Author Contributions
Conceptualization, A.K.M., J.L., B.L. and F.E.S.; Methodology, A.K.M., J.L., B.L. and F.E.S.; Investigation, A.K.M. and J.L.; Resources, J.L., G.D.M., F.E.S., V.Y., I.V.S. and A.K.M.; Writing—original draft preparation, A.K.M. and M.Z.M.; Writing—review and editing, A.K.M., M.Z.M., F.E.S., G.D.M., I.V.S., V.Y. and J.L.; Supervision, F.E.S., G.D.M., I.V.S. and V.Y.; Project Administration, G.D.M., A.K.M. and F.E.S.; Funding acquisition, F.E.S., G.D.M., J.L. and A.K.M. All authors have read and agreed to the published version of the manuscript.
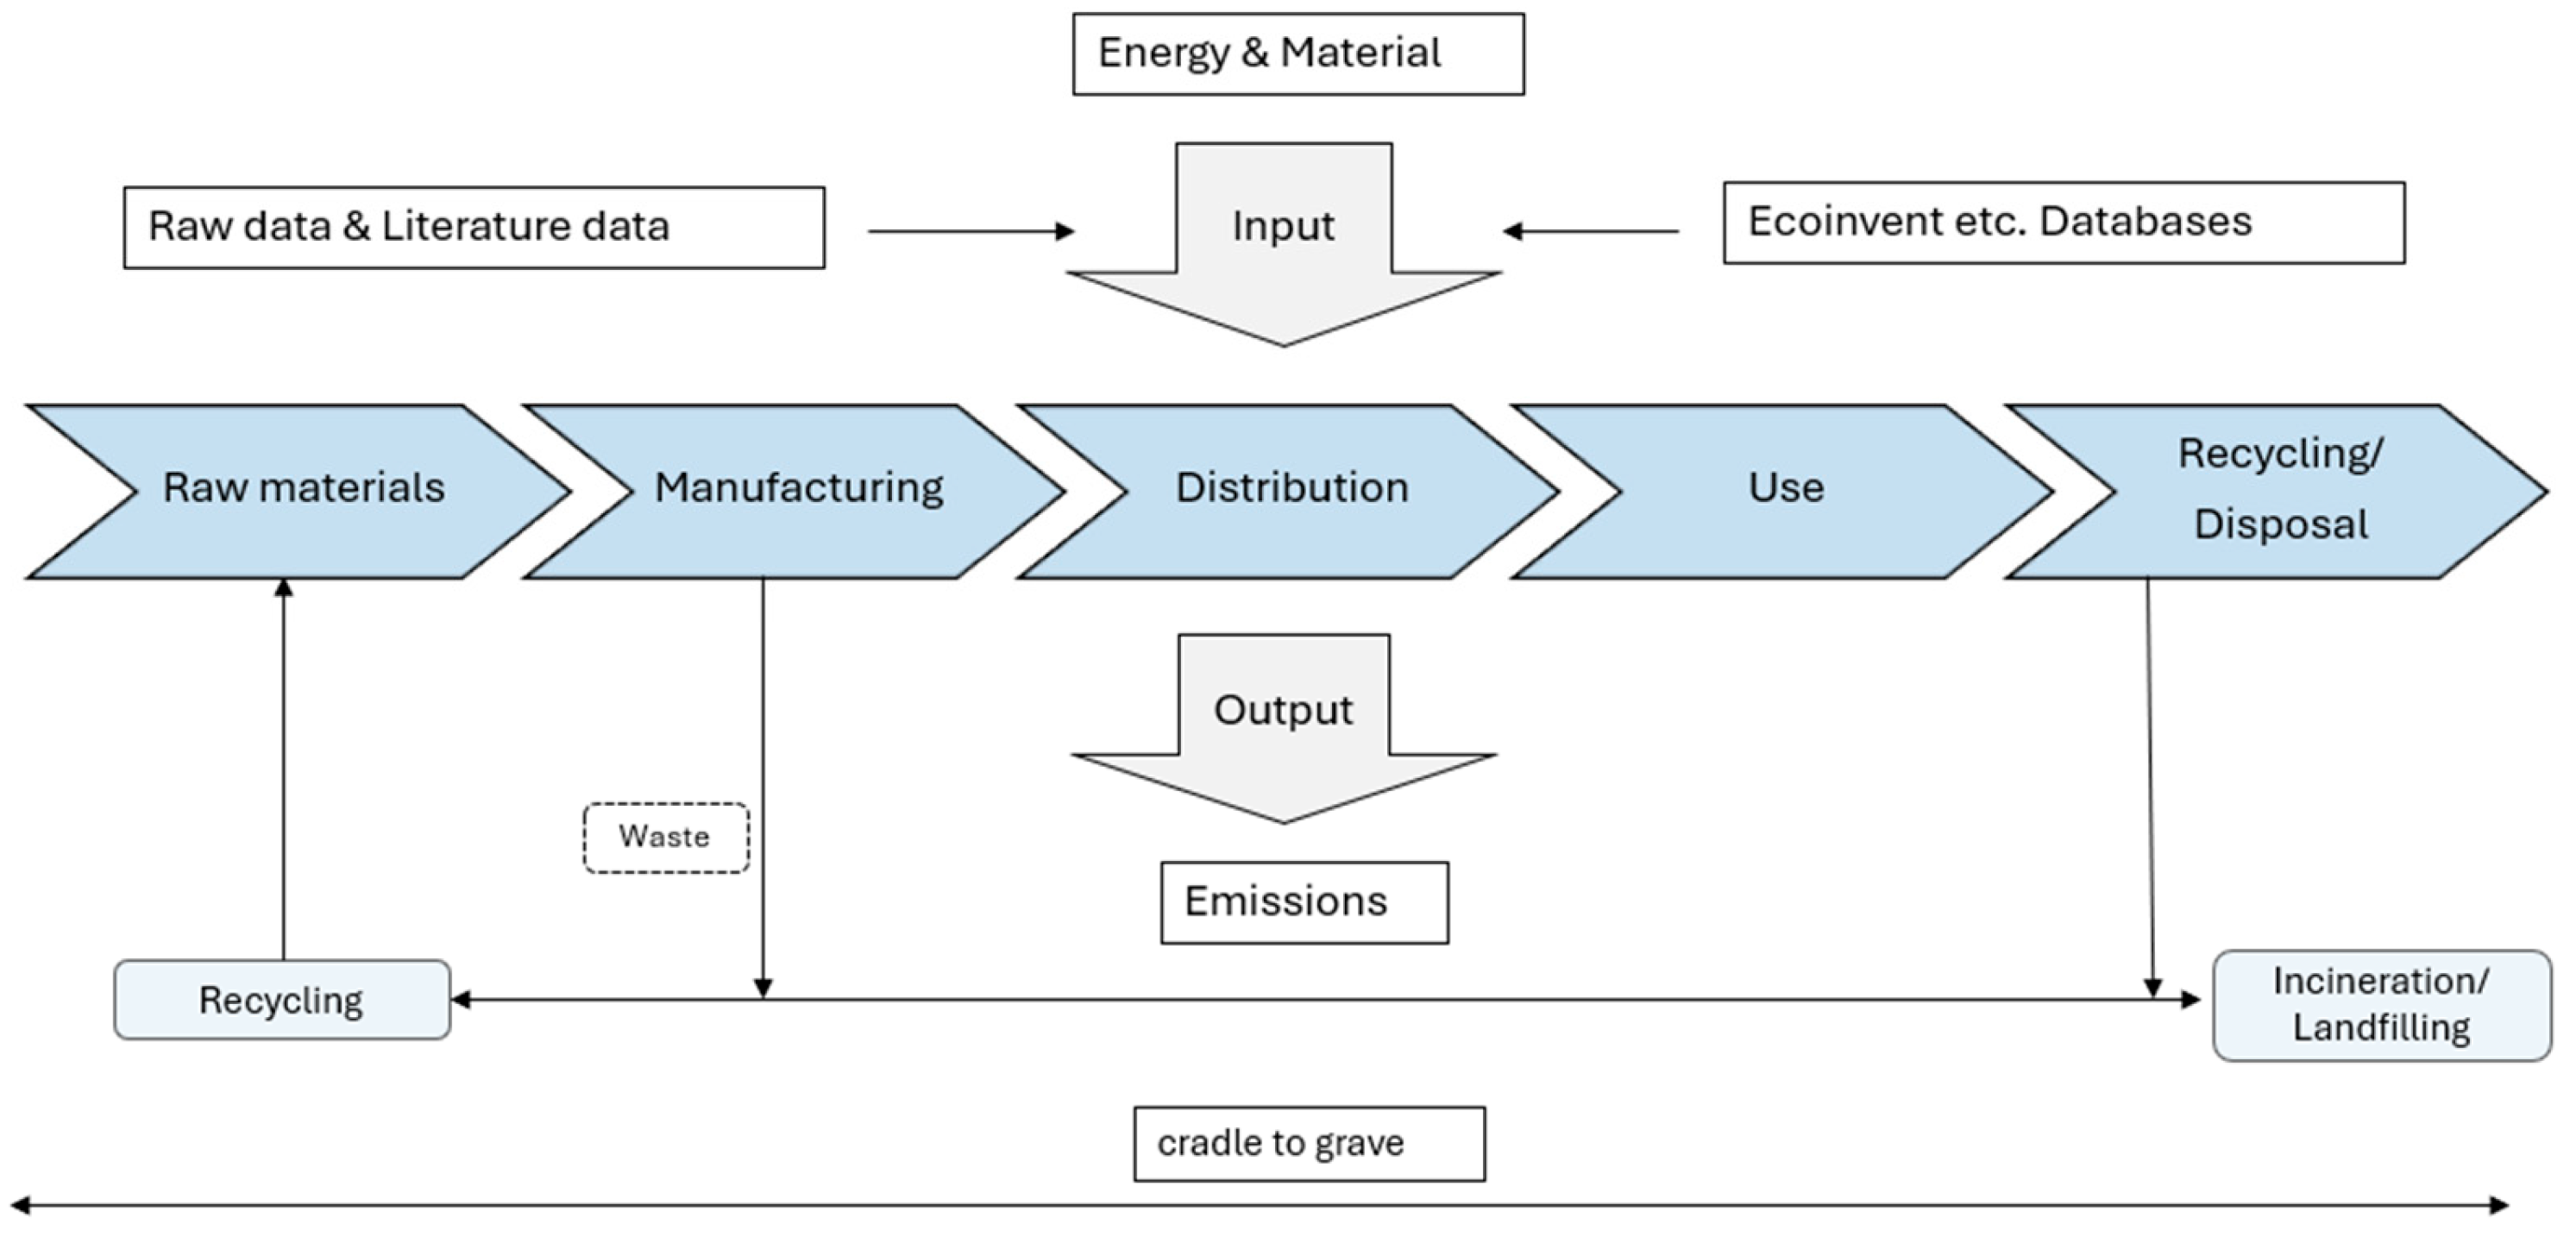
Figure 1.
Life cycle stages of the product (authors’ elaboration).
Figure 1.
Life cycle stages of the product (authors’ elaboration).
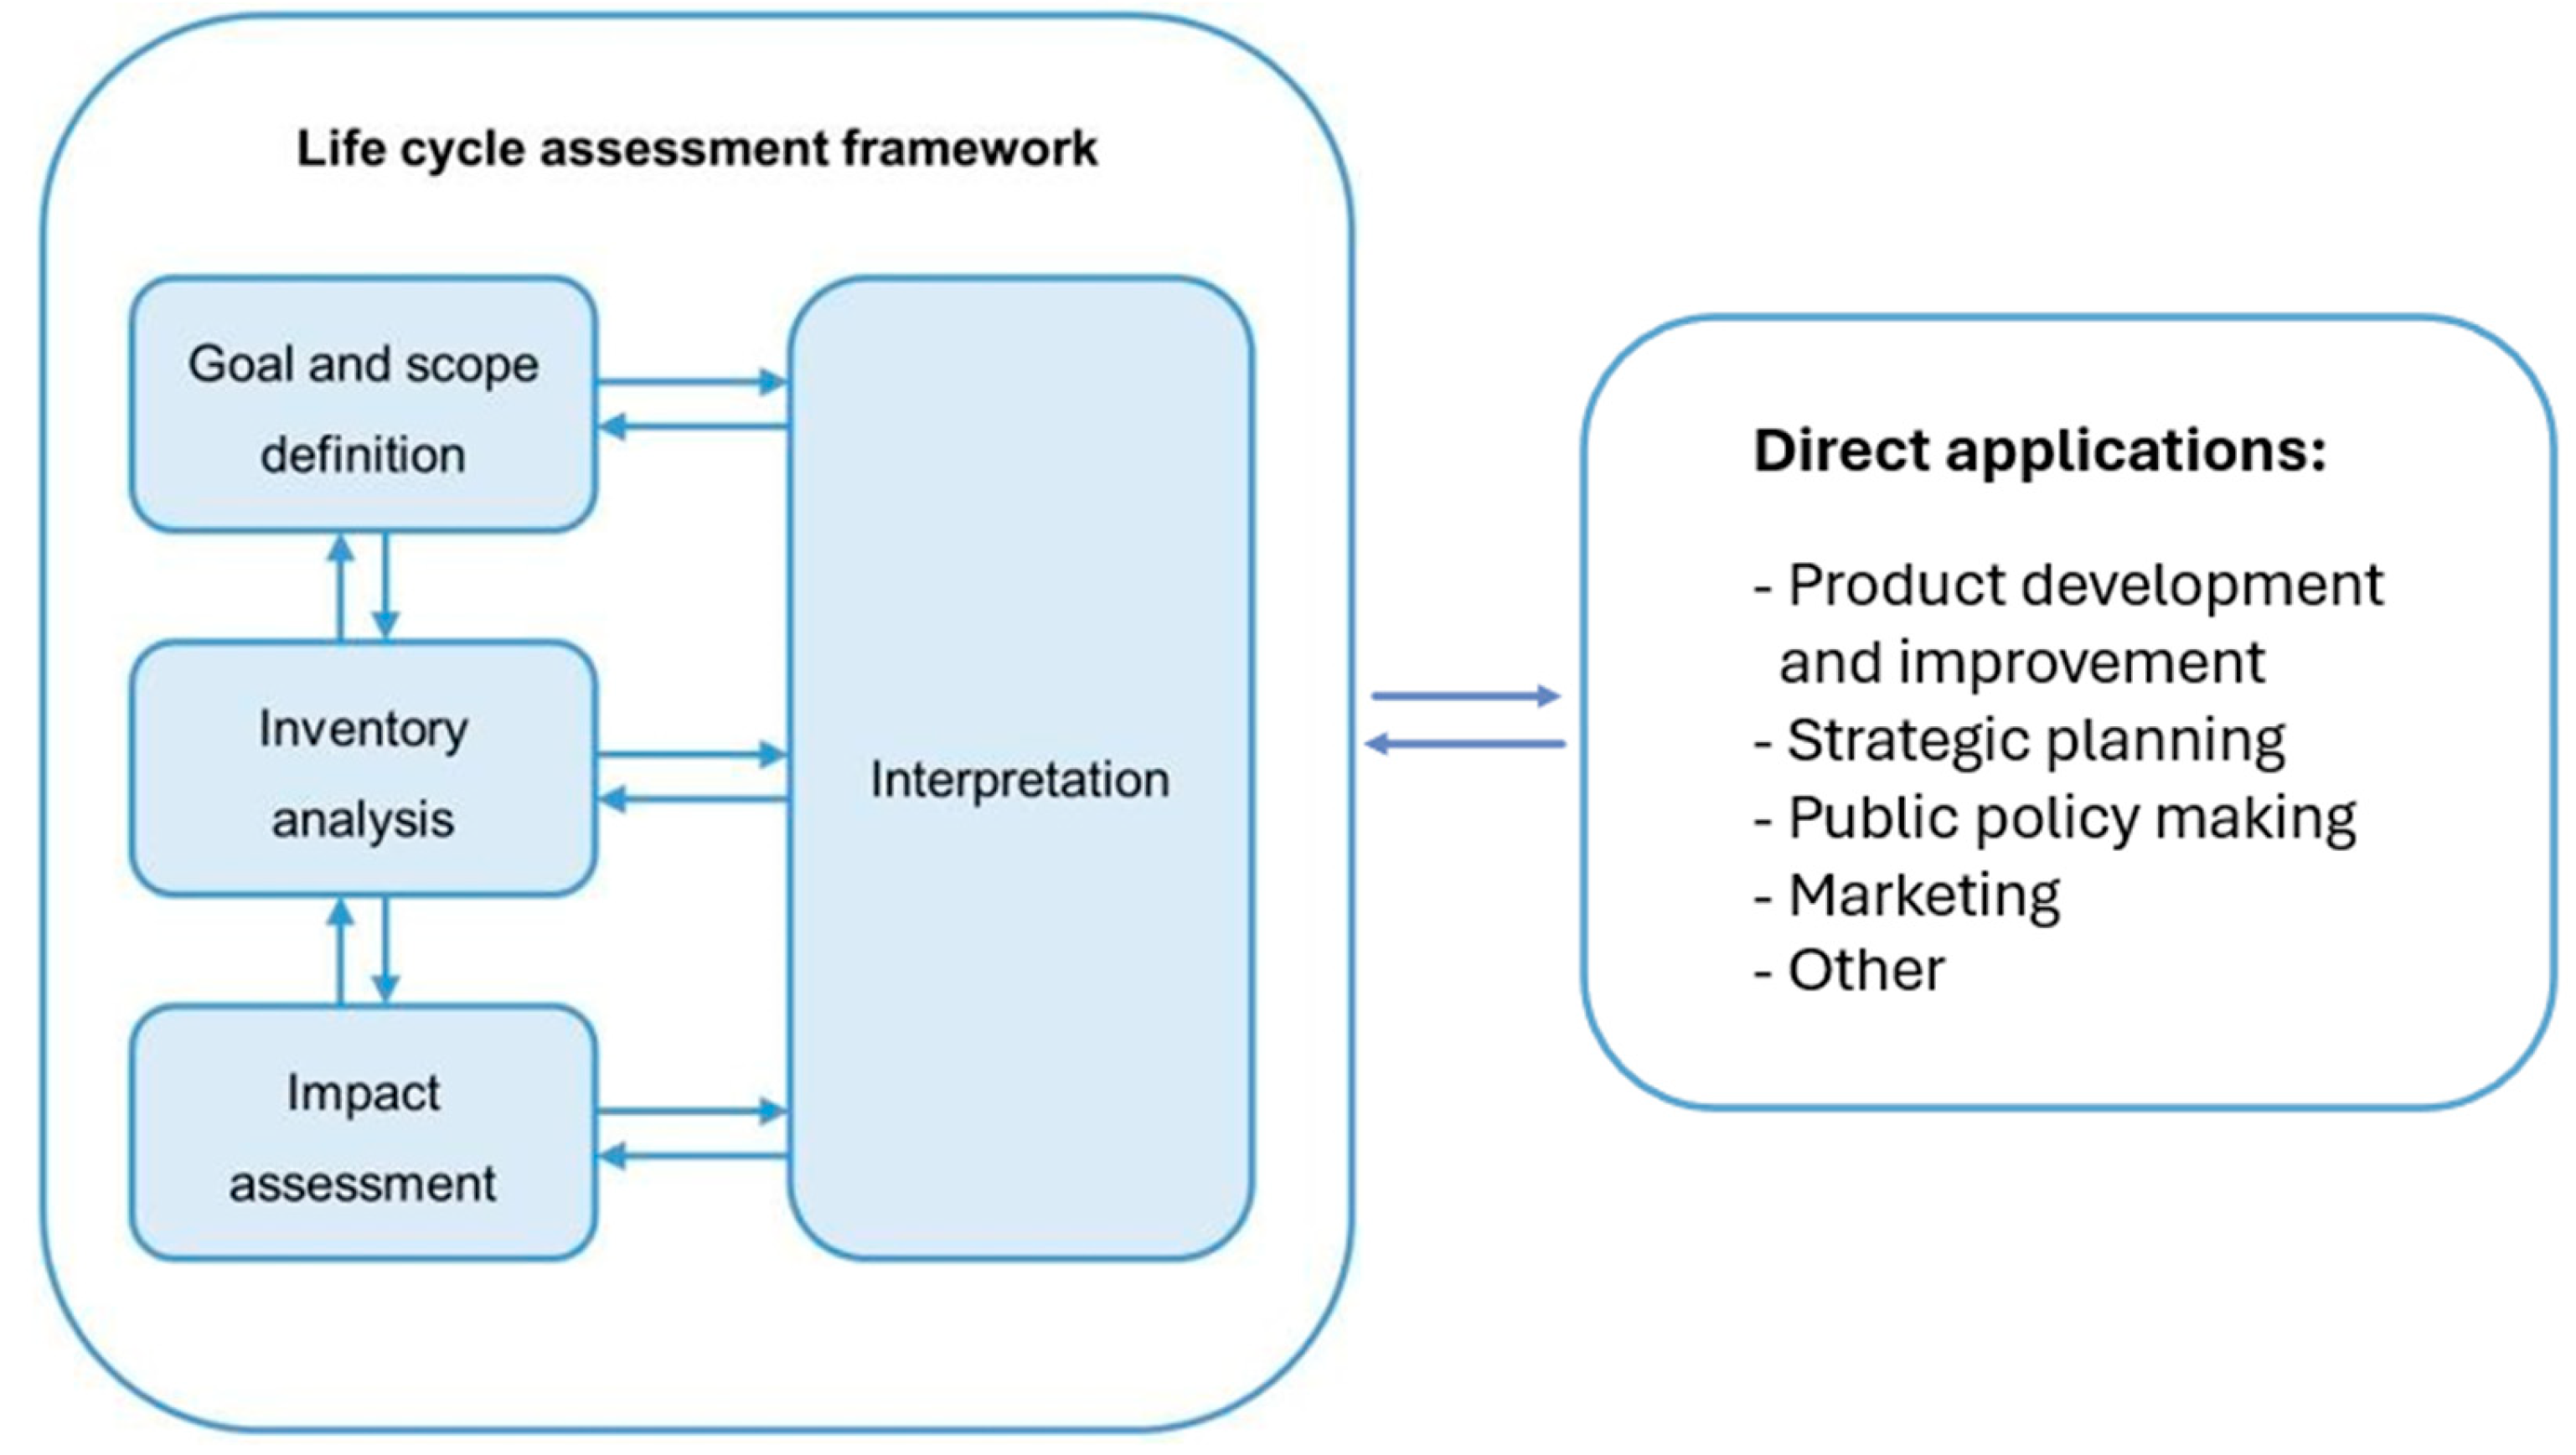
Figure 2.
Life cycle assessment framework (Source INTERNATIONAL STANDARD ISO 14040 (2006) [
35]).
Figure 2.
Life cycle assessment framework (Source INTERNATIONAL STANDARD ISO 14040 (2006) [
35]).
Figure 3.
LCA from cradle to grave (authors’ elaboration).
Figure 3.
LCA from cradle to grave (authors’ elaboration).
Figure 4.
System Boundary (authors’ elaboration).
Figure 4.
System Boundary (authors’ elaboration).
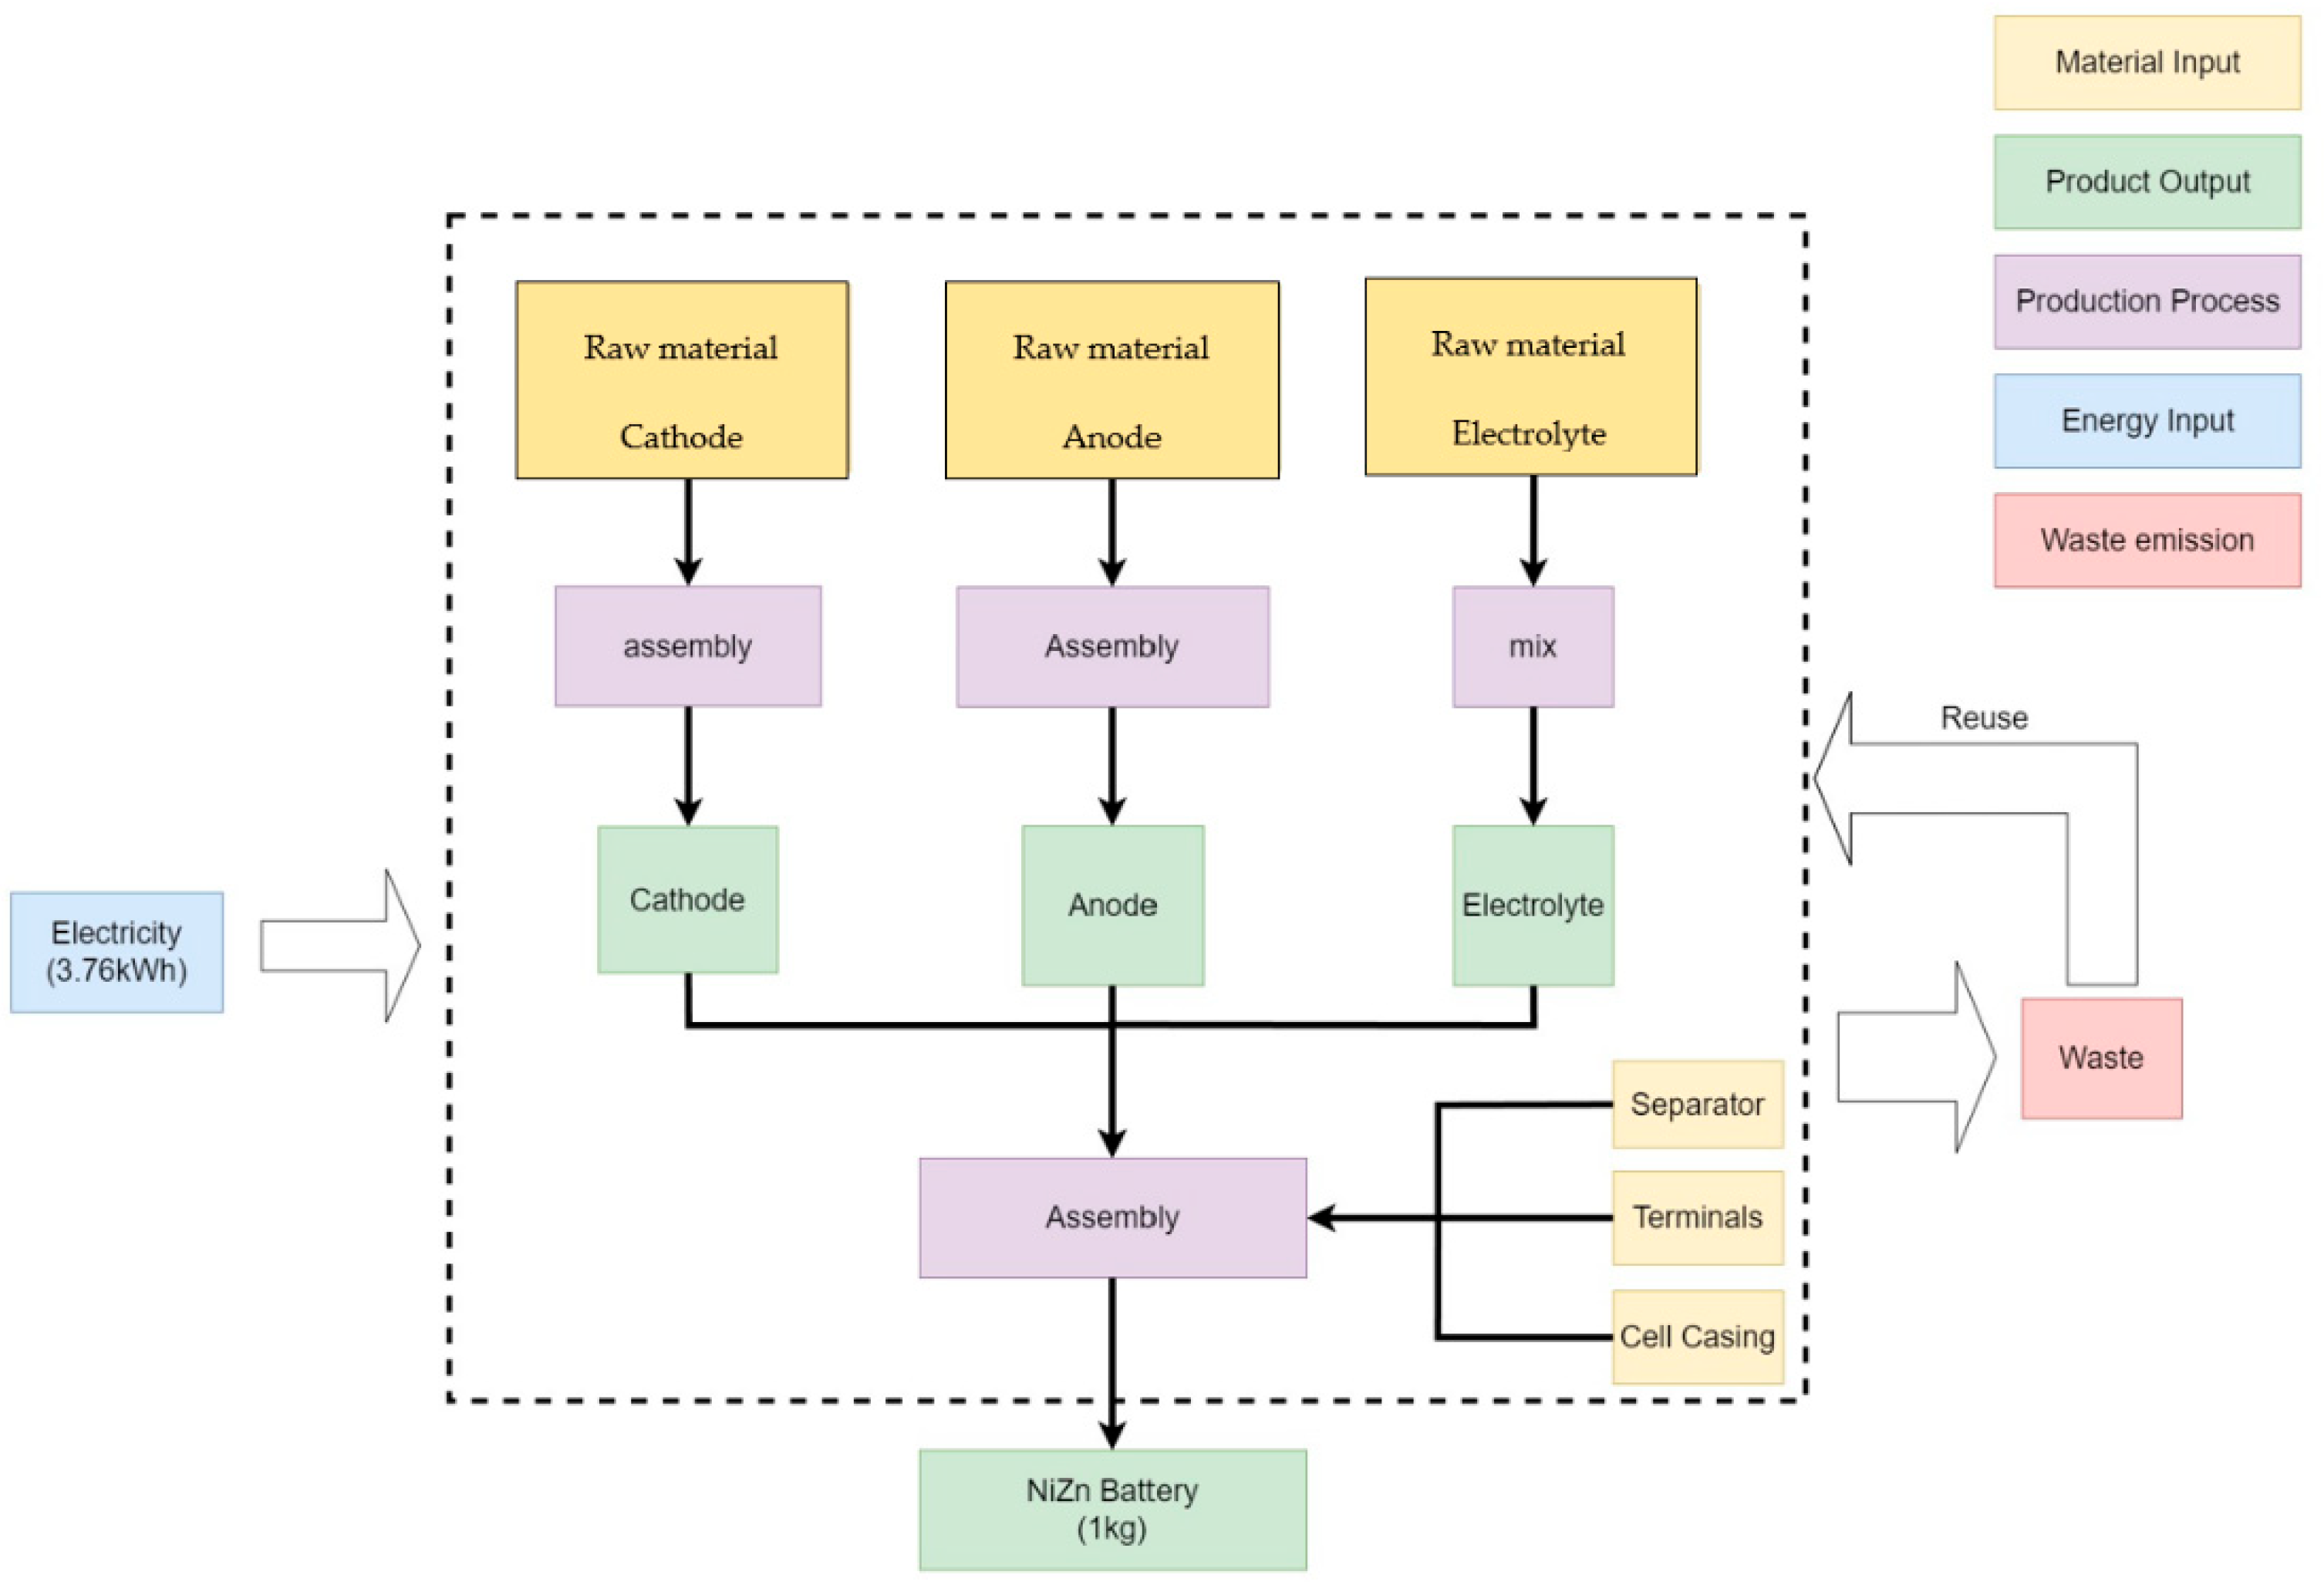
Figure 5.
Material flow diagram of the manufacturing process for 1 kg NiZn battery (authors’ elaboration).
Figure 5.
Material flow diagram of the manufacturing process for 1 kg NiZn battery (authors’ elaboration).
Figure 6.
Transport of RNZB batteries in three steps (authors’ elaboration).
Figure 6.
Transport of RNZB batteries in three steps (authors’ elaboration).
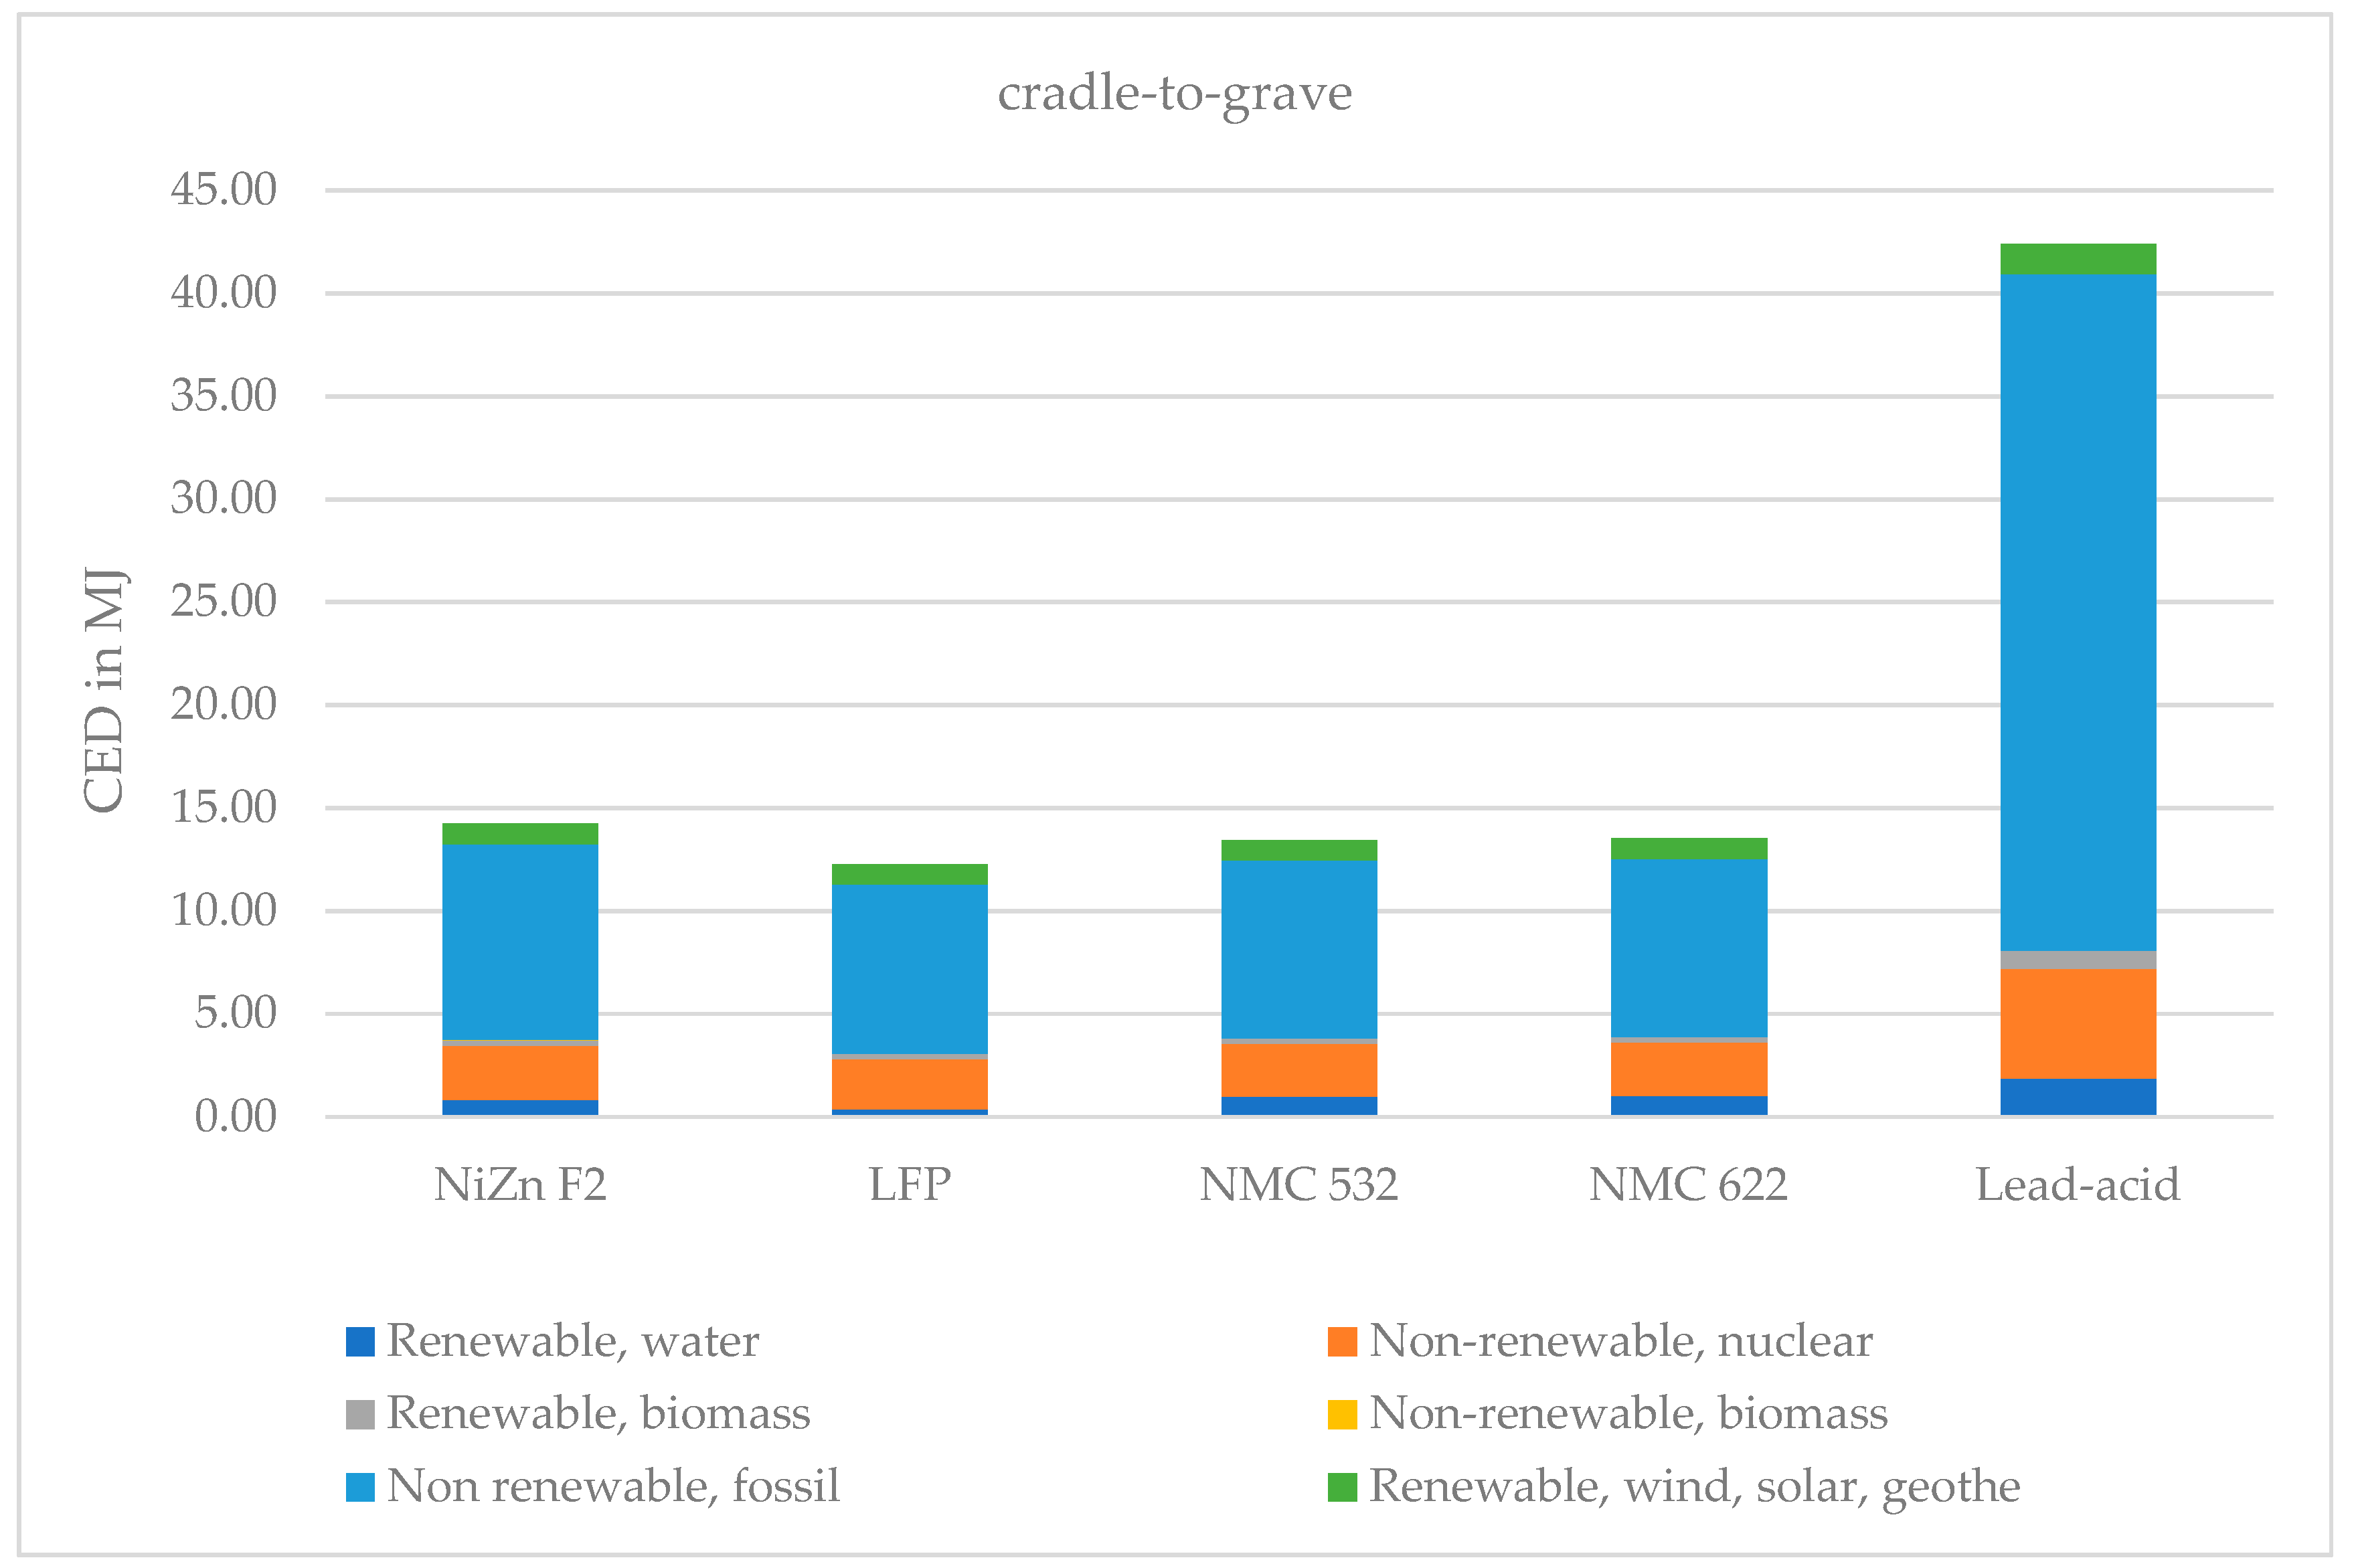
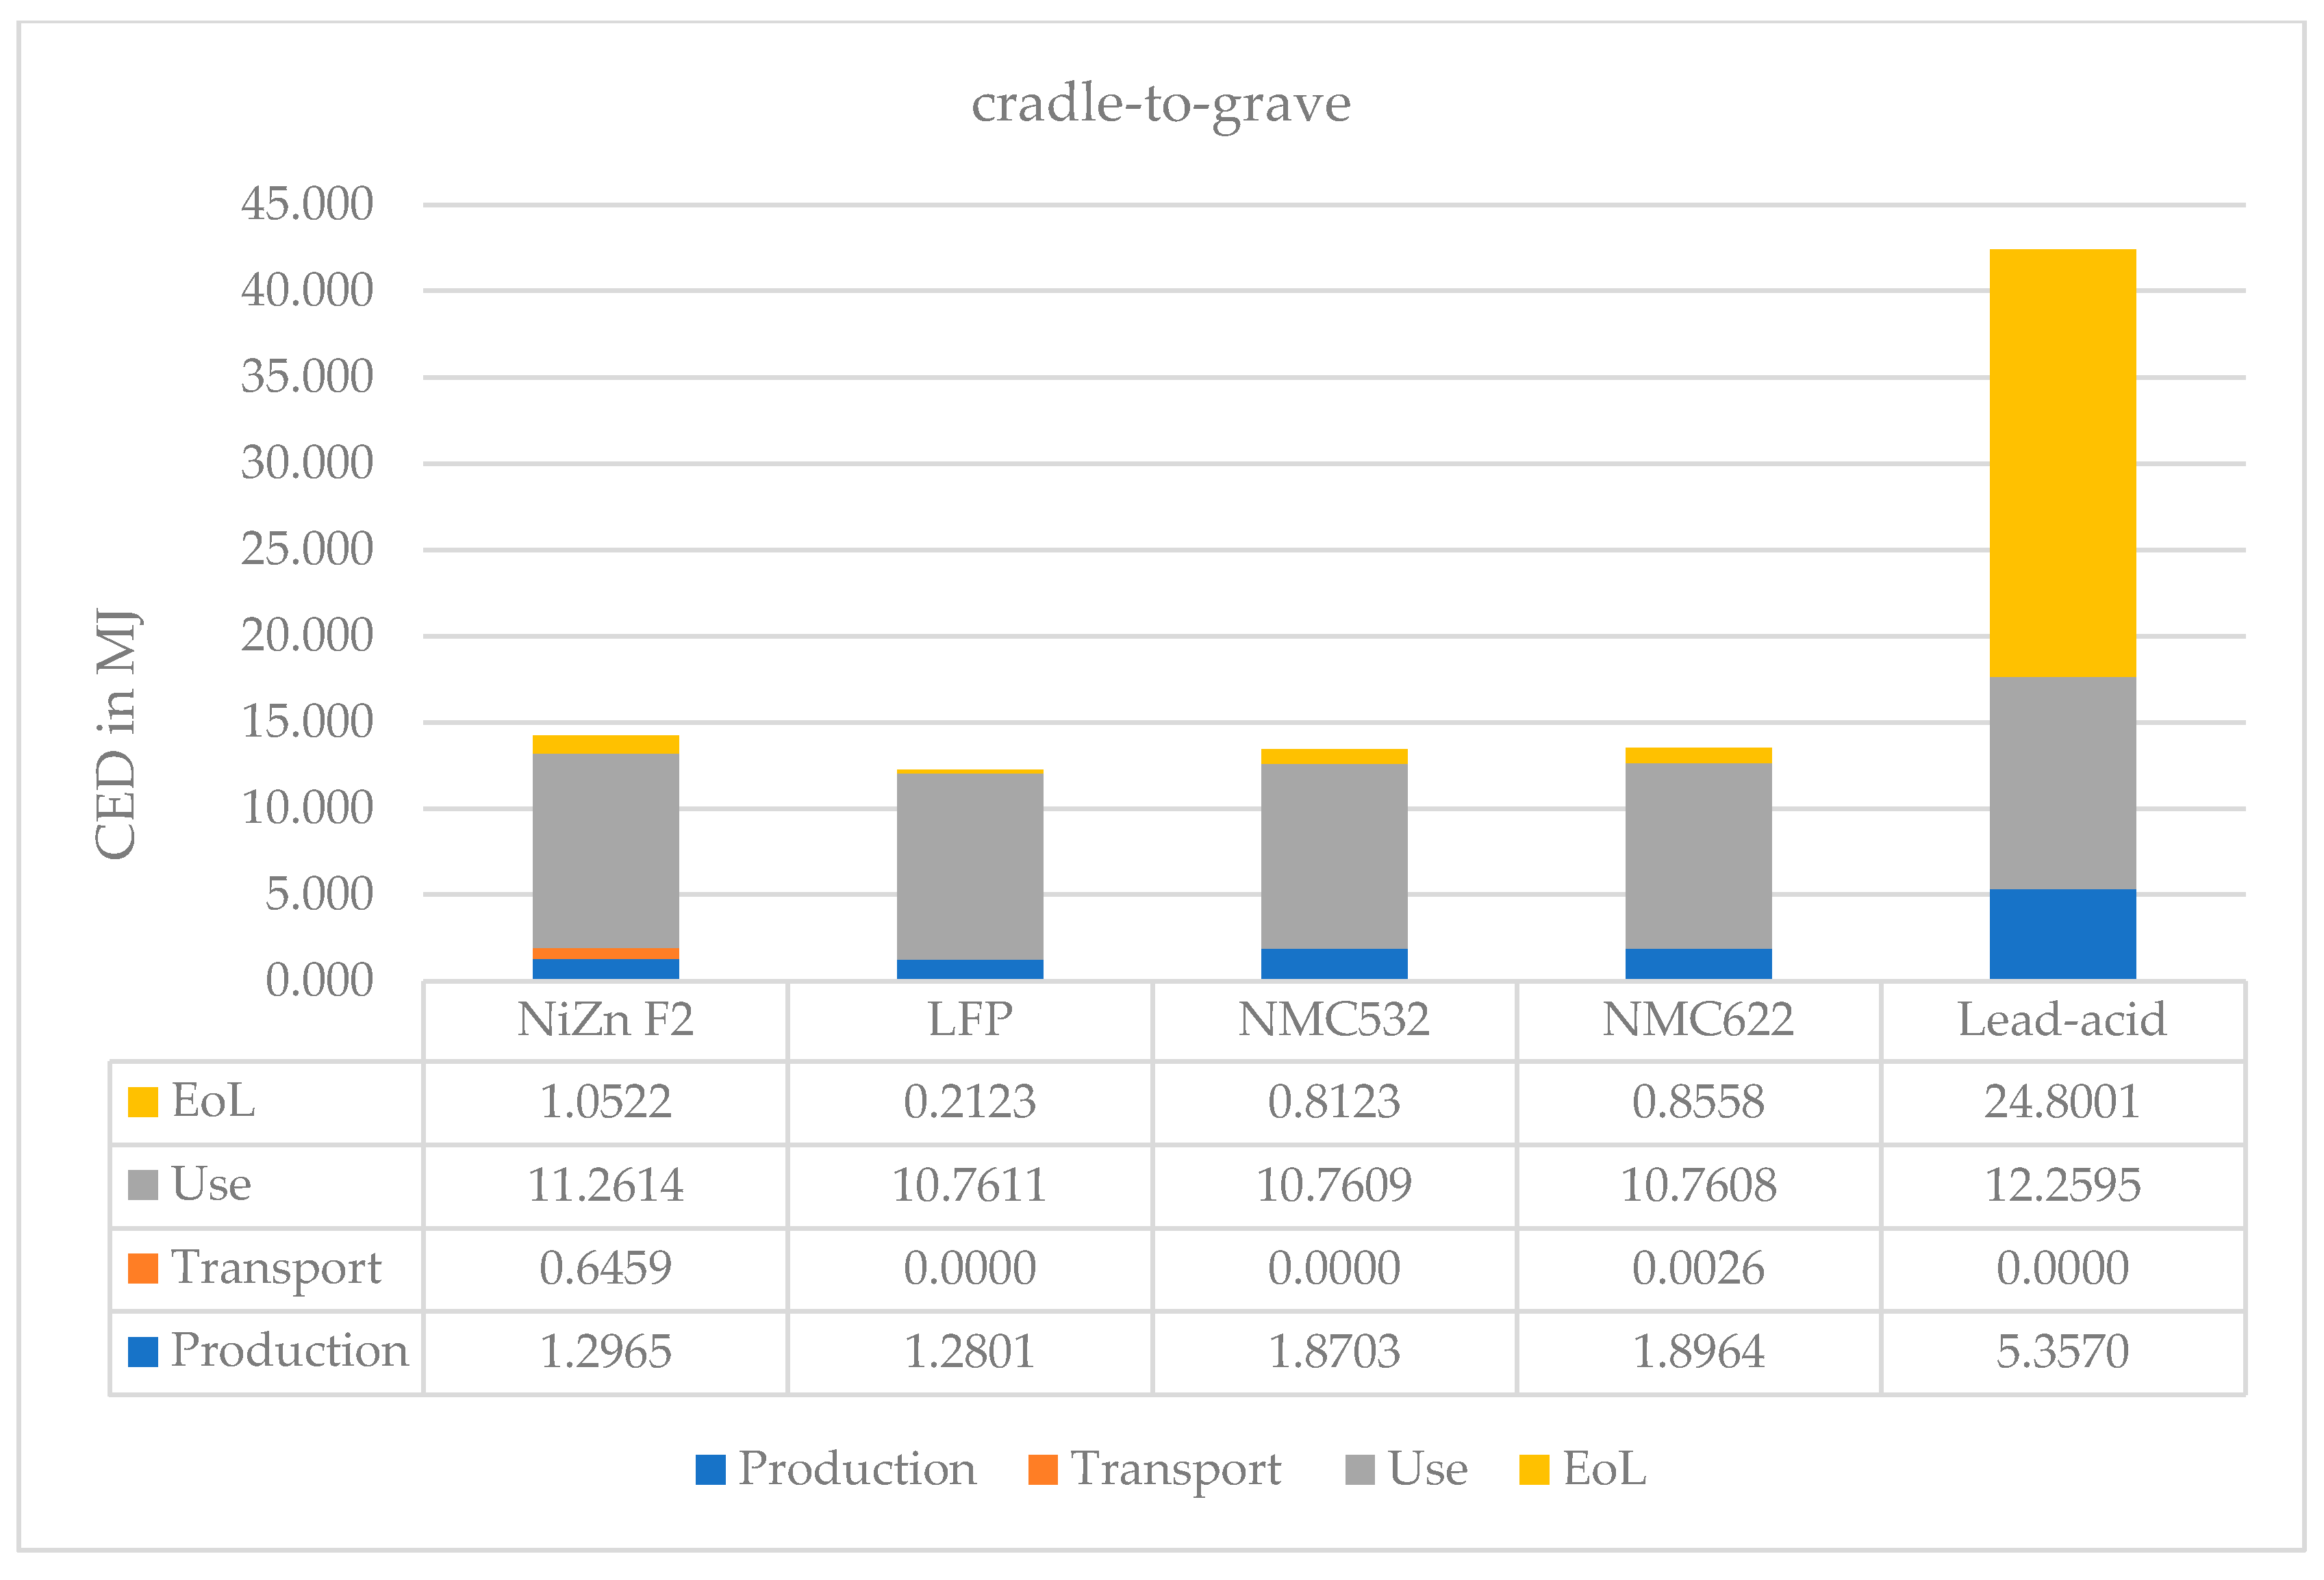
Figure 7.
CED cradle-to-grave of all batteries with a breakdown of impact categories.
Figure 7.
CED cradle-to-grave of all batteries with a breakdown of impact categories.
Figure 8.
CED cradle-to-grave of all batteries with the breakdown of LCI steps.
Figure 8.
CED cradle-to-grave of all batteries with the breakdown of LCI steps.
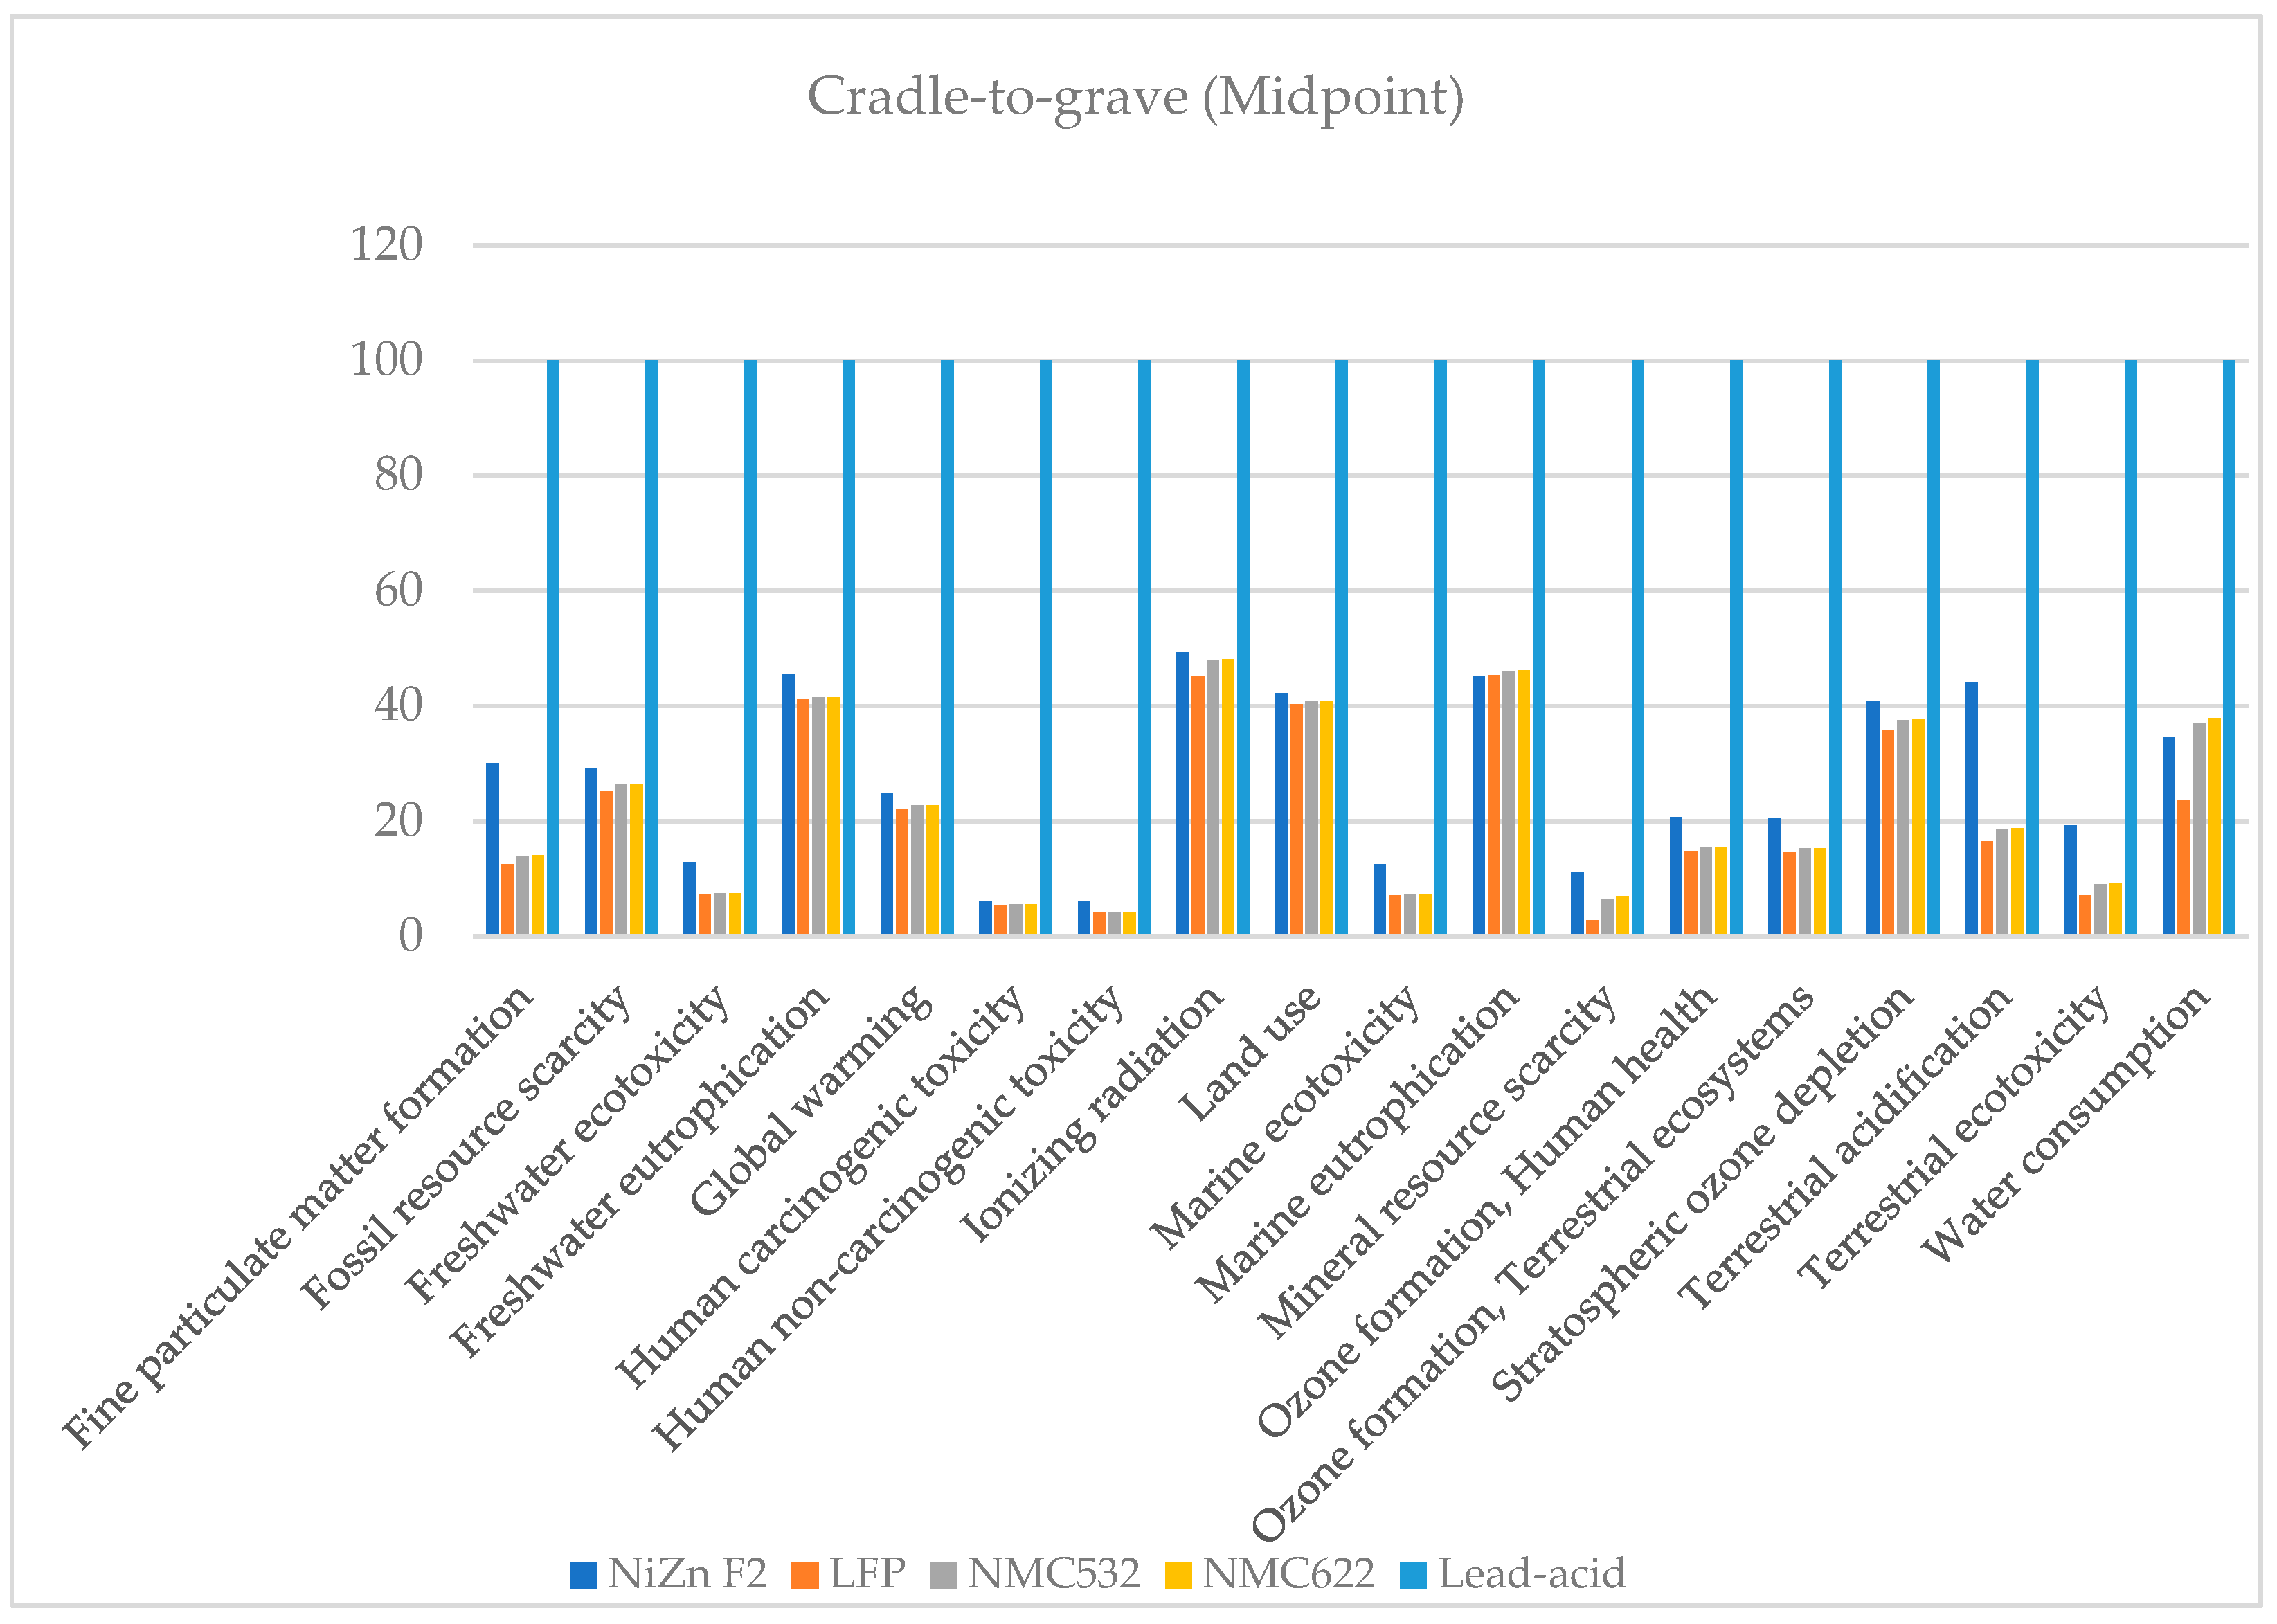
Figure 9.
Midpoint cradle-to-grave for all battery types.
Figure 9.
Midpoint cradle-to-grave for all battery types.
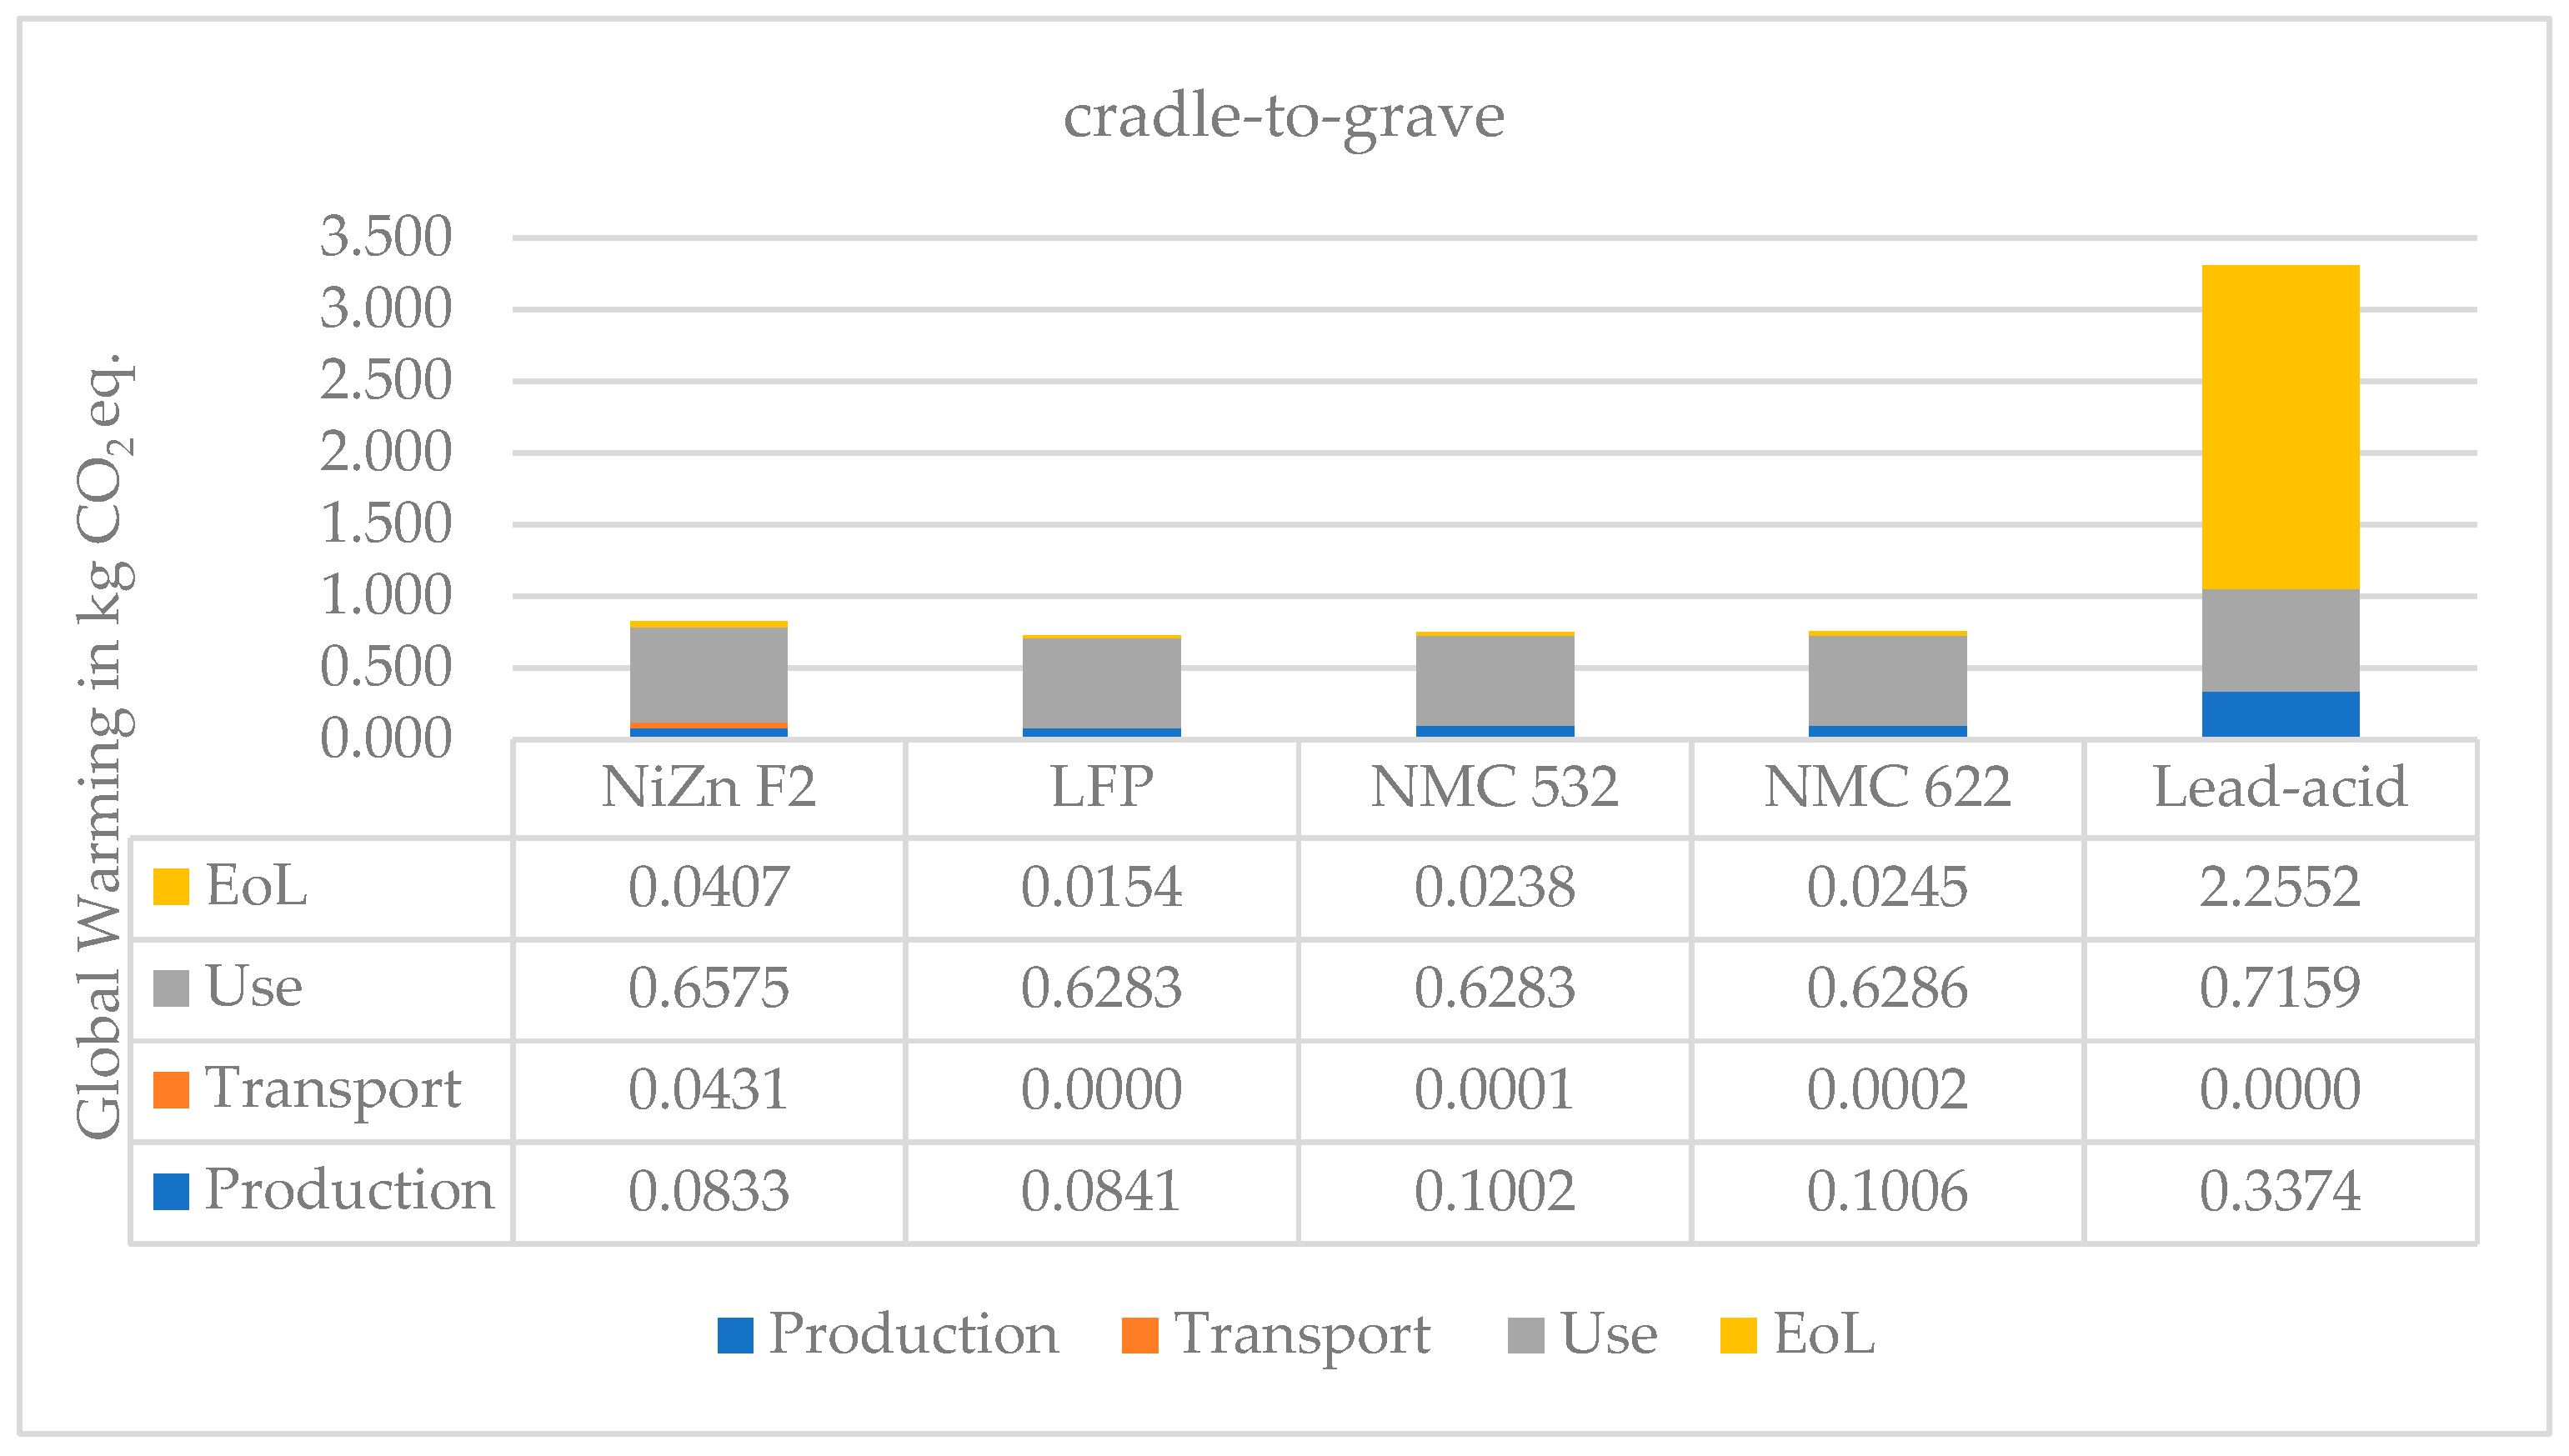
Figure 10.
Global warming cradle-to-grave for all battery types with a breakdown of LCI steps.
Figure 10.
Global warming cradle-to-grave for all battery types with a breakdown of LCI steps.
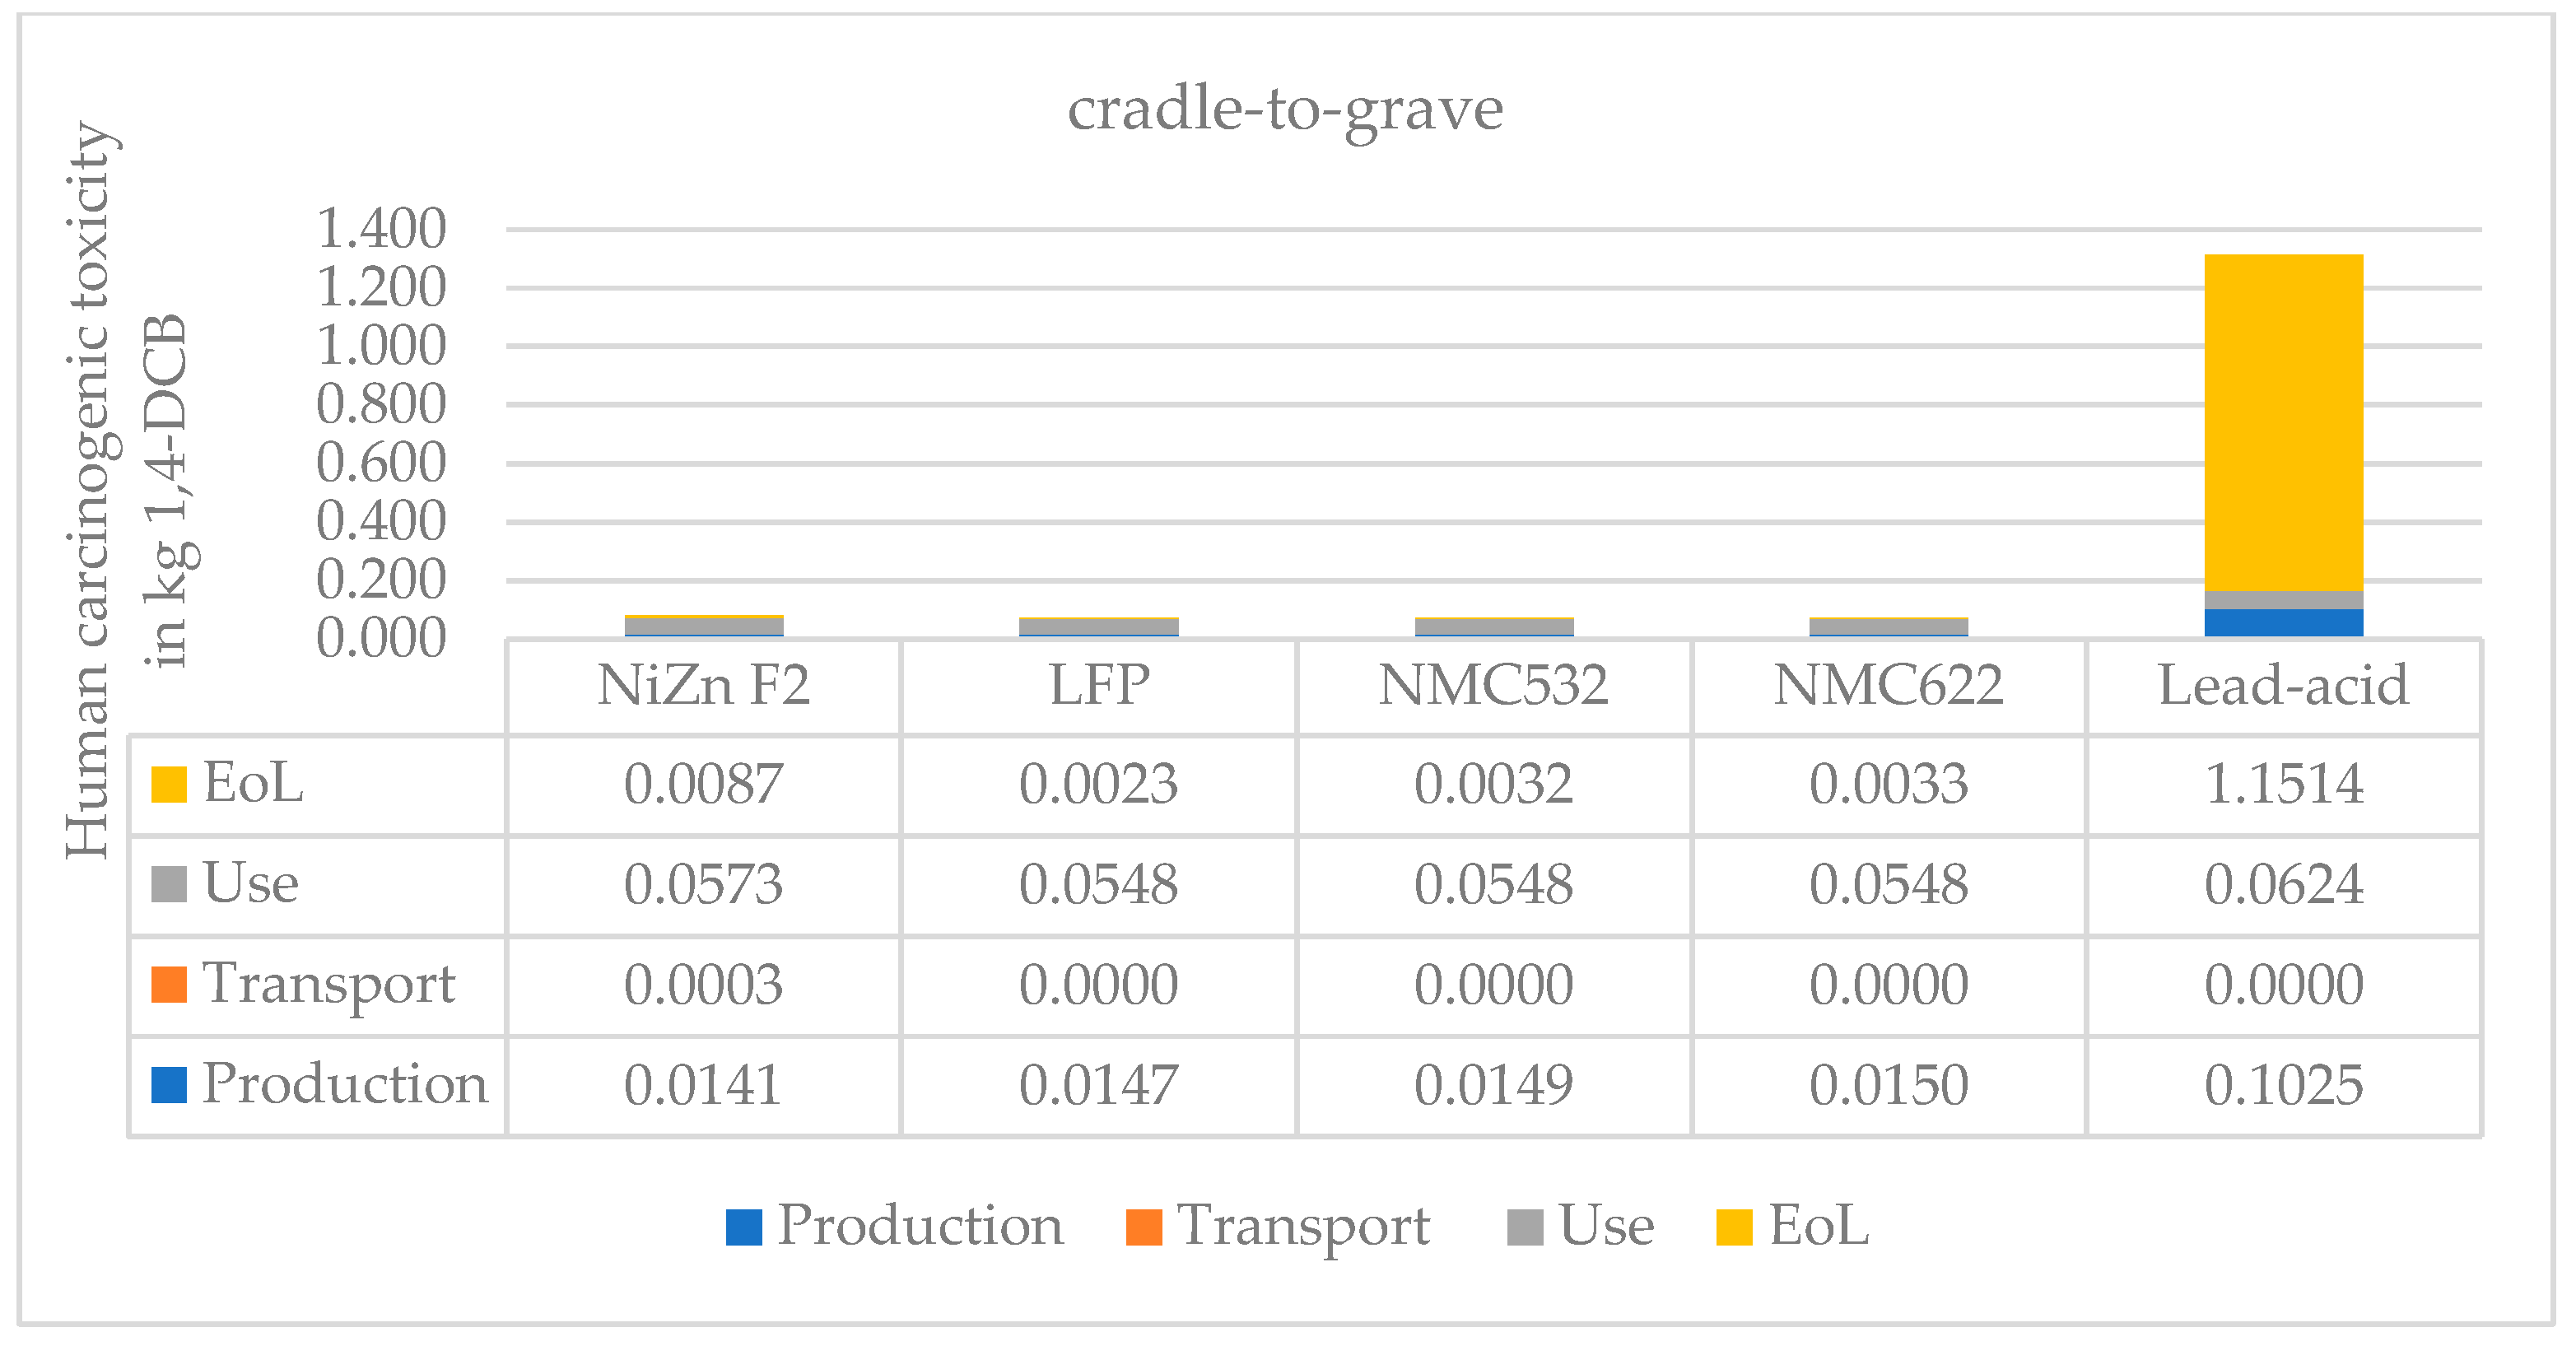
Figure 11.
Human carcinogenic toxicity cradle-to-grave for all battery types with a breakdown of LCI steps.
Figure 11.
Human carcinogenic toxicity cradle-to-grave for all battery types with a breakdown of LCI steps.
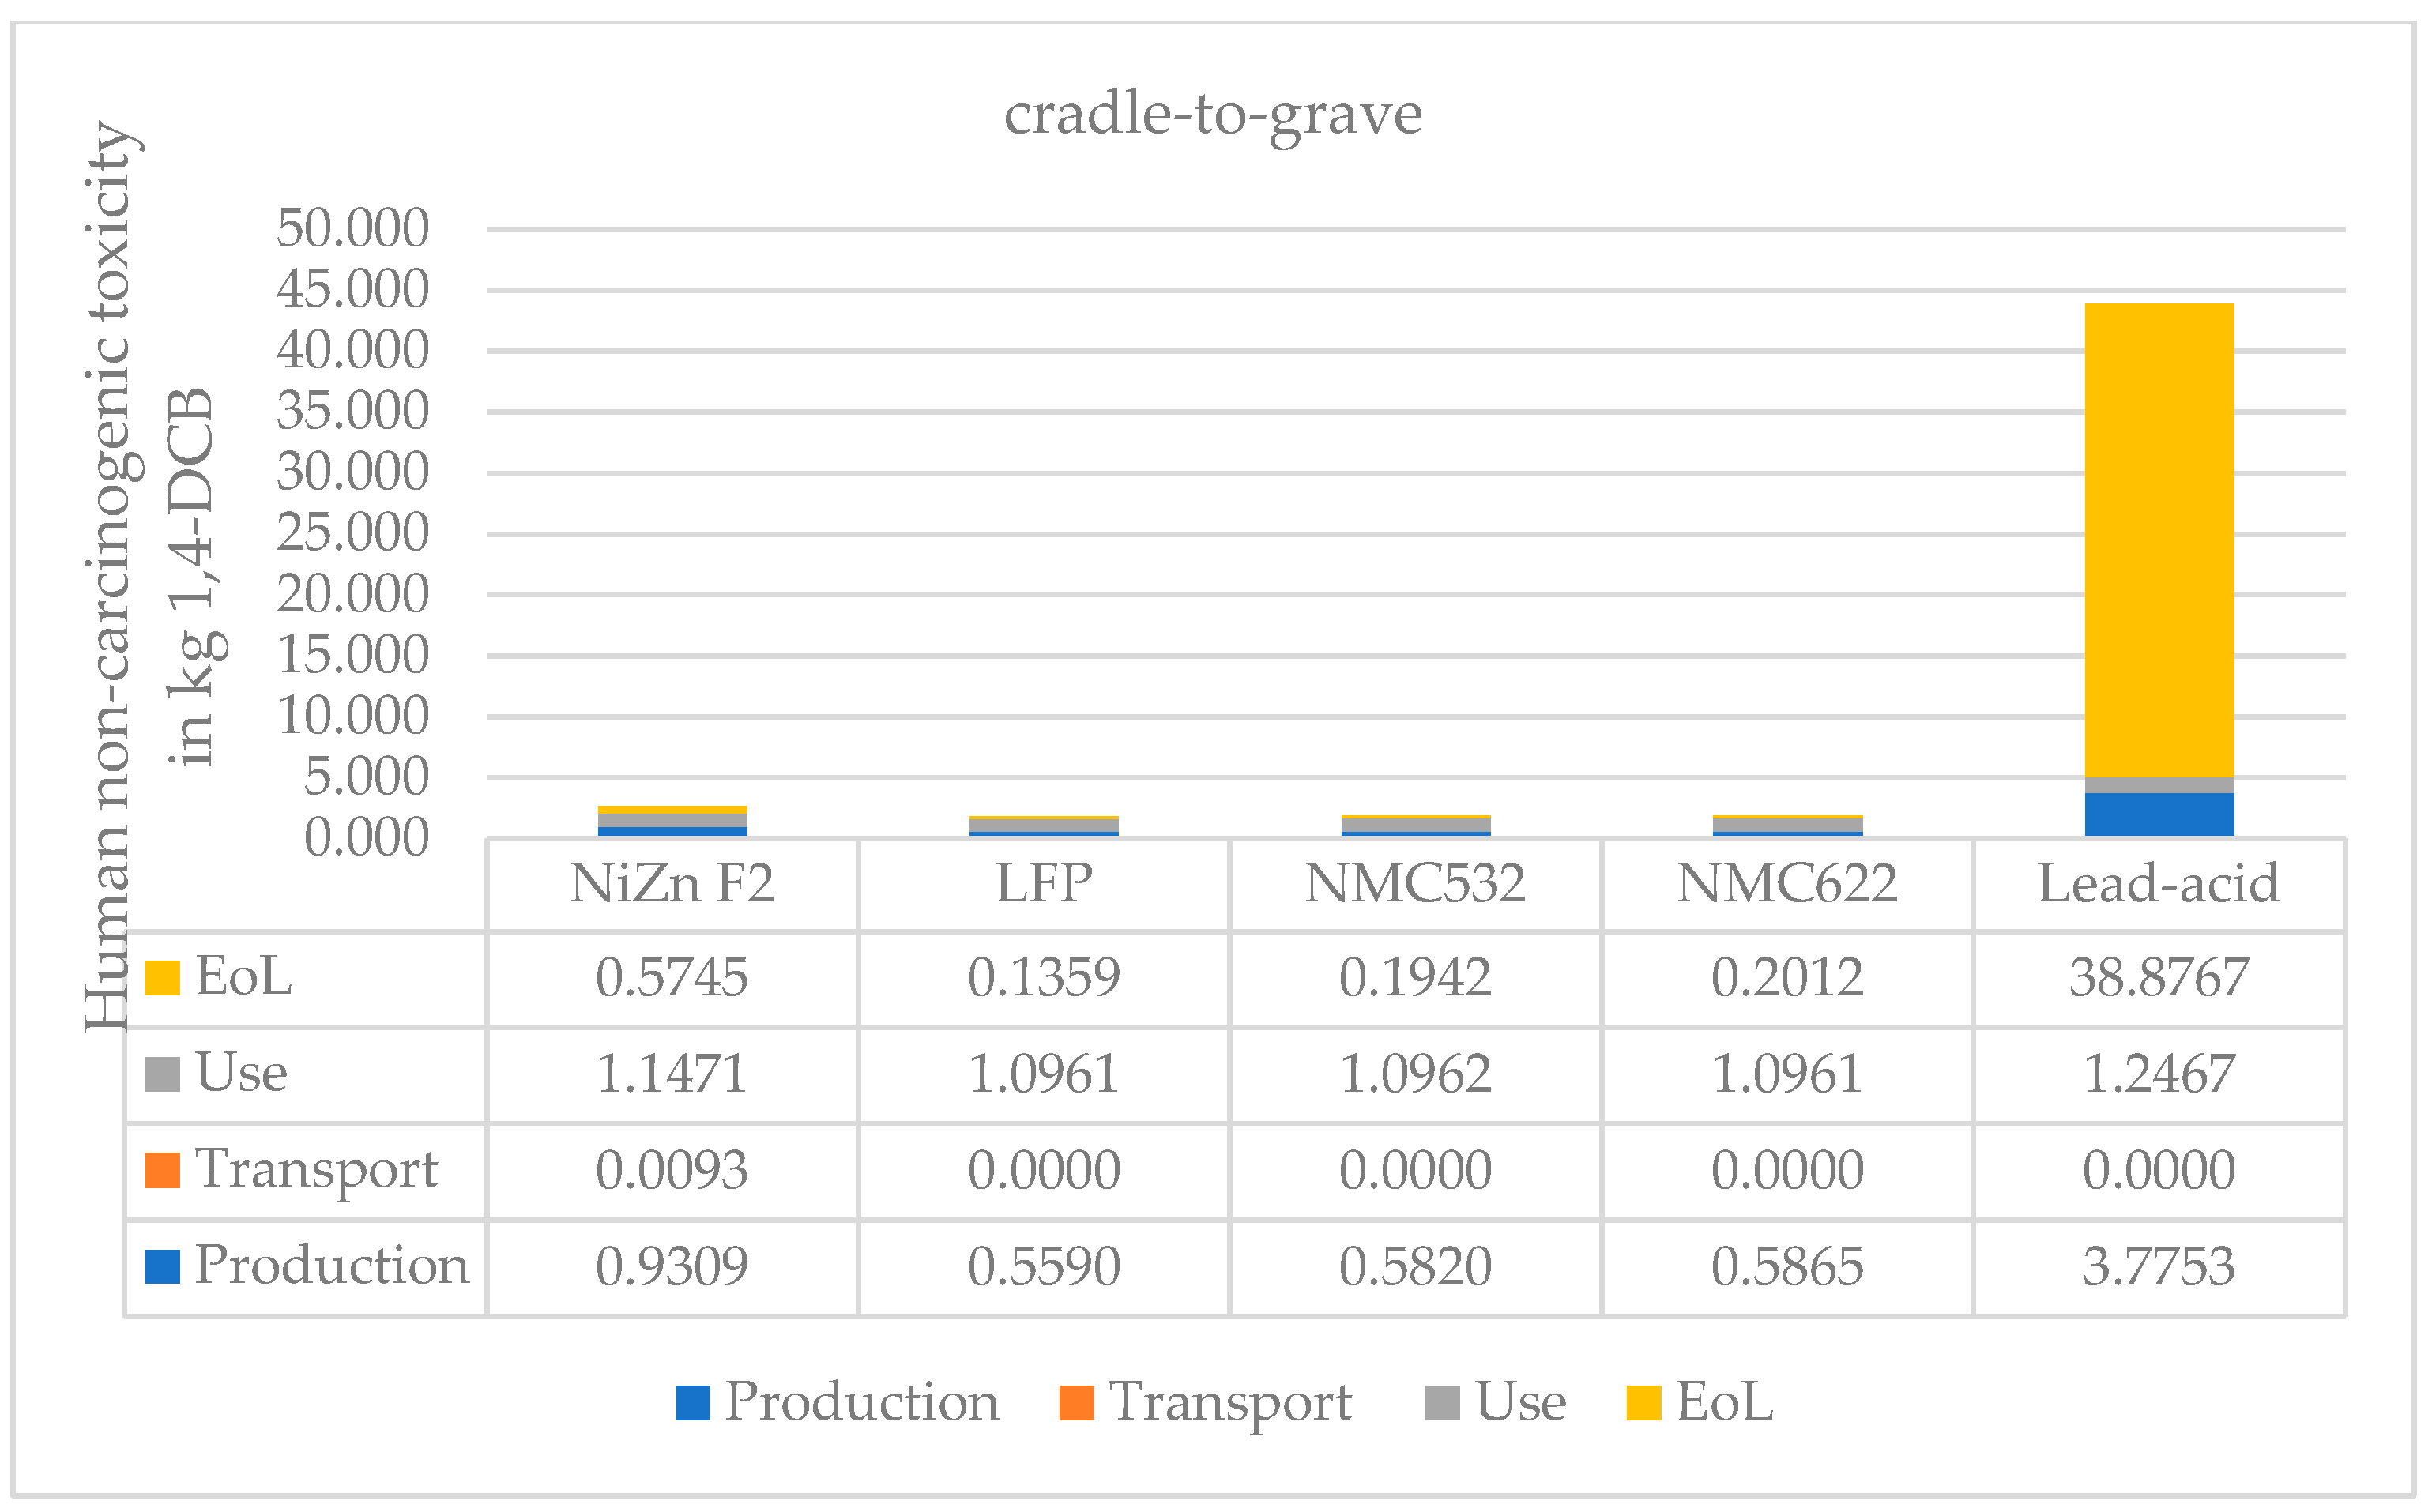
Figure 12.
Human non-carcinogenic toxicity cradle-to-grave for all battery types with a breakdown of LCI steps.
Figure 12.
Human non-carcinogenic toxicity cradle-to-grave for all battery types with a breakdown of LCI steps.
Figure 13.
Terrestrial ecotoxicity cradle-to-grave for all battery types with a breakdown of LCI steps.
Figure 13.
Terrestrial ecotoxicity cradle-to-grave for all battery types with a breakdown of LCI steps.
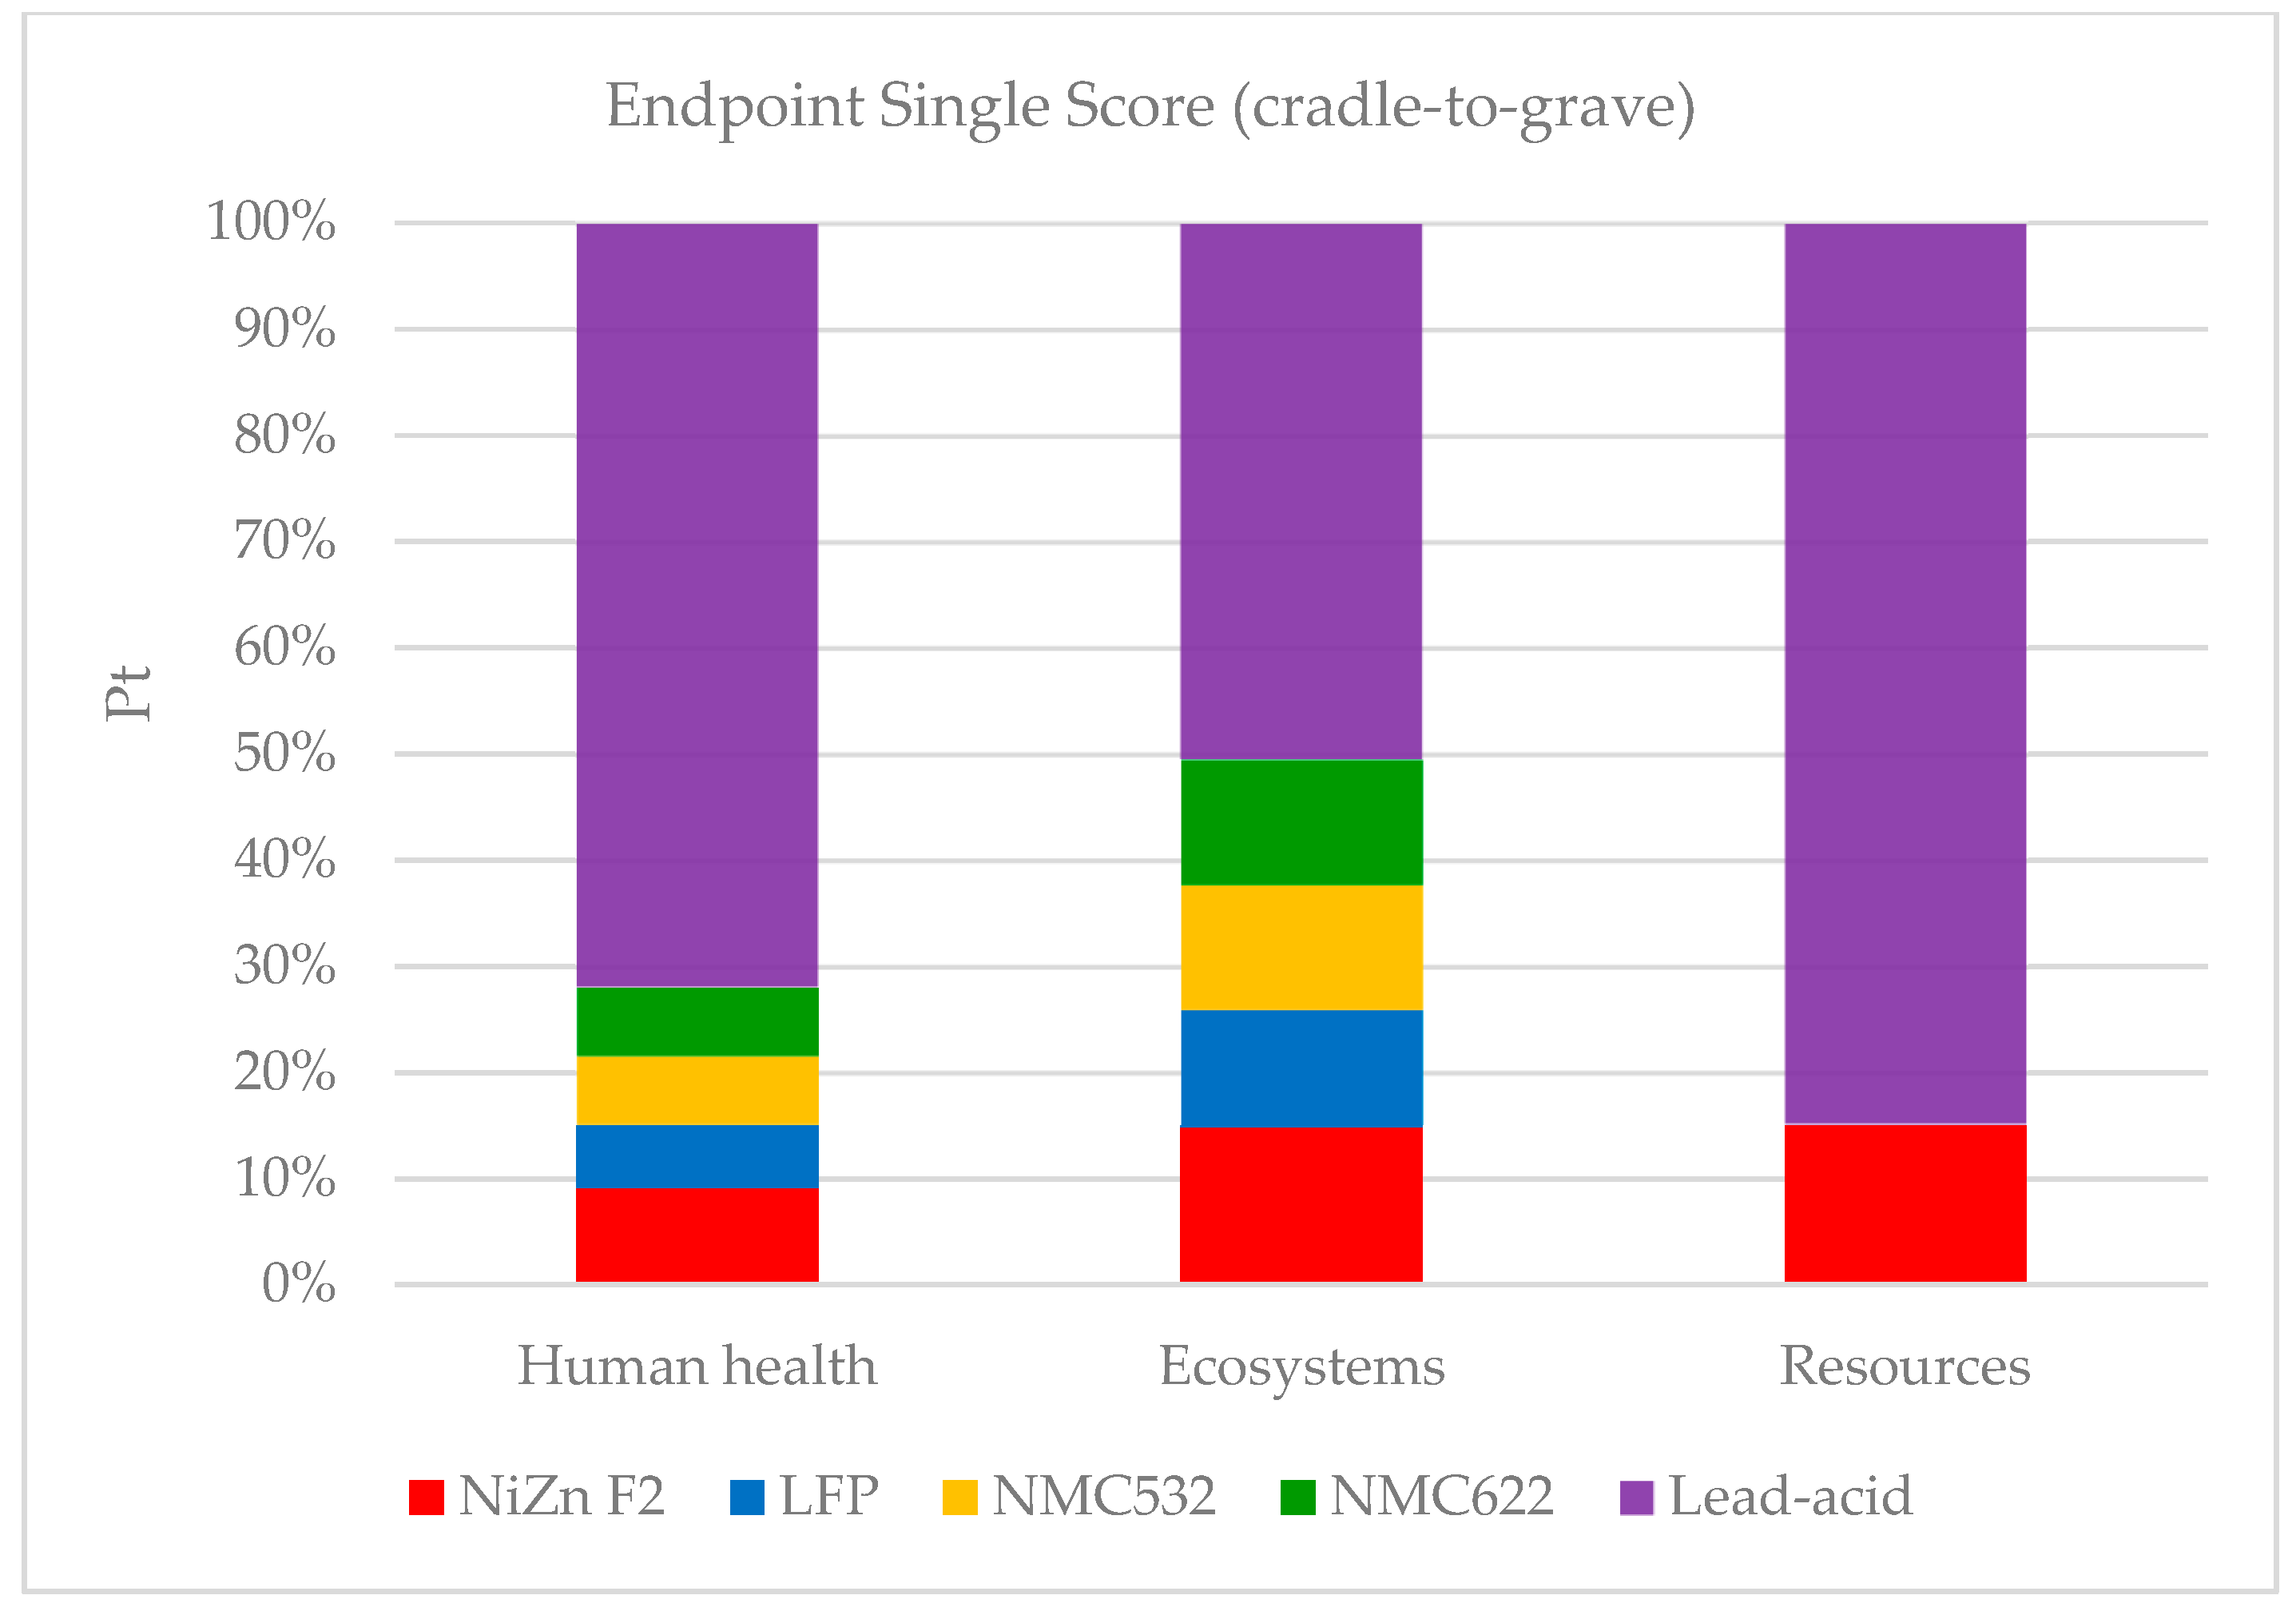
Figure 14.
Single score results of damage categories for all battery types (cradle-to-grave).
Figure 14.
Single score results of damage categories for all battery types (cradle-to-grave).
Figure 15.
The comparison results from CED-Cell Production of all battery types.
Figure 15.
The comparison results from CED-Cell Production of all battery types.
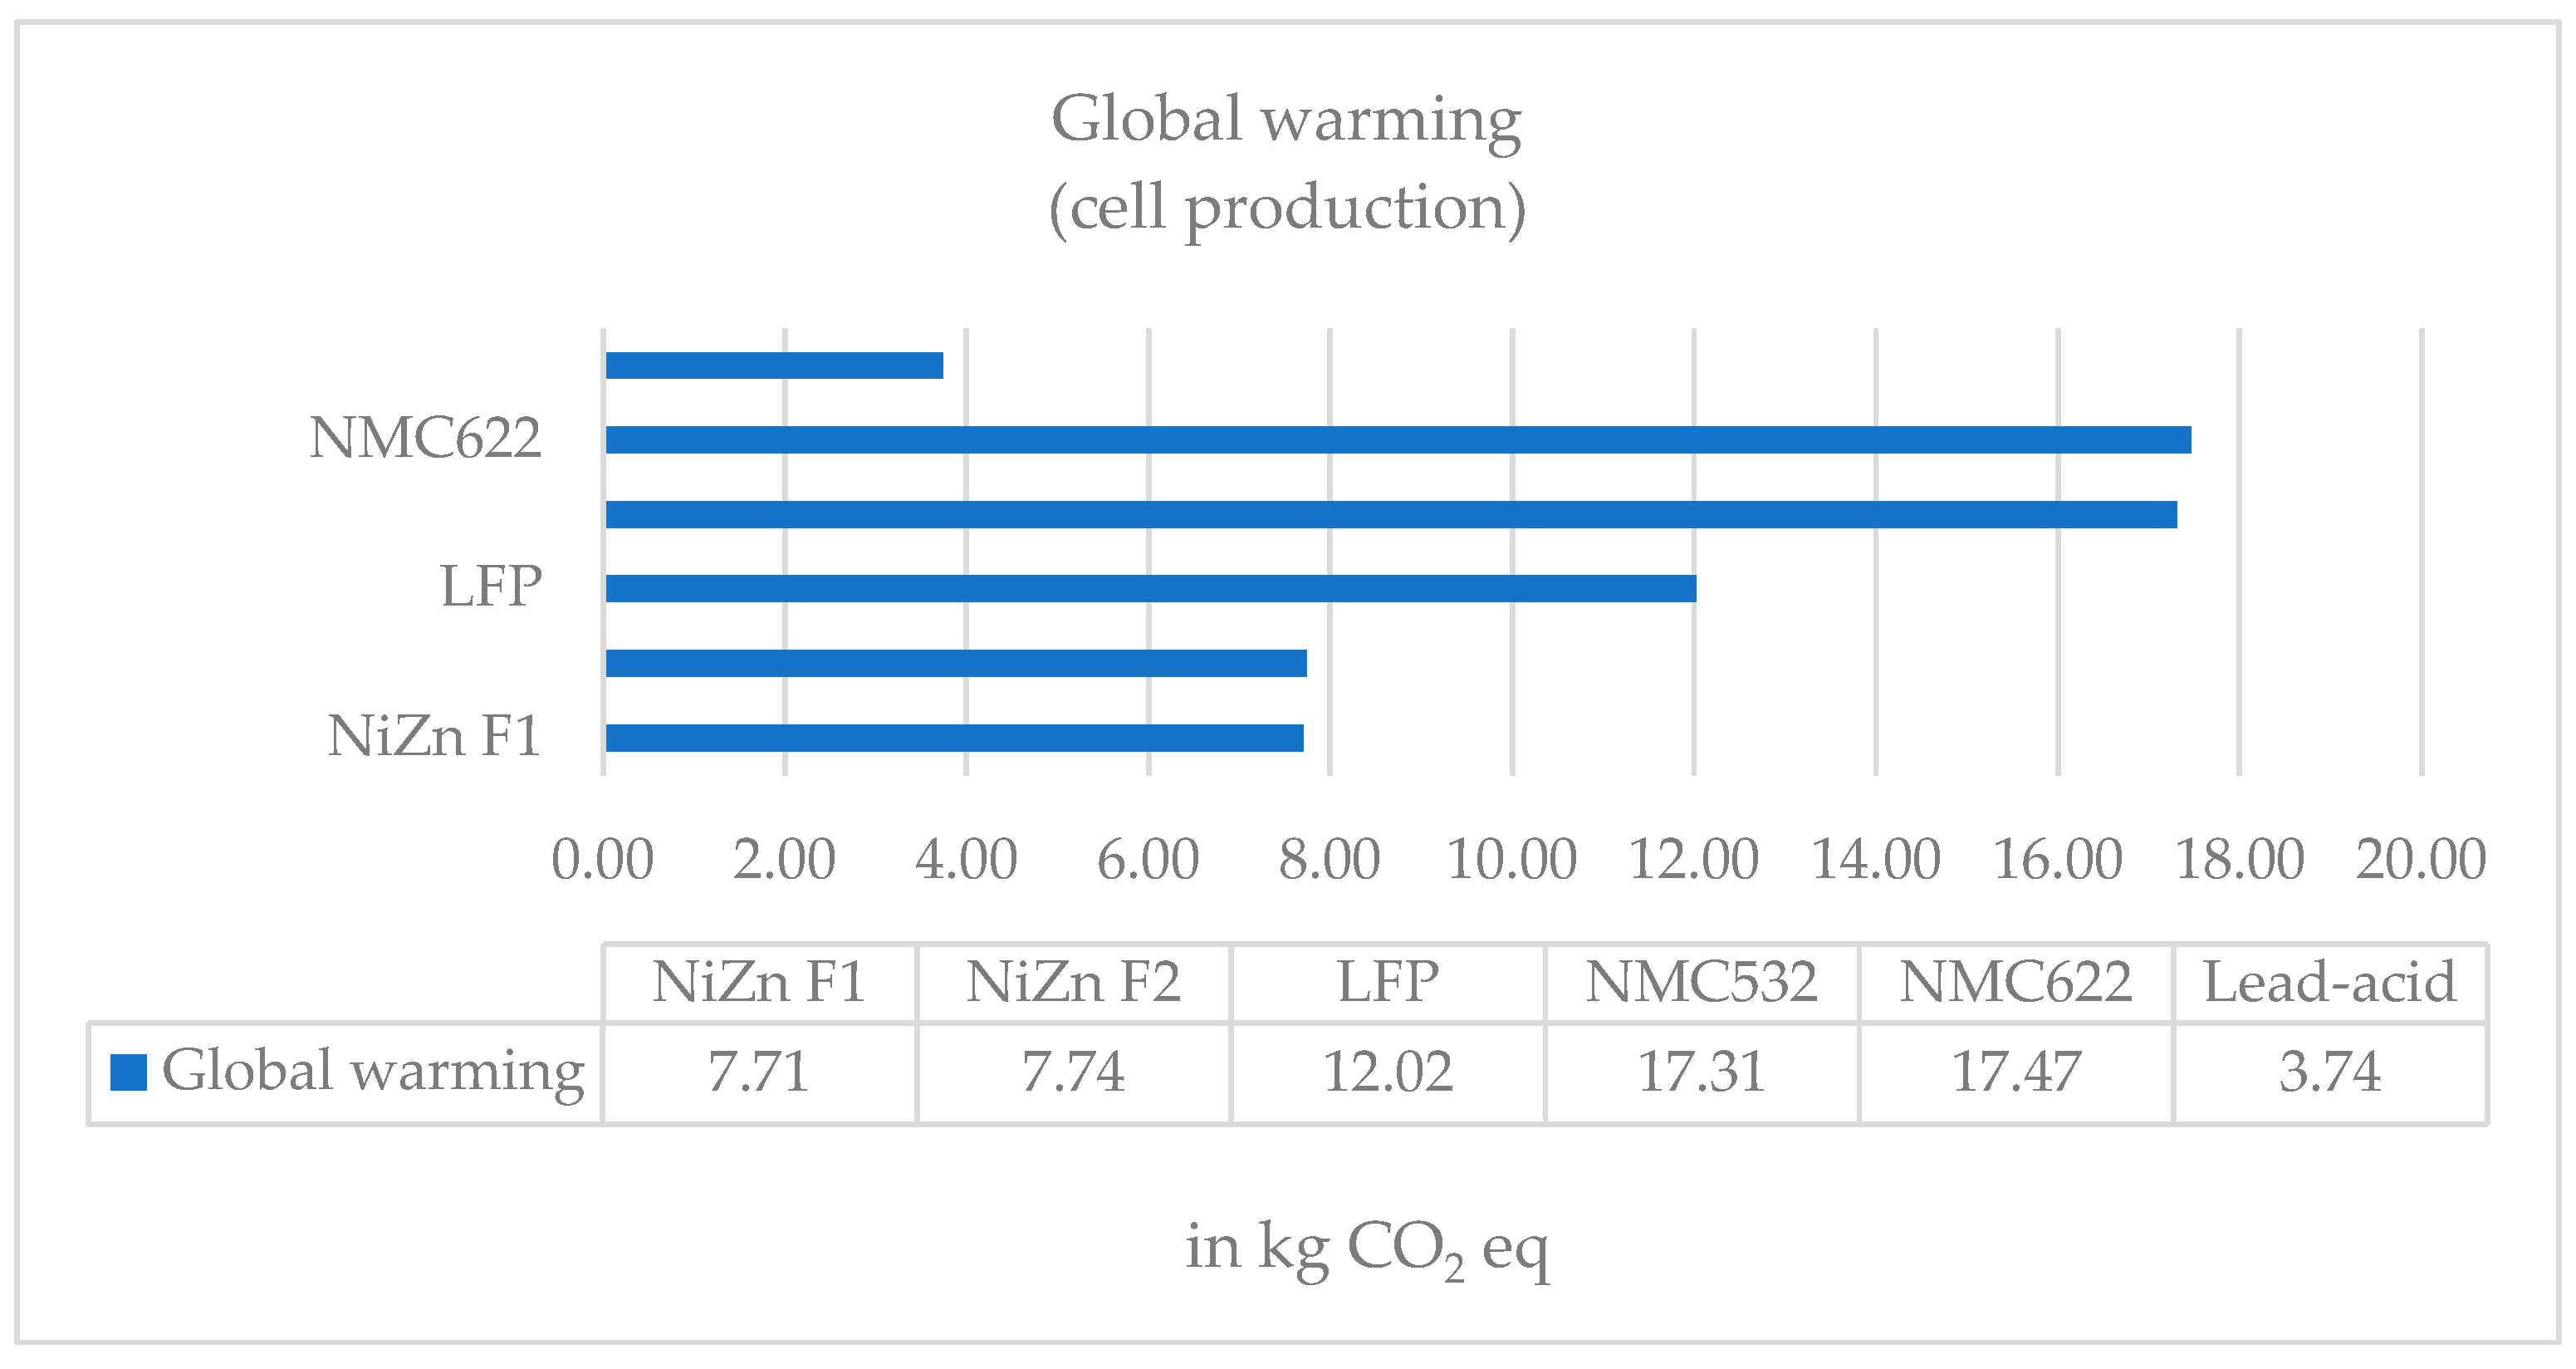
Figure 16.
Comparison results for the global warming cell production of all batteries.
Figure 16.
Comparison results for the global warming cell production of all batteries.
Figure 17.
Single score results of damage categories for all battery types (cell production).
Figure 17.
Single score results of damage categories for all battery types (cell production).
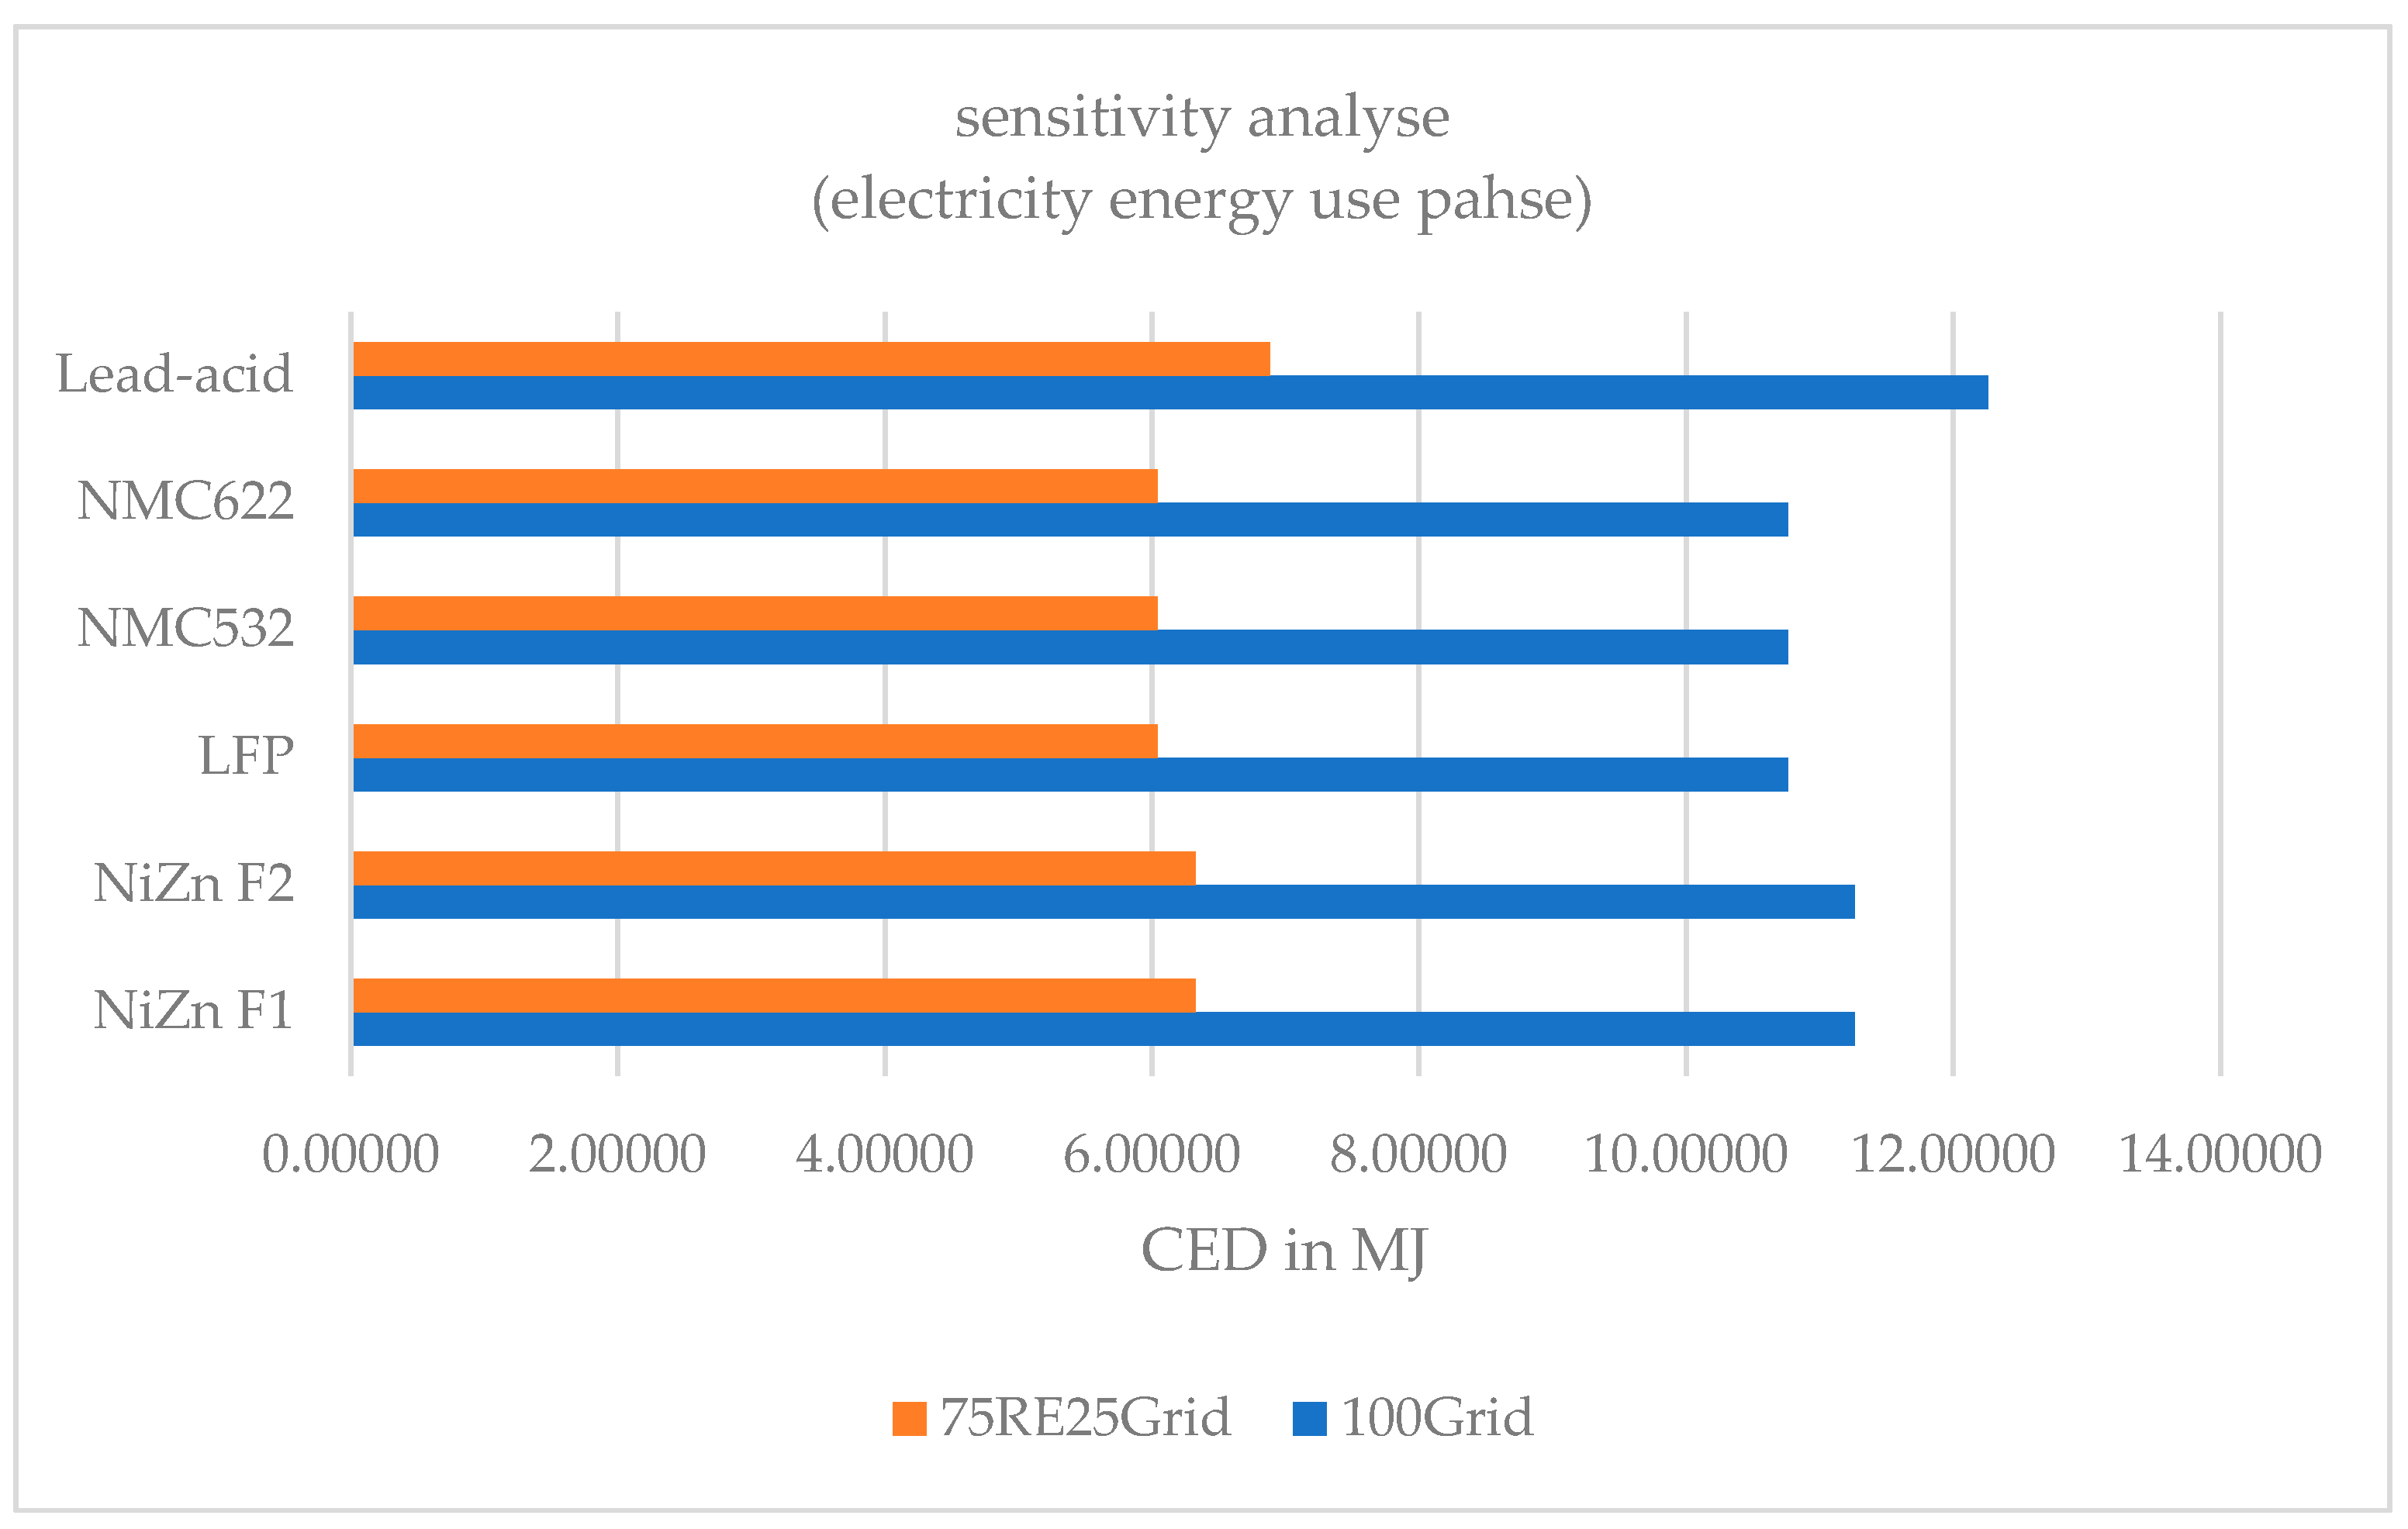
Figure 18.
Sensitivity analysis of the electricity mix in the use phase of all battery types—CED results.
Figure 18.
Sensitivity analysis of the electricity mix in the use phase of all battery types—CED results.
Figure 19.
Sensitivity analysis of the electricity mix in the use phase of all battery types—global warming results.
Figure 19.
Sensitivity analysis of the electricity mix in the use phase of all battery types—global warming results.
Figure 20.
Sensitivity analysis of round-trip efficiency of all battery types—CED results.
Figure 20.
Sensitivity analysis of round-trip efficiency of all battery types—CED results.
Table 1.
GWP and CED of zinc production given in the literature (electrolytic process).
Table 1.
GWP and CED of zinc production given in the literature (electrolytic process).
| No. | References | Global Warming Potential
(kg CO2eq/kg) | Cumulative Energy Demand
(MJ/kg) |
|---|
| 1 | (Qi et al., 2017) [16] | 6.12 | 78.1 |
| 2 | (International Zinc Association, 2016 [13];
Van Genderen et al., 2016 [14]) | 2.66 | 37.4 |
| 3 | (Nuss and Eckelman, 2014) [17] | 3.1 | 52.9 |
| 4 | (Andrae and Vaija, 2014) [18] | 4.11 | - |
| 5 | (Norgate et al., 2007) [19] | 4.6 | 48 |
Table 2.
Summary of range of values for CED and GWP per kg of battery reported in the bibliography for different chemistries.
Table 2.
Summary of range of values for CED and GWP per kg of battery reported in the bibliography for different chemistries.
| No. | Battery Technology | CED (MJ/kg Battery) | GWP (kg CO2eq/kg Battery) |
|---|
| 1 | NiZn (Nickel-Zinc) [10] | 1.37–4.05 | 0.08–0.244 |
| 2 | NaS (Sodium-sulfur) [11,22,23,24] | 174–235 | 14.9 |
| 3 | PbA (Lead-Acid) [10,11,25,26,27,28] | 18–93 | 1.1–6.4 |
| 4 | Li-ion (Lithium-ion) [11,22,24,25,29,30,31,32] | | |
| - NCA (Lithium nickel cobalt aluminium oxides) | 125–224 | 7–18.1 |
| - NMC (Lithium nickel manganese cobalt oxides) | 160–231 | 5.69–22 |
| - LFP (Lithium Iron Phosphate) | 129–205 | 22 |
| - LMO (Lithium-ion manganese oxide) | 104–143 | 6–7.63 |
| 5 | NiCd (Nickel-Cadmium) [22,24,25,29] | 68–235 | 6.2–9.9 |
| 6 | NiMH (Nickel Metal Hydride) [24,25,29,33,34] | 108–263 | 2.2–20 |
Table 3.
Battery characteristics (cell) (Ref. LOLABAT project, [
5,
40,
47]).
Table 3.
Battery characteristics (cell) (Ref. LOLABAT project, [
5,
40,
47]).
| Batterie Chemistries | NiZn (F1) | NiZn (F2) | Lead-Acid | Lithium-Ion (LFP) | Lithium-Ion (NMC) |
|---|
| Voltage (V) | 1.63 V | 1.63 V | 2.1 | 3.3 | 3.6 Li (NixMnyCoz)O2 |
| Cathode | Ni (OH)2 | Ni (OH)2 | PbO2 | LiFePO4 | where x, y, z denotes different possibilities) |
| Anode | Zn | Zn | Pb | graphite | graphite |
| Energy density (Wh/L) | 80–200 | 80–200 | 60–75 | 200 | 500 |
| Specific Energy (Wh/kg) | 50 | 67 | 35–40 | 120 | 160 |
| Depth of discharge (DoD) (%) | 100 | 100 | 80 | 80 | 80–90 |
| Lifespan (cycles) | 3800 | 2000 | 1500 | 5000 | 2000–2500 |
| Calendar life (years) | 10 | 10 | 8.5 | 15 | 20 |
Table 4.
Battery performance parameters for use phase calculation according to Refs. [
10,
50,
51,
52].
Table 4.
Battery performance parameters for use phase calculation according to Refs. [
10,
50,
51,
52].
| Battery Types | Specific Energy of Battery Pack
(Wh/kg) | Round-Trip Efficiency
(%) | Cycle Life at 80% DOD
(No. of Cycles to Failure) | Calendar Life
(Years) |
|---|
| NiZn | 45 | 86 | 3800 | 10 |
| LIB | 79 | 90 | 2000 | 10 |
| Lead-acid | 60 | 79 | 300 | 10 |
Table 5.
Existing battery recycling routes.
Table 5.
Existing battery recycling routes.
| | Lead-Acid | LIB (LFP/NMC) | NiZn |
|---|
| collection rate | 100% | 100% | 100% |
| preparation | discharging | and dismantling to the cell level | |
| pre-recycling steps | breaking and separation | pretreatment (mechanical processing and pyrolysis) | pretreatment (wet-mechanical processing and separation) |
| recovered materials | lead, lead-oxide, lead sulphate | steel, Li-metal oxide | Fe, Al, plastics |
| metal recovery processes | hydrometallurgy | pyrometallurgy and direct | recycling |
| recoverable metals | Pb, antimony, tin, copper, silver | Al, Cu, Co salts, Ni salts,
Mn salts, Li salts | Zn-compounds, Ni-compounds,
Ti, Y, Bi, Co, Cu |
Table 6.
Electricity sources considered in LCI.
Table 6.
Electricity sources considered in LCI.
| LCI Steps | Electricity Dataset Used |
|---|
| NiZn cell manufacturing in China | Electricity mix in China:
Market for electricity, medium voltage I electricity, medium voltage I APOS, U—CN-SGCC |
| Lithium-ion battery cell and pack manufacturing | since the manufacturing is located in Italy.
“Market for electricity, high voltage I electricity, high voltage I APOS, U—IT” and
“market for electricity, medium voltage I electricity, medium voltage I APOS, U—IT” |
| Lead-acid battery cell and pack manufacturing | adopted from the process.
“Battery production, lead-acid, rechargeable, stationary I battery, lead-acid, rechargeable,
stationary|APOS, U—RoW” available on ecoinvent 3.8. |
| Battery use phase—grid | Market for electricity, medium voltage I electricity, medium voltage I APOS, U—DE. |
| Battery use—renewable | Market for electricity, medium voltage, renewable energy products I electricity, medium
voltage, renewable energy products I APOS, U—CH. |
Table 7.
Electricity mix in China.
Table 7.
Electricity mix in China.
| Composition | Percentage (%) |
|---|
| Coal | 73.20% |
| Crude Oil | 8.40% |
| Natural Gas | 4.80% |
| Primary and others | 13.70% |
| Total | 100.10% |
Table 8.
CED results for NiZn F1_Use Scenario 1_100Grid.
Table 8.
CED results for NiZn F1_Use Scenario 1_100Grid.
| Impact Category | Production | Transport | Use | Impact Result Total | Unit |
|---|
| Renewable, water | 31.82% | 0.36% | 67.82% | 0.35871 | MJ |
| Non-renewable, nuclear | 3.48% | 0.11% | 96.41% | 2.49514 | MJ |
| Renewable, biomass | 9.46% | 0.20% | 90.34% | 0.25221 | MJ |
| Non-renewable, biomass | 5.93% | 0.12% | 93.50% | 0.00193 | MJ |
| Non-renewable, fossil | 8.40% | 7.30% | 84.30% | 8.78005 | MJ |
| Renewable, wind, solar, Goethe | 1.02% | 0.04% | 98.94% | 0.99126 | MJ |
Table 9.
CED results for NiZn F1_Use Scenario 2_75RenewEnerg/25Grid.
Table 9.
CED results for NiZn F1_Use Scenario 2_75RenewEnerg/25Grid.
| Impact Category | Production | Transport | Use | Impact Result Total | Unit |
|---|
| Renewable, water | 3.24% | 0.03% | 96.72% | 3.52631 | MJ |
| Non-renewable, nuclear | 12.37% | 0.37% | 87.25% | 0.70295 | MJ |
| Renewable, biomass | 22.05% | 0.46% | 77.49% | 0.10819 | MJ |
| Non-renewable, biomass | 17.73% | 0.36% | 81.91% | 0.00064 | MJ |
| Non-renewable, fossil | 22.41% | 19.48% | 58.11% | 3.28957 | MJ |
| Renewable, wind, solar, Goethe | 3.25% | 0.11% | 96.65% | 0.31403 | MJ |
Table 10.
Midpoint (H) results for NiZn F1_Use Scenario 2_75RenewEnerg/25Grid.
Table 10.
Midpoint (H) results for NiZn F1_Use Scenario 2_75RenewEnerg/25Grid.
| Impact Category | Production | Transport | Use | Impact Result Total | Unit |
|---|
| Fine particulate matter formation | 61.10% | 11.38% | 27.51% | 0.00037 | kg PM2.5 eq |
| Fossil resource scarcity | 22.23% | 19.44% | 58.33% | 0.07202 | kg oil eq |
| Freshwater ecotoxicity | 81.85% | 0.19% | 17.96% | 0.06483 | kg 1,4-DCB |
| Freshwater eutrophication | 23.04% | 0.18% | 76.79% | 0.00034 | kg P eq |
| Global warming | 22.56% | 15.37% | 62.06% | 0.28069 | kg CO2 eq |
| Human carcinogenic toxicity | 37.21% | 1.00% | 61.79% | 0.02823 | kg 1,4-DCB |
| Human non-carcinogenic toxicity | 70.18% | 0.86% | 28.97% | 1.10534 | kg 1,4-DCB |
| lionizing radiation | 12.23% | 1.16% | 86.61% | 0.03722 | kBq Co-60 eq |
| Land use | 9.90% | 1.77% | 88.34% | 0.00676 | m2a crop eq |
| Marine ecotoxicity | 81.32% | 0.26% | 18.43% | 0.08377 | kg 1,4-DCB |
| Marine eutrophication | 26.65% | 0.30% | 73.05% | 0.00003 | kg N eq |
| Mineral resource scarcity | 95.51% | 0.17% | 4.32% | 0.00885 | kg Cu eq |
| Ozone formation, Human health | 36.06% | 32.16% | 31.78% | 0.00065 | kg NOx eq |
| Ozone formation, Terrestrial ecosystem | 36.23% | 32.02% | 31.75% | 0.00066 | kg NOx eq |
| Stratospheric ozone depletion | 15.82% | 5.18% | 79.00% | 0.00000 | kg CFC11 eq |
| Terrestrial acidification | 59.67% | 12.24% | 28.08% | 0.00103 | kg SO2 eq |
| Terrestrial ecotoxicity | 89.76% | 2.45% | 7.79% | 3.87112 | kg 1,4-DCB |
| Water consumption | 6.89% | 0.12% | 93.11% | 0.01656 | m3 |
Table 11.
Endpoint results (H) for NiZn F1_Use Scenario 1_100Grid.
Table 11.
Endpoint results (H) for NiZn F1_Use Scenario 1_100Grid.
| Damage Category | Result | Unit |
|---|
| Human health | 1.7823 × 10⁻⁶ | DALY |
| Ecosystems | 3.7939 × 10⁻⁹ | species. yr. |
| Resources | 2.9359 × 10⁻² | USD2013 |
Table 12.
Aggregated weighted average (Single score) results for NiZn F1_Use Scenario 1_100Grid.
Table 12.
Aggregated weighted average (Single score) results for NiZn F1_Use Scenario 1_100Grid.
| Damage Category | Single Score | Unit |
|---|
| Human health | 1.270 × 10⁻⁵ | Pt |
| Ecosystems | 1.087 × 10⁻⁹ | Pt |
| Resources | 2.467 × 10⁵ | Pt |
Table 13.
Aggregated weighted average (Single score) Endpoint (H) for NiZn F1_Use Scenario 2_75ReRenewEnerg/25Grid.
Table 13.
Aggregated weighted average (Single score) Endpoint (H) for NiZn F1_Use Scenario 2_75ReRenewEnerg/25Grid.
| Damage Category | Single Score | Unit |
|---|
| Human health | 6.261 × 10⁻⁶ | Pt |
| Ecosystems | 4.863 × 10⁻¹⁰ | Pt |
| Resources | 1.407 × 10⁵ | Pt |
Table 14.
CED results for NiZn F2 with preliminary EoL_Scenario 1_100Grid.
Table 14.
CED results for NiZn F2 with preliminary EoL_Scenario 1_100Grid.
| Impact Category | Production | Transport | Use | EoL | Impact Result Total | Unit |
|---|
| Renewable, water | 17.30% | 0.16% | 29.67% | 52.88% | 0.82008 | MJ |
| Non-renewable, nuclear | 4.86% | 0.10% | 91.35% | 3.68% | 2.63334 | MJ |
| Renewable, biomass | 11.81% | 0.18% | 84.83% | 3.18% | 0.26860 | MJ |
| Non-renewable, biomass | 6.67% | 0.11% | 92.08% | 1.13% | 0.00197 | MJ |
| Non-renewable, fossil | 10.28% | 6.73% | 77.71% | 5.28% | 9.52538 | MJ |
| Renewable, wind, solar, Goethe | 1.55% | 0.04% | 97.40% | 1.01% | 1.00689 | MJ |
Table 15.
CED results for NiZn F2 with preliminary EoL_Scenario 2_75RenewEnerg/25Grid.
Table 15.
CED results for NiZn F2 with preliminary EoL_Scenario 2_75RenewEnerg/25Grid.
| Impact Category | Production | Transport | Use | EoL | Impact Result Total | Unit |
|---|
| Renewable, water | 3.56% | 0.03% | 85.54% | 10.87% | 3.98767 | MJ |
| Non-renewable, nuclear | 15.23% | 0.31% | 72.92% | 11.53% | 0.84115 | MJ |
| Renewable, biomass | 25.45% | 0.40% | 67.29% | 6.86% | 0.12458 | MJ |
| Non-renewable, biomass | 19.18% | 0.34% | 77.23% | 3.25% | 0.00068 | MJ |
| Non-renewable, fossil | 24.27% | 15.89% | 47.37% | 12.46% | 4.03490 | MJ |
| Renewable, wind, solar, Goethe | 4.75% | 0.10% | 92.07% | 3.08% | 0.32966 | MJ |
Table 16.
Midpoint (H) results for NiZn F2 with preliminary EoL-Scenario 1.
Table 16.
Midpoint (H) results for NiZn F2 with preliminary EoL-Scenario 1.
| Impact Category | Production | Transport | Use | EoL | Impact Result Total | Unit |
|---|
| Fine particulate matter formation | 17.48% | 2.78% | 22.39% | 57.35% | 0.00153 | kg PM2.5 eq |
| Fossil resource scarcity | 10.19% | 6.70% | 77.84% | 5.27% | 0.20901 | kg oil eq |
| Freshwater ecotoxicity | 47.73% | 0.09% | 28.99% | 23.19% | 0.13086 | kg 1,4-DCB |
| Freshwater eutrophication | 8.79% | 0.06% | 87.53% | 3.62% | 0.00116 | kg Peq |
| Global warming | 10.10% | 5.23% | 79.73% | 4.93% | 0.82472 | kg CO2 eq |
| Human carcinogenic toxicity | 17.52% | 0.35% | 71.30% | 10.83% | 0.08043 | kg 1,4-DCB |
| Human non-carcinogenic toxicity | 34.97% | 0.35% | 43.09% | 21.58% | 2.66202 | kg 1,4-DCB |
| lionizing radiation | 4.88% | 0.31% | 90.50% | 4.31% | 0.13961 | kBq Co-60 eq |
| Land use | 6.73% | 0.63% | 91.96% | 0.68% | 0.01922 | m2a crop eq |
| Marine ecotoxicity | 46.85% | 0.13% | 29.38% | 23.64% | 0.17227 | kg 1,4-DCB |
| Marine eutrophication | 10.16% | 0.09% | 82.94% | 6.81% | 0.00008612 | kg N eq |
| Mineral resource scarcity | 44.03% | 0.06% | 3.84% | 52.07% | 0.02249 | kg Cu eq |
| Ozone formation, Human health | 21.24% | 14.90% | 51.44% | 12.41% | 0.00140 | kg NOx eq |
| Ozone formation, Terrestrial ecosystems | 21.42% | 14.82% | 51.29% | 12.48% | 0.00142 | kg NOx eq |
| Stratospheric ozone depletion | 8.87% | 2.16% | 82.42% | 6.55% | 0.00000054 | kg CFC11 eq |
| Terrestrial acidification | 14.25% | 2.67% | 21.06% | 62.02% | 0.00473 | kg SO2 eq |
| Terrestrial ecotoxicity | 32.78% | 0.92% | 5.95% | 60.35% | 10.29883 | kg 1,4-DCB |
| Water consumption | 10.87% | 0.16% | 57.08% | 31.89% | 0.01290 | m3 |
Table 17.
Midpoint (H) results for NiZn F2 with preliminary EoL-Scenario 2_75RenewEnerg/25Grid.
Table 17.
Midpoint (H) results for NiZn F2 with preliminary EoL-Scenario 2_75RenewEnerg/25Grid.
| Impact Category | Production | Transport | Use | EoL | Impact Result Total | Unit |
|---|
| Fine particulate matter formation | 20.72% | 3.30% | 7.97% | 68.01% | 0.00129 | kg PM2.5 eq |
| Fossil resource scarcity | 24.12% | 15.85% | 47.56% | 12.47% | 0.08832 | kg oil eq |
| Freshwater ecotoxicity | 59.73% | 0.11% | 11.14% | 29.02% | 0.10457 | kg 1,4-DCB |
| Freshwater eutrophication | 25.23% | 0.15% | 64.24% | 10.38% | 0.00040 | kg P eq |
| Global warming | 24.40% | 12.64% | 51.03% | 11.93% | 0.34141 | kg CO2 eq |
| Human carcinogenic toxicity | 34.78% | 0.69% | 43.03% | 21.50% | 0.04053 | kg 1,4-DCB |
| Human non-carcinogenic toxicity | 50.72% | 0.52% | 17.45% | 31.31% | 1.83504 | kg 1,4-DCB |
| lionizing radiation | 14.97% | 0.95% | 70.84% | 13.23% | 0.04550 | kBq Co-60 eq |
| Land use | 17.23% | 1.59% | 79.45% | 1.74% | 0.00752 | m2a crop eq |
| Marine ecotoxicity | 58.88% | 0.16% | 11.26% | 29.70% | 0.13709 | kg 1,4-DCB |
| Marine eutrophication | 26.28% | 0.24% | 55.85% | 17.64% | 0.00003 | kg N eq |
| Mineral resource scarcity | 44.99% | 0.06% | 1.73% | 53.21% | 0.02200 | kg Cu eq |
| Ozone formation, Human health | 33.56% | 23.55% | 23.26% | 19.62% | 0.00088 | kg NOx eq |
| Ozone formation, Terrestrial ecosy | 33.78% | 23.37% | 23.18% | 19.67% | 0.00090 | kg NOx eq |
| Stratospheric ozone depletion | 17.53% | 4.28% | 65.23% | 12.96% | 0.00000027 | kg CFC11 eq |
| Terrestrial acidification | 16.75% | 3.14% | 7.19% | 72.92% | 0.00403 | kg SO2 eq |
| Terrestrial ecotoxicity | 33.80% | 0.95% | 3.01% | 62.23% | 9.98726 | kg 1,4-DCB |
| Water consumption | 6.70% | 0.09% | 73.58% | 19.64% | 0.02096 | m3 |
Table 18.
Endpoint (H) results for NiZn F2 with preliminary EoL_Scenario 1_100Grid.
Table 18.
Endpoint (H) results for NiZn F2 with preliminary EoL_Scenario 1_100Grid.
| Damage Category | Result | Unit |
|---|
| Human health | 2.6310 × 10⁻⁶ | DALY |
| Ecosystems | 4.8434 × 10⁻⁹ | species.yr |
| Resources | 0.0367 | USD2013 |
Table 19.
Aggregated weighted average (Single score) results for NiZn F2 with preliminary EoL-Scenario 1_100Grid.
Table 19.
Aggregated weighted average (Single score) results for NiZn F2 with preliminary EoL-Scenario 1_100Grid.
| Damage Category | Single Score | Unit |
|---|
| Human health | 1.8748 × 10⁻⁵ | Pt |
| Ecosystems | 1.3878 × 10⁻⁹ | Pt |
| Resources | 3.0827 × 10⁵ | Pt |
Table 20.
Endpoint (H) results for NiZn F2 with preliminary EoL-Scenario 2_75RenewEnerg/25Grid.
Table 20.
Endpoint (H) results for NiZn F2 with preliminary EoL-Scenario 2_75RenewEnerg/25Grid.
| Damage Category | Result | Unit |
|---|
| Human health | 1.7274 × 10⁻⁶ | DALY (Disability Adjusted Life Year) |
| Ecosystems | 2.7468 × 10⁻⁹ | species.yr |
| Resources | 0.0241 | USD2013 |
Table 21.
Aggregated weighted average (Single score) results for NiZn F2_with preliminary EoL-Scenario 2_75RenewEnerg/25Grid.
Table 21.
Aggregated weighted average (Single score) results for NiZn F2_with preliminary EoL-Scenario 2_75RenewEnerg/25Grid.
| Damage Category | Single Score | Unit |
|---|
| Human health | 1.2309 × 10⁻⁵ | Pt |
| Ecosystems | 7.8704 × 10⁻¹⁰ | Pt |
| Resources | 2.0233 × 10⁵ | Pt |
Table 22.
CED results for cradle-to-grave of all batteries with a breakdown of impact categories.
Table 22.
CED results for cradle-to-grave of all batteries with a breakdown of impact categories.
| Impact Category | NiZn F2 | LFP | NMC 532 | NMC 622 | Lead-Acid | Unit |
|---|
| Renewable, water | 0.82008 | 0.38319 | 0.99153 | 1.03482 | 1.84160 | MJ |
| Non-renewable, nuclear | 2.63334 | 2.43256 | 2.56616 | 2.57393 | 5.34186 | MJ |
| Renewable, biomass | 0.26860 | 0.25008 | 0.25758 | 0.25785 | 0.87984 | MJ |
| Non-renewable, biomass | 0.00197 | 0.00185 | 0.00187 | 0.00187 | 0.00411 | MJ |
| Non-renewable, fossil | 9.52538 | 8.22665 | 8.64982 | 8.67016 | 32.89169 | MJ |
| Renewable, wind, solar, Goethe | 1.00689 | 0.95911 | 0.97733 | 0.97815 | 1.45757 | MJ |
| Total | 14.25625 | 12.25344 | 13.44429 | 13.51678 | 42.41667 | MJ |
Table 23.
Midpoint results of cradle-to-grave for all batteries.
Table 23.
Midpoint results of cradle-to-grave for all batteries.
| Indicator | NiZn F2 | LFP | NMC532 | NMC622 | Lead-Acid | Unit |
|---|
| Fine particulate matter formation | 0.00153 | 0.00064 | 0.00071 | 0.00072 | 0.00509 | kg PM2.5 eq |
| Fossil resource scarcity | 0.20901 | 0.18061 | 0.18986 | 0.19031 | 0.71862 | kg oil eq |
| Freshwater ecotoxicity | 0.13086 | 0.07409 | 0.07498 | 0.07535 | 1.00890 | kg 1,4-DCB |
| Freshwater eutrophication | 0.00116 | 0.00105 | 0.00106 | 0.00106 | 0.00255 | kg Peq |
| Global warming | 0.82472 | 0.72774 | 0.75234 | 0.75385 | 3.30827 | kg CO2 eq |
| Human carcinogenic toxicity | 0.08043 | 0.07186 | 0.07291 | 0.07306 | 1.31638 | kg 1,4-DCB |
| Human non-carcinogenic toxicity | 2.66202 | 1.79109 | 1.87256 | 1.88402 | 43.89870 | kg 1,4-DCB |
| Ionizing radiation | 0.13961 | 0.12793 | 0.13555 | 0.13600 | 0.28273 | kBq Co-60 eq |
| Land use | 0.01922 | 0.01834 | 0.01858 | 0.01859 | 0.04558 | m2a crop eq |
| Marine ecotoxicity | 0.17227 | 0.09858 | 0.10017 | 0.10068 | 1.37439 | kg 1,4-DCB |
| Marine eutrophication | 0.00009 | 0.00009 | 0.00009 | 0.00009 | 0.00019 | kg N eq |
| Mineral resource scarcity | 0.02249 | 0.00552 | 0.01300 | 0.01359 | 0.19946 | kg Cu eq |
| Ozone formation, Human health | 0.00140 | 0.00100 | 0.00104 | 0.00104 | 0.00676 | kg NOx eq |
| Ozone formation, Terrestrial ecosystems | 0.00142 | 0.00101 | 0.00106 | 0.00106 | 0.00692 | kg NOx eq |
| Stratospheric ozone depletion | 0.00000 | 0.00000 | 0.00000 | 0.00000 | 0.00000 | kg CFC11 eq |
| Terrestrial acidification | 0.00473 | 0.00177 | 0.00199 | 0.00201 | 0.01071 | kg SO2 eq |
| Terrestrial ecotoxicity | 10.29880 | 3.82854 | 4.84463 | 4.97144 | 53.51310 | kg 1,4-DCB |
| Water consumption | 0.01290 | 0.00884 | 0.01384 | 0.01418 | 0.03740 | m3 |
Table 24.
Endpoint results cradle-to-grave for all batteries.
Table 24.
Endpoint results cradle-to-grave for all batteries.
| Damage Category | NiZn F2 | LFP | NMC532 | NMC622 | Lead-Acid | Unit |
|---|
| Human health | 2.63098 × 10⁻⁶ | 1.92251 × 10⁻⁶ | 1.84820 × 10⁻⁶ | 1.85772 × 10⁻⁶ | 2.07393 × 10⁻⁵ | DALY |
| Ecosystems | 4.84340 × 10⁻⁹ | 3.63621 × 10⁻⁹ | 3.84092 × 10⁻⁹ | 3.85640 × 10⁻⁹ | 1.64976 × 10⁻⁸ | species.yr |
| Resources | 3.66846 × 10⁻² | 2.39800 × 10⁻² | 2.88200 × 10⁻² | 2.91000 × 10⁻² | 2.05258 × 10⁻¹ | USD2013 |
Table 25.
Aggregated weighted average (Single score) results cradle-to-grave for all batteries.
Table 25.
Aggregated weighted average (Single score) results cradle-to-grave for all batteries.
| Damage Category | NiZn F2 | LFP | NMC532 | NMC622 | Lead-Acid | Unit |
|---|
| Human health | 1.87481 × 10⁻⁵ | 1.24411 × 10⁻⁵ | 1.31701 × 10⁻⁵ | 1.32380 × 10⁻⁵ | 1.47786 × 10⁻⁴ | Pt |
| Ecosystems | 1.38779 × 10⁻⁹ | 1.04189 × 10⁻⁹ | 1.10055 × 10⁻⁹ | 1.10499 × 10⁻⁹ | 4.72711 × 10⁻⁹ | Pt |
| Resources | 3.08274 × 10⁵ | 1.26217 × 10⁻⁴ | 2.74250 × 10⁻⁴ | 2.85765 × 10⁻² | 1.72485 × 10⁻⁶ | Pt |
Table 26.
The comparison results from CED-Cell Production.
Table 26.
The comparison results from CED-Cell Production.
| Indicator | NiZn-F1 | NiZn-F2 | LFP | NMC532 | NMC622 | Lead-Acid | Unit |
|---|
| Non-renewable, fossil | 88.393 | 87.836 | 152.552 | 241.388 | 244.049 | 51.631 | MJ |
| Non-renewable, biomass | 0.015 | 0.014 | 0.021 | 0.027 | 0.027 | 0.003 | MJ |
| Non-renewable, nuclear | 9.403 | 9.454 | 20.700 | 41.222 | 42.216 | 4.379 | MJ |
| Renewable, biomass | 2.824 | 2.723 | 4.694 | 6.485 | 6.519 | 0.998 | MJ |
| Renewable, water | 16.098 | 19.105 | 23.871 | 102.127 | 107.691 | 2.367 | MJ |
| Renewable, wind, solar, Goethe | 1.070 | 1.128 | 4.504 | 8.022 | 8.126 | 0.594 | MJ |
| Total | 117.80210 | 120.26042 | 206.34199 | 399.27115 | 408.62730 | 59.97217 | MJ |
Table 27.
Comparison results of selected Midpoint impact categories for cell production.
Table 27.
Comparison results of selected Midpoint impact categories for cell production.
| Indicator | NiZn F1 | NiZn F2 | LFP | NMC532 | NMC622 | Lead-Acid | Unit |
|---|
| Human carcinogenic toxicity | 1.28 | 1.35 | 1.39 | 1.46 | 1.48 | 1.08 | kg 1,4-DCB |
| Human non-carcinogenic toxicity | 100.92 | 98.19 | 56.29 | 63.83 | 65.30 | 39.83 | kg 1,4-DCB |
| Terrestrial ecotoxicity | 507.77 | 467.14 | 421.51 | 522.25 | 538.47 | 66.04 | kg 1,4-DCB |
Table 28.
Comparison Endpoint results from cell production of all batteries.
Table 28.
Comparison Endpoint results from cell production of all batteries.
| Damage Category | NiZn F1 | NiZn F2 | LFP | NMC532 | NMC622 | Lead-Acid | Unit |
|---|
| Human health | 0.00005 | 0.00005 | 0.00005 | 0.00007 | 0.00007 | 0.00002 | DALY |
| Ecosystems | 0.00000 | 0.00000 | 0.00000 | 0.00000 | 0.00000 | 0.00000 | species.yr |
| Resources | 0.74281 | 0.79345 | 1.07759 | 1.89389 | 1.93155 | 0.38214 | USD2013 |
Table 29.
Comparison aggregated weighted average (Single score) results from cell production of all batteries.
Table 29.
Comparison aggregated weighted average (Single score) results from cell production of all batteries.
| Damage Category | NiZn F1 | NiZn F2 | LFP | NMC532 | NMC622 | Lead-Acid | Unit |
|---|
| Human health | 3.82097 × 10⁻⁴ | 3.73759 × 10⁻⁴ | 3.72672 × 10⁻⁴ | 4.81078 × 10⁻⁴ | 4.89835 × 10⁻⁴ | 1.57051 × 10⁻⁴ | Pt |
| Ecosystems | 1.82663 × 10⁻⁸ | 1.79369 × 10⁻⁸ | 2.24659 × 10⁻⁸ | 3.20411 × 10⁻⁸ | 3.26140 × 10⁻⁸ | 5.84248 × 10⁻⁹ | Pt |
| Resources | 6.24206 × 10⁶ | 6.66763 × 10⁶ | 9.05536 × 10⁶ | 1.59150 × 10⁷ | 1.62315 × 10⁷ | 3.21125 × 10⁶ | Pt |
Table 30.
Results of the sensitivity analysis of the electricity mix in the use phase.
Table 30.
Results of the sensitivity analysis of the electricity mix in the use phase.
| Battery Types | 100Grid | 75RE25Grid | Unit |
|---|
| NiZn F1 | 11.26083 | 6.32341 | MJ |
| NiZn F2 | 11.26142 | 6.32363 | MJ |
| LFP | 10.76112 | 6.04256 | MJ |
| NMC532 | 10.76086 | 6.04261 | MJ |
| NMC622 | 10.76078 | 6.04206 | MJ |
| Lead-acid | 12.25953 | 6.88437 | MJ |
Table 31.
Results of the sensitivity analysis of the electricity mix in the use phase—global warming results.
Table 31.
Results of the sensitivity analysis of the electricity mix in the use phase—global warming results.
| Battery Types | 100Grid | 75RE25Grid | Unit |
|---|
| NiZn F1 | 0.6575 | 0.1742 | kg CO2 eq |
| NiZn F2 | 0.6575 | 0.1742 | kg CO2 eq |
| LFP | 0.6283 | 0.1665 | kg CO2 eq |
| NMC532 | 0.6283 | 0.1665 | kg CO2 eq |
| NMC622 | 0.6286 | 0.1665 | kg CO2 eq |
| Lead-acid | 0.7159 | 0.1895 | kg CO2 eq |
Table 32.
Parameters used for sensitivity analysis of round-trip efficiency.
Table 32.
Parameters used for sensitivity analysis of round-trip efficiency.
| Parameters | Definition | Values |
|---|
| NiZn_RTE-high | 3% higher than the average Round-trip Efficiency of NiZn: 89% | 0.89 |
| NiZn_RTE-low | 3% lower than the average Round-trip Efficiency of NiZn: 86% | 0.83 |
| Lithium_RTE-high | 1% higher than the average Round-trip Efficiency of Lithium-ion Batteries: 90% | 0.91 |
| Lithium_RTE-low | 1% lower than the average Round-trip Efficiency of Lithium-ion Batteries: 90% | 0.89 |
| Lead_RTE-high | 1% higher than the average Round-trip Efficiency of Lead-acid battery: 79% | 0.80 |
| Lead_RTE-low | 1% lower than the average Round-trip Efficiency of Lead-acid battery: 79% | 0.78 |
Table 33.
Sensitivity analysis of round-trip efficiency results, full LCA.
Table 33.
Sensitivity analysis of round-trip efficiency results, full LCA.
| Battery Types | RTE_High | RTE_Low | Unit |
|---|
| NiZn F2 | 13.9363 | 14.7229 | MJ |
| LFP | 13.9363 | 14.7229 | MJ |
| NMC532 | 13.3262 | 13.5653 | MJ |
| NMC622 | 13.3987 | 13.6378 | MJ |
| Lead-acid | 42.2635 | 42.5738 | MJ |
Table 34.
Sensitivity analysis of round-trip efficiency—global warming results, full LCA.
Table 34.
Sensitivity analysis of round-trip efficiency—global warming results, full LCA.
| Battery Types | RTE_High | RTE_Low | Unit |
|---|
| NiZn F2 | 0.80256 | 0.84849 | kg CO2 eq |
| LFP | 0.72084 | 0.73480 | kg CO2 eq |
| NMC532 | 0.74544 | 0.75940 | kg CO2 eq |
| NMC622 | 0.74668 | 0.76064 | kg CO2 eq |
| Lead-acid | 3.29932 | 3.31745 | kg CO2 eq |

