Article

Influence of Coherent Vortex Rolls on Particle Dynamics in Unstably Stratified Turbulent Channel Flows

Dipartimento di Ingegneria Meccanica e Aerospaziale, Politecnico di Torino, Corso Duca degli Abruzzi 24, 10129 Torino, Italy
*
Author to whom correspondence should be addressed.
Energies 2024, 17(11), 2725; https://doi.org/10.3390/en17112725
Submission received: 6 May 2024 / Revised: 28 May 2024 / Accepted: 30 May 2024 / Published: 3 June 2024
(This article belongs to the Section J1: Heat and Mass Transfer)

Abstract

:
This work investigates the dynamics of heavy particles dispersed in turbulent channel flows under unstable thermal stratification conditions using point-particle direct numerical simulations (PP-DNS), to quantify the influence of large-scale coherent vortex rolls, arising from the combined effects of shear and buoyancy, on the spatial distribution and preferential sampling behavior of inertial particles. We examined three particle Stokes numbers ( St + = 0.6 , 60 , 120 ) and two friction Richardson numbers, Ri τ = 0.272 and Ri τ = 27.2 , which exemplify the regimes below and above the critical condition for vortex roll formation, respectively. The results indicate that the flow reorganization into large-scale longitudinal vortices significantly alters the topological features of small scales in the near-wall region impinged by the thermal plumes, resulting in a prevalence of vorticity-dominated topologies. The interplay between this phenomenon and the tendency of particles to preferentially sample strain-dominated topologies leads to a distinctive asymmetric particle distribution in the near-wall planes. Inertial particles markedly accumulate in the strain-dominated regions where the coherent thermal plumes emerge from the walls, while avoiding the vorticity-dominated impingement zones. This peculiar particle response to the vortex rolls is most pronounced when the particle response time matches the characteristic timescale of the large-scale coherent motions in the cross-stream planes.

1. Introduction

The combination of shear and buoyancy effects in transferring momentum and heat in fluid flows, known as mixed convection, is a common occurrence in many engineering applications, ranging from heat exchangers to electronic cooling systems, as well as natural processes such as atmospheric circulation and ocean currents. In turbulent flows, buoyancy can either enhance or suppress turbulent exchanges depending on the orientation of the temperature gradient (responsible for the fluid density gradient) relative to the gravitational acceleration. When a fluid is heated from above, and its lowest layers are cooled down, buoyancy suppresses vertical motions, establishing a stable stratification where hotter and less dense fluid layers sit atop colder and denser ones. Conversely, unstable stratification occurs when the fluid is heated from below, causing hotter and less dense fluid to rise while colder, denser fluid descends under the action of buoyancy. This generates a self-sustaining process which promotes convective vertical motions and enhances momentum and heat transfer within the fluid.
Several numerical and experimental studies have explored the influence of buoyancy on wall-bounded shear flows, revealing qualitative changes in wall turbulence characteristics and structures under both stable [1,2,3,4,5,6,7,8] and unstable [9,10,11,12,13,14,15,16,17] stratification.
In the context of stable stratification, as the temperature gradient increases and stratification strengthens, turbulent fluctuations, vertical transport, and coherent near-wall structures are progressively suppressed [3]. The inhibition of near-wall coherent structures reduces turbulent production and can lead to temporary flow laminarization [5]. Both measurements [2] and simulations [4,6] of wall-bounded flows under strong stratification show the formation of peculiar wave-like motions in the core region, created by pressure diffusion of shear-induced turbulence, as well as significant counter-gradient momentum and heat fluxes.
Wall-bounded flows under unstable stratification exhibit markedly different characteristics compared to both stably stratified and neutrally buoyant conditions. In unstably stratified flows, turbulent transport mechanisms are significantly influenced by large-scale coherent motions. Pioneering experiments by Mizushina et al. [9] and Fukui and Nakajima [10] provided the first evidence of the distinct features of wall-bounded turbulence under unstable stratification in open and closed channel flows, respectively. In the open channel case, Mizushina et al. [9] reported that ejection motions contributed predominantly to the total turbulent momentum and heat fluxes in the near-wall region. The measurements by Fukui and Nakajima [10] corroborated these findings, unveiling the differential impact of unstable stratification on turbulent fluctuations in the near-wall and outer regions.
At moderate Richardson numbers, unstably stratified flows reorganize into large-scale ordered motions through buoyancy-induced thermal plumes [12]. The combined effects of shear and buoyancy lead to the formation of distinct large-scale vortical structures, termed “vortex rolls”, which are aligned with the flow direction. The first experimental observation of vortex rolls in the plane channel [12] revealed that these coherent structures consist of pairs of counter-rotating streamwise vortices, spanning the entire duct region with an overall width approximately 1.3 times the channel height. The structures exhibited different characteristics compared to the analogous longitudinal vortices already observed in [18,19] for laminar unstably stratified flows. The formation and dynamics of large-scale vortical structures in unstably stratified flows have been further investigated through direct numerical simulations (DNS) by Domaradzki and Metcalfe [11], Iida and Kasagi [13], and Pirozzoli et al. [16]. In the plane Couette flow, Domaradzki and Metcalfe [11] observed that shear can effectively reorganize buoyancy-driven convective structures into longitudinal rolls, provided that the effects of shear and buoyancy are equally significant. When buoyancy effects predominate over shear, their results indicated that shear tends to disrupt the coherent thermal plumes, thereby inhibiting the generation of vortex rolls. Iida and Kasagi [13] recognized that the development of vortex rolls in channel flows is promoted by the spanwise flow generated when thermal plumes originating from one wall impinge upon the opposite wall and spread horizontally. This spanwise fluid motion sweeps out the near-wall low-speed streaks, streamwise vortices, and emerging thermal plumes, driving them towards confined regions. As a consequence, thermal plumes tend to coalesce and align with the direction of the flow, while the majority of streamwise turbulent structures accumulate where the largest thermal plumes emerge from the wall. Pirozzoli et al. [16] conducted a comprehensive numerical investigation of unstably stratified channel flow, encompassing a wide range of bulk Reynolds numbers ( 100 Re b 31,623) and bulk Richardson numbers ( 0.001 Ri b 100 ), including the limiting cases of pure forced convection ( Ri b = 0 ) and pure natural convection ( Re b = 0 ). For the cases examined, their study revealed that the large-scale organization of the flow is primarily governed by the Richardson number. Longitudinal vortex rolls were observed in the range from Ri b = 0.01 to the maximum value examined, Ri b = 100 . Notably, these vortices exhibited an ordered configuration at low Richardson numbers but displayed a tendency to meander in the spanwise direction as the stratification intensified. Their results further suggest that the dominance of shear over buoyancy, and vice versa, tend to disrupt the roll structures.
Consistent with the findings by Pirozzoli et al. [16], the linear stability analysis in Cossu [20] for thermally stratified channel flows demonstrated that the onset of large-scale convection rolls is associated with a linear instability of the turbulent mean flow to coherent streamwise-uniform perturbations. This instability arises at a critical friction Richardson number Ri τ 0.86 (or alternatively, Ri b 0.006 ), which is nearly invariant to the bulk Reynolds number, Re b , within the range 10 4 Re b 10 6 examined. For these Re b values, the spanwise wavelength ( λ cr ) of the critical coherent structures responsible for the vortex rolls exhibits a weak dependence on the Reynolds number. Specifically, λ cr is approximately 5.8 and 6.6 times the channel half-height, h, for Re b = 10 4 and Re b = 10 6 , respectively.
In the context of turbulent wall-bounded flows laden with small solid particles, highly coherent structures play a central role in determining particle dynamics and spatial distribution [21,22,23]. The investigation conducted by Marchioli and Soldati [23] demonstrated that near-wall coherent sweeps and ejections constitute efficient mechanisms through which wall turbulence transports inertial particles toward and away from the wall region, respectively. The main parameter governing the dynamics of small spherical particles in turbulent flows is the particle response time, defined as τ p = 2 ρ p r 2 / ( 9 ρ f ν ) , where ρ p / ρ f represents the particle-to-fluid density ratio, r is the particle radius, and ν is the fluid’s kinematic viscosity. This parameter represents a measure of particle inertia relative to the fluid’s viscous forces, and determines the tendency of particles to cluster, disperse, and sample preferentially specific flow regions. Numerous experimental and numerical studies on inertial particles dispersed in turbulent flows [22,23,24,25,26,27,28,29,30] have highlighted that the interaction between particles and turbulence, manifested through phenomena such as turbophoresis and inertial clustering, is most intense when the particle response time matches the timescale of local turbulent eddies. In wall-bounded flows, due to the interaction with near-wall vortical structures, particles with density significantly higher than the fluid commonly exhibit migration toward the wall, known as turbophoretic drift, and accumulation in low-speed streaks [27]. Heavy particles also tend to preferentially sample strain-dominated regions while avoiding high vorticity regions, a phenomenon referred to as preferential sampling or concentration [27].
To date, few works have analyzed the dynamics of a solid dispersed phase in wall-bounded flows under thermal unstable stratification [17,31]. The recent numerical investigation by Zaza and Iovieno [31], employing point-particle direct numerical simulations, explored how the interplay between particle inertia, wall turbulence, and heat transfer via both natural and forced convection alters the statistics of both the fluid and the particles in channel flow. By simulating the one- and two-way coupling regimes, the study primarily focused on quantifying the modifications to momentum and heat transport within the carrier flow when accounting for feedback forces and thermal interactions from the dispersed phase. Despite the insights provided, the response exhibited by particles to the flow regimes, particularly their spatial distribution and preferential sampling behavior in relation to the large-scale coherent vortices, has not been comprehensively investigated. Under unstable stratification, the dramatic change in the main flow structure caused by the reorganization into large-scale longitudinal vortices is expected to inevitably affect the topology of the smallest scales across the channel and consequently exert a significant influence on both the dynamics and preferential concentration of the particles.
Building upon the DNS dataset and preliminary findings reported in Zaza and Iovieno [31], the current work conducts an in-depth analysis of the dynamical interactions between vortex rolls and inertial particles in the plane channel flow. The primary objective is to quantify the influence of large-scale vortex rolls on the spatial distribution of heavy particles, with a particular focus on the modifications induced by moderate unstable stratification on particle turbophoretic drift toward the wall and preferential sampling of strain-dominated regions. The analysis is conducted by examining the local topology of the channel flow under regimes with and without the presence of rolls, using the approach proposed by Blackburn et al. [32]. This method employs the joint probability density functions (joint-PDFs) of the second and third invariants of the velocity gradient tensor to explore the topological features of the finest scales of motion, as classified by Chong et al. [33]. This topological approach is then extended to investigate particle preferential sampling by correlating particle concentration with the local flow topology, following the methodology previously employed in [27,34,35].
The remainder of this paper is structured as follows: In Section 2, we describe the physical model adopted to represent the non-isothermal particle-laden channel flow under unstable stratification and outline the methodology based on the invariants of the velocity gradient tensor used in the analysis. Section 3 presents and discusses the results of the investigation, while Section 4 provides the final conclusions.

2. Physical Model and Methodological Instruments

In this section, we outline the governing equations for both the fluid and dispersed phases, the computational domain on which they are numerically solved, and the boundary conditions used in the analysis. Additionally, we describe the invariants of the velocity gradient tensor, which are used to describe the local flow topology.

2.1. Governing Equations

We investigated the non-isothermal turbulent flow between two infinite, flat, and parallel walls. A uniform pressure gradient, p / x , drives the flow in a direction parallel to the walls, which is referred to as the streamwise direction, while gravitational acceleration acts perpendicular to the walls. To induce unstable stratification, a temperature difference T 1 T 2 between the solid boundaries is imposed, with the lower wall warmer than the upper wall ( T 1 > T 2 ). The streamwise, wall-normal, and spanwise directions of the flow correspond, respectively, to the x, y, and z axes, as shown in Figure 1.
The height of the channel is 2 h , and the length of the domain in the streamwise and spanwise directions can be reduced to a finite size by imposing periodicity of the velocity and temperature fields in these directions, exploiting the statistical homogeneity of the flow in both x and z. According to the linear stability analysis in [20], to accurately capture the formation of rolls at moderate Reynolds numbers ( Re b 10 4 , or equivalently Re τ 298 ), a spanwise domain size of 5.8 h proves sufficient. Therefore, the streamwise and spanwise periodicities are set to 2 π h , satisfying this requirement. At the walls, the no-slip condition is imposed for the fluid velocity, while the temperature is set equal to the temperature of the boundaries.
The equations governing the fluid motion are the incompressible Navier–Stokes equations, coupled with an advection-diffusion equation for the temperature through the Boussinesq approximation. In dimensionless form, they are expressed as follows:
u j x j = 0 ,
u i t + ( u i u j ) x j = p x i + 1 Re τ 2 u i x j 2 + Ri τ ϑ δ i 2 + δ i 1 ,
ϑ t + ϑ u j x j = 1 Re τ Pr 2 ϑ x j 2 ,
here, u i t , x denotes the i-th component of the fluid velocity, p t , x is the fluctuating component of the pressure ( p = p p ), and ϑ t , x stands for the temperature field. The non-dimensional groups that govern the flow are the friction Reynolds number Re τ , the Prandtl number Pr , and the friction Richardson number Ri τ , which are, respectively, defined as Re τ = u τ h / ν , Pr = ν / κ , and Ri τ = h α g Δ T ref / u τ 2 . These are obtained by scaling the dimensional equations with respect to the reference quantities: mean fluid density ρ f , channel half-height h, friction velocity u τ = | p / x | h / ρ f , and the half-temperature difference between the walls Δ T ref = ( T 1 T 2 ) / 2 . The non-dimensional groups also contain the kinematic viscosity ν , thermal diffusivity κ , thermal expansion coefficient α of the fluid, and the gravitational acceleration g.
The fluid flow transports a dispersed phase consisting of N p identical, rigid, and heavy spheres with radii smaller than any characteristic length scale of the flow. Due to their small size relative to the dynamically relevant flow scales, a point-particle representation can be employed [36]. The evolution of these particles is tracked in a Lagrangian framework by solving for each particle using the Maxey-Riley Equation [37], wherein only the Stokes drag force contribution is retained. The other force contributions— the pressure gradient, added-mass, and Basset–Boussinesq history forces—are disregarded under the assumption of large particle-to-fluid density ratios [38]. Buoyancy effects on particles are also neglected to avoid gravitational settling, following the common approach adopted in the relevant literature on particle-laden channel flows [34,35,38,39,40,41]. Based on these assumptions, the governing equations for the motion of the j-th particle, made dimensionless by the same reference scales used for the fluid equations, are:
d x j d t = v j ( t ) ,
d v j d t = u ( t , x j ( t ) ) v j ( t ) τ p Φ Re j ,
where x j ( t ) and v j ( t ) are the position and velocity of the particle, respectively, while u ( t , x j ( t ) ) is the fluid velocity evaluated at the particle location. As suggested in [42], the Stokes drag force in Equation (5) has been corrected with the empirical factor:
Φ Re j = 1 + 0.15 Re j 0.687 ,
which accounts for the effects of finite particle Reynolds numbers, defined as
Re j = 2 r u t , x j ( t ) v j ( t ) Re τ ,
with r non-dimensional particle radius.
In Equation (5), the quantity τ p represents the particle response time and is commonly interpreted as the time it would take for the particle to adjust its velocity to the velocity of the surrounding fluid. In non-dimensional form, this characteristic time is expressed as follows:
τ p = 2 9 ρ p r 2 Re τ ,
where ρ p is the mass density of the particle rescaled by the fluid density. The ratio between the particle response time and a characteristic timescale of the flow gives the Stokes number, St , which governs particle dynamics. Based on the choice of the reference flow scale, various definitions of the Stokes number are possible. In the context of wall-bounded flows, the most significant temporal scale is the wall viscous timescale, which is defined as τ ˜ η = ν / u τ 2 and has non-dimensional expression τ η = 1 / Re τ . Using this characteristic time to rescale τ p , the resulting Stokes number would be:
St + = τ p τ η = 2 9 ρ p r 2 Re τ 2 ,
where the superscript “+” reminds one that St is obtained with wall variables.
Neglecting gravity in particle dynamics is a simplification that allows the present study to focus on the fundamental interaction between wall turbulence and inertial particles, without the complication of particle deposition on the bottom wall. Indeed, it can be easily shown that by introducing buoyancy in Equation (5), the ratio between the settling velocity and the friction velocity is proportional to ( 1 1 / ρ p ) St + / ( Fr τ 2 Re τ ) , where Fr τ = u τ / g h is the friction Froude number. Therefore, since St + < Re τ in our simulations, particle gravitational settling becomes negligible for Froude numbers larger than one. This condition can be achieved by extending the limits of validity of the Boussinesq approximation to consider finite relative variations of the fluid density α Δ T ref , since Fr τ 2 = α Δ T ref / Ri τ . This approach also circumvents the necessity of considering the effect of an additional independent parameter, the friction Froude number Fr τ , which lies beyond the scope of the present investigation.
In this study, we examined the so-called one-way coupling regime, as defined in [36], wherein the influence of particles on the fluid phase and inter-particle collisions are neglected. The particle feedback on the fluid phase is disregarded, as the primary objective of this investigation is to explore the influence of large-scale coherent structures on particle dynamics, without considering the modulation of fluid variables due to the presence of particles. Moreover, this modulation is expected to be minimal and does not qualitatively modify the flow field, as demonstrated in other works at similar volume fractions [17,43]. Furthermore, within the limit of validity of the one-way coupling regime, the effects of particle collisions are negligible [44] and can be safely disregarded. Since the particle volume fraction does not influence particle statistics in the one-way coupling regime, we considered a large number of particles, leading to a volume fraction of φ = 2.5 × 10 4 , which exceeds the formal limit of validity of the one-way coupling regime. This approach serves as a practical means to increase the statistical ensemble for computing particle statistics, without the need to rerun the simulations over a much longer time, and it is not intended to represent the behavior of concentrated suspensions.
Wall-particle collisions are treated as perfectly elastic, conserving the kinetic energy of the particles. Particles leaving the computational domain through the periodic boundaries in the streamwise (x) and spanwise (z) directions are re-injected into the domain from the opposite periodic boundaries. The equations are solved numerically using the numerical schemes of Zaza and Iovieno [31]. Further details can be found in [45].

2.2. Invariants of the Velocity Gradient Tensor

The small-scale features of turbulence can be investigated by analyzing the statistical behavior of the gradient of the fluid velocity, the tensor A i j = u i / x j . The invariants of the gradient of the fluid velocity, customarily called P, Q, and R, are the coefficients of its cubic characteristic equation,
λ α 3 + P λ α 2 + Q λ α + R = 0 ,
where λ α (with α = 1 , 2 , 3 ) are the eigenvalues of A i j . These invariants can be expressed as functions of the symmetric and skew-symmetric components of the gradient tensor, which correspond, respectively, to the rate of strain tensor S i j = ( A i j + A j i ) / 2 , and the rate of rotation tensor Ω i j = ( A i j A j i ) / 2 . As shown by Chong et al. [33], the invariants of A i j have the following general expressions:
P = S i i = tr A ,
Q = 1 2 P 2 S i j S j i Ω i j Ω j i = 1 2 tr A 2 tr A 2 ,
R = 1 3 P 3 + 3 P Q S i j S j k S k i 3 Ω i j Ω j k S k i = det A .
Alternatively, the invariants can also be expressed as functions of the eigenvalues of A i j as follows:
P = λ 1 + λ 2 + λ 3
Q = λ 1 λ 2 + λ 2 λ 3 + λ 3 λ 1
R = λ 1 λ 2 λ 3
Assuming flow incompressibility ( P = A i i = 0 ) and using the definition of the vorticity vector ω k = ε i j k A j i = ε i j k Ω j i , the expressions (11)–(13) reduce to the following:
P = 0
Q = 1 2 S i j S i j 1 2 ω i 2
R = 1 3 S i j S j k S k i + 3 4 ω i ω j S j i .
From a physical standpoint, the definition (18) of the second invariant reveals that large positive values of Q correspond to flow regions dominated by enstrophy over strain, whereas large negative values signify the prevalence of strain over enstrophy. The interpretation of the third invariant R, defined by Equation (19), is not as straightforward as that of the second invariant Q, as it depends on the sign of Q. As highlighted by Bijlard et al. [35] and Lozano-Durán et al. [46], when Q > 0 , the second term in R, given by 1 / 4 ω i ω j S j i , dominates over the first term, and its contribution is related to the generation of enstrophy due to vortex stretching or compression. Conversely, when Q < 0 , the first addend in R, given by 1 / 3 S i j S j k S k i , becomes the dominant term, and it is associated with the self-amplification of straining motions, which has interestingly been recognized by Carbone and Bragg [47] as the main mechanism driving the turbulent energy cascade.
Under incompressible flow conditions ( P = 0 ), the discriminant of the characteristic polynomial of A i j is given by D = 4 Q 3 27 R 2 . The sign of the discriminant determines the nature of the eigenvalues λ α . A positive discriminant ( D > 0 ) implies one real eigenvalue and two complex-conjugate eigenvalues, while a negative discriminant ( D < 0 ) results in three distinct real eigenvalues. When the discriminant is zero ( D = 0 ), the eigenvalues are real, with two of them being equal.
Depending on the nature and the sign of the eigenvalues of A i j , various topologically distinct flow patterns are possible [33]. Complex-conjugate eigenvalues λ 1 , 2 = ζ ± i ω are associated with spiraling trajectories, topologies known as foci. The foci are either stable or unstable, which is determined by the sign of the real part ζ . Specifically, unstable foci arise when ζ > 0 , while stable foci correspond to ζ < 0 . Moreover, the divergence-free constraint, expressed as
P = λ 1 + λ 2 + λ 3 = 0 ,
implies that the third real eigenvalue of the foci is related to ζ as λ 3 = ζ . Consequently, unstable foci are accompanied by compressing motion ( λ 3 < 0 ), whereas stable foci are characterized by stretching motion ( λ 3 > 0 ). When all three eigenvalues are real and distinct, the local topology is classified as node/saddle/saddle [33]. These topologies are considered unstable if two eigenvalues are positive, and stable if two eigenvalues are negative.
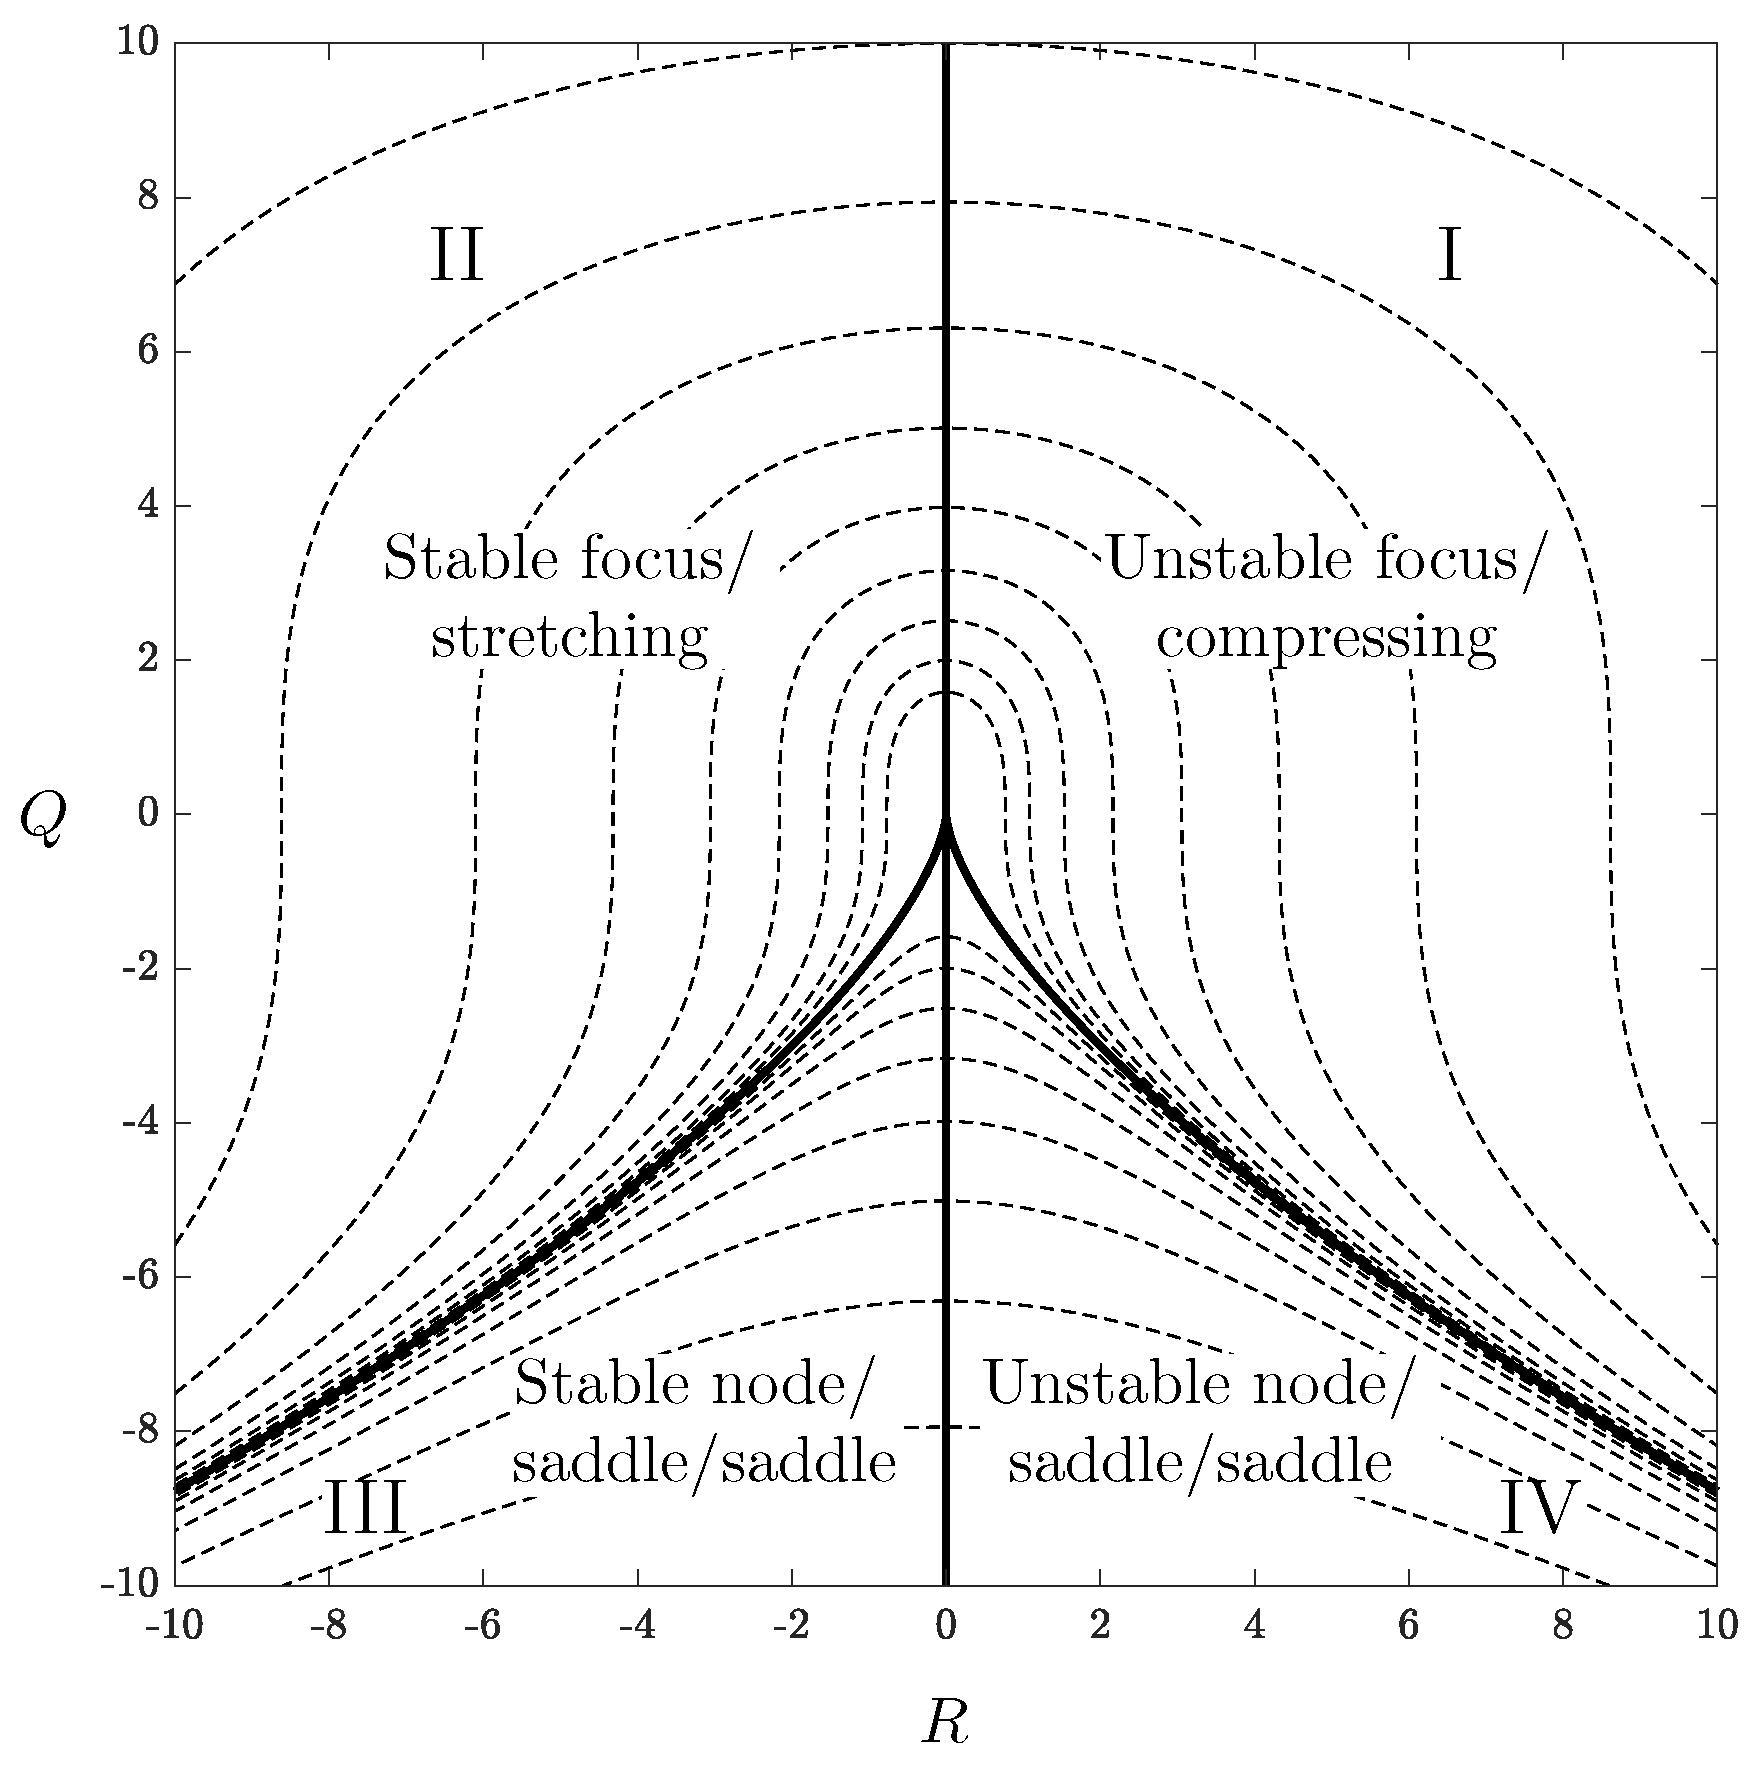
These four topological patterns—unstable focus/compressing, stable focus/stretching, stable node/saddle/saddle, and unstable node/saddle/saddle—are typically represented in the ( R , Q ) phase-plane, as illustrated in Figure 2. These patterns correspond to the four regions delimited by the vertical axis R = 0 and the discriminant curve D = 0 .
In the context of particle-laden flows, the joint probability density functions (joint-PDFs) of the invariants of the velocity gradient tensor (VGT) sampled at particle locations are widely employed to explore the phenomenon of preferential concentration, i.e., the tendency of inertial particles to preferentially populate flow regions with specific topologies [27,34,35]. The present investigation adopts the same approach based on the joint-PDFs of Q and R to examine both the topological changes in the channel flow induced by buoyancy forces and the consequent response of particle preferential concentration.

3. Results and Discussion

The dataset utilized in this study is derived from the point-particle direct numerical simulations (PP-DNS) performed by Zaza and Iovieno [31] at a friction Reynolds number Re τ = 180 , Prandtl number Pr = 0.71 , and two friction Richardson numbers, Ri τ = 0.272 and Ri τ = 27.2 . With reference to the stability analysis by Cossu [20], these values are representative of the regimes below and above the critical limit of Ri τ 0.86 , at which spanwise instabilities initiate the formation of streamwise vortex rolls. Each simulation involved 22,000,000 identical particles, with radii of 6 × 10 4 . The resulting particle volume fraction was φ = 2.5 × 10 4 . Three particle Stokes numbers were investigated: St + = 0.6 , St + = 60 , and St + = 120 , which were achieved by adjusting the non-dimensional density of the particles. The parameters employed in these simulations are summarized in Table 1, which additionally provides the Reynolds and Richardson numbers based on the bulk velocity, u b , to facilitate comparisons with previous works. The bulk Reynolds number is conventionally defined as Re b = 2 h u b / ν , while the bulk Richardson number is defined as Ri b = 2 h α g Δ T ref / u b 2 .
Statistical stationarity of particle variables and fluid fields was ensured by computing 27 non-dimensional temporal scales in each simulation. The initial conditions for the non-dimensional temperature field and velocity field were set to a uniform zero temperature throughout the channel and a pre-computed velocity field at Re τ = 180 , respectively. Particles were initially seeded randomly throughout the computational domain, with their initial velocities matching the local fluid velocity. The computational domain was discretized using 201 Chebyshev polynomials in the wall-normal direction and 192 Fourier modes in the streamwise and spanwise directions. This discretization resulted in a uniform grid spacing of Δ x + = Δ z + 5.9 for the streamwise and spanwise directions, while the wall-normal grid spacing varied from Δ y + 0.02 at the wall to Δ y + 2.9 at the channel centerline. For the present investigation, post-processing analyses on the dataset were performed on the final 12 temporal scales.
The following sections present and discuss the results on the reorganization of the flow into large-scale longitudinal vortical structures due to increasing buoyancy effects. The modifications in the local flow topology, described by the invariants of the velocity gradient tensor, are also highlighted. Furthermore, the investigation examines the response of particles to the flow large-scale reorganization, focusing on their spatial distribution and the statistical correlations between particle concentration and the local flow topology.

3.1. Flow Organization

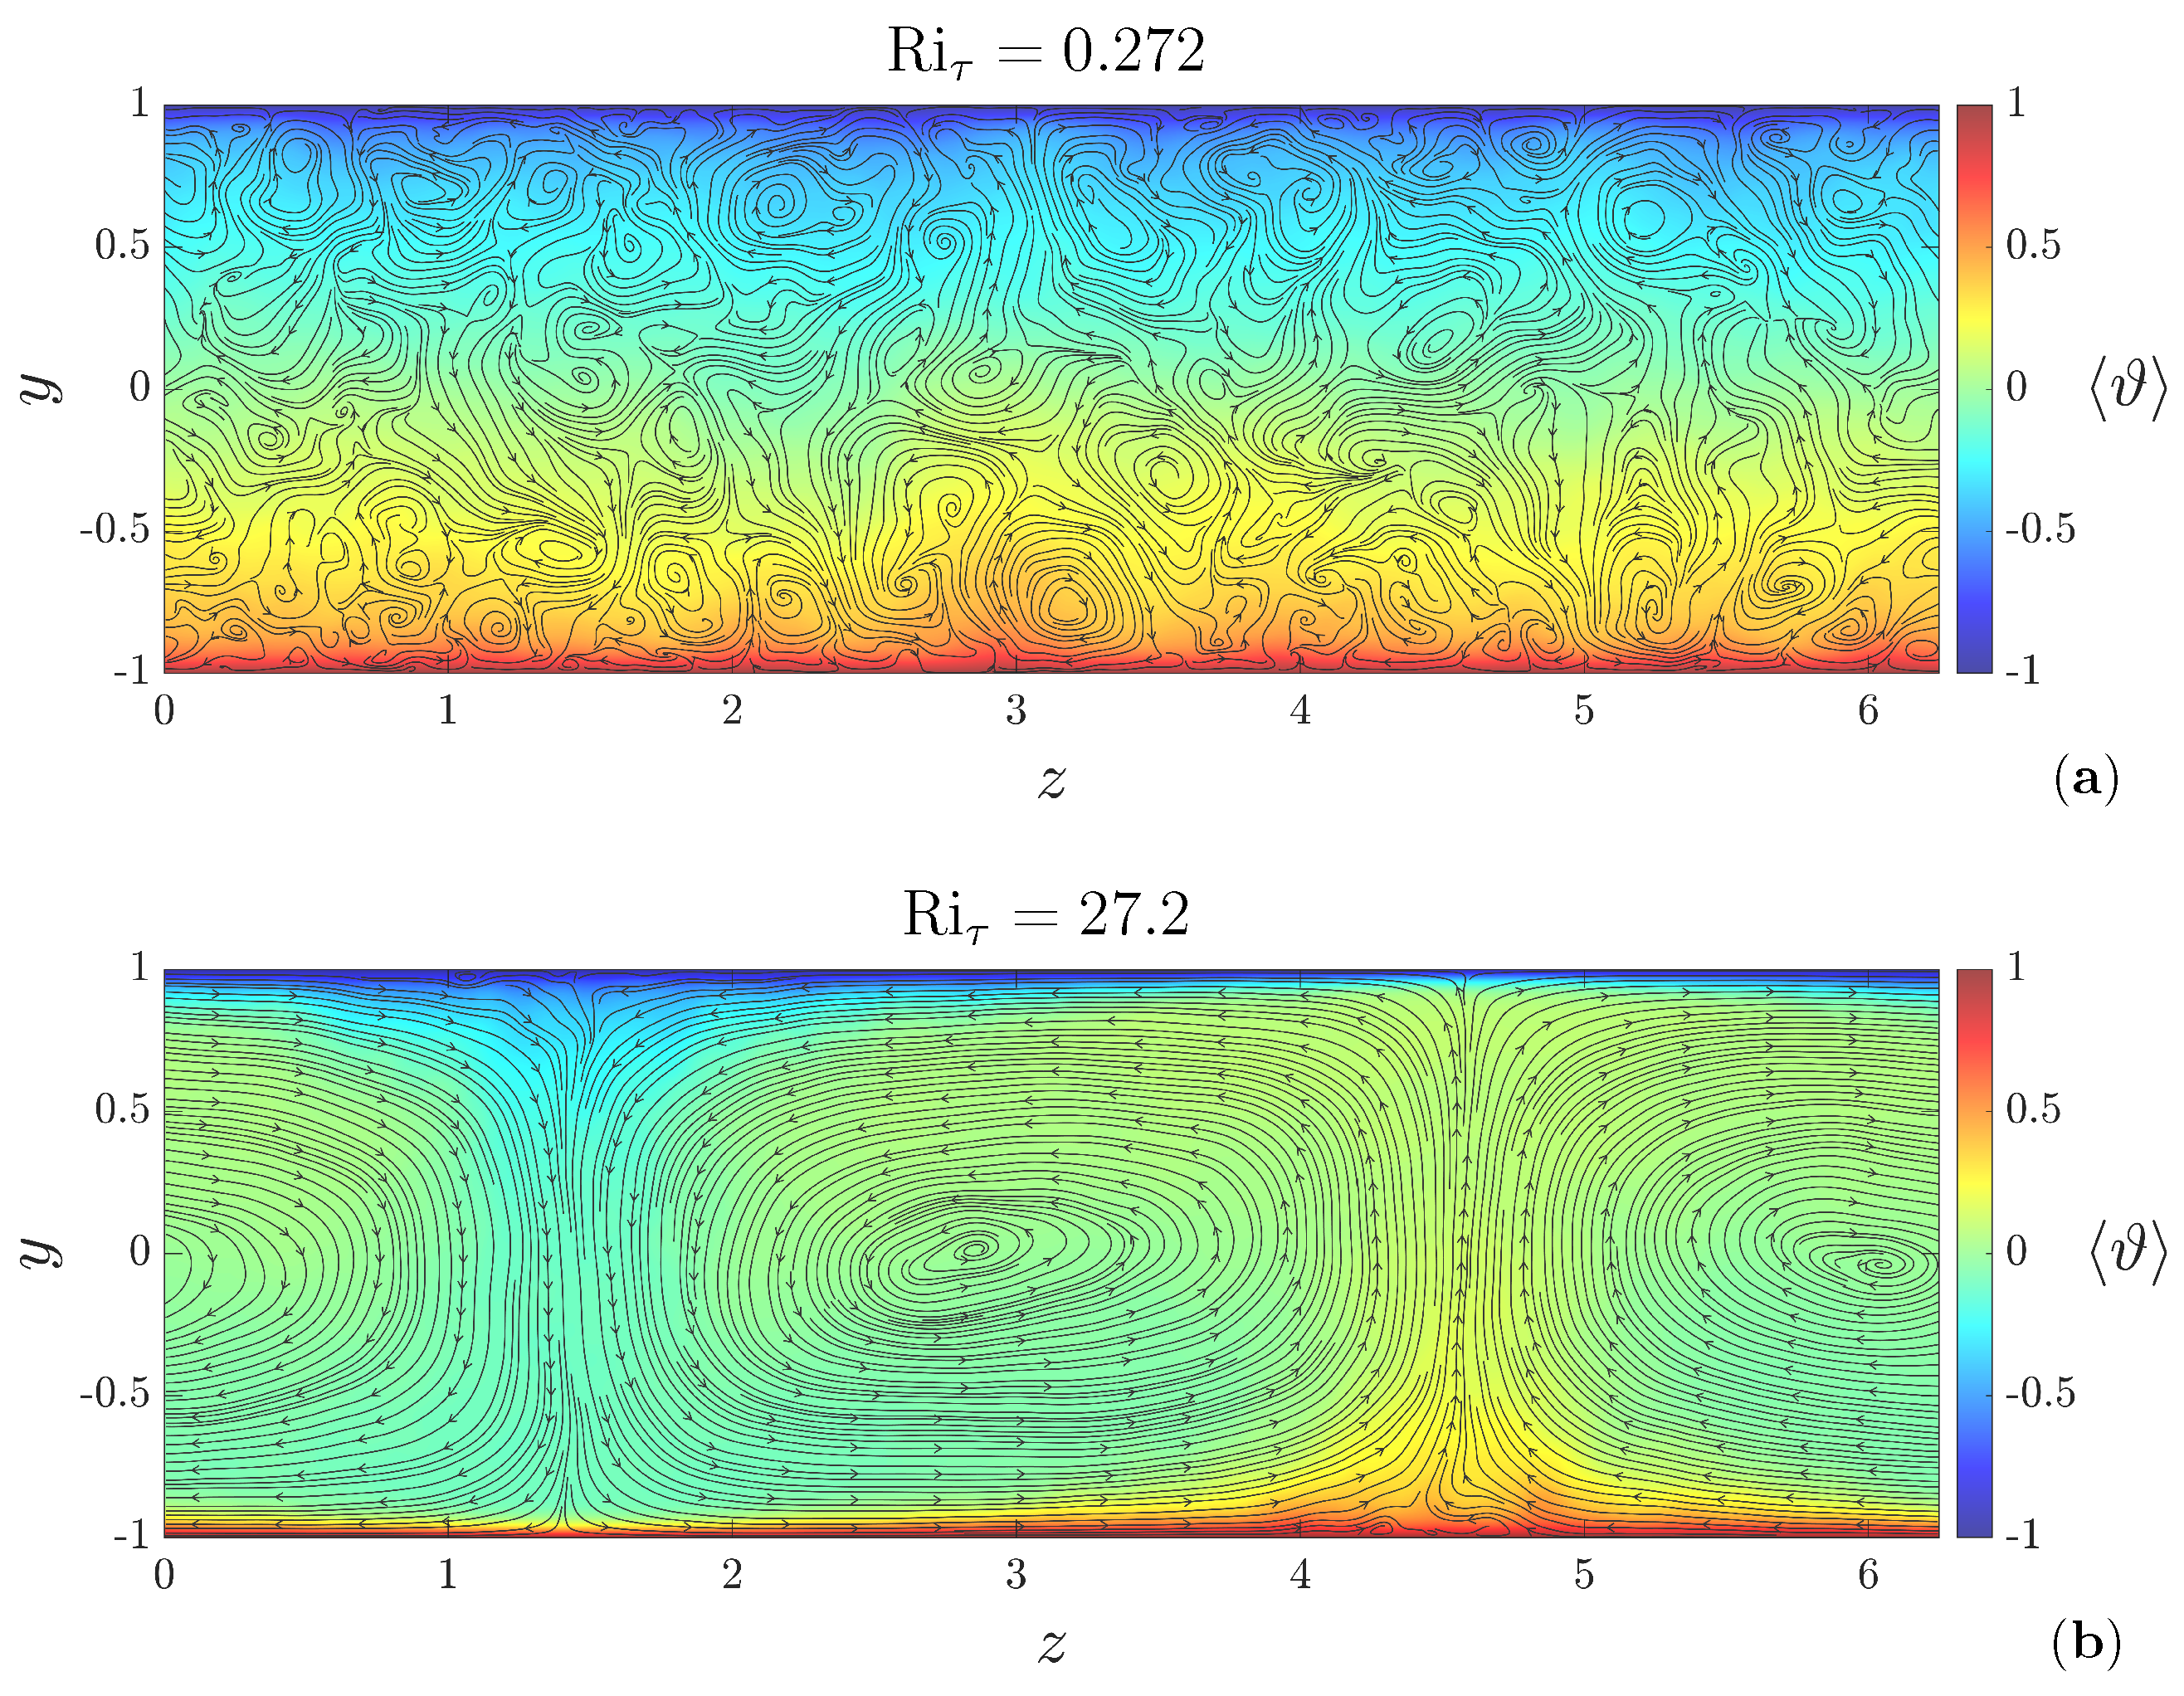
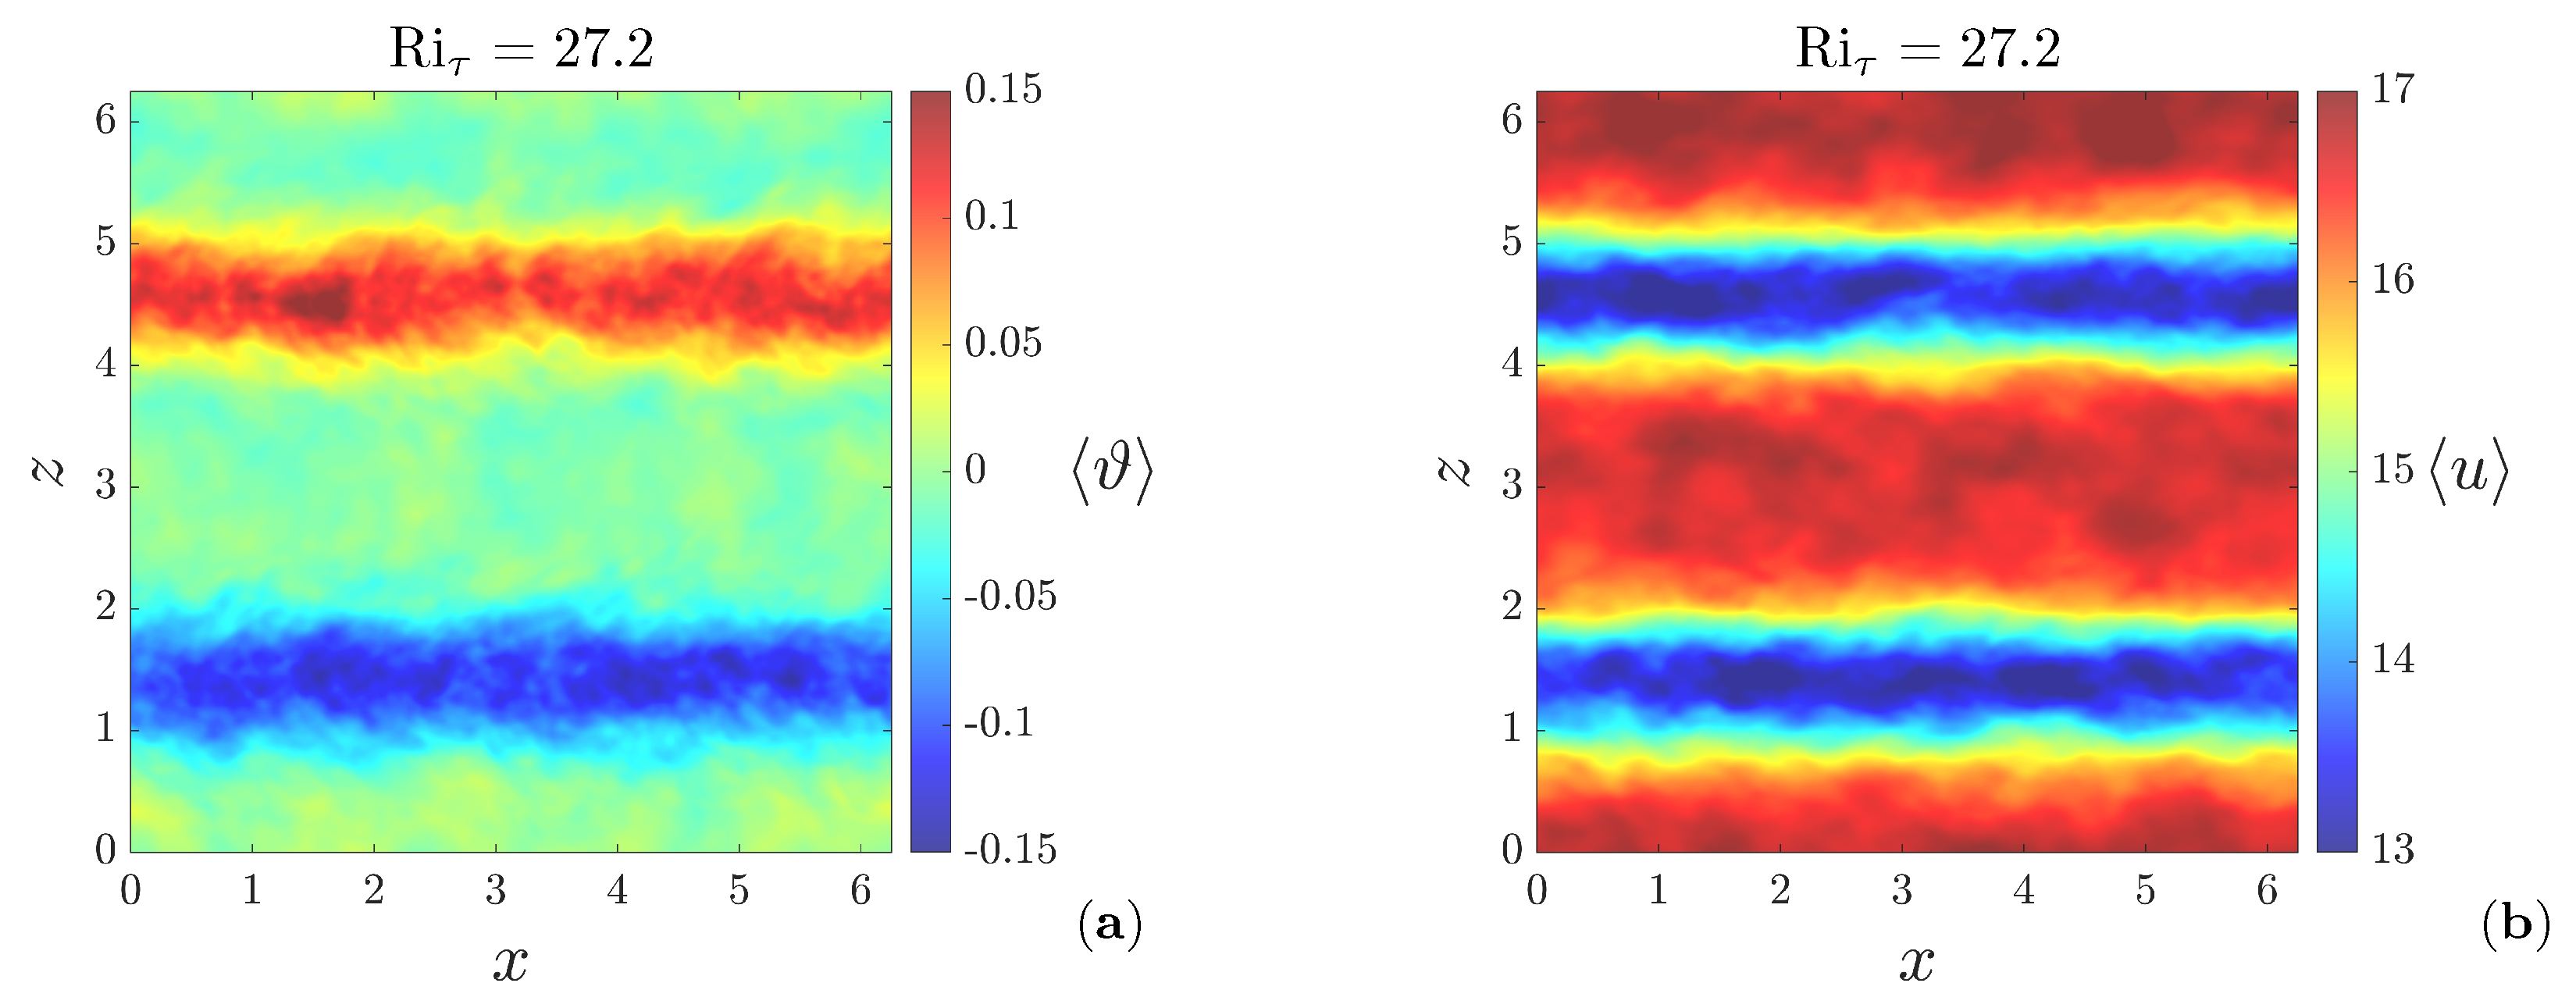
To investigate the combined effects of shear and buoyancy on the mean flow structure, we examined the time-averaged fluid fields in the cross-stream and wall-parallel middle planes of the channel. Figure 3 presents the time-averaged fluid temperature ϑ ( x ) evaluated in the cross-stream plane ( z , y ) at x = π for the two Richardson numbers considered. The streamlines of the mean velocity components ( w , v ) in the same plane are also shown. As the Richardson number increases from Ri τ = 0.272 to Ri τ = 27.2 , the flow reorganizes into two large counter-rotating vortical structures bounded by coherent regions of upwelling hot fluid and downwelling cold fluid (Figure 3b). Consistent with the findings in [12,16], these vortices extend across the entire channel height and width, with their axes aligned in the streamwise direction, as evident from Figure 4a,b, which illustrate the time-averaged temperature and streamwise velocity, respectively, in the central wall-parallel plane for Ri τ = 27.2 . Notably, the mean streamwise velocity u exhibits a significant reduction in the regions characterized by the most intense vertical motions, which correspond to the boundaries of the rolls. The development of these slower bands can be ascribed to the continuous lifting of hot/cold low-speed fluid from the walls driven by buoyancy forces within the coherent thermal plumes observed in Figure 3b.
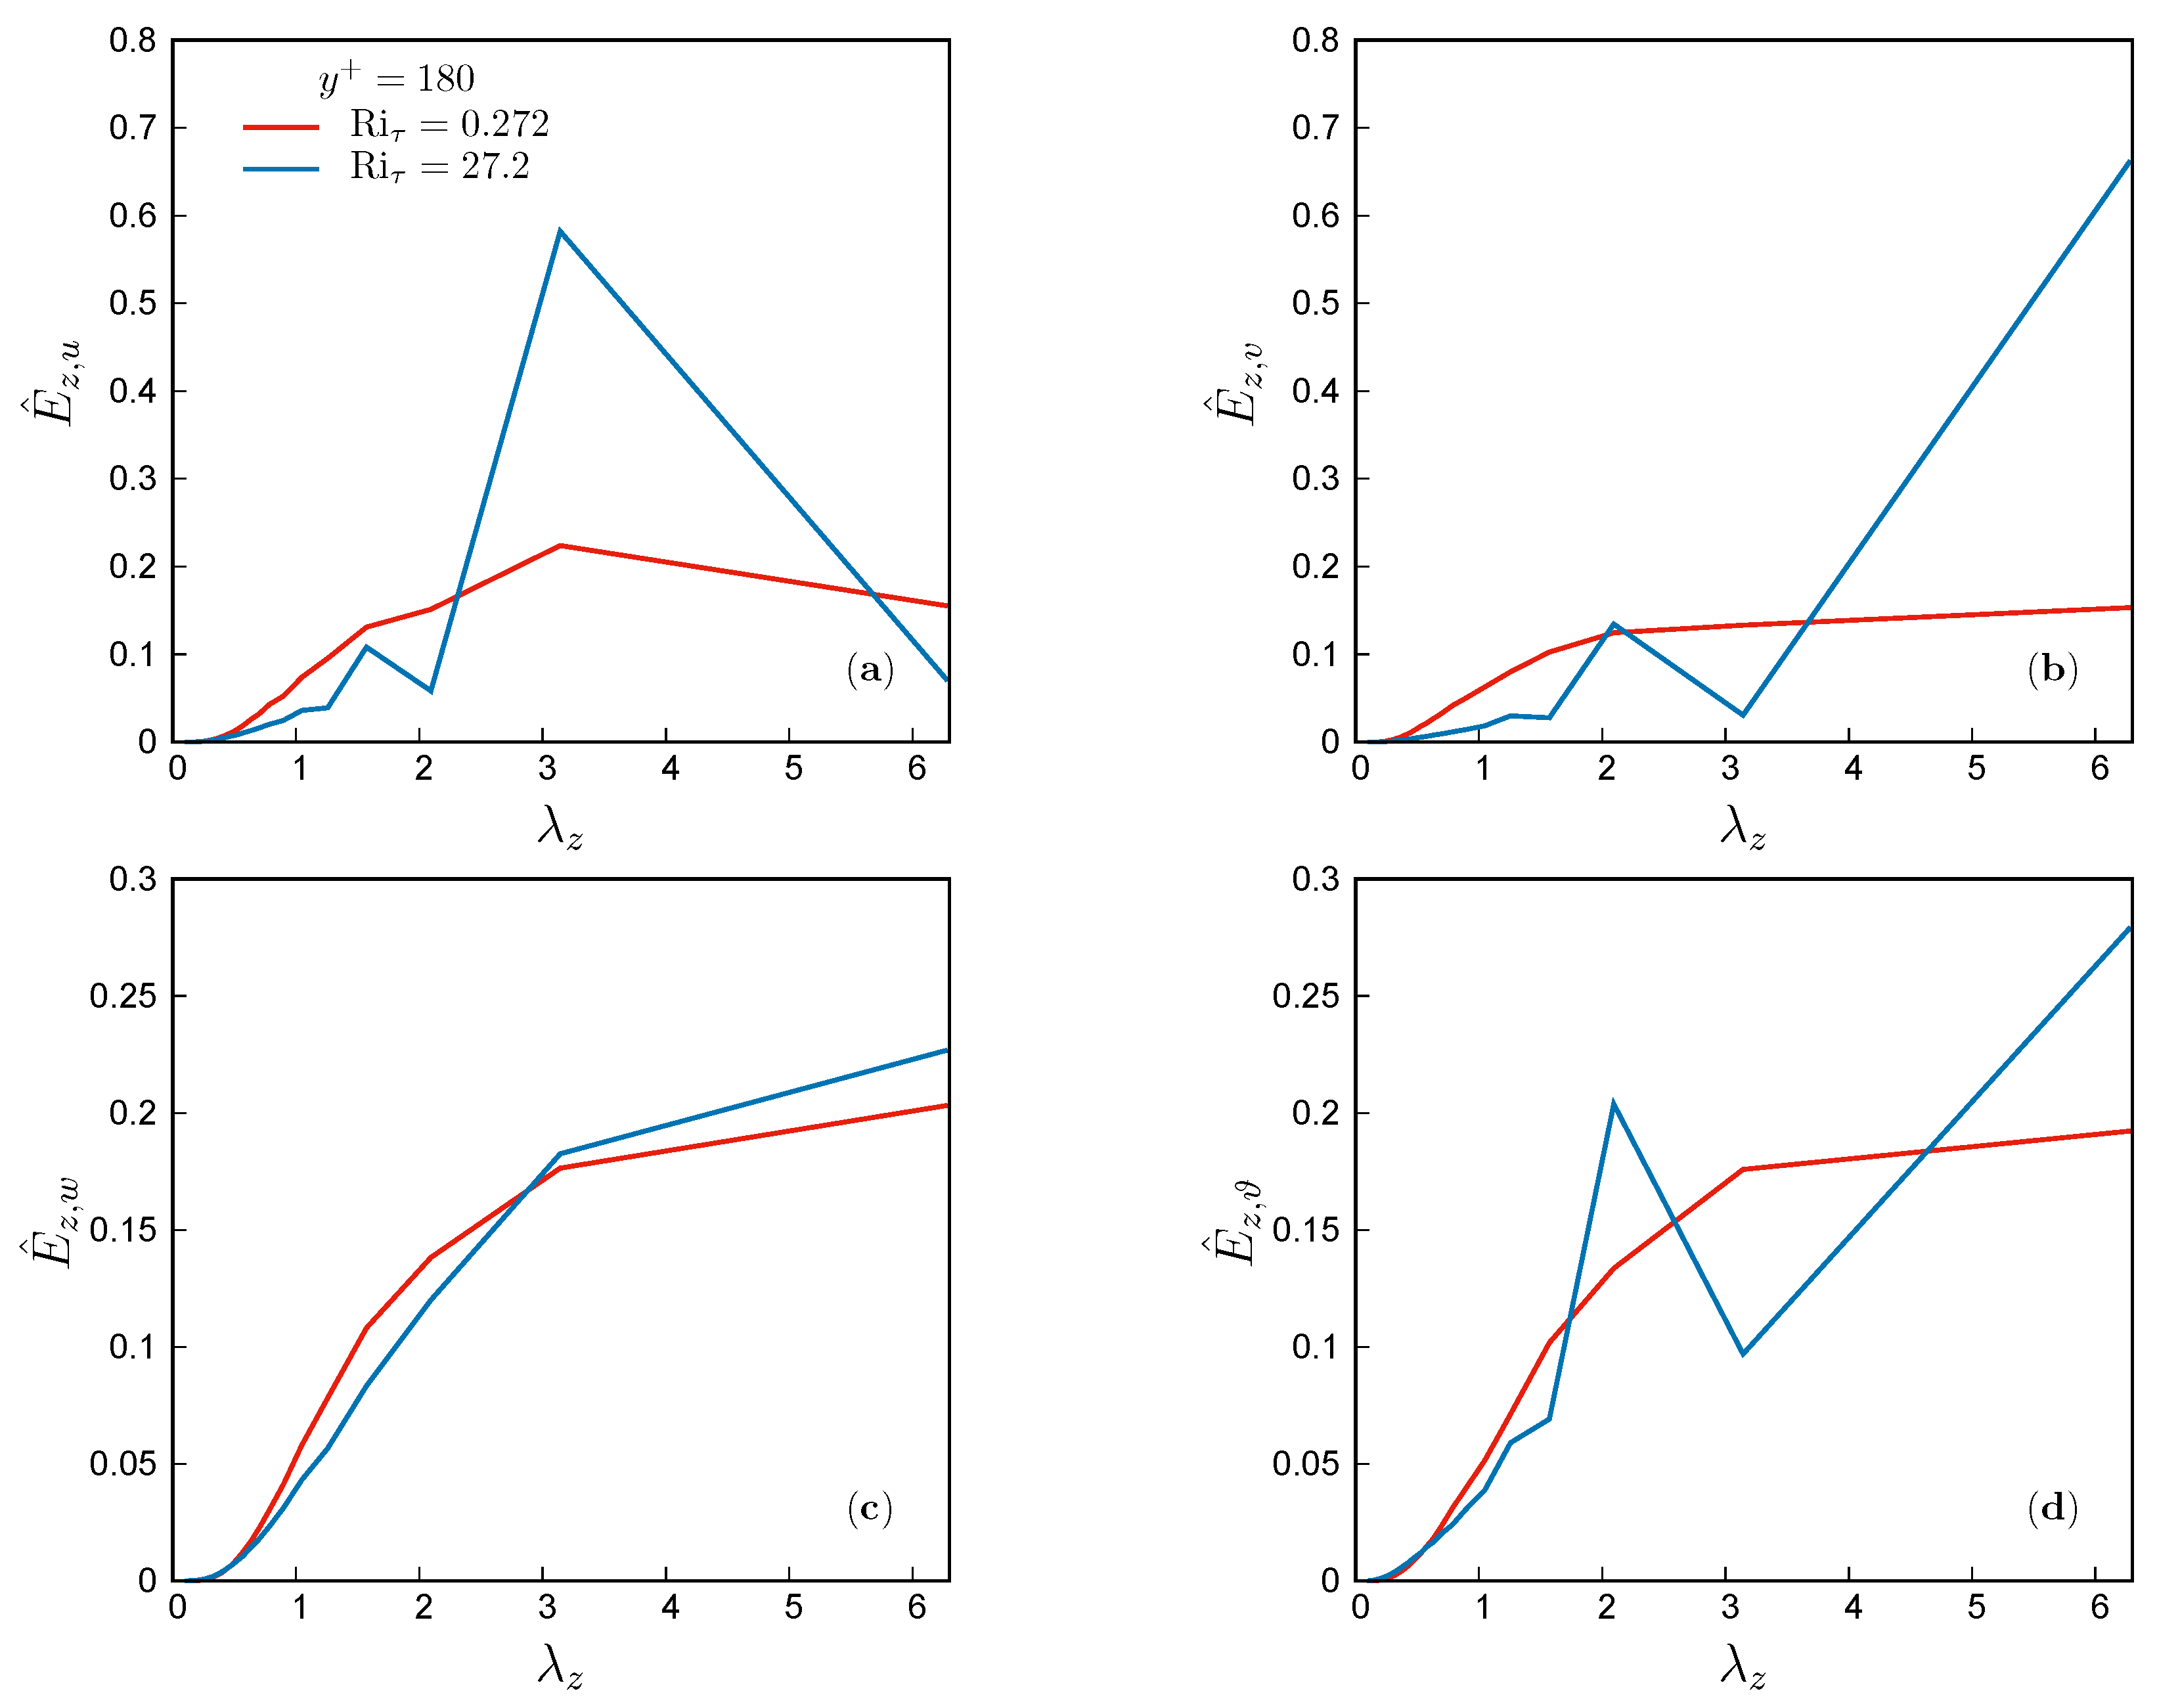
To explore the redistribution of energy across spanwise scales induced by the flow reorganization, the spanwise spectral densities of the fluid variables were computed at the channel centerline ( y + = 180 ), which is the region most affected by the vortex rolls, and within the buffer layer ( y + 20 ), the region of most intense turbulent production. Figure 5 indicates that, at the channel centerline, the presence of the rolls spanning the entire channel width ( Ri τ = 27.2 case) coincides with the observation that the most energetic spanwise scale for the variables v, w, and ϑ has wavelength of λ z = L z / h = 2 π . Notably, a secondary, less energetic peak is observed for v and ϑ at λ z = L z / ( 3 h ) = 2 π / 3 , which may suggest the potential existence of a set of three smaller structures within each longitudinal vortex roll, or it could be due to the effect of the secondary harmonics of the roll. As noted in Pirozzoli et al. [16], the spectral density of the streamwise velocity component u (Figure 5a) exhibits its peak at a wavelength λ z = L z / ( 2 h ) = π , half of that observed for v and ϑ . This phenomenon is attributed to the fact that both the upward motion of hot fluid and the downward motion of cold fluid cause a reduction in the streamwise velocity. Consequently, the spanwise Fourier mode of u associated with the rolls has a wavelength equal to the width of a single vortex, i.e., twice as small as the wavelength of the temperature and vertical velocity.
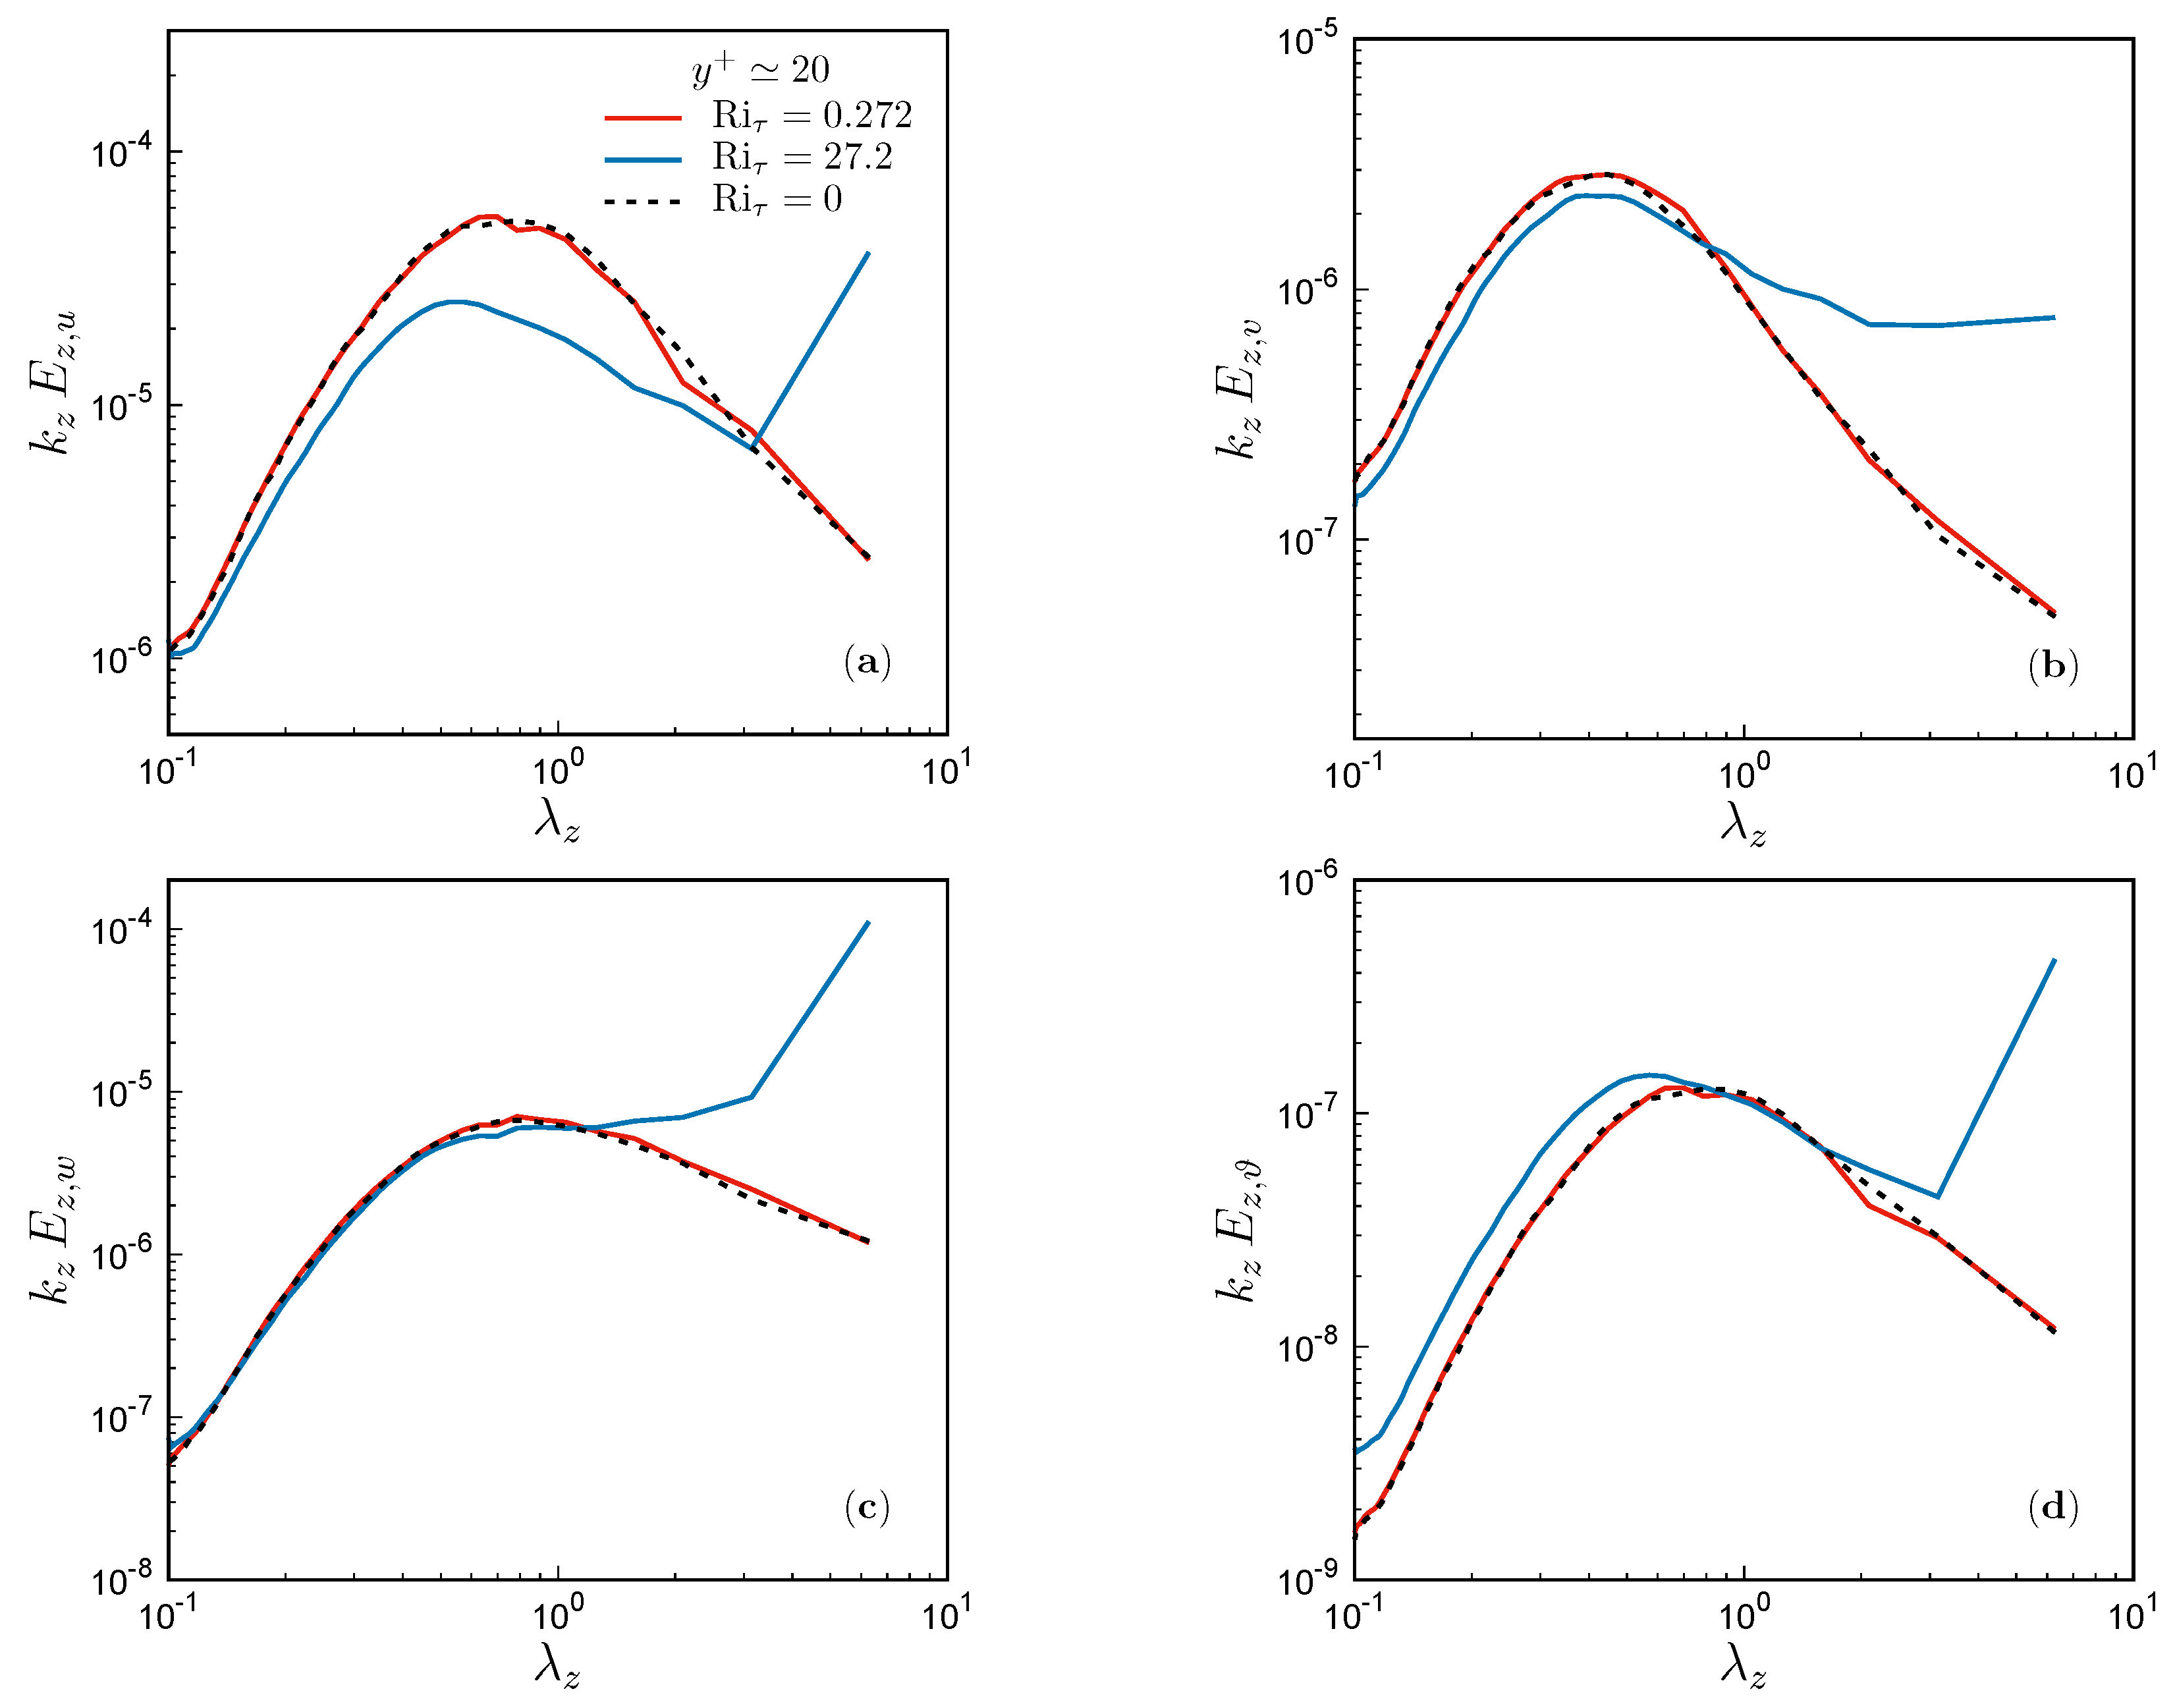
The pre-multiplied spanwise spectral densities of fluid variables at the wall-normal location y + 20 are presented in Figure 6. For comparison, the spectra for the pure forced convection case at the same Re τ , obtained from the results of Zaza and Iovieno [17], are also shown. At Ri τ = 0.272 , the spectra exhibit close alignment with those of the pure forced convection case. The spectral maxima of u and ϑ are observed at λ z 0.7 , corresponding to λ z + = λ z Re τ 126 in wall units, while the maximum for v occurs at λ z 0.42 (i.e., λ z + 75.6 ). These maxima are associated with the well-known low-speed streaks in the buffer layer, which are characterized by longitudinal regions of slow fluid motion lifted by the most energetic streamwise vortices [48]. The streaks have a typical spanwise spacing of approximately 100 wall units, and their separation increases with the distance from the wall [49].
As visible from Figure 6, the reorganization of the flow induced by buoyancy forces leads to a redistribution of energy toward larger scales. In the case with Ri τ = 27.2 , the spectral densities in the buffer layer exhibit a prominent peak at the wavelength λ z = 2 π , which is a distinct signature of large-scale motions that is not present in the cases where buoyancy influences are weak or absent. Notably, the large-scale spanwise motion itself, generated by impinging thermal plumes, plays a crucial role in the development of vortex rolls [13]. This cross-stream motion drives most of the structures formed by both shear and buoyancy effects toward confined regions, thereby conveying energy to larger scales. Spanwise motions could also account for the reduced spacing between low-speed streaks to λ z 0.57 (or λ z + 102.6 ), which is visible in Figure 6a.

3.2. Local Flow Topology

Further insights into the flow characteristics can be obtained by analyzing the invariants of the velocity gradient tensor (VGT), which are commonly used as descriptors of the local flow topology. In this analysis, the channel domain was divided into four quadrants in the cross-stream planes ( z , y ) by bisecting both the spanwise and wall-normal directions into two halves. With reference to Figure 3b, these quadrants correspond to the two regions where thermal plumes emerge from the walls, and the two regions where the plumes impinge upon the opposite walls. In the following, we will refer to the regions where the plumes originate as the subdomain at z > L z / 2 , and conversely, the regions where the plumes impinge as the subdomain with z L z / 2 , as if we were considering only the lower half of the channel ( y + 180 ). This distinction into regions characterized by fluid motion directed away from the walls and toward the walls is maintained for both Richardson numbers under investigation, despite the absence of coherent large-scale plumes for the case at Ri τ = 0.272 . We then evaluated the joint probability density functions (joint-PDFs) of Q and R, the second and third invariants of the VGT, conditionally sampled at computational grid points located at various wall-normal distances: in the viscous sublayer ( 0 < y + 5 ), the buffer layer ( 5 < y + 35 ), the logarithmic layer ( 35 < y + 60 ), and the outer region ( 60 < y + 180 ). It is noteworthy that, in this analysis, the boundaries for the logarithmic layer are not defined rigorously, as the choice of layer thicknesses is constrained by statistical considerations. Excessively thin layers would result in an insufficient number of grid points available for sampling the variables of interest, thereby compromising the statistical robustness of the analysis.
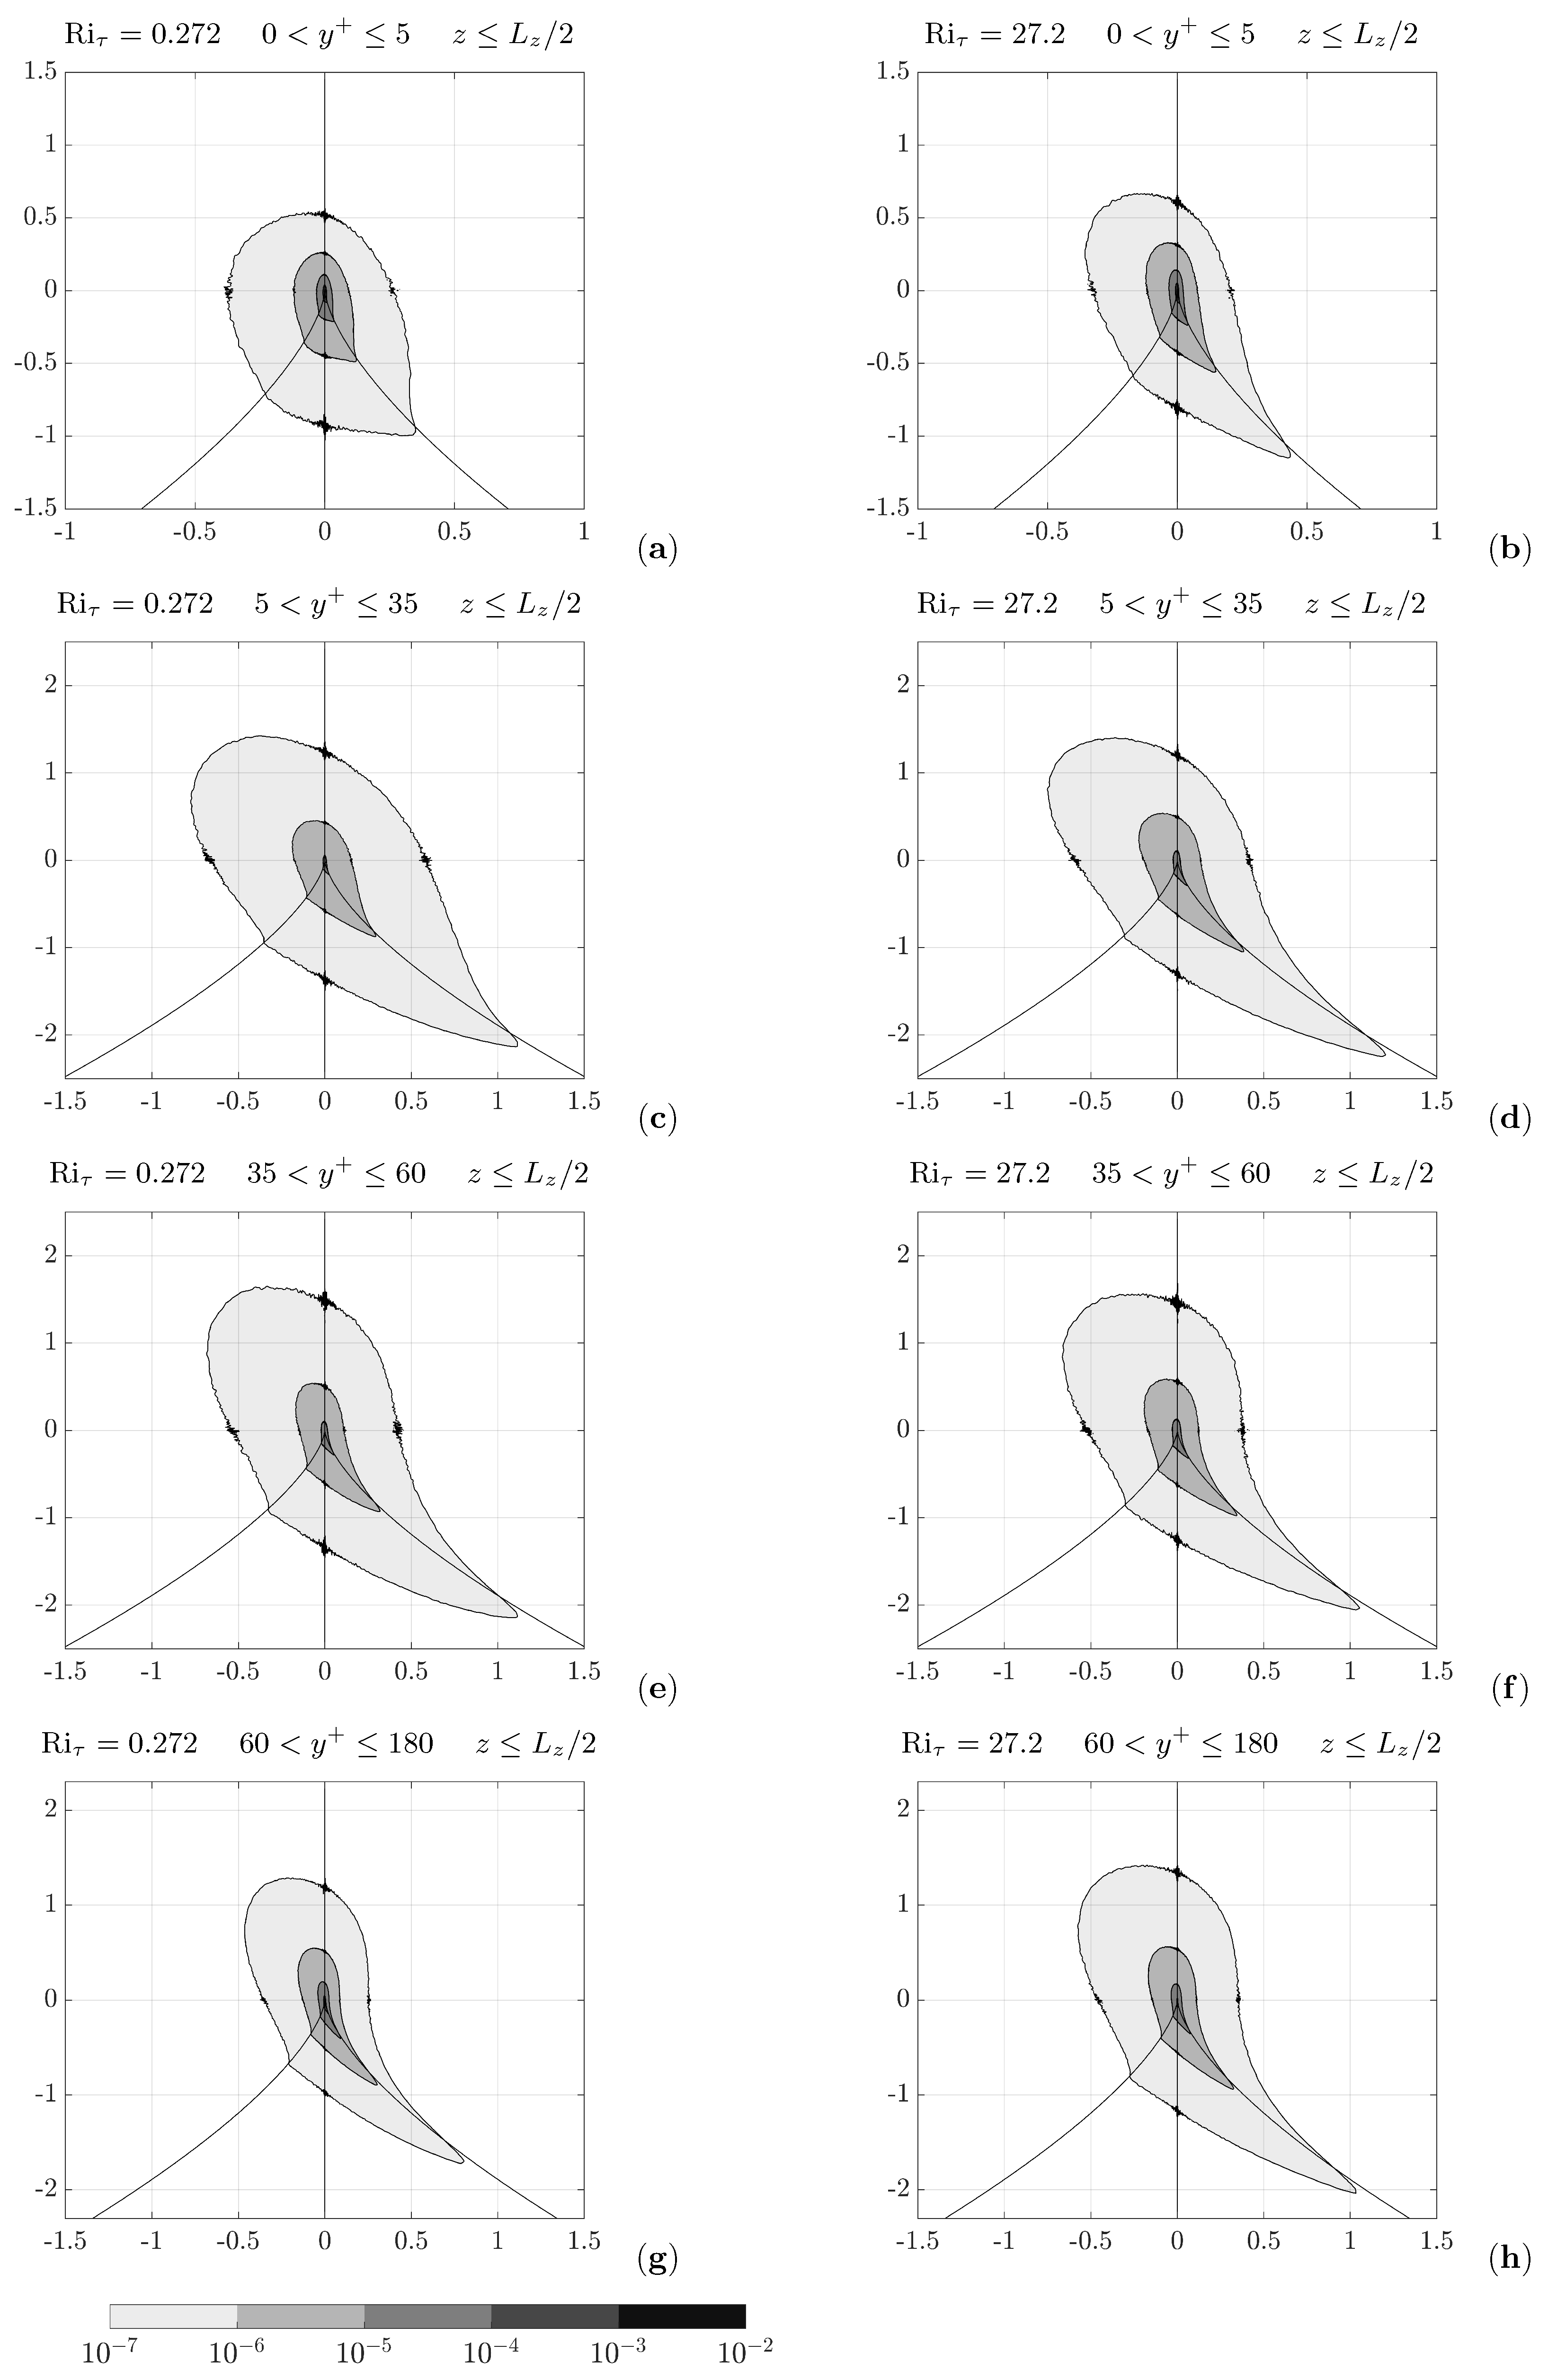
Figure 7 presents the joint-PDFs of Q and R computed in the subdomains where the coherent roll-related plumes originate, evaluated across the various wall-parallel layers. Results are shown for both Richardson numbers investigated, and the contours of the joint-PDFs are displayed for each decade in the range from 10 7 to 10 2 .
The results displayed in Figure 7 suggest that, aside from minor deviations, the local flow topologies of the two cases, Ri τ = 0.272 and Ri τ = 27.2 , exhibit significant similarities in the regions where the fluid moves away from the wall. However, in the viscous sublayer (Figure 7a,b), as the Richardson number increases, strain-dominated topologies appear to be more frequent, as higher values of the PDF populate the third and fourth quadrants of the R-Q plane, and a reduced preference for the stable focus/stretching topology (second quadrant) is observed. This results in a more symmetric distribution around the vertical R = 0 axis (Figure 7b).
Moving away from the wall, for both the Richardson numbers examined, the joint-PDFs exhibit the characteristic “teardrop” shape, as documented in [46] for the plane channel flow. This shape corresponds to an increased probability in the second quadrant and along the D = 0 line dividing the first and fourth quadrants. Such behavior appears to be a common feature of turbulence across numerous flow configurations [46] and is inherently related to the strain self-amplification mechanism. From the buffer layer to the outer region (from Figure 7c–h), minimal deviations are observed between the joint-PDFs of the two Richardson numbers considered, which consistently resemble those reported by Blackburn et al. [32] for isothermal plane channel flow. This result indicates that the topology of the subdomain characterized by the presence of the coherent emerging plume ( Ri τ = 27.2 ) is overall highly similar to that without the large-scale structure ( Ri τ = 0.272 ).
Figure 8 illustrates the joint-PDFs of Q and R, formally identical to the previously analyzed quantity, but now sampled within the subdomain where the coherent plume impinges upon the wall. For Ri τ = 0.272 , the topology in the region z L z / 2 presents analogous characteristics to the previously examined region z > L z / 2 . This consistency is observed across all wall-parallel layers when comparing Figure 7a,c,e,g with their counterparts in Figure 8. This outcome is expected, as there is no significant variation in the flow structure along the spanwise direction in the absence of the coherent rolls. Conversely, the joint-PDFs for Ri τ = 27.2 in the subdomain characterized by the impinging plume exhibit remarkable differences compared to both those at Ri τ = 0.272 and those evaluated in the sector where the plume originates. Notably, within the viscous sublayer (Figure 8b), the characteristic teardrop shape is already discernible. This implies that the topology is oriented primarily towards vortex stretching and strain self-amplification mechanisms, which are phenomena typically observed farther from the wall. The early manifestation of this configuration can be ascribed to vertical motions directed towards the wall, which presumably reduces the lifting of turbulent structures from the wall, or even drives them closer to the wall. Corroborating this explanation, the joint-PDF of the buffer layer (Figure 8d) exhibits a significant reduction in the first quadrant compared to the case with opposite vertical motion (Figure 7d), accompanied by an increasing preference for the second and fourth quadrants. Coherently, this topology is characteristic of regions farther from the wall, as evidenced by the resemblance to the joint-PDF of the logarithmic layer not affected by the plume (Figure 8e). Minimal deviations from the expected topology are observed in the layers farther from the wall (Figure 8e–h).

3.3. Particle Distribution

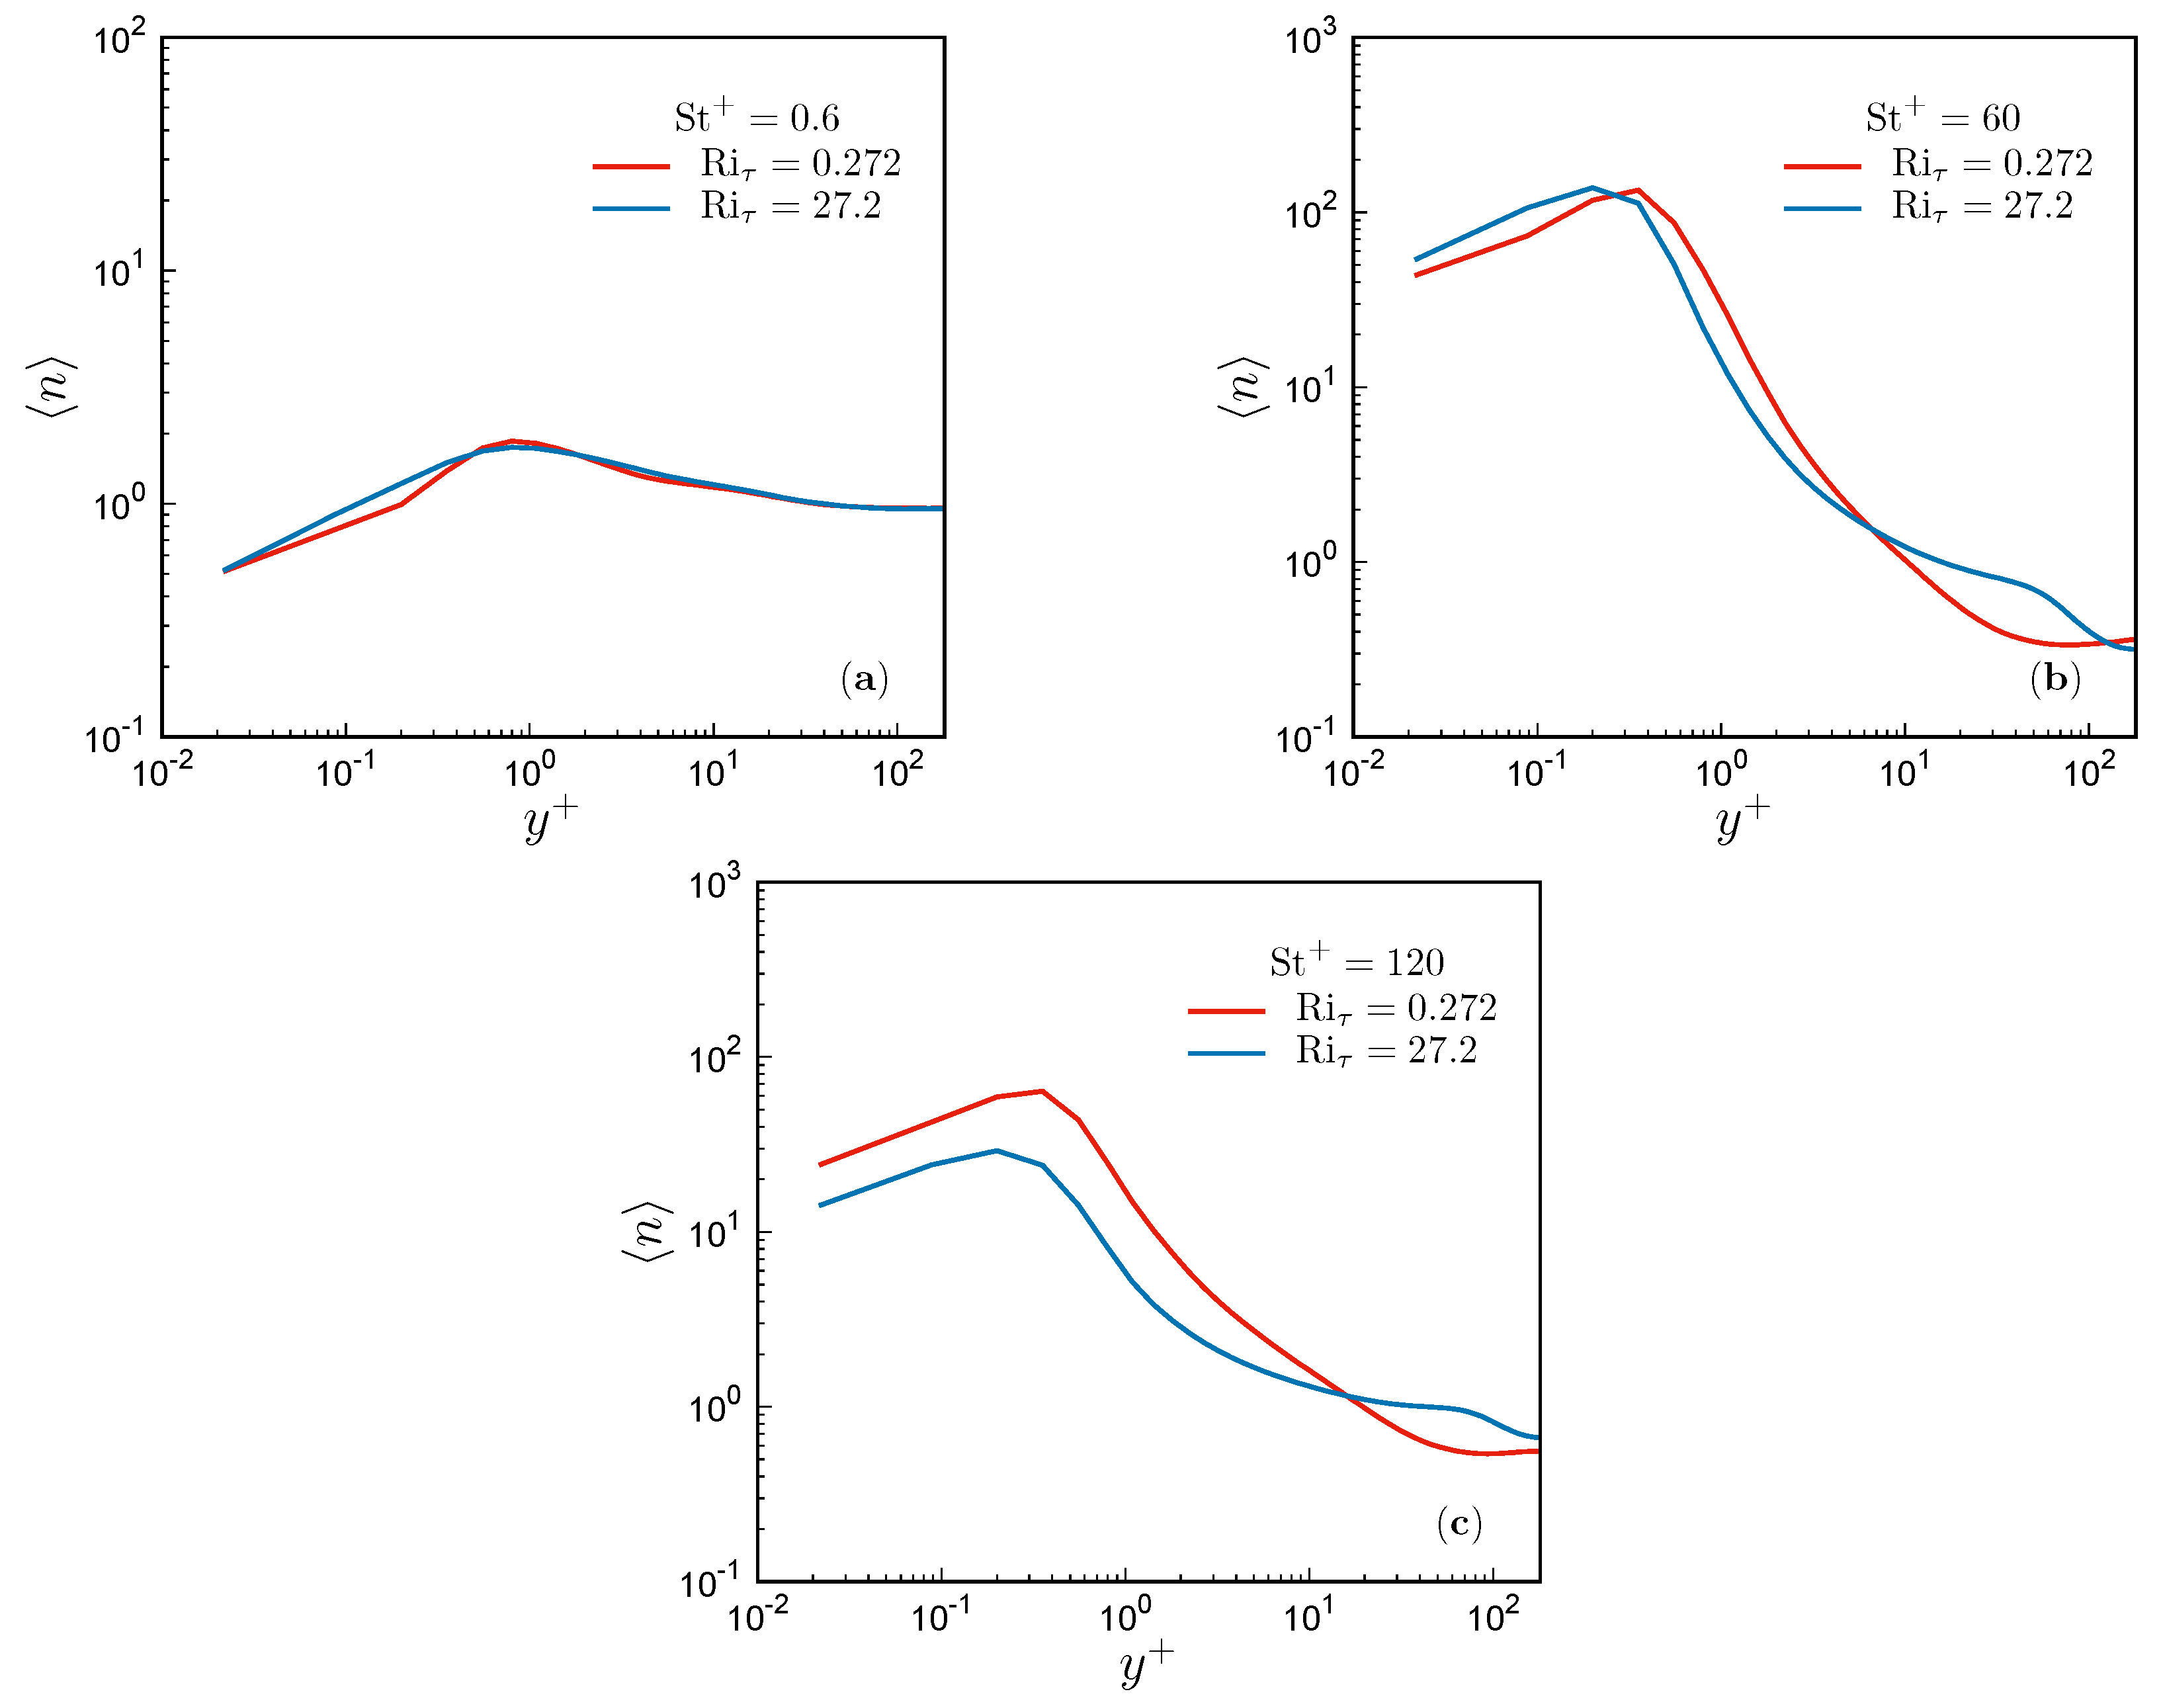
The spatial distribution of particles within the channel is firstly analyzed by examining the time-averaged particle concentration (Figure 9) and its variance (Figure 10), as functions of the wall-normal coordinate, y + = y Re τ , expressed in wall units. Particle concentration n is quantified as the number of particles per unit volume, normalized by its mean value across the fluid domain. In dimensionless form, the normalization term is given by N p / V , where N p denotes the total number of particles, and V = 8 π 2 is the non-dimensional volume of the channel.
In all the examined cases, particles exhibit a characteristic tendency to accumulate in the near-wall region, as evidenced by the concentration maxima in the viscous sublayer observed in Figure 9. This migration towards the wall, termed turbophoretic drift [50], is primarily attributed to the centrifugal mechanism, whereby heavy particles are expelled from the vortices due to their increased inertia relative to the fluid phase. Consequently, particles preferentially migrate towards regions characterized by reduced turbulent fluctuation intensities. This phenomenon, arising from particle–eddy interactions, is most pronounced when the particle density is significantly larger than the fluid density [45], and their response time τ p is comparable to the viscous timescale of the flow [22,27], i.e., at Stokes numbers St 1 . In agreement with this observation, the concentration peaks in Figure 9 are more prominent at St + = 60 and St + = 120 , which correspond to St = 0.33 and St = 0.67 , respectively, since St = St + / Re τ . As expected, for lower particle inertia (Figure 9a), turbophoretic drift is significantly attenuated, as particles exhibit a behavior more akin to fluid tracers, closely coupled to the fluid motion.
Regarding the effects of buoyancy, the concentration profiles illustrated in Figure 9b,c indicate that the increased Richardson number generally reduces particle concentration within the viscous sublayer. This effect is especially evident for particles with St + = 120 (Figure 9b). As observed in [17], the attenuated turbophoresis can be ascribed to the enhancement of the wall-normal motions induced by increasing buoyancy forces. Consequently, for the case at Ri τ = 27.2 , more particles populate the layers more distant from the wall, as evidenced by the bump-shaped concentration profiles for y + 10 (blue curves in Figure 9b,c). The modulating effect of buoyancy on particle concentration appears to be negligible for St + = 0.6 , as shown in Figure 9a.
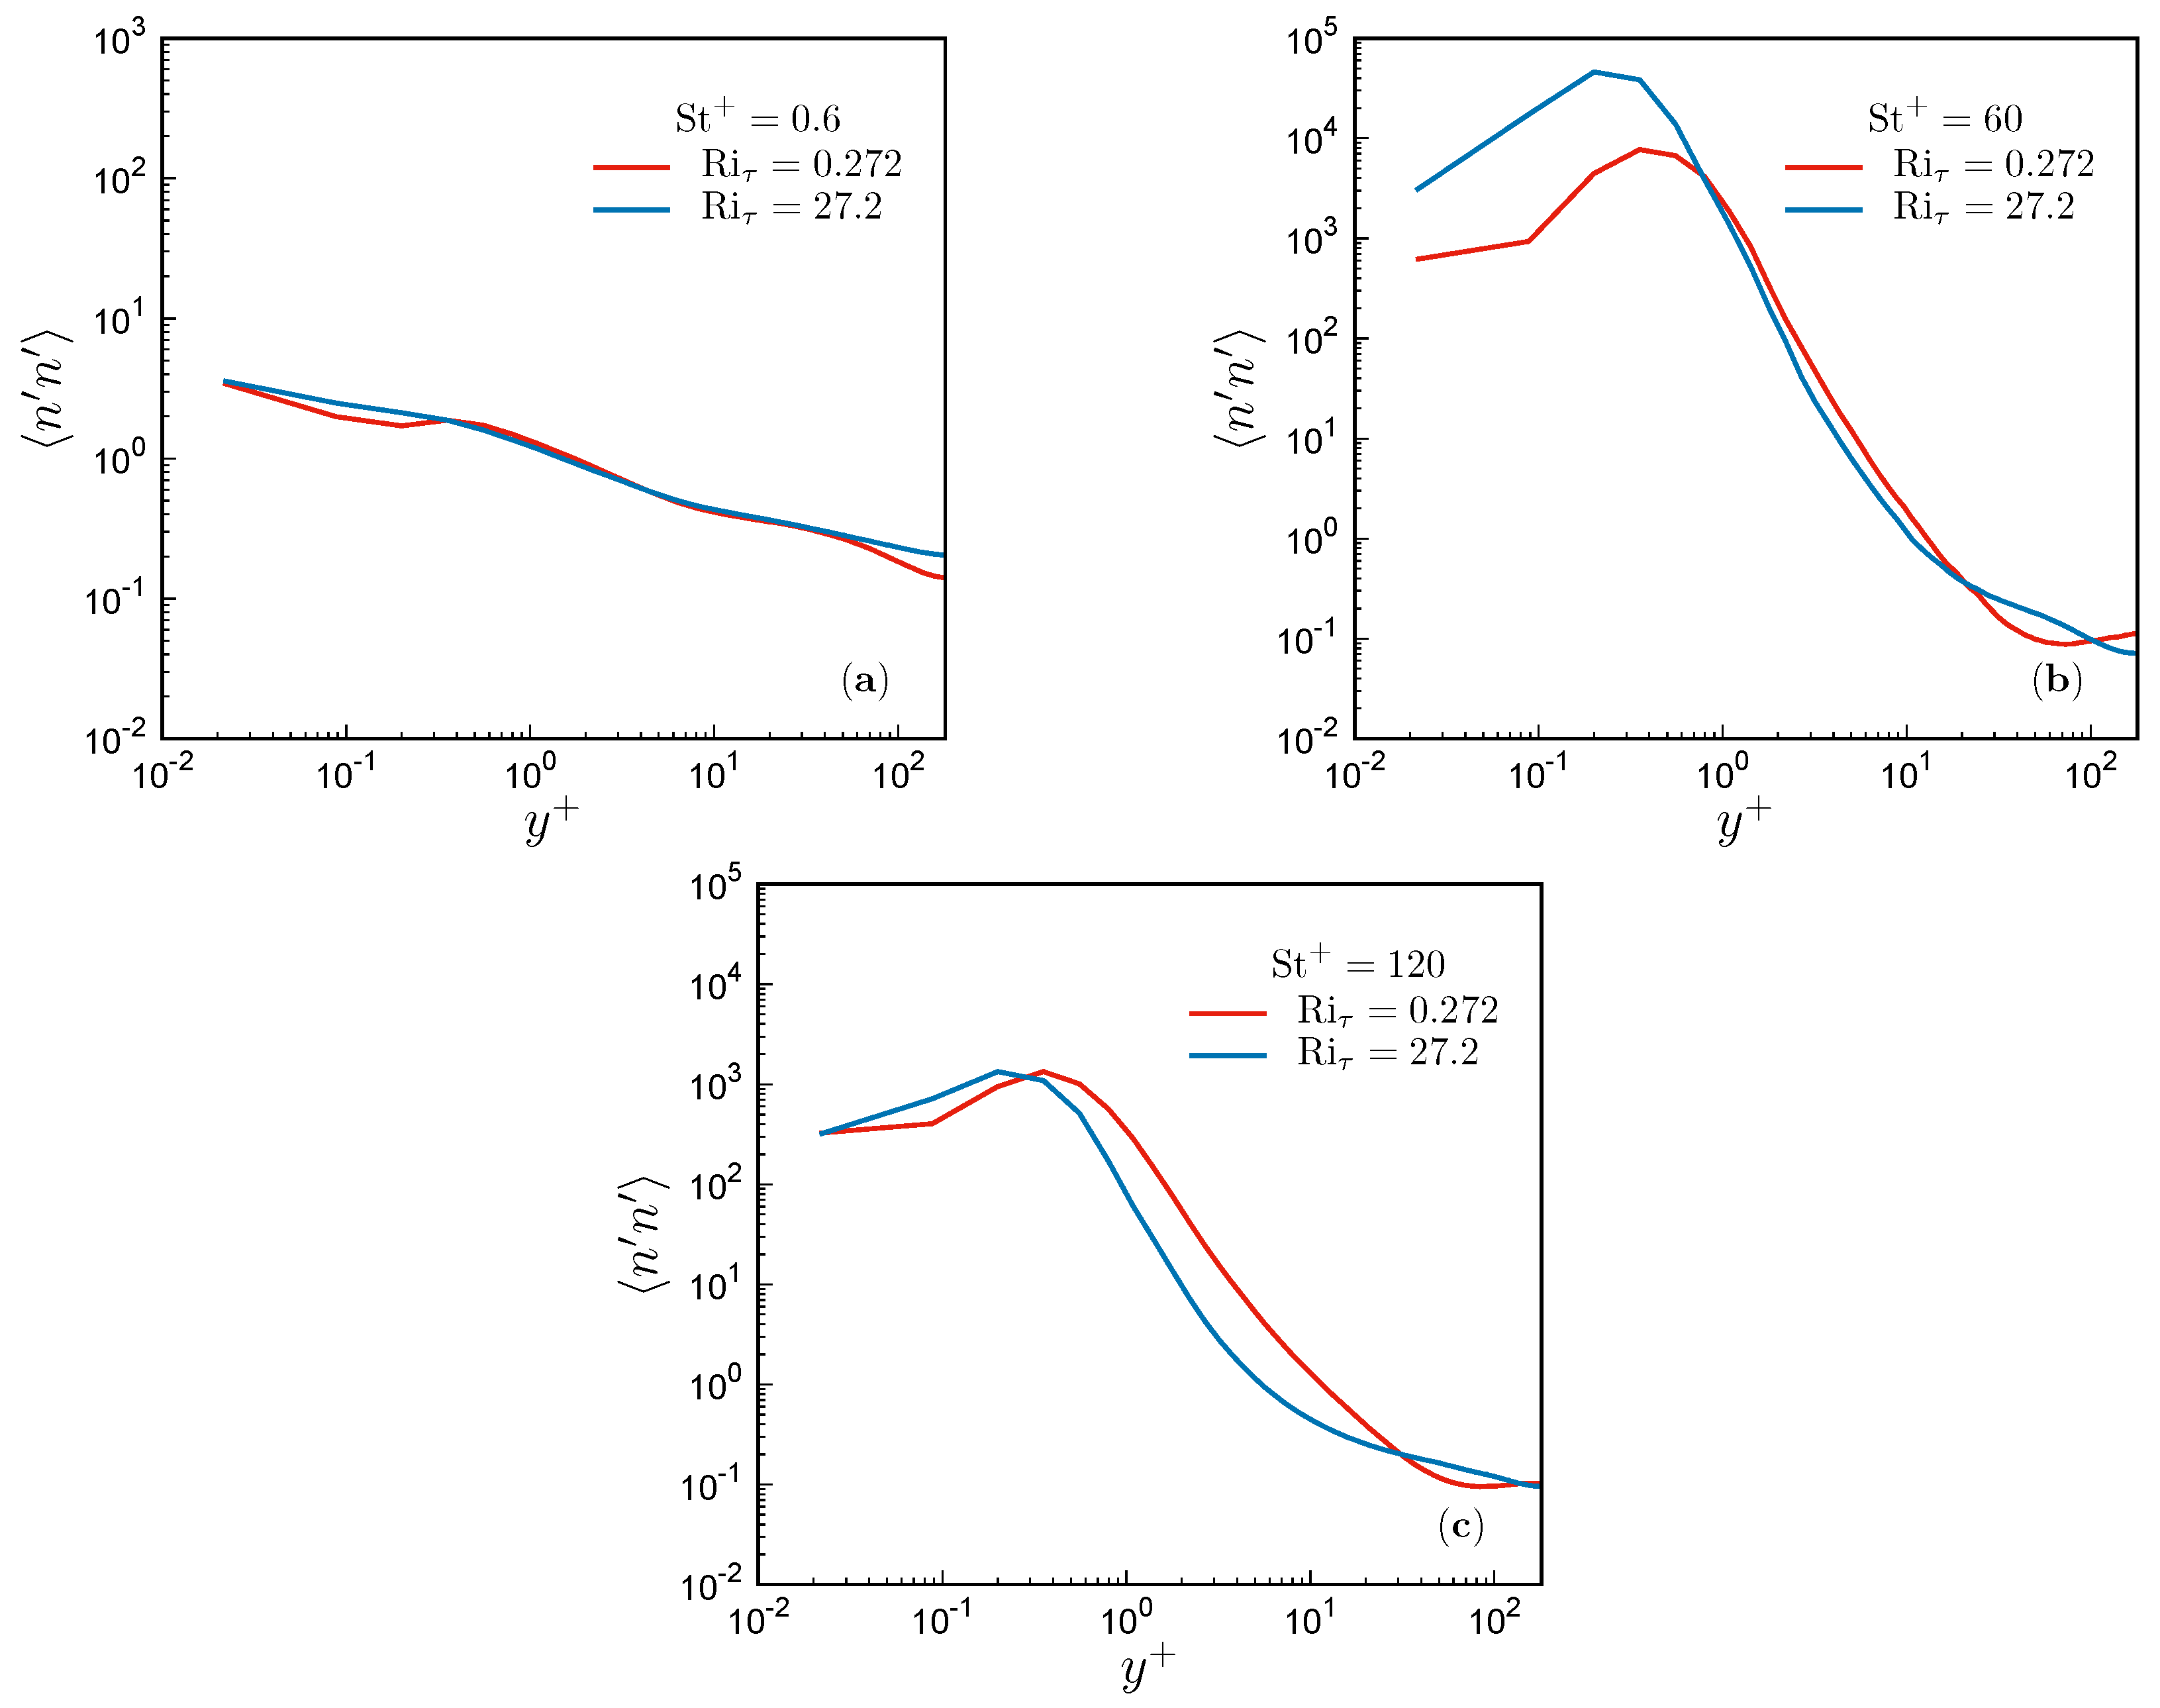
The particle concentration variance n n in the wall-normal direction, as illustrated in Figure 10, exhibits a trend analogous to that of the mean concentration n . The variance attains a peak within the viscous sublayer and decreases significantly with increasing distance from the wall. This decrease in n n at larger y + values, observed across all examined cases, is attributed to the reduced inhomogeneity and anisotropy of the flow field away from the wall region, which leads to a more uniform particle distribution within wall-parallel planes near the core region. The elevated values of n n observed in the near-wall regions are directly attributed to the well-documented phenomenon of particle accumulation within the low-speed streaks [21,27,45], which leads to the formation of elongated streamwise-oriented particle clusters. Notably, particles with St + = 60 (Figure 10b) exhibits the highest sensitivity to the presence of the wall.
Both cases with St + = 60 and St + = 120 are significantly influenced by increased buoyancy effects. Buoyancy markedly amplifies the peak of n n for St + = 60 (Figure 10b), and reduces the near-wall values of n n for St + = 120 (Figure 10c). This result suggests that the large-scale formations observed at Ri τ = 27.2 effectively redistributes particles within the wall-parallel planes. In line with the previous discussion on the mean concentration, for St + = 0.6 , the concentration variance also shows no discernible dependence on the Richardson number, as illustrated in Figure 10a.
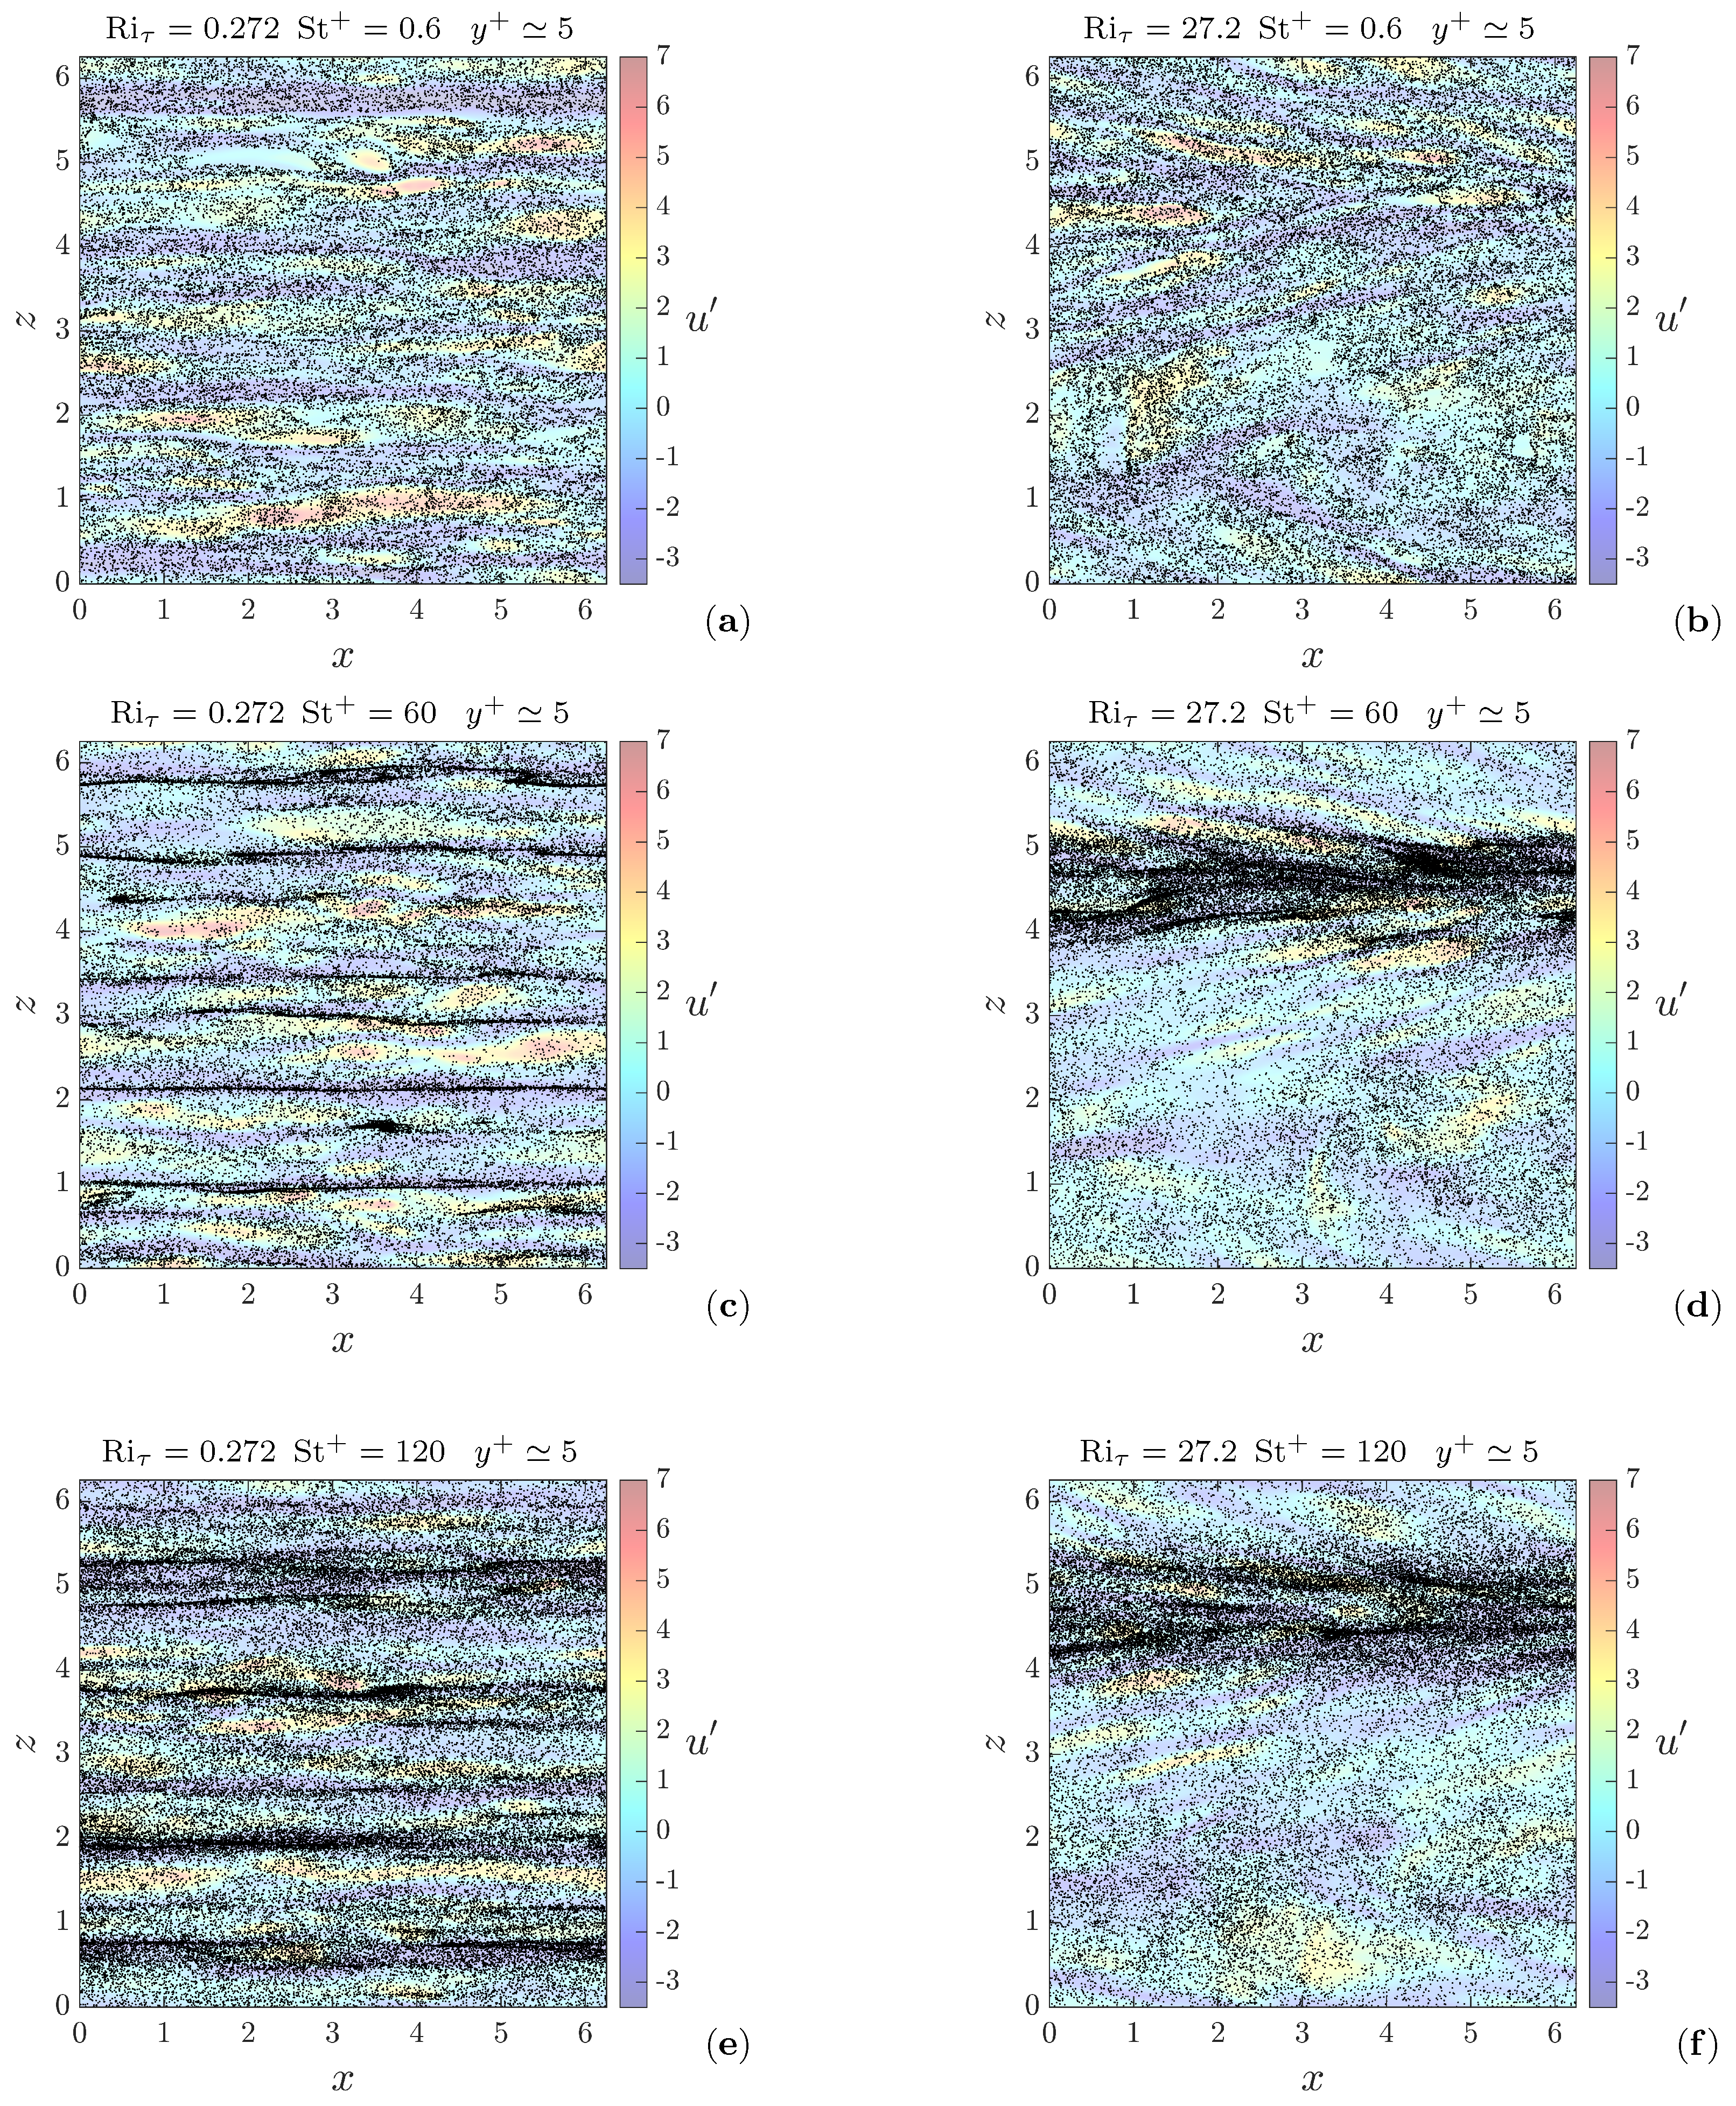
The considerations regarding the elevated particle concentration variance n n in the near-wall region, attributed to the formation of elongated streamwise-oriented particle clusters within the low-speed streaks, are visually confirmed by the instantaneous particle positions in the wall-parallel plane at y + 5 from the lower wall, as illustrated in Figure 11. This figure also shows the fluctuations of the fluid streamwise velocity in the same plane. For the case at Ri τ = 0.272 , Figure 11c,e provide visual evidence of the highly inhomogeneous particle distribution in the near-wall region, which is characterized by particle accumulation within low-speed streaks and the formation of the distinctive “necklace” clusters, first documented by Young and Hanratty [51]. These elongated accumulation patterns appear much more sharply defined and well-delineated for the particles at St + = 60 (Figure 11c) in comparison to those at St + = 120 (Figure 11e). In contrast, no structured pattern is evident for St + = 0.6 (Figure 11a).
At Ri τ = 27.2 , the instantaneous particle positions reveal a remarkable accumulation pattern. In stark contrast to the other case, particles with St + = 60 and St + = 120 (Figure 11d,f) exhibit a striking asymmetric distribution, which is characterized by pronounced elongated clusters confined to only one-half of the channel. Notably, this accumulation occurs in the low-speed regions contained within the channel half where the emerging thermal plume is present.
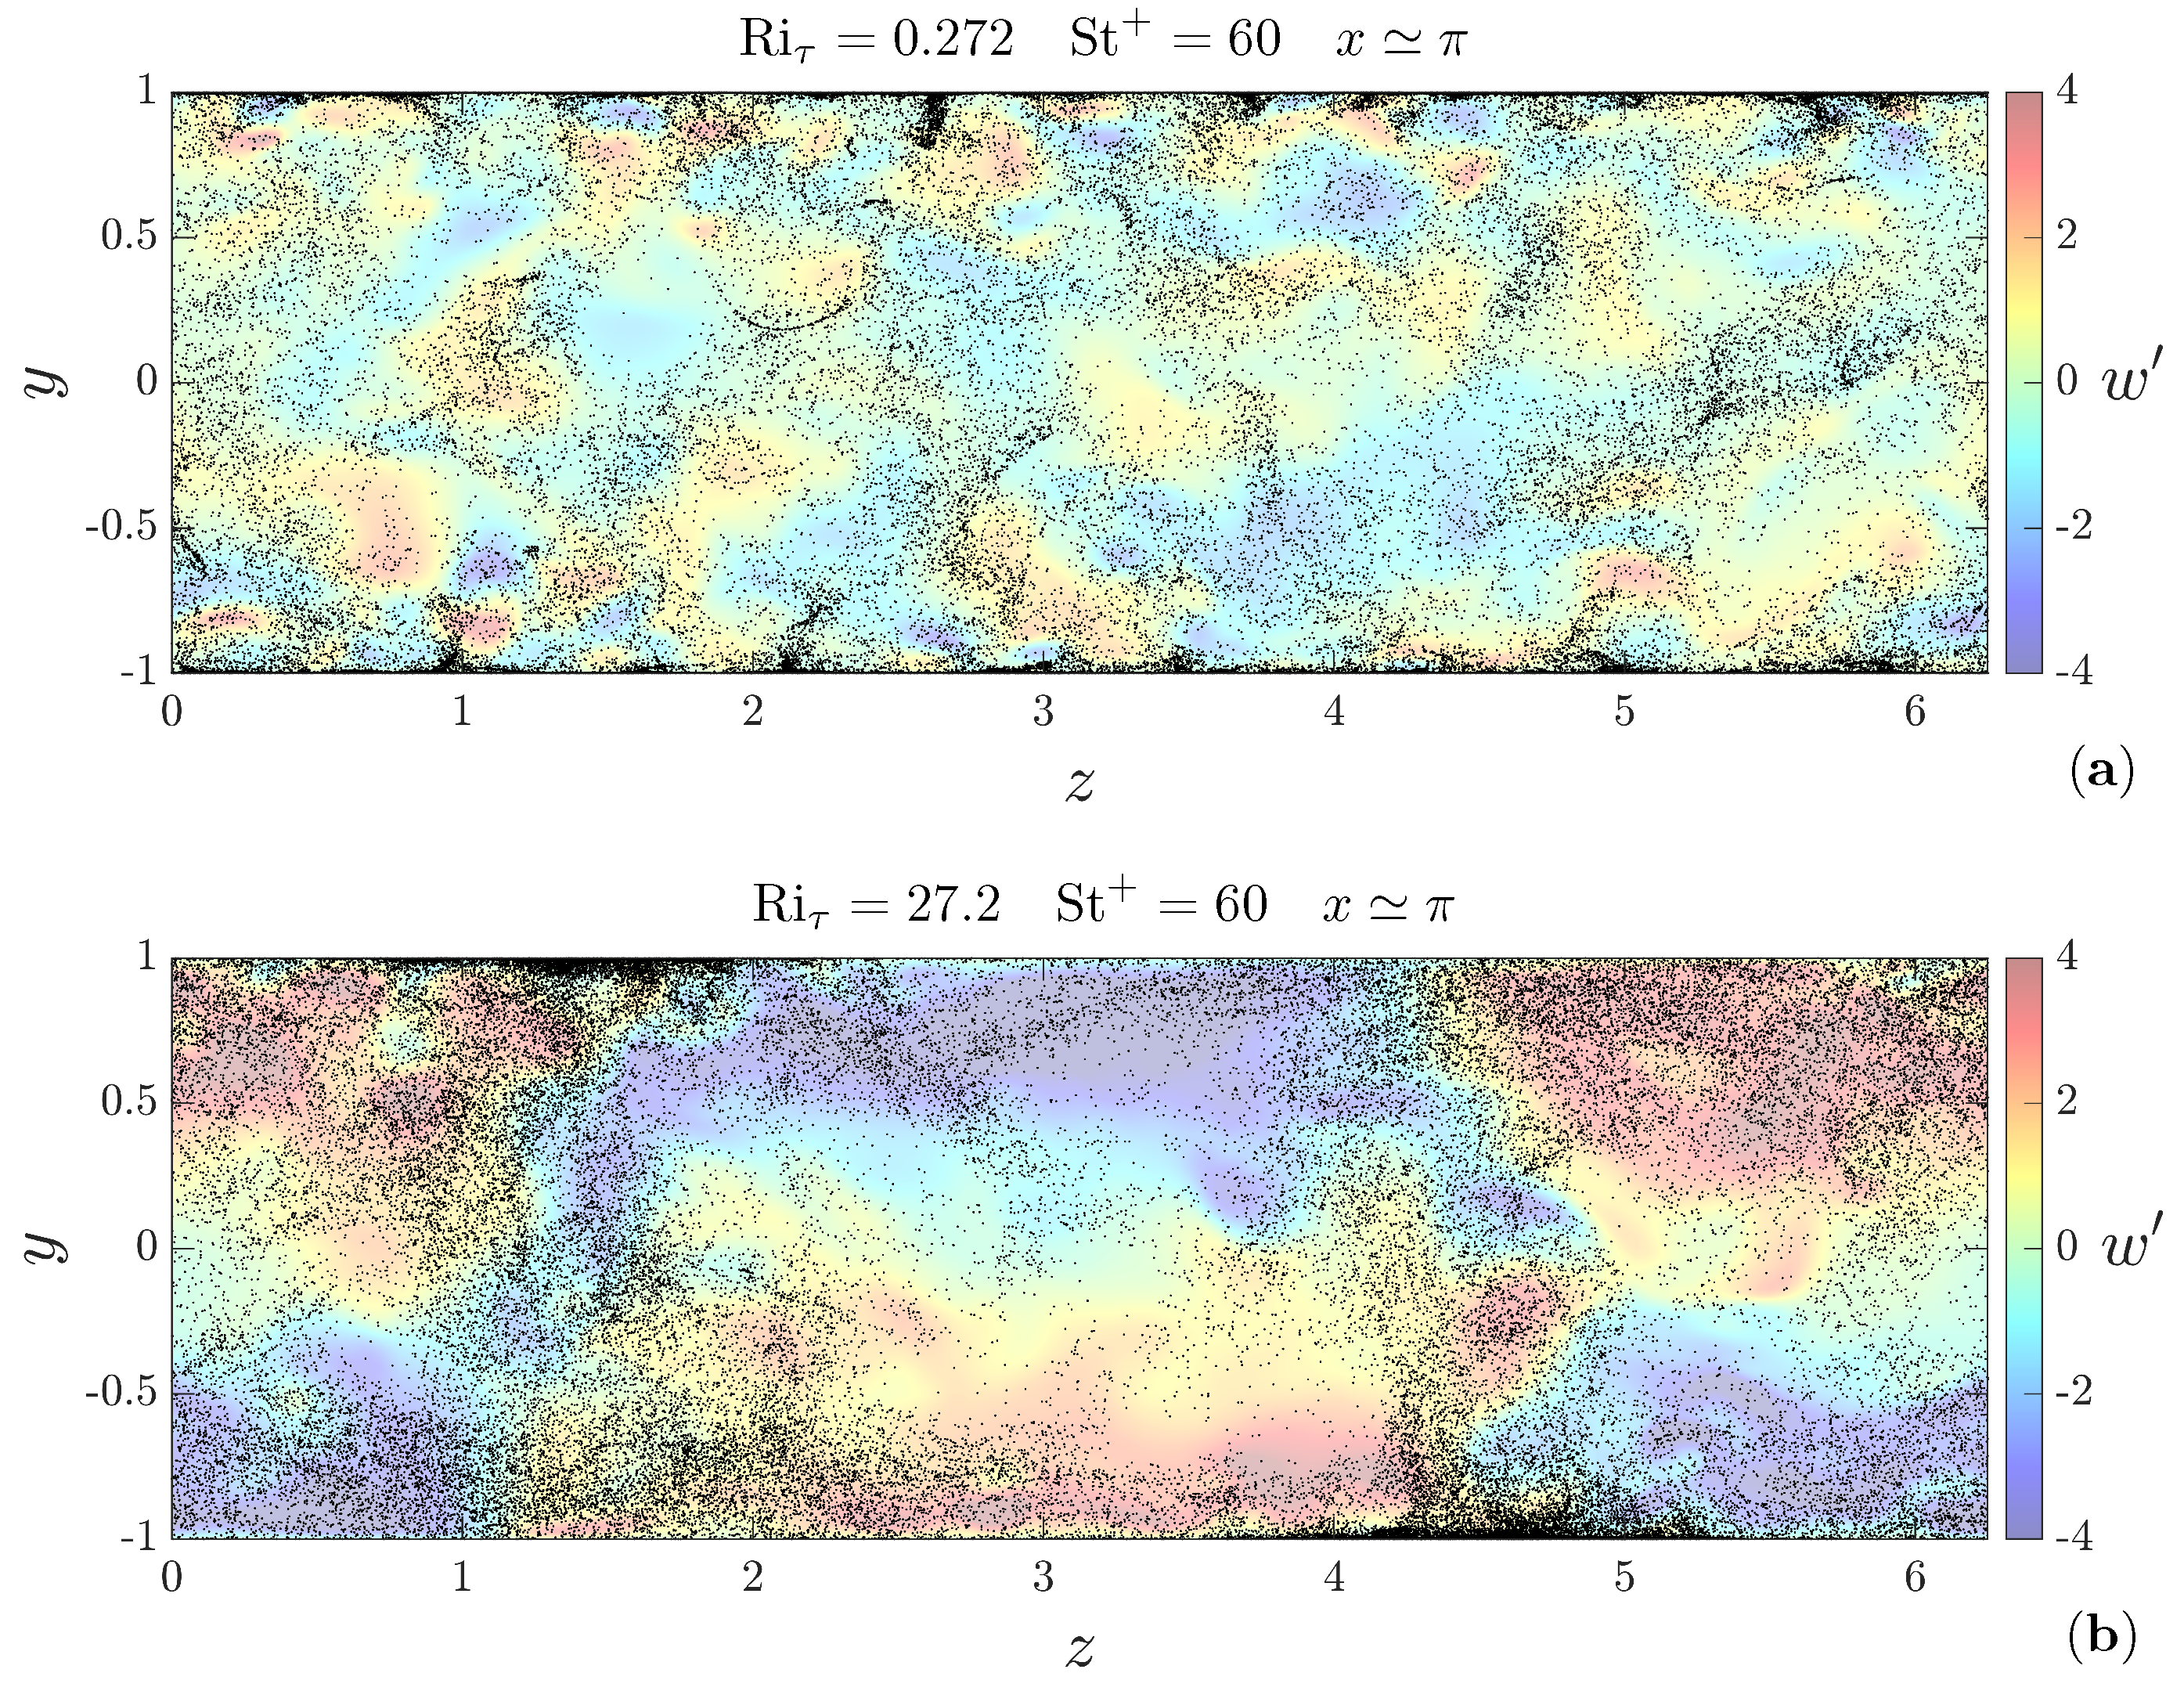
This finding is further confirmed by the instantaneous particle distribution in the middle cross-stream plane reported in Figure 12 for the cases at St + = 60 . For Ri τ = 0.272 , Figure 12a demonstrates that particles tend to concentrate preferentially in short vertical clusters attached to the walls, corresponding to the low-speed fluid regions where small and incoherent thermal plumes emerge. In contrast, for Ri τ = 27.2 , particles predominantly accumulate in the wide near-wall regions where the coherent thermal plumes originate (Figure 12b). As evidenced by the fluctuating spanwise velocity in the same plane, the areas where the accumulation occurs are convergence zones for w . These observations suggest the existence of a strong interaction between inertial particle dynamics and large-scale coherent flow structures.
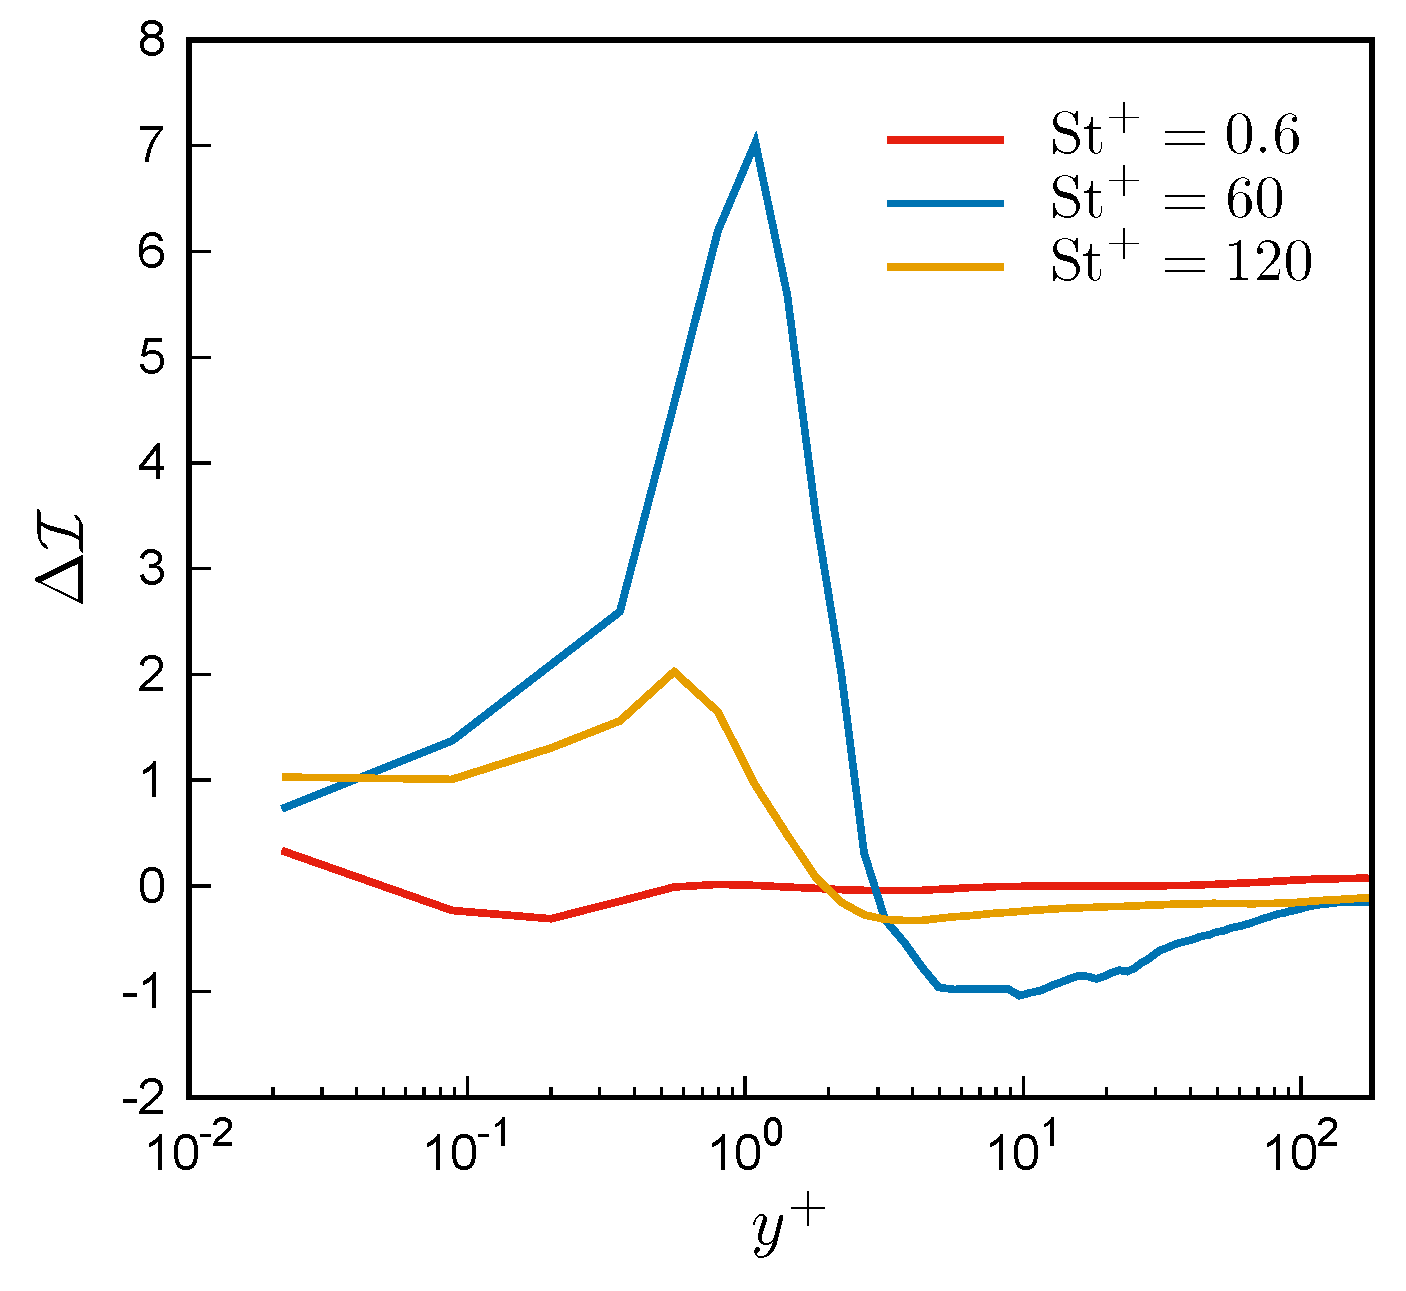
To assess the impact of vortex rolls on the particle distribution at a constant Stokes number, we evaluated the deviation in the quantity I = n n / n 2 caused by the increasing Richardson number. The deviation Δ I , computed as the difference between I at Ri τ = 27.2 and I at Ri τ = 0.272 , is plotted against the wall-normal coordinate in Figure 13. The profiles reveal that the vortex rolls have a substantial impact on the particle distribution in the viscous sublayer and buffer layer for St + = 60 , followed by a moderate influence for St + = 120 , whereas their effect is negligible for St + = 0.6 .
This differential response of particles to the large-scale formations observed at Ri τ = 27.2 has been further analyzed by comparing the particle response times τ p to the characteristic timescale of vortex rolls dynamics in the cross-stream planes. This timescale, denoted as τ R , can be defined as τ R = L R / V R , where L R and V R are, respectively, the characteristic length and velocity scales of the roll in the ( z , y ) planes. Since the roll extends over the entire channel height, 2 h can be considered a suitable characteristic length scale. Moreover, given the coherent nature of the structure, it is appropriate to use the maximum value of the mean fluid velocity’s magnitude in the cross-stream planes as the characteristic velocity scale of the roll. Hence, in dimensionless form, the timescale of the roll is given by
τ R = 2 max x w 2 + v 2 1 / 2 .
By averaging the results over the simulations at Ri τ = 27.2 , the dimensionless roll timescale is determined to be τ R 0.477 . This timescale can be compared to the non-dimensional particle response time τ p , which equals the Stokes number St = St + / Re τ . The comparative analysis is summarized in Table 2, which presents the ratio τ p / τ R and its absolute deviations from unity, | 1 τ p / τ R | , for various Stokes numbers.
In conjunction with the previous findings regarding the metric Δ I , the results in Table 2 demonstrate that the particle distribution within the channel is most significantly influenced by the vortex rolls when the ratio of the particle response time τ p to the vortex roll timescale τ R approaches unity. This observation aligns with the existing literature on turbulent particle-laden flows [23,43,52,53], which suggests that the most intense interactions between particles and vortices occur when particle response times are comparable to the timescales of the vortical structures.

3.4. Particle Concentration and Local Flow Topology

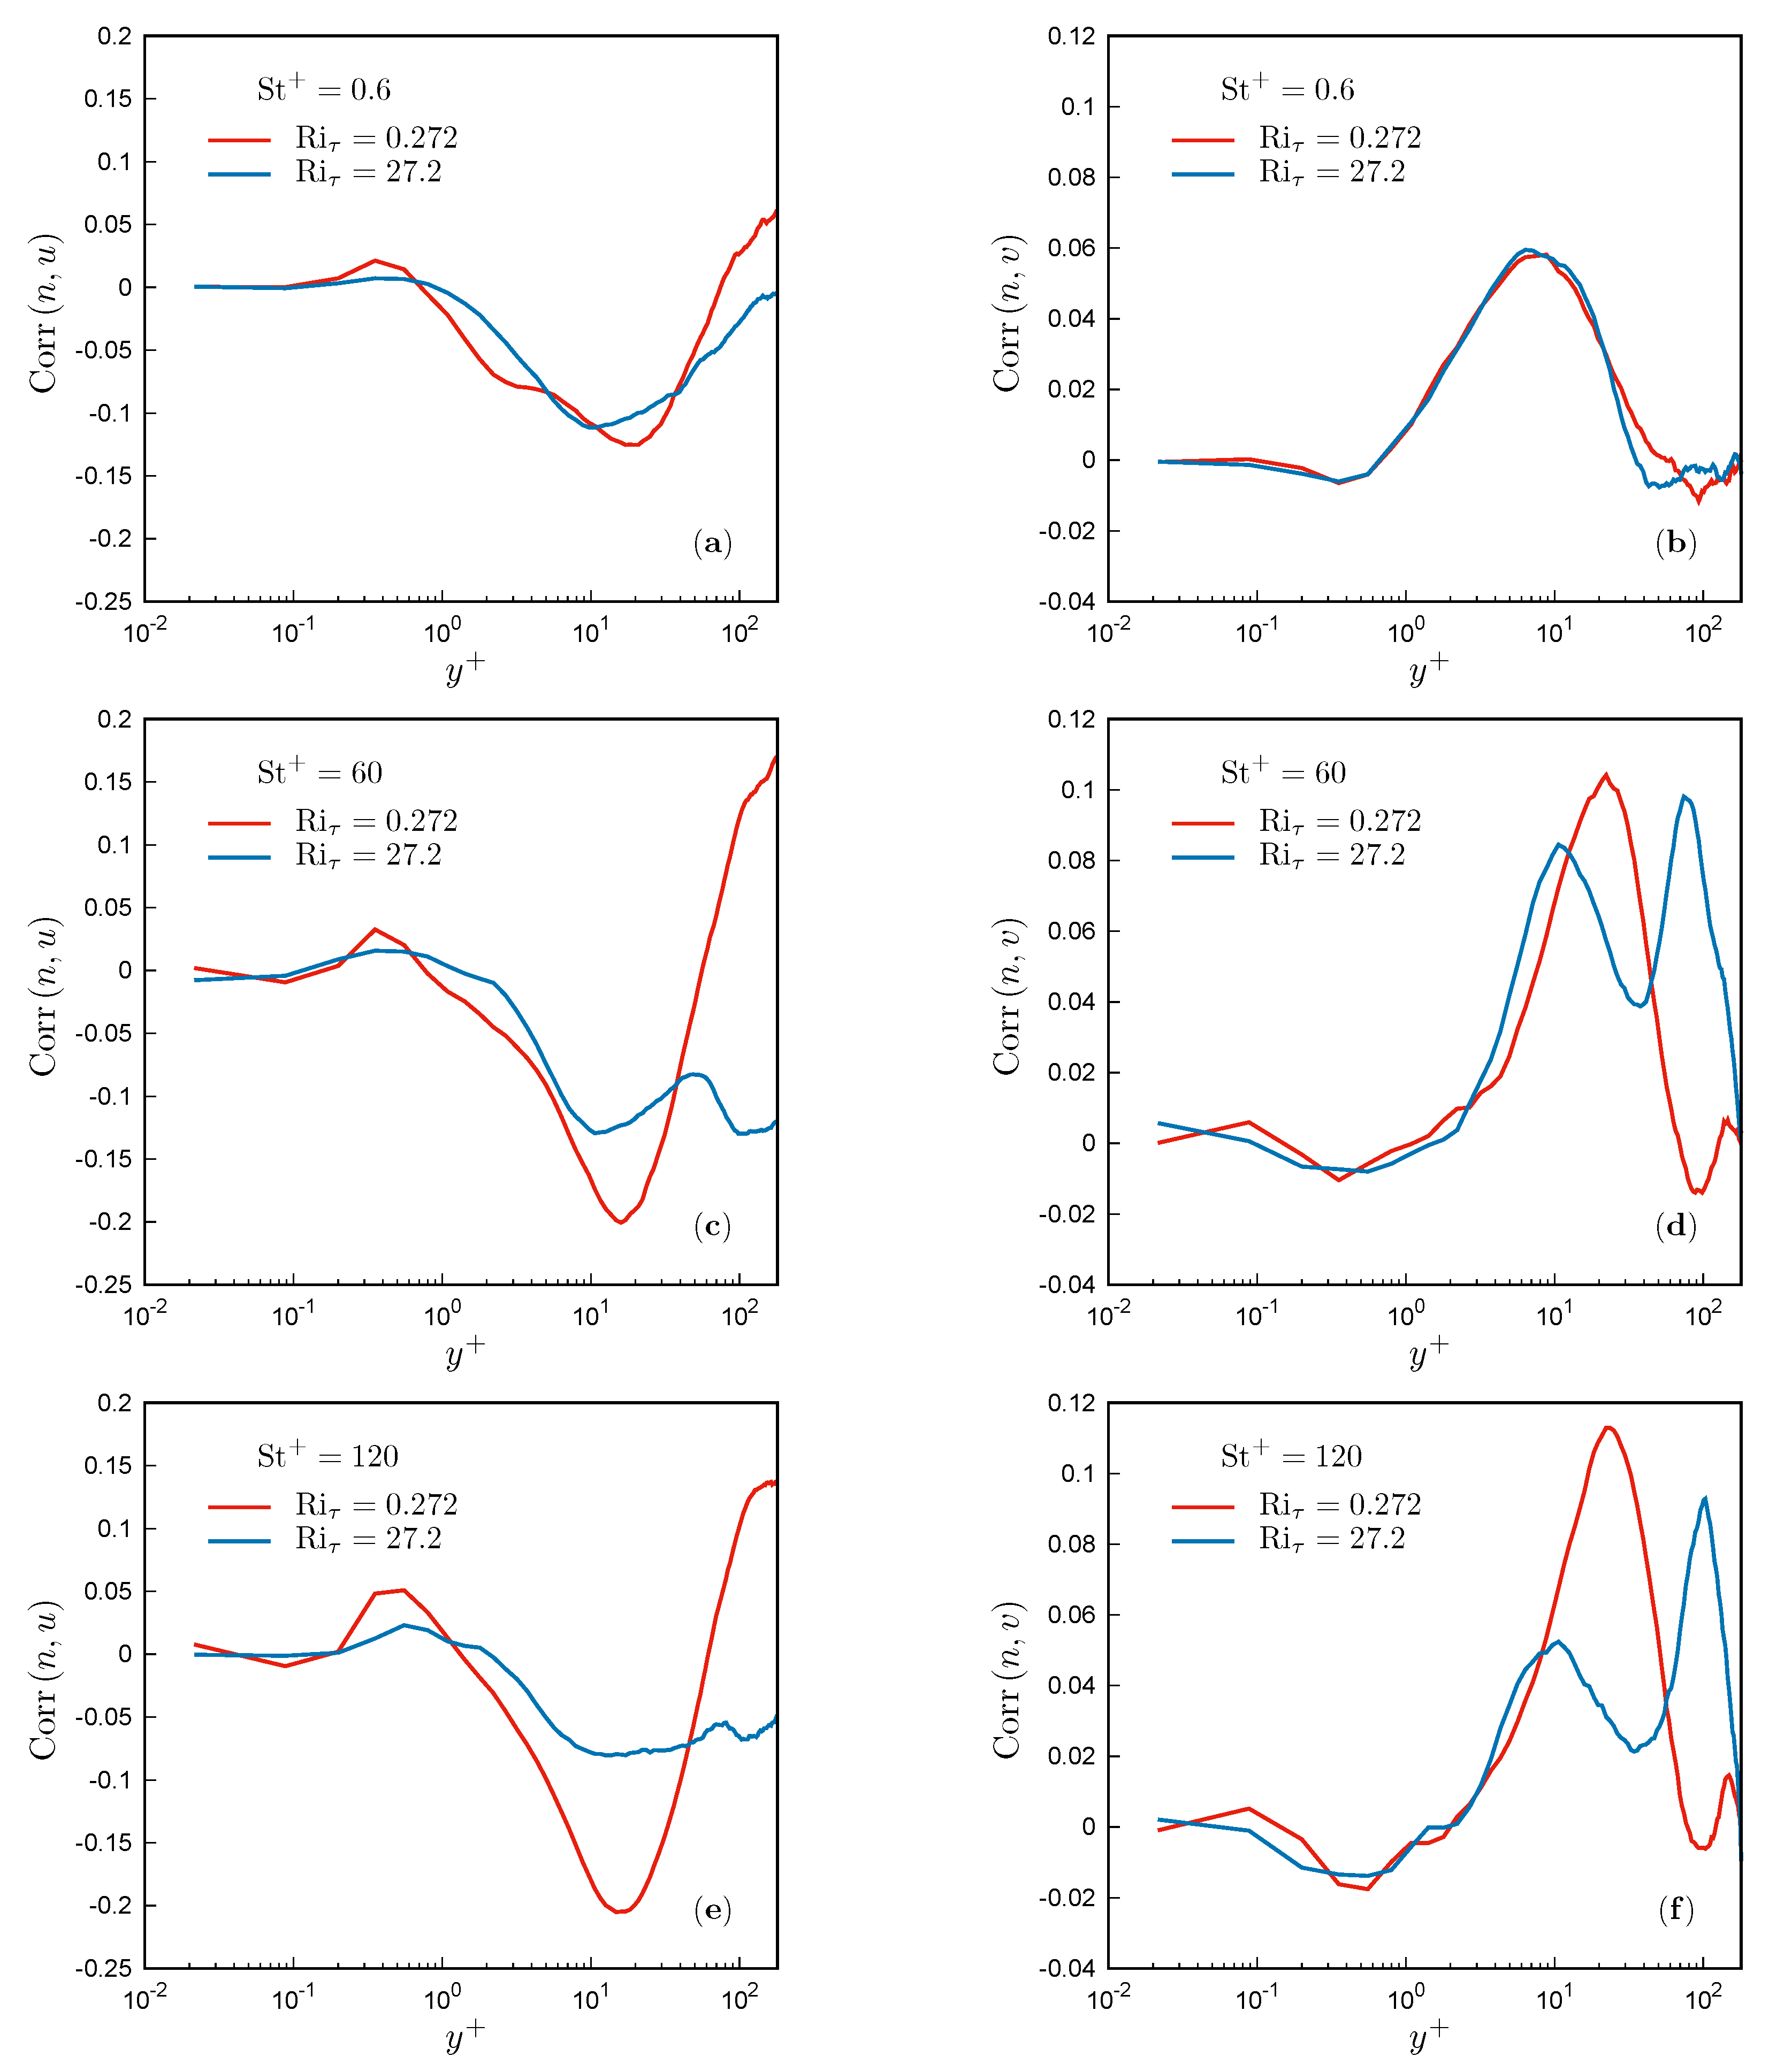
To elucidate the distinctive accumulation displayed by the particles in the near-wall region where the coherent thermal plume originates, we examined the statistical correlations between the particle concentration and the local flow topology. By examining the statistical relationship among particle spatial distribution, flow topology, and velocity fluctuations, a comprehensive understanding of the preferential sampling tendencies exhibited by inertial particles can be achieved. To this end, we first computed the correlation coefficients between the particle concentration n, and the streamwise (u) and wall-normal (v) components of the fluid velocity as functions of y + (Figure 14).
In all the examined cases, Corr ( n , u ) attains negative values and Corr ( n , u ) presents positive values, with peaks occurring in the buffer layer at y + 10 for both the correlations. These common trends confirm the inherent tendency of heavy particles to collect in the near-wall low-speed streaks, a phenomenon consistently reported in previous studies ([21,27,45]). Negative values of Corr ( n , u ) indicate, in fact, an elevated particle concentration in regions characterized by reduced streamwise momentum, while the positive values of Corr ( n , v ) signify a higher concentration within fluid elements lifted away from the walls. These signatures, namely diminished streamwise velocity coupled with outward wall-normal motion, are indeed common features of the low-speed streaks. In line with the current literature, the maxima of the correlations are more intense for the Stokes numbers closer to the unit value, i.e., the cases at St + = 60 and St + = 120 (Figure 14c–f).
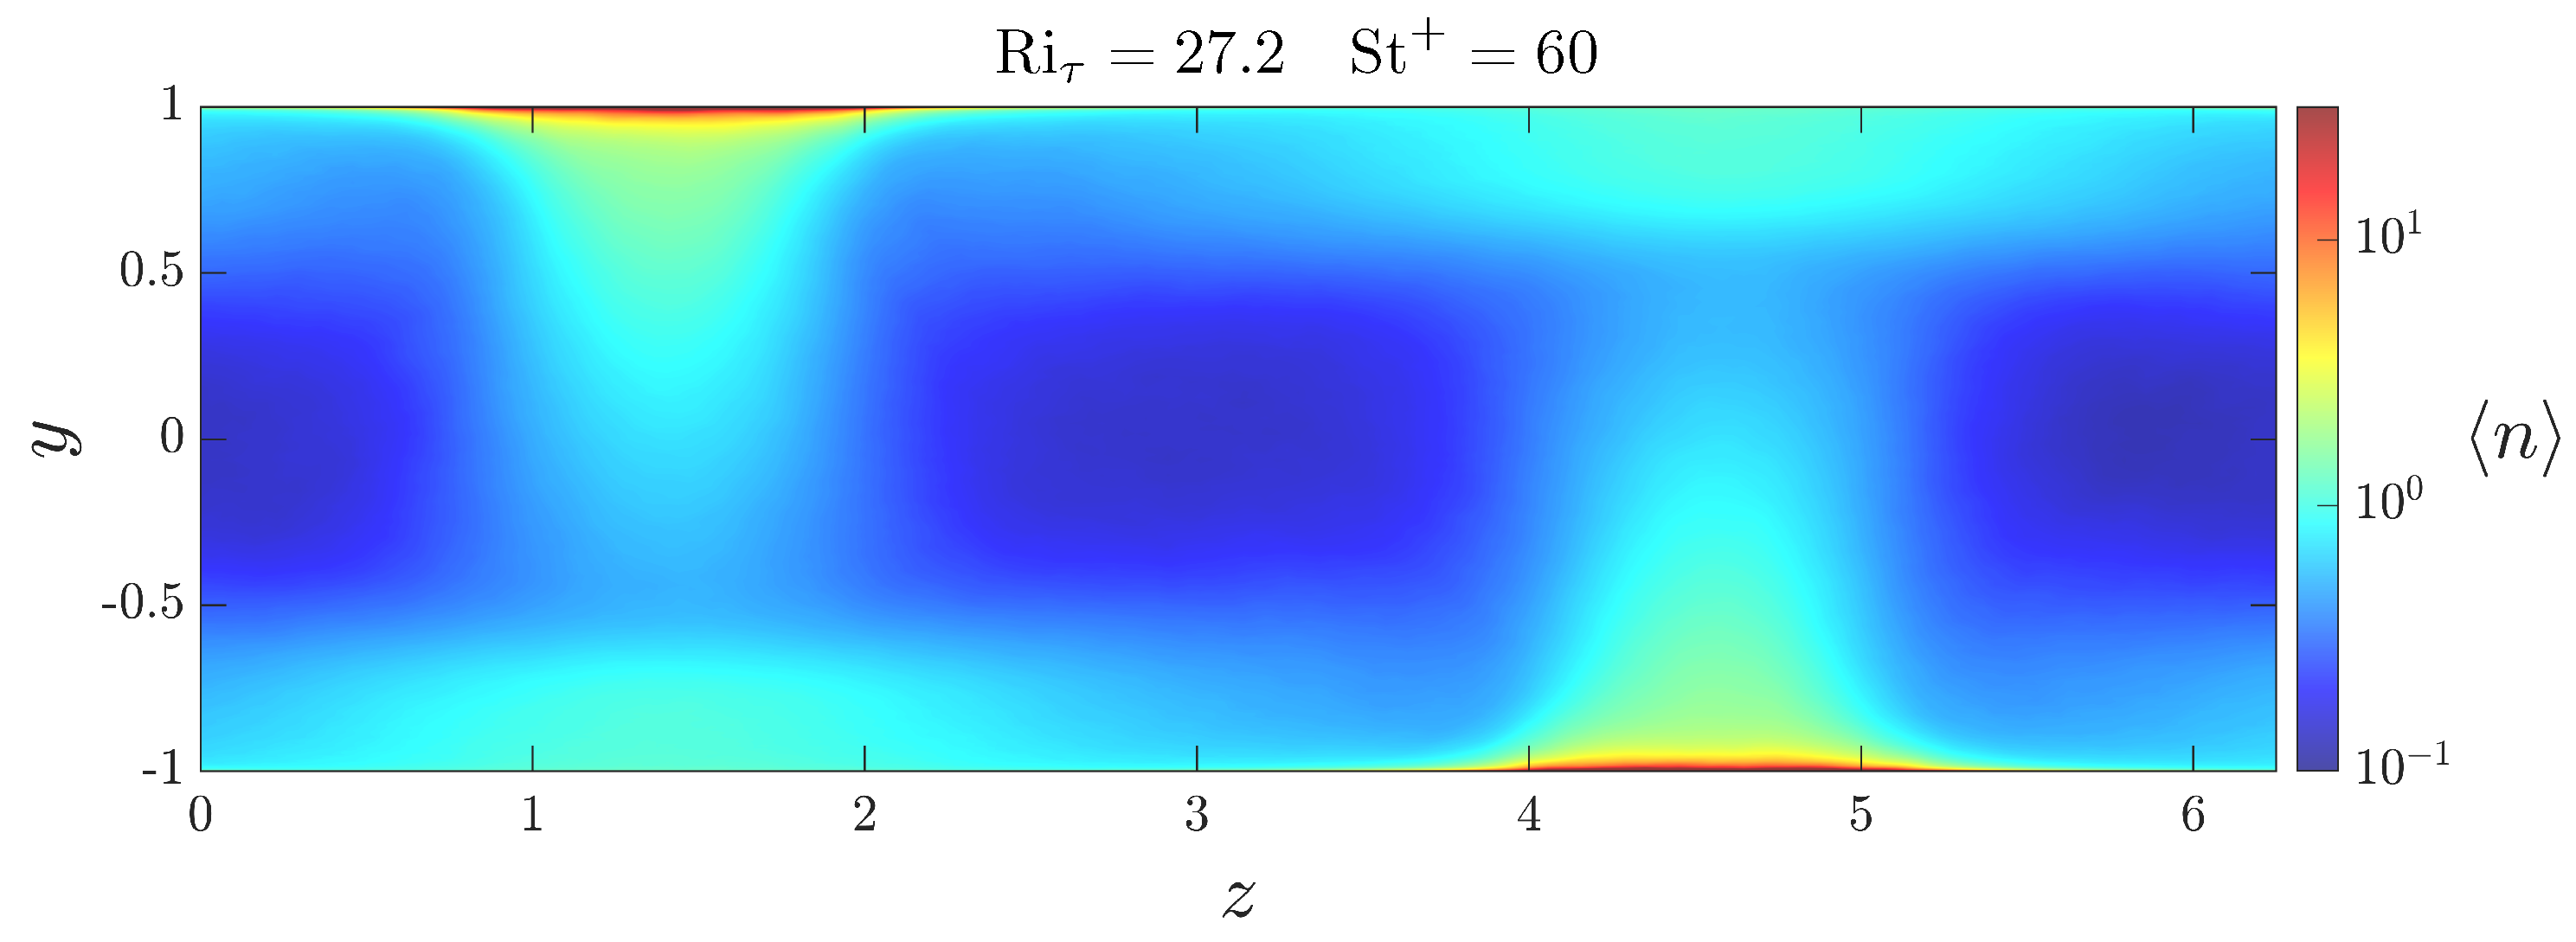
Interestingly, at Ri τ = 27.2 , the correlations between n and v associated with the particles more affected by the vortex rolls ( St + = 60 and St + = 120 ) also exhibit a pronounced positive peak in the outer region at approximately y + 100 , corresponding to y ± 0.44 (Figure 14d,f). This positive correlation primarily results from a localized reduction in particle concentration at y ± 0.44 , which occurs exclusively within the subdomains of the channel where the coherent thermal plume impinges upon the wall. Notably, this localized reduction does not affect the overall time-averaged concentration profiles, as illustrated previously in Figure 9, but is observable in the cross-stream distribution of the mean concentration averaged over the streamwise coordinate, as shown in Figure 15. This reduction is presumably caused by the large-scale spanwise velocity fluctuations w , which produce a divergence zone in this region.
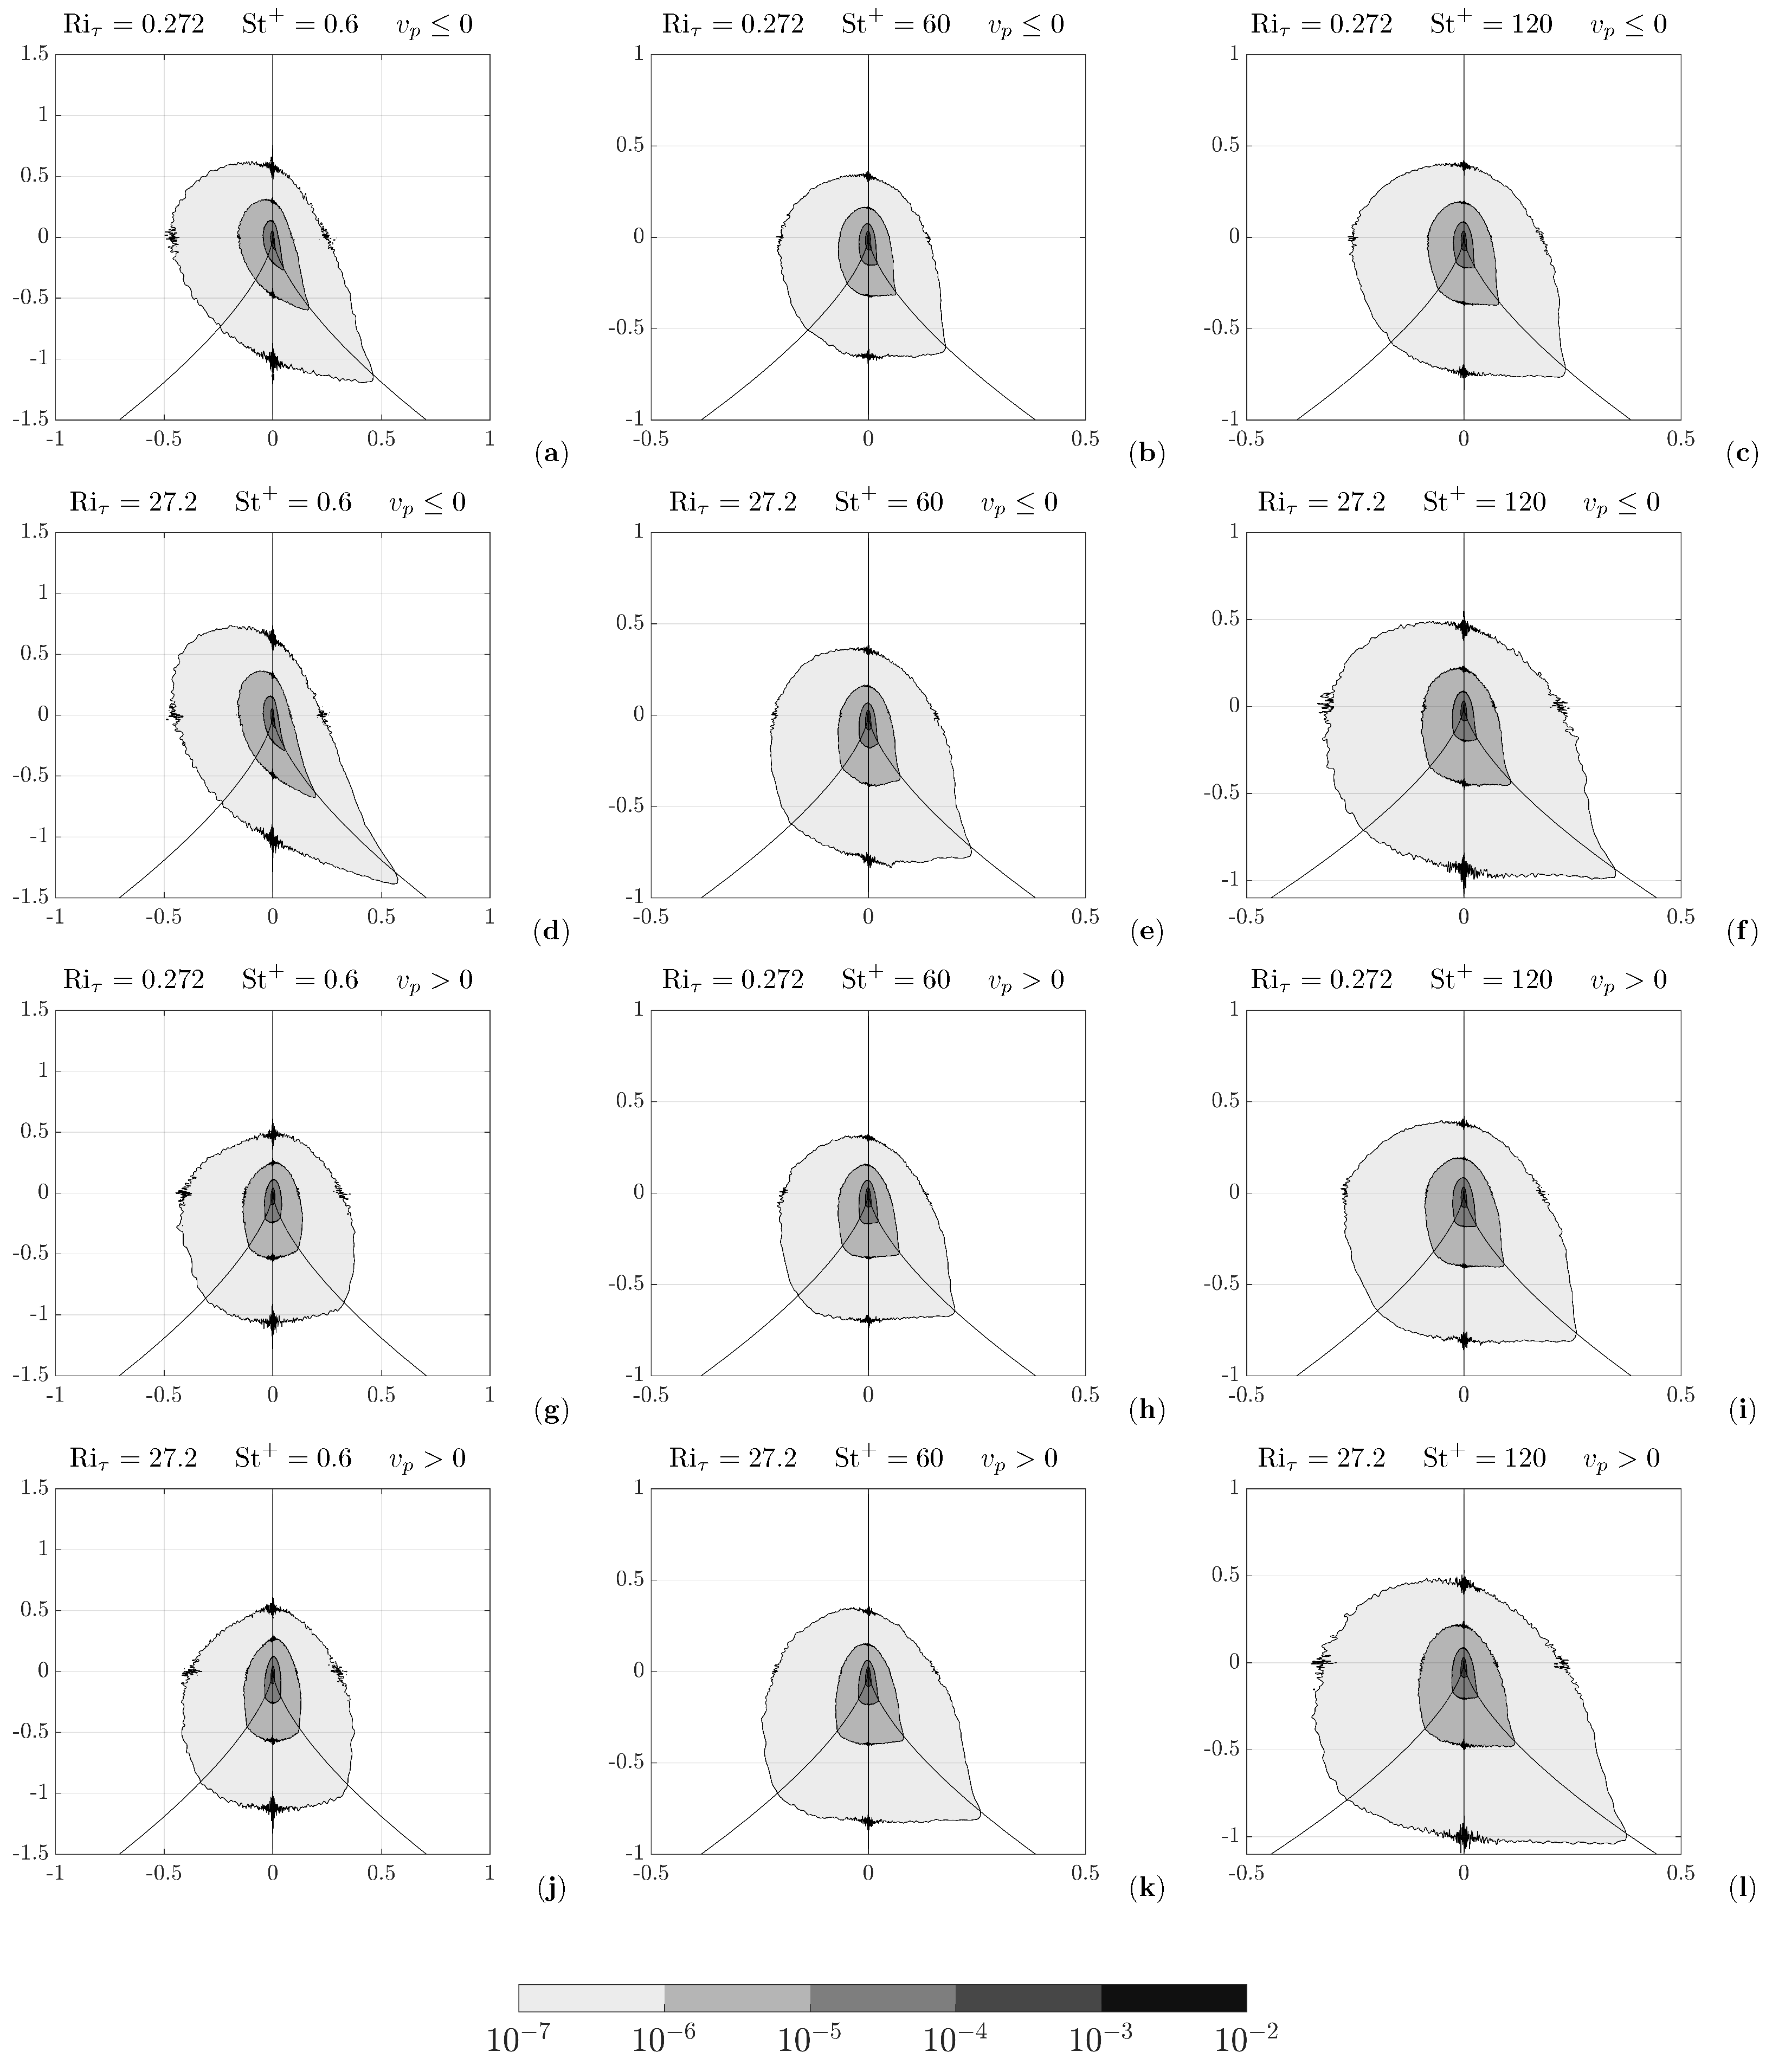
Finally, we evaluated the joint probability density functions (joint-PDFs) of the second and third invariants of the velocity gradient tensor, conditionally sampled at particle locations across various wall-normal distances. The sampling procedure further categorized the particles based on their vertical velocity component, distinguishing between those moving away from the wall (positive vertical velocity v p , according to the sign convention adopted) and those directed towards the wall (negative v p ). This conditional sampling approach follows the methodology previously employed by Bijlard et al. [35] for the analysis of isothermal particle-laden channel flow. The joint-PDFs were computed for all wall-parallel layers within the channel domain, following the subdivision adopted in Section 3.2. However, the most relevant results pertaining to only the viscous sublayer ( 0 < y + 5 ) and the buffer layer ( 5 < y + 35 ) are presented in Figure 16 and Figure 17, respectively.
The results in Figure 16 for the particles sampled in the viscous sublayer show a common tendency to preferentially sample strain-dominated regions, with the exception of particles at St + = 0.6 moving towards the walls (Figure 16a,d). The joint-PDF associated with these particles interestingly presents a distribution oriented towards the second quadrant, accompanied by the presence of a “tail” along the D = 0 line dividing the first and fourth quadrants, which is more pronounced for Ri τ = 27.2 than for Ri τ = 0.272 . Owing to their low inertia, these particles exhibit a tracer-like behavior, sampling the flow field indistinctly. Consequently, for them, the deviation expected from the joint-PDFs sampled at the grid points should be minimal. However, for Ri τ = 0.272 , this early manifestation of topology oriented towards vortex stretching and strain self-amplification, as observed in Figure 16a, was not captured in the PDF evaluated at the grid points. This deviation suggests that under the influence of buoyancy, even incoherent vertical motions impinging on the walls exhibit a predominant topology characterized by vortex stretching and strain self-amplification.
As the Richardson number increases from Ri τ = 0.272 to Ri τ = 27.2 , an enhanced preferential sampling of strain-dominated regions is observed for particles with Stokes numbers St + = 60 and St + = 120 , as evidenced by the augmented joint-PDFs values in the third and fourth quadrants (Figure 16e,f,h,l). This inherent propensity of particles to avoid vortical regions in favor of strain-dominated ones, previously documented in [27], explains their predominant accumulation in the regions where thermal plumes originate (strain-dominated), and their depleted presence where the plumes impinge upon the walls (vorticity-dominated).
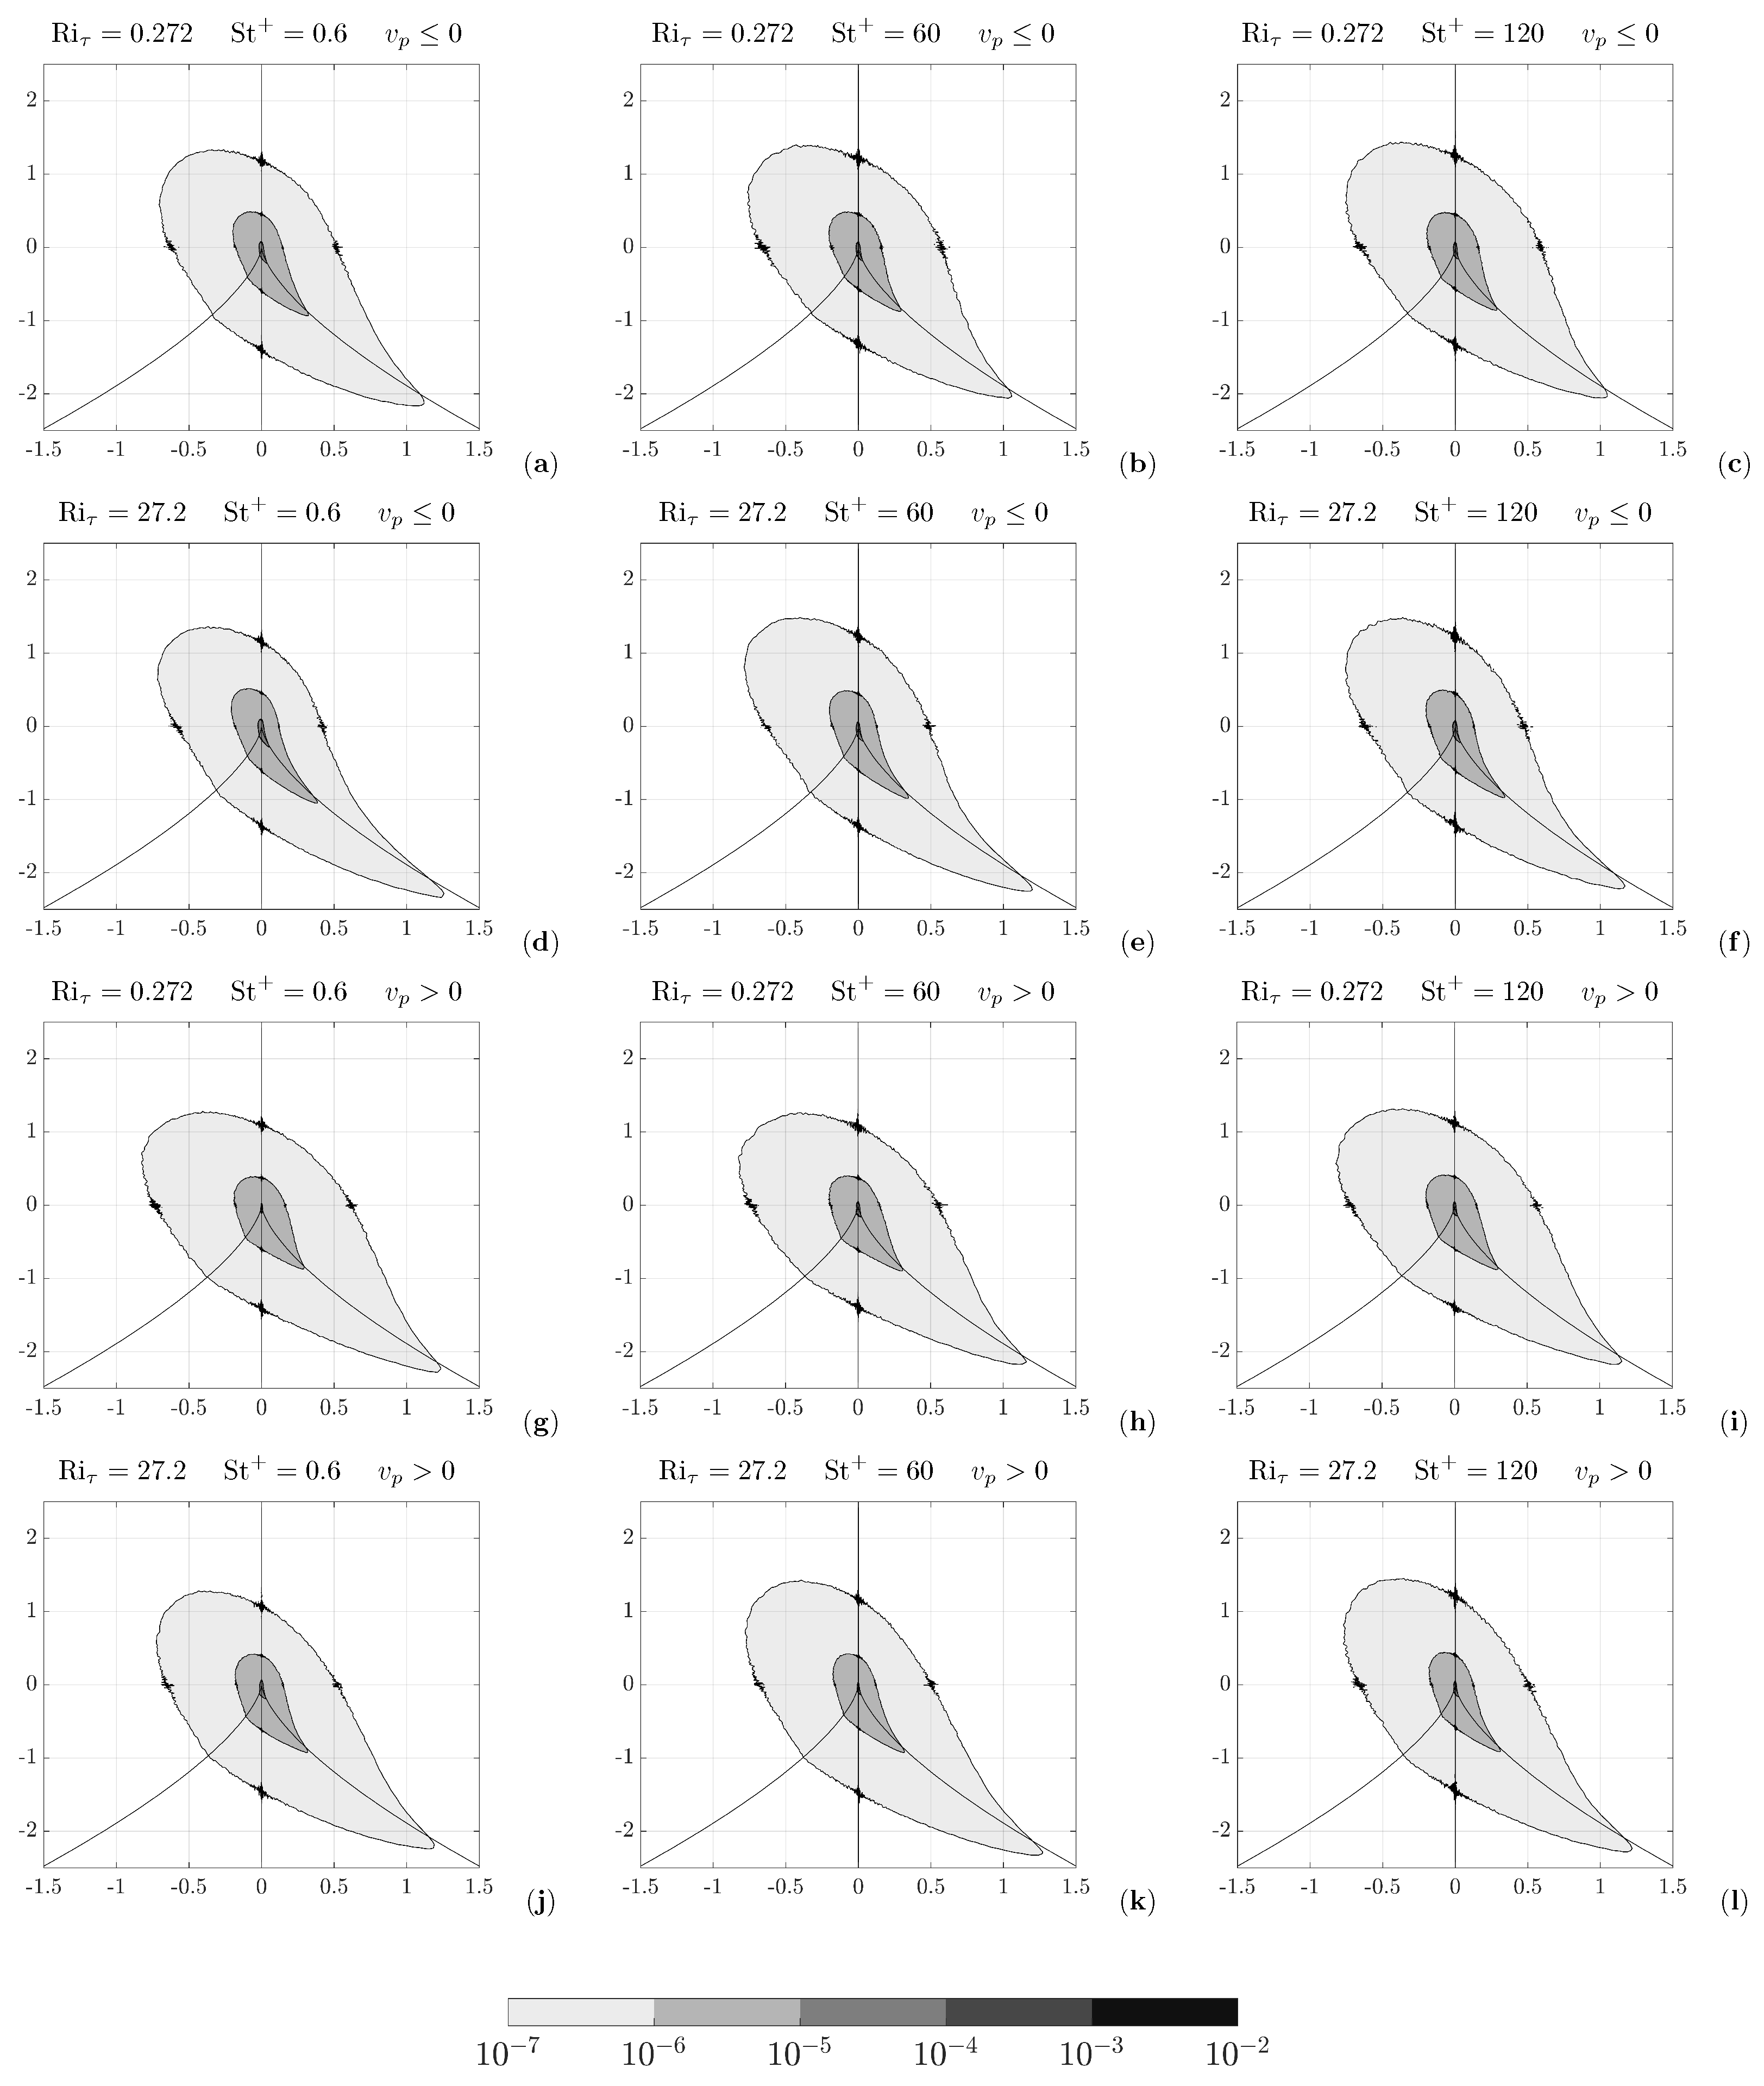
Figure 17 shows the joint-PDFs of Q and R conditionally sampled in the particle locations within the buffer layer ( 5 < y + 35 ). In all the examined cases, as the distance from the wall increases, the joint-PDFs present a more pronounced orientation towards the second and fourth quadrants, and appear to be independent of the Stokes number. The results are in line with the analysis on the flow topology, as they exhibit significant similarities to the corresponding joint-PDFs sampled at the grid points. This behavior aligns with the observation in [27], where, farther from the wall, the random dispersion of particles relative to the turbulent structures leads the joint-PDFs sampled at the particle positions to become equivalent to those sampled on a uniform grid. A weak influence of the Richardson number is observed for the particles moving towards the wall (Figure 17d,e,f). These distributions exhibit higher probability density along the D = 0 line dividing the fourth and first quadrants, accompanied by a reduction in the lobe within the first quadrant. This observation is consistent with the findings on the local topology of the region impinged by the plumes, indicating an early manifestation in the buffer layer of the topological features characteristic of regions farther from the wall.

4. Conclusions

This comprehensive investigation explored the response of inertial particles to the coherent large-scale vortical structures, known as vortex rolls, that arise in channel flow under thermal unstable stratification due to the combined effects of buoyancy and shear. Using the dataset obtained from the point-particle direct numerical simulations conducted by Zaza and Iovieno [31] on the mixed convection in particle-laden channel flows, the study aimed to evaluate the influence of vortex rolls on the spatial distribution and preferential concentration of particles with varying Stokes numbers: St + = 0.6 , St + = 60 , and St + = 120 . Two distinct regimes were analyzed, characterized by friction Richardson numbers of Ri τ = 0.272 and Ri τ = 27.2 , corresponding to bulk Richardson numbers of Ri b = 2.24 × 10 3 and Ri b = 0.283 , respectively.
In line with the current literature on wall-bounded flows under unstable stratification, our observations revealed that, as the Richardson number increased from Ri τ = 0.272 to Ri τ = 27.2 , the flow reorganized into coherent counter-rotating large vortices, aligned with the mean flow direction. These vortices were bounded in the cross-stream planes by coherent thermal plumes of upwelling hot fluid and downwelling cold fluid.
In the viscous sublayer and buffer layer, the analysis of the local flow topology through the invariants of the velocity gradient tensor revealed differential topological features between the regions where the plumes originate and the regions where the plumes impinge upon the wall. The former were dominated by vortex stretching/strain self-amplification mechanisms, while the latter were dominated by strain. In the logarithmic layer and the outer region, no significant deviation from the topology of the isothermal channel flow was observed.
The flow reorganization significantly affected the spatial distribution of inertial particles: the development of vortex rolls led to a redistribution of particles both in the wall-normal and spanwise directions, with the exception of the particles at St + = 0.6 . For the regimes characterized by the presence of the rolls, the analysis revealed a striking deviation from the commonly reported accumulation patterns in the near-wall regions. Particles exhibited a pronounced asymmetric distribution characterized by elongated clusters exclusively gathered in the wide low-speed regions where the coherent plumes originated. The near-wall regions where the coherent thermal plumes impinged exhibited a substantial depletion of particles. Particles with Stokes numbers St + = 60 and St + = 120 , which had response times closer to the characteristic timescale of the coherent motion in the cross-stream planes, exhibited the most pronounced response to the presence of the vortex rolls.
Furthermore, the topological analysis of the finest flow scales sampled by heavy particles confirmed their tendency to preferentially concentrate in strain-dominated regions, as opposed to vorticity-dominated regions. This phenomenon clarifies the predominant accumulation of particles in the regions where thermal plumes originate, coupled with their marked depletion in the regions where the plumes impinge upon the walls.
The validity of the results presented in this work is limited by the adoption of the Boussinesq approximation. Indeed, as discussed in Section 2.1, gravitational effects on particles become negligible when α Δ T is moderate, which lies beyond the formal limits of validity of the Boussinesq approximation. Nevertheless, this investigation contributes to a deeper understanding of the complex influence of coherent large-scale flow structures on the dynamics of inertial particles in wall-bounded turbulent flows under the combined effects of buoyancy and shear. The implications of the insights gained from this study extend to a wide range of applications involving particle transport and dispersion in thermally stratified environments, heat exchangers, chemical reactors, and certain geophysical flows. For instance, the large-scale circulations occurring in Earth’s mantle are characterized by the combination of Rayleigh–Bénard convection with the large-scale flow that balances the mass flux of moving lithospheric plates, as discussed in [54,55]. The interaction between buoyancy-driven convection and large-scale shear associated with plate motion tends to organize the small-scale convection within the asthenosphere, creating longitudinal convection rolls, often referred to as “Richter rolls” [55]. The accumulation patterns exhibited by the dispersed phase in our study, with marked difference between impinging and emerging zones of thermal plumes, could find physical evidence in the streaky and elongated nature of the mantle mass–density distribution documented in [56]. The observed density distribution anomalies can potentially be explained as the result of the convective transport of crystallizing portions of the mantle in the early stages of Earth’s lithosphere formation.

Author Contributions

Conceptualization, D.Z. and M.I.; methodology, D.Z. and M.I.; software, D.Z.; formal analysis, D.Z. and M.I.; investigation, D.Z. and M.I.; writing—original draft preparation, D.Z. and M.I.; writing—review and editing, D.Z. and M.I.; visualization, D.Z.; supervision, M.I. All authors have read and agreed to the published version of the manuscript.

Funding

This research received no external funding.

Data Availability Statement

The data that support the findings of this study are available from the authors upon reasonable request.

Acknowledgments

The authors acknowledge the CINECA award under the ISCRA initiative (Project HP10CIUF9S), for the availability of high-performance computing resources and support. Additional resources were provided by HPC@POLITO (http://www.hpc.polito.it accessed on 4 May 2024).

Conflicts of Interest

The authors declare no conflict of interest.

References

  1. Arya, S.P.S. Buoyancy effects in a horizontal flat-plate boundary layer. J. Fluid Mech. 1975, 68, 321–343. [Google Scholar] [CrossRef]
  2. Komori, S.; Ueda, H.; Ogino, F.; Mizushina, T. Turbulence structure in stably stratified open-channel flow. J. Fluid Mech. 1983, 130, 13–26. [Google Scholar] [CrossRef]
  3. Garg, R.P.; Ferziger, J.H.; Monismith, S.G.; Koseff, J.R. Stably stratified turbulent channel flows. I. Stratification regimes and turbulence suppression mechanism. Phys. Fluids 2000, 12, 2569–2594. [Google Scholar] [CrossRef]
  4. Iida, O.; Kasagi, N.; Nagano, Y. Direct numerical simulation of turbulent channel flow under stable density stratification. Int. J. Heat Mass Transf. 2002, 45, 1693–1703. [Google Scholar] [CrossRef]
  5. Armenio, V.; Sarkar, S. An investigation of stably stratified turbulent channel flow using large-eddy simulation. J. Fluid Mech. 2002, 459, 1–42. [Google Scholar] [CrossRef]
  6. Moestam, R.; Davidson, L. Numerical simulations of a thermocline in a pressure-driven flow between two infinite horizontal plates. Phys. Fluids 2005, 17, 075109. [Google Scholar] [CrossRef]
  7. García-Villalba, M.; del Álamo, J.C. Turbulence modification by stable stratification in channel flow. Phys. Fluids 2011, 23, 045104. [Google Scholar] [CrossRef]
  8. Zonta, F.; Onorato, M.; Soldati, A. Turbulence and internal waves in stably-stratified channel flow with temperature-dependent fluid properties. J. Fluid Mech. 2012, 697, 175–203. [Google Scholar] [CrossRef]
  9. Mizushina, T.; Ogino, F.; Katada, N. Ordered motion of turbulence in a thermally stratified flow under unstable conditions. Int. J. Heat Mass Transf. 1982, 25, 1419–1425. [Google Scholar] [CrossRef]
  10. Fukui, K.; Nakajima, M. Unstable stratification effects on turbulent shear flow in the wall region. Int. J. Heat Mass Transf. 1985, 28, 2343–2352. [Google Scholar] [CrossRef]
  11. Domaradzki, J.A.; Metcalfe, R.W. Direct numerical simulations of the effects of shear on turbulent Rayleigh-Bénard convection. J. Fluid Mech. 1988, 193, 499–531. [Google Scholar] [CrossRef]
  12. Fukui, K.; Nakajima, M.; Ueda, H. Coherent structure of turbulent longitudinal vortices in unstably-stratified turbulent flow. Int. J. Heat Mass Transf. 1991, 34, 2373–2385. [Google Scholar] [CrossRef]
  13. Iida, O.; Kasagi, N. Direct Numerical Simulation of Unstably Stratified Turbulent Channel Flow. J. Heat Transf. 1997, 119, 53–61. [Google Scholar] [CrossRef]
  14. Zonta, F.; Soldati, A. Effect of Temperature Dependent Fluid Properties on Heat Transfer in Turbulent Mixed Convection. J. Heat Transf. 2013, 136, 022501. [Google Scholar] [CrossRef]
  15. Sid, S.; Dubief, Y.; Terrapon, V.E. Direct Numerical Simulation of Mixed Convection in Turbulent Channel Flow: On the Reynolds number dependency of momentum and heat transfer under unstable stratification. In Proceedings of the 8th International Conference on Computational Heat and Mass Transfer, Istanbul, Turkey, 25–28 May 2015; p. 190. [Google Scholar]
  16. Pirozzoli, S.; Bernardini, M.; Verzicco, R.; Orlandi, P. Mixed convection in turbulent channels with unstable stratification. J. Fluid Mech. 2017, 821, 482–516. [Google Scholar] [CrossRef]
  17. Zaza, D.; Iovieno, M. Mixed convection in turbulent particle-laden channel flow at Reτ = 180. J. Phys. Conf. Ser. 2024, 2685, 012003. [Google Scholar] [CrossRef]
  18. Mori, Y.; Uchida, Y. Forced convective heat transfer between horizontal flat plates. Int. J. Heat Mass Transf. 1966, 9, 803–817. [Google Scholar] [CrossRef]
  19. Fukui, K.; Nakajima, M.; Ueda, H. The longitudinal vortex and its effects on the transport processes in combined free and forced laminar convection between horizontal and inclined parallel plates. Int. J. Heat Mass Transf. 1983, 26, 109–120. [Google Scholar] [CrossRef]
  20. Cossu, C. Onset of large-scale convection in wall-bounded turbulent shear flows. J. Fluid Mech. 2022, 945, A33. [Google Scholar] [CrossRef]
  21. Brooke, J.W.; Kontomaris, K.; Hanratty, T.J.; McLaughlin, J.B. Turbulent deposition and trapping of aerosols at a wall. Phys. Fluids A Fluid Dyn. 1992, 4, 825–834. [Google Scholar] [CrossRef]
  22. Pedinotti, S.; Mariotti, G.; Banerjee, S. Direct numerical simulation of particle behaviour in the wall region of turbulent flows in horizontal channels. Int. J. Multiph. Flow 1992, 18, 927–941. [Google Scholar] [CrossRef]
  23. Marchioli, C.; Soldati, A. Mechanisms for particle transfer and segregation in a turbulent boundary layer. J. Fluid Mech. 2002, 468, 283–315. [Google Scholar] [CrossRef]
  24. Squires, K.D.; Eaton, J.K. Particle response and turbulence modification in isotropic turbulence. Phys. Fluids A Fluid Dyn. 1990, 2, 1191–1203. [Google Scholar] [CrossRef]
  25. Wang, L.P.; Maxey, M.R. The Motion of Microbubbles in a Forced Isotropic and Homogeneous Turbulence. Appl. Sci. Res. 1993, 51, 291–296. [Google Scholar] [CrossRef]
  26. Fessler, J.R.; Kulick, J.D.; Eaton, J.K. Preferential concentration of heavy particles in a turbulent channel flow. Phys. Fluids 1994, 6, 3742–3749. [Google Scholar] [CrossRef]
  27. Rouson, D.W.I.; Eaton, J.K. On the preferential concentration of solid particles in turbulent channel flow. J. Fluid Mech. 2001, 428, 149–169. [Google Scholar] [CrossRef]
  28. Aliseda, A.; Cartellier, A.; Hainaux, F.; Lasheras, J. Effect of preferential concentration on the settling velocity of heavy particles in homogeneous isotropic turbulence. J. Fluid Mech. 2002, 468, 77–105. [Google Scholar] [CrossRef]
  29. Sardina, G.; Schlatter, P.; Brandt, L.; Picano, F.; Casciola, C. Wall accumulation and spatial localization in particle-laden wall flows. J. Fluid Mech. 2012, 699, 50–78. [Google Scholar] [CrossRef]
  30. Petersen, A.J.; Baker, L.; Coletti, F. Experimental study of inertial particles clustering and settling in homogeneous turbulence. J. Fluid Mech. 2019, 864, 925–970. [Google Scholar] [CrossRef]
  31. Zaza, D.; Iovieno, M. Mixed convection in a particle-laden channel flow: One and two-way coupling regimes. In Progress in Turbulence X; Springer Proceedings in Physics; Örlü, R., Talamelli, A., Peinke, J., Eds.; Springer International Publishing: Cham, Switzerland, 2024; Volume 1066. [Google Scholar] [CrossRef]
  32. Blackburn, H.M.; Mansour, N.N.; Cantwell, B.J. Topology of fine-scale motions in turbulent channel flow. J. Fluid Mech. 1996, 310, 269–292. [Google Scholar] [CrossRef]
  33. Chong, M.S.; Perry, A.E.; Cantwell, B.J. A general classification of three-dimensional flow fields. Phys. Fluids A Fluid Dyn. 1990, 2, 765–777. [Google Scholar] [CrossRef]
  34. Picciotto, M.; Marchioli, C.; Soldati, A. Characterization of near-wall accumulation regions for inertial particles in turbulent boundary layers. Phys. Fluids 2005, 17, 098101. [Google Scholar] [CrossRef]
  35. Bijlard, M.; Oliemans, R.; Portela, L.; Ooms, G. Direct numerical simulation analysis of local flow topology in a particle-laden turbulent channel flow. J. Fluid Mech. 2010, 653, 35–56. [Google Scholar] [CrossRef]
  36. Kuerten, J.G.M. Point-Particle DNS and LES of Particle-Laden Turbulent flow-a state-of-the-art review. Flow Turbul. Combust. 2016, 97, 689–713. [Google Scholar] [CrossRef]
  37. Maxey, M.R.; Riley, J.J. Equation of motion for a small rigid sphere in a nonuniform flow. Phys. Fluids 1983, 26, 883–889. [Google Scholar] [CrossRef]
  38. Armenio, V.; Fiorotto, V. The importance of the forces acting on particles in turbulent flows. Phys. Fluids 2001, 13, 2437–2440. [Google Scholar] [CrossRef]
  39. Arcen, B.; Tanière, A.; Khalij, M. Heat transfer in a turbulent particle-laden channel flow. Int. J. Heat Mass Transf. 2012, 55, 6519–6529. [Google Scholar] [CrossRef]
  40. Kuerten, J.G.M.; van der Geld, C.W.M.; Geurts, B.J. Turbulence modification and heat transfer enhancement by inertial particles in turbulent channel flow. Phys. Fluids 2011, 23, 123301. [Google Scholar] [CrossRef]
  41. Zonta, F.; Marchioli, C.; Soldati, A. Direct numerical simulation of turbulent heat transfer modulation in micro-dispersed channel flow. Acta Mech. 2008, 195, 305–326. [Google Scholar] [CrossRef]
  42. Morsi, S.A.; Alexander, A.J. An investigation of particle trajectories in two-phase flow systems. J. Fluid Mech. 1972, 55, 193–208. [Google Scholar] [CrossRef]
  43. Pan, Y.; Banerjee, S. Numerical simulation of particle interactions with wall turbulence. Phys. Fluids 1996, 8, 2733–2755. [Google Scholar] [CrossRef]
  44. Elghobashi, S.E. On predicting particle-laden turbulent flows. Flow Turbul. Combust. 1994, 52, 309–329. [Google Scholar] [CrossRef]
  45. Zaza, D.; Iovieno, M. On the Preferential Concentration of Particles in Turbulent Channel Flow: The Effect of the Added-Mass Factor. Energies 2024, 17, 783. [Google Scholar] [CrossRef]
  46. Lozano-Durán, A.; Holzner, M.; Jiménez, J. Multiscale analysis of the topological invariants in the logarithmic region of turbulent channels at a friction Reynolds number of 932. J. Fluid Mech. 2016, 803, 356–394. [Google Scholar] [CrossRef]
  47. Carbone, M.; Bragg, A.D. Is vortex stretching the main cause of the turbulent energy cascade? J. Fluid Mech. 2020, 883, R2. [Google Scholar] [CrossRef]
  48. Smith, C.R.; Metzler, S.P. The characteristics of low-speed streaks in the near-wall region of a turbulent boundary layer. J. Fluid Mech. 1983, 129, 27–54. [Google Scholar] [CrossRef]
  49. Chernyshenko, S.; Baig, M. The mechanism of streak formation in near-wall turbulence. J. Fluid Mech. 2005, 544, 99–131. [Google Scholar] [CrossRef]
  50. Reeks, M.W. The transport of discrete particles in inhomogeneous turbulence. J. Aerosol Sci. 1983, 14, 729–739. [Google Scholar] [CrossRef]
  51. Young, J.B.; Hanratty, T.J. Trapping of solid particles at a wall in a turbulent flow. AIChE J. 1991, 37, 1529–1536. [Google Scholar] [CrossRef]
  52. Eaton, J.; Fessler, J. Preferential concentration of particles by turbulence. Int. J. Multiph. Flow 1994, 20, 169–209. [Google Scholar] [CrossRef]
  53. Brandt, L.; Coletti, F. Particle-Laden Turbulence: Progress and Perspectives. Annu. Rev. Fluid Mech. 2022, 54, 159–189. [Google Scholar] [CrossRef]
  54. Richter, F.M. Convection and the large-scale circulation of the mantle. J. Geophys. Res. 1973, 78, 8735–8745. [Google Scholar] [CrossRef]
  55. Richter, F.M.; Parsons, B. On the interaction of two scales of convection in the mantle. J. Geophys. Res. 1975, 80, 2529–2541. [Google Scholar] [CrossRef]
  56. Panet, I.; Pajot-Métivier, G.; Greff-Lefftz, M.; Métivier, L.; Diament, M.; Mandea, M. Mapping the mass distribution of Earth’s mantle using satellite-derived gravity gradients. Nat. Geosci. 2014, 7, 131–135. [Google Scholar] [CrossRef]
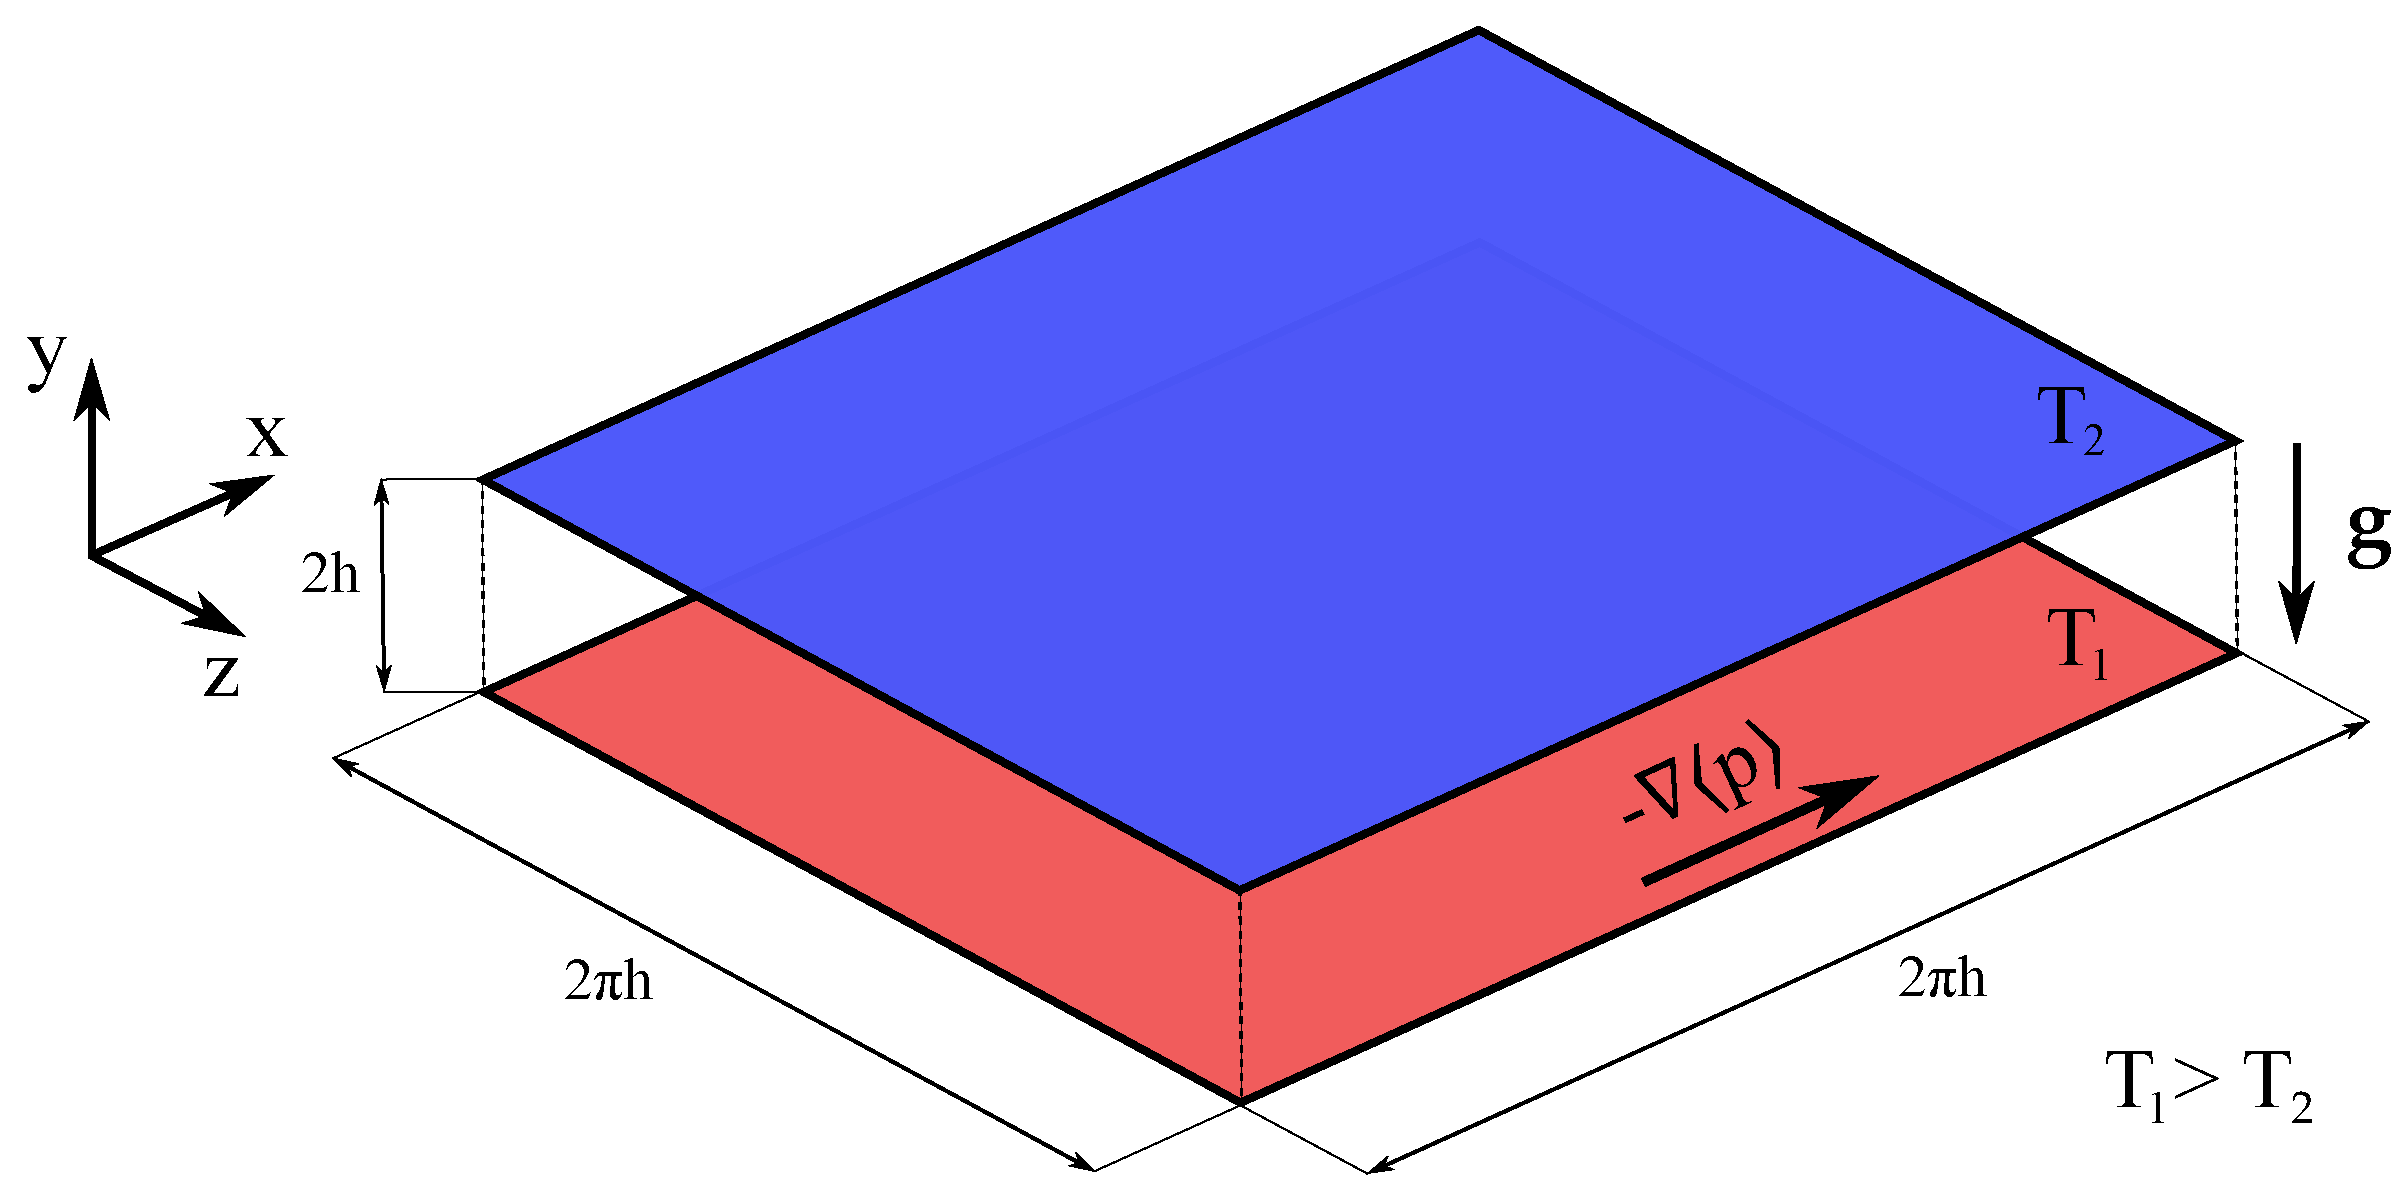
Figure 1. Plane channel flow under unstable stratification conditions.
Energies 17 02725 g001
Figure 2. Phase-space of Q and R, respectively, the second and third invariants of the velocity gradient tensor (VGT), as shown in Blackburn et al. [32]. The cusp represents the curve where the discriminant D = 4 Q 3 27 R 2 of the characteristic polynomial of the velocity gradient tensor is zero. Dashed curves represent contours of constant discriminant value.
Energies 17 02725 g002
Figure 3. Time-averaged temperature field ϑ ( x ) in the plane at x = π (perpendicular to the flow direction) for Ri τ = 0.272 (a), and Ri τ = 27.2 (b). Streamlines representing the time-averaged components of the fluid velocity ( w , v ) are superimposed on the temperature visualization.
Energies 17 02725 g003
Figure 4. Time average of (a) the temperature field ϑ ( x ) and (b) the streamwise velocity u ( x ) in the central wall-parallel plane of the channel for Ri τ = 27.2 .
Energies 17 02725 g004
Figure 5. Normalized spanwise spectral density of (a) streamwise velocity u, (b) wall-normal velocity v, (c) spanwise velocity w, and (d) temperature ϑ , plotted as a function of the spanwise wavelength λ z = 2 π / k z at the centerline of the channel ( y + = 180 ). The spectral densities are normalized by their respective integrals over the spanwise wavenumber k z domain, as denoted by the circumflex ( · ^ ) symbol.
Energies 17 02725 g005
Figure 6. Pre-multiplied spanwise spectral densities of (a) streamwise velocity u, (b) wall-normal velocity v, (c) spanwise velocity w, and (d) temperature ϑ , plotted as a function of the spanwise wavelength λ z = 2 π / k z at y + = 19.62 from the wall. The spectral densities are pre-multiplied by the spanwise wavenumber k z . The dashed curve refers to the pure forced convection case examined in Zaza and Iovieno [17].
Energies 17 02725 g006
Figure 7. Joint-PDFs of Q and R sampled at the computational grid points belonging to the quadrant of the channel where coherent thermal plumes, observed only for Ri τ = 27.2 , emerge from the walls. For the sampling, various distances from the wall are considered: (a,b) 0 < y + 5 , (c,d) 5 < y + 35 , (e,f) 35 < y + 60 , and (g,h) 60 < y + 180 . The x-axes represent R / Re τ 3 / 2 , and the y-axes represent Q / Re τ . Results are shown for both the Richardson numbers simulated.
Energies 17 02725 g007
Figure 8. Joint-PDFs of Q and R sampled at the computational grid points belonging to the quadrant of the channel where coherent thermal plumes, observed for Ri τ = 27.2 , impinge upon the walls. For the sampling, various distances from the wall are considered: (a,b) 0 < y + 5 , (c,d) 5 < y + 35 , (e,f) 35 < y + 60 , and (g,h) 60 < y + 180 . The x-axes represent R / Re τ 3 / 2 , and the y-axes represent Q / Re τ . Results are shown for both the Richardson numbers simulated.
Energies 17 02725 g008
Figure 9. Time-averaged particle concentration n as a function of y + . Results are shown at Ri τ = 0.272 and Ri τ = 27.2 for various Stokes numbers: (a) St + = 0.6 , (b) St + = 60 , and (c) St + = 120 .
Energies 17 02725 g009
Figure 10. Particle concentration variance n n as a function of y + . Results are shown at Ri τ = 0.272 and Ri τ = 27.2 for various Stokes numbers: (a) St + = 0.6 , (b) St + = 60 , and (c) St + = 120 .
Energies 17 02725 g010
Figure 11. Instantaneous spatial distribution of particles (shown out of scale) in the region comprised between the wall-parallel planes at y + = 4.75 and y + = 5.20 from the lower wall. The background shows the fluctuations u of the fluid streamwise velocity at y + 5 . The panels (a,c,e) refer to the cases at Ri τ = 0.272 , while the panels (b,d,f) refer to the cases at Ri τ = 27.2 .
Energies 17 02725 g011
Figure 12. Instantaneous spatial distribution of particles (shown out of scale) in the region comprised between the cross-stream planes at x = π 0.0164 and x = π + 0.0164 . The background depicts the fluctuations w of the fluid spanwise velocity at x = π . The particles are shown at a constant Stokes number, St + = 60 , for two different Richardson numbers: (a) Ri τ = 0.272 and (b) Ri τ = 27.2 .
Energies 17 02725 g012
Figure 13. Deviation Δ I plotted against the wall-normal coordinate in wall units ( y + ) for the three Stokes numbers examined. The quantity Δ I is defined as the difference between the ratios I = n n / n 2 evaluated at Ri τ = 27.2 and Ri τ = 0.272 for a fixed Stokes number.
Energies 17 02725 g013
Figure 14. (a,c,e) Correlation coefficient between particle concentration, n, and the streamwise velocity, u, plotted against the wall-normal coordinate in wall-units, y + . (b,d,f) Correlation coefficient between particle concentration and the wall-normal velocity, v, plotted against y + . Correlations are shown for the three Stokes numbers examined: St + = 0.6 (a,b), St + = 60 (c,d), and St + = 120 (e,f).
Energies 17 02725 g014
Figure 15. Cross-stream plane distribution of the mean particle concentration, n ( y , z ) , averaged along the streamwise direction x, for the case with friction Richardson number Ri τ = 27.2 and Stokes number St + = 60 .
Energies 17 02725 g015
Figure 16. Joint-PDFs of the invariants Q and R, conditionally sampled at particle locations within the viscous sublayer ( 0 y + 5 ) for different Stokes numbers: St + = 0.6 (a,d,g,j), St + = 60 (b,e,h,k), and St + = 120 (c,f,i,l). Both the friction Richardson numbers, Ri τ = 0.272 and Ri τ = 27.2 , are showcased. The x-axes represent R / Re τ 3 / 2 , and the y-axes represent Q / Re τ . Particle conditional sampling is based on the direction of their motion: towards the walls ( v p 0 , panels (af)) and away from the walls ( v p > 0 , panels (gl)). Contour levels of the joint-PDFs are shown for every decade in the range from 10 7 to 10 2 .
Energies 17 02725 g016
Figure 17. Joint-PDFs of the invariants Q and R, conditionally sampled at particle locations within the buffer layer ( 5 < y + 35 ) for different Stokes numbers: St + = 0.6 (a,d,g,j), St + = 60 (b,e,h,k), and St + = 120 (c,f,i,l). Both the friction Richardson numbers, Ri τ = 0.272 and Ri τ = 27.2 , are showcased. The x-axes represent R / Re τ 3 / 2 , and the y-axes represent Q / Re τ . Particle conditional sampling is based on the direction of their motion: towards the walls ( v p 0 , panels (af)) and away from the walls ( v p > 0 , panels (gl)). Contour levels of the joint-PDFs are shown for every decade in the range from 10 7 to 10 2 .
Energies 17 02725 g017
Table 1. Parameters of the point-particle direct numerical simulations (PP-DNS) performed in [31] for particle-laden turbulent channel flows under unstable stratification. The friction Reynolds number, Prandtl number, number of particles, and the non-dimensional particle radius remained constant across all simulations: Re τ = 180 , Pr = 0.71 , N p = 22,000,000 , and r = 6 × 10 4 , respectively. Here, Ri τ and Ri b represent the friction and bulk Richardson numbers, Re b is the bulk Reynolds number, while St + and ρ p denote the Stokes number and non-dimensional particle density, respectively. The following relations hold: Re b = 2 Re τ u b / u τ , Ri b = 2 Ri τ u τ / u b 2 .
Re τ Ri τ Re b Ri b St + ρ p
Run 11800.2725606 2.24 × 10 3 0.6 2.31 × 10 2
Run 21800.2725606 2.24 × 10 3 60 2.31 × 10 4
Run 31800.2725606 2.24 × 10 3 120 4.63 × 10 4
Run 418027.24984 2.83 × 10 1 0.6 2.31 × 10 2
Run 518027.24984 2.83 × 10 1 60 2.31 × 10 4
Run 618027.24984 2.83 × 10 1 120 4.63 × 10 4
Table 2. Comparative analysis between the particle response times ( τ p ) and the characteristic timescales of vortex rolls ( τ R ) across different Stokes numbers ( St + ). The ratios τ p / τ R and their absolute difference from unity, 1 τ p / τ R , are also presented, highlighting the relative response of particles to the large-scale longitudinal vortices within the ( z , y ) planes.
St + τ p τ R τ p / τ R 1 τ p / τ R
0.6 3.33 × 10 3 0.477 6.99 × 10 3 0.993
60 0.333 0.477 0.699 0.301
120 0.667 0.477 1.397 0.397
Disclaimer/Publisher’s Note: The statements, opinions and data contained in all publications are solely those of the individual author(s) and contributor(s) and not of MDPI and/or the editor(s). MDPI and/or the editor(s) disclaim responsibility for any injury to people or property resulting from any ideas, methods, instructions or products referred to in the content.