1. Introduction
Ball mills play a crucial role in the mineral-processing industry, primarily for particle size reduction and liberation of valuable minerals from ores [
1,
2]. This process is essential, as it directly influences the efficiency and effectiveness of subsequent extraction and beneficiation stages [
3]. Studies have demonstrated that the mechanical forces in ball mills facilitate the breakage and fracturing of ore particles, leading to enhanced mineral liberation. Moreover, the design and operational parameters of ball mills, such as the size and density of the grinding media [
4], rotational speed [
5], and the milling environment [
6], significantly impact the milling performance and the energy efficiency of the process. This underscores the importance of optimizing ball milling conditions to achieve the desired mineral processing outcomes.
Effective scaling of these mills from laboratory to industrial scale is crucial for optimizing the design and operation of mineral processing circuits. However, scaling ball mills presents significant challenges due to the complex dynamics of the milling process and the need to maintain consistent energy transfer and milling performance across different scales [
7,
8].
Previous studies have investigated various approaches to ball mill scaling, including the use of population balance models (PBMs) [
7], empirical energy–size reduction relationships [
9], and mechanistic models based on the discrete element method (DEM) [
10,
11]. However, these approaches often rely on assumptions that may not hold across different scales, such as the perfect mixing of grinding media and particles [
12]. Additionally, factors such as liner wear [
13,
14], particle shape [
15], and grinding medium optimization [
16,
17] further complicate the scaling process.
The energy efficiency of ball mills is typically low, with only 1–5% of the input energy used for particle breakage while the rest is lost as heat [
18]. The power draw of a ball mill is determined by the charge motion inside the mill, which is influenced by factors such as mill speed, ball filling, and lifter design [
19,
20,
21]. Discrete element method (DEM) simulations have provided detailed insights into the collision energies and forces inside ball mills, revealing the spatial and temporal distribution of energy dissipation [
19,
21,
22,
23].
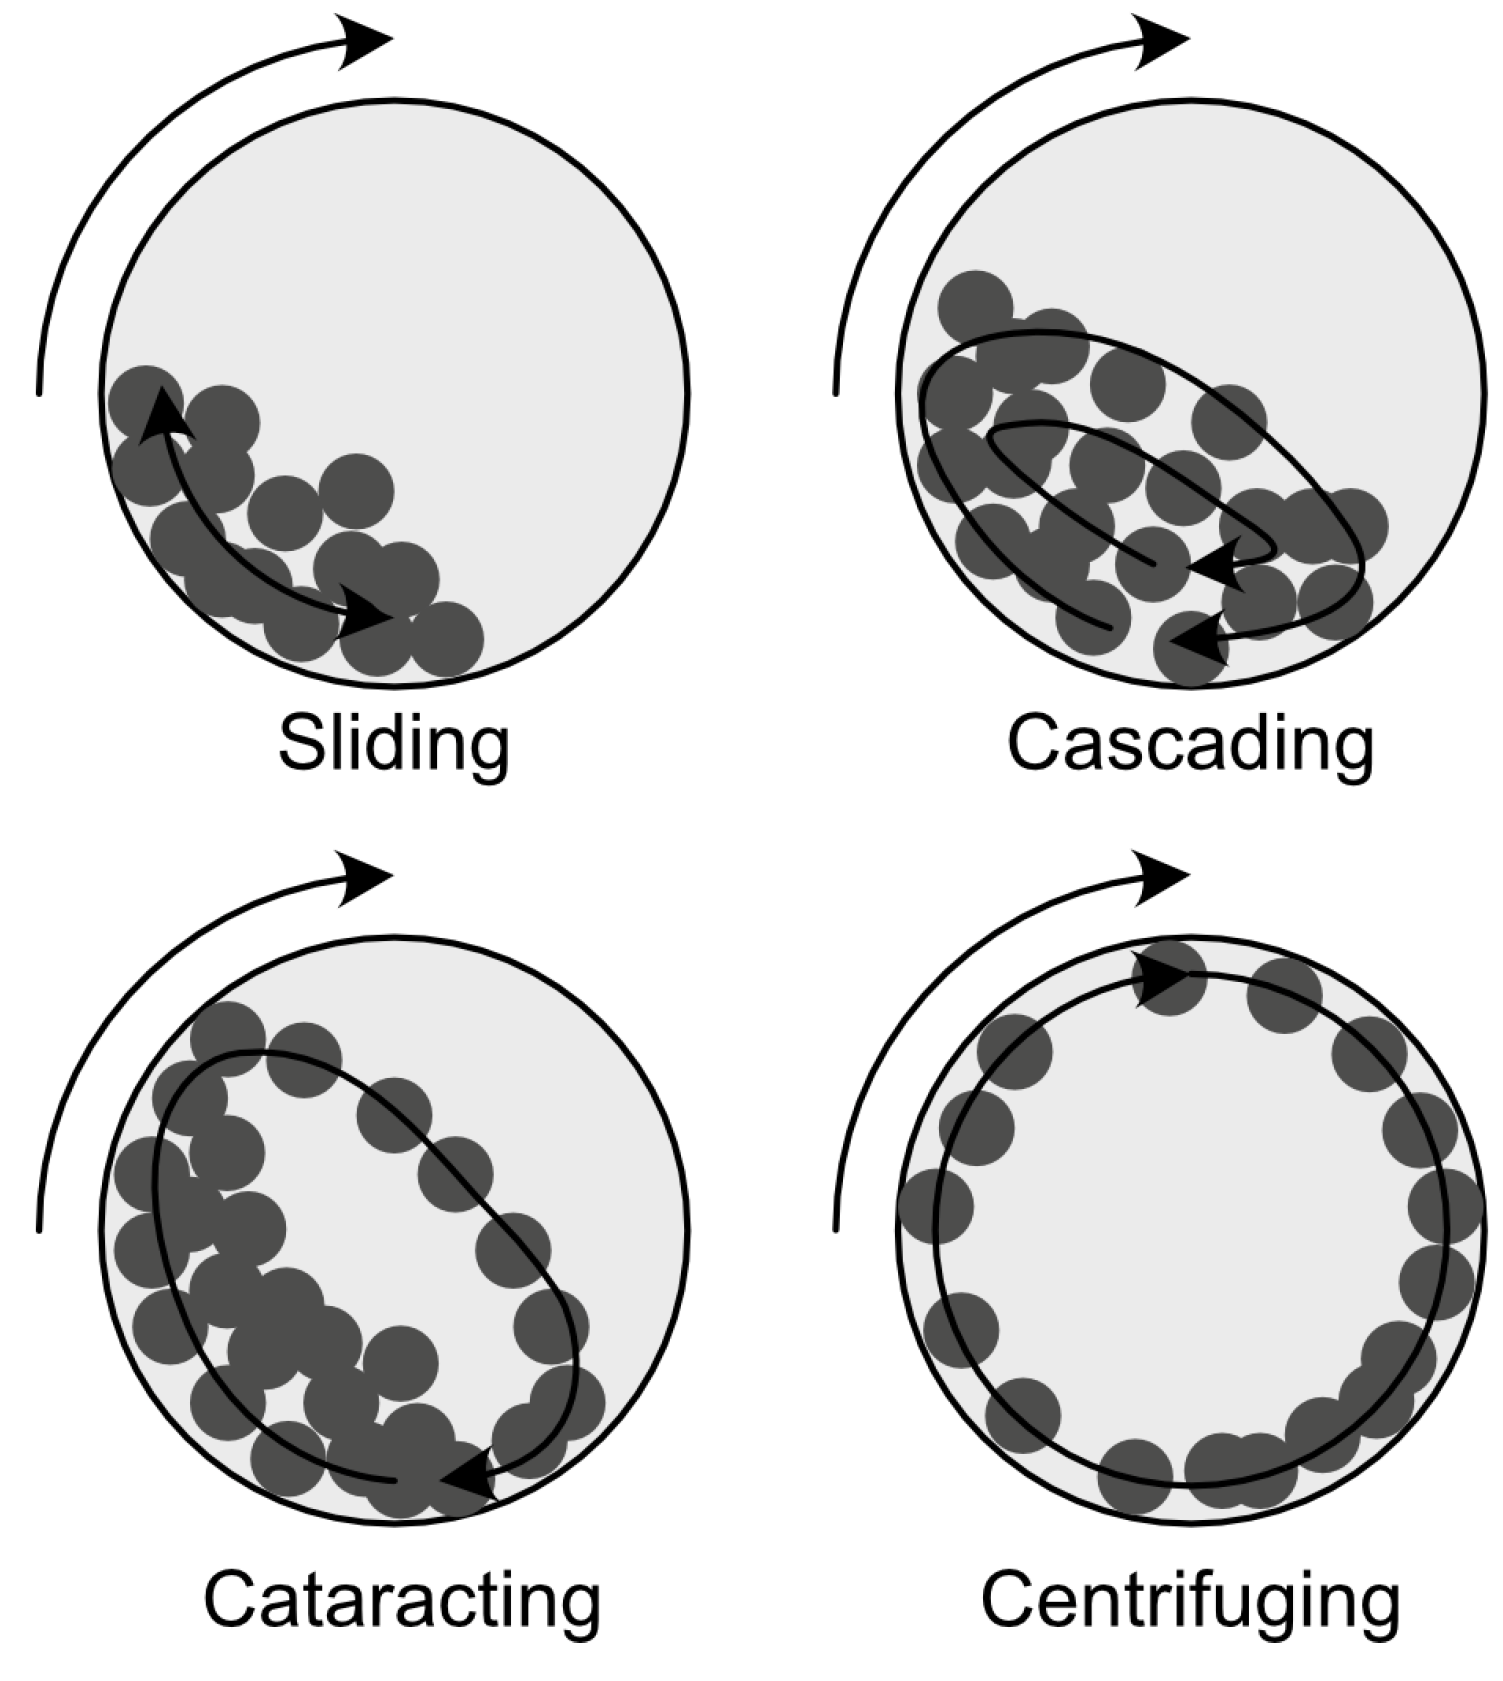
The type of charge motion in a ball mill significantly influences the grinding efficiency and energy utilization. The main types of charge motion (
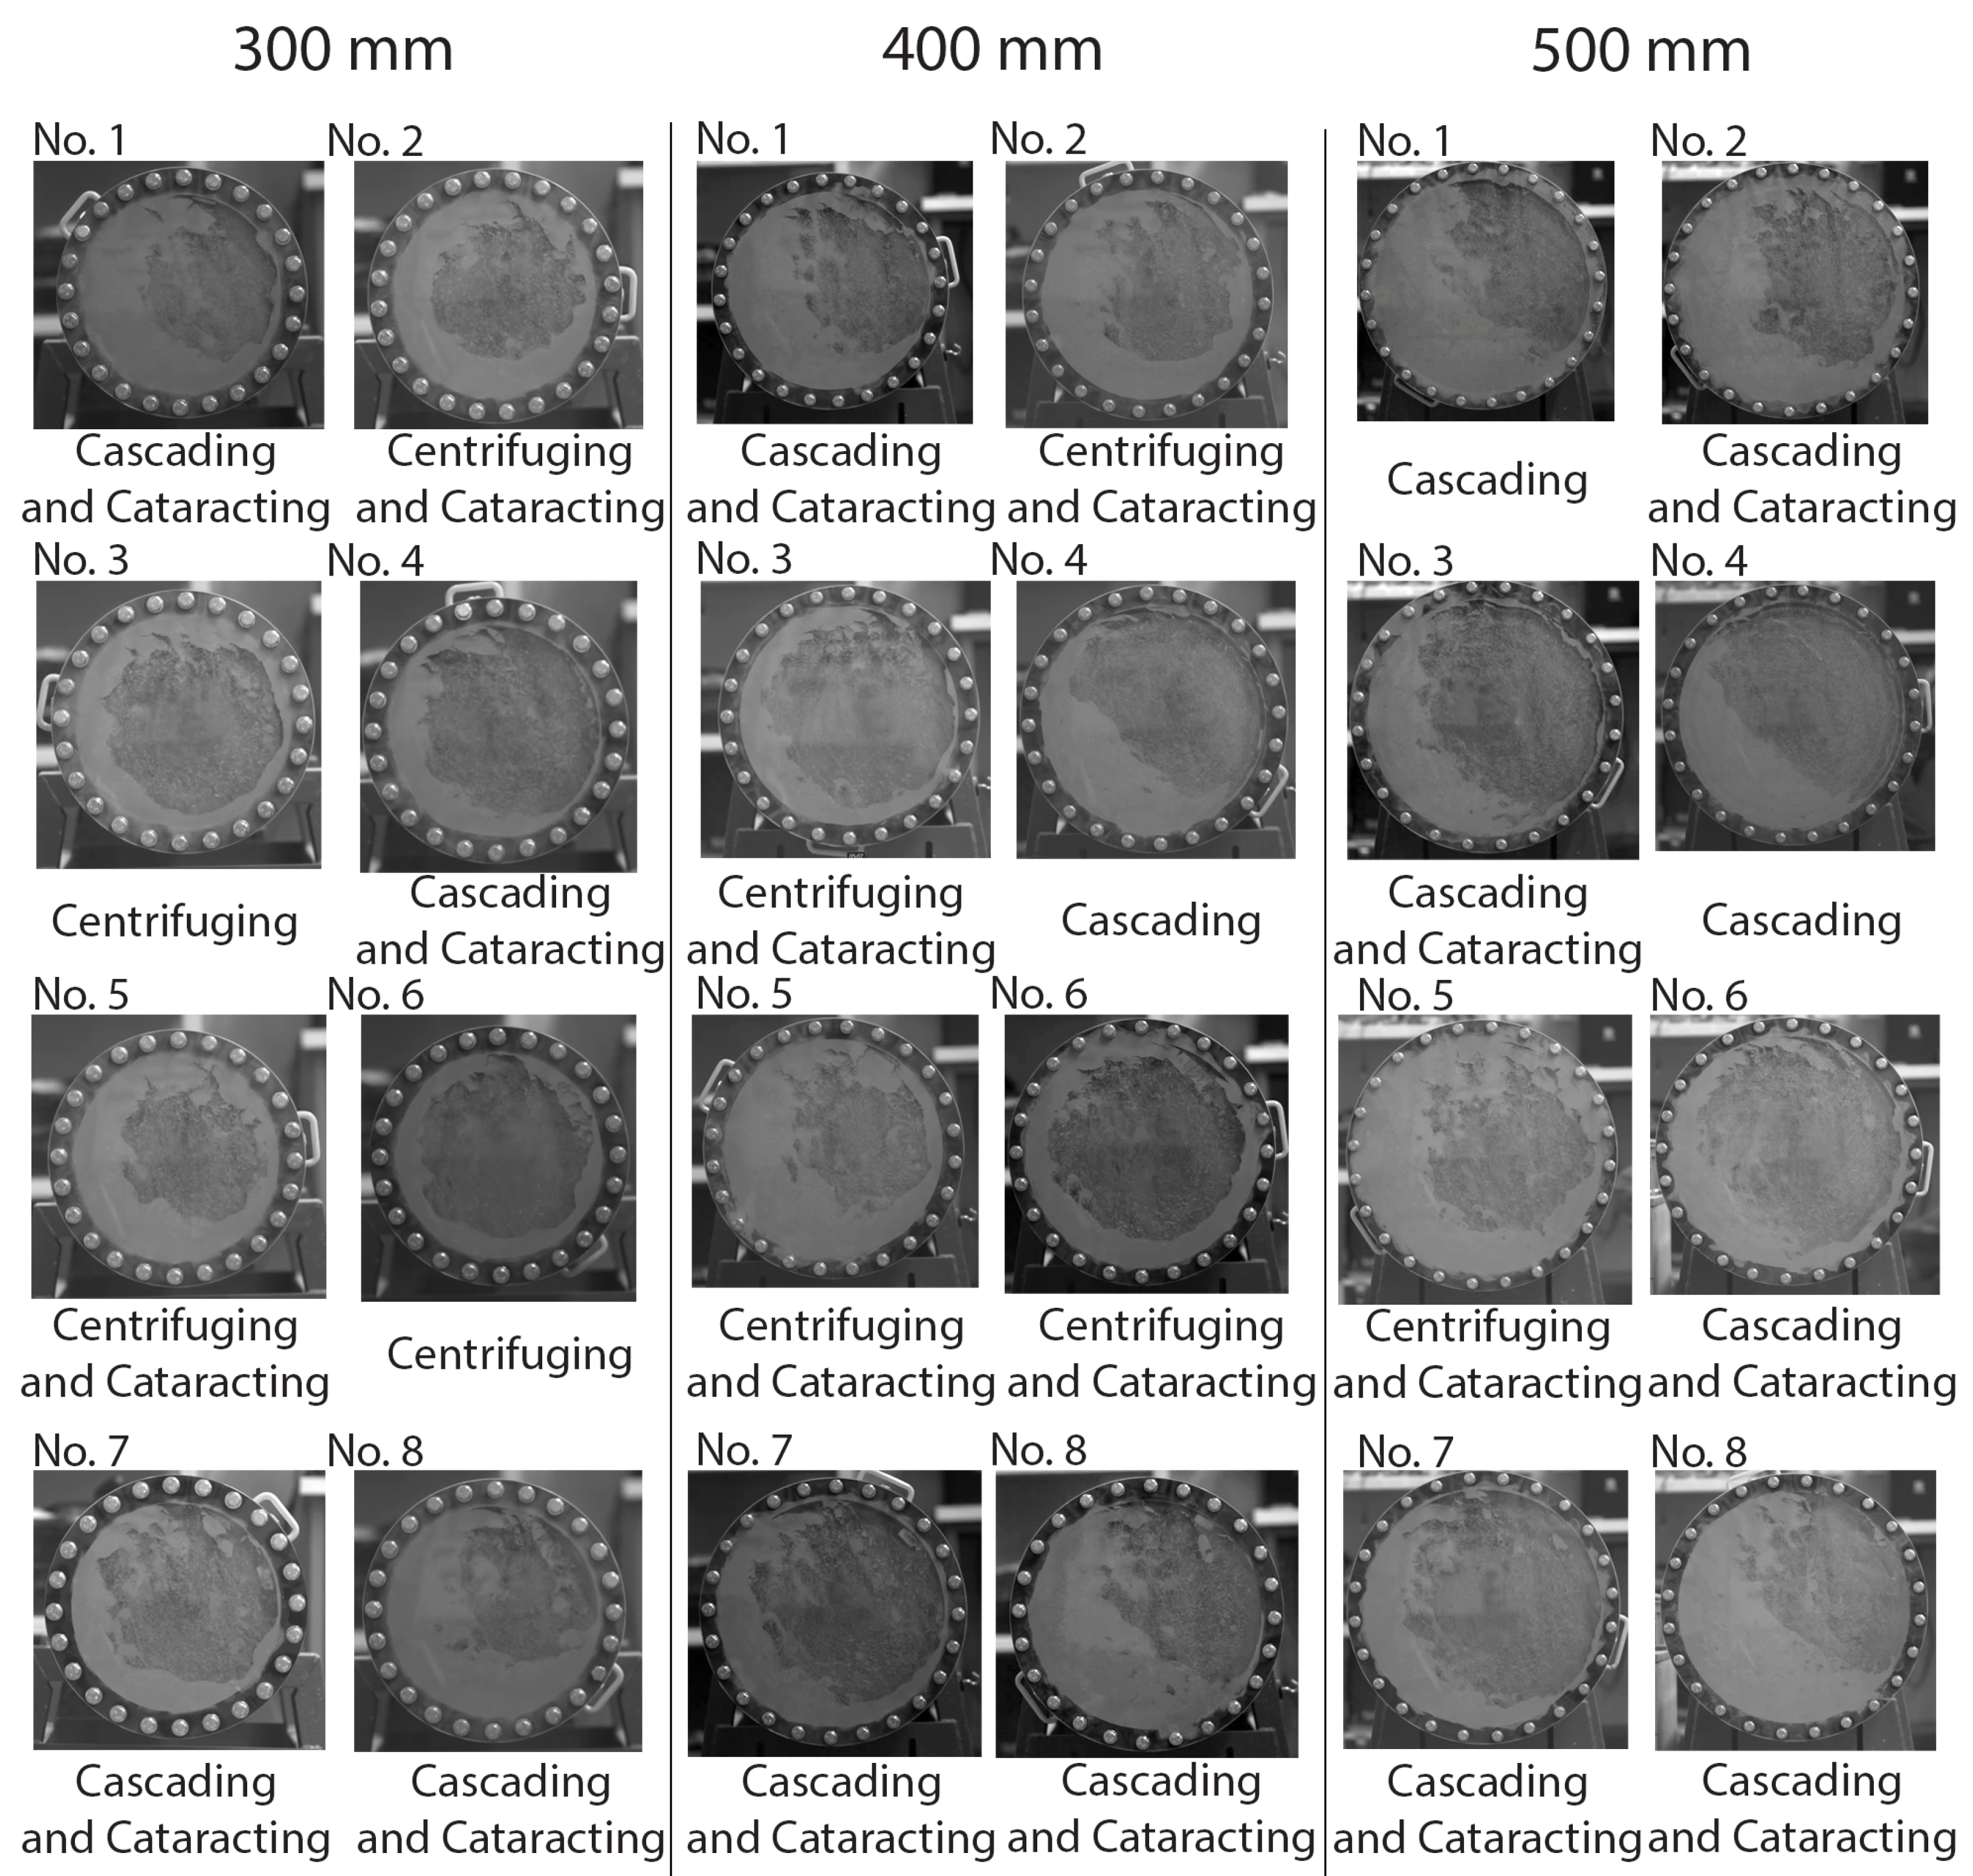
Figure 1) observed in ball mills are sliding, cascading, cataracting, and centrifuging (
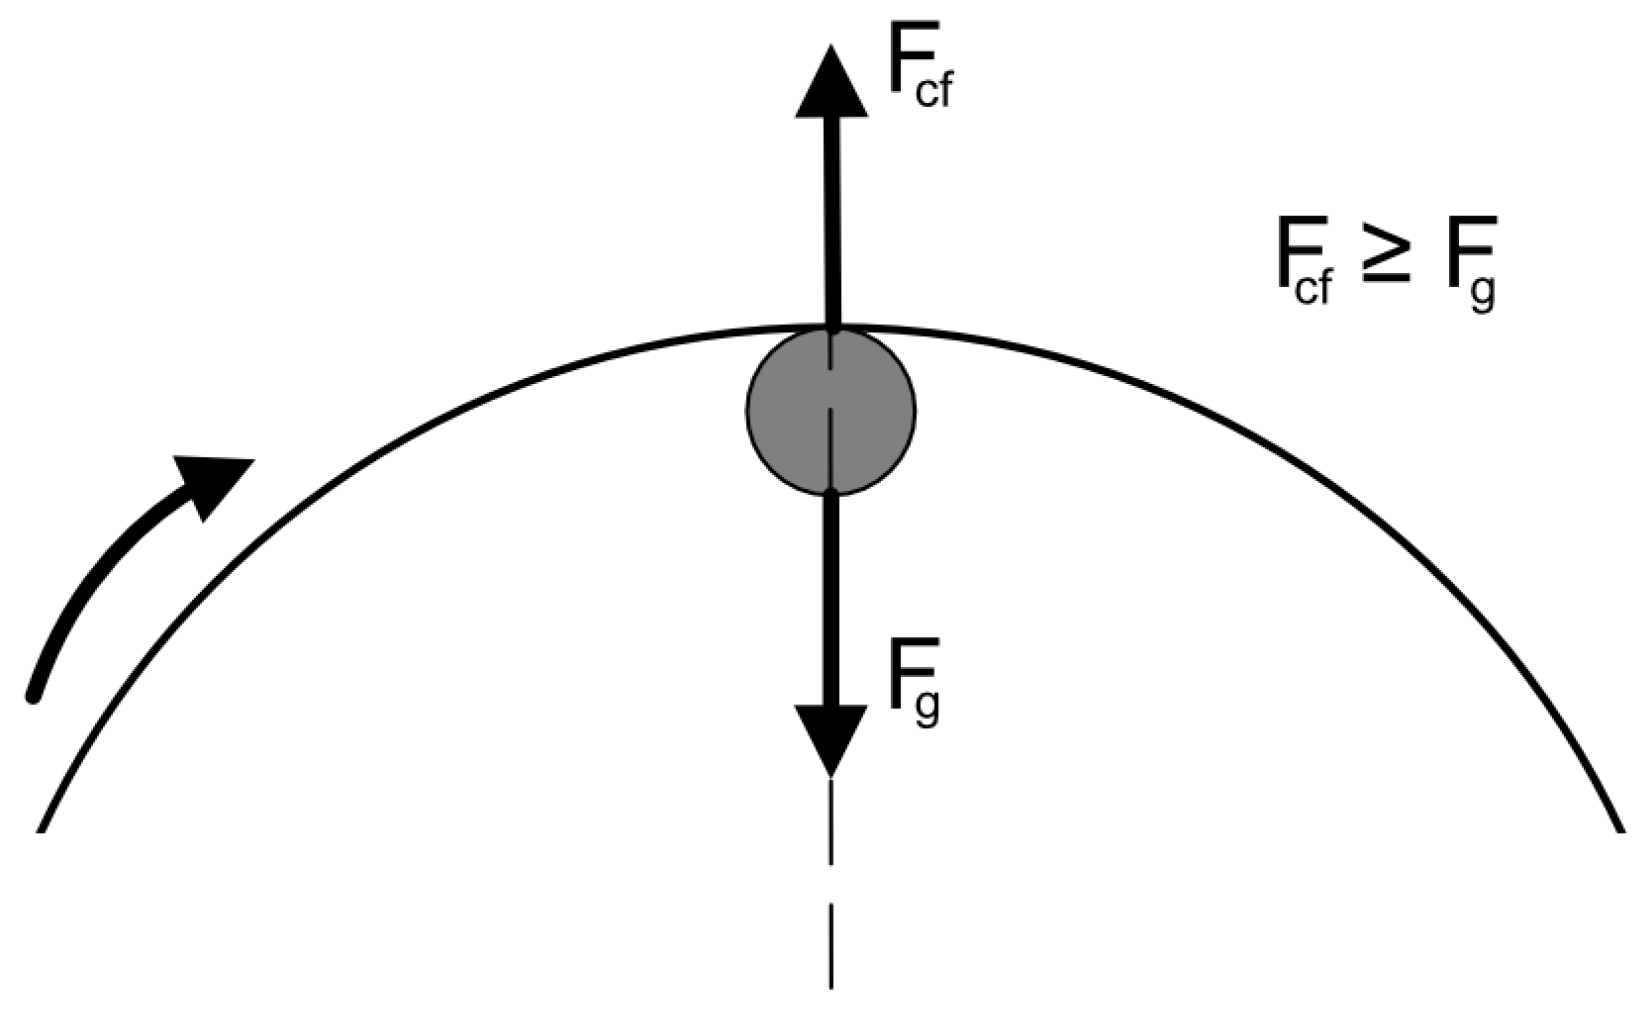
Figure 2), which depend on the rotational speed of the mill [
24,
25,
26]. The desired grinding action is usually a combination of cascading and cataracting motion, which allows for a balance of abrasion and impact breakage while preventing inefficient centrifuging of the charge [
25,
27].
Developing advanced modeling and simulation techniques, such as DEM, PBMs, and smoothed particle hydrodynamics (SPH), has allowed new perspectives for researching ball mills, as well as their scale-up and optimization. These models can aid in designing more efficient and sustainable grinding systems by providing data on the complex interactions between grinding media, ore particles, and slurries [
11,
22]. Ball mill models are advantageous in the transition from laboratory or pilot-scale tests to full-scale industrial mills [
7] and in optimizing mill operating conditions for specific ore types and product requirements [
11].
However, ball mill modeling and simulations still pose several challenges and require future research [
10,
11]. These challenges include the development of more efficient and scalable computational methods for simulating fine particles and complex mill geometries, the integration of advanced breakage models and multi-component PBMs into DEM simulations, and the validation of model predictions against experimental data from industrial mills [
10,
11].
This study introduces the novel concept of a scaling constant that aims to replicate energy transfer to ore during milling across different scales. The scaling constant focuses on adjustments in rotational speed and size distribution of grinding media rather than relying on linear scaling of mill geometry. By encapsulating nuanced parameters such as the number of balls per working area, rotational speed, and maximum potential and kinetic energies of an average ball, the scaling constant serves as a scale-agnostic measure of the maximum energy transfer rate.
The central hypothesis of this study is that maintaining the scaling constant at the same level across different mill scales should result in consistent milling effectiveness and energy utilization metrics, such as size reduction, specific energy, and specific energy per rotation. A series of experiments were conducted using a laboratory-scale ball mill with interchangeable drum sizes, with the goal of hypothesis testing. The experimental approach employed Design of Experiments (DoE) techniques to efficiently explore the parameter space. This approach helped evaluate the impact of various operational factors on milling performance.
The design of experiments is an essential tool used in mineral-processing research to systematically study the effects of various operating parameters on process performance. DoE enables the impact of multiple operating variables and their interactions to be efficiently mapped using a relatively small number of experiments or simulations. The results can be used to fit mathematical models, relating the input parameters to the measured responses, which provide further insight into the process and can guide optimization [
28,
29,
30].
The primary aim of this study is to evaluate the effectiveness of the scaling constant approach in maintaining milling performance across different scales and provide insights for ball mill design and optimization in mineral processing. By validating the scaling constant methodology, this research seeks to contribute to developing more efficient and predictable scaling strategies for ball mills, ultimately leading to improved energy efficiency and process performance in industrial mineral-processing operations.
2. Materials and Methods
2.1. Scaling Constant and Scaling Strategy
The development of a scaling constant aims to replicate the energy transfer to ore during milling across different scales. This approach could lead to consistent values of milling effectiveness and energy utilization metrics, such as size reduction, specific energy, and specific energy per rotation. These measured metrics aim to encapsulate the nuanced milling process using available measurable values. To be comparable across scales, the metrics and the scaling constant must be scale-agnostic, making total energy consumption and torque acting on the mill drum unsuitable for this purpose because the value increases as the scale increases.
Linear scaling of mill geometry and grinding medium size is not feasible due to the complex dynamics involved. Instead, this study focuses on the necessary adjustments in rotational speed and size distribution of the grinding media to ensure consistent energy utilization in larger-diameter mills. The practical goal is to calculate the scaling constant value for a small mill with reference operational parameters and then set the rotational speed and ball size distribution in such a way that a mill with a larger diameter, keeping other operational parameters (filling degree, number of lifters, lifter height) the same, would result in the same scaling constant value as the reference mill.
To achieve this, the mill’s rotational speed and the size distribution of the grinding medium are varied to explore a parameter space for optimal conditions. The parameter space exploration is performed by systematically varying the distribution of grinding medium sizes and the mill’s rotational speed, which directly impacts both the grinding medium’s kinetic energy and the scaling constant. The exploration is guided by minimizing the difference between the calculated scaling constant and the reference scaling constant value of the base mill.
A numerical solver has been implemented to explore different ball diameters and rotational speed combinations. The solver compares the calculated scaling constant for the larger-diameter mill to the reference scaling constant value of the base mill. The scaling constant aims to encapsulate nuanced parameters that may affect energy transfer by the grinding media. Parameters such as the number of balls per total working area can be compared across scales to calculate the number of contacts per square meter of the ball and mill drum inside the surface, directly impacting the contact number. Rotational speed also directly affects the rate of impacts and is therefore utilized in the scaling constant. The maximum potential and kinetic energies an average ball can obtain inside the mill are encapsulated within the scaling constant.
In summary, the scaling constant measures the maximum energy transfer rate by contacts between balls per active working area, which can be compared across scales and maintained at the same level. This approach enables the replication of energy transfer to ore during milling across different scales, potentially leading to consistent milling effectiveness and energy utilization.
2.1.1. Calculation of Total Working Area
The total working area,
, is the sum of the surface areas of all balls in the load (
) and the effective working area of the mill itself (
). To calculate
, the surface areas of all balls from
to
N are summed, where each ball can have a different diameter (
) and the following equation can be used:
The effective working area of the mill,
, is considered to be half of the entire internal surface area of the mill. This simplification assumes that only half of the internal surface is in contact with the load at any given time. The mill’s internal surface area is approximated as the surface area of a cylinder, calculated using the internal radius (
) and the length of the cylindrical section (
l):
By combining the surface areas of the balls and the effective working area of the mill, the total working area, , can be determined. This total working area is an essential factor in the scaling constant, as it allows for comparing the number of contacts per square meter of the ball and mill surface across different scales, directly impacting the contact number and energy transfer rate.
In our laboratory-scale setup, where the mill is short and represents only a segment of a longitudinal mill, the contribution of the mill’s working area is more significant in the total working area. Therefore, to avoid oversimplifying the assumptions, we included the mill’s working area in our calculations.
2.1.2. Energy Considerations
The maximal possible total energy imparted to a grinding medium within a mill is the sum of its maximal potential energy (
) and maximal kinetic energy (
). For the average ball, this can be expressed as
Here, quantifies the maximal energy due to the height h at which the average ball in the load can be lifted, while represents the maximal kinetic energy that the average ball can obtain inside the mill due to the rotation of the mill, considering only linear velocity.
The maximal potential energy is calculated as
where
is the mass of the average ball,
g is the acceleration due to gravity,
is the maximal height the ball can reach,
is the average ball radius,
is the density of the ball material, and
is the internal diameter of the mill.
The maximal kinetic energy is calculated as
where
is the maximal linear velocity of the ball,
is the angular velocity of the mill in radians per second, and
is the internal radius of the mill.
The average ball radius (
) is calculated as
where
n is the total number of size fractions,
represents the percentage of mass per the
ith size fraction (normalized as a fraction of 1), and
is the diameter of the
ith fraction.
By considering both the average ball’s maximal potential and kinetic energies within the mill, the scaling constant can better capture the nuanced factors affecting energy transfer and enable more accurate comparisons across different mill scales.
2.1.3. Operational Definition of the Scaling Constant
The scaling constant, denoted as
, is defined by the following equation:
where
represents the maximum possible energy (both kinetic and potential) of an average ball within the load, measured in Joules (J),
N denotes the total number of balls in the load,
is the total effective area available for the balls and the interior surfaces of the mill to perform work, measured in square meters (m
2), and
signifies the rotational speed of the mill, expressed in revolutions per minute (RPM).
The scaling constant
can be redefined to represent the maximum power intake per square meter of working area by dividing it by 60 s per minute, resulting in the following equation:
This redefinition allows for a more intuitive understanding of the scaling constant in terms of power per unit area, which is particularly useful when comparing mills of different sizes and operating conditions.
By incorporating the maximum possible energy of an average ball, the total number of balls, the total effective working area, and the mill’s rotational speed, the scaling constant captures the essential factors that influence energy transfer and milling efficiency. Maintaining a consistent value of across different mill scales is expected to result in similar milling performance and energy utilization, enabling more accurate scale-up predictions and optimizations.
2.2. Case Study
This study continues the studies performed on the same test stand with the same standardized copper ore [
31]. Previous studies established a way to create a digital twin of the ball mill, and a more detailed description of the interchangeable drums, slurry characterization, and grinding medium characteristics are described in that study.
2.2.1. Test Stand
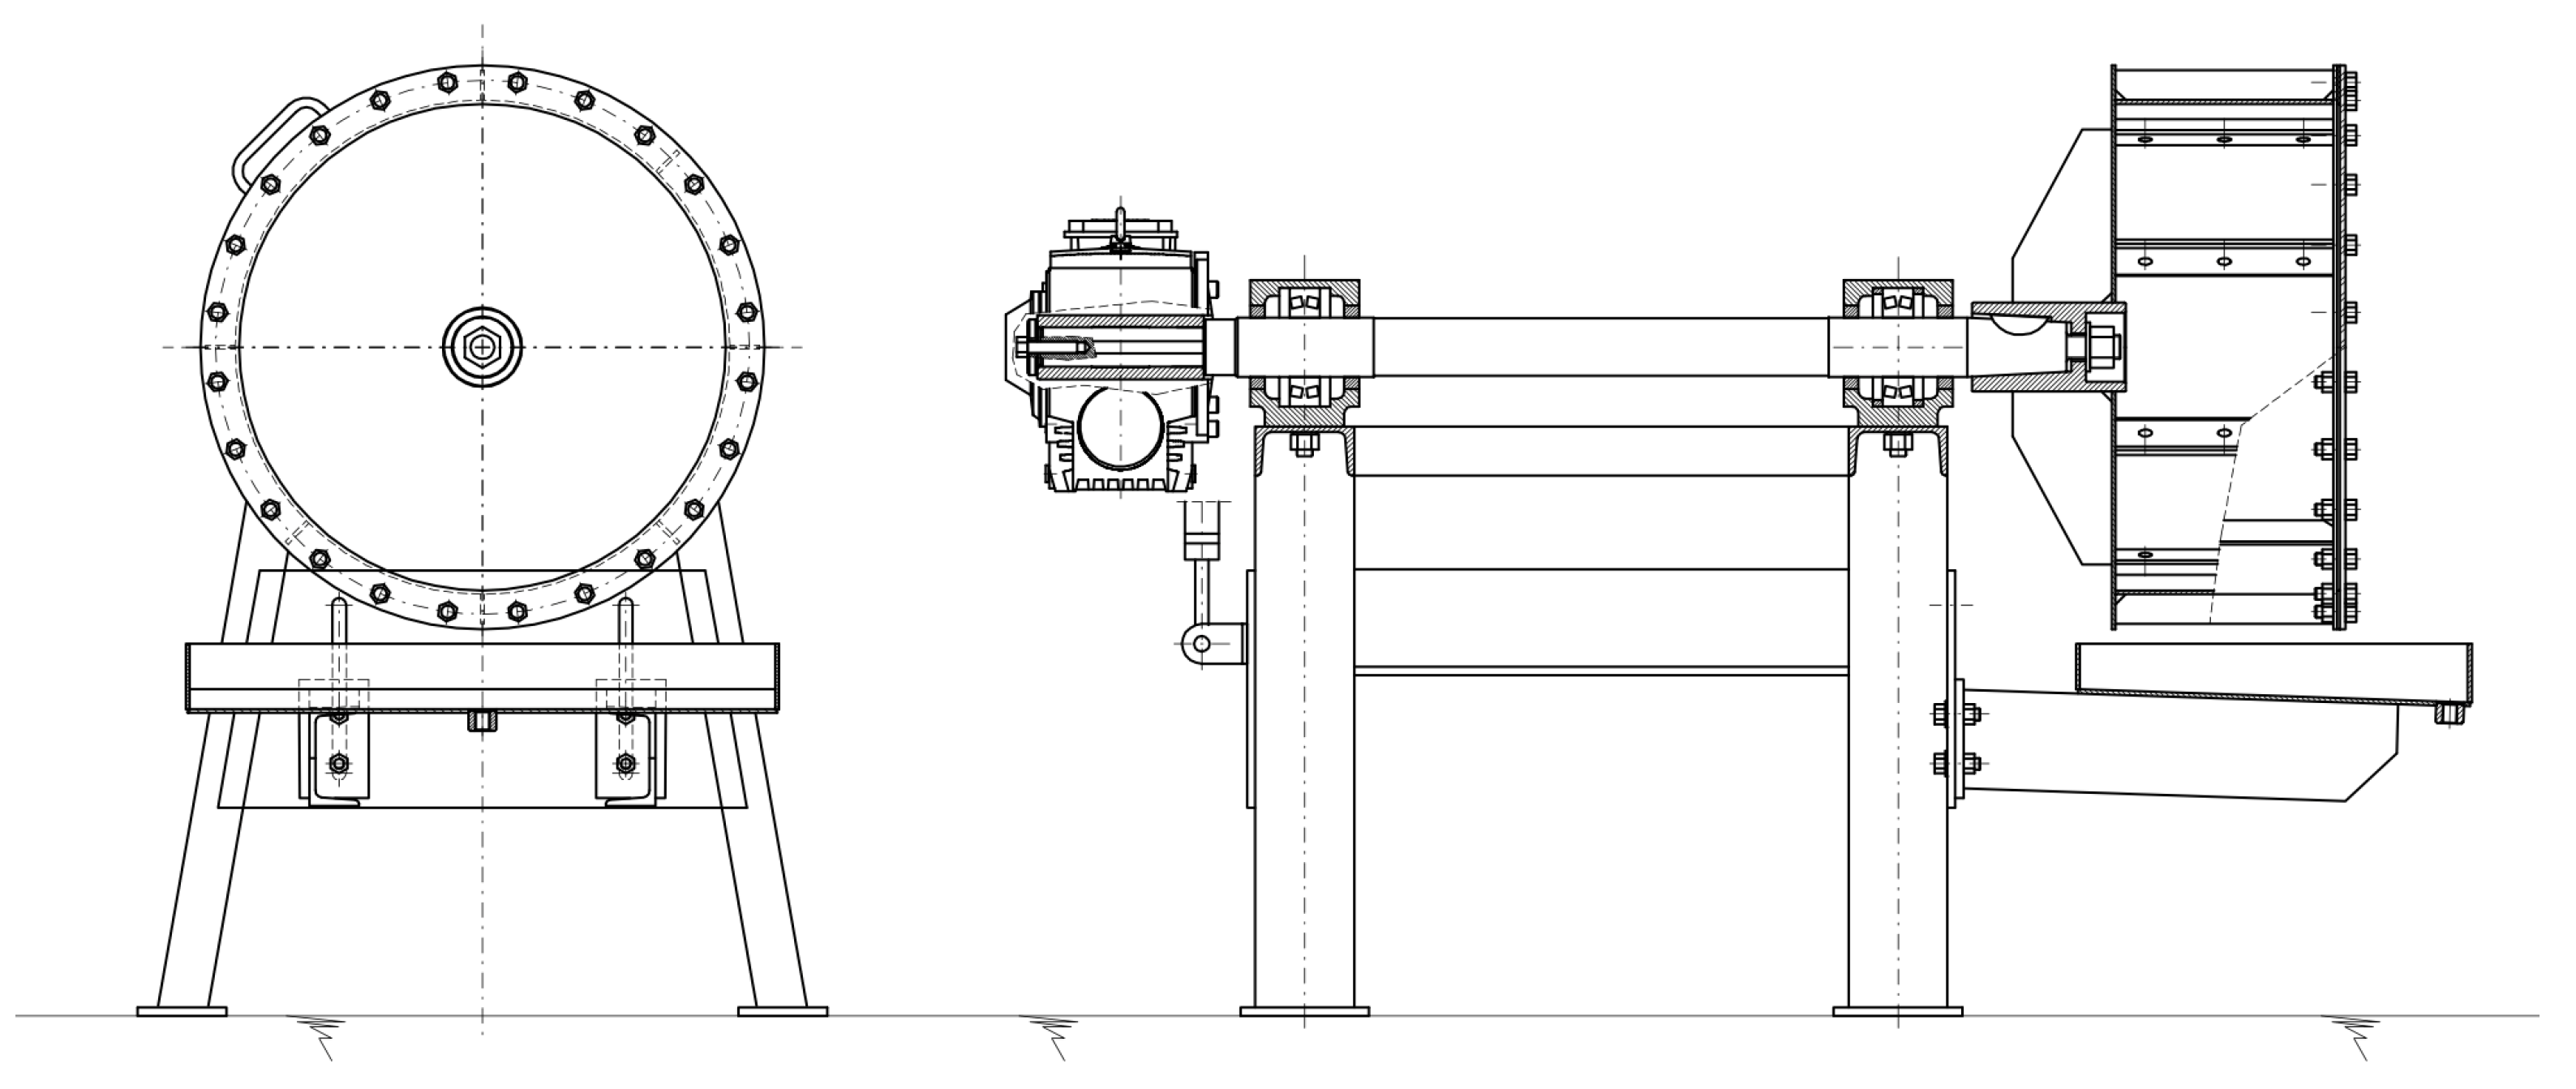
The experiments used a specially designed laboratory-scale ball mill with exchangeable drums of 300, 400, and 500 mm diameters. The internal diameter of each drum is 8 mm smaller than the external diameter. The mill features a transparent wall that allows for real-time observation and recording of the material distribution, which is essential for future computer vision analysis (
Figure 3).
The mill is driven by a 1.5 kW electric motor with a rotational speed of 1415 rpm, and the drive is transferred from the motor to the mill’s drive shaft through a worm gear with a ratio of 25. The drum rotational speed can be controlled from 0 to the nominal 56.6 rpm by adjusting the supply voltage frequency with an inverter. It was possible to obtain even higher RPMs exceeding the nominal speed by changing the voltage frequency. Two ball bearings support the mill shaft, and a quick coupler (conical and screw connection) allows the use of various drum diameters. The material is loaded through a feed manhole in the drum. The mill is also equipped to mount up to eight lifters with equal distance between them, and two sets of lifters were used: one with 5 mm height and another with 15 mm height.
The experimental setup utilized various sensors and devices to measure and record key parameters of the motor and drum shaft. The active power of the motor was determined using a signal from the inverter, while the torque of the drum shaft was measured with an HBM S2M/500N strain gauge (Hottinger Brüel & Kjaer GmbH, Darmstadt, Germany) mounted on the gearbox’s reaction arm. A Hohner 36-131-2000 incremental encoder (Hohner Automation, Breda, Spain) was employed to record the rotational speed of the drum. All signals were acquired using a BMCM measurement system operating at a sampling frequency of 50 Hz. The system comprised an analog signal amplifier BP16, a strain gauge acquisition device AD16f, and a digital signal-acquisition device IO16 by BMC Messsysteme GmbH (Maisach, Germany). NextView 4.6 software provided an interface for real-time data visualization and recording into editable formats, facilitating data analysis and interpretation.
2.2.2. Materials Characterization
The copper ore used in the experiments was prepared by mixing rocks from all exploration copper ore regions of KGHM Polkowice, Lubin, and Rudna. The primary goal was to create a repeatable and representative sample, rather than targeting a specific chemical composition. The variability in the composition of copper ore deposits is high, making it impractical to replicate a specific composition representative of all processed ores. Instead, we focused on creating a large, averaged sample that could realistically occur in a mine and be consistent across experiments. The ore was crushed using a jaw crusher and sieved through 2 mm sieves to obtain a feed size with a dominant grain size () of 0.876 mm, similar to the feed size in the industrial process of the 1st/2nd stages of copper ore milling. The measured bulk specific gravity of the ore was , referred to in the text as ore density.
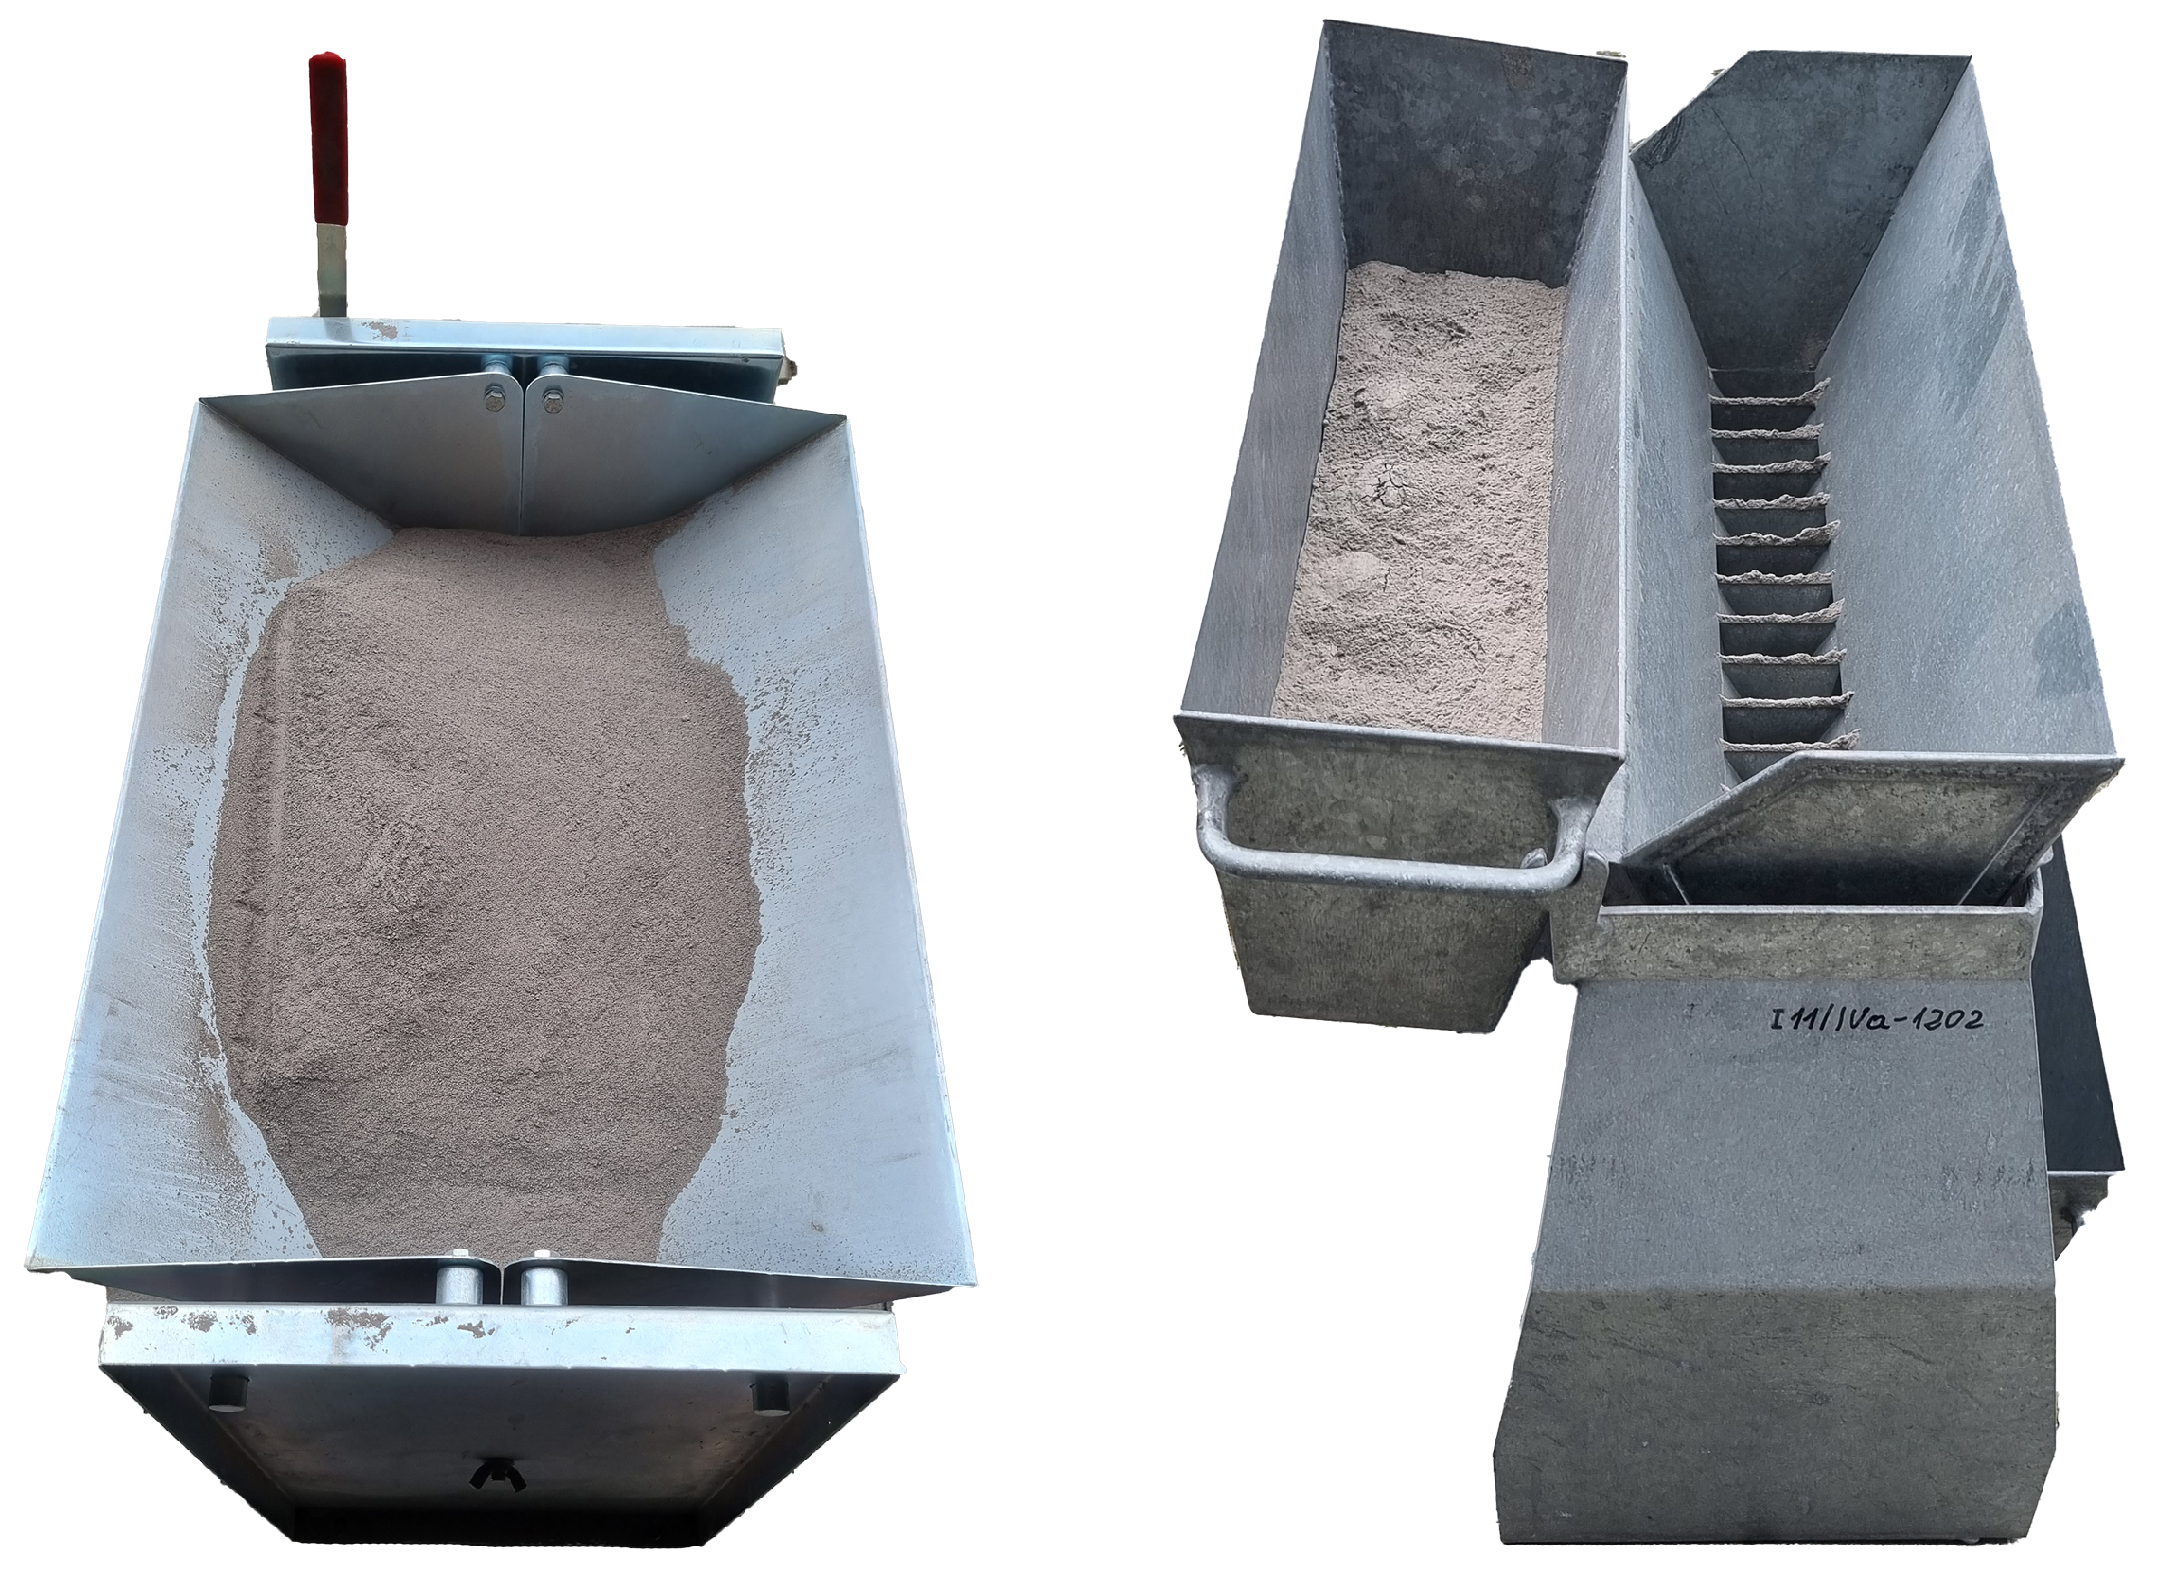
Approximately 800 kg of the averaged ore was prepared by splitting it into 32 smaller parts using a Jones splitter with 5 rounds of splitting for each ore portion (
Figure 4). The ore was stored in 32 containers, and, before using a part of the sample in an experiment, it was further reduced in size by either a Jones splitter or coning and quartering, depending on the required mass for the experiment.
The goal of the sample preparation was not to obtain a representative copper ore sample for all Polish copper ore exploitation regions, as this would be impossible, but rather to obtain a uniform material for the experimental series that would behave consistently for each designed experiment, allowing for comparable effects of milling between experimental sets.
The ore consists of dolomites, sandstone, and shale in unknown proportions, which vary depending on the region. The literature shows that sandstone content could be between 13.5% and 72%, dolomite between 22% and 72.6%, and the smallest part of shale between 6% and 13.9% [
32]. It could be hypothesized that, after mixing rocks from all regions, the ore composition would be more balanced, with about 45% each of sandstone and dolomite and about 10% of shale. The grindability work index for copper ore stones and mixes ranges from 8.3 to 16.9 kWh/t [
32].
The grinding media used in this study were steel balls with a nominal diameter of 35 mm, selected based on industry guidelines [
33] and commercial availability. The measured density of the steel balls was
. The range of ball sizes employed was from 15 to 35 mm, with 5 mm increments. The size distribution of the steel balls was determined using the Bond equilibrium state equation [
33,
34]:
where
y represents the percentage of the total equilibrium charge that passes a given size
x (mm) and
B denotes the makeup/recharge size of the balls (mm).
2.3. Particle Size Distribution Measurements
The sample preparation for size distribution measurement followed a consistent procedure, with the sample size varying depending on the measuring technique employed. For feed grain size distribution, the preparation involved Jones splitters for initial size reduction, followed by dry sieving for assessment. The product underwent initial size reduction in all dry-milling experiments using a smaller Jones splitter.
The samples were further reduced using the coning and quartering method to obtain laboratory-sized samples. In the experimental series of wet milling, the slurry was removed from the mill and transferred to a container, and the mill was washed with a water hose, allowing all residual material to fall into the container. The excess water in the container was left steady to allow the material to settle at the bottom, and then the excess water was removed from above the material. The remaining water was mixed with the ore using a stirrer until a uniform slurry was obtained. Samples were then taken from different parts of the container using a needle-free syringe to ensure a more representative sample, which was then transferred to a silicone mold.
The prepared wet samples were transferred to an oven and dried for a few hours. The dried samples were consolidated and carefully processed with low force in a ceramic mortar and pestle to make them suitable for grain size analysis without any lumps. The standard procedure of coning and quartering was then applied, as described earlier.
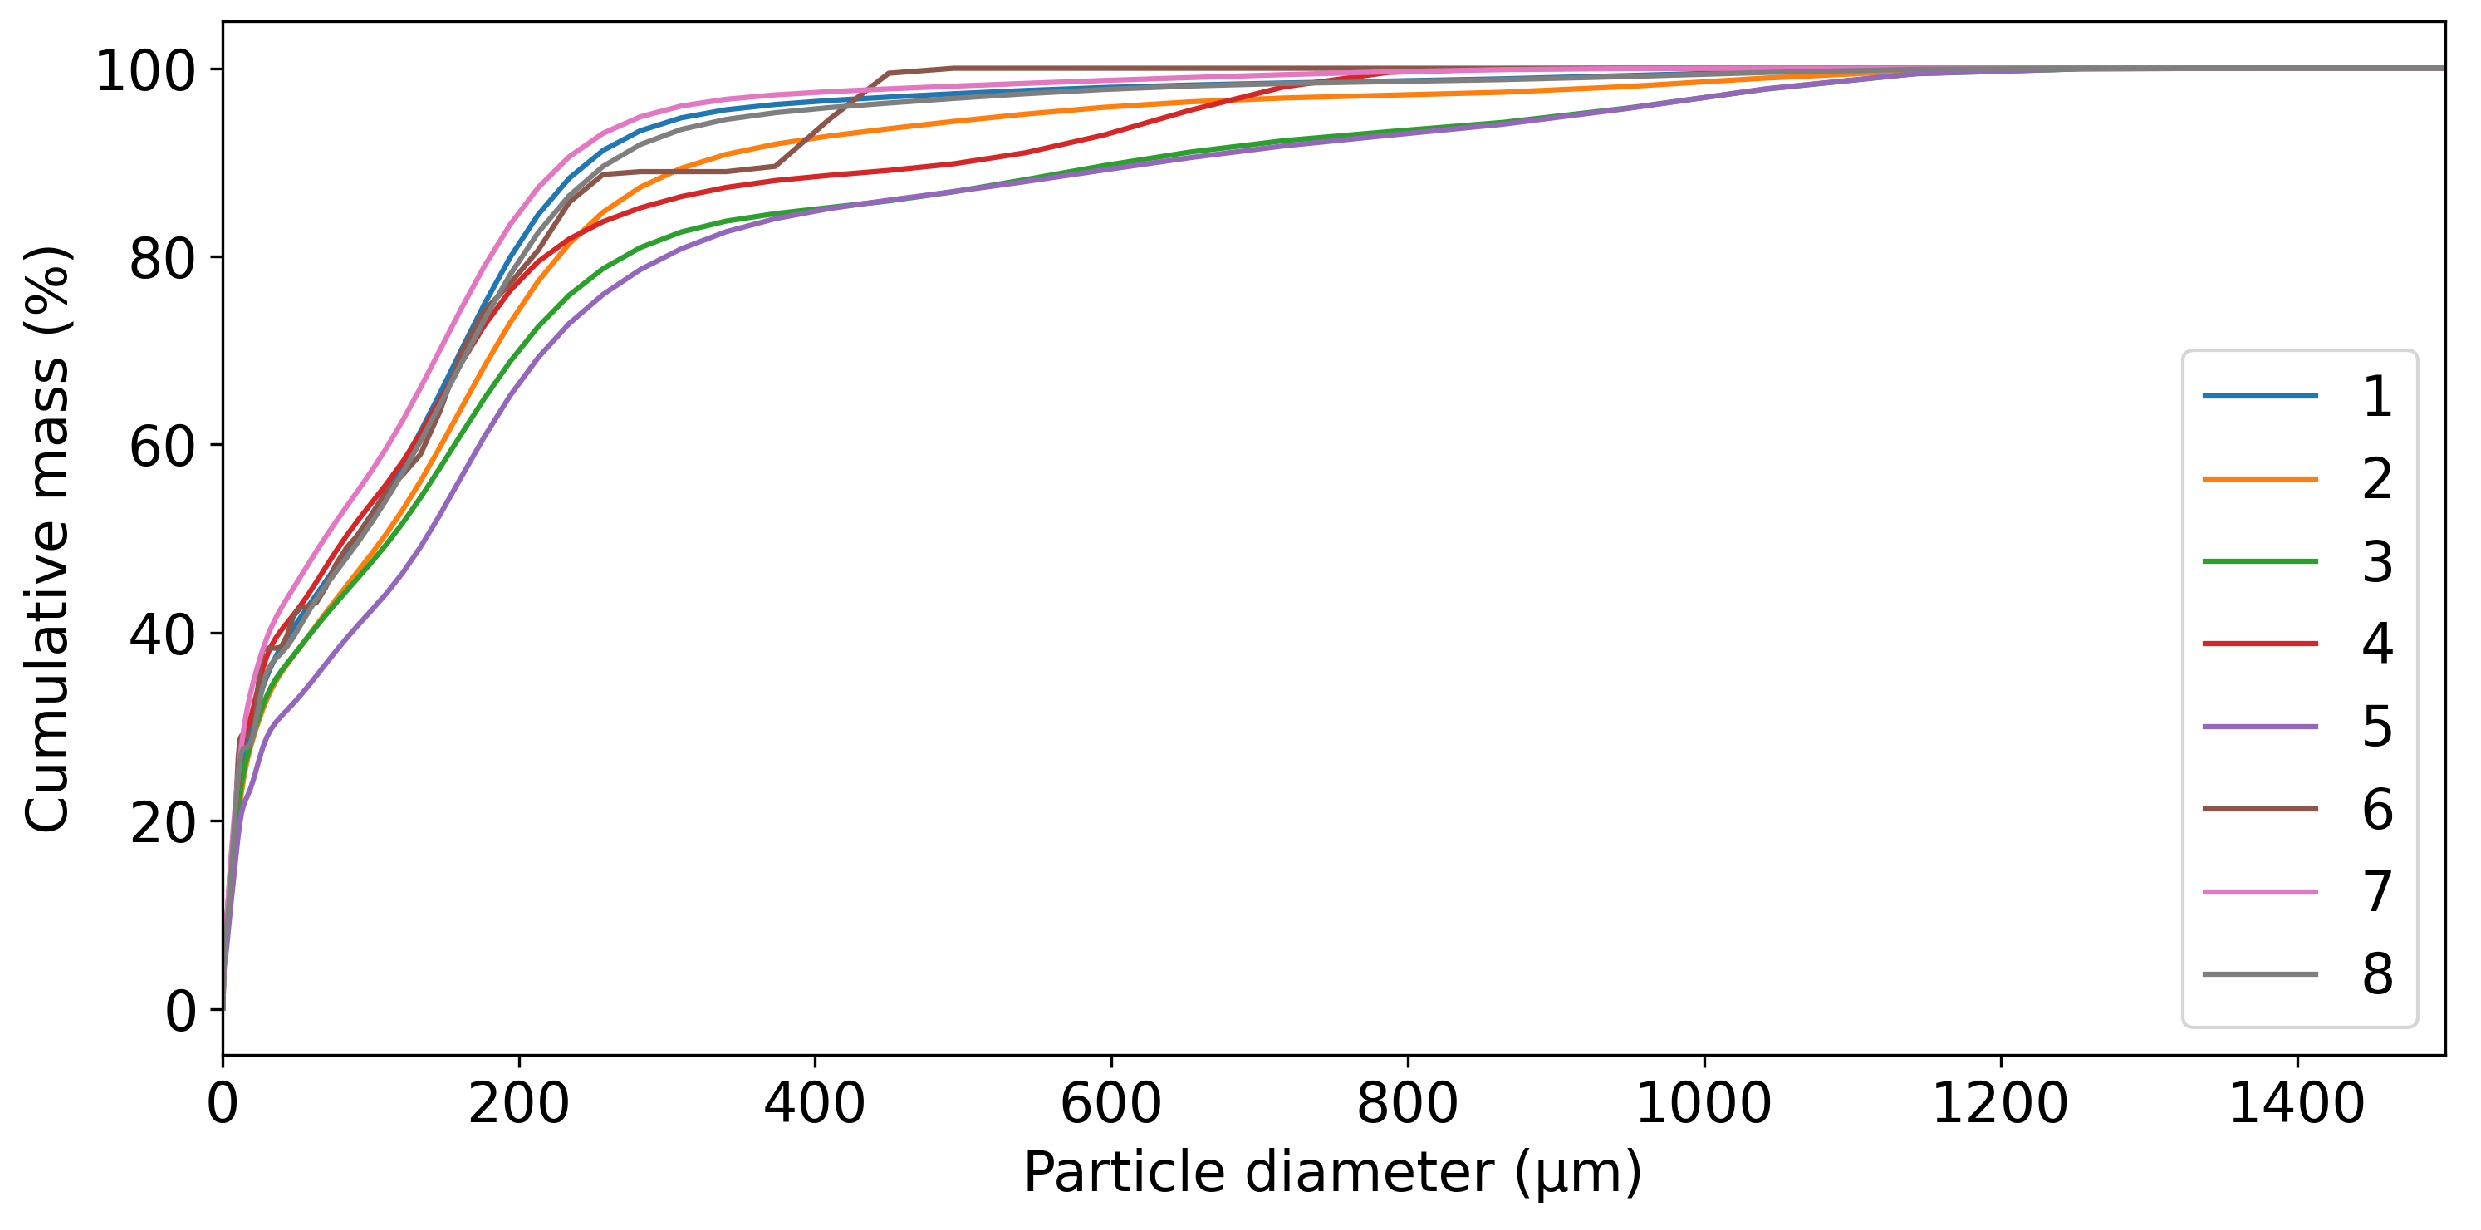
For the more significant number of product samples from the experimental series (48 in total), the Laser Diffraction method was chosen for its high accuracy and repeatability of measurements across a broad range of particle sizes (0.017
m to 2000
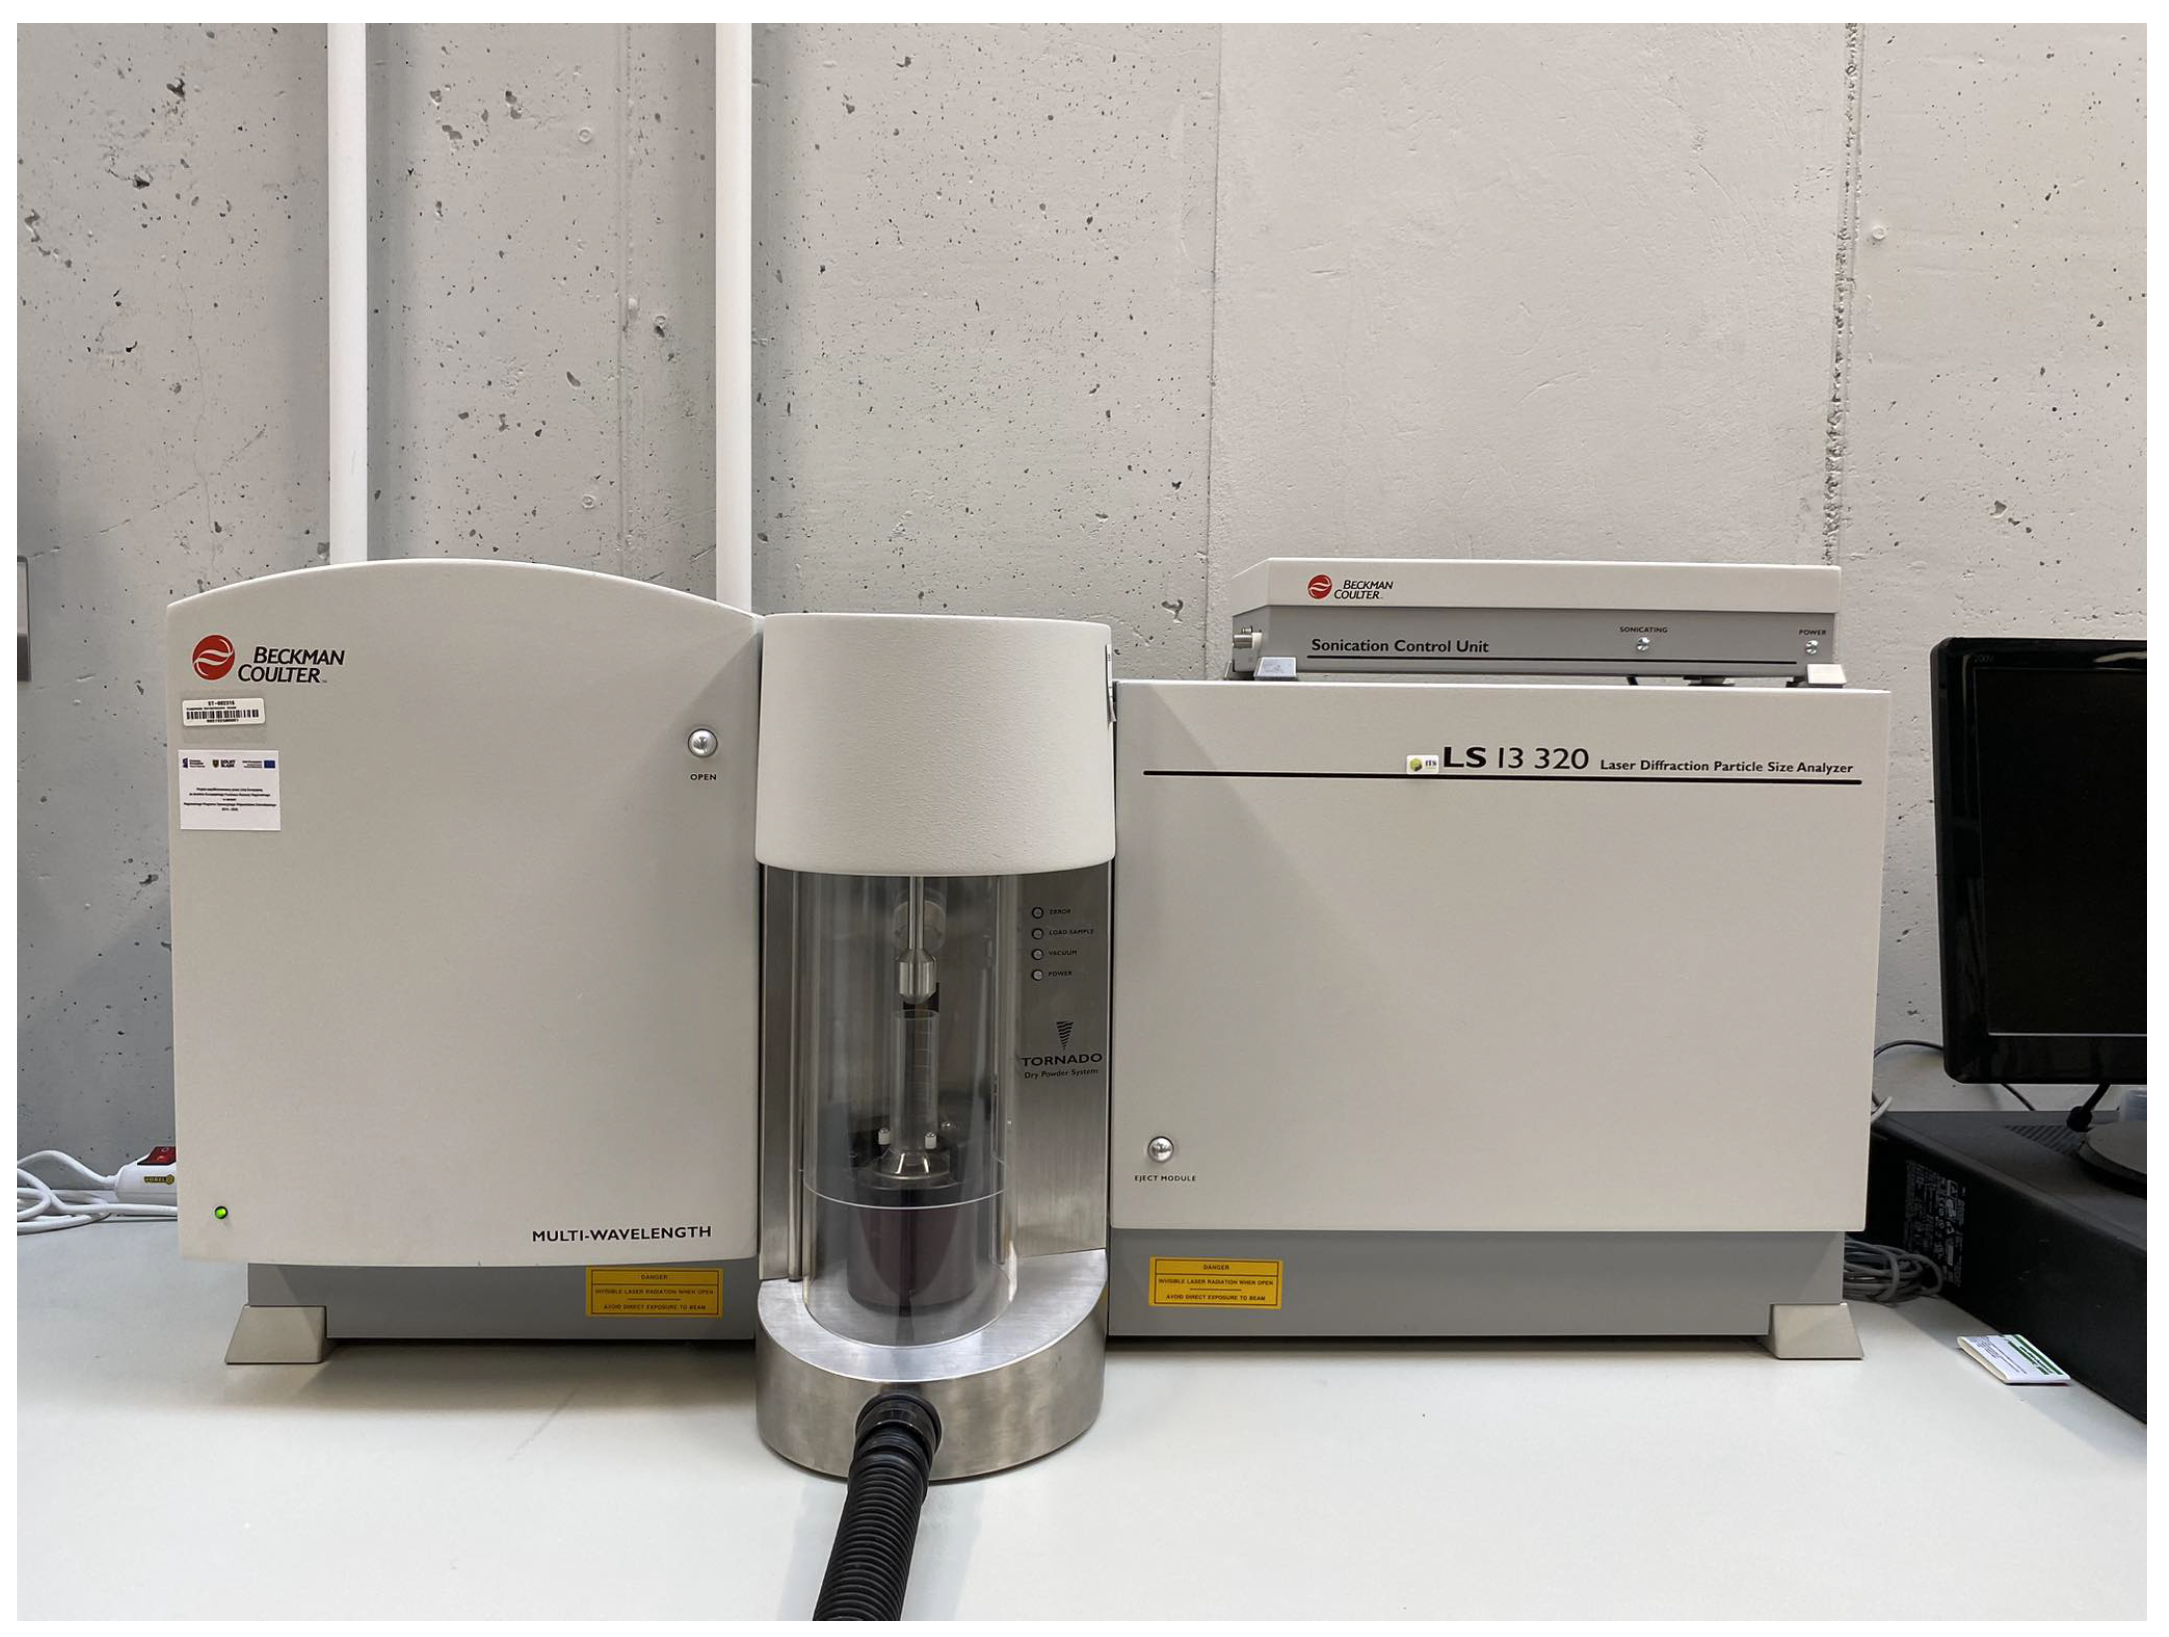
m). The LS 13 320 particle size analyzer (
Figure 5) was used to analyze the product’s particle size after grinding in a laboratory mill. Laser Diffraction determines particle size distribution by analyzing diffraction patterns formed when a laser beam passes through a sample of particles. The powder head used is designed to analyze bulk materials, ensuring the sample is even distributed and has optimal conditions for precise measurements. In Laser Diffraction, the bulk material is dispersed in air or another gas and passed through a laser beam to ensure proper dispersion and avoid agglomeration.
The size distribution analysis for each product and feed followed industry standards. Sieve analysis was performed, and the cumulative size distribution curves were fitted to the data. The horizontal axis represented the sieve size opening, while the vertical axis represented the cumulative percentage passing. The size for 80% passing ( for feed or for product) was interpolated based on the two closest measurements. The study focused on the size reduction parameter, defined as /, which indicates how many times smaller the product grain () is compared to the feed grain size (), demonstrating the effectiveness of the process.
For sieve analysis, the percentage passing for each sieve was calculated mass-wise. In contrast, laser size measurements were performed volume-wise, providing direct diameters of particles and more detailed results. However, it is essential to note that the results may be slightly biased if the copper ore consists of materials with different densities and grindability, such as dolomite, sandstone, and shale. For example, if a material with lower density is much finer than others, it could affect the measurements. To simplify the assessment of , an assumption was made that differences in the masses of minerals in different fractions would not significantly affect the results. Calculating the cumulative percentage volume-wise was considered to have the same effect as mass-wise, as the volume would be multiplied by the average density of the ore. This assumption was necessary due to the lack of a simple method to determine the prominence of different mineral types in each fraction for such a large sample size.
2.4. Sensor Data Analysis
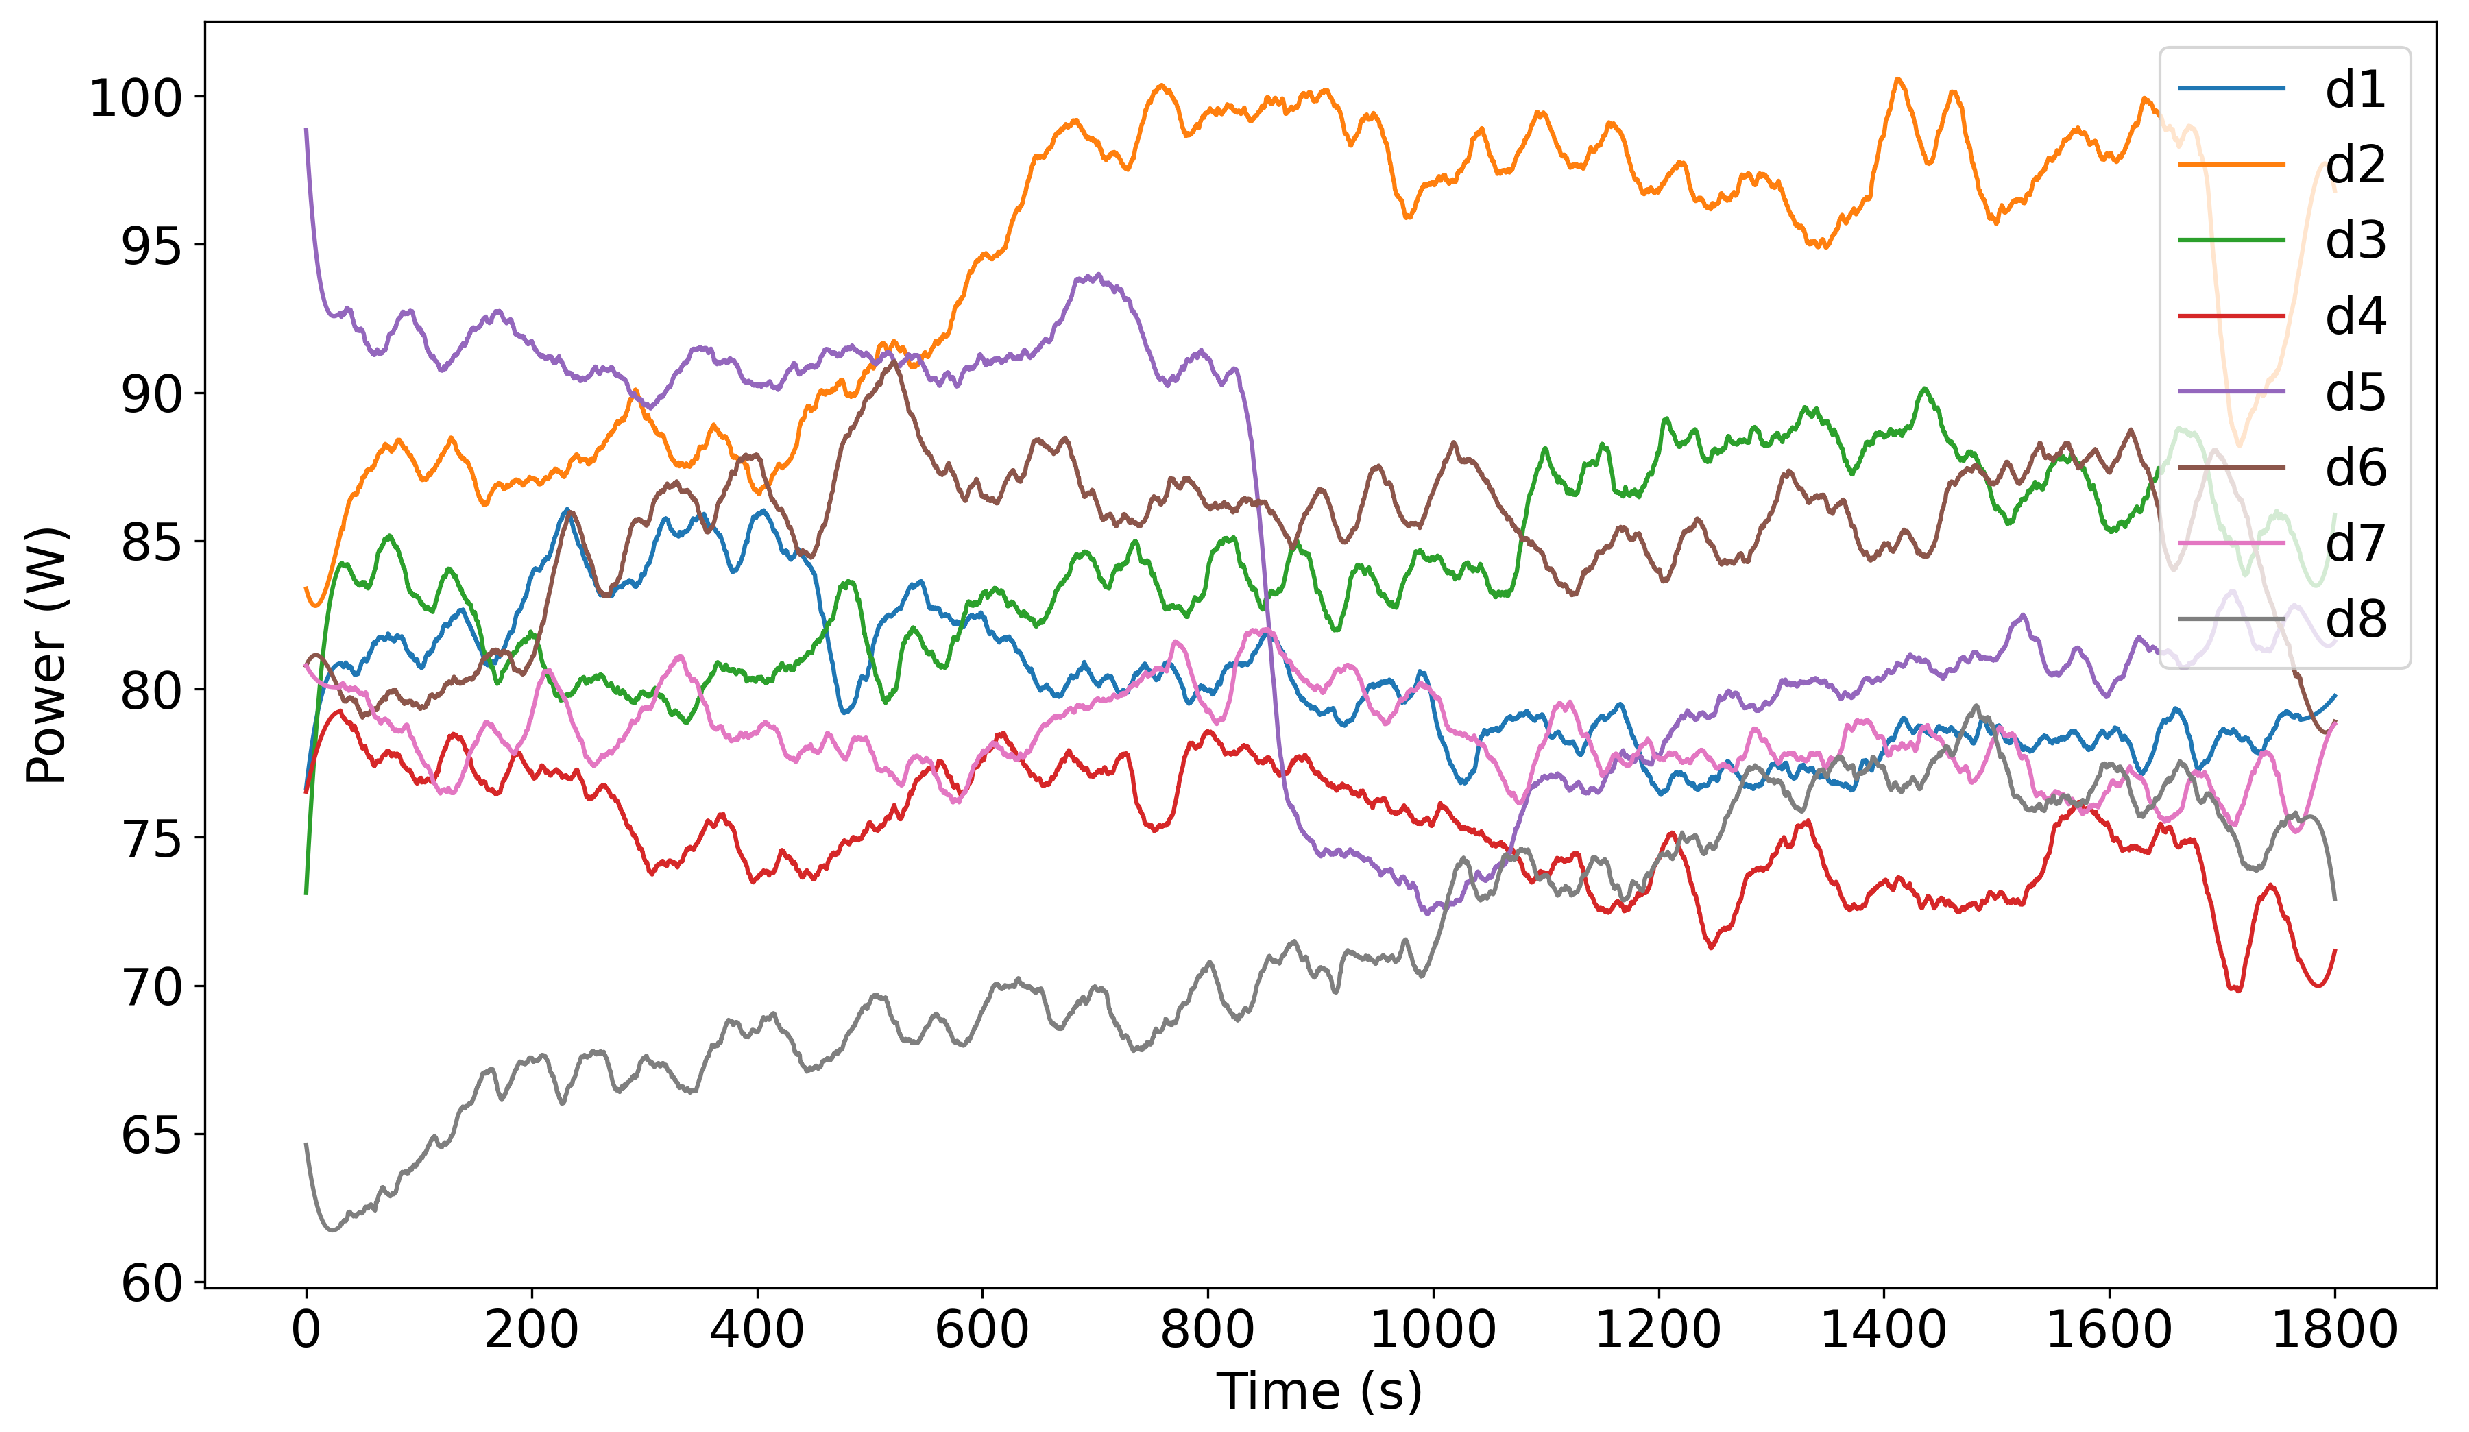
The mill sensor data include measurements of the mill’s power draw and rotational speed for this study. The data were used to calculate the energy consumption under different operating conditions.
The first step in the signal pre-processing pipeline is to detect and remove outliers from the raw data using the Z-score method. The Z-score is calculated for each data point, and points exceeding a specified threshold (default: 3 standard deviations) are considered outliers. These outliers are then replaced with the mean value of the non-outlier data points. This process is applied to each signal in the original data to ensure data integrity and reduce the influence of extreme values on subsequent analysis.
After removing outliers, the Savitzky–Golay filter is applied to smooth the signal and reduce high-frequency noise while preserving the underlying trends. The Savitzky–Golay filter is a digital smoothing filter that fits a polynomial of a specified order to a sliding window of data points. For this analysis, a window size of 3001 is chosen, corresponding to a duration of 1 min, considering the sampling rate of 50 Hz (1 sample every 0.02 s). This larger window size helps to capture the overall trends over minutes by smoothing out short-term variations and emphasizing the longer-term behavior of the signal. The polynomial order is set to 3, which is typically sufficient for capturing general trends without overfitting to noise.
The rotational speed (in RPM) signal represents the angular velocity of the ball mill. It provides information about the mill’s operating speed and stability over time. The mill’s performance and control system effectiveness can be evaluated by comparing the RPM signal to the set RPM value, which is determined based on the mill diameter and grinding conditions.
The power signal represents the power consumed by the ball mill’s motor, providing information about the mill’s energy consumption during the grinding process. The total energy consumed by the mill during the measurement period is calculated by integrating the power signal over time, offering an overall measure of the grinding process’s energy requirements. This analysis enables the assessment of the mill’s energy efficiency.
2.5. Experimental Design and Experiments
This study employed a systematic experimental approach to assess the scaling of energy transfer in ball mills. It utilized a Design of Experiments (DoE) methodology to efficiently investigate the impact of various operational variables on mill performance in both dry- and wet-milling conditions. Each experiment was planned for a 30 min duration. The time was selected based on the preliminary studies, which showed that the biggest size reduction is achieved during the initial phase of the milling. Thus, 30 min would be enough to capture all the main effects and not compromise the time needed to stabilize the charge behavior.
2.5.1. Experimental Setup
A fractional factorial design, a type of DoE that evaluates the most significant factors with fewer runs than a full factorial design, was applied, thereby optimizing resource usage. The experiments were conducted on three mill diameters to explore scale effects under controlled conditions. Each experimental setup was repeated three times, once for each diameter.
The critical operational variables adjusted during the experiments included the rotational speed, filling degree, number of lifters, and lifter height. For wet milling, slurry density was also varied. The choice of these variables and their levels was based on their expected influence on the milling performance and the practical operational limits of the milling equipment used.
2.5.2. Selection of Variable Levels
The reference levels for the variables were chosen based on median operational values:
Lifter height: Medium height was set at 10 mm, with experimental variations at 5 mm and 15 mm;
Filling degree: A median value of 40% was used as the reference, with variations at 30% and 50%;
Rotational speed: 90% and 110% of the reference speed for a given scale (300:0.75 of critical speed, 400:0.733 of critical speed, 500:0.712 of critical speed).
The critical speed (
) in revolutions per minute (RPM) is derived from the balance of gravitational and centrifugal forces and is calculated for the average mass-wise ball using Formula [
20]:
where
g is the acceleration due to gravity (
),
R is the radius of the mill (in meters), and
r is the radius of the balls (in meters).
The reference speed for 400 and 500 mm mills was calculated using a solver, and the size range of the balls (300:15—35 mm, 400:20—35 mm, 500:25—35 mm) to maintain the scaling constant with medium parameters used in the design at the same levels. Due to limited ball sizes, it was impossible to retain the scaling constant precisely the same, but for both mills (400 and 500 mm) with new rotational speed and ball sizes, it was fitted within a 5% difference of the reference 300 mm mill value.
The reference value of the scaling constant for 300 mm was 94.75 W/m2. The values for the 400 mm mill and 500 mm mill were 99.23 and 99.31 W/m2, respectively.
For wet milling, there were only two ratios of water and ore used to achieve the final slurry densities, which are detailed in the next section.
2.5.3. Design of Experiments Tables
For dry milling, the experimental design was structured as shown in
Table 1, where rotational speed, filling degree, number of lifters, and height were systematically varied across eight runs.
For wet milling, as detailed in
Table 2, the design included an additional variable of slurry density, adjusted to cover a range relevant to typical copper ore processing operations (1400–1800
). The designs were created using Minitab 21 Statistical Software.
2.5.4. Methodological Considerations
The primary goal of the experimental series was to explore scaling across different mill sizes and generate comprehensive data sets for future analysis. The structured approach of DoE allows for robust analysis and a deeper understanding of the critical parameters that influence the performance and scalability of ball mills in mineral-processing applications. Although this paper does not delve deeply into the statistical analysis of the DoE results, the framework established here lays the groundwork for future research, emphasizing systematic experimentation and data-driven decision-making in mill scale-up studies. All experiments were additionally recorded with a high-speed camera to assess qualitatively the motion type.
2.6. Methodology of Scaling Constant Testing
Controlled experiments are conducted to measure the response metrics of each experimental run, including size reduction, specific energy, and specific energy per rotation. Statistical analysis—specifically, Analysis of Variance (ANOVA)—is applied to determine if the resulting metrics remain invariant across different mill scales. Additionally, a Design of Experiments (DoE) experimental series is incorporated for each experimental series in each scale to gather additional data for future research and analysis.
The independence of observation assumption was met based on the experimental design. The Shapiro–Wilk test assessed normality within each group (300, 400, and 500 mm mills), with a p-value > 0.05 indicating that the normality assumption was met. Levene’s test was employed to evaluate the homogeneity of variances across groups, and, if the p-value was greater than 0.05, the equal variances assumption was considered met. In cases where the p-value was less than or equal to 0.05, Welch’s ANOVA was used instead of one-way ANOVA.
The choice of hypothesis test depended on the normality and homogeneity of variance assumptions. If both assumptions were met, one-way ANOVA was used. Welch’s ANOVA was employed when normality was met, but equal variances were violated. If normality was violated, the Kruskal–Wallis H test was utilized. Post hoc pairwise comparisons were conducted when the hypothesis test indicated significant differences among groups, using Tukey’s HSD test for one-way ANOVA and Welch’s ANOVA and Dunn’s test with Bonferroni correction for the Kruskal–Wallis H test.
Effect size measures were calculated to assess the magnitude of differences between groups. For Welch’s and one-way ANOVA, partial eta-squared () was used, with interpretations as follows: small effect (0.01 ≤ < 0.06), medium effect (0.06 ≤ < 0.14), and large effect ( ≥ 0.14).
The results were interpreted to determine if the scaling constant’s role in maintaining metrics at the same level held across different ball mill scales. If the hypothesis was confirmed, the scaling constant was established as an essential parameter in mill scaling. This would substantiate that comparable energy efficiency can be achieved in larger mills by meticulously adjusting operational parameters, even in laboratory-scale experiments, to scale results later. However, if empirical data do not support the hypothesis, this would suggest that factors beyond the scaling constant significantly affect size reduction, Specific Energy, and Specific Energy per rotation. This would prompt a re-evaluation of the employed scaling strategy.
4. Discussion
The results of this study provide valuable insights into the scaling of energy transfer in ball mills and the effectiveness of the proposed scaling constant approach. The experimental design, which involved varying mill diameters and operational parameters, allowed for a comprehensive assessment of the scaling constant’s ability to maintain consistent milling performance across scales.
The statistical analysis of the experimental results revealed mixed findings regarding the invariance of the measured metrics (size reduction, Specific Energy, and Specific Energy per rotation) across different mill scales when the scaling constant was kept at the same level. Significant differences were observed in the mean size reduction between the 300 mm and 500 mm scales for dry milling, suggesting that more than just the scaling constant is needed to ensure consistent size reduction performance as the mill diameter increases. However, no significant differences were found in the mean Specific Energy and mean Specific Energy per rotation across the scales for dry milling, indicating that the scaling constant approach may be more effective in maintaining these energy utilization metrics.
In the case of wet milling, the statistical tests revealed no significant differences in the mean size reduction, mean Specific Energy, and mean Specific Energy per rotation across the different mill scales. These findings suggest that the scaling constant approach is more suitable for wet-milling conditions, as these maintain consistent milling performance and energy utilization across scales.
The observed shift in the dominant type of charge motion from centrifuging to cataracting and cascading as the mill scale increased highlights the complex dynamics involved in ball mill scaling. This shift in motion type may contribute to the differences in size reduction performance observed in dry milling, as the energy transfer mechanisms and particle breakage processes can vary depending on the dominant motion regime. Further study would require developing better speed control systems. Another approach that could be beneficial is to maintain the same type of charge motion during scaling. A dual approach of retaining the scaling constant at the same level and tuning other parameters, such as lifter height and number, to achieve the same type of motion could be advantageous. This motion can be assessed with a digital twin in a numerical environment.
The study’s findings have important implications for designing and optimizing ball mills in mineral processing applications. While the scaling constant approach shows promise in maintaining consistent energy utilization metrics, particularly in wet-milling conditions, its effectiveness in ensuring invariant size reduction performance across scales appears to be limited, especially in dry milling. This suggests that additional factors beyond the scaling constant, such as the dominant charge motion regime and the complex interactions between the grinding media and the ore particles, may need to be considered when scaling up ball mills.
Future research should investigate the underlying mechanisms contributing to the observed differences in milling performance across scales, particularly in dry-milling conditions. This may involve more detailed characterization of the charge motion and particle breakage processes using advanced experimental techniques, such as high-speed imaging and discrete element method (DEM) simulations. Additionally, future studies should validate the scaling constant on different materials, not only copper ore, and the results in industrial-scale mills to assess the applicability of the findings beyond the laboratory scale.
