Article

Research on Influencing Factors and Wind Deflection Warning of Transmission Lines Based on Meteorological Prediction

1
Key Laboratory of the Ministry of Education on Smart Power Grids, School of Electrical and Information Engineering, Tianjin University, Tianjin 300072, China
2
Tangshan Power Supply Company of State Grid Jibei Electric Power Co., Ltd., Tangshan 063099, China
3
Chengnan District Power Supply Company of State Grid Tianjin Electric Power Co., Ltd., Tianjin 300201, China
4
Electric Power Research Institute State Grid Xinjiang Co., Ltd., Urumqi 830063, China
*
Author to whom correspondence should be addressed.
Energies 2024, 17(11), 2612; https://doi.org/10.3390/en17112612
Submission received: 1 May 2024 / Revised: 27 May 2024 / Accepted: 27 May 2024 / Published: 28 May 2024
(This article belongs to the Section F: Electrical Engineering)

Abstract

:
Transmission lines are affected by external environmental factors such as strong winds and ice cover. In recent years, extreme weather events have increased, leading to recurrent disturbances in transmission lines because of wind deflection. These incidents have resulted in significant financial losses and have disrupted regular industrial and domestic activities. In this paper, the ANSYS Workbench 2020 R2 finite element analysis platform was used to establish a transmission line-hanging insulator string system model. Calculations on transmission lines were conducted considering variations in different stall spacing, height differences, wind speed, and the wind attack angle. The impact of these diverse factors on the wind deflection of insulators was scrutinized, leading to the derivation of patterns describing how the wind deflection angle shifts in response to changes in stall spacing, height differences, wind speed, and the wind attack angle. Based on the generalized linear regression network and particle swarm improved support vector machine algorithm, a meteorological prediction-based early warning method for wind deflection of transmission lines was proposed, a transmission line wind deflection early warning model was established, and the practical effect of the model was evaluated. The outcomes of this study provide crucial data for the formulation and development of ultra-high voltage (UHV) and extra-high voltage (EHV) transmission networks. Furthermore, they can contribute to the advanced detection of wind deflection issues.

1. Introduction

Acting as the primary channels for conducting electricity, transmission lines link power generators with consumers, significantly impacting our daily routines. With the progress of science and technology and the improvement of the industrial level, the demand for electricity in modern society is increasing day by day, which puts forward higher requirements for the safety and reliability of transmission lines. Understanding how to conduct efficient and safe electricity transmission to all parts of the country has become a problem that needs to be solved urgently.
In recent years, the safety and stability of the power transmission system have been facing significant challenges because of the frequent occurrence of severe weather conditions and because transmission lines pass through diverse and complex terrain environments. Because of the structural characteristics of large spans, the response of transmission lines to wind loads is very sensitive. Accidents such as collapses and disconnections caused by strong winds are often reported in various media, and wind deflection faults have become an important type of transmission line fault. A wind deflection fault refers to a fault that causes a transmission line to deviate from its vertical position because of the action of the wind, which eventually leads to a discharge. The line is suspended on the tower through insulator strings, which are offset under the action of wind load, resulting in a gradual decrease in the distance between the line and the tower and surrounding objects. The air breakdown voltage gradually decreases. When the line voltage exceeds the breakdown voltage, air is broken down, resulting in discharge, causing line failure, and even affecting the operation of the power grid. After a wind deflection fault occurs, the transmission line may discharge to transmission towers, to other transmission lines, or neighboring trees, buildings, and other objects. All three forms of discharge leave a clear discharge path on the line. Figure 1 shows traces of damage to the tower and line caused by wind deflection discharges.
Wind deflection faults have complexity and uncertainty and are affected by the meteorological environment. Complex terrain can interfere with the judgment and processing of faults. Complex meteorological conditions such as tornadoes and thunderstorms can exacerbate faults with serious consequences. There are also many internal factors that affect wind deflection, such as the transmission line’s stall spacing, number of stalls, line type, line operating voltage, and so on. Most wind deflection faults occur at the operating voltage, and because of the continuity of wind, the wind deflection fault reclosing success rate is low.
Zheng Jiayan [1] studied the wind deflection of overhanging insulator strings under dynamic wind conditions, numerically simulated the wind deflection of overhanging insulator strings, and verified the results through tests in order to address the shortcomings of the traditional calculation methods of the wind deflection angle of overhanging insulator strings for high-voltage transmission lines. The numerical simulation results of the wind deflection of overhanging insulator strings showed that the finite element method and the multi-rigid body dynamics method were consistent with the traditional method under the effect of steady wind. However, under the effect of gust and pulsating wind load, the value of wind deflection obtained by the finite element method and the multi-rigid body dynamics method was much larger than that of the traditional static method, which is one of the main reasons for the occurrence of wind deflection and flashing accidents. Zhang Zhijin [2] studied the wind deflection characteristics of insulator strings under a typhoon environment and corrected the wind deflection angle calculation formula. Yu Jufang [3] studied the probabilistic prediction method for the wind deflection tripping of transmission lines in typhoon disasters. Li Mengchun [4] proposed a new model for calculating wind deflection based on stress changes and modified the model by combining the effects of friction and deformation. Kong Deyi [5] established a model of a transmission line in ANSYS, fully considered the coupling relationship among transmission towers, insulator strings, and lines, and investigated the effect of line coupling and wind pulsation on wind deflection. Zhou Longwu [6] proposed a method to suppress the wind deflection of pulsating wind through simulation. Clapp A.L. [7] analyzed the mechanism of line wind deflection flashover occurrence in terms of fundamentals, proposed new suggestions for transmission line system materials, dimensions, and other parameters, and recommended precise methods and rules of thumb for calculating wind loads and insulator string wind deflection angles. Hu Xin proposed a multi-rigid-body model for accurately and efficiently calculating the dynamic wind deflection response of overhead transmission lines under strong wind conditions. It was verified that the multi-rigid-body model was easier to use and faster to solve than the traditional method. Yin Peng [8] studied the scheme of a transmission tower-line system for fine modeling in ANSYS Workbench 2020 R2, focused on analyzing the influence of different treatments of rods and nodes on the computational and analytical results, put forward a simplified method of split lines, and analyzed the simplified line. Wang Tianyu [9] conducted a comprehensive study on the wind deflection characteristics of insulator strings using the finite element method, established a wind deflection model of insulator strings, and used the harmonic superposition method to generate the artificial pulsating wind field of transmission lines. The average wind and pulsating wind loads were applied to the coupling model, and the line coupling effect, the influence of line suspension height differences on both sides of the insulator string, and the dynamic amplification effect of pulsating wind were analyzed in detail. Finally, the corresponding correction coefficients of the wind loads were given. Wang Shengxue [10] studied the rigid body straight bar method in detail, proposed a wind deflection correction factor, established a new wind deflection angle calculation method, and corrected the wind pressure unevenness coefficient. Shao Tianxiao [11] rederived and simplified the formula of the rigid body straight bar method, analyzed the calculation problem of wind load, and suggested values for the relevant parameters of the fittings and insulators. Luo Gang [12] analyzed the aerodynamic damping characteristics, frequency domain calculation method, and response characteristics of wind deflection of transmission lines. They considered the relative motions of lines and wind in the horizontal and vertical directions, changes in line dynamic characteristics under the action of wind load, and deduced the generalized aerodynamic damping matrix formula of the line under the condition of average wind deflection. Finally, they researched the influence of a change in structural parameters on the wind deflection of extra-high voltage transmission lines and analyzed the static force of draped insulator string wind deflection from the angle of the single pendulum model. The effect of the variation in structural parameters on the wind deflection of UHV transmission lines was investigated, and the static wind deflection response of the overhanging insulator string was analyzed from the perspective of the single pendulum model to verify the reasonableness of the single pendulum model qualitatively. By comparing the results with the continuous multi-span finite element model, the source of the calculation error of the single pendulum model was analyzed from the principle, and correction suggestions were given to propose a new method for the wind load calculation of multi-span lines. Dong Xinsheng [13] established a finite element model of an exposed-pile transmission tower conforming to the structural characteristics of the actual line tower and analyzed the deviation in transmission lines and towers under different tower line loads, ice-cover loads, and wind loads. An Liqiang [14] proposed a systematic method, including three basic parts described as the simulation of wind and rain loads, the calculation of windage yaw, and flashover analysis, to analyze windage yaw flashovers of transmission lines. Zhou Chao [15] proposed a unified model with a derived stability criterion to analyze large swings of the overhead conductor. The analytical model was solved by the finite element method with aerodynamic coefficients obtained from simulated rain-wind tests, considering the effect of wind velocities, upper rivulet motion, rainfall rates, and rain loads on the large swings of overhead transmission lines. However, there is insufficient research on wind deflection warnings for conventional situations. Therefore, it is necessary to study wind deflection warnings and the influence factors of transmission lines based on meteorological prediction.
In this study, the ANSYS Workbench finite element analysis platform is used to establish a model of the transmission line-suspended insulator string system. The transmission line is calculated under different stall spacing, height differences, wind speeds, and wind attack angles, and the wind deflection angles of the insulators under corresponding conditions are obtained. The influence of different factors on the wind deflection of the insulators is analyzed. Based on the generalized linear regression network and particle swarm-improved support vector machine algorithm, a hierarchical warning method for the wind deflection of transmission lines based on meteorological prediction is proposed, which realizes the early warning of the wind deflection of transmission lines.

2. Methods

2.1. Simulation Method

According to the actual situation, the insulator models selected in this paper are FXBW-1000/300 and FXBW-500/160, and the specific parameters of the insulator are shown in Table 1. The line model selected in this paper is JL/LB20A-720/50, the shape of the line is round-stranded, and the parameters of the line are shown in Table 2. The boundaries and connections of the model are constrained to limit the displacement in the X-, Y-, and Z-directions. The schematic of the model is shown in Figure 2.
Simulation calculations are carried out for the models with different stall spacing to analyze the effect of stall spacing on the wind deflection angle of insulator strings. Simulation calculations are also carried out for models with varying height differences to analyze the effect of height differences on the wind deflection angle of insulator strings. Wind loads with different wind attack angles are applied to the model to analyze the effect of the wind attack angle on the wind deflection angle of insulator strings. Wind loads corresponding to static and pulsating winds with different wind speeds are applied to the model to analyze the effect of wind speed on the wind deflection angle of insulator strings.

2.2. Correlation Analysis of Meteorological Elements

Hour-by-hour data on the barometric pressure, wind speed, wind direction, temperature and humidity observed at a weather station for 14 days are analyzed for correlation of meteorological elements using Copula theory.
(1)
Kernel density estimation (KDE) is utilized to estimate the density function of each input separately. The Gaussian function is chosen as the kernel function of KDE, and the expression of Gaussian function is:
K u = 1 2 π e ( 1 2 u 2 )
where u represents the distance or similarity between two vectors and K(u) measures the similarity or correlation between two vectors.
The KDE expression is:
f h x = 1 n h 2 π i = 1 n e ( x X i ) 2 2 h 2
where Xi is a random variable, h is the window width, and n is the sample size.
(2)
Next, the unknown parameters of the binary Copula function are solved, and the binary Copula function is constructed. The binary t-Copula function is chosen to analyze the correlation of meteorological factors. The distribution function of the binary t-Copula function is:
C u , v ; ρ = T λ 1 ( u ) T λ 1 ( v ) 1 2 π 1 ρ 2 [ 1 + s 2 + t 2 2 ρ s t λ ( 1 ρ 2 ) ] λ + 2 2 d s d t
where u and v indicate the correlation between two variables and C describes the correlation structure between two variables. λ is the degree of freedom, T λ 1 u and T λ 1 ( v ) are the inverse functions of the distribution function, and ρ is the parameter of the correlation between the two distribution functions, which takes values ranging from −1 to 1.
(3)
Finally, the correlation parameters between the input quantities are calculated. The Spearman rank correlation coefficient ρ is chosen to evaluate the degree of correlation between the two meteorological elements. The formula for the Spearman rank correlation coefficient ρ is derived from the Copula function as:
12 0 1 0 1 C u , v d u d v 3

2.3. Weather Prediction Based on Generalized Regression Neural Networks

A generalized regression neural network is a neural network with a four-layer structure, including an input layer, pattern layer, summation layer, and output layer. The specific network structure is shown in Figure 3.
(1)
Division of the training set and the test set
The rapidity of a GRNN training network is fully utilized, and the method of dividing the training set dynamically is adopted. That is, when the prediction of meteorological elements at a certain moment t is carried out, the meteorological element data in the first 10 days of the moment t are used as the training set of the network. The prediction of meteorological elements in the latter 4 days is carried out to analyze the prediction effect of the GRNN network.
(2)
Determination of network inputs and outputs
Considering the interaction among barometric pressure, wind direction, wind speed, temperature, and humidity, the inputs to the network contain all five factors. In turn, separate predictions are made for barometric pressure, wind direction, wind speed, temperature and humidity. The inputs to the network are constructed according to the following rule: it is assumed that the prediction of barometric pressure, wind direction, wind speed, temperature, and humidity at instant t on a given day requires the barometric pressure, wind direction, wind speed, temperature, and humidity at instant t − 1 on the same day. It also requires the barometric pressure, wind direction, wind speed, temperature, and humidity at the previous day’s t − 2, t − 1, t, t + 1 and t + 2 moments and the previous day’s two day’s t − 2, t − 1, t, t + 1 and t + 2 moments of barometric pressure, wind direction, wind speed, temperature, and humidity.
The output of the network is:
Y = [ P , D , S , T , H ]
where P, D, S, T and H are the barometric pressure, wind direction, wind speed, temperature, and humidity at the predicted moment t.
(3)
Training of the GRNN to determine the optimal prediction model parameters
A dynamic prediction model is established, i.e., the network is trained once for each sample point prediction performed. Therefore, the optimal GRNN parameters for each sample point prediction are only relevant to the current prediction performed and are not deterministically constant.
(4)
Establishment of the GRNN-based meteorological prediction model
Each time a prediction is made for barometric pressure, wind direction, wind speed, temperature, and humidity at a certain moment in time, the prediction model constructed is only relevant to this prediction process and is not static.

2.4. Wind Deflection Warning Based on the Particle Swarm Optimization Support Vector Machine Algorithm

The calculation flow of the transmission line wind deflection warning model based on the support vector machine algorithm optimized by the particle swarm algorithm is shown in Figure 4. The powerful and concise optimization ability of PSO is utilized to obtain the optimal parameters of the SVM model, which is used to establish the optimal SVM classification model, thus realizing the hierarchical warning of wind deflection in transmission lines. The specific steps are described below.
(1)
Initialize the parameters (c, g) of the SVM model and encode the initialized parameters as the original particles of the PSO algorithm.
(2)
Initialize the number of particles N and generate N particles by randomly perturbing the original particles (i.e., initialize the particle positions) and initialize the rest of the parameters of the PSO algorithm (vi, w, c1, c2).
(3)
Obtain the optimal parameters of SVM by the PSO algorithm.
(4)
Use the obtained optimal parameters to construct an SVM classification model for wind deflection classification warning.

3. Results

3.1. Influencing Factors of Wind Deflection

The results of the variation in the wind deflection angle with stall distance, height difference, wind attack angle, and wind speed are shown in Figure 5.

3.2. The Result of the Correlation Analysis

The results of the calculation of the rank correlation coefficient ρ are shown in Table 3. A larger absolute value of ρ indicates a stronger correlation. It can be found that the correlation between barometric pressure and wind speed is the smallest, only −0.0120, but the correlation between wind speed and humidity reaches −0.4286, while the correlation between barometric pressure and humidity reaches −0.5809. Thus, the prediction of wind speed cannot ignore the influence of barometric pressure.

3.3. The Result of Weather Prediction

A comparison of the measured and predicted values of barometric pressure, wind direction, wind speed, temperature, and humidity is shown in Figure 6.

3.4. Effectiveness of the Wind Deflection Graded Warning

Combined with the occurrence of wind deflection in transmission lines, wind speed, wind direction, temperature, and humidity are taken as the characteristic quantities of a wind deflection warning, and the risk of wind deflection in transmission lines is described in five levels. The specific rules of warning level division are shown in Table 4.
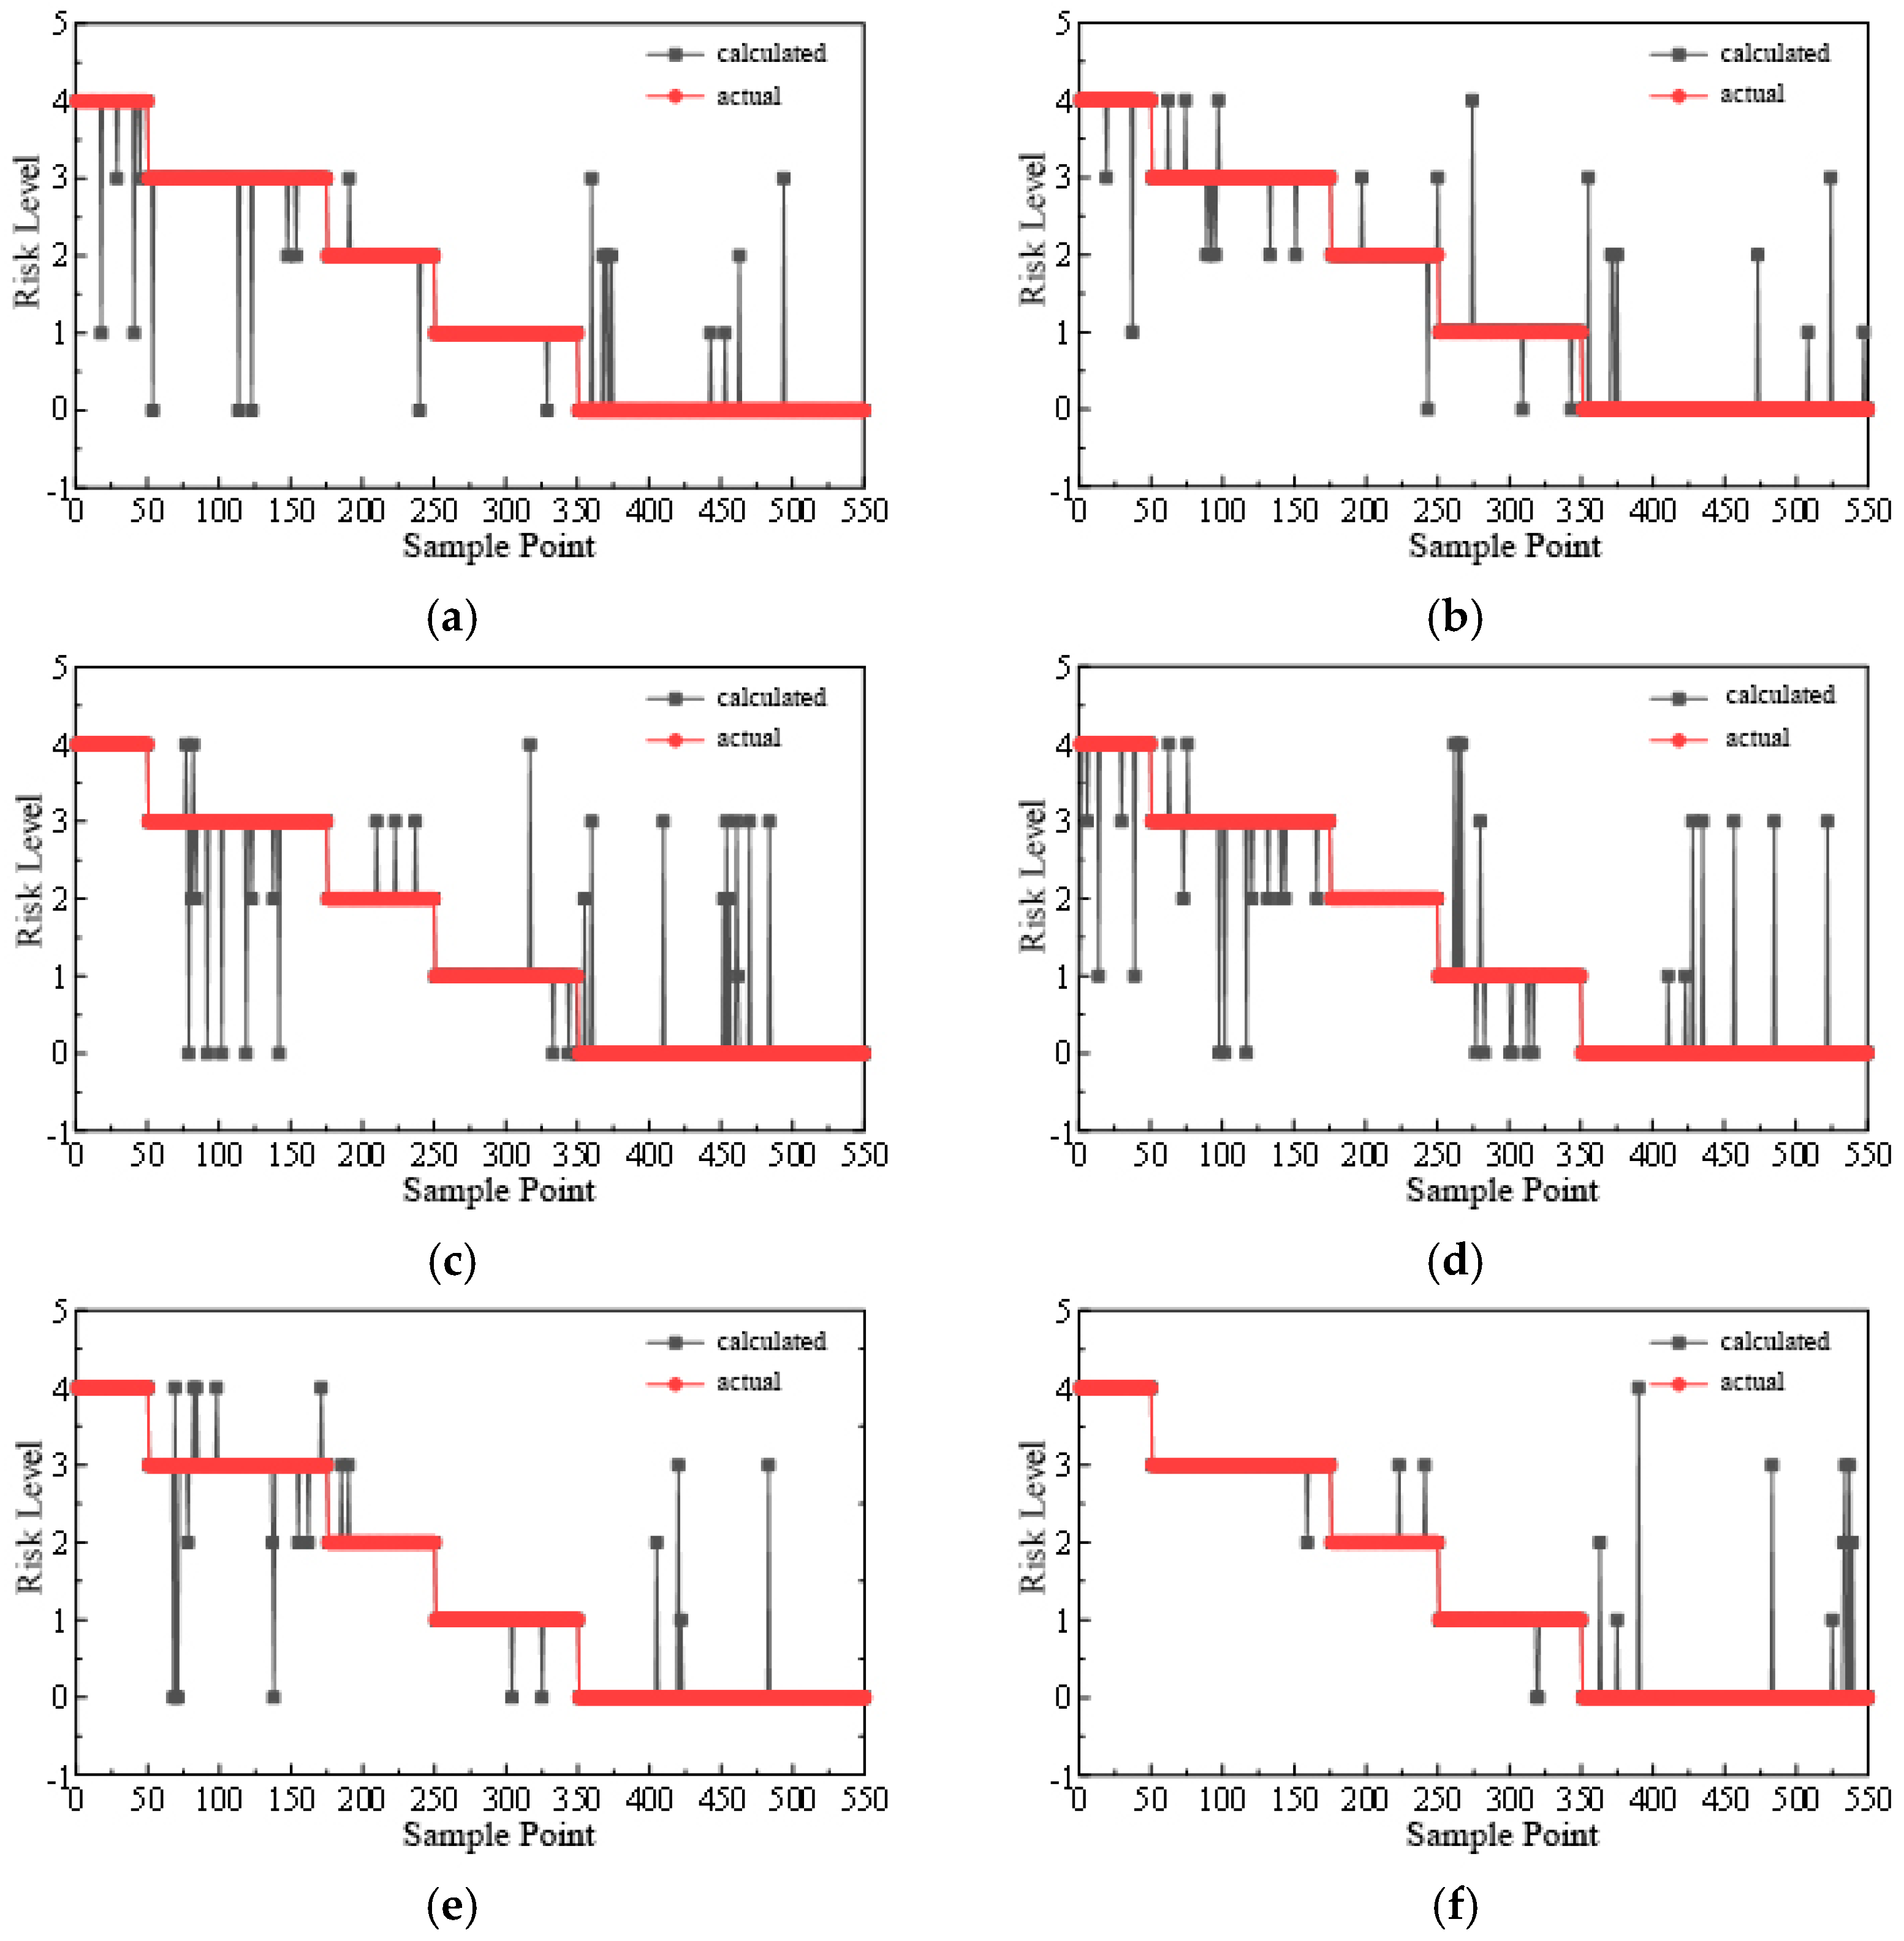
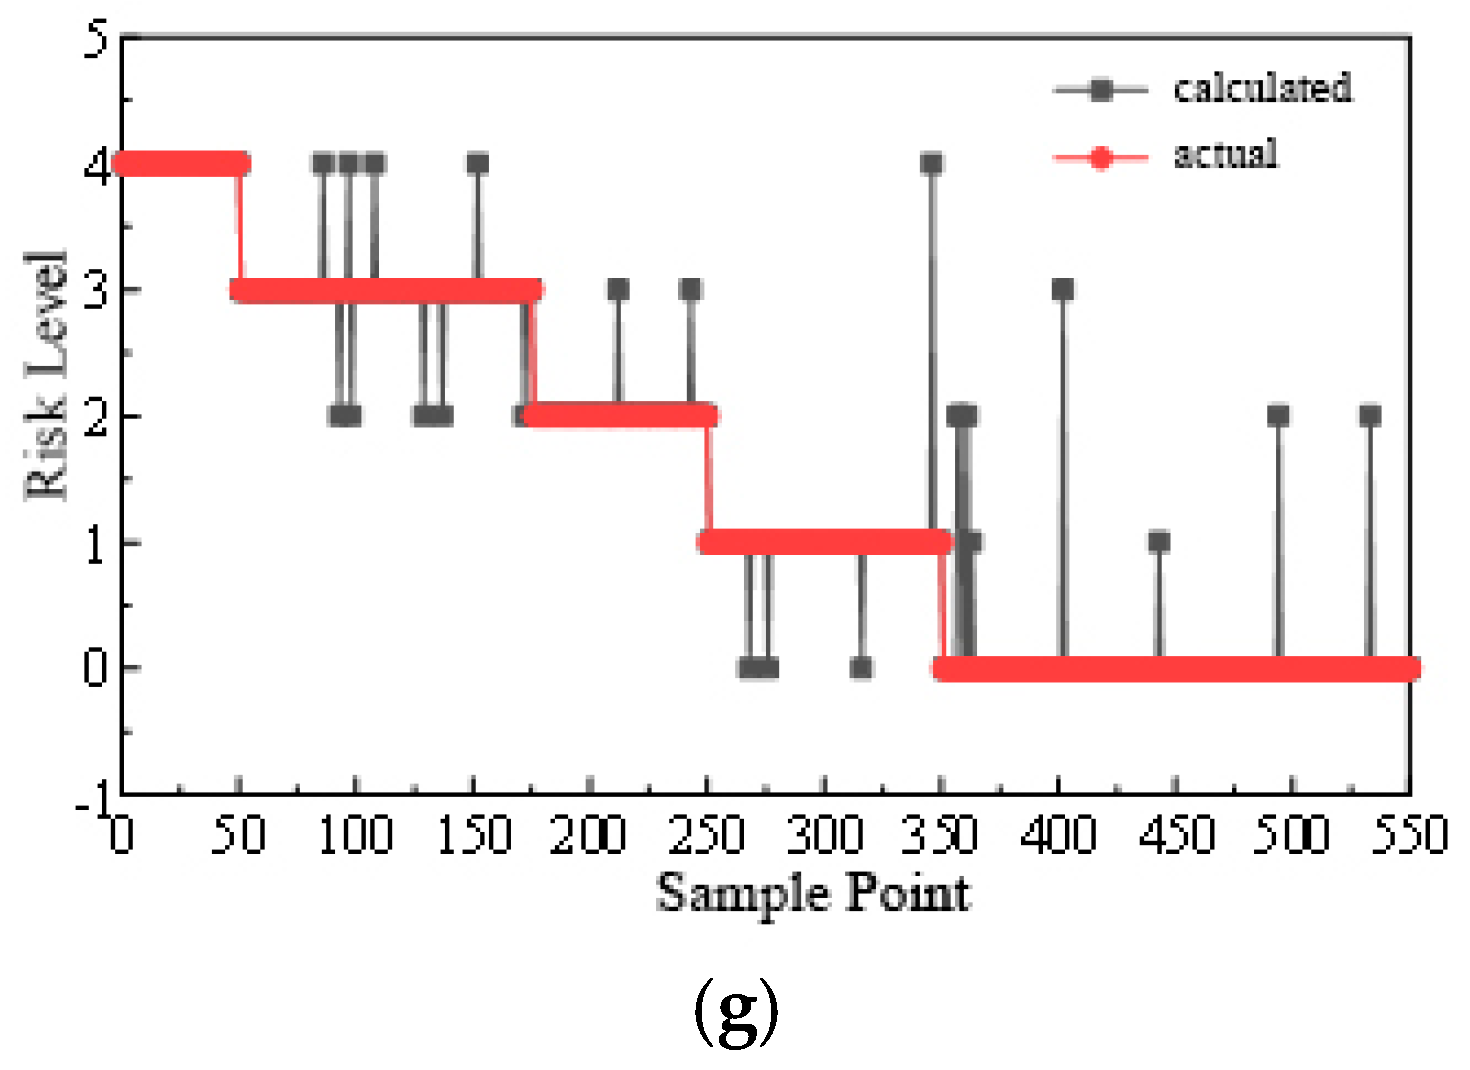
The effectiveness of the model was evaluated. A comparison of the actual risk level with the model’s calculated risk level is shown in Figure 7. It can be found that for the vast majority of each data set, the proposed hierarchical warning model can perform accurate classification and identification. The sample point distribution of misclassification is random in nature, with misclassification occurring at either risk level.
The wind deflection prediction method proposed in this paper can predict the probability of wind deflection based on wind direction, wind speed, temperature, and humidity, and a wind deflection early warning and monitoring system for transmission lines can be established based on this method. The system mainly consists of front-end devices such as acquisition devices, transmission and power supply devices, servers, and management terminals. The system topology is shown in Figure 8. The acquisition device consists of a micrometeorological sensor (a four-element integrated sensor for temperature, humidity, wind speed, and wind direction) and an industrial-grade camera. The transmission device adopts a 5G industrial gateway, and the power supply device adopts a solar-powered system. The micrometeorological sensor transmits the collected meteorological information to the 5G gateway through the RS485 port, the camera transmits the collected video to the 5G gateway through the RJ45 port, and the 5G gateway transmits the data transmitted from the collection device to the server through the 5G wireless network for data analysis and processing by the management terminal. The system software accesses the database in the server, reads the meteorological monitoring data, and processes the monitoring data by embedding the method and the video images captured by the camera in the software. This system has the potential for pilot applications.

4. Discussion

The trend in the wind deflection angle of insulators for both voltage level models at different stall spacing is consistent. The wind deflection angle of the insulators increases with an increase in the stall spacing and tends to level off gradually. This is because, under the same wind speed, the ratio of the gravity load of the insulator to the wind load is larger than the ratio of the gravity load of the line to the wind load. At small stall spacing, the force on the insulator has a greater influence on the wind deflection, and as the stall spacing increases, the wind deflection angle of the insulator depends more on the force on the line.
A comparison of the wind deflection angles for the two voltage levels at the same stall spacing shows that the wind deflection angle for 500 kV insulators is greater than that for 1000 kV insulators at the same stall spacing. This is because 1000 kV insulators have longer string lengths and higher gravity loads, so the wind deflection angle is smaller. The difference in the wind deflection angle between the two voltage levels decreases with increasing stall spacing.
Changing the height difference has a large and consistent effect on the wind deflection angle of the hanging insulators for both voltage levels of the model. The wind deflection angle of the central insulator increases with a decrease in the hanging point of the central insulator. This is because the difference in height will change the hanging pattern of the line, thus affecting the vertical pitch of the line in the wind deflection calculation. When the height difference becomes larger, the center of gravity of the line will be shifted to the central insulator, and the vertical pitch will be reduced. At the same time, the horizontal stall spacing remains unchanged, the vertical load applied to the central insulator is reduced, and the horizontal load is basically unchanged. Thus, the wind deflection angle becomes larger.
Comparing the wind deflection angles of two voltage levels at the same height difference, it is found that the wind deflection angle of 500 kV insulators is larger than that of 1000 kV insulators at the same height difference, and the difference between the two increases with an increase in the height difference. This is because as the height difference increases, the vertical load transferred from the line to the end of the insulator decreases, the weight of the insulator increases as a proportion of the vertical load in the wind deflection calculation, and the weight of the 1000 kV insulator is greater than that of the 500 kV insulator.
The wind deflection angle of the insulators under both voltage levels of the model shows an increasing trend with an increase in the wind attack angle. This is because, with an increase in the wind attack angle, the loads in the horizontal and vertical directions of the line are reduced. At the same time, the change rate of the vertical load is higher than that of the horizontal load, so the wind deflection angle increases with an increase in the wind attack angle.
Comparing the wind deflection angles of two voltage levels under the same wind attack angle, it is found that the wind deflection angle of 500 kV insulators is larger than that of 1000 kV insulators under the same wind attack angle. The difference between the two gradually increases with an increase in the wind attack angle.

5. Conclusions

This paper established a transmission line-suspended insulator string system model, analyzed the influence of different factors on wind deflection, and established a wind deflection early warning system. The main conclusions are as follows:
(1)
The wind deflection of 1000 kV and 500 kV insulator strings has the same rule of change with line conditions. The larger the stall spacing, the larger the height difference, the larger the wind attack angle, and the larger the wind speed, the larger the wind deflection of insulators. The wind deflection of 500 kV insulator strings is slightly larger than that of 1000 kV insulator strings.
(2)
The effect of pulsating wind on transmission lines is about 5% higher than that of static wind. Wind with a positive wind attack angle promotes the wind deflection of transmission lines, while wind with a negative wind attack angle inhibits it.
(3)
Both wind speed and the wind attack angle have a certain range of influence on the wind bias of transmission lines. When they are within a certain range, the line has a similar response to the load, which should be emphasized in the monitoring.
(4)
The average accuracy of the model is 95.74%, the average false alarm rate is 2.34%, the average misreporting rate is 0.94%, and the average omission rate is 0.98%. Accurate warnings as well as false alarms are conducive to maintaining the normal operation of transmission lines, which are considered effective warnings. Misreporting will still cause concern to staff. Only omission may lead to risk discovery, thus affecting the safety and stability of transmission lines. This model has an average misreporting rate of less than 1%, an effective warning rate of greater than 98%, and an early warning rate of greater than 99%. The overall prediction effect is good, which proves the feasibility of the meteorological prediction model based on GRNN. There is a complex correlation among barometric pressure, wind speed, wind direction, temperature, and humidity, and only by comprehensively considering the interactions of each meteorological element can we predict the meteorological factors more accurately.

Author Contributions

Conceptualization, Y.L.; Methodology, Y.G.; Software, B.W.; Validation, Q.L.; Formal analysis, Q.G.; Investigation, Y.W. All authors have read and agreed to the published version of the manuscript.

Funding

This research received no external funding.

Data Availability Statement

Data are contained within the article.

Conflicts of Interest

Q.L. was employed by Tangshan Power Supply Company of State Grid Jibei Electric Power Co., Ltd. Q.G. was employed by Chengnan District Power Supply Company of State Grid Tianjin Electric Power Co. Y.W. was employed by Electric Power Research Institute State Grid Xinjiang Co., Ltd. The remaining authors declare that the research was conducted in the absence of any commercial or financial relationships that could be construed as a potential conflict of interest.

References

  1. Zheng, J. Calculation of Wind Deflection of Overhanging Insulator String under Dynamic Wind. Master’s Thesis, Chongqing University, Chongqing, China, 2006. [Google Scholar]
  2. Zhang, Z.; Ji, Y.; Xu, J.; Wang, X.; Jiang, X. Wind deflection characteristics and correction of composite insulators in coastal typhoon environment. Grid Technol. 2023, 47, 2977–2985. [Google Scholar]
  3. Yu, J. Research on Key Technology of Failure Risk Prediction of Power Transmission and Distribution Equipment under Typhoon Disaster. Master’s Thesis, Wuhan University of Technology, Wuhan, China, 2021. [Google Scholar]
  4. Li, M.; Zhang, Y.; Yang, B.; Xue, H.; Lv, Y.; Zhang, M. Calculation and analysis of minimum clearance distance for wind deflection of pendant insulator string. Electr. Meas. Instrum. 2012, 49, 7–10. [Google Scholar]
  5. Kong, D.; Li, L.; Long, X.; Liang, Z. Finite Element analysis of dynamic wind deflection angle of overhanging insulator string. Electr. Power Constr. 2008, 9, 5–9. [Google Scholar]
  6. Zhou, L.; Yan, X.; Li, S.; Yin, F.; Wang, L. Simulation of pulsating wind bias characteristics and suppression measures for ultra-high voltage lines. Electr. Porcelain Surge Arrester 2022, 4, 194–200+213. [Google Scholar]
  7. Clapp, A.L. Calculation of Horizontal Displacement of Conductors Under Wind Loading Toward Buildings and Other Supporting Structures. Ind. Appl. IEEE Trans. 1994, 30, 496–504. [Google Scholar] [CrossRef]
  8. Yin, P. Research on Dynamic Characteristics and Wind Vibration Control of Large Span Transmission Tower-Line System. Doctoral Thesis, Huazhong University of Science and Technology, Wuhan, China, 2009. [Google Scholar]
  9. Wang, T. Research on Wind Deflection of Ultra-High Voltage V-Type Insulator String. Master’s Thesis, Huazhong University of Science Technology, Wuhan, China, 2015. [Google Scholar]
  10. Wang, S.; Wu, G.; Fan, J.; Zhou, J.; Jiang, W. Study on wind-biased flashover of draped insulator strings on 500kV transmission lines. Grid Technol. 2008, 09, 65–69. [Google Scholar]
  11. Shao, T. Discussion on the calculation of sway angle and wind load of pendant insulator string. Electr. Power Constr. 1991, 04, 23–27+32. [Google Scholar]
  12. Luo, G. Research on Refined Analysis of Wind Deflection and Equivalent Static Wind Load of Power Transmission Conductor. Doctoral Thesis, Zhejiang University, Hangzhou, China, 2017. [Google Scholar]
  13. Dong, X.; Wen, G.; Zhao, M.; Yang, Y.; Li, M.; Zhao, L. Study of the Prevention Method of ±800 kV Transmission Tower Foundation Deviation. Energies 2023, 16, 2557. [Google Scholar] [CrossRef]
  14. An, L.; Guan, Y.; Zhu, Z.; Zhang, R. Research on Windage Yaw Flashovers of Transmission Lines under Wind and Rain Conditions. Energies 2019, 12, 3728. [Google Scholar] [CrossRef]
  15. Zhou, C.; Yin, J.; Liu, Y. Large Swing Behavior of Overhead Transmission Lines under Rain-Load Conditions. Energies 2018, 11, 1092. [Google Scholar] [CrossRef]
Figure 1. Damage caused by wind deflection discharges. (a) Traces of damage on a tower and (b) traces of damage on the line.
Energies 17 02612 g001
Figure 2. The schematic of the model.
Energies 17 02612 g002
Figure 3. GRNN structure schematic.
Energies 17 02612 g003
Figure 4. PSO-SVM-based transmission line wind deflection warning model.
Energies 17 02612 g004
Figure 5. The variation in the wind deflection angle with different influencing factors. (a) The variation with different stall spacing. (b) The variation with height differences. (c) The variation with different wind attack angles. (d) The variation with different wind speeds.
Energies 17 02612 g005
Figure 6. The variation in the wind deflection angle with different influencing factors. (a) Barometric pressure. (b) Wind direction. (c) Wind speed. (d) Temperature. (e) Humidity.
Energies 17 02612 g006
Figure 7. Comparison of actual risk levels and model-calculated risk levels. (a) Group 1. (b) Group 2. (c) Group 3. (d) Group 4. (e) Group 5. (f) Group 6. (g) Group 7.
Energies 17 02612 g007aEnergies 17 02612 g007b
Figure 8. The system topology.
Energies 17 02612 g008
Table 1. Insulator parameters.
Insulator TypeParameter
Modulus of Elasticity (Pa)Poisson’s RatioDensity (kg/m3)String Length (m)Equivalent Diameter (m)
FXBW-1000/4203.5 × 10100.320,000102.6 × 10−2
FXBW-500/1003.5 × 10100.324,00061.8 × 10−2
Table 2. Line parameters.
Line TypeParameter
Modulus of Elasticity (Pa)Poisson’s RatioDensity (kg/m3)Diameter (m)Cross-Sectional Area (m2)
JL/LB20A-720/506 × 10100.32.43.53 × 10−27.55 × 10⁻⁴
Table 3. Calculation of the rank correlation coefficient.
Meteorological ElementsBarometric PressureWind SpeedWind DirectionTemperatureHumidity
Barometric pressure1−0.01200.2281−0.6208−0.5809
Wind speed−0.01201−0.17700.2372−0.4286
Wind direction0.2281−0.177010.1404−0.3024
Temperature−0.62080.23720.14041−0.2253
Humidity−0.5809−0.4286−0.3024−0.22531
Table 4. Early warning classification.
Risk LevelCharacteristic
Level 0No risk of wind deflection and low wind effects
Level 1No risk of wind deflection and high wind effects
Level 2Lower risk of wind deflection and high wind effects
Level 3Moderate risk of wind deflection and high wind effects
Level 4Higher risk of wind deflection and high wind effects
Disclaimer/Publisher’s Note: The statements, opinions and data contained in all publications are solely those of the individual author(s) and contributor(s) and not of MDPI and/or the editor(s). MDPI and/or the editor(s) disclaim responsibility for any injury to people or property resulting from any ideas, methods, instructions or products referred to in the content.