Article

Aerial Inspection of High-Voltage Power Lines Using YOLOv8 Real-Time Object Detector

Department of Electronic and Electrical Engineering, Brunel University London, Kingston Lane, Uxbridge UB8 3PH, UK
*
Author to whom correspondence should be addressed.
Energies 2024, 17(11), 2535; https://doi.org/10.3390/en17112535
Submission received: 16 January 2024 / Revised: 21 February 2024 / Accepted: 22 May 2024 / Published: 24 May 2024
(This article belongs to the Special Issue Challenges and Progress in Power System Analysis and Control)

Abstract

:
The aerial inspection of electricity infrastructure is gaining high interest due to the rapid advancements in unmanned aerial vehicle (UAV) technology, which has proven to be a cost- and time-effective solution for deploying computer vision techniques. Our objectives are focused on enabling the real-time detection of key power line components and identifying missing caps on insulators. To address the need for real-time detection, we evaluate the latest single-stage object detector, YOLOv8. We propose a fine-tuned model based on YOLOv8’s architecture, trained on a custom dataset with three object classes, i.e., towers, insulators, and conductors, resulting in an overall accuracy rate of 83.8% ([email protected]). The model was tested on a GeForce RTX 3070 (8 GB), as well as on a CPU, reaching 243 fps and 39 fps for video footage, respectively. We also verify that our model can serve as a baseline for other power line detection models; a defect detection model for insulators was trained using our model’s pre-trained weights on an open-source dataset, increasing precision and recall class predictions (F1-score). The model achieved a 99.5% accuracy rate in classifying defective insulators ([email protected]).

1. Introduction

Global energy demand, industrial or residential, is growing over the years, making the energy sector uniquely critical. As a result, the proper maintenance and periodical inspection of such critical infrastructure are a priority and a challenge as well. This research addresses the challenge of high-voltage transmission line surveillance and inspection. Traditionally, power line inspections have been conducted manually by workers, assisted mainly by helicopters. These methods are not only costly but also time-consuming and expose workers to high risk [1]. As a result, researchers have shifted their focus towards automated, remote inspection solutions utilizing unmanned aerial vehicles (UAVs), or drones. Drones provide more efficient and safer means of conducting inspections and have become increasingly popular for monitoring critical infrastructure in hard-to-reach areas, such as transmission line networks. The efficiency of drone-based intelligent inspections is estimated to be 2.5 times that of traditional methods, significantly aiding grid maintenance personnel by saving time and reducing effort [2]. The latest advancements in this area have seen the integration of drones with artificial intelligence (AI), further enhancing the efficiency and accuracy of the inspection process. Overall, this technology has the potential to have a significant impact on the power industry, helping to ensure that power line systems can meet the increasing demand for energy while maintaining safety. To this end, this study investigates automatic power line detection models based on the latest single-stage detector, YOLOv8 [3]. YOLO stands for You Only Look Once [4], because unlike previous regional neural networks (RCNNs), where the neural network made predictions after creating several regions of interest (ROIs) within an image, in YOLO the input image is passed only once through the process.
This work is part of a project that aims for visual-based navigation over power lines for a fully automated inspection solution. This purpose requires a system that is able to recognize all the major components of high-voltage electricity facilities from a longer distance; namely towers, insulators, and conductors, and then approach at a closer distance to differentiate between normal and defective insulators (missing caps). For this purpose, we created an image dataset consisting of both drone and ground footage in order to train a YOLOv8 model for detecting power line components in their normal state. Pre-trained weights derived from this process were then utilized to train a model for detecting defective insulators on an open-source dataset. Our work proved that the pre-trained weights of our model can improve precision and recall when training other YOLOv8 models for defect detection applications.
Concurrently, this work offers publicly accessible models and an image dataset to facilitate the further research of power line inspection. This initiative is particularly noteworthy given the existing scarcity of open-source data in the field.

1.1. Contributions

This research enhances existing knowledge, providing useful insights in the field of visual-based power line inspection with three main contributions:
  • In this work, we created an image dataset with annotation files, both for object detection (bounding boxes) and instance segmentation (polygons), containing 2056 images of the three main components of high-voltage power line facilities: towers, insulators, and conductors. To the best of our knowledge, there is only one dataset publicly available, containing 1100 images of high-voltage towers and conductors with annotations for instance segmentation [5], indicating the need for more data in the field.
  • Our proposed method of utilizing our model’s pre-trained weights for detecting defects of insulators increased precision and recall class predictions (f1-score), outperforming state-of-the-art work.
  • This work contributes to the evaluation of recently developed YOLOv8-based models for real-time power line detection, focusing on the capabilities of onboard processing. The research builds upon our prior work [6], improving the detection accuracy across all three object classes.

1.2. Related Work

In the past five years, researchers have been increasingly interested in utilizing deep learning techniques for detecting electrical components and conducting fault diagnosis. This interest stems from the advantages offered by computer vision technology, such as the ability to accurately and rapidly detect multiple objects. In [7], researchers carried out a pioneering work in this field, employing a convolutional neural network (CNN) to classify the status of insulators. Their approach involved extracting features from multiple patches using a CNN model, which served as a representation of the insulator’s status. These extracted features were then used to train a support vector machine (SVM) for classification purposes. Interesting results were also obtained from the Region-CNN approach algorithms, as demonstrated in studies [8,9]. These studies showed that deep learning has the potential to enable fully automated power line inspections, achieving high accuracy results with a mean average precision (mAP) of over 90%. Recently, there has been a focus on striking a balance between accuracy and speed, leading to the exploration of single-stage detectors. Among various deep neural architectures, the YOLO family has gained prominence since 2019. In [10,11], YOLOv2 and YOLOv3, respectively, were assessed for their effectiveness in detecting and classifying distribution line poles. These models outperformed previous Faster-RCNN models in terms of both mAP and detection speed. In our previous work [6], a YOLOv5-based model achieved an 82.3% mAP 0.50 for detecting high-voltage towers, conductors, and insulators, reaching 33 fps detection speed in a UAV flight, using a Jetson Nano (Nvidia Corporation, Santa Clara, CA, USA) for onboard processing. Furthermore, YOLOv5 was fine-tuned using a custom dataset and evaluated for its ability to detect normal and defective insulators in [12]. For other smaller objects found in transmission lines, such as dampers, spacers, and adjusting plates, an optimized YOLOv5 algorithm was proposed in [13], demonstrating high accuracy and speed. An image enhancement method based on illumination correction and compensation was combined with a fine-tuned YOLOv5 model in [14] to detect defective insulators, reaching a 94.79% mAP on the open-source dataset (CPLID). On the same dataset, ref. [15] achieved an even higher overall mAP of 97.82% and a detection speed of 43.2 fps. Finally, a method to enhance the feature extraction capability of the YOLOv5-small neural network was attempted in [16] to improve the detection performance while maintaining high speed. In [17], researchers achieved the highest results so far in detecting defective insulators, with the F1-score reaching 99.64%, using the latest YOLOv8 architecture combined with PS-ProtoPNet.

2. Materials and Methods

2.1. Methodology

This work experiments on YOLOv8 architecture, which is the latest object detector of the YOLO models. Object detection is a technique in computer vision that enables the identification and positioning of objects in images or videos. It merges the concepts of image classification and object localization. Image classification is the process of determining the category of objects in an image, while object localization involves pinpointing the objects’ positions, typically by surrounding them with a bounding box to mark their boundaries. Object detection models are trained on relatively large datasets containing images annotated with bounding boxes and class labels. These models learn to recognize patterns, shapes, and features that correspond to various objects, enabling them to detect these objects in new, unseen images. In YOLO, the input image is passed through the neural network only once to make predictions. This offers fast predictions achieving real-time object detection with a video stream of less than 25 ms latency [4]. The input image is divided into grid cells (S × S), and each of them corresponds to bounding box predictions, confidence scores for these boxes, and class probabilities. Figure 1 depicts the generic YOLO algorithm’s process. YOLO has received several improvements—YOLOv2 [18], YOLOv3 [19], YOLOv4 [20], and YOLOv5 [21], reaching YOLOv8 in 2023 [3]—by the Ultralytics team. YOLOv8 introduces a novel architecture, with faster and more accurate predictions on the MS-COCO dataset, anchor-free detections, and an additional application of instance segmentation (mask branch). The architecture of YOLOv8 comprises two main components, the backbone and the head:
a.
The backbone is based on a modified CSPDarknet53 architecture, consisting of 53 convolutional layers, while incorporating cross-stage partial connections to enable enhanced information flow between the layers.
b.
The head is composed of several convolutional layers followed by fully connected layers. These layers play a crucial role in predicting bounding boxes and class probabilities for detected objects in an image.
Similar to YOLOv5, we find five different variations (nano, small, medium, large, and xlarge) depending on the layers’ depth and width.
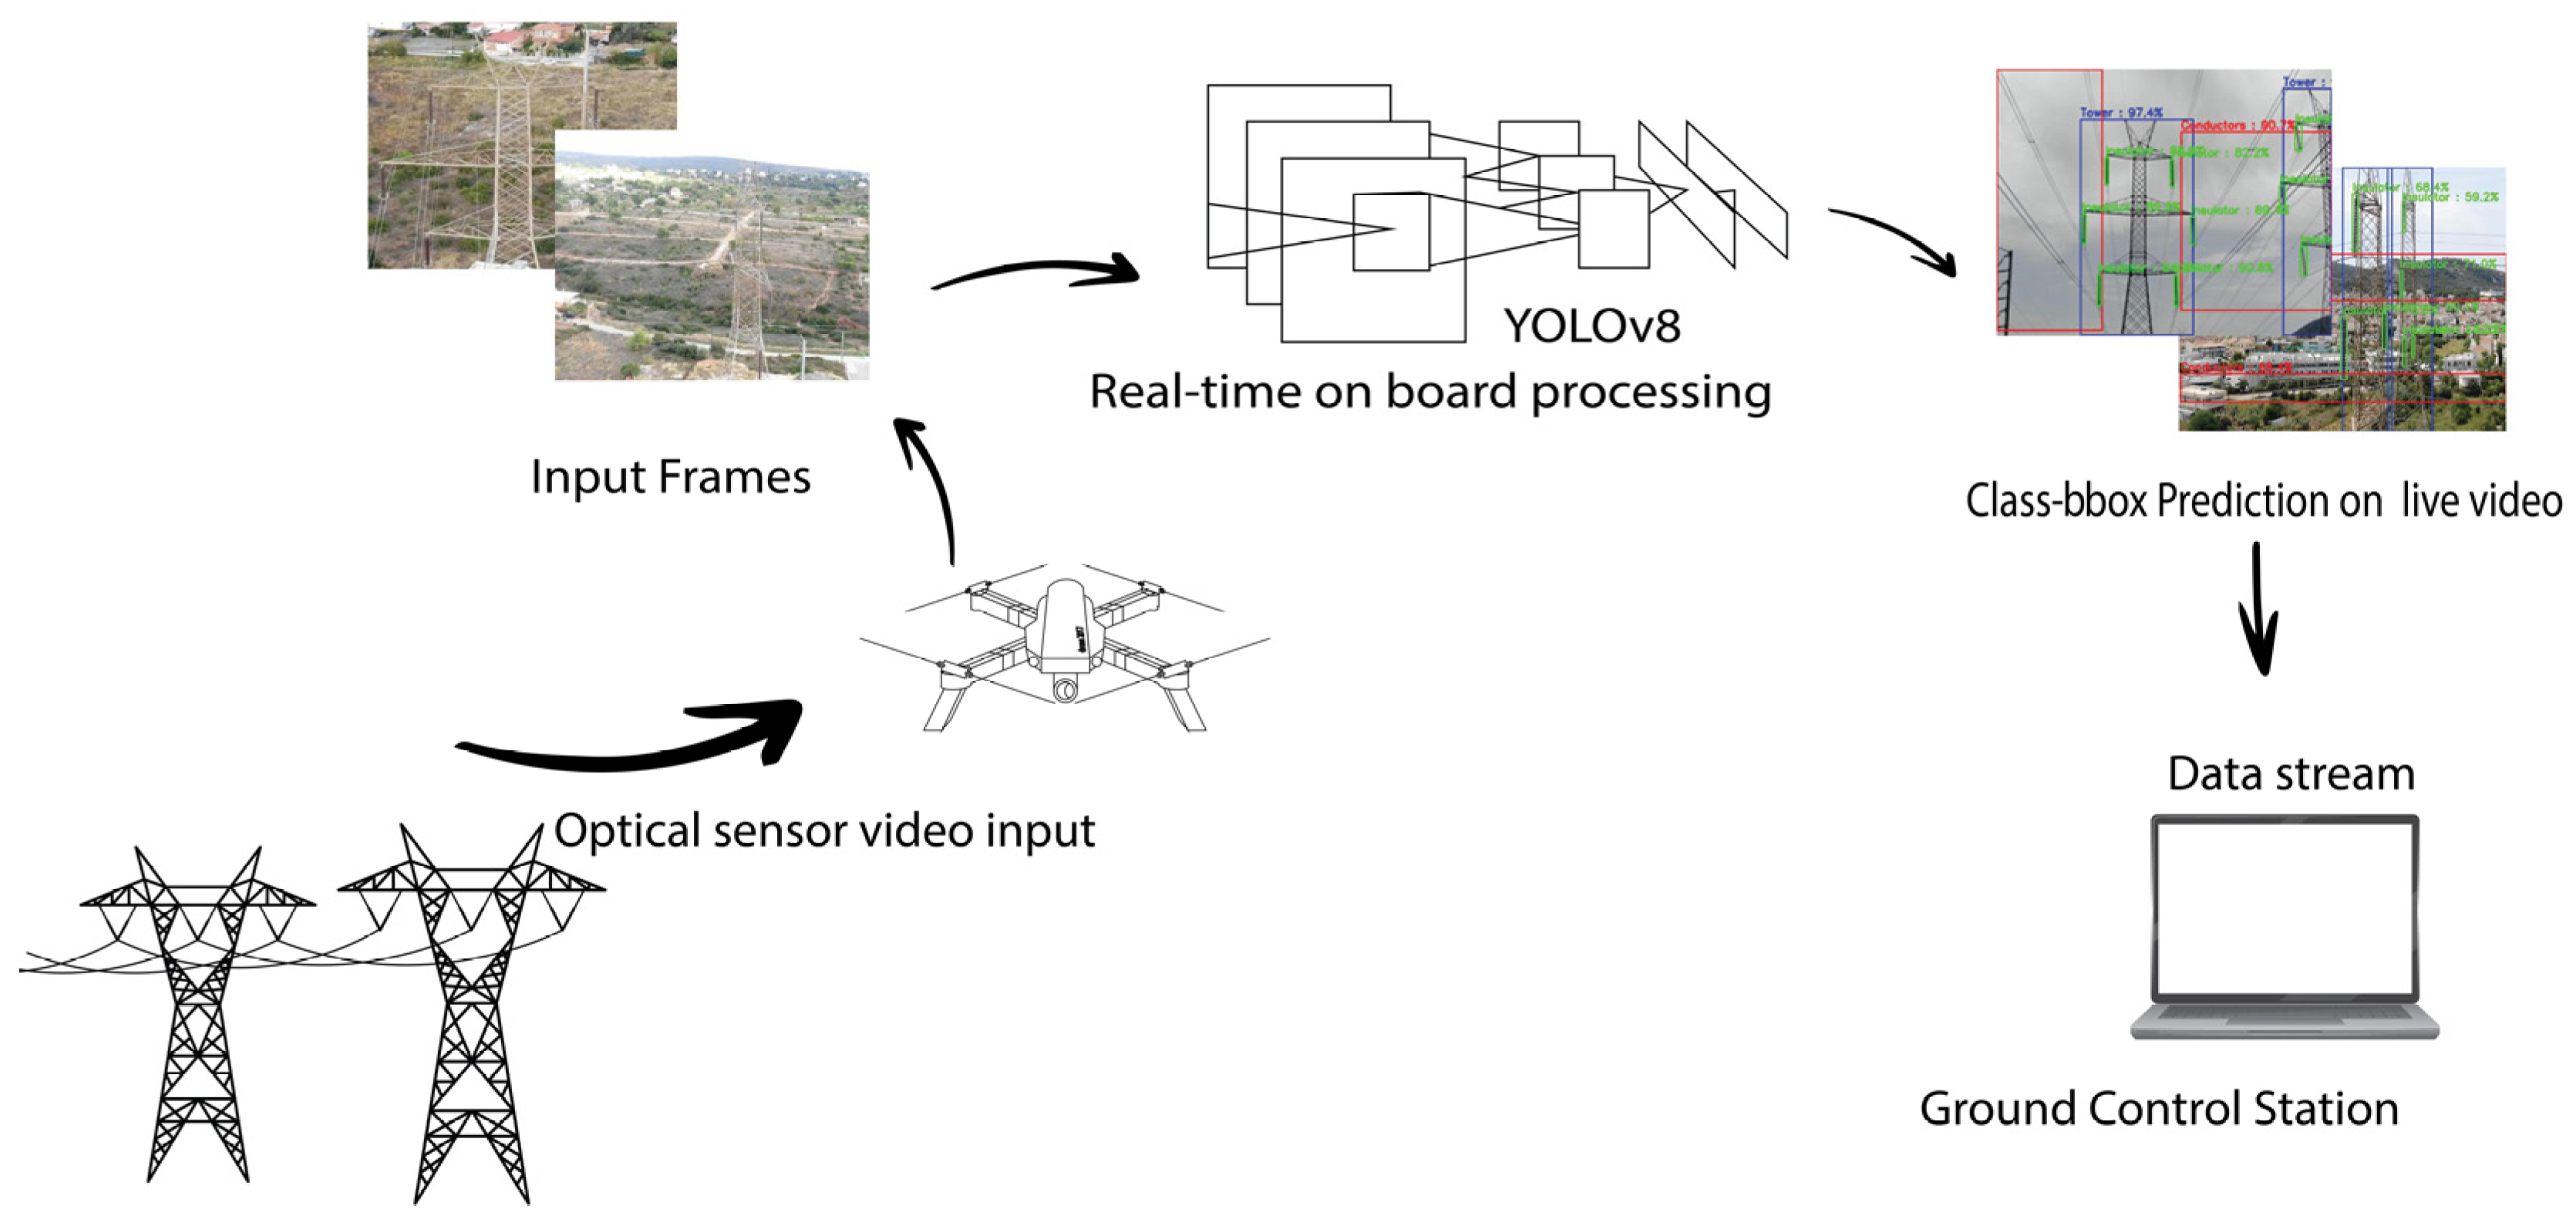
The aim of this research is reflected in the following graphical representation (Figure 2), which illustrates the aerial inspection with onboard processing using a drone.
We fine-tuned and trained models based on the YOLOv8 architecture and its different variations (nano, small, medium, large, and xlarge), which detected the three main power line components (towers, insulators, and conductors, TICs) using our custom dataset described in Section 2.4. We evaluated our model for accuracy and speed and chose the model that best fit for drone applications. The real-time detection of our selected TIC model was verified by optimizing it with Tensor-RT (v8.2) and ONNX and performing tests on video footage using both a GPU (GeForce RTX 3070) and CPU (AMD-Ryzen 5) to assess the performance. Tensor-RT (https://developer.nvidia.com/tensorrt, accessed on 15 October 2023) enhances inference performance by leveraging various optimization techniques. These techniques include quantization, layer and tensor fusion, kernel tuning, and more, and are specifically designed for Nvidia GPUs. The Open Neural Network eXchange (ONNX) (https://onnx.ai/, accessed on 15 October 2023) runtime is an open-source project that is designed to accelerate machine learning across a wide range of frameworks, operating systems, and hardware platforms. Both formats can speed up inference in YOLO models, with Tensor-RT accelerating the speed on GPUs and ONNX increasing the speed on a CPU.

2.2. Model Training

We used YOLOv8 base models as a starting point to build up our TIC model training. Transfer learning, as this training methodology is called, takes advantage of other models trained on large, open-source datasets, such as ImageNet and MS-COCO, thus being preferred to training from scratch in terms of computational efficiency. In our case, we used YOLOv8 weights, pre-trained on the MS-COCO dataset, a large-scale object detection dataset consisting of 330 K images and 80 object categories. The pre-trained models used to train our TIC models are listed in Table 1.
Initially, we conducted training for all five models using the default hyperparameters and internal data augmentations provided in the original code. By observing the behavior of training loss over the training epochs, we found that the model was “learning” too fast, while the validation loss indicated early overfitting. Based on these observations, we deemed it necessary to fine-tune some of the main hyperparameters of each model using a genetic algorithm (GA) for optimizing the hyperparameters of YOLO-based models. The final combination of the main hyperparameters we set for training are shown in Table 2. The most important hyperparameter we adjusted was the initial learning rate (lr0), which is a significant factor regarding the model’s accuracy. We found that changing its value could improve the model’s accuracy by approximately 1–2%. Other changes were related to augmentation techniques, which improved the training process by avoiding early overfitting. Information about the training environment is listed in Table 3.

2.3. Insulators’ Inspection Method

For the inspection task, we trained on an open-source dataset (CPLID) using our TIC model and its pre-trained weights from the previous stage. The described methodology is presented in Figure 3.
We built upon our TIC model from the earlier phase, which had been pre-trained on a dataset relevant to power lines (TIC dataset), to develop a model capable of identifying defects in insulators. Our investigation focused on the impact that pre-trained weights from our model had on the accuracy when working with fewer images, as opposed to the default YOLOv8 weights. Additionally, we explored whether this approach would result in quicker convergence, meaning the model would reach its optimal performance faster during the training process.

2.4. Data Description

2.4.1. Tower, Insulator, and Conductor (TIC) Dataset

Our TIC dataset including 2056 images of transmission line network footage in Greece (Northeast Attica) and annotations of three object classes, i.e., towers, insulators and conductors, was created by aerial and ground photos taken from a DJI Mavic 2 Zoom quadcopter (CMOS 1080p, 30 fps) and a 64 MP conventional camera, respectively. To capture real flight parameters with diverse backgrounds and different points of view, angles and sun positions of the shots differ (Figure 4).
In order to simplify the computational procedure, images (frames) from video footage were cropped, rotated, and resized to 512 × 640 (original size 1080 × 1920). Figure 5 shows polygon annotation on an open-source annotations tool. In total, 9802 objects were annotated. We extracted segmentation pixel coordinates and bounding box coordinates of each object, which were then used for the model training procedure (instance segmentation and object detection, respectively).
The object classes were very different from each other, in terms of size and features, and often more than one or two object classes were captured within a frame. Different angles and distances of the same object class were also included, making the detection procedure even more complex. These characteristics of the dataset reduce the mean average precision score. However, they reflect real environment visualization for visual-based navigation. Conductors, often depicted as straight lines, typically occupy a minimal number of pixels within an image, leading to an inconsistent ratio of object-to-background pixels. They tend not to be centrally positioned within a frame and may bear resemblance to other background elements, such as lines of similar shape, which can perplex the model. These issues can lead to challenges in accurately detecting and distinguishing conductors from the surrounding environment, potentially resulting in misclassifications or false positives in the object detection task. On the other hand, towers are typically depicted as large objects within an image, with a characteristic shape but also containing many transparent areas, resulting in high background noise. Compared to towers, insulators are depicted as relatively small objects, often necessitating closer shots for precise defect detection. When captured at close range, they exhibit clear boundaries and a distinct geometry characterized by recognizable caps, typically in the shape of disks or cylinders. These geometric features, along with their elongated body, facilitate the easier detection of small defects.

2.4.2. Chinese Power Line Insulator Dataset (CPLID)

To inspect insulators and identify potential missing caps, the open-source CPLID dataset by Tao et al. (2020) [22] was utilized to train our models. The dataset is divided into two parts:
a.
600 images of normal insulators captured by UAVs, with bounding box annotations in VOC2007 format;
b.
248 synthesized images of defective insulators, also with bounding box annotations in VOC2007 format.
This dataset contains up-close shots of insulators with only two object classes, where either of them appears in each image, thus demonstrating low complexity. Although the dataset is relatively small, we applied no external data augmentation techniques, as YOLOv8 provides internal augmentations that are sufficient to achieve high accuracy with no overfitting indications. Sample images of the CPLID dataset are shown in Figure 6.

3. Results

3.1. Evaluation Metrics

Unlike previous YOLO versions, YOLOv8 calculates classification loss based on the focal loss function, which is an improved version of cross-entropy loss. It focuses on hard examples that the model predicts incorrectly rather than dealing with rewarding the easy predictions that the model understands and predicts correctly [23]. The equation of focal loss extends to cross-entropy by adding a parameter γ to be tuned during cross-validation, which has a value range of [0, 1] (Equation (1)).
Focal   Loss = i = 1 i i pi γ logb pi
where γ = 0 and γ = 1 indicate that the predicted probability (pi) is high and low, respectively, so the function is unaffected by this parameter and works like cross-entropy. The regression branch (bbox) is calculated using the intersection over the union (IoU), which is defined by the area where the predicted box and the ground truth overlaps divided by the total area of both bounding boxes (predicted and ground truth):
IoU b pred , b gt = Area b pred b gt Area b pred b gt
During training, loss in the training set and loss in the validation set should be reduced; otherwise, the model indicates overfitting. In our methodology, we selected training iterations based on validation loss behavior. The graphs in Figure 7 depict the training and loss behavior of the models. The training loss graph shows how well each model is learning from the training data over time. A general trend of decreasing loss indicates that the model is improving its predictions and getting better at the task that it is being trained for. We observe that the smaller the model, the sooner it converges, meaning it learns as much as it can from the training data earlier compared to more complex models, such as YOLOv8x. Thus, further training may not significantly improve its performance. Validation loss gives an estimate of how well the model performs on a dataset that it has not seen during its training process. A decreasing trend in validation loss suggests that the model is learning general patterns rather than memorizing the training data. Lower values of validation loss indicate a better performance of the model, which in our case is YOLOv8x. Once the level of the validation loss curve stabilizes (in other words, it stops decreasing), it is recommended to stop the training process to avoid overfitting. In our scenario, the optimal number of iterations was identified as 50 for the larger models and 80 for the smaller models.
The final evaluation stage of the trained model is defined by the mean average precision (Equation (5)) and F1-score (Equation (6)).
Precision is calculated using false positives and true positives of the predictions:
  • true positive (TP): object is present and predicted;
  • false positive (FP): object is predicted when not present (confused with background);
  • false negative (FN): object is present and not predicted.
Precision relies on true positives in relation to false positives, while recall relies on true positives in relation to false negatives (Equations (3) and (4)):
Precision = TP TP + FP
Recall = TP TP + FN .
The mean average precision is calculated by the sum of the average precision (AP) for each query, represented by the sum of the curve area under the PR curves:
mAP = 1 N i = 1 N APi
An IoU of 50% is the minimum acceptable percentage to evaluate the accuracy of the majority of the models, indicated as [email protected]. We also included an evaluation of the AP across all IoUs from 50% to 95% ([email protected]:.95).
F1-score is the harmonic average of recall and precision, taking values between 0 and 1:
F 1 = 2 × Precision × Recall Precision + Recall

3.2. Models’ Performance for Detecting Key Components

We fine-tuned, trained, and evaluated five YOLOv8 models on our custom TIC dataset predicting towers, insulators, and conductors based on the different base models (nano, small, medium, large, and xlarge). Table 4 shows the mAP score of each fine-tuned model and speed in the validation dataset, while Table 5 depicts the detection accuracy of each object class.
The YOLOv8x TIC model outperformed the others in terms of accuracy; however, it was significantly slower than the other YOLOv8 models. We noticed a fair trade-off between accuracy and speed for the YOLOv8s TIC model, which is also lighter and less complex, and could thus be more effective for onboard real-time applications using a drone. We chose YOLOv8s TIC model for further testing the detection speed with ONNX and Tensor-RT optimization on a CPU and GPU to verify the results on video. Table 6 presents the results of the optimized TIC model hardware tests.
Running our models on a GPU, we observed an increase in speed after optimizing our model with Tensor-RT, with a good balance between mAP and fps. On the other hand, optimizing the inference with ONNX on a CPU did not result in a higher speed; however, we achieved real-time detection in both cases by reducing the image size from 640 × 640 to 320 × 320. The real-time detection speed on GPU-free hardware is promising and indicates that our model is capable of onboard real-time detection using single-board computers (SBCs) with embedded GPUs, which are often used as companion computers on UAVs.
Based on state-of-the-art work, experiments on other object detection methods, such as CNN models, CenterNet, Fast- and Faster-RCNN, have shown that YOLO models are superior in terms of balancing accuracy and speed [13,14]. They demonstrate excellent speed performance while producing lightweight models, which is one of the main objectives of our research. To verify our results over other computer vision techniques, we experimented and compared our TIC YOLOv8s model to recent instance segmentation methods, which according to the literature [24,25] can achieve real-time multi-class detection, i.e., YOLACT [26]. Unlike traditional segmentation methods that might first detect objects and then segment them, YOLACT (You Only Look At Coefficients) operates by predicting both object classes and segmentation masks simultaneously. It is a pioneering approach in the realm of instance segmentation that can operate at speeds comparable to real-time object detection models like YOLO. To this end, we trained all the models on our TIC dataset and the results are shown in Table 7.
Figure 7 demonstrates that YOLOv8s provides a fair trade-off between accuracy and speed compared to YOLOv5s. Among the YOLACT models evaluated, YOLACT-Edge was the only one to achieve real-time detection on the TIC dataset, although with performance significantly inferior to that of the YOLO models. These findings underscore the suitability of our object detection model for practical applications.

3.3. Models’ Performance for Detecting Defects in Insulators

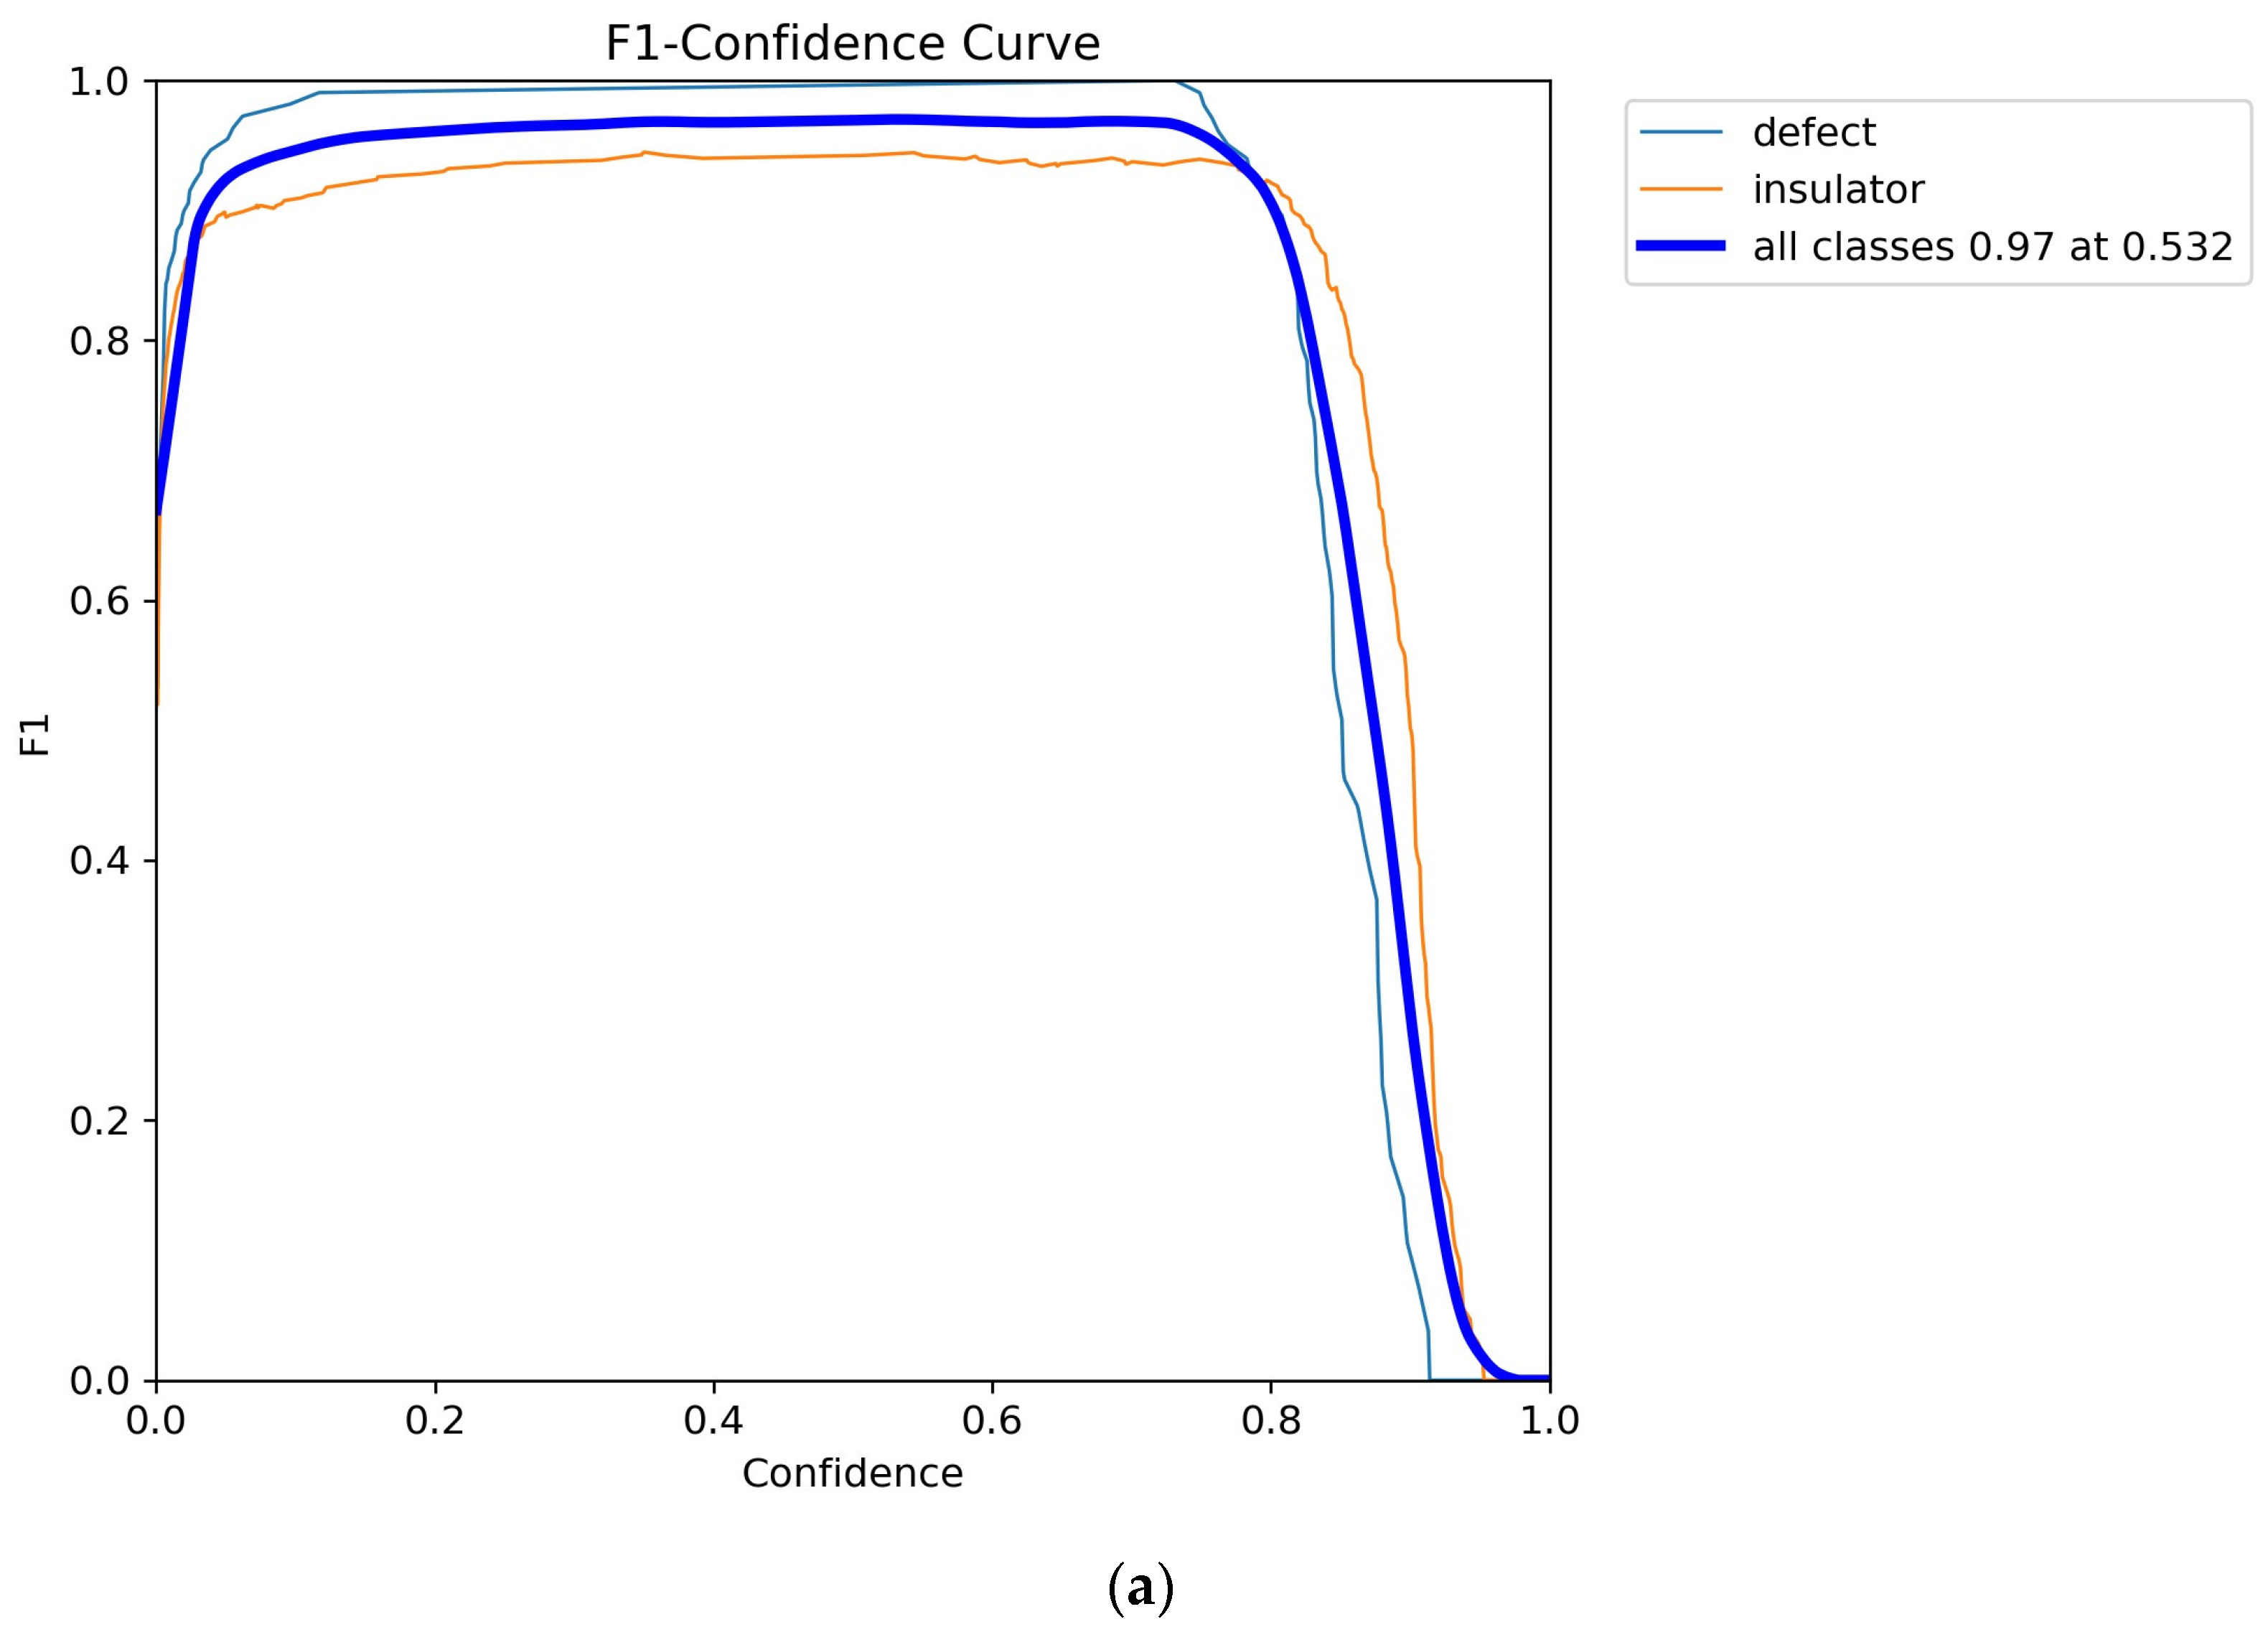
To verify our TIC model’s robustness, we further extended our research by training models for detecting normal and defective insulators on the open-source dataset CPLID. We applied transfer learning using our TIC model weights to train a model to predict defects in insulators. This method proved to increase precision and recall class predictions (reflected by F1-score curve), compared to training using the base YOLOv8s pre-trained weights on the MS-COCO dataset. In Figure 8, the F1-score curve reflects the precision and recall class predictions of each model.
The overall accuracy score, according to the F1-score curves, suggests that our methodology led to a model that had a marginally better balance of precision and recall. In practical terms, it appeared to be more effective at correctly identifying defects while minimizing the number of false positives and false negatives.
We compared this model with state-of-art work, where a high mAP and F1-score were achieved on the same dataset and ground truth annotations, showing that our method based on YOLOv8 architecture outperformed the others in precision and recall. Table 8 shows the score results for each model.
We observed that our method achieved the highest F1-score amongst the other methods. This indicates that the model is ready for practical application, as it has advanced ability to accurately identify relevant instances with a balanced approach towards false positives and false negatives. It is important to highlight that our model achieved a highly competitive accuracy, without external augmentations or modifications to the backbone. These techniques, while useful, tend to complicate the pre-processing and training phases. In the comparison table, we exclusively feature models trained on an identical CPLID dataset to ensure fair comparability. This is because outcomes can vary substantially and become incomparable if either the dataset or the annotation process (ground truth) is different. Nonetheless, it is important to acknowledge the notable contribution made by [35], in which an enhanced YOLOv8 algorithm was tested in detecting small insulator targets using a different dataset, achieving a 99.4% mAP 0.50. In the same context, researchers in [17] pre-processed, augmented, and re-annotated the CPLID dataset with remarkable results as well. Using a method of combining the YOLOv8m model with PS-ProtoPNet based on Resnet-34, they achieved an F1-score of 99.64% and 99.79% accuracy in defect classification, which is close to our F1-score for defect detection, i.e., 99.89%.

3.4. Inference

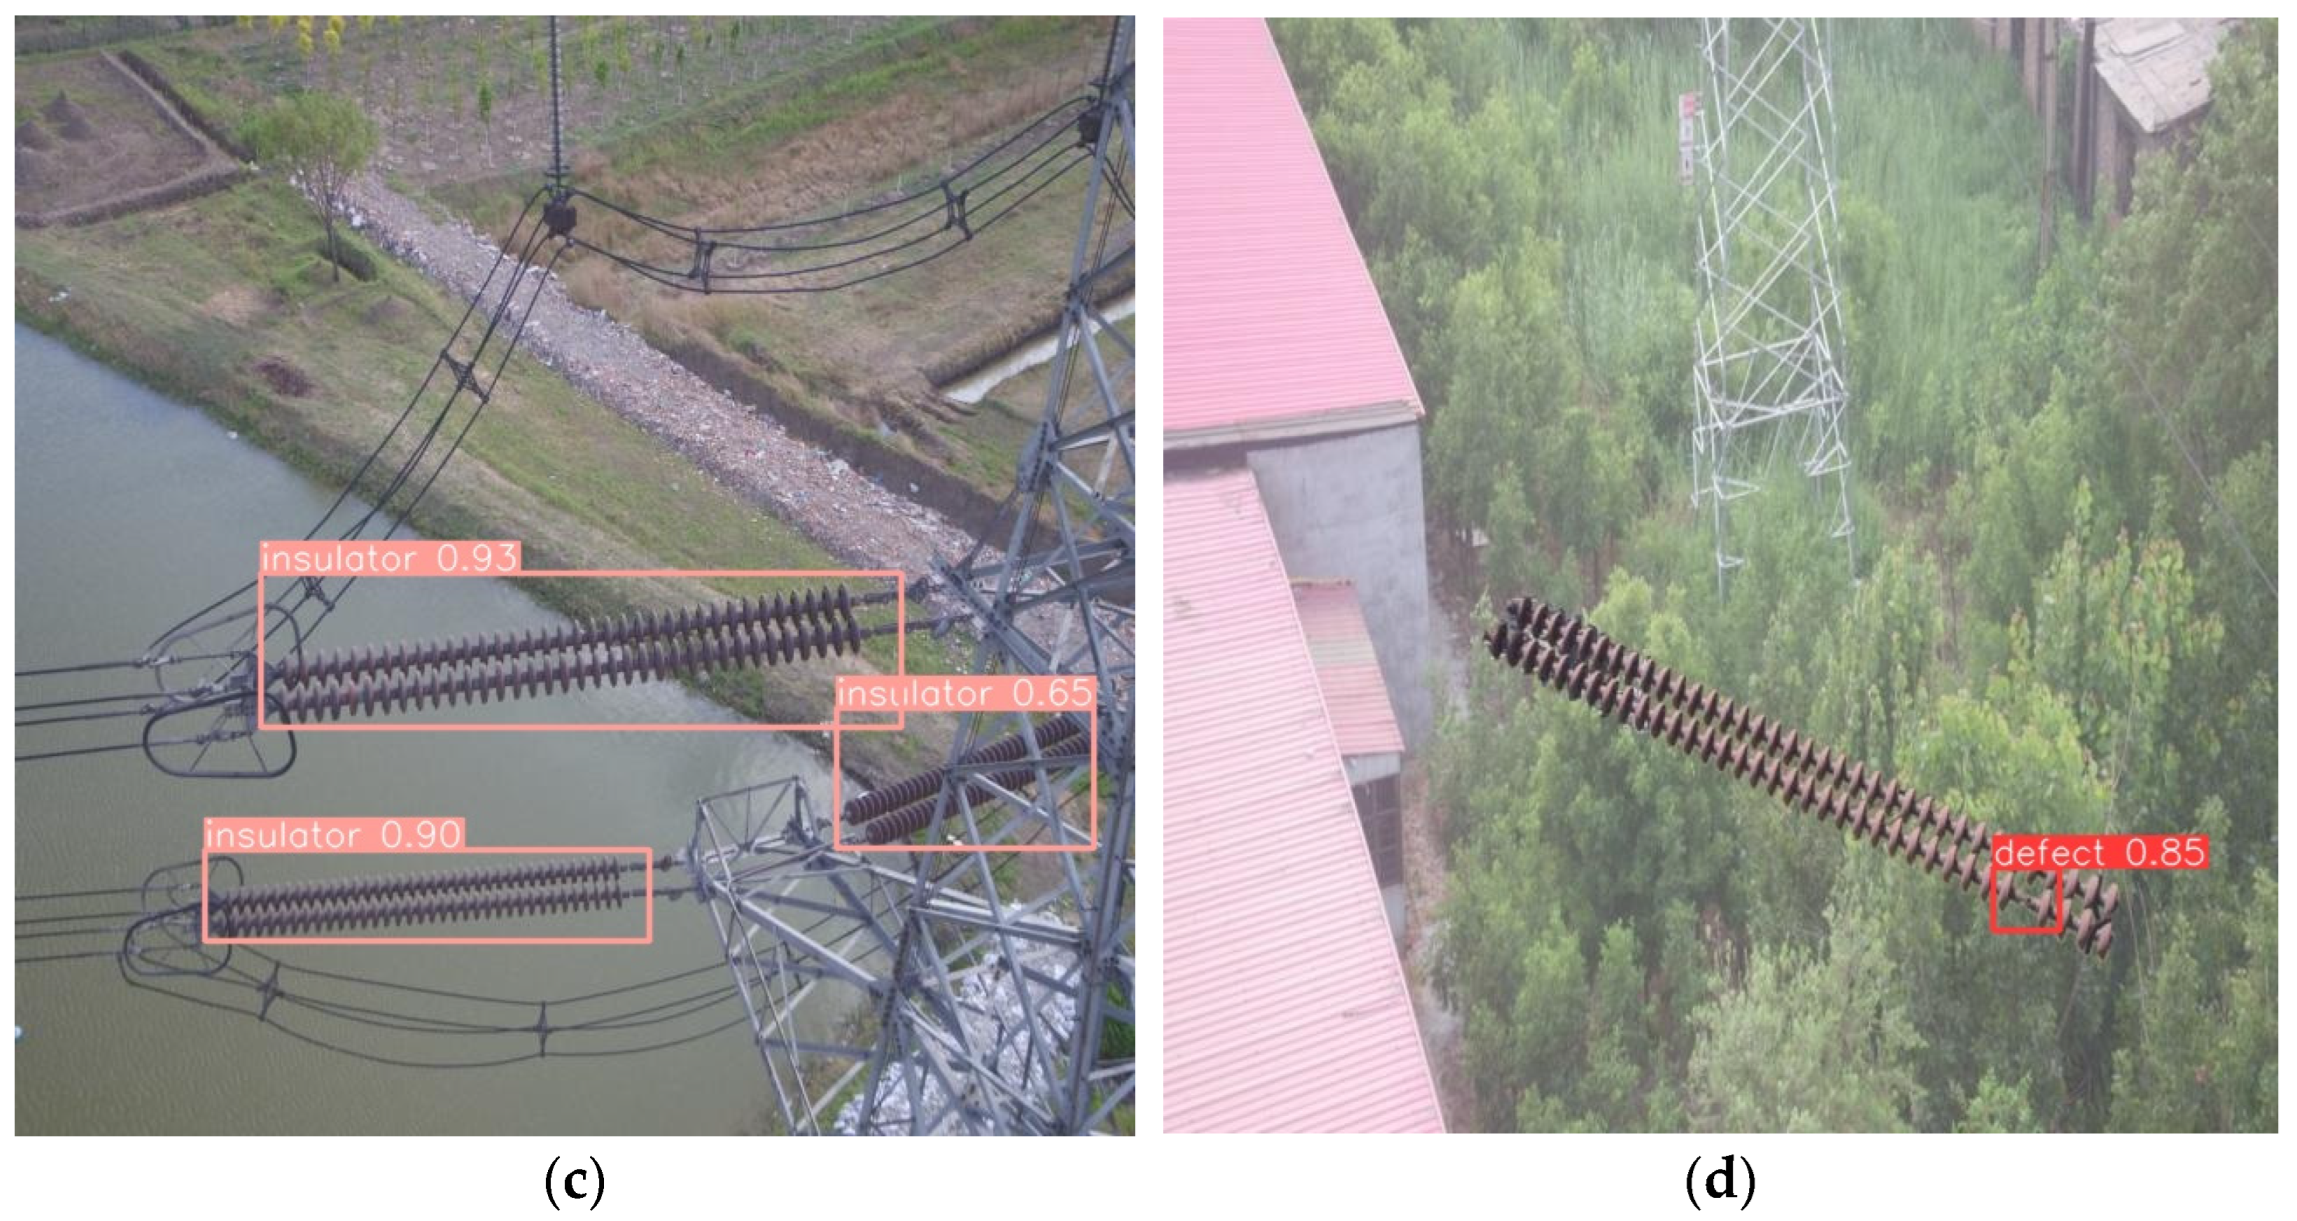
Inference conducted on test images showed a high accuracy rate in the predictions made by both models (the TIC model and the defect detection model), as illustrated in Figure 9. This evidence supports their potential for practical application in real-world power line inspections. We observed a decrease in prediction accuracy as the shot distance increased, a trend that aligned with expectations. This occurs because objects are represented by fewer pixels within a frame when the drone moves further away.

4. Discussion

In this study, we explored the capabilities of YOLOv8, the latest iteration in the series of real-time object detectors, specifically for the aerial automatic inspection of power lines. Our approach included the development of an original dataset comprising 2056 images that represent the complexity of real-world environments encountered during drone-powered inspections. This dataset was curated to include a variety of angles and backgrounds, reflecting the diverse conditions under which power line components—namely towers, insulators, and conductors (TICs)—are observed. Such diversity is critical, as it closely mimics the challenges of drone maneuverability in authentic operational scenarios. The inclusion of different backgrounds and the inherent variability in the physical characteristics of the TIC components elevate the complexity of the detection task at hand. To enhance the utility of our dataset for broader applications, we annotated the images using both polygons and bounding boxes. This dual annotation approach not only facilitates instance segmentation but also augments the scope of object detection applications.
Leveraging the YOLOv8 architecture, we conducted training sessions across models varying in layer depth. Our objective was to strike an optimal balance between accuracy, model size, and processing speed, which is paramount for on-board detection systems constrained by computational resources. The YOLOv8s model emerged as the most suitable variant, demonstrating a high-speed performance of 243 fps on an Nvidia GeForce RTX 3070, achieving an overall mean average precision (mAP) of 83.8%. These metrics underscore the model’s efficacy and its potential as a foundational model for further research in power line inspection, including fault and defect detection.
To validate the robustness of our TIC model, we conducted tests using the open-source CPLID dataset, which includes images of defective insulators. The incorporation of our model’s weights enhanced the overall mAP to 99% and improved the F1-score for class predictions. This marked improvement, when compared to the base YOLOv8 weights trained on the MS-COCO dataset, highlights the precision of our model in identifying defects. Moreover, our F1-score for detecting defective insulators reached 99.89%, positioning our results among the highest reported in the literature.
It is essential to note that, while our work focuses on YOLO-based models, significant contributions in the literature [36,37,38] also present promising avenues for future research in this domain. Our investigation extends beyond the immediate application of TIC models for power line inspection. We envisage the future implementation of our models in visual-based navigation tasks across transmission line networks. Preliminary results [6] indicate that our models, when deployed on unmanned aerial vehicles (UAVs) equipped with single-board computers (SBCs) featuring GPU processors and essential sensors (FHD camera, thermal sensor, and LiDAR), can facilitate real-time automatic inspection tasks effectively. This capability not only demonstrates the practical applicability of our models in field conditions but also paves the way for autonomous navigation and inspection systems that can operate independently of human intervention.
In conclusion, our study provides a comprehensive evaluation of the YOLOv8 detector for aerial power line inspection tasks. Through a detailed analysis of our original dataset, model training and testing phases, we have demonstrated the model’s high performance and its potential for future applications in automated inspection and navigation systems. By providing our original dataset and model weights publicly, we aim to contribute to the open-source community and to the ongoing efforts in enhancing the reliability and efficiency of power line maintenance and inspection protocols.

Supplementary Materials

Inference on drone footage (VideoS1.mp4) is openly available at: https://drive.google.com/drive/folders/1ZLePzH2bEddZNVCc389al3SokTV9EC7G?usp=sharing (accessed on 15 January 2024).

Author Contributions

Conceptualization, E.B. and I.P.; Methodology, E.B., I.P. and K.B.; Validation, E.B.; Formal analysis, E.B.; Investigation, E.B. and K.B.; Writing—original draft, E.B.; Writing—review & editing, I.P. and K.B.; Supervision, I.P. and K.B.; Project administration, I.P. All authors have read and agreed to the published version of the manuscript.

Funding

This research received no external funding.

Data Availability Statement

The models included in this research as well as the full dataset with annotation files are openly available at the following Github repository: https://github.com/Elizbellou/Tower-Insulator-Conductors-TIC-Dataset-and-Object-Detection-Models.git (accessed on 15 January 2024).

Acknowledgments

The authors would like to thank drone operator, Konstantinos Vlamidis and Altus Lsa for both assisting in the dataset collection flights.

Conflicts of Interest

The authors declare no conflict of interest.

References

  1. Martins, W.M.; Dantas Filho, A.J.; Dejesus, L.D.; Desouza, A.D.; Ramos, A.C.; Pimenta, T.C. Tracking for inspection in energy transmission power lines using unmanned aerial vehicles: A systematic review of current and specific literature. IAES Int. J. Robot. Autom. 2020, 9, 233. [Google Scholar] [CrossRef]
  2. Zuo, Y.; Chen, Z.; Zhang, W.; Huang, Z.; Wu, S.; Long, Y.; Chen, J. The Development of Unmanned Aerial Vehicle Intelligent Inspection Technology in Power System. In Proceedings of the 2023 Panda Forum on Power and Energy (PandaFPE), Chengdu, China, 27–30 April 2023; pp. 393–398. [Google Scholar] [CrossRef]
  3. Jocher, G.; Chaurasia, A.; Qiu, J. YOLO by Ultralytics (Version 8.0.0) [Computer Software]. 2023. Available online: https://github.com/ultralytics/ultralytics (accessed on 15 December 2023).
  4. Redmon, J.; Divvala, S.; Girshick, R.; Farhadi, A. You only look once: Unified, real-time object detection. In Proceedings of the IEEE Conference on Computer Vision and Pattern Recognition, Las Vegas, NV, USA, 27–30 June 2016; pp. 779–788. [Google Scholar]
  5. Abdelfattah, R.; Wang, X.; Wang, S. TTPLA: An Aerial-Image Dataset for Detection and Segmentation of Transmission Towers and Power Lines. In Proceedings of the Asian Conference on Computer Vision, Kyoto, Japan, 30 November–4 December 2020. [Google Scholar]
  6. Bellou, E.; Pisica, I.; Banitsas, K. Real-Time Object Detection on High-Voltage Powerlines Using an Unmanned Aerial Vehicle (UAV). In Proceedings of the 2023 58th International Universities Power Engineering Conference (UPEC), Dublin, Ireland, 29 August–1 September 2023; pp. 1–6. [Google Scholar] [CrossRef]
  7. Zhao, Z.; Xu, G.; Qi, Y.; Liu, N.; Zhang, T. Multi-patch deep features for power line insulator status classification from aerial images. In Proceedings of the 2016 International Joint Conference on Neural Networks (IJCNN), Vancouver, BC, Canada, 24–29 July 2016; pp. 3187–3194. [Google Scholar]
  8. Li, S.; Zhou, H.; Wang, G.; Zhu, X.; Kong, L.; Hu, Z. Cracked insulator detection based on R-FCN. J. Phys. Conf. Ser. 2018, 1069, 012147. [Google Scholar] [CrossRef]
  9. Ling, Z.; Qiu, R.C.; Jin, Z.; Zhang, Y.; He, X.; Liu, H.; Chu, L. An accurate and real-time self-blast glass insulator location method based on faster R-CNN and U-net with aerial images. arXiv 2018, arXiv:1801.05143. [Google Scholar]
  10. Chen, B.; Miao, X. Distribution Line Pole Detection and Counting Based on YOLO Using UAV Inspection Line Video. J. Electr. Eng. Technol. 2020, 15, 441–448. [Google Scholar] [CrossRef]
  11. Chen, Q.; Gao, Y.; Peng, Y.; Zhang, J.; Sun, K. Accurate Object Recognition for Unmanned Aerial Vehicle Electric Power Inspection using an Improved YOLOv2 Algorithm. In Proceedings of the 2019 IEEE Fourth International Conference on Data Science in Cyberspace (DSC), Hangzhou, China, 23–25 June 2019; pp. 610–617. [Google Scholar]
  12. Feng, Z.; Guo, L.; Huang, D.; Li, R. Electrical Insulator Defects Detection Method Based on YOLOv5. In Proceedings of the IEEE 10th Data Driven Control and Learning Systems Conference (DDCLS), Suzhou, China, 14–16 May 2021; pp. 979–984. [Google Scholar] [CrossRef]
  13. Gu, J.; Hu, J.; Jiang, L.; Wang, Z.; Zhang, X.; Xu, Y.; Zhu, J.; Fang, L. Research on object detection of overhead transmission lines based on optimized YOLOv5s. Energies 2023, 16, 2706. [Google Scholar] [CrossRef]
  14. Li, Y.; Ni, M.; Lu, Y. Insulator defect detection for power grid based on light correction enhancement and YOLOv5 model. Energy Rep. 2022, 8, 807–814. [Google Scholar] [CrossRef]
  15. Li, Q.; Zhao, F.; Xu, Z.; Wang, J.; Liu, K.; Qin, L. Insulator and damage detection and location based on YOLOv5. In Proceedings of the 2022 International Conference on Power Energy Systems and Applications (ICoPESA), Virtual, 25–27 February 2022; pp. 17–24. [Google Scholar]
  16. Qi, Y.; Li, Y.; Du, A. Research on an Insulator Defect Detection Method Based on Improved YOLOv5. Appl. Sci. 2023, 13, 5741. [Google Scholar] [CrossRef]
  17. Singh, G.; Stefenon, S.F.; Yow, K.C. Interpretable visual transmission lines inspections using pseudo-prototypical part network. Mach. Vis. Appl. 2023, 34, 41. [Google Scholar] [CrossRef]
  18. Redmon, J.; Farhadi, A. YOLO9000: Better, faster, stronger. In Proceedings of the IEEE Conference on Computer Vision and Pattern Recognition, Honolulu, HI, USA, 21–26 July 2017; pp. 7263–7271. [Google Scholar]
  19. Redmon, J.; Farhadi, A. Yolov3: An incremental improvement. arXiv 2018, arXiv:1804.02767. [Google Scholar]
  20. Bochkovskiy, A.; Wang, C.Y.; Liao, H.Y.M. Yolov4: Optimal speed and accuracy of object detection. arXiv 2020, arXiv:2004.10934. [Google Scholar]
  21. Jocher, G. YOLOv5 by Ultralytics (Version 7.0) [Computer Software]. 2020. Available online: https://zenodo.org/records/7347926(accessed on 15 December 2023).
  22. Tao, X.; Zhang, D.; Wang, Z.; Liu, X.; Zhang, H.; Xu, D. Detection of Power Line Insulator Defects Using Aerial Images Analyzed with Convolutional Neural Networks. IEEE Trans. Syst. Man Cybern. Syst. 2020, 50, 1486–1498. [Google Scholar] [CrossRef]
  23. Nayak, R. Focal Loss: A Better Alternative for Cross-Entropy. Towards Data Science. 2022. Available online: https://towardsdatascience.com/focal-loss-a-better-alternative-for-cross-entropy-1d073d92d075 (accessed on 15 December 2023).
  24. Vemula, S.; Frye, M. Real-Time Powerline Detection System for an Unmanned Aircraft System. In Proceedings of the 2020 IEEE International Conference on Systems, Man, and Cybernetics (SMC), Toronto, ON, Canada, 11–14 October 2020; pp. 4493–4497. [Google Scholar] [CrossRef]
  25. Zhao, Q.; Ji, T.; Liang, S.; Yu, W.; Yan, C. Real-time power line segmentation detection based on multi-attention with strong semantic feature extractor. J. Real-Time Image Proc. 2023, 20, 117. [Google Scholar] [CrossRef]
  26. Bolya, D.; Zhou, C.; Xiao, F.; Lee, Y.J. Yolact: Real-time instance segmentation. In Proceedings of the IEEE/CVF International Conference on Computer Vision, Seoul, Korea, 27 October–2 November 2019; pp. 9157–9166. [Google Scholar]
  27. Bolya, D.; Zhou, C.; Xiao, F.; Lee, Y.J. YOLACT++ Better Real-Time Instance Segmentation. IEEE Trans. Pattern Anal. Mach. Intell. 2022, 44, 1108–1121. [Google Scholar] [CrossRef] [PubMed]
  28. Liu, H.; Soto, R.A.R.; Xiao, F.; Lee, Y.J. Yolactedge: Real-time instance segmentation on the edge. In Proceedings of the 2021 IEEE International Conference on Robotics and Automation (ICRA), Xian, China, 30 May–5 June 2021; pp. 9579–9585. [Google Scholar]
  29. Chen, C.; Yuan, G.; Zhou, H.; Ma, Y. Improved YOLOv5s model for key components detection of power transmission lines. Math. Biosci. Eng. 2023, 20, 7738–7760. [Google Scholar] [CrossRef] [PubMed]
  30. Xia, H.; Yang, B.; Li, Y.; Wang, B. An improved CenterNet model for insulator defect detection using aerial imagery. Sensors 2022, 22, 2850. [Google Scholar] [CrossRef] [PubMed]
  31. Dong, C.; Zhang, K.; Xie, Z.; Shi, C. An improved cascade RCNN detection method for key components and defects of transmission lines. IET Gener. Transm. Distrib. 2023, 17, 4277–4292. [Google Scholar] [CrossRef]
  32. Zhao, W.Q.; Cheng, H.H.; Zhao, Z.B.; Zhai, Y.J. Combining attention mechanism and Faster RCNN for insulator recognition. CAAI Trans. Int. Syst. 2020, 15, 92–98. [Google Scholar] [CrossRef]
  33. Wang, S.; Tan, W.; Yang, T.; Zeng, L.; Hou, W.; Zhou, Q. High-Voltage Transmission Line Foreign Object and Power Component Defect Detection Based on Improved YOLOv5. J. Electr. Eng. Technol. 2023, 19, 851–866. [Google Scholar] [CrossRef]
  34. Wang, S.; Zou, X.; Zhu, W.; Zeng, L. Insulator Defects Detection for Aerial Photography of the Power Grid Using You Only Look Once Algorithm. J. Electr. Eng. Technol. 2023, 18, 3287–3300. [Google Scholar] [CrossRef]
  35. Hu, D.; Yu, M.; Wu, X.; Hu, J.; Sheng, Y.; Jiang, Y.; Zheng, Y. DGW-YOLOv8: A small insulator target detection algorithm based on deformable attention backbone and WIoU loss function. IET Image Process. 2023, 18, 1096–1108. [Google Scholar] [CrossRef]
  36. Li, X.; Su, H.; Liu, G. Insulator defect recognition based on global detection and local segmentation. IEEE Access 2020, 8, 59934–59946. [Google Scholar] [CrossRef]
  37. Wang, L.; Chen, Z.; Hua, D.; Zheng, Z. Semantic segmentation of transmission lines and their accessories based on UAV-taken images. IEEE Access 2019, 7, 80829–80839. [Google Scholar] [CrossRef]
  38. Sampedro, C.; Rodriguez-Vazquez, J.; Rodriguez-Ramos, A.; Carrio, A.; Campoy, P. Deep learning-based system for automatic recognition and diagnosis of electrical insulator strings. IEEE Access 2019, 7, 101283–101308. [Google Scholar] [CrossRef]
Figure 1. YOLO model detection process: It divides the image into an S × S grid and each grid cell predicts B bounding boxes, the confidence for those boxes, and C class probabilities (class probability map indicating each class prediction by different pixel coloring) [4].
Energies 17 02535 g001
Figure 2. Schematic representation of real-time object detection on power lines.
Energies 17 02535 g002
Figure 3. Methodology steps applying transfer learning, using our TIC model’s pre-trained weights to enhance the performance of the defects’ detection model.
Energies 17 02535 g003
Figure 4. Sample images of the dataset: (a) downside up, (b) top down, and (c) side.
Energies 17 02535 g004
Figure 5. Annotations of towers (blue), insulators (red), and grids (yellow) using CVAT tool (v2.1). Conductors were annotated both separately and in pairs to visualize them as straight line “corridors”.
Energies 17 02535 g005
Figure 6. Sample images of CPLID dataset, containing normal insulators images (left side) and synthesized images of insulators with missing cups with diverse backgrounds (center,right side).
Energies 17 02535 g006
Figure 7. Box loss during training process for all five YOLOv8 models: loss in training dataset (left) and loss in validation dataset (right).
Energies 17 02535 g007
Figure 8. F1-score curve of the defects’ detection models trained on (a) YOLOv8s base model and (b) our TIC model.
Energies 17 02535 g008aEnergies 17 02535 g008b
Figure 9. Inference on test images of (a,b) TIC model predictions and (c,d) defect detection model. Inference on drone footage is also provided in mp4 format, named Video S1, in Supplementary Materials Section.
Energies 17 02535 g009aEnergies 17 02535 g009b
Table 1. Pre-trained models used for transfer learning.
ModelModel VersionPre-Trained ModelParameters (M)GFLOPs (B)
YOLOv8Yolov8nyolov5n.pt3.28.7
Yolov8syolov5s.pt11.228.6
Yolov8myolov5m.pt25.978.9
Yolov8lyolov5l.pt43.7165.2
Yolov8xyolov8x.pt68.2257.8
Table 2. Tuned hyperparameters.
HyperparameterValueHyperparameterValue
Lr00.00106Scale0.82518
Lrf0.01Mosaic0.94583
Momentum0.98Flipud0.25826
Weight decay0.00058Copy_paste0.09673
Epochs80–100
patience20
Hsv_h0.01443
Hsv_s0.68579
Hsv_v0.28021
Translate0.12681
Table 3. Training environment.
Dependencies/HardwareVersion
python3.10.11
Ultralytics8.0.112
CUDA12.0
GPUTesla 4 15 GB (google colab)
CPUAMD Ryzen 5 2500U 8 GB RAM (2 GHz)
Table 4. Our models’ performance with Tesla T4 GPU (15 GB). Input image size, 640 × 640. NMS time per image ≈ 1.5–2 ms (not included). The highest scores overall are highlighted in bold.
TIC ModelsPrecisionRecall[email protected]mAP@[.50:.95]Inference (FPS)Model SizeTime to Train
YOLOv8n0.7930.7810.8220.6062775.9 MB31 min 18 s
YOLOv8s0.8130.7840.8380.64613821.5 MB30 min 34 s
YOLOv8m0.8330.780.840.6786149.6 MB1 h 17 min
YOLOv8l0.8410.7870.8520.69435.783.6 MB1 h 12 min
YOLOv8x0.8370.7990.8560.69921.5130 MB1 h 77 min
Table 5. Precision, recall, and mAP of YOLOV8x for each class, reaching 97% [email protected] for tower detection.
Object ClassPrecisionRecall[email protected]mAP@[.50:.95]
Tower0.9560.8910.970.916
Insulator0.8360.8650.910.696
Conductor0.7180.6410.6890.486
Table 6. Accuracy and speed results of video inference of our optimized TIC model on RTX3070 (8 GB) and on AMD- Ryzen 5 (16 GB) CPU.
ModelHardwareImage Size[email protected]msfps
TIC modelGPU64083.8%4.1243
CPU320 25.639
TIC model + ONNXCPU32082.2%32.430.8
TIC model + Tensor-RTGPU64082.2%3.9256
Table 7. Performance comparison of TIC YOLOv8s model with YOLOv5s, YOLACT, YOLACT++, and YOLACT-Edge models. Object detection models (YOLO) are evaluated for their bounding box predictions and instance segmentation models (YOLACT) for their mask prediction accuracy. The highest scores in each column are highlighted in bold.
ModelmAP@[.50:.95][email protected]Inference (FPS)
YOLACT-Resnet50-FPN [26]32.7153.1426
YOLACT++-RESNET50 [27]32.1153.1427.8
YOLACT Edge-Resnet50 [28]32.3453.0233
YOLOv5s [6]60.782303
TIC YOLOv8s64.683.8138
Table 8. Comparison with related work on CPLID dataset for detecting defective insulators. The highest scores in each column are highlighted in bold.
AuthorsModelPrecisionRecall[email protected]F1
Tao et al. [22]CNN/VGG-1691%96%N/A93.4%
Qi et al. [16]YOLOv5 + anchor, NAM, and gn Conv94.8%91.9%93.7%93.32%
Feng et al. [12]YOLOv8x + Anchor changing86.8%199.5%92.93%
Chen et al. [29]YOLOv5 + CBAM + Focal lossN/A199.5%N/A
Xia et al. [30]CenterNet95.8%N/A79.4%N/A
Dong et al. [31]Cascade RCNN + SwingV296.5%98.55%94.6%97.51%
Zhao et al. [32]Attention mechanism + Fast-RCNNN/A98.42%94.3%N/A
Wang et al. [33,34]Improved YOLOv5 [33]98.6%94.3%97.8%96.4%
YOLOv4 + data augmentation [34]91%98.84%99.08%94.7%
OursBase YOLOv8s96%98.1%98.7%97.04%
OursTIC model97.7%97.6%99%97.65%
defect 0.998%199.5%99.89%
normal 0.955%0.953%98.5%97.35%
Disclaimer/Publisher’s Note: The statements, opinions and data contained in all publications are solely those of the individual author(s) and contributor(s) and not of MDPI and/or the editor(s). MDPI and/or the editor(s) disclaim responsibility for any injury to people or property resulting from any ideas, methods, instructions or products referred to in the content.