Article

Dynamic Response Study of Overhead Contact System Portal Structure Based on Vehicle–Track–Bridge Coupled Vibration

School of Automation and Electrical Engineering, Lanzhou Jiaotong University, Lanzhou 730070, China
*
Author to whom correspondence should be addressed.
Energies 2024, 17(11), 2510; https://doi.org/10.3390/en17112510
Submission received: 18 April 2024 / Revised: 20 May 2024 / Accepted: 22 May 2024 / Published: 23 May 2024

Abstract

:
In light of the rapid development of electrified railways, the safety and stability of train operations, as well as the catenary’s interaction with current quality, have garnered widespread attention. Electrified train operation with additional track irregularities serves as a principal excitation source within the vehicle–bridge–catenary system, significantly influencing the vibration characteristics of the system. Addressing the aforementioned issues, we first established the vehicle–track dynamics model and the bridge–catenary finite element model based on the principles of coupled dynamics of the vehicle–track system. These models are interconnected using dynamic forces between the wheel and rail. Subsequently, within the vehicle–track coupled system, track random irregularities are introduced as input excitations for the coupled model, and the dynamic response of the system is simulated and solved. Then, the obtained wheel–rail forces are applied to the bridge–catenary coupled system finite element model in the form of time-varying moving load forces. Finally, the dynamic response characteristics of the catenary portal structure under different conditions are determined. Meanwhile, a study on the vibration characteristics of the truss-type pillar portal structure was conducted, and the results were compared with those of existing models. The results indicate that the vertical and lateral forces between the vehicle and track are positively correlated with the speed and irregularity amplitude. Response values such as the derailment coefficient and wheel load reduction rate are within the specified range of relevant standards. The low-order natural resonant frequency of the truss-type pillar structure has, on average, increased by 0.86 compared to the existing pillar structure, which signifies improved stability. Furthermore, under various conditions, the average reductions in maximum displacement and stress response of this pillar structure are 13.2% and 14.19%, respectively, in comparison to the existing pillar structure, rendering it more suitable for practical engineering applications.

1. Introduction

In a certain segment of the Lanzhou Hub of the Lan-Yu Railway, a four-line continuous beam super-large bridge experiences significant vibration phenomena in both the bridge itself and the catenary portal structure when trains pass on the upstream four-lane track, under the influence of irregularities in the additional track. This severely impacts the stable contact between the pantograph and the catenary, posing a significant threat to the stability and safety of train operation [1,2]. Optimizing model parameters to maintain stable and robust contact between the train and the overhead contact system during high-speed operations stands as a crucial direction for future research in the high-speed overhead contact system domain [3]. Meanwhile, increasing train speed can deteriorate the interactive performance between the pantograph and the contact system [4,5]. Experimental trials and numerical simulations were conducted on the pantograph–contact system interaction at various speeds, and the contact quality was optimized using neural network optimization algorithms [6]. A dynamic approach to the energy-harvesting system was proposed based on finite element and multibody dynamics methods, integrated through a combined simulation framework.
As the electrified railway transportation industry develops rapidly, to better adapt to the complexity of railway networks, railway construction often employs elevated railway bridges instead of traditional roadbeds, significantly increasing the proportion of bridges in the railway network. Therefore, research on the dynamics of vehicle–track–bridge coupled systems becomes more necessary and urgent [7,8,9]. Models of railway bridges and vehicles based on three-dimensional finite element and multibody dynamics were constructed, and the influences of speed, load, and damping on the dynamic response of the system were studied through numerical analysis [10]. The dynamic response between the track and the train was studied in bridge and tunnel environments at different speeds, and compared with measurements from traditional ballasted track lines [11]. An analytical method for a coupled system of train–track–bridge–foundation based on lumped parameter models was proposed, and the coupling of subsystems was achieved using a modified component mode synthesis method [12]. Based on the established finite element simulation model of bridges, the deformation of the track caused by bridge deformation was added as an excitation to the coupled system, and the influence of additional bridge deformation on the dynamic response characteristics of the vehicle–track–bridge coupled system was analyzed [13]. The fatigue characteristics of railway bridges with different spans (25 m and 30 m) under train loads were analyzed, and recommended operating speeds corresponding to the spans were provided. It can be seen that, in previous studies on vehicle–track–bridge coupled systems, the analyzed objects were mainly bridge or vehicle subsystems, with less research on the vibration characteristics of the catenary portal structure on the bridge [14,15,16,17]. When trains pass over railway bridges, the effect of track irregularities disturbs the dynamic contact state between the wheel and rail, deteriorating the coupled vibration behavior in the system, thereby affecting the stability and safety of train operations [18]. Nowadays, many scholars have conducted research and discussions on the dynamic response characteristics of vehicle–track–bridge coupled systems under the excitation of electrified train track irregularities. Ref. [19] first simulated seismic and track irregularity spectra, then selected samples with better performance characteristics using number theory methods, and finally analyzed the time-domain dynamic response of the coupled system under two types of excitation. Ref. [20] established a probability model to efficiently select a high-precision set of track irregularities and, combined with vehicle–track coupling dynamics and finite element analysis, revealed the mechanism of interaction between the track and vehicle in the coupled system.
Regarding the abovementioned problem, this article takes the overhead contact system of a four-line continuous beam bridge as the research object; analyzes the low-order natural vibration characteristics of the structure; and then, considering the additional track irregularity excitation from moving loads, respectively, explores the dynamic characteristics of existing portal structures and truss-type pillar portal structures under different vehicle speeds, different irregularity amplitudes, and different driving conditions. The dynamic response results of the two structures are compared and analyzed.

2. Construction of Models

2.1. Modeling of Bridge–Portal Structure

Detailed structural parameters of the bridge’s catenary portal structure are illustrated in the accompanying Figure 1.
The continuous beam bridge, consisting of segments of 40 + 64 + 40 m, is designed in a linear fashion. Both left and right piers are single-box, single-cell, variable-height straight web box-sections made of prestressed concrete C50. The bearings employed are TPZ bowl-type rubber bearings. The main pier cap of the continuous beam is 5.2 m high, while the straight section beam height is 3.0 m, with a bottom curve following a quadratic parabola. The box beam has a top width of 11.5 m and a bottom width of 6.5 m. The bridge segments extend laterally to form platforms, where the overhead contact system’s rigid cross support pillars are fixed. The material for the portal structure on the bridge is Q345 carbon structural steel, with the angle steel being ∠80 × 8. The portal structure support pillars are made of steel pipes with a uniform diameter of 350 mm and a wall thickness of 14 mm.
The main material parameters are configured as shown in Table 1.
When conducting finite element modeling for the system, the main consideration includes structures such as steel rails, sleepers, ballast, bridges, bridge piers, rigid crossbeams, and pillars. The element type selected is the solid186 element with mid-side nodes. When setting displacement boundary conditions, ground settlement is neglected, and fixed constraints are applied to the bottom surfaces of the four bridge piers. To ensure the accuracy of finite element analysis calculations, specific additional components, such as nuts and washers used in the structure, are ignored; and relatively small features, such as bolts and elastic clips, are simplified. A three-dimensional model of the bridge–catenary portal structure crossbeam structure is constructed in the ANSYS finite element simulation platform, as shown in Figure 2.

2.2. Modeling of Vehicle–Track Coupling System

The vehicle–track coupling system is divided into vehicle subsystem and track subsystem, with the wheel–rail contact surface as the boundary, and the coupling of the system model is achieved through the wheel–rail contact relationship [21,22]. A certain type of high-speed train single-car model can be simplified into a multi-rigid body system consisting of a vehicle subsystem model, including a car body, two bogies, and four wheelsets. Each structure is considered as a rigid body with 6 degrees of freedom. Thus, the entire vehicle model has 42 degrees of freedom [23,24]. The main component degrees of freedom of the system are shown in Table 2, and the model schematic is shown in Figure 3.
In Figure 3, M represents mass; X, Y, Z, φ, β, and ψ represent longitudinal, lateral, vertical, roll, pitch, and yaw degrees of freedom, respectively; subscripts c, t, and w represent car body, bogie, and wheelset, respectively; EI is the elastic modulus of the steel rail; Kt and Kp represent vertical stiffness of one side of the two-series suspension and one-side vertical stiffness of the one-series suspension, respectively; Ct and Cp represent vertical damping of one side of the two-series suspension and one-side vertical damping of the one-series suspension, respectively; and Z0i represents track irregularities.
We built a vehicle–track coupled simulation model using Simpack dynamics 2021 software, as shown in Figure 4.

3. Dynamic Response of Vehicle–Track Systems

3.1. Simulation of Track Irregularities

The China Railway Science Research Institute has proposed track spectra applicable to China’s main trunk lines and different types of track structures through data collection, processing, calculation, and analysis of track spectra. These spectra unify the expressions of track irregularities in elevation, lateral, and alignment using different coefficients. The expression is as follows:
S ( f ) = A ( f 2 + B f + C ) f 4 + D f 3 + E f 2 + F f + G
where S(f) represents power spectral density; f represents spatial frequency; and AG are characteristic coefficients of track irregularity power spectral density, with different values corresponding to different line grades and types.
In the vehicle–track coupled system, using the seven-parameter track irregularity power spectral density function of China’s three main trunk lines as excitation, irregular excitations with lengths of 200 and frequencies of 1920 in the range of 1–200 m long waves are obtained. The temporal samples of vertical and lateral irregular disturbances are shown in Figure 5:
From Figure 5, it can be seen that, in the temporal samples of track irregularities simulated by the seven-parameter track irregularity power spectral density function in China, the vertical irregularity amplitudes of the left track range from −5.12 to 5.98 mm, and the lateral irregularity amplitudes range from −5.96 to +5.67 mm. The vertical irregularity amplitudes of the right track range from −5.04 to 5.69 mm, and the lateral irregularity amplitudes range from −7.79 to +5.74 mm.

3.2. Different Driving Speeds

Considering that the maximum speed limit of the target line is 120 km/h, three operating conditions are set with speeds of 80 km/h, 100 km/h, and 120 km/h, respectively, to analyze the impact of varying train speeds on the interaction between the wheel and rail in the vehicle–track coupled system. The dynamic response results are shown in Figure 6.
Since the length of the target bridge is 144 m, when the train runs over the bridge at speeds of 80 km/h, 100 km/h, and 120 km/h, the response curves end at 6.48 s, 5.18 s, and 4.32 s, respectively. Taking the first wheelset of the leading bogie of the train as an example, the dynamic response curve of wheel–rail interaction at different speeds is shown in Figure 6.
From Figure 6, it can be observed that, under the influence of additional track irregularity excitation, both vertical and lateral forces between the wheel and rail increase with the increase in train speed. Specifically, at a speed of 120 km/h, the maximum vertical forces on the left and right tracks are 63.83 kN and 62.67 kN, respectively. Compared to the maximum vertical forces at 80 km/h, these values increased by 3.07% and 2.62%, respectively. Additionally, the maximum lateral forces on the left and right tracks are 1.71 kN and 1.79 kN, respectively, at 120 km/h, showing increases of 8.23% and 16.9% compared to those at 80 km/h. Furthermore, by comparing these response values with the previously mentioned electrified railway operational safety verification standards, all obtained values are within the specified limits [25,26].
By comparing the respective response values in Reference [27], the relative errors were consistently below 10%, validating the correctness of the vehicle–track model. The specific data comparison results are shown in Table 3.

3.3. Different Track Irregularities

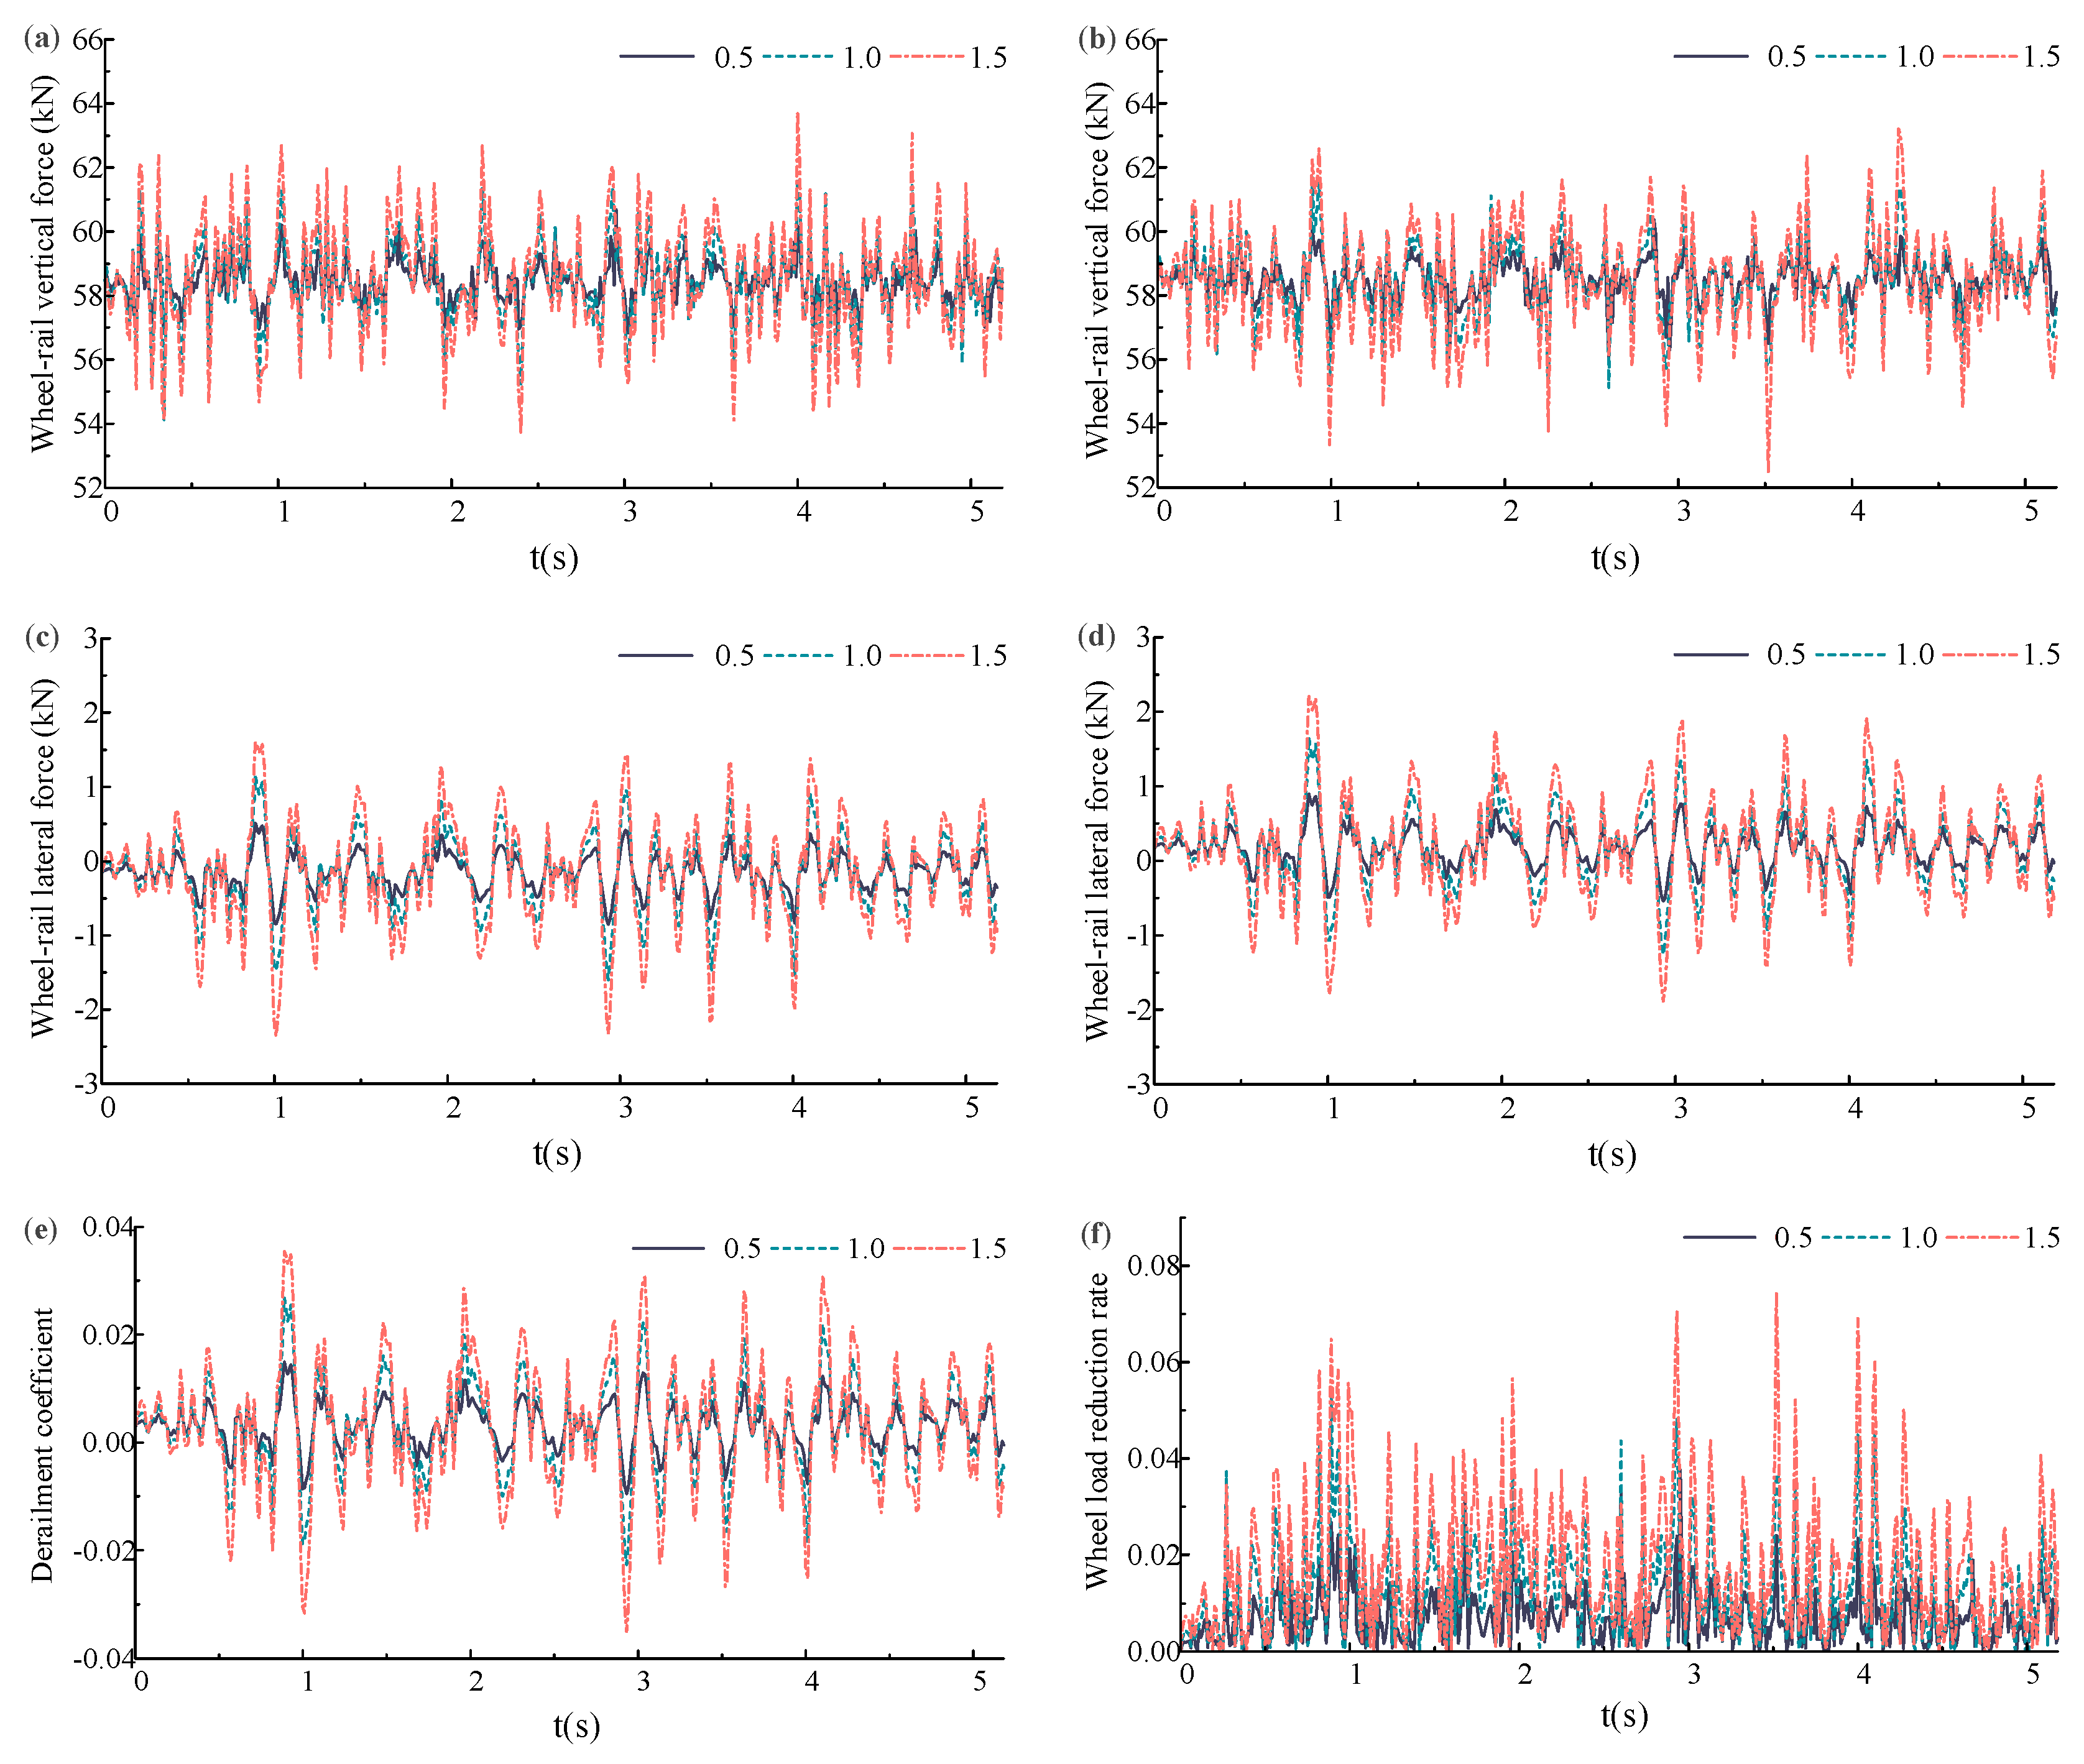
Figure 7 simulates different levels of track irregularity by scaling the amplitude of the input irregularity samples. Assuming trains are running over the bridge at the same speed (100 km/h), scaling factors of 0.5 (Condition 1), 1 (Condition 2), and 1.5 (Condition 3) are used to represent better, initial, and worse track smoothness, respectively.
From Figure 7, it can be observed that there is a positive correlation between track irregularity amplitudes and the wheel–rail contact forces in the system. For the left rail, when the irregularity amplitudes are 0.5, 1, and 1.5 times the standard deviation, the maximum measured vertical wheel–rail forces are 60.68 kN, 62.89 kN, and 64.34 kN, respectively. When the irregularity amplitude increases to 1.5 times the standard deviation, the maximum vertical wheel–rail force increases by approximately 6.03% compared to 0.5 times. The maximum lateral wheel–rail forces are 0.51 kN, 1.13 kN, and 1.60 kN, respectively, showing a significant increase of 213.45% from 0.5 to 1.5 times the standard deviation. Additionally, for the right rail, the maximum vertical wheel–rail forces under the corresponding irregularity amplitude conditions are 60.37 kN, 61.71 kN, and 63.20 kN, with an increase of 4.70% from 0.5 to 1.5 times the standard deviation. The maximum lateral wheel–rail force increases from 0.89 kN to 2.21 kN, representing an increase of 146.07%. Comparing these results, it can be seen that the influence of track irregularity amplitudes on lateral wheel–rail contact forces is more significant than that on vertical wheel–rail forces, and the significant increase in wheel–rail contact forces leads to an exacerbation of the vehicle–track system’s amplitude, consistent with reality.

4. Dynamic Response of Existing Portal Structure

4.1. Modal Analysis of Existing Portal Structure

The natural characteristics of portal structure are mainly reflected by its low-order modes. The purpose of modal analysis is to study the inherent vibration characteristics of the structure. Each mode has its unique natural vibration frequency, damping ratio, and mode shape, and the modal analysis is the process of determining these modal parameters. ANSYS software v19.2 provides various modal analysis methods, such as subspace iteration and modal reduction [28]. Subspace iteration is particularly suitable for large-scale structural problems, especially for solving symmetric eigenvalues. When the frequency range of the structure is difficult to estimate and the primary degrees of freedom cannot be pre-selected, this method can demonstrate good applicability.
M u ¨ + C u ˙ + K u = F
where M, C, and K are, respectively, the mass, damping, and stiffness matrices; {u}, { u ˙ }, and {ü} are the displacement, velocity, and acceleration vectors; and F is the road load. The displacement vector, { u ˙ }, and the acceleration vector, {ü}, are as follows, respectively:
u = λ sin ω t + θ
u ¨ = ω 2 λ sin ω t + θ
where ω represents the natural frequency, φ represents the structural mode shape, and θ represents the initial phase.
When damping is neglected, the equation for the natural frequency of portal structure is as follows:
λ sin ω t + θ K ω 2 λ sin ω t + θ M = 0
Since the sine term can take any value, it can be eliminated; thus, Equation (5) can be further written as follows:
K ω 2 M = 0
By solving Equation (6), the first n natural frequencies of the structure are as follows:
ω 1 ω 2 ω 3 ω n
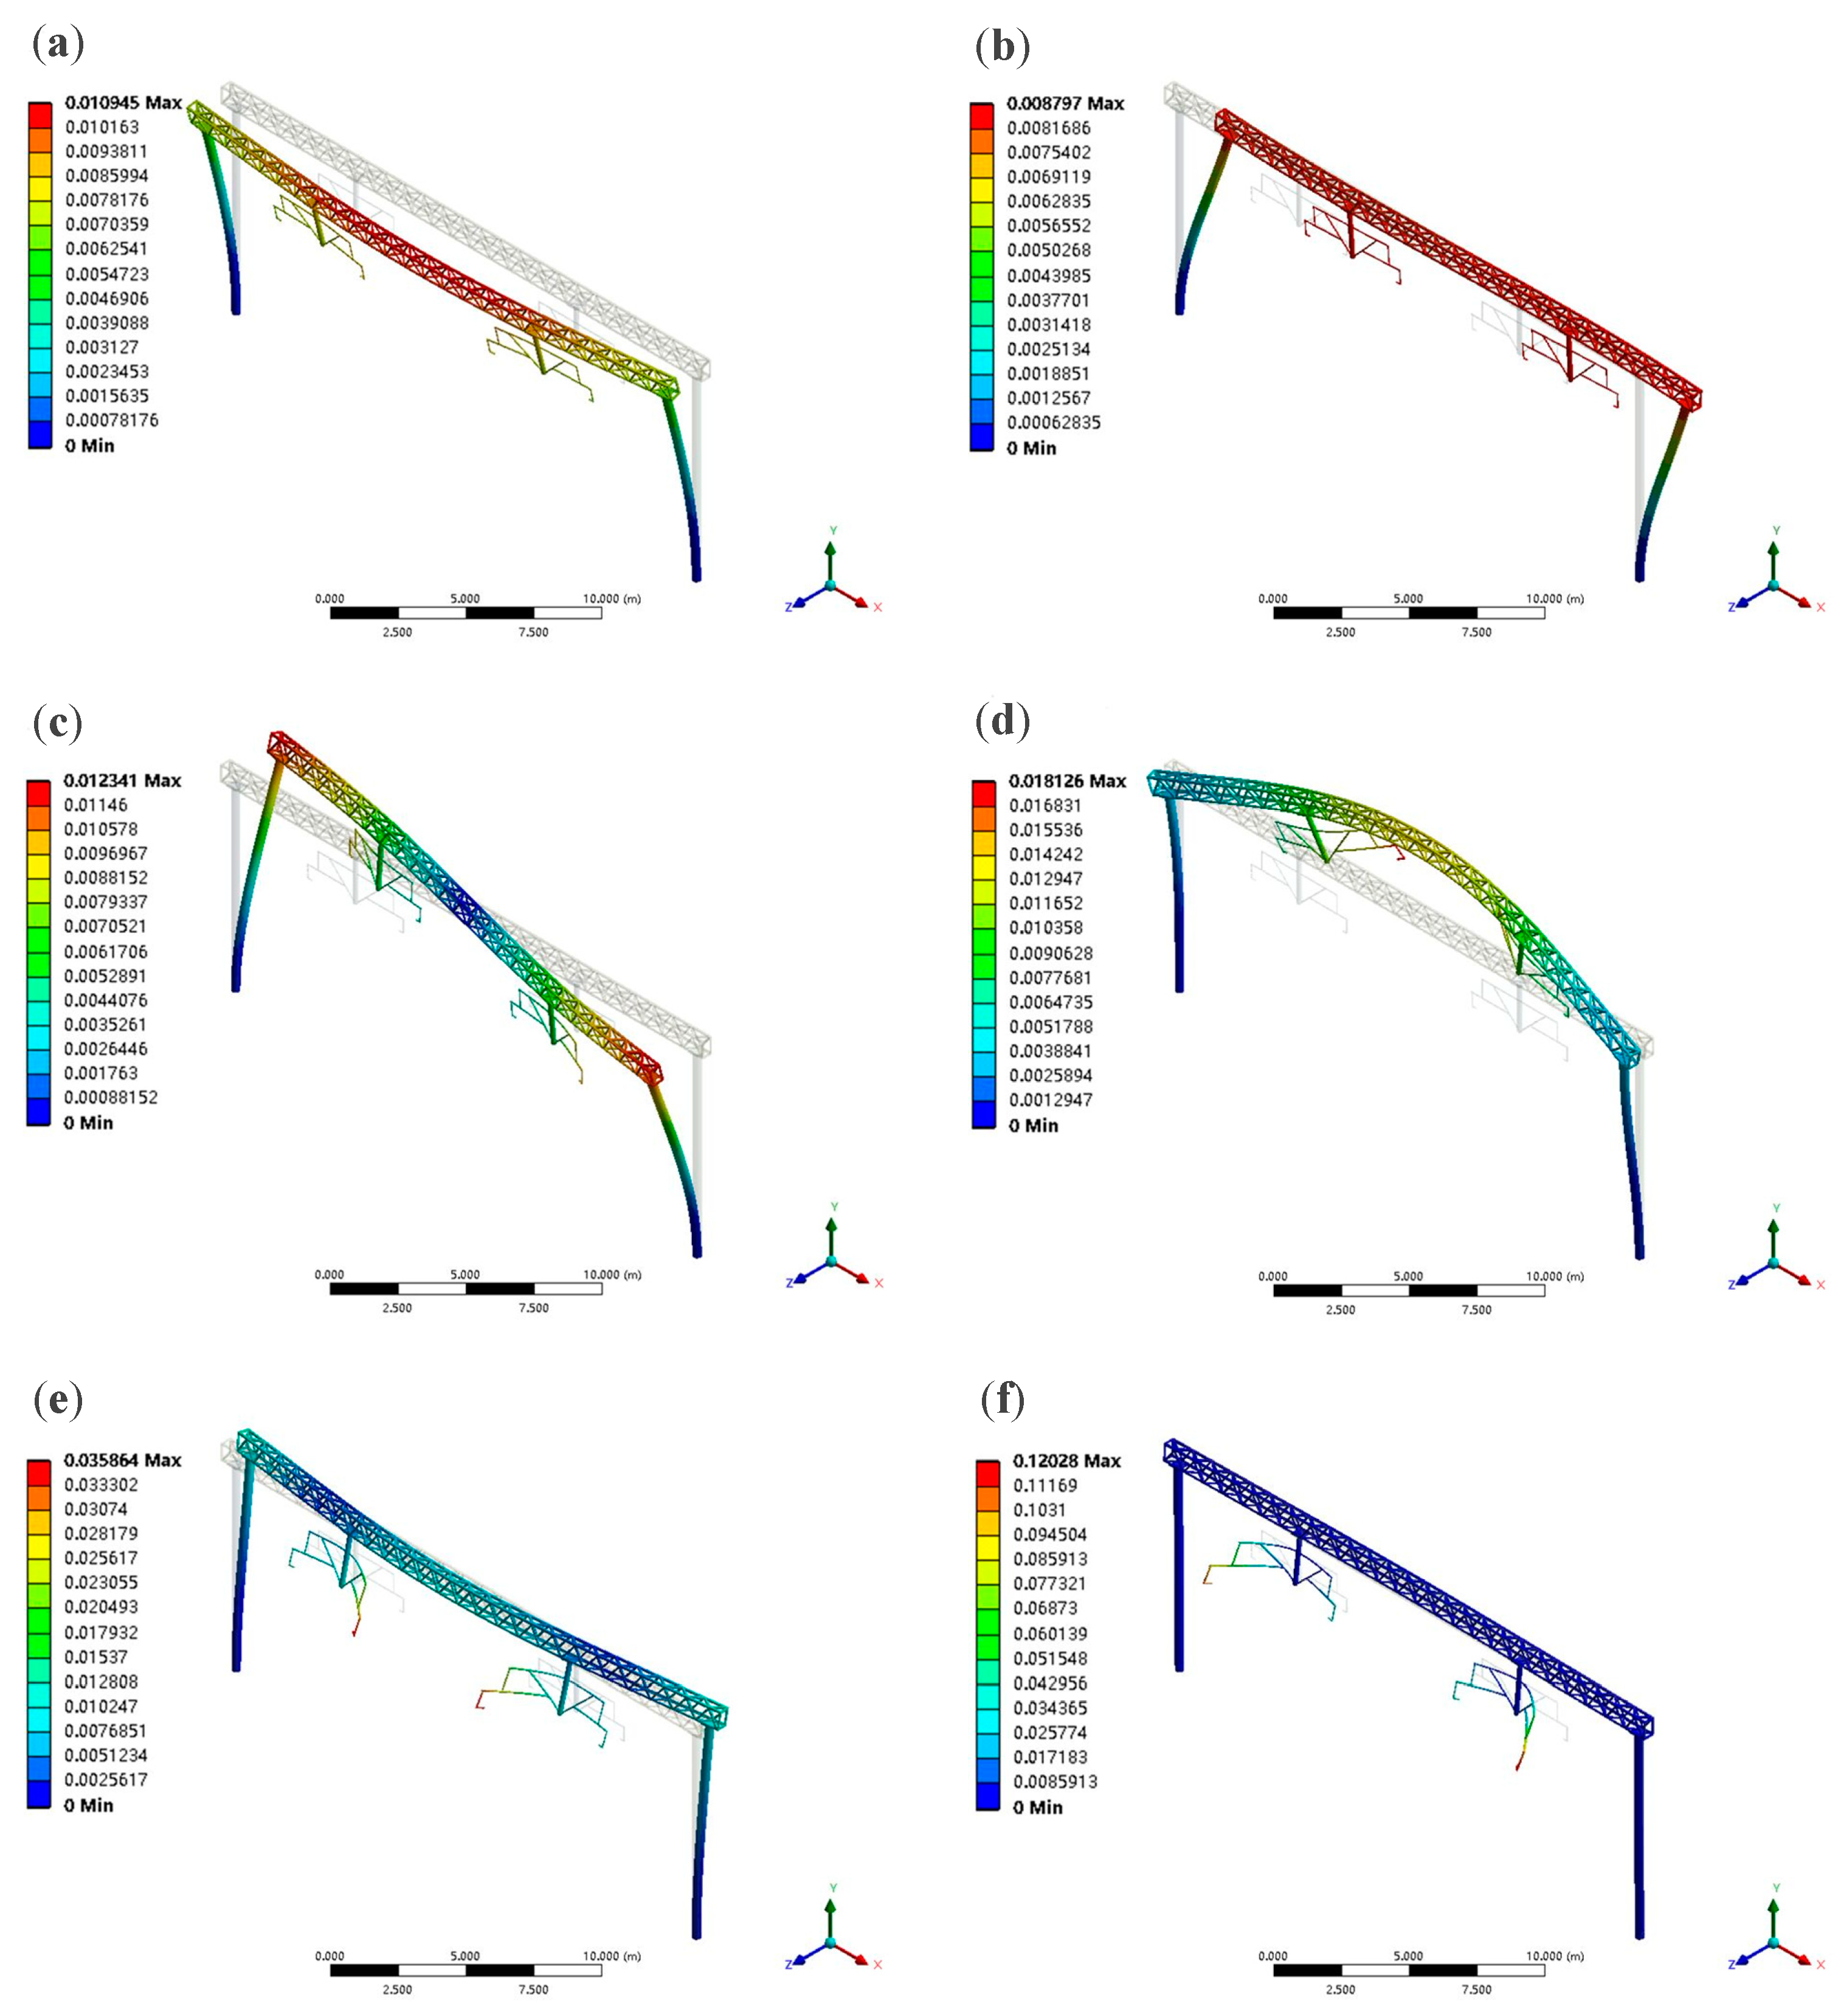
In the ANSYS simulation software, taking the portal structure at the midspan position of the system bridge as an example, a modal analysis was conducted on the structure to obtain the mode shapes of low-order modes and the corresponding natural frequencies of each mode. Based on the modal parameters of the structure vibration obtained, the vibration forms and characteristics of the portal structure under each natural frequency state were analyzed. The first six mode shapes of the structure and their corresponding natural resonance frequencies are shown in Figure 8.
The first mode shape of the portal structure transverse structure manifests as a longitudinal vibration between the beam and the pillar, with the beam structure showing a tendency to overturn along the Z direction; the second mode shape exhibits a lateral vibration of the beam and the pillar along the X direction; the third mode shape shows an anti-symmetric longitudinal vibration of the two end pillars; the fourth mode shape shows a vertical vibration of the beam and the contact line suspension structure; the fifth mode shape exhibits an anti-symmetric longitudinal vibration of the pillar top, the middle position of the beam, and the contact line suspension structure, with the pillar top along the -Z direction and the middle of the beam along the Z direction; the sixth mode shape demonstrates symmetric longitudinal vibration of the beam driving the contact line suspension structure. The self-vibration forms of the portal structure are primarily longitudinal vibrations, with fewer horizontal and vertical mode shapes, which are secondary vibration forms. Moreover, torsional mode shapes do not appear in the lower-order modes, indicating that the structure has significant torsional stiffness and meets requirements easily. The resonant frequencies corresponding to each mode shape are listed in Table 4.

4.2. Dynamic Response of Existing Portal Structure under Different Conditions

4.2.1. Different Driving Speeds

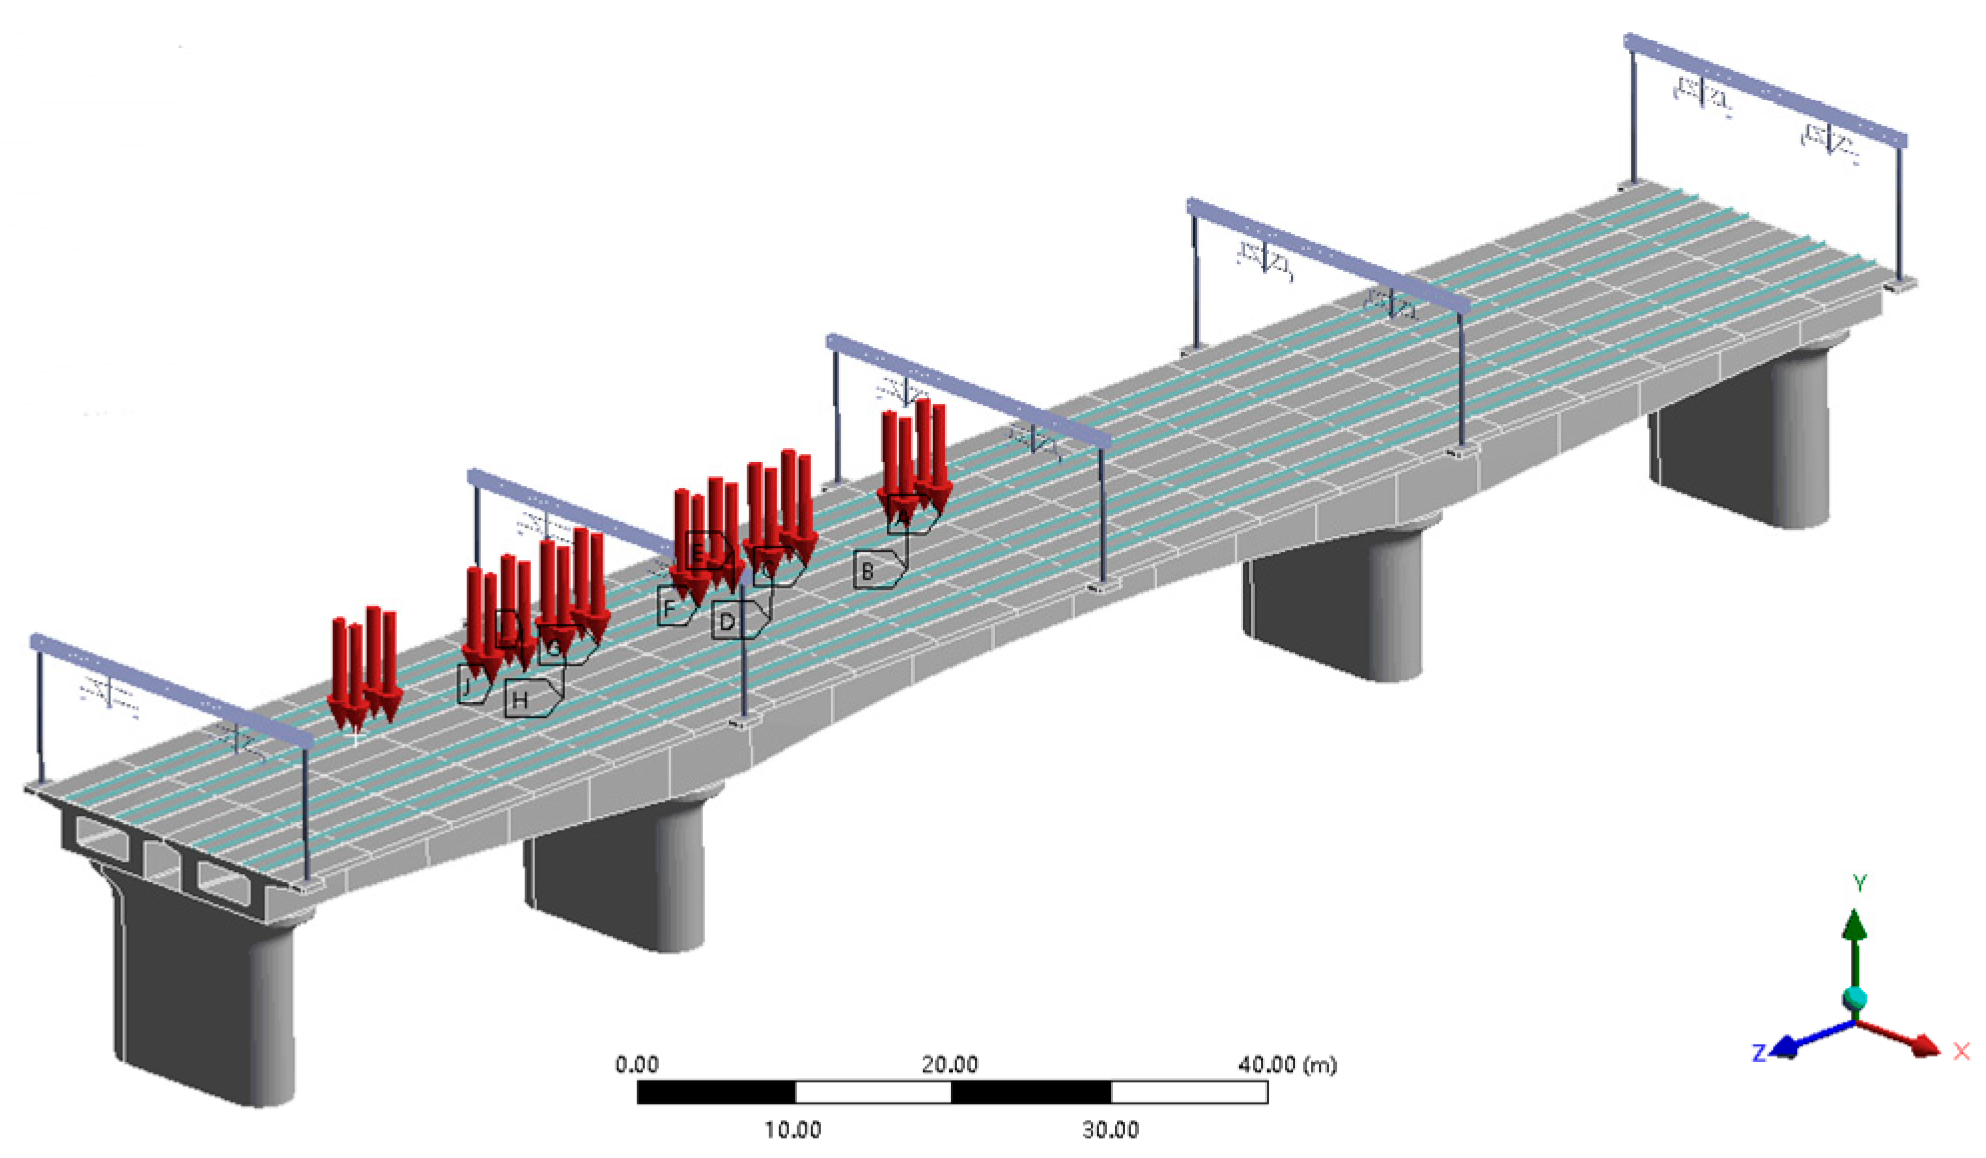
Selecting the node located at the midpoint along the bridge direction on the surface of the rail as the trajectory for load movement, a vertical load force is applied to a single node. As the load moves to the next node, the load on the previous node is removed to simulate the movement of a vehicle on the bridge. For example, in Figure 9, the load distribution is depicted for when a train travels at 120 km/h and reaches 2.16 s.
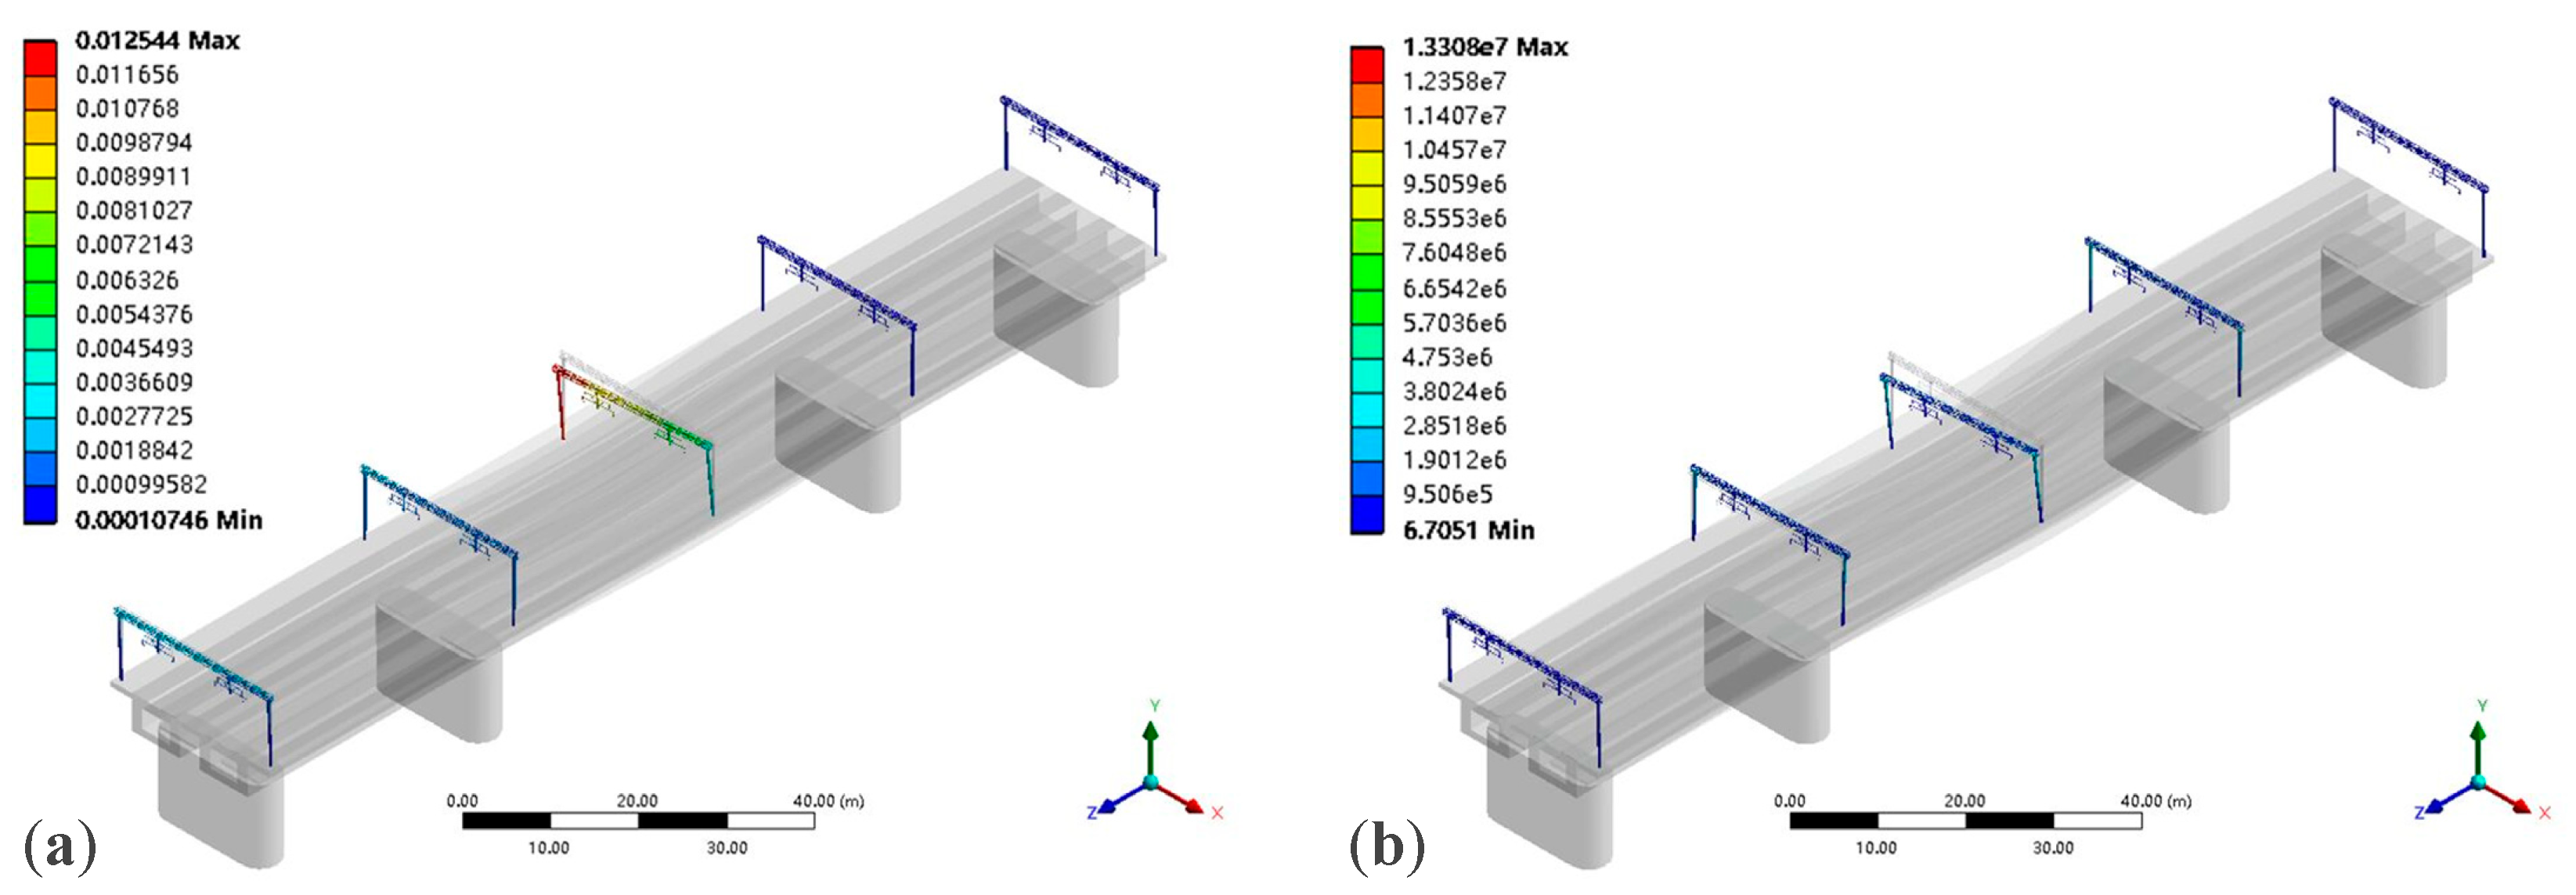
Analyzing the vibration characteristics of the catenary portal structure on the continuous girder bridge under the excitation of electrified trains, we can see that the trains are designed to operate along Line 3, with a speed range from 80 to 120 km/h. The track irregularities adopt the track spectrum recommended by the China Academy of Railway Sciences. A dynamic response simulation analysis was conducted on the catenary portal structure, obtaining its dynamic response results of displacement and stress, as shown in Figure 10.
From Figure 10, it can be observed that, as the train speed increases, the dynamic response of the portal structure gradually increases. However, regardless of the train speed, the dynamic response of the #3 portal structure at the mid-span of the bridge under the moving train load is always the most intense. When the train speed increases from 80 km/h to 120 km/h, the maximum displacement of this portal structure increases from 12.544 mm to 17.789 mm. When the train speed reaches 100 km/h, the displacement amplitude of the structure increases by 25.14, and when the train speed is 120 km/h, the displacement amplitude increases by 41.81% compared to the speed of 80 km/h. The maximum stresses are 13.308 MPa, 15.617 MPa, and 18.730 MPa, respectively, increasing by 17.35% and 40.74%, respectively. Compared to stress response, the displacement response of the portal structure is more sensitive to changes in train speed, and when the train speed increases to 100 km/h, the change in displacement response is significantly greater than the change in stress response.

4.2.2. Different Driving Conditions

Analyzing the dynamic response characteristics of the catenary portal structure under different operating conditions, setting the train to operate at the same speed (100 km/h), respectively, along Line 1 and Line 3, and crossing the bridge with two lines intersecting, three operating conditions are considered. Displacement and stress analyses were conducted on the portal structure. The dynamic response values during single line operation on Line 3 are the same as in Figure 10a,b, so they are ignored here. The dynamic response results of the portal structure during single-line operation on Line 1 and double-line intersection operation are shown in Figure 11.
From Figure 11, it can be seen that, when the train operates along the outer Line 1 of the bridge, the maximum displacement and maximum stress reach 16.366 mm and 16.642 MPa, respectively. Compared to when operating on Line 3, the dynamic response values of the structure under this operating condition are larger, with increases of 4.26% and 6.56%, respectively. Meanwhile, when the train operates with double lines intersecting, the structural dynamic response is greater than when operating on a single line. The impact of the train’s double lines intersection on the structural displacement and stress response is most significant at the mid-span of the portal structure. It reaches 19.494 mm and 24.889 MPa, respectively. The maximum displacement response during the double-line intersection is approximately 1.24 times that of single-line operation, while the maximum stress response is 1.59 times that of single-line operation. Compared to the displacement response, the changes in operating conditions have a more pronounced effect on the stress response of the portal structure.

4.2.3. Different Track Irregularities

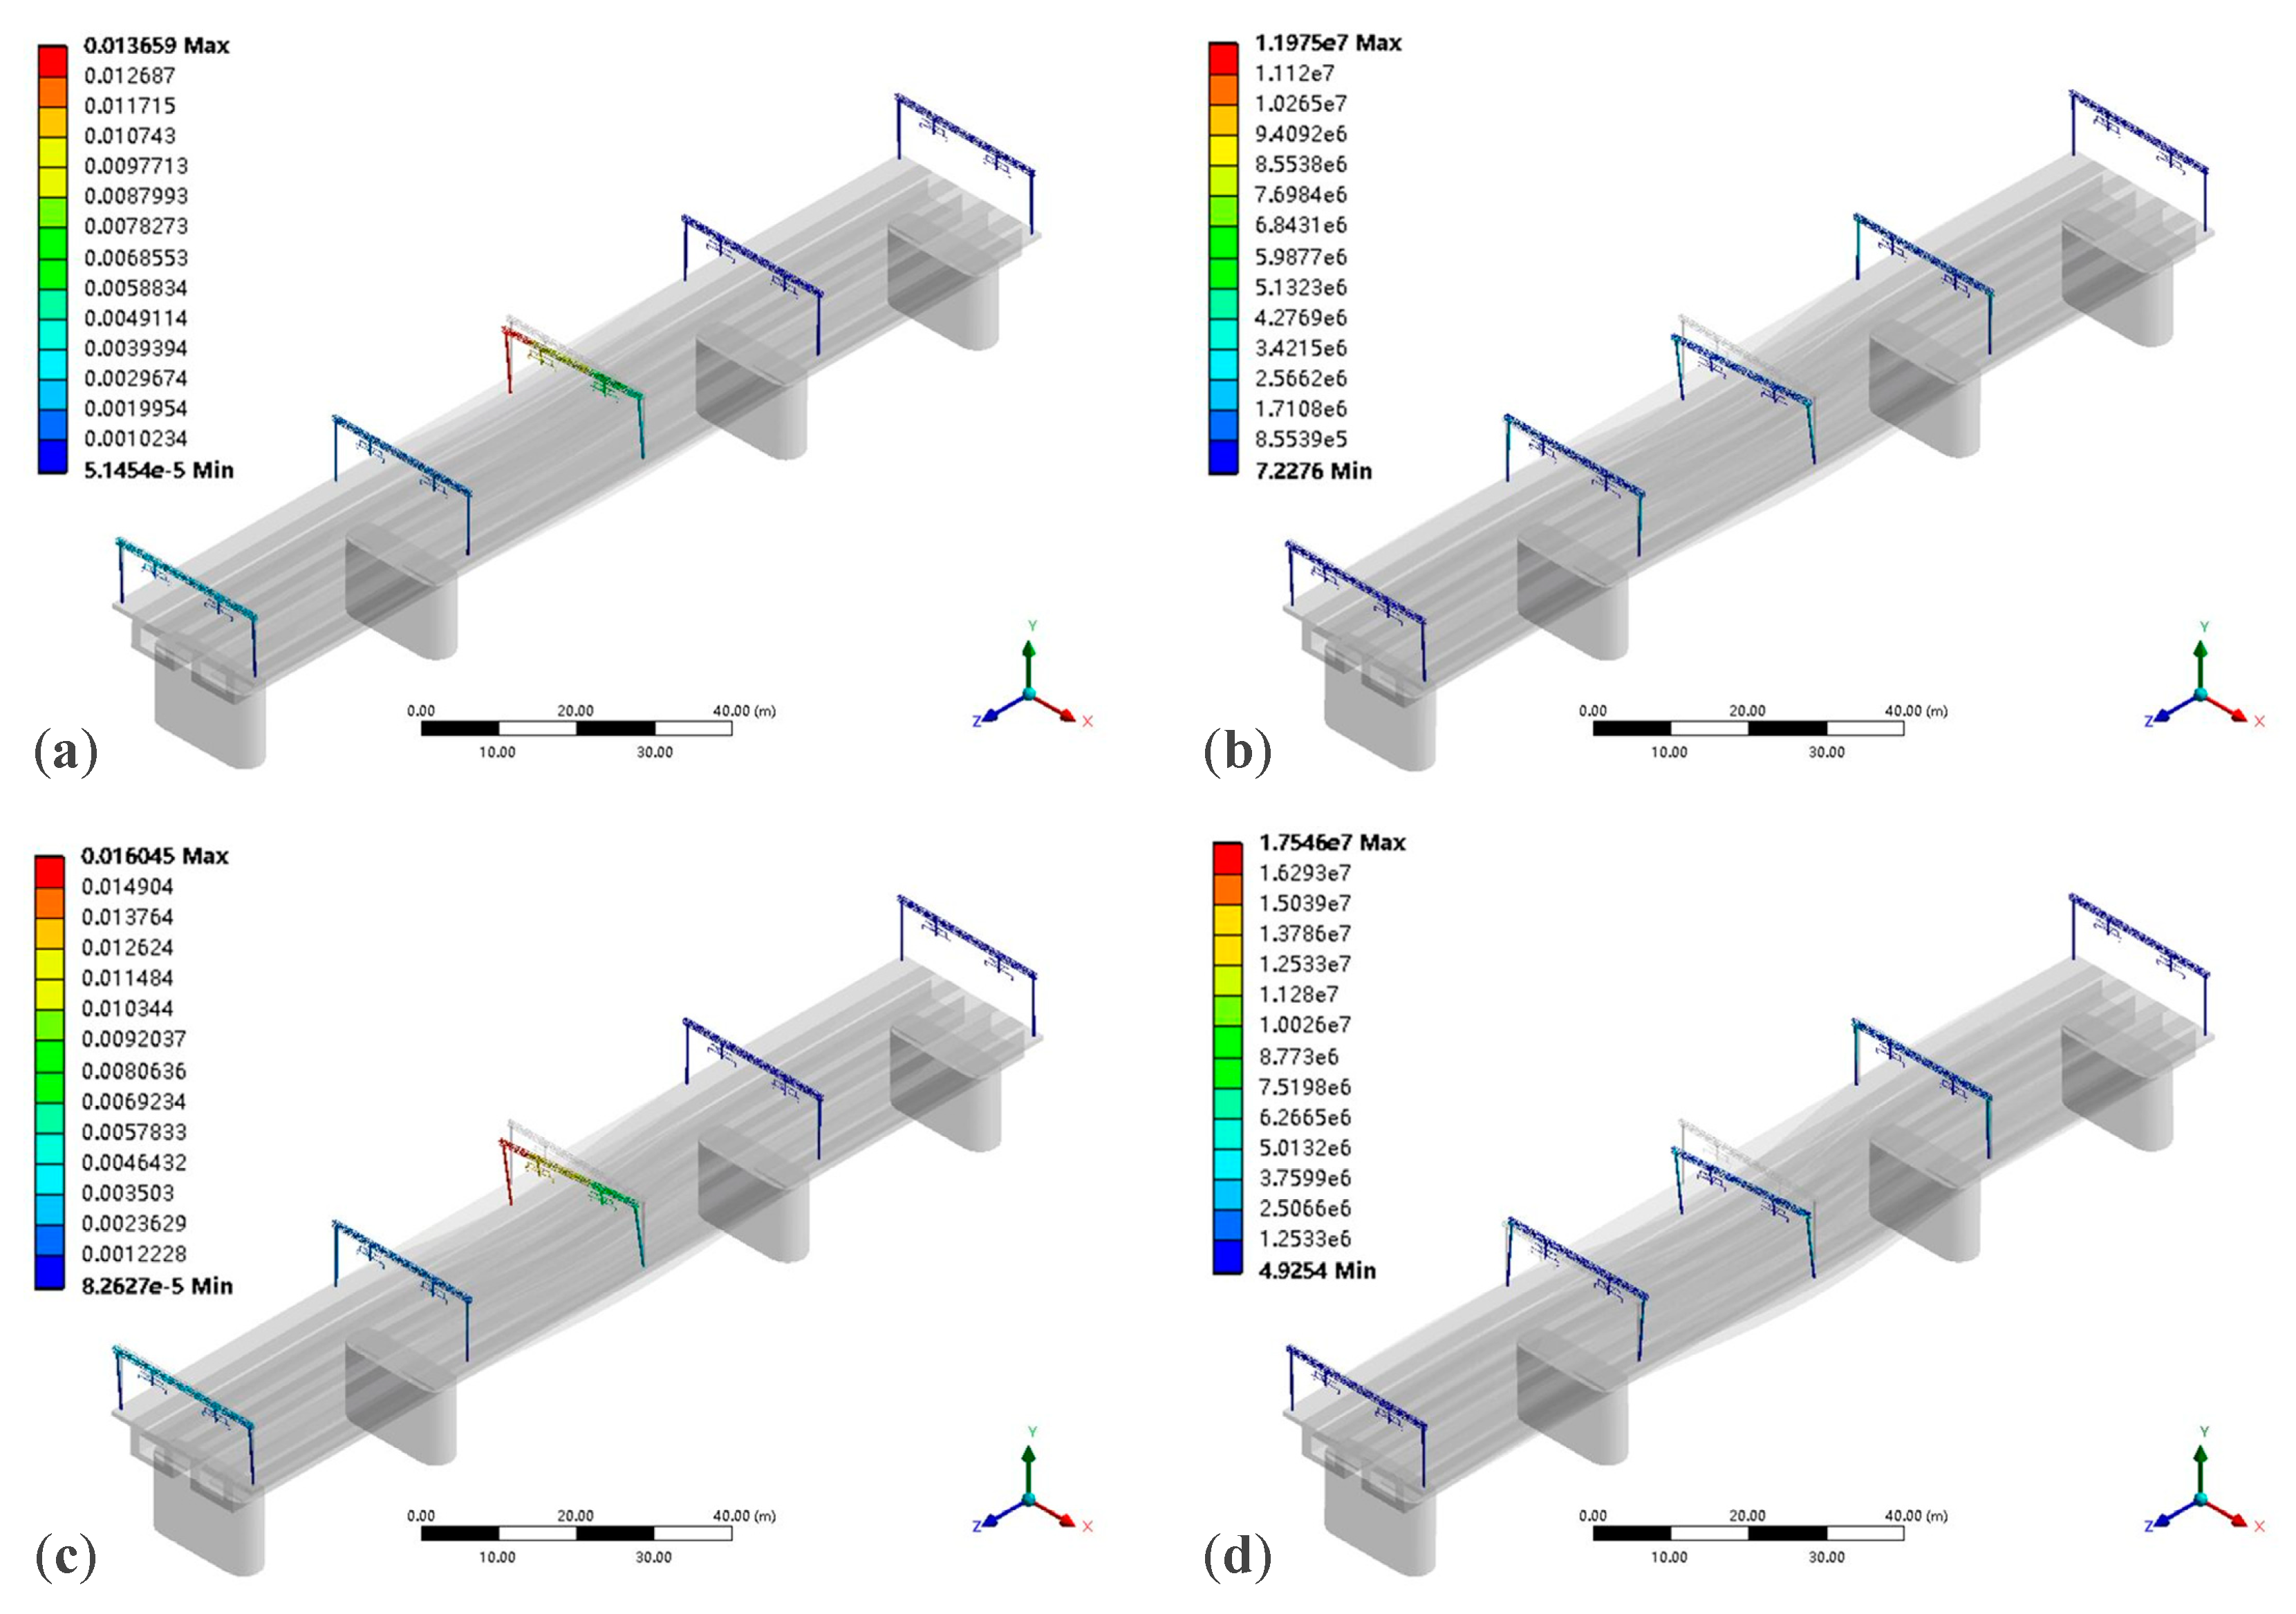
Taking the track spectrum recommended by the China Academy of Railway Sciences as excitation, and selecting the same speed (100 km/h), the vibration characteristics of the portal structure under different irregularity amplitudes (0.5~1.5 times) are analyzed. Among them, the dynamic response values under the irregularity amplitude of 1 times are the same as in Figure 10a,b, so they are ignored here. The dynamic response curves of portal structure displacement and stress under irregularity amplitudes of 0.5 and 1.5 times are shown in Figure 12.
From Figure 12, it can be observed that the maximum displacement and stress response of the portal structure are both located at the mid-span of the bridge at the 3# portal structure. At irregularity amplitudes of 0.5 and 1.5 times, the maximum displacements of the portal structure are 13.659 mm and 16.045 mm, respectively. Compared to the 1 times irregularity amplitude, these represent reductions of 14.93% and an increase of 2.21%, respectively. The maximum stresses are 11.975 MPa and 17.546 MPa, respectively, representing reductions of 30.41% and an increase of 12.35% compared to the 1 times irregularity amplitude.
By comparing the maximum displacements and stress response values from Reference [29], relative errors were found to be below 10%, validating the correctness of the finite element model for the bridge–portal structure. The specific data comparison results are shown in Table 5.

5. Dynamic Response of Truss-Type Pillar Portal Structure

5.1. Modal Analysis of Truss-Type Pillar Portal Structure

We modeled the truss-type pillar portal structure in ANSYS finite element simulation software and analyzed the first six vibration modes and corresponding natural frequencies of the structure, as shown in Figure 13. Based on the system modal parameters obtained from the structural vibration, we analyzed the vibration forms and characteristics of the portal structure under various natural frequency states.
As seen from Figure 13, the first vibration mode of the portal structure exhibits the longitudinal vibration of the beam, with the structure tilting in the Z direction. The second vibration mode shows the anti-symmetric longitudinal vibration between the beam and the pillar. The third vibration mode exhibits the anti-symmetric vertical vibration at the tops of the two end pillars. The fourth vibration mode shows the longitudinal vibration of the tops of the two end pillars and the contact line suspension structure, with the pillar tops along the Z direction and the beam along the Z direction. The fifth vibration mode shows the anti-symmetric longitudinal vibration of the contact line suspension structure. The sixth vibration mode exhibits the symmetric longitudinal vibration of the contact line suspension structure driven by the middle of the beam. The corresponding natural frequencies for each mode are listed in Table 6.
Compared to existing portal structure, the truss-type pillar portal structure has higher low-order natural frequencies, indicating that the structure is less susceptible to external disturbances and vibrations and, thus, exhibits better stability.

5.2. Dynamic Response of Truss-Type Pillar Portal Structure under Different Conditions

5.2.1. Different Driving Speeds

We analyzed the vibration characteristics of the truss-type pillar portal structure when a train passes over a continuous beam bridge at different speeds. The design speed range is from 80 to 120 km/h, with speed increments of 20 km/h each time. The track irregularity adopts the track spectrum recommended by the China Academy of Railway Sciences. The dynamic response results of displacement and stress are shown in Figure 14.
As seen from Figure 14, when the train’s operating speed increases from 80 km/h to 120 km/h, the dynamic response of the truss-type pillar portal structure still shows a positive correlation with the speed variation. The maximum displacement increases from 10.864 mm to 15.176 mm, reaching a 39.69% increase. The maximum stress increases from 10.220 MPa to 17.128 MPa, showing a 67.59% increase. Compared to the displacement response, the stress response of this structure is more sensitive to changes in train operating speed.

5.2.2. Different Driving Conditions

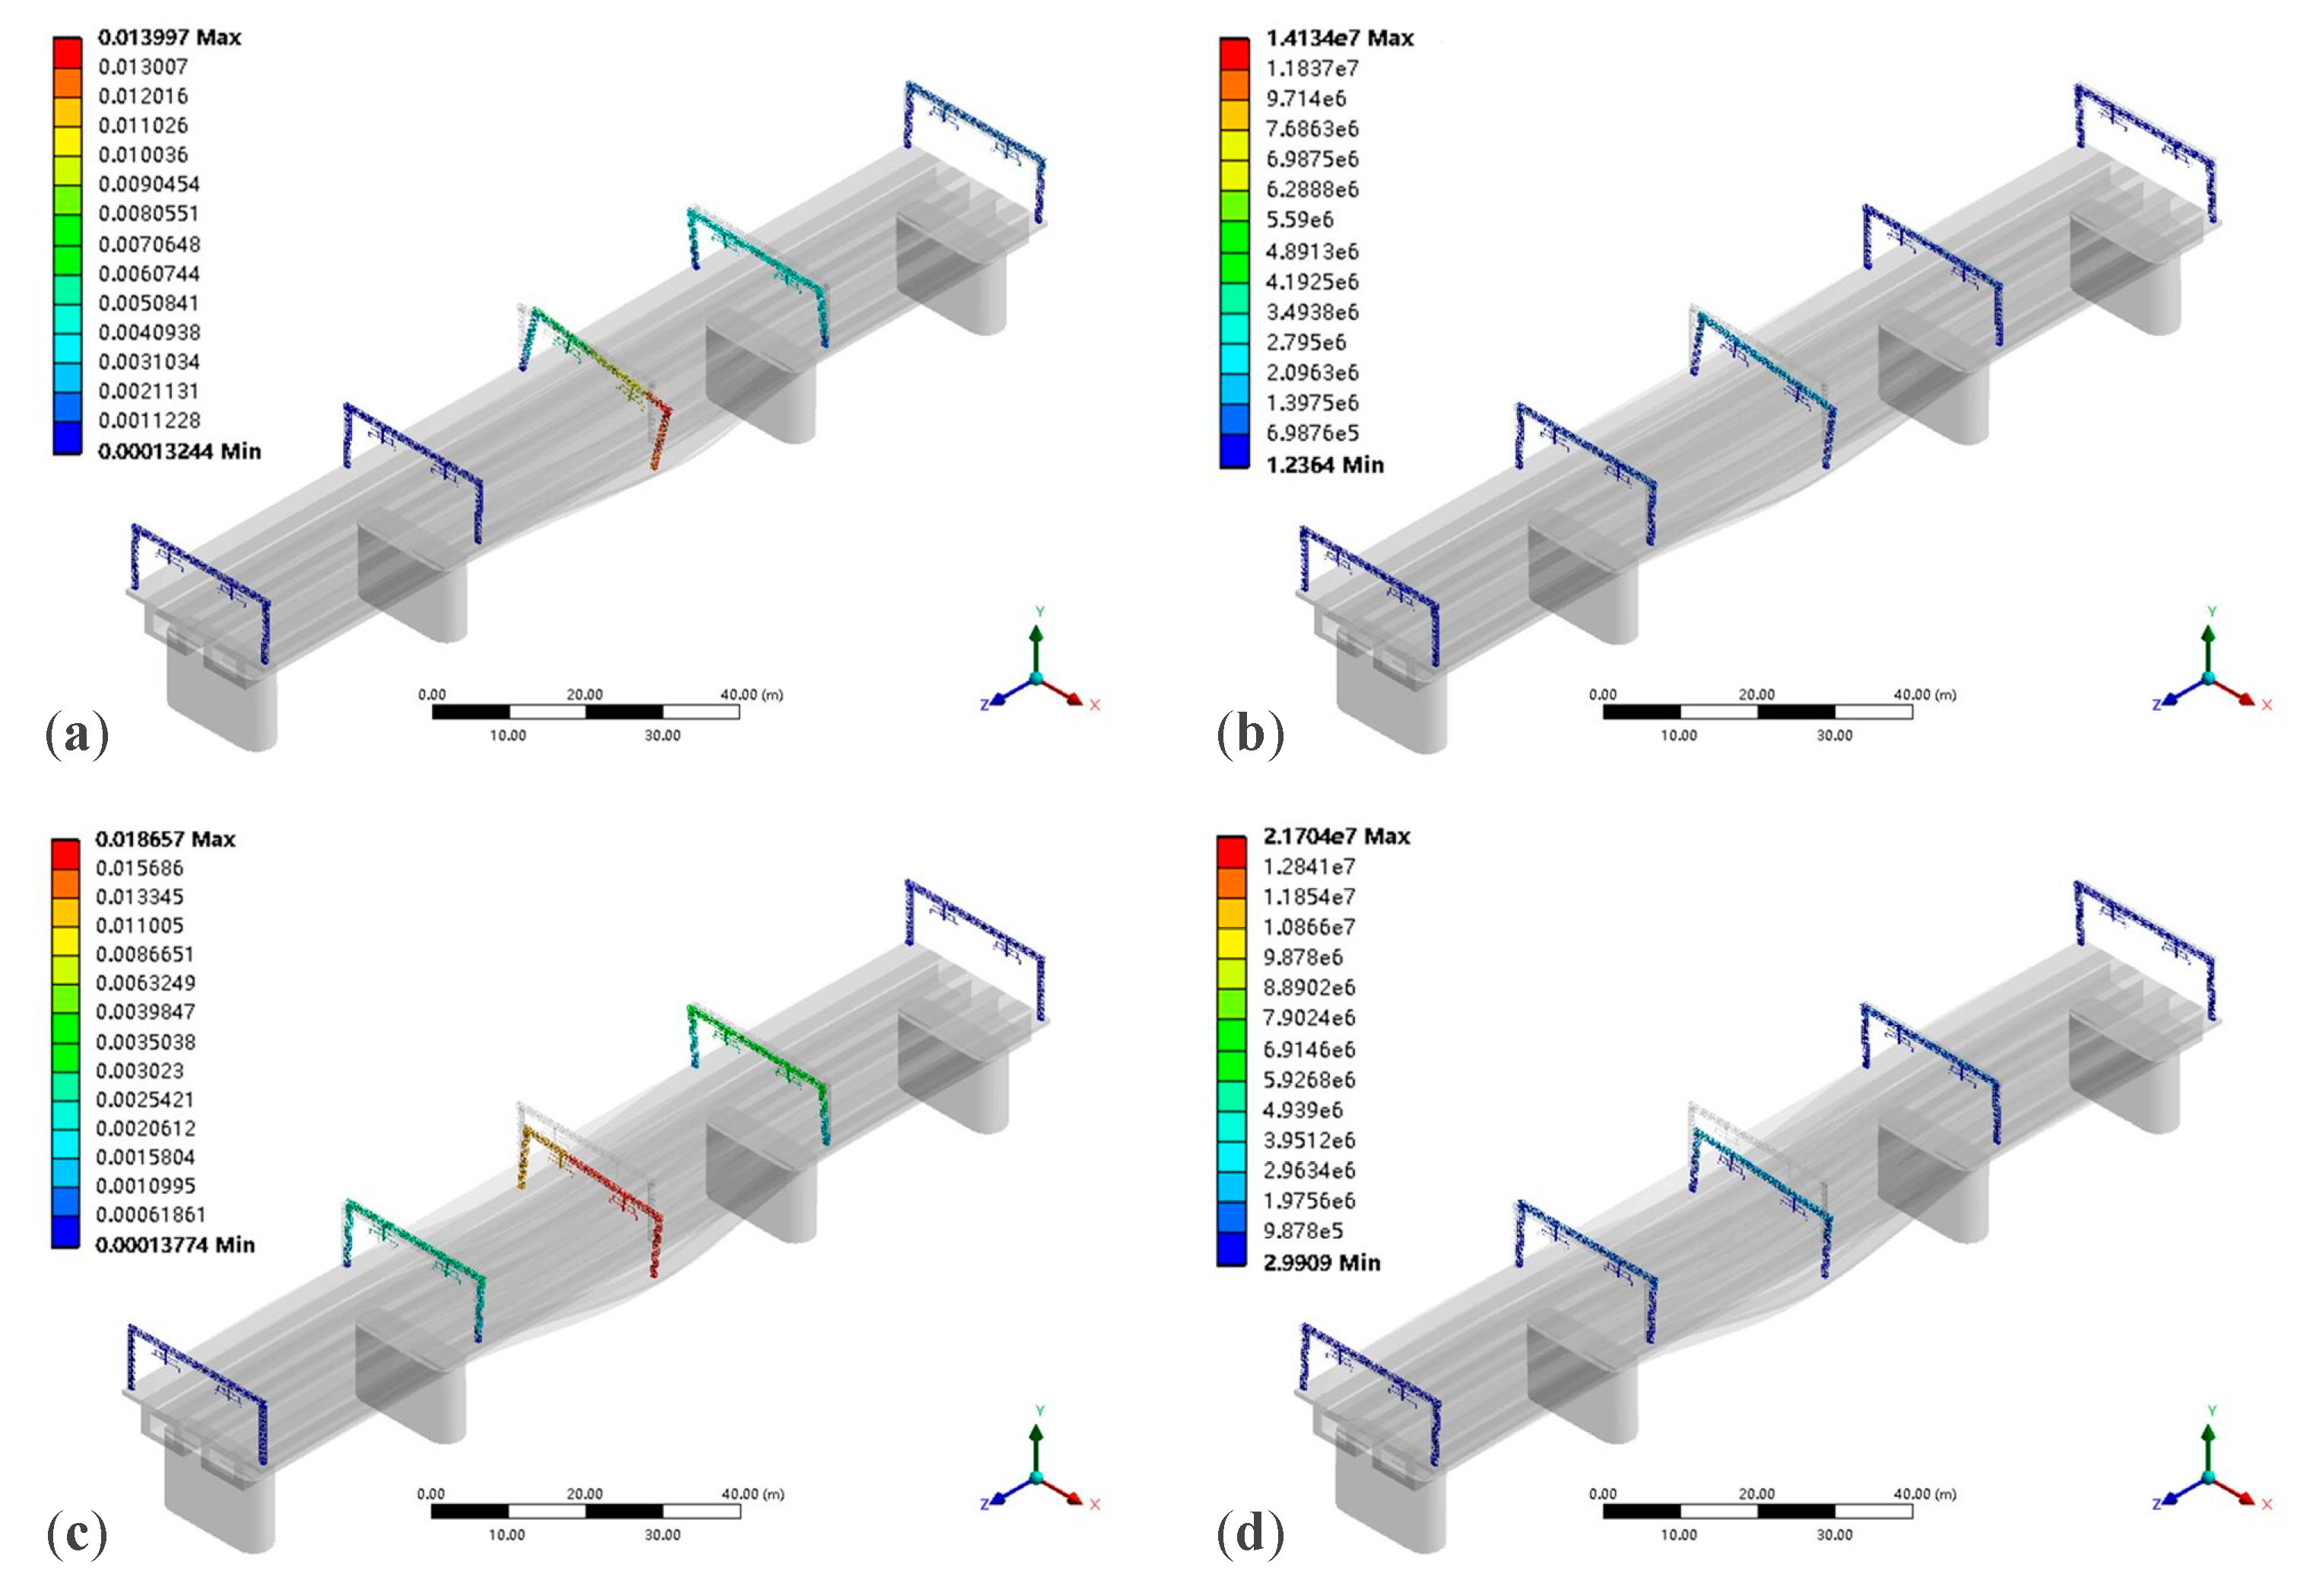
Set the train to run at a constant speed (100 km/h). Analyze the displacement and stress response of the truss-type pillar portal structure when the train passes the bridge along the single track of Line 1 and the intersection of Lines 1 and 3, as shown in Figure 15.
When the train runs along Line 1, as shown in Figure 15, the maximum displacement and maximum stress values are 13.997 mm and 14.134 MPa, respectively. Compared to running along Line 3, they increased by 2.18% and 4.92%, respectively. When running at the intersection of two lines, the displacement and stress response values are significantly increased, reaching 18.657 mm and 21.704 MPa, respectively.

5.2.3. Different Track Irregularities

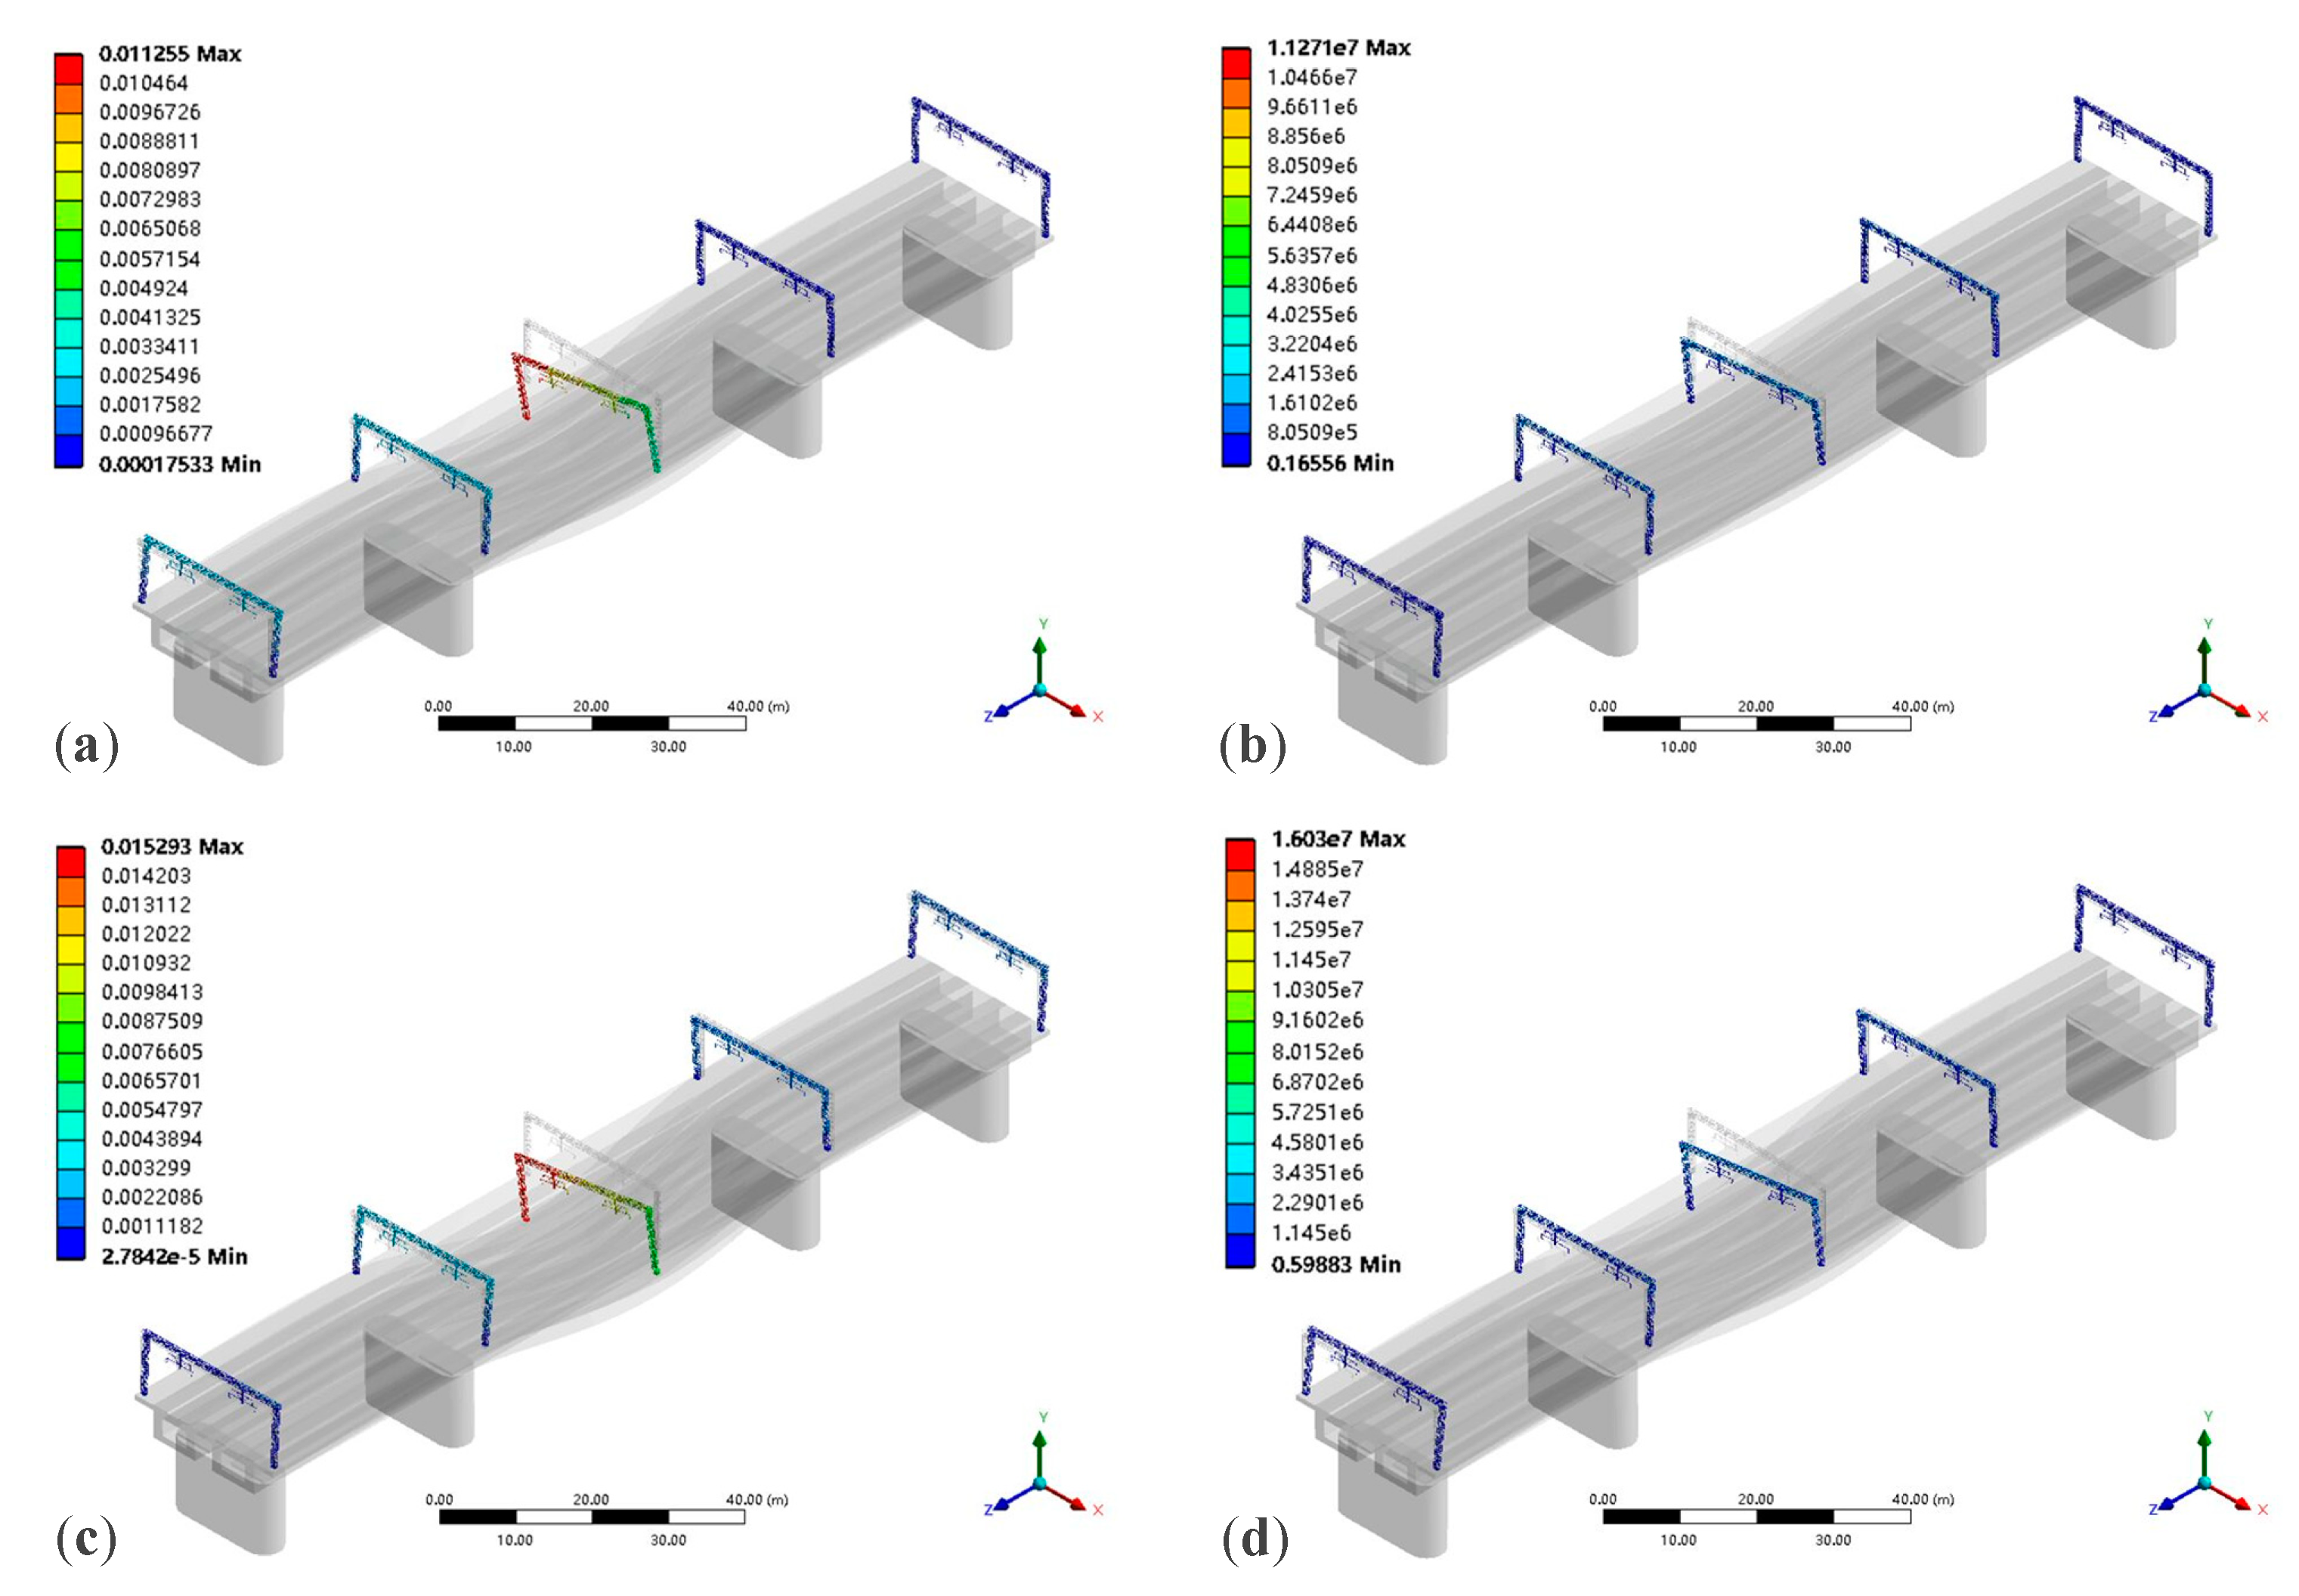
From Figure 16, it can be observed that, at irregularity amplitudes of 0.5 and 1.5 times, the maximum displacements of the rigid structure are 11.255 mm and 15.293 mm, respectively, decreasing by 21.71% and increasing by 11.64% compared to the amplitude of 1. The maximum stress increases from 11.271 MPa to 16.030 MPa, decreasing by 19.52% and increasing by 19.01% compared to the amplitude of 1. When the track smoothness deteriorates, the fluctuation of the interaction force between the wheel and rail has a greater impact on the stress of this structure.

5.3. Comparison Analysis

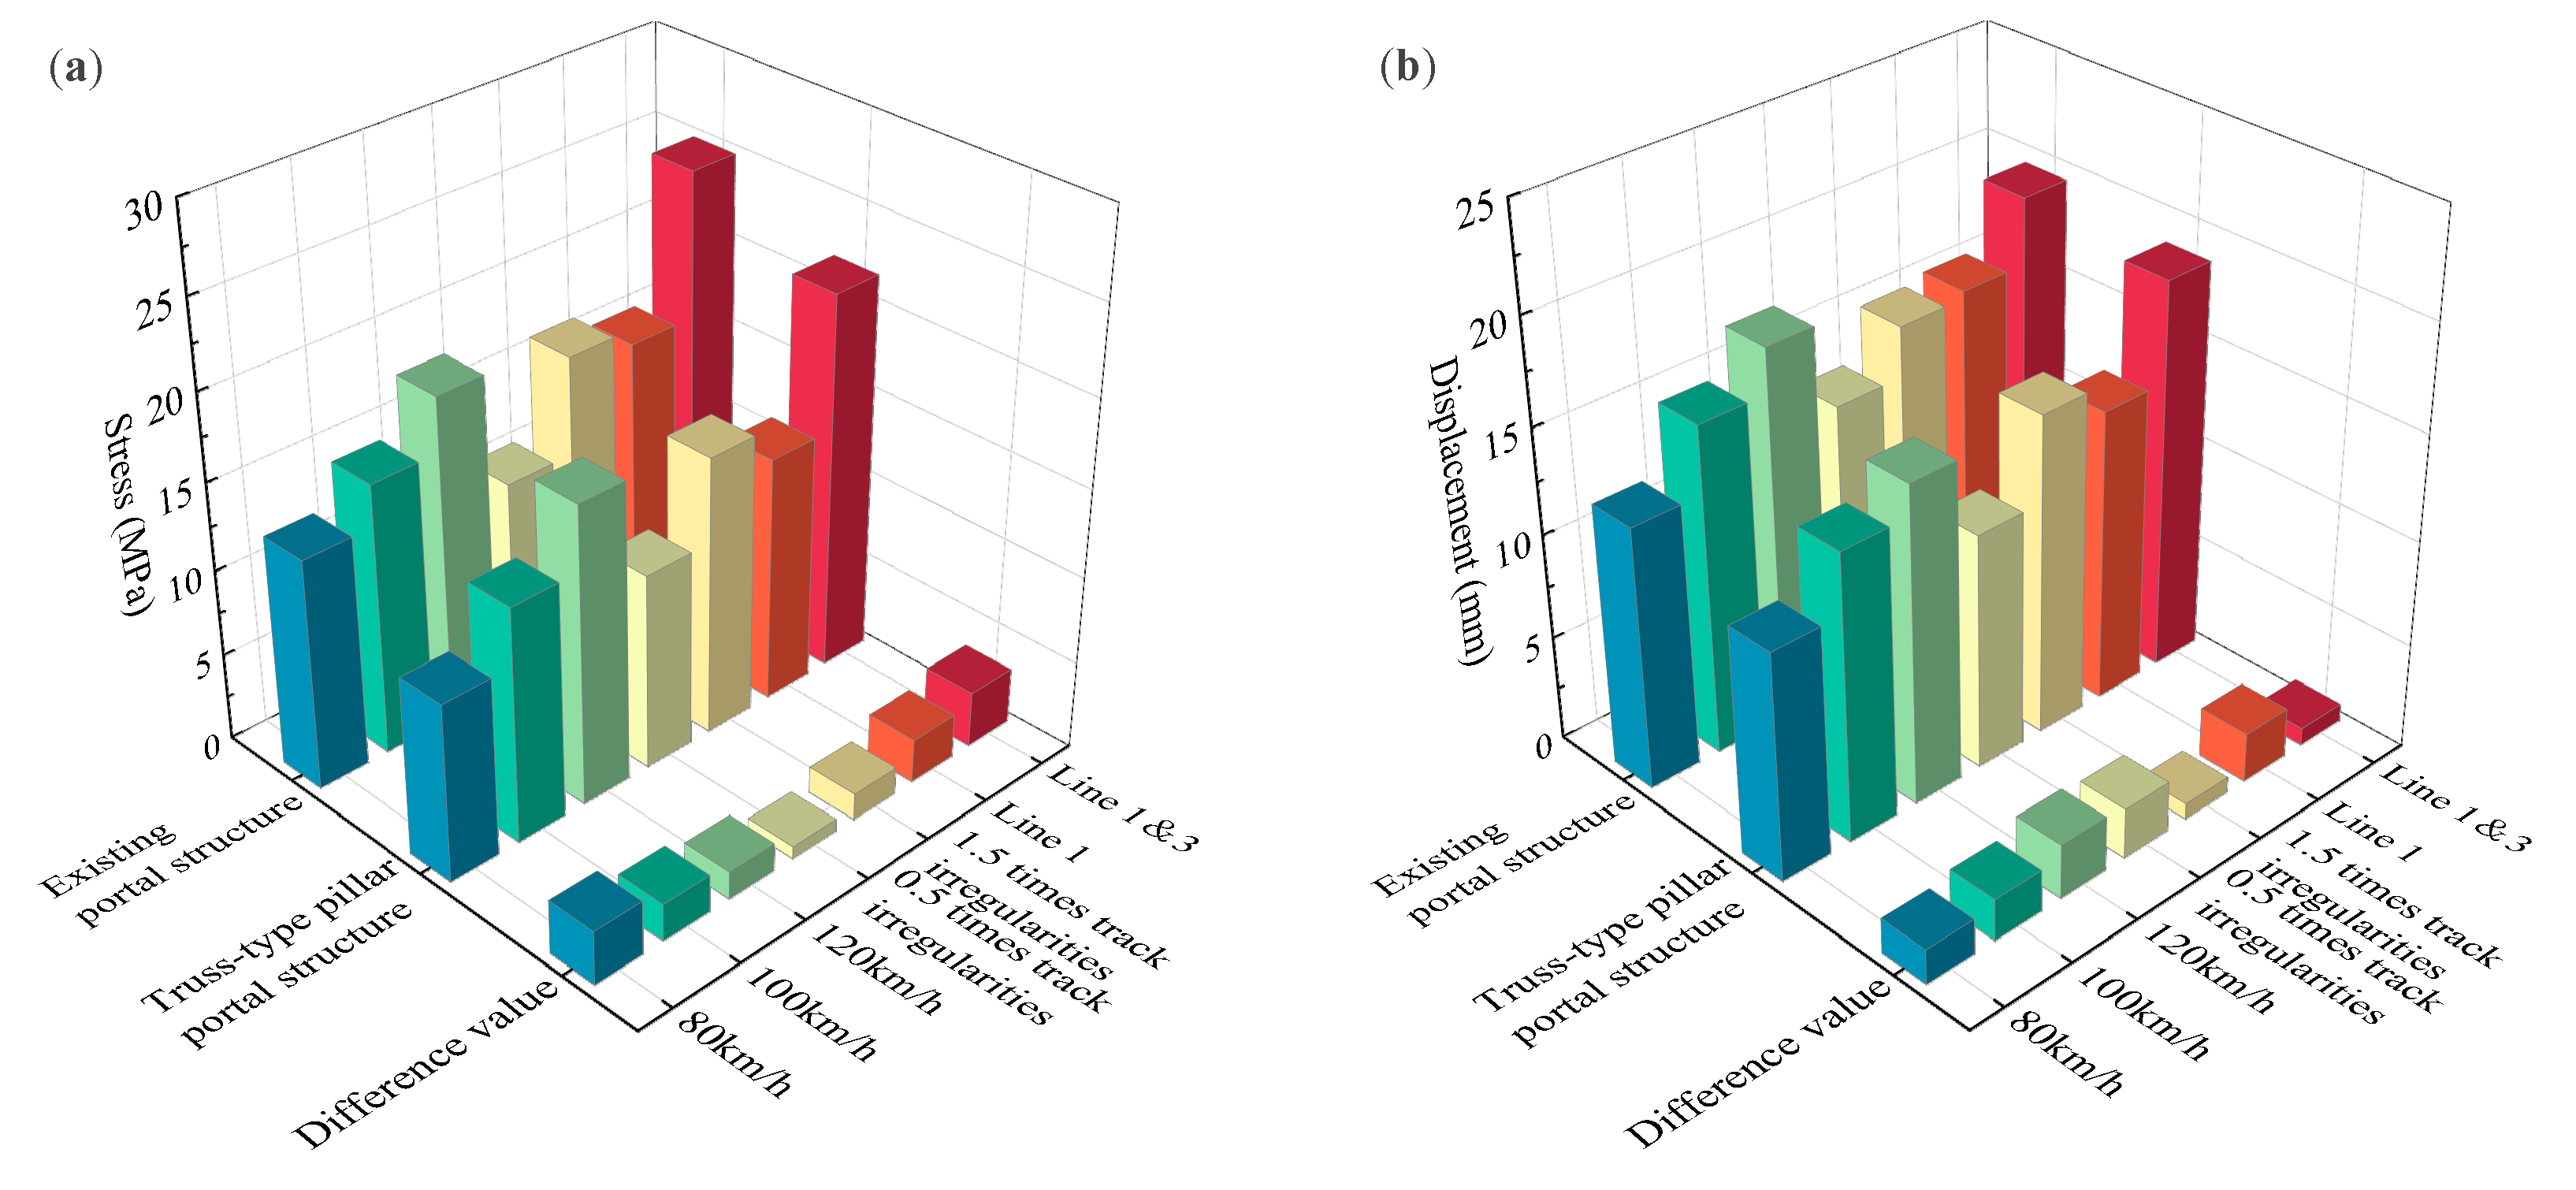
By comparing the displacement and stress dynamic response values of the truss-type pillar portal structure and the existing portal structure under various working conditions, the influence of the changes in the portal structure on the overall dynamic response of the structure was analyzed. Figure 17 provides the dynamic response extreme values of the two portal structures and the difference between them.
As shown in Figure 17, compared with the existing portal structure, the truss-type pillar portal structure has an average reduction of 15.76% in maximum displacement response values under different operating speeds. Especially when the speed reaches 120 km/h, the reduction in displacement response is most significant, up to 17.22%. Similarly, the maximum stress response values of the structure decreased by an average of 18.50%, with the highest reduction occurring at a speed of 80 km/h, reaching 30.22%. Under different operating conditions, the average reduction in maximum displacement response values is 13.14%, with a smaller average reduction in maximum stress response, only 7.85%. Under different track irregularity amplitudes, the average reduction in maximum displacement response is relatively small, at 10.71%, while the average reduction in maximum stress response values is 16.21%. Compared to changes in track irregularity amplitudes, the structure demonstrates better adaptability to higher vehicle speeds and more complex operating conditions.

6. Conclusions

This article takes the electrified elevated railway of a certain quadruple-track continuous beam on the Lanzhou–Chongqing line as the background. Based on establishing the dynamics simulation model of the vehicle–track system and the finite element simulation model of the bridge–catenary portal structure system, the track random irregularity time-domain samples are used as internal excitation for the vehicle–track coupled system. By solving the simulation, the dynamic response results of the vehicle–track coupled system are obtained. Subsequently, a finite element simulation analysis of the bridge–catenary portal structure system is conducted, and the dynamic response characteristics of the portal structure under various working conditions are obtained. The research results provide theoretical support for the construction of a portal structure between bridges and catenary systems in electrified railways and offer certain references for practical engineering design. The main work and conclusions of this study are as follows:
(1)
By using the SIMPACK dynamic analysis platform and the ANSYS finite element analysis platform, the dynamics models of the vehicle–track system and the finite element model of the bridge–catenary portal structure were, respectively, built. Based on the track irregularity power spectral density function, track irregularity samples were obtained to input driving excitation, and then the dynamic response characteristics of the vehicle–track coupled system were analyzed.
(2)
Based on the track irregularity time-domain samples, the dynamic response characteristics of trains under different operating speeds and different track irregularity amplitudes were analyzed. The results show that the lateral and vertical forces between the vehicle and the track are positively correlated with the speed and irregularity amplitude. Moreover, the vertical force is more sensitive to changes in train speed than the lateral force. Meanwhile, the response values of the derailment coefficient and wheel load reduction rate are within the specified range of relevant standards, validating the rationality of the model.
(3)
The low-order modes of the existing portal structure were analyzed, showing that the predominant vibration mode of the structure is longitudinal vibration, with fewer lateral and vertical vibration modes, which are secondary vibration forms. Additionally, torsional vibration modes do not exist in the low-order modes, indicating that the structure has a high torsional stiffness and can meet the requirements. The vibration characteristics of the catenary portal structure on the bridge were analyzed, obtaining displacement and stress response values under different conditions. The results indicate that, compared to the effects of train speed and irregularity amplitude, the increase in the complexity of operating conditions has a more significant impact on the dynamic response of the structure.
(4)
The low-order modes of the truss-type pillar portal structure were analyzed, and the results indicated that this structure has relatively high natural frequencies for low-order modes and good stability. The dynamic response of the truss-type pillar portal structure under different conditions was also analyzed, showing an average reduction of 15.76% and 18.50% in maximum displacement and stress, respectively, compared to the existing model. This structure demonstrates good adaptability to higher vehicle speeds and more complex operating conditions.

Author Contributions

Conceptualization, X.Z.; methodology and software, T.L.; writing—original draft preparation, T.L.; writing—review and editing, X.Z. All authors have read and agreed to the published version of the manuscript.

Funding

This research was funded by the National Natural Science Foundation of China (52367009) and the Natural Science Key Foundation of Science and Technology Department of Gansu Province (22JR5RA318, 21JR7RA280, 22JR11RA162).

Data Availability Statement

The data that support the findings of this study are available from the corresponding author upon reasonable request.

Conflicts of Interest

The authors declare no conflicts of interest.

References

  1. Jiang, Y.; Wu, P.; Zeng, J.; Wu, X.; Zhang, Y.; Yang, Z.; Gao, R.; Dai, X. Researches on the resonance of a new type of suspended monorail vehicle-bridge coupling system based on modal analysis and rigid-flexible coupling dynamics. Veh. Syst. Dyn. 2021, 59, 135–154. [Google Scholar] [CrossRef]
  2. Song, Y.; Wang, Z.; Liu, Z.; Wang, R. A spatial coupling model to study dynamic performance of pantograph-catenary with vehicle-track excitation. Mech. Syst. Signal Process. 2021, 151, 107336. [Google Scholar] [CrossRef]
  3. Liu, Z.; Song, Y.; Gao, S.; Wang, H. Review of Perspectives on Pantograph-Catenary Interaction Research for High-Speed Railways Operating at 400 km/h and above. IEEE Trans. Transp. Electrif. 2023; early access. [Google Scholar] [CrossRef]
  4. Song, Y.; Duan, F.; Liu, Z. Analysis of critical speed for high-speed railway pantograph-catenary system. IEEE Trans. Veh. Technol. 2021, 71, 3547–3555. [Google Scholar] [CrossRef]
  5. Song, Y.; Lu, X.; Yin, Y.; Liu, Y.; Liu, Z. Optimization of Railway Pantograph-Catenary Systems for over 350 km/h Based on an Experimentally Validated Model. IEEE Trans. Ind. Inform. 2024, 20, 7654–7664. [Google Scholar] [CrossRef]
  6. Ambrósio, J.; Pombo, J.; Pereira, M.; Antunes, P.; Mósca, A. A computational procedure for the dynamic analysis of the catenary-pantograph interaction in high-speed trains. J. Theor. Appl. Mech. 2012, 50, 681–699. [Google Scholar]
  7. Jin, Z.; Liu, W.; Pei, S. Probabilistic evaluation of railway vehicle’s safety on bridges under random earthquake and track irregularity excitations. Eng. Struct. 2022, 266, 114527. [Google Scholar] [CrossRef]
  8. Sun, K.; Nong, X.; Feng, Q.; Chen, H.; Xiao, J. Numerical analysis of interface damage in ballastless track on simply supported bridge due to thermal and vehicle dynamic load. Constr. Build. Mater. 2023, 366, 130181. [Google Scholar] [CrossRef]
  9. Nunia, B.; Rahman, T.; Choudhury, S.; Janardhan, P. Effect of vehicle speed and road surface roughness on the impact factor of simply supported bridges due to IRC Class A and B loading. SN Appl. Sci. 2020, 2, 3–19. [Google Scholar] [CrossRef]
  10. Auersch, L. The dynamic train–track interaction on a bridge and in a tunnel compared with the simultaneous vehicle, track and ground vibration measurements on a surface line. Appl. Sci. 2023, 13, 10992. [Google Scholar] [CrossRef]
  11. König, P.; Salcher, P.; Adam, C. An efficient model for the dynamic vehicle-track-bridge-soil interaction system. Eng. Struct. 2022, 253, 113769. [Google Scholar] [CrossRef]
  12. Gou, H.; Liu, C.; Zhou, W.; Bao, Y.; Pu, Q. Dynamic responses of a high-speed train passing a deformed bridge using a vehicle-track-bridge coupled model. Proc. Inst. Mech. Eng. 2021, 235, 463–477. [Google Scholar] [CrossRef]
  13. Cui, C.; Feng, F.; Meng, X.; Liu, X. Fatigue life assessment of intercity track viaduct based on vehicle–bridge coupled system. Mathematics 2022, 10, 1663. [Google Scholar] [CrossRef]
  14. Zhao, G.; Wang, M.; Liu, Y.; Zhang, M. Dynamic Response of Transmission Tower-Line Systems Due to Ground Vibration Caused by High-Speed Trains. Buildings 2023, 13, 2884. [Google Scholar] [CrossRef]
  15. Wu, J.; Cai, C.; Li, X.; Liu, D. Dynamic analysis of train and bridge in crosswinds based on a coupled wind-train-track-bridge model. Adv. Struct. Eng. 2023, 26, 904–919. [Google Scholar] [CrossRef]
  16. Zhang, M.; Li, Y.; Wang, B. Effects of fundamental factors on coupled vibration of wind-rail vehicle-bridge system for long-span cable-stayed bridge. J. Cent. South Univ. 2016, 23, 1264–1272. [Google Scholar] [CrossRef]
  17. Lei, X.; Wang, H. Dynamic analysis of the high speed train–track spatial nonlinear coupling system under track irregularity excitation. Int. J. Struct. Stab. Dyn. 2023, 23, 25–29. [Google Scholar] [CrossRef]
  18. Singh, A. Dynamic modeling and ride comfort evaluation of railway vehicle under random track irregularities: A case study of a Linke-Hofmann-Busch coach. J. Eng. Res. 2023, 4, 77–81. [Google Scholar]
  19. Xu, L.; Zhai, W. Stochastic analysis model for vehicle-track coupled systems subject to earthquakes and track random irregularities. J. Sound Vib. 2017, 40, 209–215. [Google Scholar] [CrossRef]
  20. Xu, L.; Zhai, W.; Gao, J. A probabilistic model for track random irregularities in vehicle/track coupled dynamics. Appl. Math. Model. 2017, 51, 145–158. [Google Scholar] [CrossRef]
  21. Zhang, K.; Yang, J.; Liu, C.; Wang, J.; Yao, D. Dynamic Characteristics of a Traction Drive System in High-Speed Train Based on Electromechanical Coupling Modeling under Variable Conditions. Energies 2022, 15, 1202. [Google Scholar] [CrossRef]
  22. Kisilowski, J.; Kowalik, R. Mechanical Wear Contact between the Wheel and Rail on a Turnout with Variable Stiffness. Energies 2021, 14, 7520. [Google Scholar] [CrossRef]
  23. Yang, Y.; He, Q.; Cai, C.; Zhu, S.; Zhai, W. A novel 3D train–bridge interaction model for monorail system considering nonlinear wheel-track slipping behavior. Nonlinear Dyn. 2024, 112, 3265–3301. [Google Scholar] [CrossRef]
  24. Xu, L.; Zhai, W.; Gao, J. Extended applications of track irregularity probabilistic model and vehicle–slab track coupled model on dynamics of railway systems. Veh. Syst. Dyn. 2017, 55, 1686–1706. [Google Scholar] [CrossRef]
  25. Heleno, R.; Montenegro, P.A.; Carvalho, H.; Ribeiro, D.; Calcada, R.; Baker, C.J. Influence of the railway vehicle properties in the running safety against crosswinds. J. Wind Eng. Ind. Aerodyn. 2021, 217, 104732. [Google Scholar] [CrossRef]
  26. Gao, M.; Xu, X.; He, R.; Chen, Q.; Li, D. Vibration of subgrade and evaluation of derailment coefficient of train under combined earthquake-moving train load. Soils Found. 2021, 61, 386–400. [Google Scholar] [CrossRef]
  27. Liu, Y.; Sun, J.; Li, W.; Peng, Q.; Zhang, Q. Dynamic Response of Flexible Wheelset High-speed Train Passing through Turnout. J. Qingdao Univ. (Nat. Sci. Ed.) 2024, 37, 69–78. [Google Scholar]
  28. Najm, H.M.; Ibrahim, A.M.; Sabri, M.M.; Hassan, A.; Morkhade, S.; Mashaan, N.S.; Eldirderi, M.M.A.; Khedher, K.M. Modelling of Cyclic Load Behaviour of Smart Composite Steel-Concrete Shear Wall Using Finite Element Analysis. Buildings 2022, 12, 850. [Google Scholar] [CrossRef]
  29. Wang, S.; Li, X. Vibration Characteristics Analysis and Structure Optimization of Catenary Portal Structure on Four-Wire Bridge. Struct. Durab. Health Monit. 2022, 16, 361–382. [Google Scholar] [CrossRef]
Figure 1. Bridge–portal structure parameters: (a) main view and (b) side view.
Energies 17 02510 g001
Figure 2. Bridge–portal structure simulation model.
Energies 17 02510 g002
Figure 3. Vehicle–track spatial coupling model: (a) main view, (b) side view, and (c) top view.
Energies 17 02510 g003
Figure 4. Vehicle–track simulation model.
Energies 17 02510 g004
Figure 5. Track irregularities’ time-domain samples: (a) vertical track irregularities and (b) lateral track irregularities.
Energies 17 02510 g005
Figure 6. (a) Left rail vertical force. (b) Right rail vertical force. (c) Left rail lateral force. (d) Right rail lateral force. (e) Derailment coefficient. (f) Wheel load reduction rate.
Energies 17 02510 g006
Figure 7. (a) Left rail vertical force. (b) Right rail vertical force. (c) Left rail lateral force. (d) Right rail lateral force. (e) Derailment coefficient. (f) Wheel load reduction rate.
Energies 17 02510 g007
Figure 8. The first six mode shapes of existing portal structure: (a) first mode, (b) second mode, (c) third mode, (d) fourth mode, (e) fifth mode, and (f) sixth mode.
Energies 17 02510 g008
Figure 9. Example illustration of train load application.
Energies 17 02510 g009
Figure 10. (a) Displacement response of 80 km/h. (b) Stress response of 80 km/h. (c) Displacement response of 100 km/h. (d) Stress response of 100 km/h. (e) Displacement response of 120 km/h. (f) Stress response of 120 km/h.
Energies 17 02510 g010aEnergies 17 02510 g010b
Figure 11. (a) Displacement response of Line 1. (b) Stress response of Line 1. (c) Displacement response of Lines 1 and 3. (d) Stress response of Lines 1 and 3.
Energies 17 02510 g011
Figure 12. (a) Displacement response of 0.5 times track irregularities. (b) Stress response of 0.5 times track irregularities. (c) Displacement response of 1.5 times track irregularities. (d) Stress response of 1.5 times track irregularities.
Energies 17 02510 g012
Figure 13. The first six mode shapes of truss-type pillar portal structure: (a) first mode, (b) second mode, (c) third mode, (d) fourth mode, (e) fifth mode, and (f) sixth mode.
Energies 17 02510 g013
Figure 14. (a) Displacement response of 80 km/h. (b) Stress response of 80 km/h. (c) Displacement response of 100 km/h. (d) Stress response of 100 km/h. (e) Displacement response of 120 km/h. (f) Stress response of 120 km/h.
Energies 17 02510 g014
Figure 15. (a) Displacement response of Line 1. (b) Stress response of Line 1. (c) Displacement response of Lines 1 and 3. (d) Stress response of Lines 1 and 3.
Energies 17 02510 g015
Figure 16. (a) Displacement response of 0.5 times track irregularities. (b) Stress response of 0.5 times track irregularities. (c) Displacement response of 1.5 times track irregularities. (d) Stress response of 1.5 times track irregularities.
Energies 17 02510 g016
Figure 17. Comparative analysis of dynamic responses between two portal structures: (a) displacement response and (b) stress response.
Energies 17 02510 g017
Table 1. Material parameter settings.
NumberMaterialYoung’s Modulus
/MPa
Poisson’s RatioDensity
/kg·m−3
Bulk Modulus
/MPa
Shear Modulus
/MPa
1Concrete 503.45 × 1040.2025001.92 × 1041.44 × 104
2Q345 steel2.06 × 1050.2878501.56 × 1050.80 × 105
345Mn steel2.10 × 1050.2778501.72 × 1050.79 × 105
4DN3501.77 × 1050.3078501.48 × 1050.68 × 105
Table 2. Degrees of freedom of the vehicle model.
StructureForms of Motion
LongitudinalLateralBounceRollPitchYaw
Car bodyxcyczcφcβcψc
Bogie framextytztφtβtψt
Wheelsetxwywzwφwβwψw
Table 3. Comparison of vehicle–track response results.
Response
Values
Left Rail
Vertical
Force (kN)
Right Rail
Vertical
Force (kN)
Left Rail
Lateral
Force (kN)
Right Rail
Lateral
Force (kN)
Derailment
Coefficient
Wheel Load
Reduction Rate
Simulation63.8362.671.711.790.0230.068
Reference [27]69.0969.071.881.630.0270.07
Relative error7.61%9.27%9.04%9.82%14.81%2.86%
Table 4. The resonant frequencies of existing portal structure.
Mode123456
f (Hz)1.27421.97452.24323.86974.02065.4278
T (s)0.78480.50650.44580.25840.24870.1842
Table 5. The resonant frequencies of truss-type pillar portal structure.
Response ValuesMaximum Displacement (mm)Maximum Stress (MPa)
Simulation19.49424.889
Reference [29]21.0824.24
Relative error7.52%2.68%
Table 6. The resonant frequencies of truss-type pillar portal structure.
Mode123456
f (Hz)1.70563.10064.27994.45875.17255.2404
T (s)0.58630.32250.23370.22430.19330.1908
Disclaimer/Publisher’s Note: The statements, opinions and data contained in all publications are solely those of the individual author(s) and contributor(s) and not of MDPI and/or the editor(s). MDPI and/or the editor(s) disclaim responsibility for any injury to people or property resulting from any ideas, methods, instructions or products referred to in the content.