1. Introduction
The integration of distributed energy resources (DERs)—including photovoltaic panels (PVs), small-scale wind turbines, batteries for energy storage, and biomass generators—into electricity distribution networks is important for advancing renewable energy adoption and enhancing grid resilience. Positioned close to the consumption points, these resources offer significant economic and environmental benefits, particularly PVs, known for their efficiency and sustainability advantages [
1]. Despite the potential, the intermittent nature of DERs poses unique challenges to energy system operators, such as managing the unpredictability of energy output influenced by weather conditions for solar generation [
2]. This variability can lead to faster frequency deviations, risking statutory frequency limits and introducing operational complexities, thereby necessitating advanced coordination and real-time data visibility [
3]. Furthermore, the integration of DERs into distribution networks prompts a re-evaluation of grid measures to accommodate the nuances introduced by these technologies [
1].
In response to these challenges, the adoption of Digital Twin (DT) technology presents a promising solution to enhance the visibility and manageability of physical systems within the energy domain [
4]. DT technology enables the testing, optimization, and validation of design and control decisions in a virtual space before implementation in the real world, aiming to improve economic outcomes in DER management [
5].
The literature on DTs for DERs has been employed for optimizing forecasting, simulating, monitoring, and diagnosing faults in DERs such as solar photovoltaics, batteries, and electric vehicles (EVs). However, existing applications often focus on individual DER components which indicates a significant need for more holistic approaches that can seamlessly integrate various DERs. Furthermore, the literature reveals a substantial gap in scalability—a crucial aspect for accommodating the diversity and distribution of DERs across the grid.
This paper proposes a novel DT framework designed to simulate heterogeneous systems in the energy domain, utilizing an agent-based simulation (ABS) methodology. This approach defines the agents and their interactions based on an ecosystem mapping of actors, objects, roles, and relations within the system, allowing for a detailed and dynamic representation of DER operations and their impacts on distribution grids.
The core aim of this framework is to investigate and analyze emergent patterns in grid operation and management as DER adoption increases among residential consumers. Specifically, the study examines the potential for electric vehicles and rooftop PV installations to induce overloads in distribution grids and explores how stationary residential batteries might mitigate these challenges [
6]. This analysis is critical for distribution system operators (DSOs) in planning grid reinforcements and for policymakers in assessing the implications of energy policies on grid stability and sustainability.
The proposed framework is distinct in its design to seamlessly integrate various DER components, facilitating a comprehensive management approach that transcends the limitations of individual DER focus. By leveraging scalable modules, the framework is adept at processing and integrating a diverse range of DERs across the grid, ensuring adaptability and responsiveness to the dynamic nature of energy systems. This integrated and scalable approach marks a significant leap forward in DT technology for energy system management.
The paper is structured as follows: The Literature Review section reviews current research on selected DER technologies and their digital twinning. The Material and Methods section presents a summary of the methodology and tools used for developing the framework, while the Digital Twin Framework Design and Implementation section presents the developed framework, DERInGrid, itself. The Scenarios and Case Studies section presents a set of simulation scenarios and case study systems that have been applied to test and demonstrate the framework. Example outputs from these scenarios are presented and discussed in the Results section, and the performance and evaluation of the framework are discussed in the Framework Discussion section. The Conclusion section concludes the paper.
2. Literature Review—Digital Twins of Distributed Energy Resources
This section introduces the literature on DT development for three types of DERs: PV, EVs, and batteries, especially how DTs are utilized for simulating, monitoring, analyzing, and optimizing solar PVs, EVs, and batteries.
2.1. Digital Twin of Solar Photovoltaics
The DT for solar PVs is essential for optimizing, forecasting, simulating, monitoring, and diagnosing faults. By integrating real-time and forecasted weather data, DT enhances the accuracy of predicting the output of both physical and virtual PV plants [
7,
8]. Leveraging historical information, the DT replicates behavior through simulation and optimizes PV system performance [
9], improving the accuracy of distributed photovoltaic (D-PV) power generation [
10]. Furthermore, the DT serves as a robust tool for monitoring and analyzing PV performance, facilitating effective fault diagnosis. For instance, DTs incorporating Spread Spectrum Time Domain Reflectometry (SSTDR) enable the detection and diagnosis of faults in PV systems [
11]. Additionally, DTs monitor anomalies and compare expected versus actual PV panel behavior within an IoT system, not only detecting faults but also pinpointing the exact position of faults within PV systems [
12,
13]. Moreover, the DTs simulate the PV power output and ensure the normal operation of the system, contributing to comprehensive fault detection and optimization strategies [
14].
Studies and methodologies highlight the effectiveness and advancements in PV systems. These include the contribution of DTs to the significant advancements in fault detection and identification with a remarkable accuracy rate of 98.55% [
13]. Studies also highlight the integration of DT technology with advanced methodologies for fault diagnosis [
15] and for predicting PV power output [
16]. Furthermore, coordination control strategies utilizing DT frameworks have been instrumental in enhancing the hosting capacity of the grid [
17] and optimizing the performance of distributed PV power generation clusters [
18]. Moreover, leveraging DTs alongside machine learning algorithms results in notable improvements in the efficiency and performance of solar PV plants [
19], bridging the gap between conventional models and real-world PV systems [
20]. DT-enabled frameworks also facilitate real-time estimations and short-term forecasts of PV power production [
8], offering accurate insights into PV panel anomalies [
12]. The benefits of interoperable geographical urban DTs are emphasized [
21], as well as the effectiveness of DT technology in enhancing understanding of vertical PV system performance [
22]. Additionally, real-time temperature estimates provided by DTs contribute to the optimization of PV system performance [
23] and, in addition, the capability to restore PV power–voltage characteristics under various conditions [
24]. DTs can also optimize D-PV power generation clusters [
18] and incorporate hybrid neural networks to enhance PV panel performance in real-world applications [
24]. In summary, the DT accurate modeling of physical objects like PV arrays in virtual environments can bridge the gap between simulation and real-world conditions.
2.2. Digital Twin of Batteries
DT technology, serving as a virtual representation of a physical lithium ion battery (LIB), can play a crucial role in battery production operations [
25], engine-based power plants [
26], and battery energy storage systems (BESSs) [
27], showcasing its versatility and applicability in diverse industrial contexts. For instance, DT technology is used to optimize real-time disassembly strategies for end-of-life LIBs [
28], production and value chain efficiency [
29], and management systems [
30]. DTs have also been employed to predict future battery behavior [
31], the partial discharge voltage curve [
32], the maximum available capacity of LIBs in EVs [
33], the remaining useful cycle life [
34], and the capacity decay and safety hazards in LIBs [
35]. Additionally, DTs allow for real-time analysis and testing of LIB characteristics, offering a versatile approach to testing different configurations and control strategies without physical prototypes [
36]. Moreover, DT models electrode structures at a microscopic level [
37] and simulates battery behavior with AI [
38,
39]. It can also be applied to simulate lithium–air battery electrodes under varying electrolyte saturations [
40], simulate mesostructures of electrodes [
41], and model thermal behaviors [
42]. DTs are also used to monitor the components in fission battery systems [
43] and provide real-time predictive monitoring of battery brackets in new energy commercial vehicles [
44].
The literature reveals that DT technology offers a promising solution for reducing energy consumption and predicting battery performance and behavior under different conditions with results validating its high prediction accuracy of 95% in real-world scenarios [
33] and is also applicable for predicting battery health [
45]. Moreover, Dual Digital Twin technology significantly enhances real-time monitoring and control for EV batteries [
46,
47], while the hybrid DT model achieves a remarkable 68.42% reduction in battery capacity error [
48]. Meanwhile, DT technology predicts structural performance [
44] and challenges related to the degradation of LIBs and proper charging patterns, thereby enhancing battery performance and lifespan [
32]. DTs offer solutions like fast algorithm development [
49], enhancing cathode performance in LIBs [
50], and efficient testing of high-voltage power supplies [
51]. Integrating DTs into battery manufacturing improves process efficiency and quality, offering benefits like increased productivity and enhanced sustainability [
52,
53,
54]. The integration of DT technology with battery systems also offers benefits for the energy sector, such as reducing design time, enhancing flexibility, and improving disassembly process efficiency [
28,
55]. Finally, DT technology enhances efficiency in microgrid design [
56], optimizes Second-life Battery Storage Systems (SBSS) [
36], and improves transportation electrification [
57].
2.3. Digital Twin of Electric Vehicles
DT technology is crucial in addressing challenges faced by EVs. For instance, the literature highlights the effectiveness of DTs [
58] in EV propulsion units [
59], accurately estimating SoC [
60] and analyzing heavy-duty vehicle aerodynamics and powertrain configurations [
61], accurately modelling vehicle behavior during driving cycles [
62], optimizing charging schedules and forecasting energy demand under various scenarios [
63]. Moreover, the DT is significant in addressing various challenges in the EV, including health monitoring, predictive maintenance, and optimization of energy consumption [
64] and charging behavior [
65]. Studies highlight the effectiveness of DT models and advanced algorithms [
66], ensuring high prediction accuracy [
67] and shaping a data-driven automotive industry [
68]. Utilizing DTs addresses challenges, like enhancing the management of specific EV components (e.g., air conditioning [
69] and battery [
70]). Additionally, the DT enhances battery efficiency and management while reducing degradation and enhancing energy efficiency [
71]. Studies also demonstrate effectiveness in addressing critical battery system issues [
72] and contribute to enhancing EV technology for sustainability [
73]. Moreover, Fuel Cell Hybrid Electric Vehicles (FCHEVs) have the potential to significantly contribute to decarbonization efforts [
62] and offer a promising solution to mitigate environmental impact in the automotive sector [
74].
DT technology is also used in battery systems for monitoring and analyzing to improve propulsion drive systems [
68], for predicting usable battery life [
75], and for enabling intelligent management and autonomous control of battery packs [
72]. Additionally, DT technology enhances vehicle lifespan, performance, and maintenance through diagnostic and prognostic algorithms [
64] while also facilitating flexible resource coordination scheduling [
65].
2.4. Research Gaps in Digital Twins for Distributed Energy Resources
The literature review comprehensively covers the advancements and applications of DTs across three critical components of DERs: solar PVs, batteries, and EVs. It elaborates on how DTs have been employed for optimizing forecasting, simulating, monitoring, and diagnosing faults in these DERs. For solar PVs, the integration of real-time and forecasted weather data into DTs enhances the prediction accuracy for the output of both physical and virtual PV plants. For batteries, DTs serve as crucial tools for performance monitoring, predictive maintenance, and optimization. Regarding EVs, DT technology fosters sustainability and efficiency through simulation, monitoring, analysis, optimization, and predictive maintenance.
Despite the extensive work and progress in DTs for DERs, two significant research gaps are identified and addressed in this paper:
Integration and Interoperability: While there are DTs for individual components of DERs (solar PVs, batteries, EVs), the literature indicates a need for more integrated approaches. This paper focuses on a DT framework development that seamlessly integrates various DERs, facilitating holistic distributed energy systems management.
Scalability: The literature points out advancements in DTs for specific DERs, but there is less emphasis on scalability. The DT framework proposed in this paper consists of scalable modules that efficiently process and integrate diverse DERs distributed across the grid.
3. Material and Methods
This section covers the overall methodology and tools that have been applied to develop the proposed simulation framework (named DERInGrid).
3.1. Agent-Based Simulation
This section gives a brief introduction to the concept of ABS and the simulation development software which are employed in the developed simulation framework.
Instead of monolithically simulating a system that might consist of numerous actors with heterogeneous and highly complex behaviors, ABS uses a bottom-up approach and instead simulates a system as a collection of distinct agents with individual behaviors and characteristics. The behaviors and patterns that emerge in the overall system due to the actions and interactions between the individual agents are then observed. This approach is relatively intuitive, as it facilitates the translation of real-world actors into simulation agent counterparts, making it clear which parts of the simulation represent specific parts of the real system.
Identification of phenomena or behavioral aspects that emerge in the overall system but cannot be associated with individual agents or parts that comprise the system is an important aspect of the ABS methodology. Furthermore, the ABS methodology is well suited to simulating non-deterministic systems with actors that have limited knowledge of the environment and other actors and objects in the system. According to [
76], an agent in ABS is characterized by the following attributes:
Self-containment—an agent is defined as an identifiable individual with clear boundaries.
Autonomy—an agent can act independently according to a set of internal rules that defines its logic and decisions. The agent responds to information received through interactions with other agents according to this logic.
State—an agent has a set of attributes which define its current condition. The values of these attributes, and hence the state of the agent, vary over time.
Sociability—an agent can interact and exchange information with other agents and perceive and recognize certain properties of these agents. Agents are typically part of a topology of relations that defines which agents interact with each other, and this topology might change dynamically over time.
Agents might be situated in a spatial environment and hence possess a geographical attribute as part of their states. Furthermore, depending on their logic, agents might act to achieve certain goals, adapt, and develop over time and assume certain traits of intelligence. These characteristics are, however, not part of the core characteristics that define agents in ABS. Agents are defined as types, with a simulation potentially comprising multiple agents of the same type. These agents behave according to shared logic but differ in parameters, states, and relations to other agents in the system.
There is no requirement for the complexity of an agent, nor are there any requirements for its scope and tangibility. The definition is flexible and allows for a wide range of entities, from individuals to abstract concepts or information. This flexibility constitutes a key challenge which lies in determining the appropriate abstraction level; too few details might cause an insufficient representation of the system with missing key factors, while a too-detailed model might cause excess complexity and too many constraints [
77].
The software chosen for developing the simulation framework is the university version of the AnyLogic platform (version 8.8.3) [
78], as it meets the required criteria. AnyLogic is a versatile ABS platform that is not specialized for any specific sciences or system domains. It integrates elements from event-driven and system dynamics modeling methodologies. Furthermore, the platform supports spatial simulation of agents in a GIS setting, a feature that is necessary to represent the grid topology in a simulation model of the electricity distribution grid. Finally, AnyLogic provides a convenient graphical user interface and visualization during simulation runtime to allow visual inspection of agents and their contents during simulation runtime. AnyLogic is based on Java and is commercially available along with a free limited version.
In choosing an agent-based modeling tool, it should be noted that there is no one-fits-all tool. Each tool has specific advantages and disadvantages that cover special purposes, domains or scalability levels [
79]. Alternative available tools, possibly ones listed in [
79,
80], might be well suited for the same modeling problem and could possibly have been employed instead with a similar research outcome.
3.2. Ecosystem Approach
For this paper, the agents have been determined systematically by using the business ecosystem mapping approach presented in [
81] and applied in the preliminary work [
82]. This means that before any ABS is conducted, all actors, objects, roles, and relations that are part of the system to be simulated must be identified and mapped as prescribed in [
81].
An important aspect relating to the ecosystem is that all relations between actors and objects are based on the roles they assume and not on the actors or objects themselves. The roles, therefore, represent how actors and objects are perceived by other actors and objects in the system and which responsibilities they fulfil in the system. An actor or object can assume multiple roles, and a particular role can be assumed by multiple actors or objects. The advantage of the business ecosystem mapping methodology, and the reason for its use in this thesis, is that it takes a similar approach by clearly identifying and delimiting actors and objects in the ecosystem and then identifying the interactions that commence between them based on their roles. This allows a mapped ecosystem to be converted directly into an agent-based framework. This conversion of the respective ecosystem elements is presented in
Table 1.
The interface concept from object-oriented programming is used to represent roles from the ecosystem in the framework. The methods of the interfaces represent the ways the implemented agent can be contacted by other agents to perform interactions, based on the interaction identified in the ecosystem mapping. The bodies of these methods are implemented by the agent types, and hence each agent type can respond differently to a request using the same method. Only the types and format of input information that must be provided and the format of the information that is returned are therefore visible to other agents. Agents are unable to access and affect other agents unless these interactions are performed through the roles of the agents. This approach reflects the fact that actors in the real world typically possess little knowledge of other actors’ roles except the ones that are relevant to them.
Usually, interfaces for different roles feature methods with identical signatures, i.e., name and input argument types of the method and purposes, because there are some commonalities between their role counterparts. Hence, the interfaces share some functionalities that can be covered by one or more common super-interface framework interfaces. For instance, EVs and batteries can both act as electric loads, and a common framework interface that captures this commonality can be employed. Framework interfaces provide the following advantages, proposed by [
82]:
Simplification: Duplicates of the same method across multiple roles and within the same role, the latter to allow access from multiple different interfaces, can be reduced to one item.
Reusability: Framework role interfaces represent generalized roles in the domain of which the energy ecosystem is a part. These interfaces can be applied to roles with the same properties across different ecosystems and simulation models.
Standardization of concepts: Using the same framework role interface for all roles that perform a certain task or service ensures that this service remains consistent across all domain interfaces that provide it and all ecosystems where it appears.
Note that the number of interfaces, particularly framework interfaces defined for the simulation, is too extensive to present in this paper. Furthermore, the methodology itself is of importance, while the specific interfaces are case-specific and might be different for other domains and systems.
For the creation of actors in the simulation framework, actors/objects from the energy ecosystem are defined as agent types in the simulation framework in a one-to-one manner. Each agent type can then implement domain interfaces according to the roles in the ecosystem mapping; along with the framework interfaces, the domain interfaces extend.
4. Digital Twin Framework Design and Implementation
The developed DERInGrid simulation framework consists of four modules as shown in
Figure 1: Distributed Energy Resource, Electricity Distribution Grid, Electricity Consumer, and Energy Management System. Each module consists of a number of agent types that are related to each other in the electricity domain. Overall, there are twelve agents in the framework:
The Distributed Energy Resource module consists of three agents:
- ○
Electric Vehicle
- ○
Roof Photovoltaics
- ○
Stationary Battery
The Electricity Distribution Grid module consists of five agents:
- ○
Distribution Grid
- ○
Transformer
- ○
Cable Box
- ○
Consumer Connection Point
- ○
Cable
The Energy Management System module consists of two agents:
- ○
Energy Management System
- ○
Control Strategy
The Electricity Consumer module consists of two agents:
- ○
Residential Consumer
- ○
Base Appliances
Furthermore, agents communicate with each other internally in the modules. The modules are designed to be operated independently and interact with each other with clearly defined and delimited relations. The overall designs of the individual modules are summarized in the following subsections.
4.1. Digital Twin Element—Distributed Energy Resource
The Distributed Energy Resource module contains agents that represent DER technologies along with the equipment required to connect them to the electricity system, e.g., inverters.
4.1.1. Agent Types
This module includes the agent types:
Electric Vehicle—refers to a pair of agent types: one for the Electric Vehicle, offering transportation using electric energy for propulsion and a battery for electricity storage, and one for the Charging Box that connects the vehicle to the electricity grid and charges it.
Roof Photovoltaics—refers to a pair of agent types: one for the Roof Photovoltaic equipment, consisting of multiple cells that convert solar energy into electricity, and one for the Inverter that connects the PVs to the grid and inverts the generated power from direct current to alternating current.
Stationary Battery—refers to a pair of agent types: one for the Stationary Battery, consisting of one or more battery cells that can store electric energy to be used later, and one for the Inverter that connects the battery to the grid and inverts the exchanged power between direct current and alternating current.
4.1.2. Electric Vehicle Agent Logic
EVs are represented by the Electric Vehicle agent type, and the complementary appliance, the EV charging box, is represented by the EV Charging Box agent type.
The Electric Vehicle agent type performs the actions driving and charging. Furthermore, it contains variables that represent the amount of energy the battery currently contains and its SoC. For driving, an Electric Vehicle agent receives a schedule of driving trips from the owner, which consists of sets of departure and arrival date times and corresponding driving distances.
At all times, an Electric Vehicle agent is in one of the four states presented in the statechart in
Figure 2, and the following list summarizes the logic that the Electric Vehicle can perform:
Idle: fully charged and not connected to an EV Charging Box agent.
Driving: moves into this state from any other state if the next departure date scheduled by the user agent has been reached (transitions labelled 1). Waits in this state until the scheduled arrival date time of the trip arises, then moves through the transition labelled 2. Upon doing so, the amount of energy spent for the trip, based on mileage and trip distance, is subtracted from the battery. It then sends a request to the owning Residential Consumer agent to connect to an EV Charging Box agent. It then moves to the Connected_to_charger state for charging.
Connected_to_charger: connected to an EV Charging Box agent. Charging does not commence but can be activated through the transition labelled 3 when receiving a signal from the charging box (the reverse is also possible).
Charging: the battery SoC gradually increases according to the charging rate signal previously received from the connected EV Charging Box; power is drawn from the charging box as a load. If fully charged, the vehicle disconnects and moves through the transition labelled 4.
4.1.3. Photovoltaic System Agent Logic
The PV system, comprising the PV equipment and a complementary inverter, is represented in the model by the Roof Photovoltaic and Standard Inverter agent types, respectively. The agents represent an assembly of PV cells which operate as a single unit. For the cells, uniform solar radiation, orientation, and azimuth angle are assumed, along with the absence of damage or dirt on the cells.
A Roof Photovoltaic agent generates DC power and must be connected to an agent that can act as an electricity converter (through its interface) before it can deliver electricity to the AC electricity system. The Roof Photovoltaic agent has a peak production capacity, measured in kWp, which represents the production when the solar radiance on the agent is 1000 W/m
2. The actual electricity generation from the agent scales proportionally with the received solar irradiance and is calculated by Equation (1), where
Qsolar denotes the solar irradiance (received from the Utility module),
εPV denotes the conversion efficiency of the PV cells,
NPVUnit denotes the number of PV cells that make up the panel, and
APVUnit denotes the area of the individual PV cells.
For the PV dimensioning, upon adoption of a Roof Photovoltaic agent, the Residential Consumer first chooses a random model type for the PV among the ones available. After this choice has been made, the available Standard Inverter agent with the lowest power rating for the PV connection side, which is at least equal to the peak generation rate of the Roof Photovoltaic agent, is selected. Then, the number of cells NPVUnit is determined to cover a certain share of the available roof area of the building inhabited by the Residential Consumer agent.
4.1.4. Battery Agent Logic
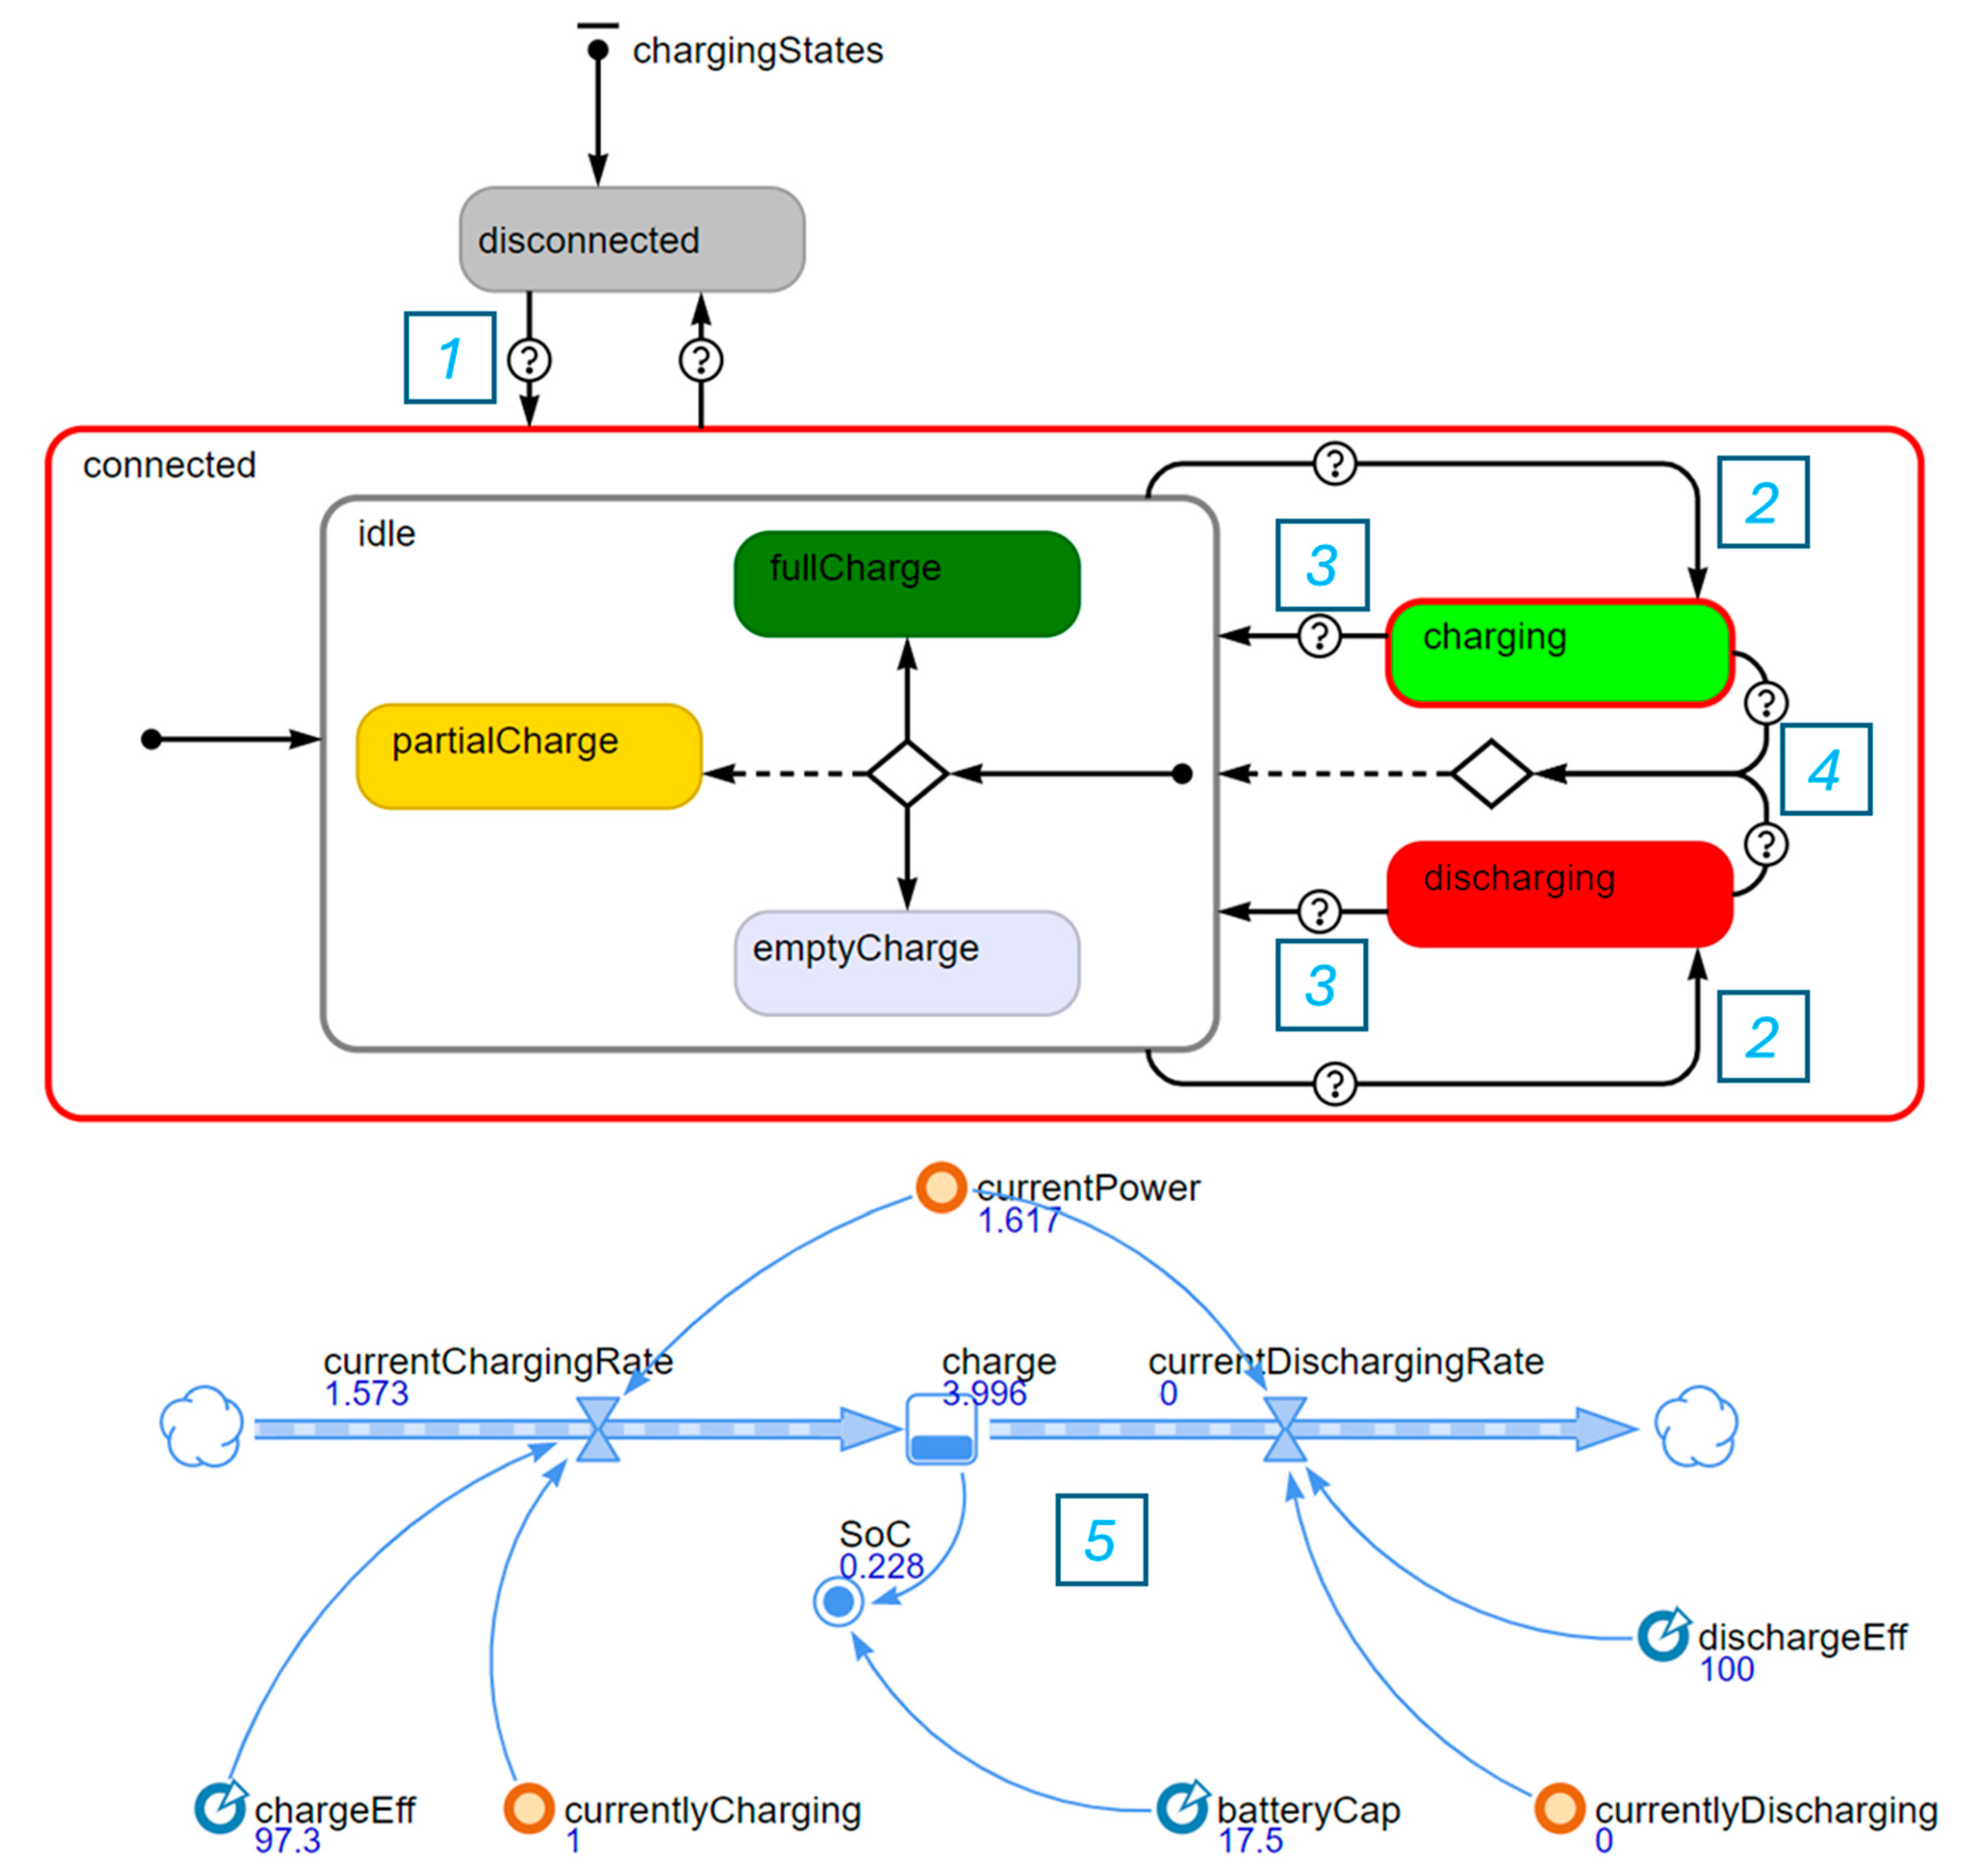
The residential storage battery system is constituted of a battery and a complementary hybrid inverter, represented by the Residential Battery and Hybrid Inverter agent types, respectively. The logic of the Residential Battery agent type is as follows and is based on the statechart and elements in
Figure 3:
Before a Residential Battery agent is able to operate, it must, similar to other DER agents, be connected to a Hybrid Converter agent that acts as an electricity AC/DC converter. When this is fulfilled, the state of the Residential Battery agent moves from
disconnected (labelled
1 in
Figure 3) to
connected.
As the operation of a Residential Battery agent is decided by a controller agent, it does not, by itself, decide when to charge and discharge. However, the battery will stop charging if it reaches a SoC of 100%. The battery includes a Depth-of-Discharge (DoD) parameter, and the controller agent pays heed to this in the charging/discharging logic and avoids discharging the battery below a certain SoC to prevent unnecessary degradation of the battery. The Residential Battery, furthermore, includes parameters that determine the maximum charging and discharging rates that the battery can support, and it includes parameters for the efficiencies of the two processes as well.
The battery starts charging or discharging when the connected controller agent asks it to do so and moves to either the
charging or
discharging state through one of the transitions labelled
2 in
Figure 3. The rate of charging or discharging is set by the controller but cannot exceed the maximum rate of the battery.
If the Residential Battery agent stops the operation by itself due to being fully charged or reaching the minimum SoC as described above, it moves to the idle state through one of the transitions labelled with 3. Otherwise, if asked to stop the operation by the controller agent, it moves to the idle state through one of the two transitions labelled with 4. When not operating, the battery, depending on the SoC, is either in the fullCharge state with a SoC of 100%, emptyCharge at the minimum SoC with the given DoD, or partialCharge at all SoC levels in between.
The charging and discharging processes and current SoC of the battery are represented by AnyLogic system dynamics elements as depicted at 5 in the figure. When charging, the currentChargingRate variable is positive, and the charge variable continuously increases. Similarly, the currentDischargingRate variable is positive during discharging, and the charge variable continuously decreases. The currentPower variable denotes the power rate that is drawn from (when positive) or supplied to (when negative) the agent when the battery is connected for electricity exchange. This power rate includes the charging or discharging efficiency of the battery agent.
4.1.5. Internal Agent Communication
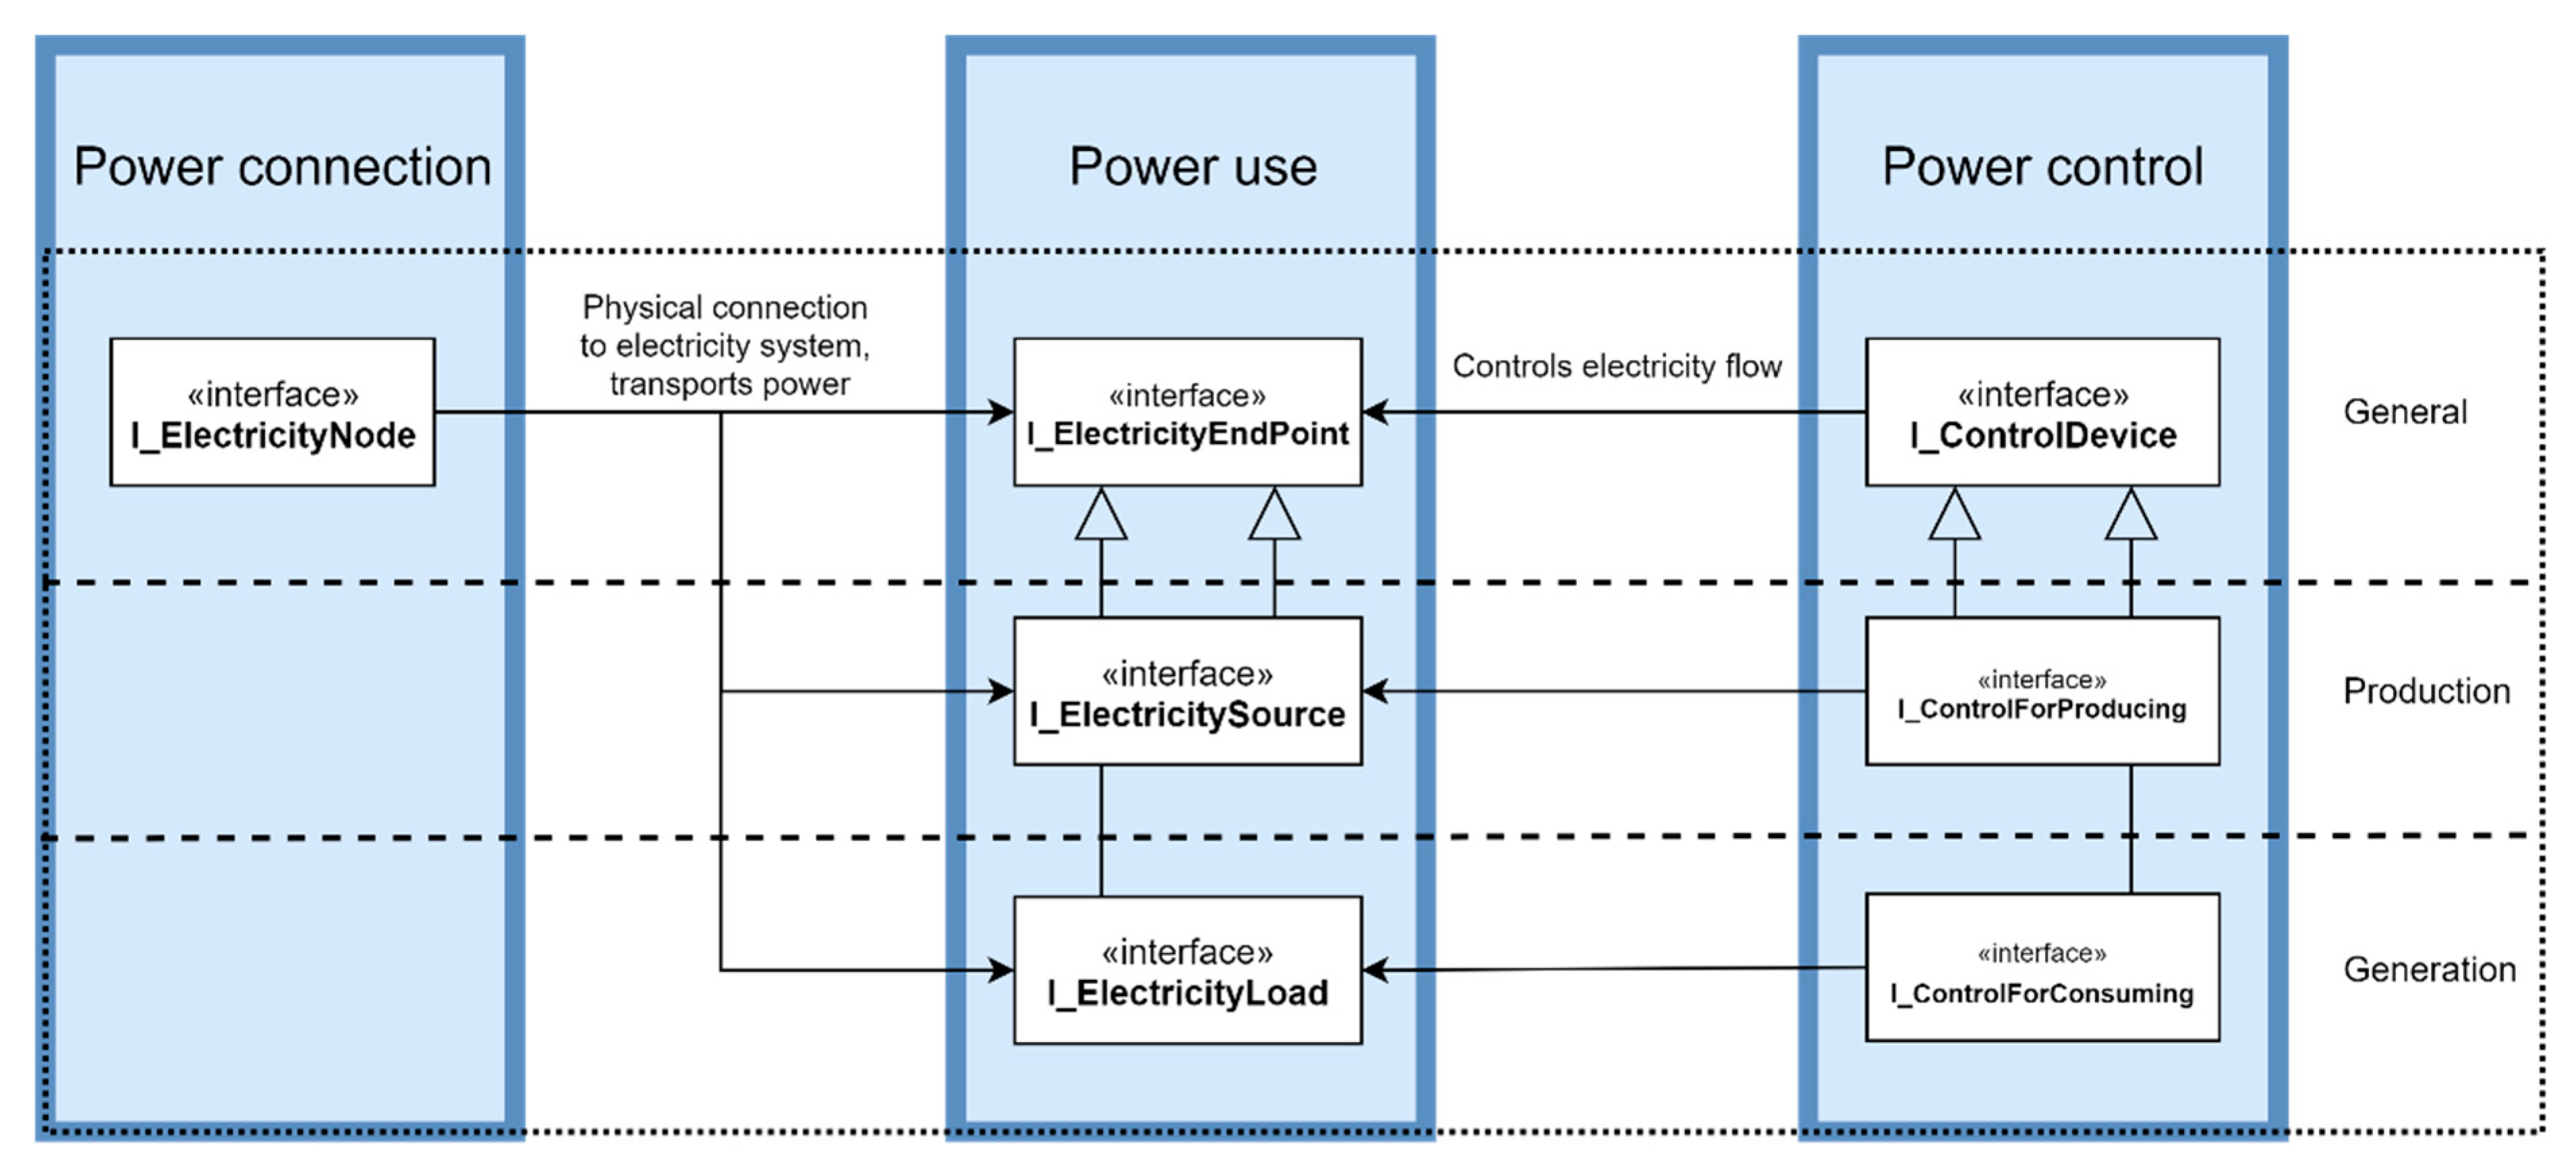
In the DER module, there is no communication between the respective types of DERs as this is handled by the EMS and Residential Consumer. However, a common requirement for DER agents is that they must be connected to certain other agents that assume certain roles (through framework interfaces), as shown in
Figure 4. This includes:
Power control: An agent that controls the power flow to and from the DER. This is not the same as an EMS, which instead sends control signals to the power control agent.
Power connection: An agent that maintains the physical transportation of electricity between the DER and the power system. It sends power flow information from the DER agent to agents in the connected power system.
The DER agent itself is usually the power user (middle). The power control and connection are usually maintained by other agent types, but the DER itself might also maintain one or both of these in certain cases, depending on the characteristics of the DERs.
In this paper, the Charging Box and Inverter agent types maintain the power connection and control.
4.2. Digital Twin Element—Electricity Distribution Grid
The Electricity Distribution Grid contains agents that constitute parts of an electricity distribution grid and transport electricity to and from electricity consumers (and producers).
4.2.1. Agent Types
The following list of agent types constitutes the Electricity Distribution Grid module:
Distribution Grid—an overall distribution grid section that contains and consists of a number of subcomponents.
Transformer—a 10/0.4 kV transformer that supplies a radial part of the electricity distribution grid.
Cable Box—an electric box placed in the 0.4 kV distribution grid that forms a junction between cable lines and the connection between consumer points and the distribution grid.
Consumer Connection Point—the point in the electricity distribution grid where an electricity consumer is connected.
Cable—a cable that forms the connection between nodes in the grid, such as Cable Boxes and Transformers.
4.2.2. Electricity Distribution Grid Agent Logic
The overall distribution grid is considered radial; hence, all components in the grid are connected in a radial treelike structure. All the agents that are part of the electricity distribution grid representation in the simulation implement the same particular interface relating to their role as power carriers in the grid. While the individual agent types might have specialized behaviors and additional interfaces, the common interface allows for the following two mechanisms to be implemented in the simulation:
One common characteristic of all agents that are part of the Electricity Distribution Grid module is a parameter that contains the ID of the distribution grid to which they belong. The respective lists of information on the components given as input to the simulation framework contain these IDs, and based on this information, a Distribution Grid agent can automatically establish the topology of the distribution grid. This implementation is particularly convenient when the simulation is applied to multiple case studies, as the grid for each case is simply represented by a list of grid components provided by the DSO.
The representation of power flows in the electricity grid follows the same logic as the power flows between electricity appliances in the DER module. This means that all agents that transport electricity in the Electricity Distribution Grid module do implement an interface that denotes they are an element that transports electricity in the power system. All agents are connected to a single agent upward in the radial grid topology and none to multiple agents downward in the topology. A grid agent responds to changes in loads and generations from the downward-connected agents and, in turn, invokes this change in the upward-connected agent. This forms a chain of load change calls that pass from the agent where the power flow change originates (at the Consumer Connection Point agents in the simulation) and through the path to the top agent in the topology.
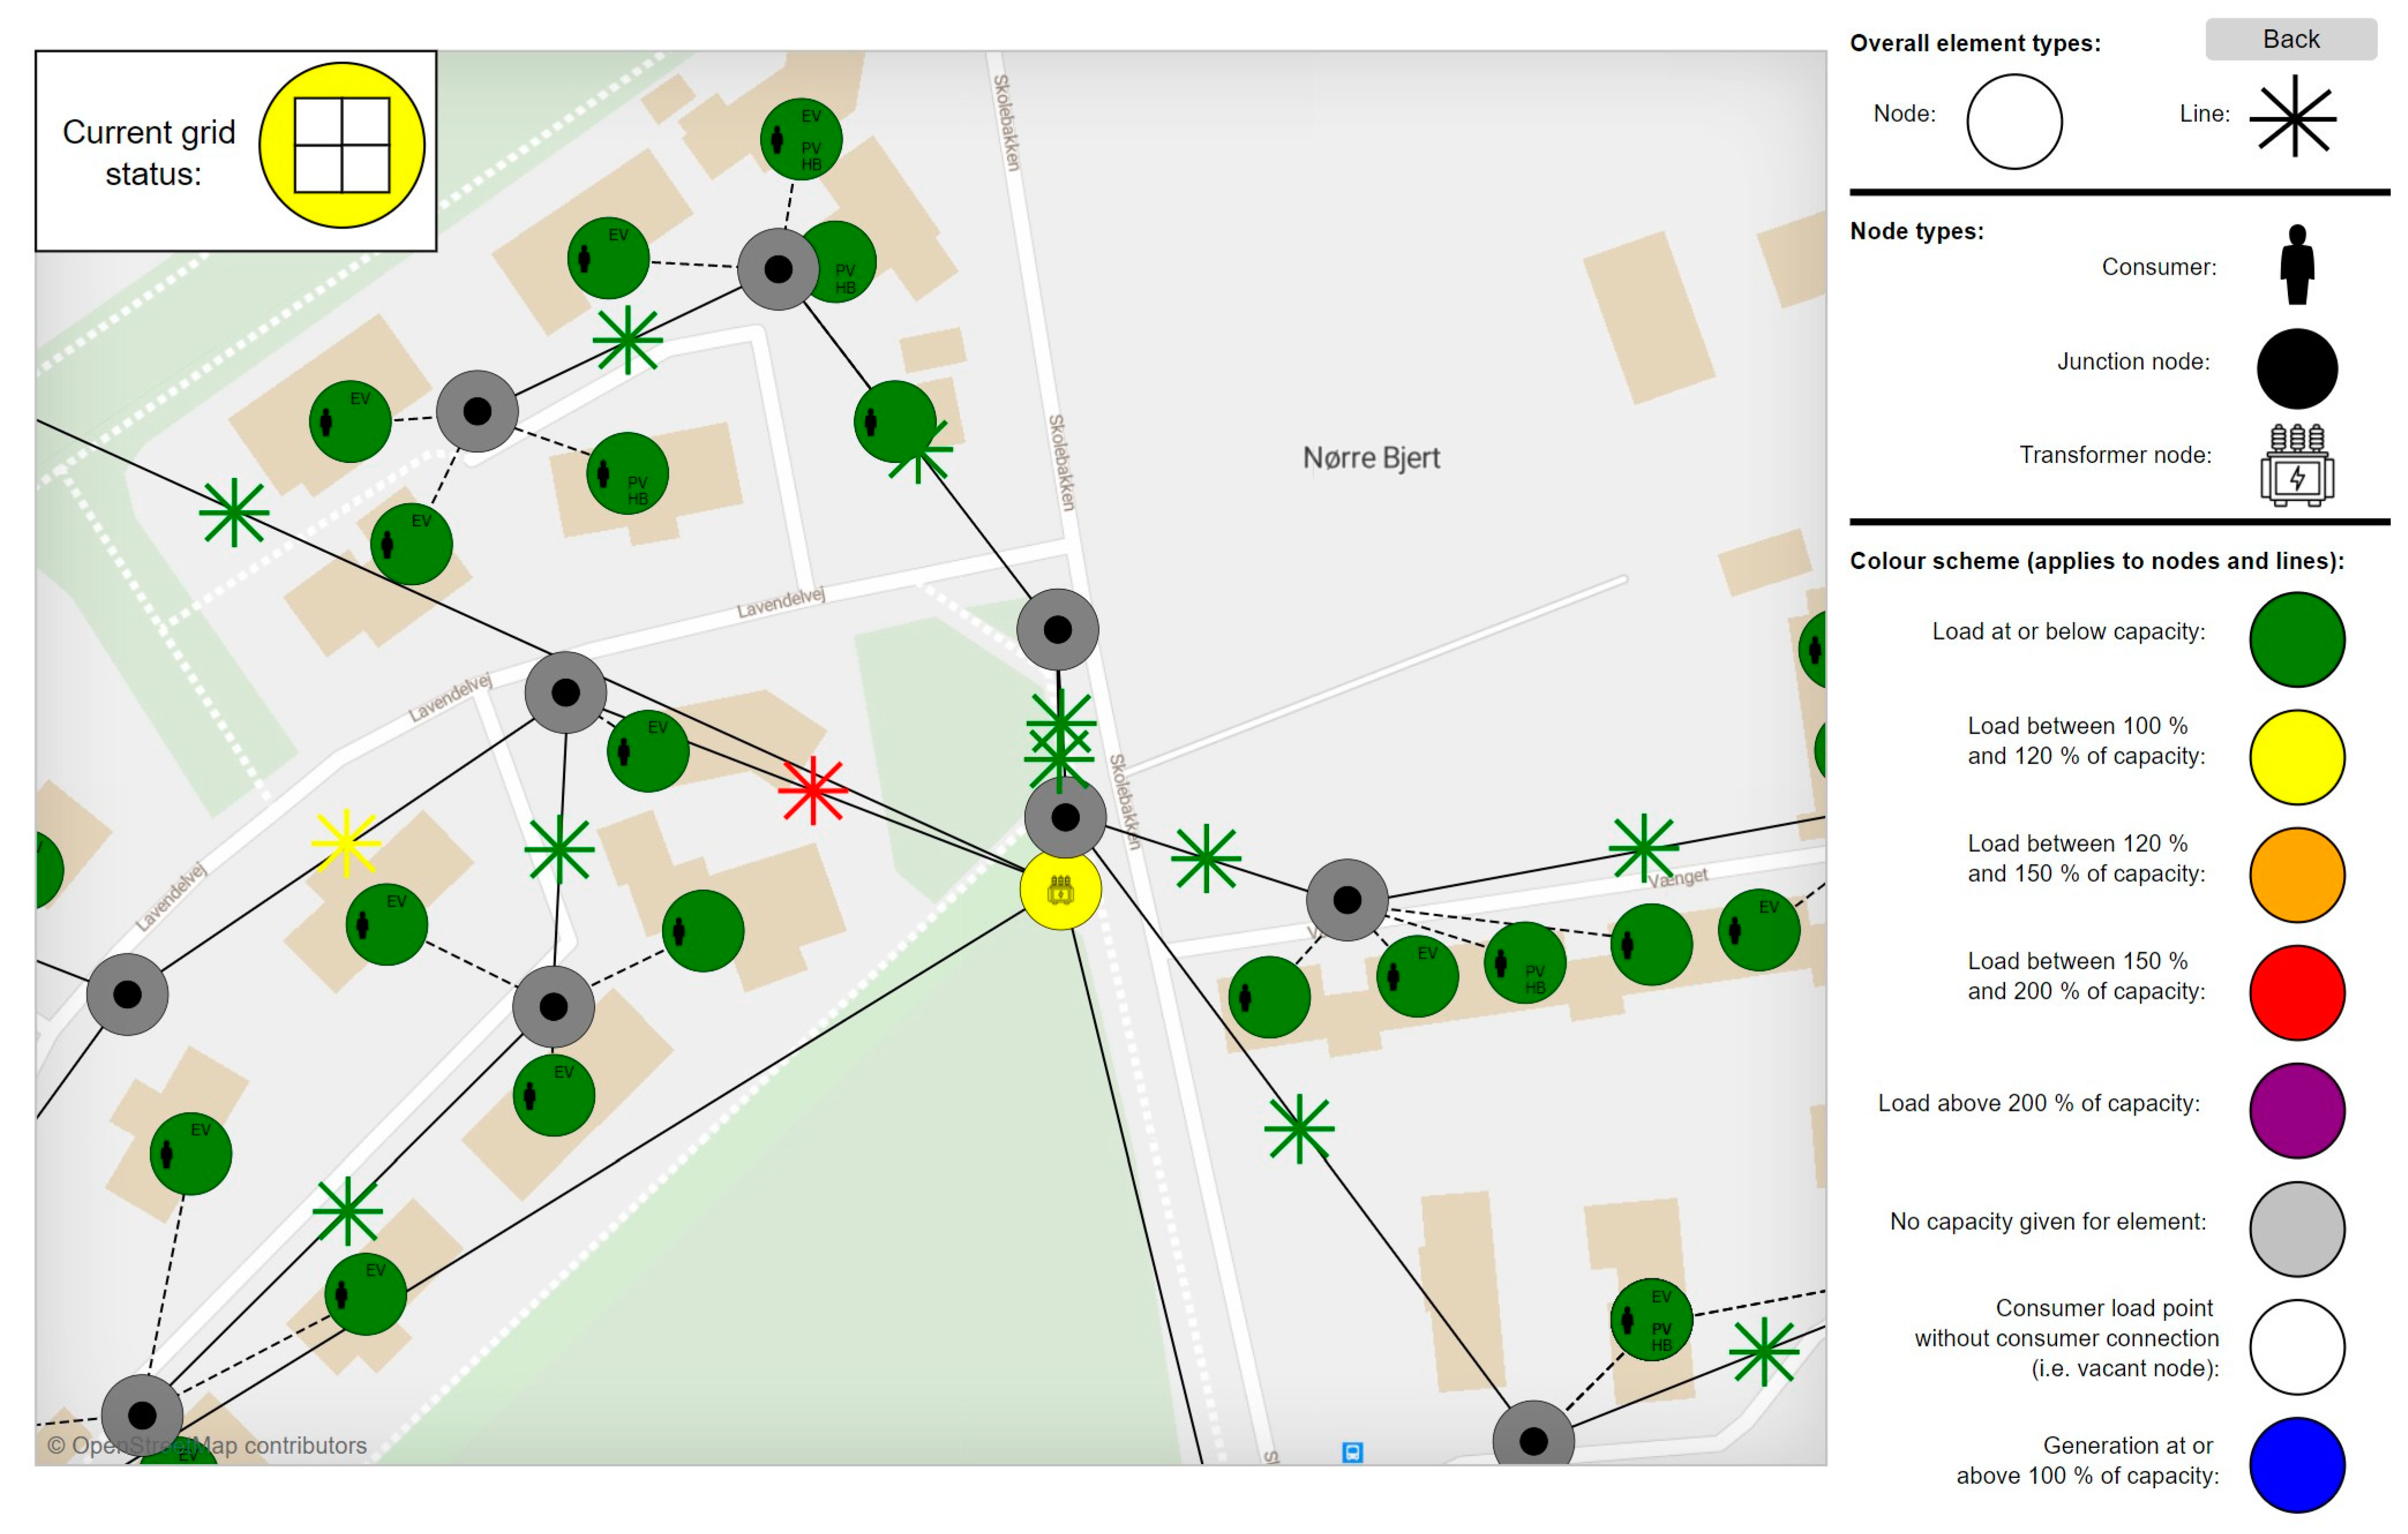
If GIS coordinates are provided as inputs for the respective components, it is possible to view the topology on a map while a simulation experiment is running. The visualization allows the user to monitor overloads when they occur in different components, as exemplified in
Figure 5.
4.2.3. Internal Agent Communication
The communication that commences within this module is two-fold:
Firstly, when a simulation experiment is started, the Distribution Grid agent instantiates the agents that are part of the particular grid according to an input spreadsheet containing the grid topology information. The instantiated agents ask the Distribution Grid agent to be connected to other agents in the grid according to the topology, and the Distribution Grid agent provides references to these other agents. This way, the radial topology structure between the agents in the grid is automatically generated based on an input spreadsheet with the information.
Secondly, the power flows are continuously updated from the bottom to the top of the radial grid structure. This means that if a load changes at a consumer point, the Consumer Connection Point sends a power flow information update to the Cable Box agent where it is connected. This information is relayed through the chain of agents in the grid, who update their current power flows all the way to the agent at the top of the topology. The aggregated power flow at the top agent, usually a Transformer that represents the connection to the power system outside the specific distribution grid, is considered to be exchanged with this power system. The chaining of power flow update interactions is made possible by the fact that the agents in this module act as power transportation nodes and lines and use the same update protocol through the designated interfaces.
4.3. Digital Twin Element—Energy Management System
The Energy Management System module contains agents that participate in the control and coordination of the operation of electric appliances according to certain logic and to fulfil certain objectives.
4.3.1. Agent Types
The following list of agent types constitutes the Energy Management Systems module:
Energy Management System—an EMS that can control DER appliances according to a set of control strategies.
Control Strategy—contains the logic and goals that an EMS uses for controlling one or more DER appliances. Multiple different Control Strategy agents can exist for the same EMS.
4.3.2. Energy Management System Agent Logic
For the developed framework, the EMS agent is placed at the residential consumer level, i.e., it is embedded in the Residential Consumer agent type.
The EMS agent has access to a number of charging strategies, each being represented by a distinct agent type embedded in the EMS agent. The set of charging strategies implemented and used for the scenarios presented later in this paper are described in the subsequent subsections but are as follows, paired by strategy and designated agent type:
It should be noted that the EMS and its strategies must respect the physical limitations of the controlled DER (e.g., battery discharging at zero SoC); in this case, the DER responds back to the EMS with the actual power flow it is able to sustain, and the EMS (and control strategies) can then decide and plan accordingly.
It should also be noted that the main purpose of the included strategies is to test the framework with a few examples. Hence, numerous future charging strategies with different logic should be implemented for analyzing different possible solutions for DER controlling.
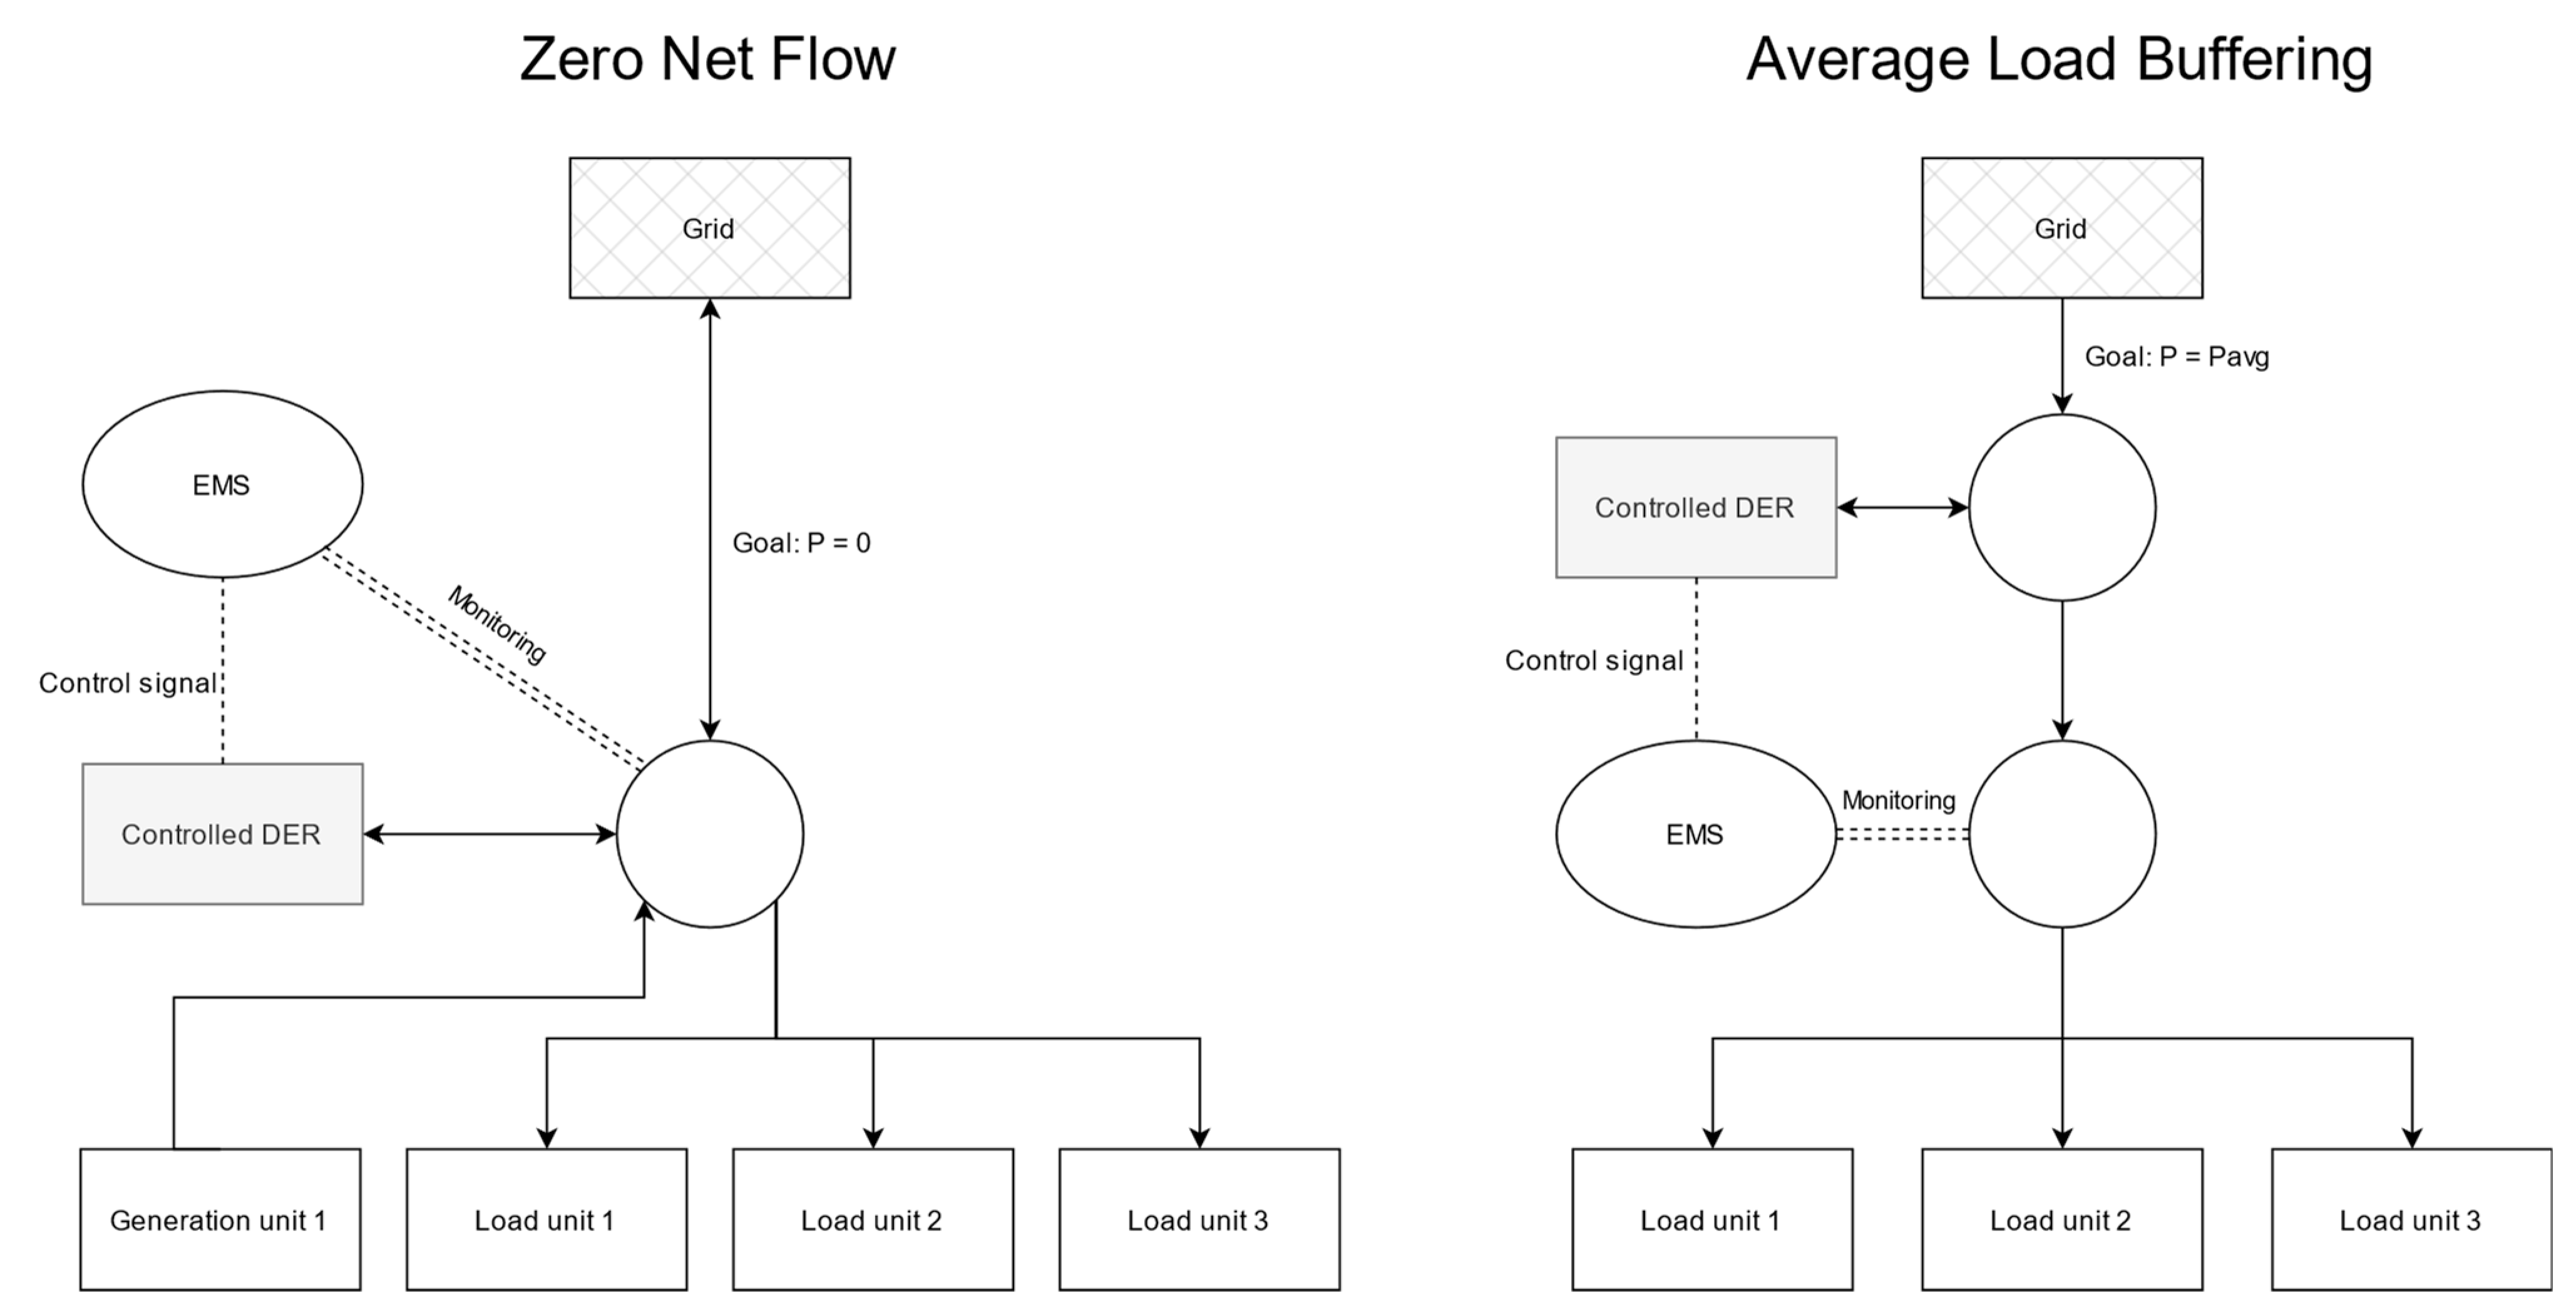
An overview of how the EMS and controlled DER are connected in the electricity system behind the consumer connection point (Grid) for the two Battery control strategies is depicted in
Figure 6.
Simple Charging
This strategy can be used for charging Electric Vehicle agents. It is the simplest charging scheme possible, as it immediately starts charging the vehicle at full power when it returns home after a driving trip. Charging continues until the vehicle battery is fully charged.
Zero Net Flow
The EMS controls the flow to and from a DER with the goal of minimizing the net power flow at the consumer connection point EMS is connected to upwards in the electricity system. Essentially, this corresponds to the grid connection point of the residential consumer who owns the unit, which means that the aggregated power flows of other appliances owned by the consumer impact the control.
The inverter continuously monitors the net power flow at this connection point, and each time it changes, usually in response to another appliance that changes its load or generation rate, the inverter sets the operation of the controlled DER unit to balance out this change. This means that when the EMS registers a net load at the connection point, it sends a message to the DER unit to consume/charge or produce/discharge at a rate that will change the net power flow to zero (within the limits of the DER unit). The new power flow (negative value for generation/discharging),
PcontrolNew, necessary after a change at the connection point flow, is determined using Equation (2), where
PcontrolOld denotes the previous power flow of the controlled unit, and
Pconnection denotes the net power flow at the consumer connection point after the power flow has changed but before the EMS has changed the power flow of the controlled unit accordingly.
The strategy does not plan ahead in time and simply reacts in response to the net power flow described above. For a storage unit, it is, therefore, likely that it will spend all the energy stored to balance a slight net load over a duration of several hours, while it will be unable to reduce a short-term peak load that occurs subsequently because the charge has been depleted by then. The control strategy can, therefore, be described as naïve.
This strategy is designed to be used with consumers who both own electricity-consuming and producing DER technologies. Due to the zero net flow aim, the controlled DER will always exchange power with the other appliances at the consumer, either absorbing surplus generation or sustaining surplus load, but it will never exchange power with the grid.
Average Load Buffering
While this is an unlikely case in practice because electricity consumers will most likely only adopt batteries if they own equipment that is able to generate electricity, the Average Load Buffering control strategy has been added to investigate whether DERs with storage can be used to reduce power flow fluctuations when no electricity generation is present. Instead, charging commences by drawing power from the grid.
The Average Load Buffering strategy is designed to be used with consumers who only own electricity-consuming DER technologies. The goal of the strategy is, instead of keeping the net power flow as close to zero as possible, to reduce the fluctuations in the power flow in systems where only historical power flow data is available.
The EMS monitors the net power flow from all appliances behind the consumer connection point, excluding the controlled DERs. Based on the flow measurements, over the course of the simulation, the EMS continuously calculates the average total power flow from the non-controlled appliances over time. By changing the power flow of the DER, the EMS aims to maintain the net power flow at the consumer connection point to be as close as possible to the measured average and, therefore, as stable as possible.
The strategy is somewhat similar to the Zero Net Flow strategy, only changing the power flow setpoint objective from zero to
Pavg, as given by Equation (3).
It is emphasized that Pavg does not include the power flow from the controlled DER appliance, i.e., there is no feedback loop from the control. This strategy is also naïve due to the lack of ability to plan ahead.
4.3.3. Internal Agent Communication
Communication in the EMS module is designed so that the EMS agent is responsible for communicating with any agents outside the module, particularly the controlled DERs. Furthermore, it is responsible for keeping track of which DER agent should be controlled according to which charging strategy. When a connection is established to a DER agent that needs to be controlled, the EMS creates and connects to an instance of the corresponding control strategy. As illustrated in
Figure 7, the EMS then collects the necessary information needed by the strategy regarding the state of the DER or other necessary external parameters (grid state, electricity price, etc.). The EMS agent communicates this information to the charging strategy as necessary. The charging strategy then determines and returns a suggested power flow for the DER (this can be an immediate response with one value or a schedule with multiple suggested control signals, depending on the charging strategy), which the EMS then relays to the controlled DER.
4.4. Digital Twin Element—Electricity Consumer
The Electricity Consumer module contains agent types that relate to electricity consumers and the appliances or objects, excluding DERs, that the consumers own and use.
4.4.1. Agent Types
Residential Consumer—a residential electricity consumer (or prosumer) who owns and uses a number of electric appliances and is connected to an electricity consumer point in the electricity distribution grid.
Base Appliances—an agent that represents electric appliances that are not DERs and are not assumed to be used for flexibility by the consumer in the setting of this paper (even though they might potentially be subject to certain flexibility schemes, e.g., price-based demand response). This includes lightning, washing and dishwashing machines, and television and electronics, among others. The agent type virtually captures all of these in one place and has a fixed load schedule that is defined through a list of loads in an input spreadsheet with past residential electricity consumption measurements.
4.4.2. Electricity Consumer Agent Logic
The implementation of the Electricity Consumer logic mainly consists of the Residential Consumer agent type, which has two overall responsibilities.
Firstly, the Residential Consumer agent type is responsible for adopting, owning, and using DER technologies. Hence, the Residential Consumer agents gradually adopt DER agents during a simulation experiment, according to a preset adoption rate. Because the rate of adoption of DER technologies applies to the entire population of Residential Consumer agents, the adoption of a DER technology is instigated by the environment in which the agent is embedded (represented by a Main agent in the DERInGrid simulation framework). When prompted to adopt a DER appliance, the Residential Consumer first chooses a model type of the DER and a fitting complementary equipment (Charging Box/Inverter) model type. When the adopted DER agents have been initialized, the Residential Consumer agent sets itself as the owner of the adopted DER agent and any complementary equipment agents. Furthermore, the Residential Consumer then connects the DER agent to the complementary equipment agent, if one exists, and the complementary equipment agent, or if no such agent exists, the DER agent itself is connected to the Consumer Connection Point agent assigned to the Residential Consumer.
Secondly, as the user of EVs for driving, the Residential Consumer agent plans whenever an adopted Electric Vehicle agent goes on a driving trip. The driving schedule is decided according to the following procedure:
Exactly one driving trip is planned for each day, and the next trip is scheduled at the time of arrival from the previous one. Thereby, the schedule always contains one planned trip.
The times of departure and arrival always lie within pre-defined time ranges, one for the departure and one for the arrival.
The departure is determined to be within the first hour after the highest base load measurement in the departure time range. Similarly, the arrival is determined to be within the hour before the highest base load measurement in the arrival time range. This logic is used due to the fact that the inhabitants of the residential consumer households are likely to be home when high base loads are registered.
Finally, the distance of a planned driving trip is determined. This is achieved by using a set of probability distributions, one for each day of the week.
When a trip has been planned, the departure and arrival times and the distance will be passed to the corresponding Electric Vehicle and Charging Box agents.
4.4.3. Internal Agent Communication
There is limited communication between agents in this module since the Residential Consumer agent constitutes most of the content here. The Residential Consumer agent owns the Base Load agent and connects it to its Consumer Connection Point.
4.5. Communication between Framework Modules
With the aim of attaining as much independence between the framework modules as possible, the relations and communication between the modules have been kept to relatively few and distinct connections. An overview is provided in
Table 2. Communication between framework modules is usually conducted through agent references stored in variables within the agents that interact. The types of these references are interface-based (since interactions are based on roles), and the Utility module of the framework or sometimes the owner agent (e.g., the Residential Consumer for DERs) is responsible for providing necessary connection references when new agents are instantiated. To keep the modules’ ability to work independently of each other, an implementation in the agents that uses reference variables for contacting agents from other modules is usually covered by a guard statement or exception handling; if there is no stored reference to an agent in another module, i.e., the value in the reference variable is null, the agent does not try to interact with the other agent and behaves accordingly. For instance, a DER not connected to an agent from the Electricity Distribution System module will simply cease to function (island mode is not part of the current implementation), but it will not cause a runtime exception.
5. Scenarios and Case Studies
This section first presents the scenarios that have been established for testing the DERInGrid framework. Secondly, it presents two Danish residential electricity distribution grid case studies in which the framework has been applied.
5.1. Testing Scenarios
This section introduces the simulation scenarios that have been designed to apply the developed DERInGrid simulation framework for two specific case systems. This application serves as a demonstration of how the simulation can be used to obtain identification and evaluation of emerging DER operation patterns and the congestion these cause in parts of an electricity distribution system.
It is possible to employ the simulation for numerous different configurations of DER technology adoptions and settings and, in turn, analyze the results for emerging patterns between numerous combinations of variables and in various visualizations.
For this paper, three particular scenarios have been established to demonstrate how different electricity and production DERs can impact a residential electricity distribution grid. An overview of the scenarios is provided in
Table 3, and the individual scenarios are described in the following subsections.
The simulation experiments comprise 15 years, which is considered a reasonable timeframe to achieve a significant adoption of DERs while not being too far and hence too uncertain for the last years. Time series measurements for power flows at relevant agents are obtained every 10 min of simulation time.
In this scenario, the population of residential consumers will gradually adopt PV equipment during the simulation run, according to pre-set adoption functions. The residential consumer agents in the population will be selected randomly for the adoptions, and a consumer agent can only adopt and own one PV unit. No control strategy applies to this scenario.
The battery scenario comprises two sub-scenarios:
In order to test whether stationary batteries might have some potential for being installed without any DER electricity generation technologies, such as PVs, they are instead being used as storage buffers, exchanging power with the distribution grid. Over the course of the simulation, the consumers who adopted PVs in S.2 will now adopt batteries instead. The exchange of power with the batteries is controlled by the EMS using the Average Load Buffering strategy. A particular focus of this strategy is whether the net load at the Consumer Connection Points is smoothened, i.e., peak loads are reduced.
In this scenario, the population of Residential Consumers will gradually adopt EVs, according to a pre-set adoption function. Each vehicle goes on one driving trip per day; departures can occur between 5:00 and 9:00, while arrivals can occur between 14:00 and 20:00. These ranges are assumed to reasonably reflect a standard driving behavior to and from work. It should be noted that these time ranges are used for weekends and holidays as well for simplicity purposes. For the distance of a driving trip, the value is set according to a random distribution based on measurements performed in [
83]. Each day of the week has a distinct distribution. Furthermore, vehicles will be charged according to the Simple Charging EMS control strategy, and no discharging will therefore commence. A particular focus of this scenario is whether multiple EVs charging at the same time will cause overloads in the electricity distribution grid and its components.
This scenario combines the residential consumer adoption of rooftop PV equipment and the stationary batteries to reflect what might be expected from a future increase in electricity price volatility and, therefore, incentives for Danish electricity consumers to buffer the generation from the PV equipment to times when loads on the grid are high and can be alleviated by local power generation resources. The EMS controls the inverter that connects the PV and battery to reduce net load at the Consumer Connection Point, according to the Zero Net Load control strategy.
5.2. Case Studies
This section introduces the two Danish case studies, including information on the grid topology, the expected adoption rates of DERs among the population of residential consumers, and the available DER models that can be adopted by the consumers. These are referred to as Case 1 and Case 2, respectively.
The reason for choosing the two particular cases is that they both represent a typical Danish residential electricity distribution grid. The DSO operating the grids in both cases is, furthermore, concerned that overloads caused by DERs will occur in the near future, necessitating large-scale and expensive grid reinforcements. This makes the systems relevant to the aim of the developed simulation framework. Furthermore, the cases have different characteristics that are relevant when comparing them; Case 1 is an older residential district comprising 126 households. The district is relatively old, with some of the buildings dating back to 1910–1930. The current adoption of DERs is limited; however, the district is upper-middle-class, and the residential consumers have the resources and are expected to be relatively early adopters of DERs within the upcoming years. Case 2 is a residential district that was established in 1985. It therefore comprises 160 households and a distribution grid that are relatively new. It is still being developed with new buildings that will likely have PVs installed as part of the construction.
Historical electricity consumption data for 2019 has been acquired for all the households in the two cases and is used to represent the loads from the Base Appliances agents. This data has an hourly time resolution and is reused for every year of the conducted simulation experiments.
5.2.1. Grid Topology
The two Danish case study systems in the paper consist of a single 10 kV/0.4 kV transformer sub-station that feeds the entire electricity distribution grid that connects residential consumers in the systems. These transformers are designed to support a nominal load of 400 kVA. In addition to the transformers, only interconnect cable boxes are included in the paper. Cables that constitute the connection between cable boxes and residential consumer connection points are disregarded for the systems as no information or specifications could be acquired. The local DSO has supplied information on all cables and cable boxes. For the cables, this information includes cable types, lengths, rated amperage, and information on the cable boxes they connect at each end. For the cable boxes, only the geographical location has been provided, which means that overload occurrences cannot be registered for the cable boxes in the performed experiments. Furthermore, the DSO has provided information on which cable boxes feed the respective consumer connection points and the IDs and residential consumer addresses of these points.
According to the DSO, electricity consumers connected to their grid are usually allocated 25 A per phase when new grid sections are dimensioned. This means that the allocated power capacity at each connection point is calculated in Equation (4).
5.2.2. Distributed Energy Resource Adoption
In the two cases, adoption of EVs, PVs, and batteries are considered, since they are the main technologies discussed by the Danish transmission system operator, Energinet, when discussing the future impact of residential consumers on the electricity grid [
6]. It should be noted that heat pumps are also considered crucial for the future electricity system in the report; however, the cases in the scope of this paper only consider purely electric DERs.
Based on patterns in base electricity load data and building information, it has been determined that some households already own some DER equipment by the start of the performed simulations. The pre-existing numbers of units for each DER in the cases are given in
Table 4.
Based on the innovation adoption theories discussed in [
84], a logistic growth function, Equation (5), is used for the adoption of EVs and PV equipment across the consumer agent populations.
The upper limit, K, is set to the number of consumers in the respective systems, as it is assumed that every consumer is able to adopt one of each DER. Batteries are adopted in conjunction with PV equipment for S.3, so this DER type does not have an adoption function by itself.
It is assumed that the growth in the number of adopted DER appliances is still in a relatively early phase and that it is comparable with exponential growth similar to the early part of a logistic growth curve. To estimate the growth rate parameter, r, and the initial number of DERs, P0, for the logistic growth functions, an exponential regression has been performed on data covering the developments in the numbers of the respective DERs that have been registered for previous years.
For EVs, the Danish bureau of statistics, Statistics Denmark, publishes detailed data relating to the monthly and yearly EV sales in Denmark [
85]. Specific data for the municipalities of the two case study systems has been acquired, and the considered vehicles comprise pure EVs used for residential purposes, i.e., hybrid vehicles and commercially used vehicles are disregarded. The extracted data encompasses the years 2018 to 2021, and the numbers have been scaled down by a factor that matches the relative number of households in the two case study systems compared to the respective municipalities [
86].
For rooftop PV panels, no data is available from Statistics Denmark. Instead, a projection made by the Danish Energy Agency has been acquired, which considers the expected development in installed rooftop PV capacity [
87]. This projection, scaled down to the case study systems sizes, has been used for the adoption function.
The final adoption functions for the two DERs and two case study systems are shown in
Table 5.
5.2.3. Distributed Energy Resource Specifications
For the two Danish case systems, the same DER and complementary appliance model types are available to the residential consumers for adoption. These sets are presented in the following sections.
Electric Vehicle and Charging Box
From [
88], which lists the most sold vehicle models in Denmark for the first 7 months of 2021, the 10 most popular pure EV model types have been selected for inclusion in the simulations. Upon adoption, the likelihood of choosing a specific EV model type is based on its relative market share parameter, i.e., how many vehicles of the EV model types have been adopted in the sales numbers compared to the total adoption of EVs. For consistency between vehicle suppliers, which might sometimes present certain parameters differently, the specifications for the chosen EV model types have been gathered from the Electric Vehicle Database [
89].
For the complementary EV charging box appliances, only four different model types have been included in the simulation, one for each of the four maximum charging rates that are commonly supported by EV model types, i.e., 3.7, 7.2, 11, and 22 kW, as it is assumed that domestic consumers will always adopt a charging box that at least supports the maximum charging rate of the vehicle and the operational limitations set by the box do not influence the charging of the vehicle. For simplicity, the constant charging efficiency of 85.7% has been used for the overall charging process in the Danish case study systems, corresponding to level 2 (240 V) charging stated in [
90].
Roof Photovoltaic and Standard Inverter
A variety of differently sized PV model types offered by [
91] are included in the simulation input list. Note that while the information on all model types comes from the same PV retailer, the range of PV model types comes from multiple different producers and is considered broad enough to sufficiently represent the roof PV equipment that might be adopted by most Danish domestic electricity consumers.
Inverters are used to convert power between DC and AC when appliances requiring or producing DC power are connected to the grid. Two types of inverters have been included in the model: a standard inverter that connects PV appliances and a hybrid inverter that connects both PV and battery appliances. The included appliance model types have been retrieved from the same retailer as the battery [
92].
Battery and Hybrid Inverter
For simplicity, and like with the roof PV model type specifications set, all specifications for the battery model types have been obtained from a single retailer that sells household batteries on the Danish market, Viva Energi [
92]. All batteries are assumed to have a DoD of 80%.
The list of chosen battery model types only includes one model type. Instead, the list contains installations of different numbers (currently 3–7) of module units of that model type that are stacked and, therefore, linearly increase the rated voltage, capacity, and charging rate. Furthermore, the battery model type is a LIB, thereby offering a relatively high DoD level and durability. These choices have been made to limit the complexity and factors that affect the operation of the battery over its lifetime to a minimum in the simulations.
6. Results
This section presents and discusses a set of relevant results that have been obtained from performing the scenarios with the two case studies.
6.1. Simulation Outputs Overview
After each simulation experiment, outputs are printed to a set of spreadsheet files. These outputs from the simulation currently consist of:
Time of adoption and adopted DER models at the Residential Consumer agents.
Timeseries measurements of variables that make up the state of the agents in the system, e.g., power flows from DER agents, battery SoCs, aggregated power flows at agents in the distribution grid, etc.
Data on overload occurrences at agents in the Electricity Distribution Grid Module, particularly their frequency and magnitudes over time of the day, day of the week, and month of the year.
Since the output data from the simulation experiments is extensive and can be presented and analyzed in numerous ways; however, the purpose of this paper is to present and test the DERInGrid DT framework, and a deeper analysis of the impact of adoption, operation, and control of DERs in the particular case studies is beyond the scope of this paper. Instead, a few example figures are included to demonstrate the outputs from the simulation and discuss its validity. The included results comprise:
A summary of the number of Residential Consumer agents who have adopted DERs at the end of each scenario experiment—
Table 6Operation curves for summer and winter weeks for a Residential Consumer example agent that has adopted PVs in S.1 (Case 2)—
Figure 8Same as above for a battery adopter in S.2A (Case 2)—
Figure 9Same as above for an EV adopter in S.2B (Case 2)—
Figure 10Overviews of the relative time over the hours of the day where the top-level Transformer agent was overloaded by different magnitudes. It should be noted that only figures for S.2B are included here since the transformer is never overloaded in the other scenarios—
Figure 11 and
Figure 12Operation curves for a PV and battery adopter in S.3 (Case 2)—
Figure 13An overview of the time passed and charging power capacity distribution of adopted EVs before the first transformer overload incident—
Table 7A summary of certain simulation performance measurements, e.g., elapsed time—
Table 8
6.2. Case and Scenario Comparison
The numbers of adopted DERs after 15 years for each of the scenarios and case studies are shown in
Table 6.
For S.1, it seems that the operation logic of PV agents correctly makes them produce electricity during the middle of the day when there is sunlight, and in some cases, there might be significant electricity generation from a single Residential Consumer, as can be seen from the summer week in
Figure 8. However, it is not enough to overload parts of the electricity grid, possibly due to the fact that a limited number of consumers (13 for Case 1, 25 for Case 2,
Table 6) have adopted PV over the 15-year course of the simulation.
For S.2,
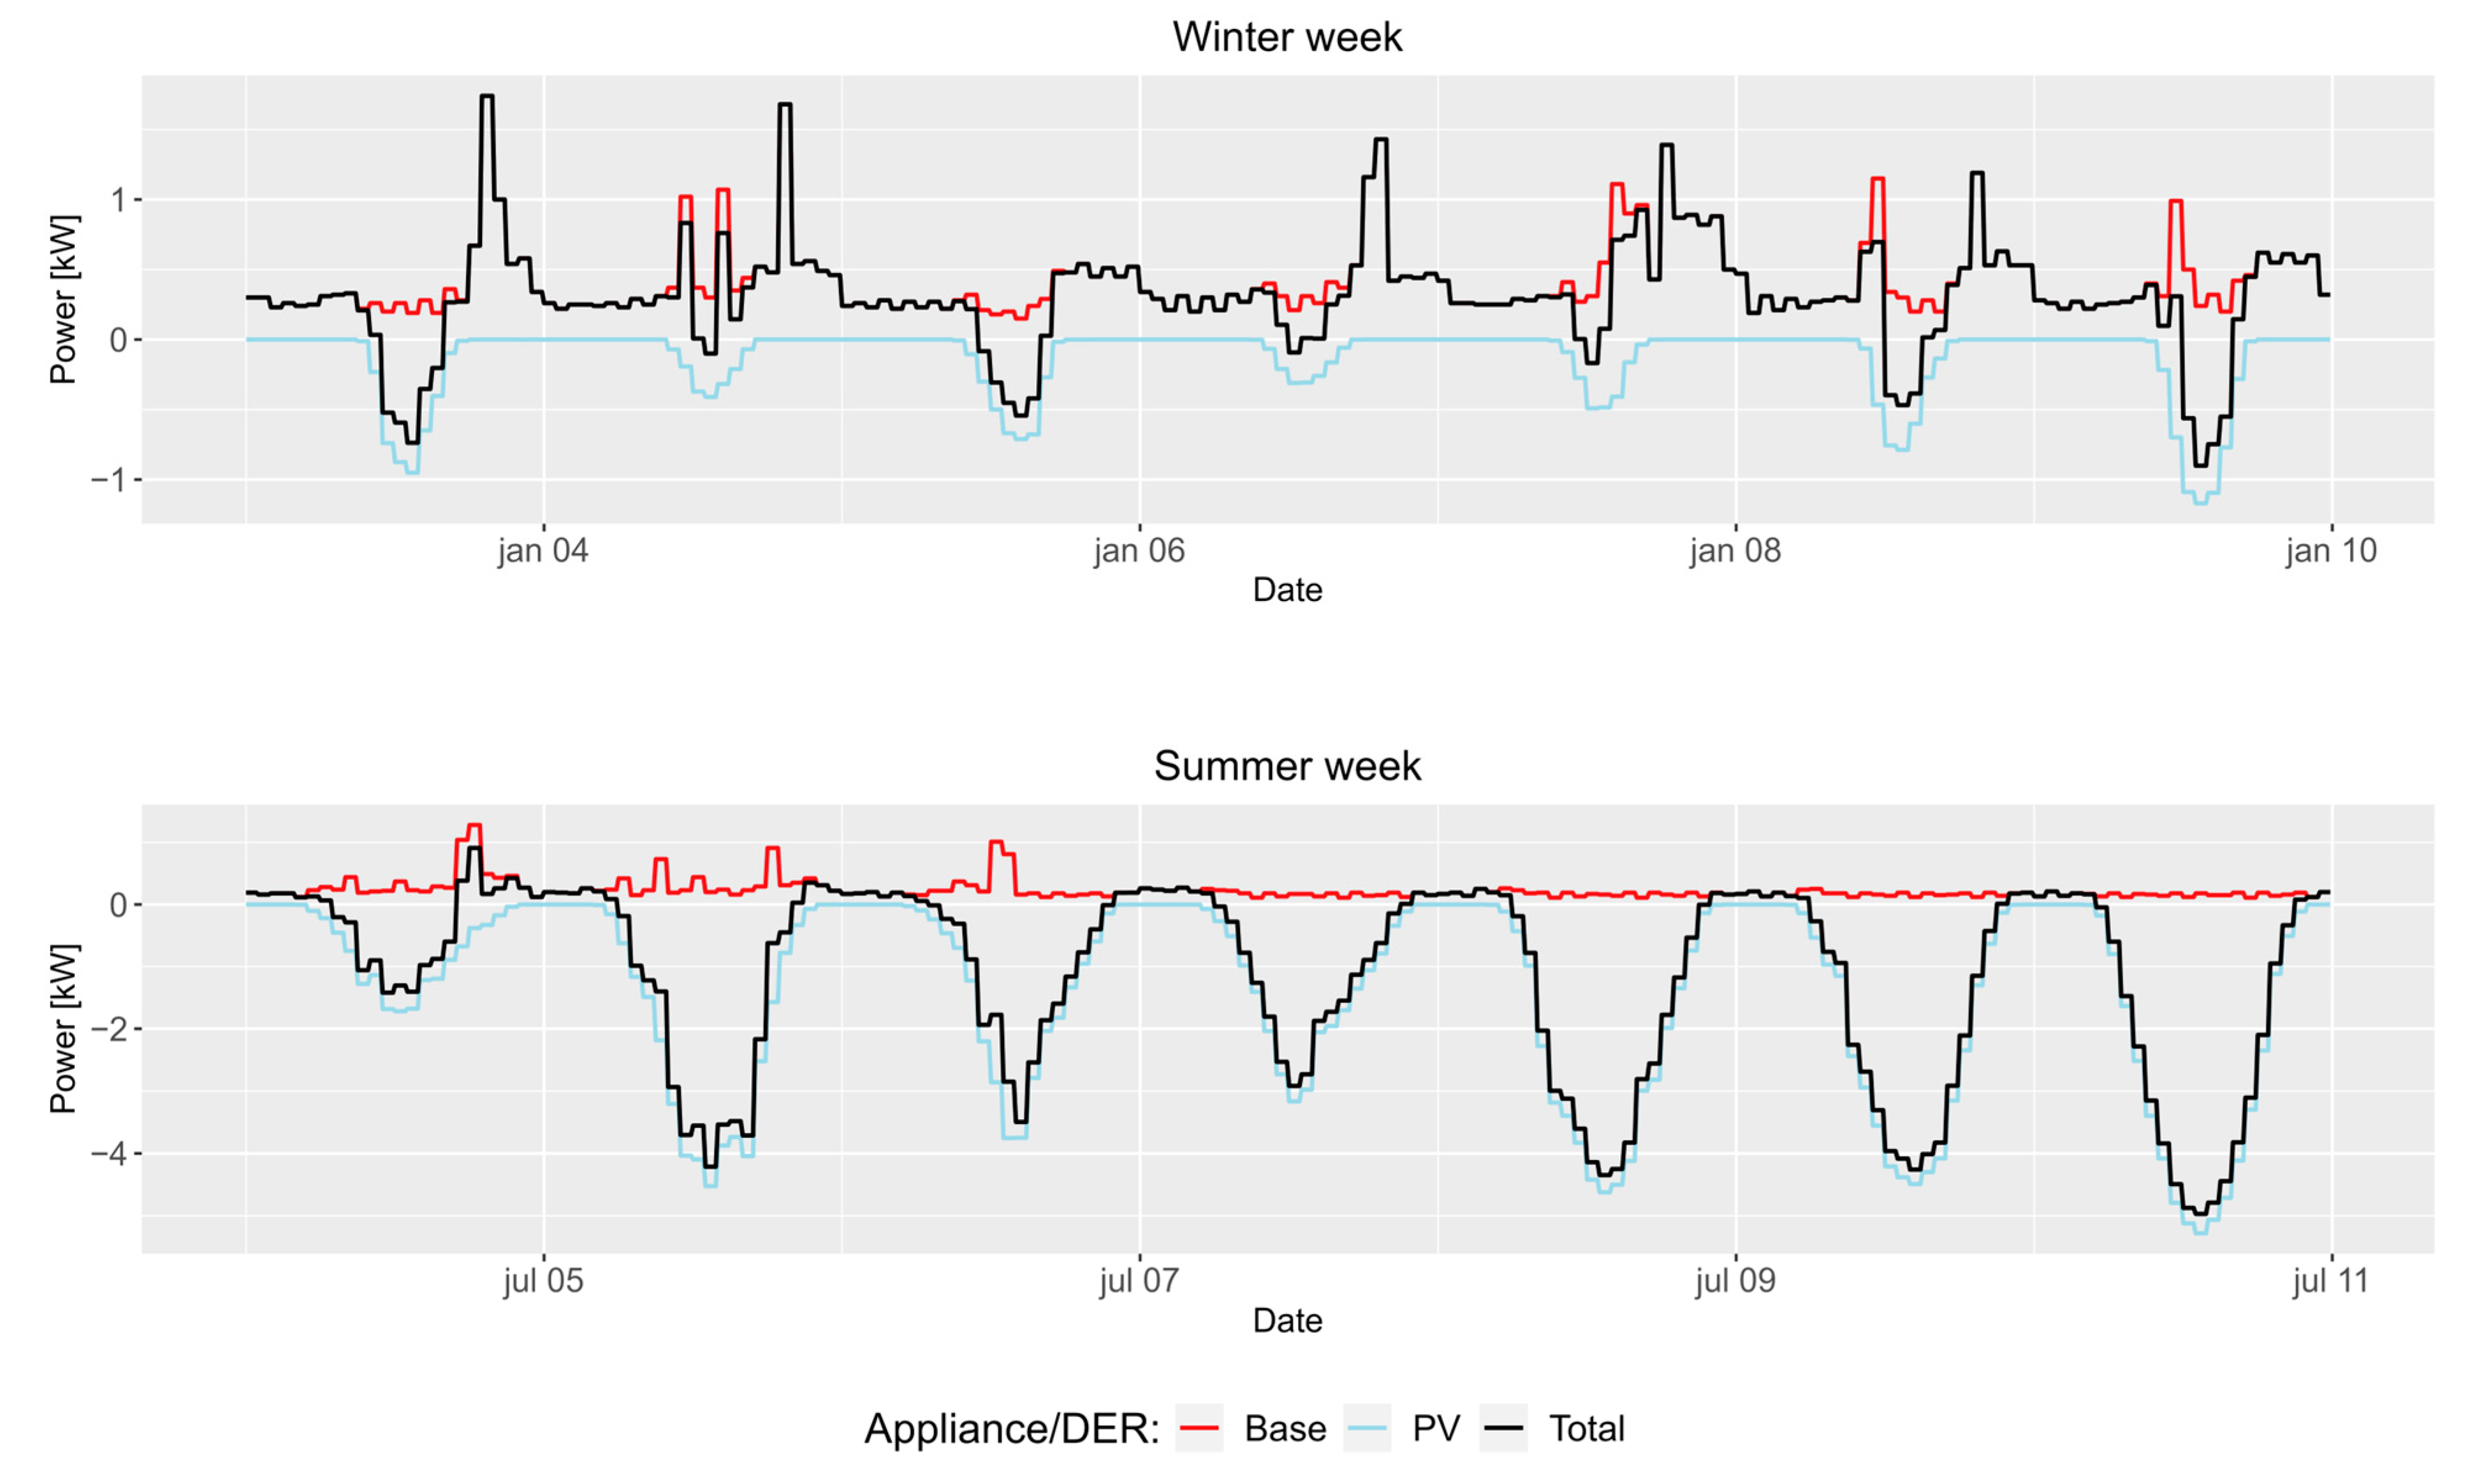
Figure 9 illustrates that the operation of a battery without PV, according to the Average Load Buffering control strategy in S.2A, can be verified to be working as intended. While it is able to keep the net load stable for some of the time, particularly during the winter week, of interest here is the fact that the Battery agents have limited charging/discharging rates, limited energy capacity, and the Battery reaching 20% (DoD) and 100% SoC due to insufficient energy stored or empty capacity before discharging/charging is needed. This is a particular issue during the summer week, where the base load is below the average for multiple days, while the battery cannot increase the net load to the average value by charging because it already has 100% SoC. Also, the stored amount of energy is insufficient to completely alleviate the peak load period at the end of the summer week (the very last peak load is not reduced). Therefore, the performance of the Battery agent as a tool for load fluctuation reductions might be improved significantly with larger battery dimensioning (and higher costs) or a more intelligent control strategy that can plan ahead in time and optimize accordingly. It should be noted that
Figure 9 shows a point in time during year 15, where the average load value has stabilized compared to the beginning of the simulation (the battery was not adopted at that time, however).
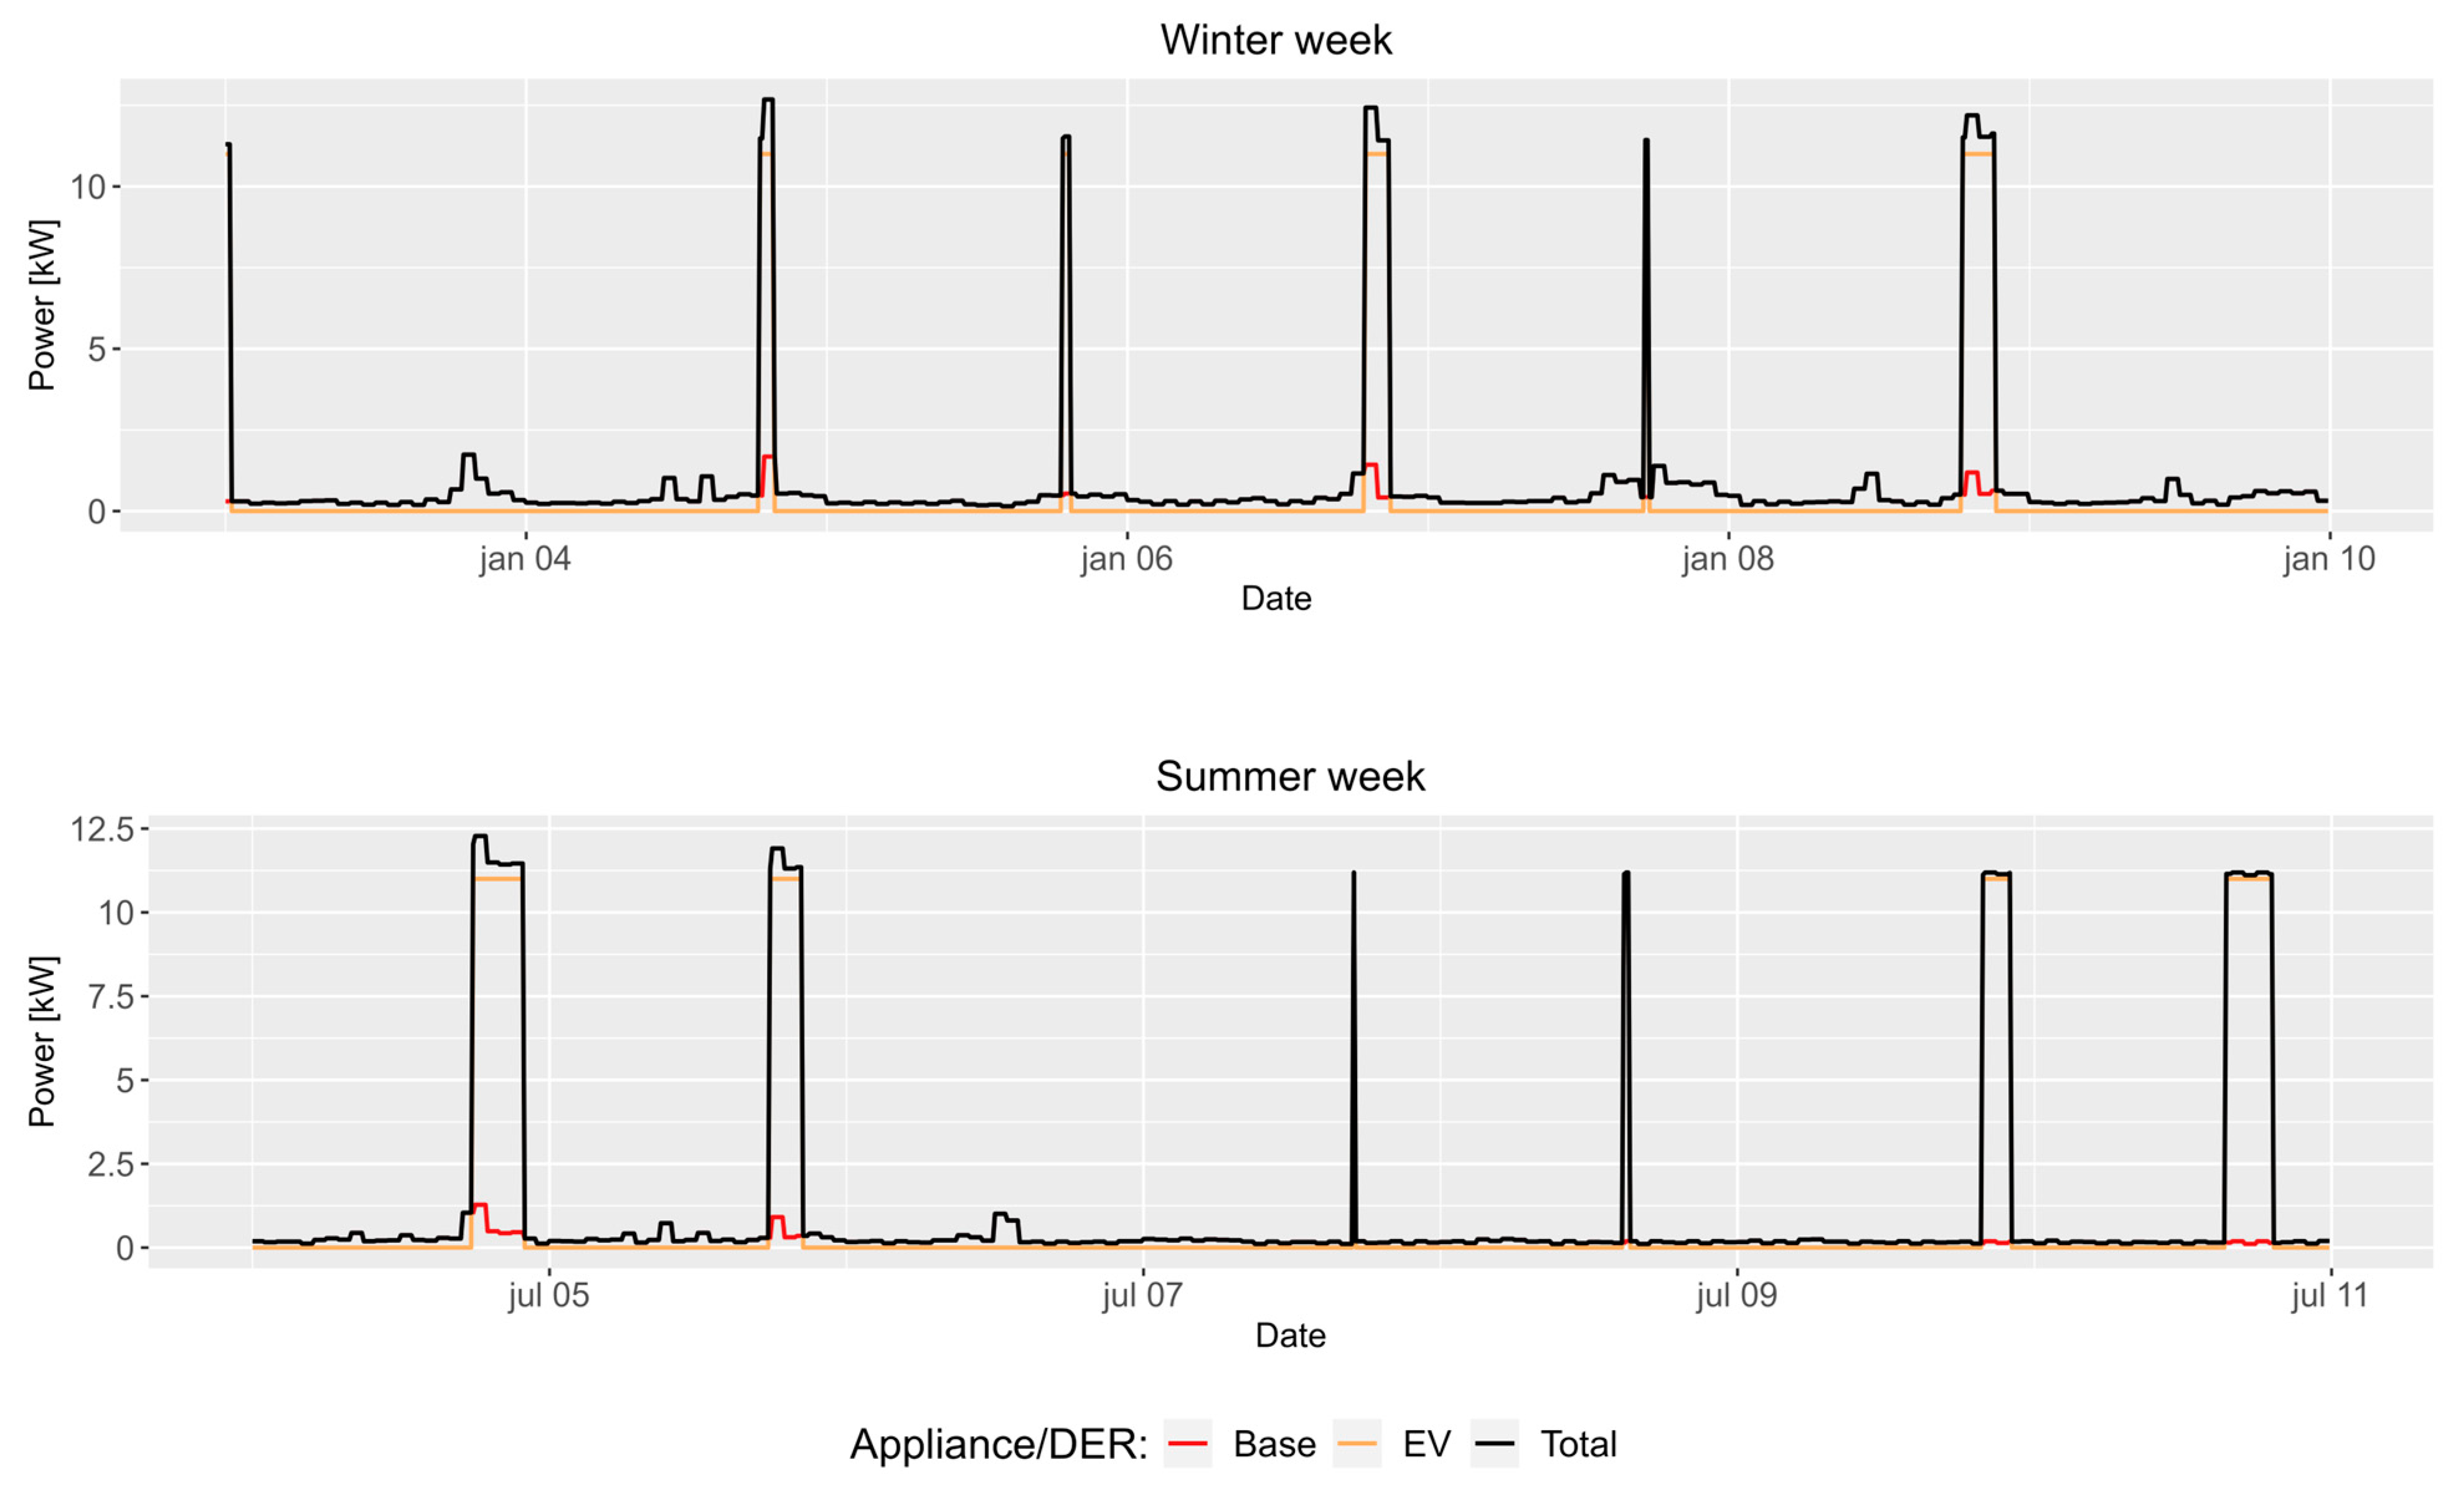
For the S.2B scenario, looking at the operation plot for EVs in
Figure 10, it is evident that the vehicle is charged at around 11 kW in the late afternoon or early evening when returning from a driving trip. The time for charging varies due to the varying driving distances. In some cases, the distance is so short that the load from the charging is not measured at all (load measurements for outputs are performed every 10 min in the simulation). The S.2B scenario with the EV adoption is significantly different when it comes to overloads in the distribution grid. Due to the adoption functions, the adoption of EVs is significantly faster than PV/Batteries; almost every consumer has an EV after 15 years, as seen in
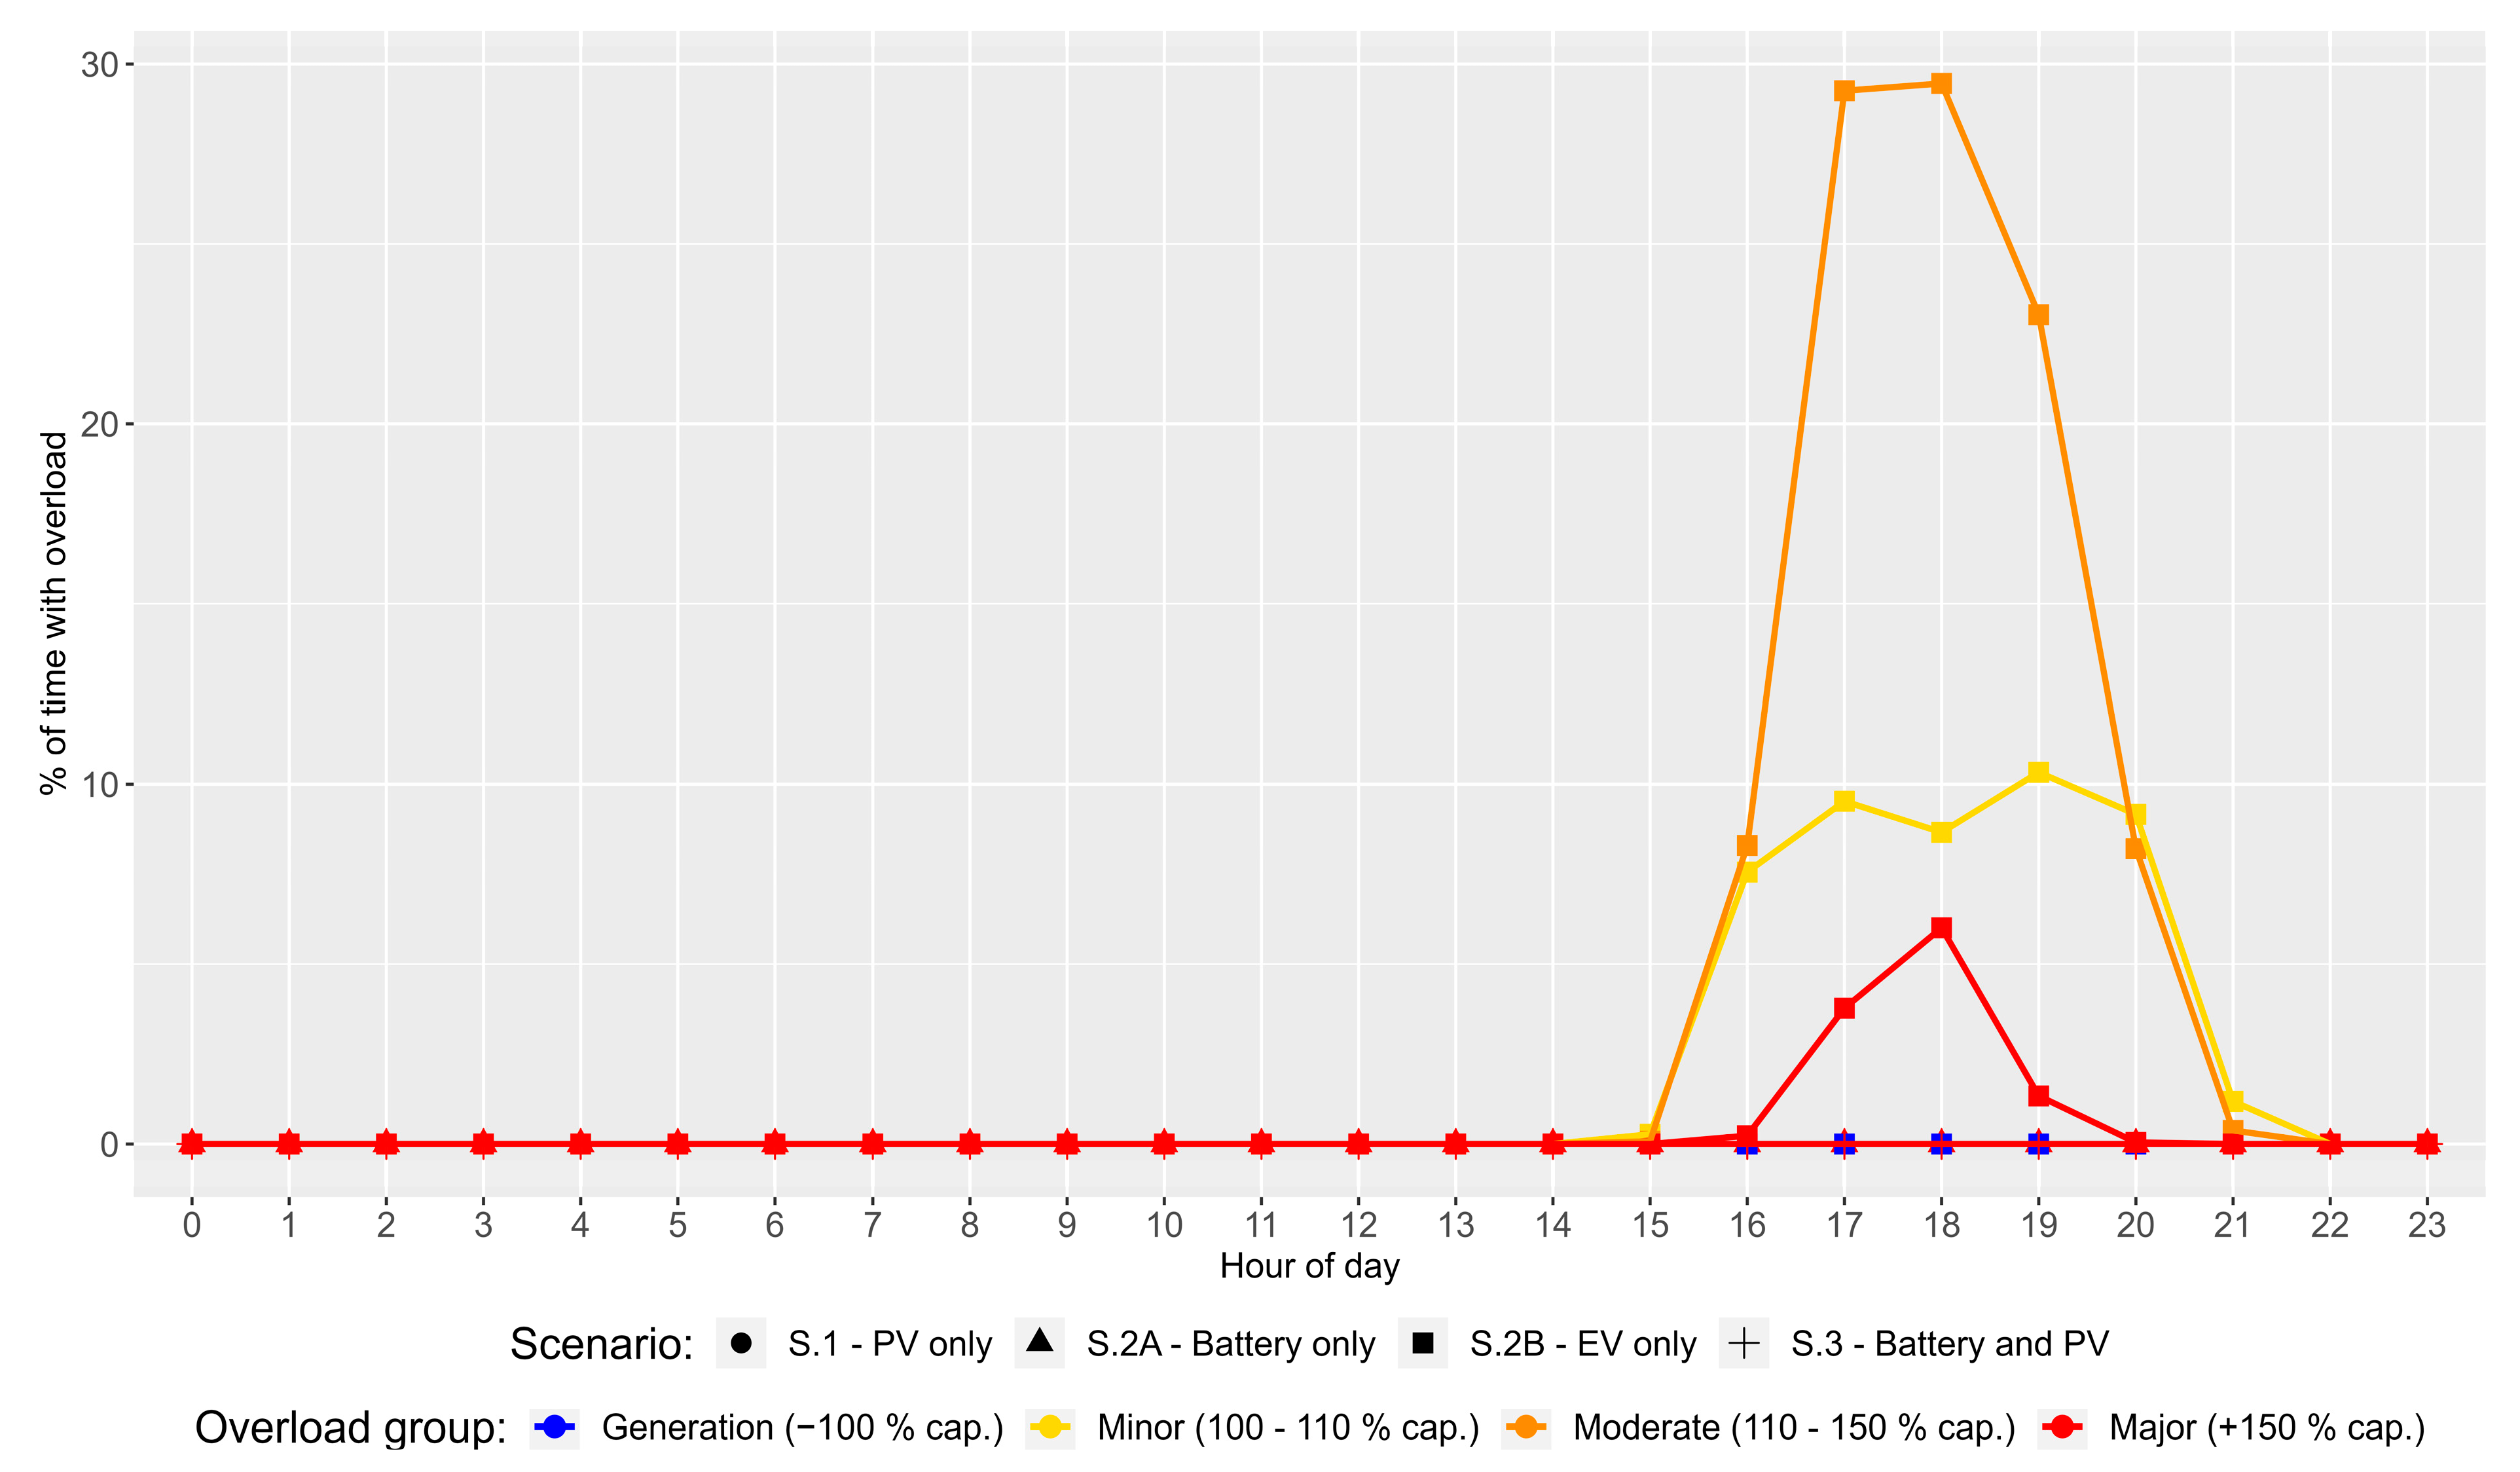
Table 6. During the 15 years, approx. 30% of the time between 17:00 and 19:00 in the evening at the Case 2 system, the top-level transformer is moderately overloaded (
Figure 12), which indicates a major challenge to the DSO if this adoption occurs in the future. The overload durations in Case 1 are significantly lower (
Figure 11), mainly due to the fact that there are fewer Residential Consumer agents (the Transformer nominal power capacity is the same in both cases), and especially due to the high higher number of electric vehicles found in Case 2 at simulation start; there are more vehicles early on, causing overloads for a larger share of the time across the 15 years. Further supporting this claim, as presented in
Table 7, the first overload in Case 1 is registered after a little more than 7 years, while Case 2 has its first overload after almost 5 years. The number of adopted EVs at these two points is 33 and 43, respectively. This is an example where further analysis of the data output produced by the simulation can be conducted by a DSO. For instance, the reason for the lower number of vehicles at the first Case 1 overload occurrence might be due to coincidental charging between a large number of vehicles at the same time, or it might be due to generally higher base appliance loads in the system, compared to Case 2. Such further analysis should be conducted by the DSO to look for certain patterns, particularly by using the generated overload curves exemplified by
Figure 11 and
Figure 12, and identifying grid sections vulnerable to overloads.
Table 7.
Overview of the time passed before the first registered transformer level overloads in the two cases and the number of electric vehicles adopted at these times, grouped by charging rate.
Table 7.
Overview of the time passed before the first registered transformer level overloads in the two cases and the number of electric vehicles adopted at these times, grouped by charging rate.
| | Case 1 | Case 2 |
|---|
Time passed before first overload occurrence
[h/yr] | 63,090/7.20 | 42,498/4.85 |
| Number of electric vehicles with charging capacity at first overload occurrence | | |
| 7.2 kW | 12 | 15 |
| 11 kW | 21 | 26 |
| 22 kW | 0 | 2 |
| Total | 33 | 43 |
For S.3, the combination of PVs and Batteries using the Zero Load control strategy seems to work well in the winter when the limited sunlight provides just enough energy to cover the Base Appliance demand over a day. As seen in
Figure 13, the net load at the example Residential Consumer is kept stable at zero except for a small occurrence during the night of 8 January, where the battery is depleted. However, during the summer week, the Battery agent is very under-dimensioned compared to the PV and cannot absorb the electricity generation during the day due to being at a SoC of 100% almost all of the time. To properly keep the net load at zero in this case, the Battery agent should be larger, or there should be additional loads that the battery can discharge to outside sunlight hours, for instance from an EV.
7. Framework Discussion
This section evaluates the proposed framework and discusses and recommends future work for improvements.
7.1. Framework Evaluation and Challenges
There are a few aspects that are relevant to discuss when evaluating the proposed framework and the use of ABS, particularly regarding the feasibility of the framework and simulation methodology:
A crucial aspect when evaluating the framework and when discussing the simulation, in general, is the wall clock time that elapses when running an experiment. As shown in
Table 8, all of the simulation experiments took between 9 to 12 h to finish. While this is feasible, although time-consuming, a challenge might occur with systems where there are far more Residential Consumer agents, Electricity Distribution Grid Module agents, and DER agents (including additional types). There might be multiple ways to solve this challenge, a notable one being the use of multithreading. Unfortunately, this is not supported by AnyLogic (however, separate simulation experiments can run simultaneously on multiple cores), so alternative solutions might be necessary if bigger and more complex systems are to be simulated.
Table 8.
Summary of simulation performance indicator values for the scenarios and case studies.
Table 8.
Summary of simulation performance indicator values for the scenarios and case studies.
| Case Study | Scenario | Simulation Time [s] | Simulation Steps | Output Data Fields |
|---|
| Case 1 | S.1 | 37,142 | 452,078,633 | 362,926,200 |
| S.2A | 34,052 | 453,639,582 | 460,758,480 |
| S.2B | 37,203 | 465,525,660 | 661,156,860 |
| S.3 | 36,523 | 454,025,600 | 563,324,580 |
| Case 2 | S.1 | 39,857 | 586,059,619 | 471,804,060 |
| S.2A | 40,549 | 589,082,500 | 596,461,320 |
| S.2B | 41,655 | 604,969,996 | 850,509,660 |
| S.3 | 40,935 | 589,864,780 | 725,852,400 |
The agents in the Electricity Distribution Grid module all act as power transporters, with power flows being propagated through chains of components in the grid from an electricity appliance that changes its load/generation rate to the top-level Transformer agent. This solution is simple, flexible, and intuitive. However, its drawback is the need for actions to be executed by numerous agents each time a single electric appliance changes its power flow. If there are hundreds of appliances, the amount of necessary processing becomes extensive, and if some of them change their power flow frequently, e.g., every second, the simulation performance might become very slow. A solution to this issue might be to combine power flow change signals for multiple agents that change their power flow at exactly the same time, hence reducing the number of power flow signals that propagate through the grid components.
Currently, the power flows for all DER agents and all agents in the Electricity Distribution Grid module are measured once per 10 min. of simulation time, causing the large amount of data fields denoted in
Table 8 that must be stored in memory until the simulation ends. For these experiments, the memory requirement has been in the range of 250–300 GB. However, if less-detailed data are needed for further analysis, the frequency can be decreased, hence reducing the memory requirements. Alternatively, output data can be continuously printed to output spreadsheets; however, this might increase the simulation time significantly.
AnyLogic comes with system dynamics modeling features. Currently, these are used for charging EVs and batteries. Decreasing the solver time step accuracy might decrease the number of simulation steps (given in
Table 8); however, this is at the expense of equation-solving accuracy. Alternative solutions, e.g., charging in discrete “blocks” added to/subtracted from the SoC, might be used instead of the system dynamics features, potentially speeding up the simulation performance significantly.
The feature from the DERInGrid framework used to automatically establish radial grid topologies in the simulation provides a few advantages. Firstly, this approach provides some user-friendliness and enables an actor, particularly a DSO, who has limited knowledge regarding the technical setup of the simulation, to run simulations on different sub-grids; they just provide different input lists of grid components for each case and type in the name of the spreadsheet files as an input parameter before running the experiments.Another particular advantage of the auto-generation feature is that it enables testing of different grid topology configurations without having to modify the simulation itself, only the input list of components. For instance, investigating the implications of a new future cable being installed between two nodes (possibly replacing another cable to retain the radial topology), simply requires that the cable is added as an entry in the input spreadsheet. AnyLogic supports running multiple simulation experiments simultaneously, and hence it is possible to quickly prepare and subsequently compare simulations of multiple case systems and scenarios with modified topologies. The approach is expected to be applicable to electricity grids on a larger scale, i.e., where the topology is extended to include the transmission part of the grid; while there might be additional types of components, requiring additional agent types, the graph-like structure with nodes and lines is still present. On a further note, the structure found within other infrastructure sectors, e.g., district heating or water supply, might also be presented as nodes and lines in a grid structure, and hence the auto-generation feature might be applicable to such systems as well. Extending the DERInGrid framework to include these sectors, possibly in conjunction with the electricity sector, is a topic for further study.
On another note, the framework interface approach might solve that by adding interfaces that relate to certain DER characteristics relevant to EMS control strategies and which determine which control strategies can be used with which DER technologies. However, this comes with the risk of an unnecessarily complex hierarchy of interfaces that extend each other, and an alternative solution might be better in this case.
7.2. Potential Extensions and Necessary Improvements
The developed framework is still in an early stage of development, and there is need for multiple for improvements and especially extensions for future work. A few examples are provided below.
Electricity price signals used by the EMS for control have deliberately been omitted from the control strategies in this work since the aim has been to achieve a stable load power flow from a load/generation perspective rather than the consumers reducing their electricity bills. However, since the monetary aspect is important from a consumer perspective regarding when to invest in electricity storage and an EMS, future control strategies should include electricity price signals as a decision parameter.
Another angle that would be important to consider when investigating the possibility of load reduction is whether a centralized EMS would perform better when aiming to reduce loads at a grid transformer level, possibly in combination with the decentralized EMS discussed in this paper. Extending the EMS with more control strategies, and in particular strategies that employ optimization in combination with demand, price, and weather prediction, possibly based on machine learning approaches, will be of interest when considering possible methods to reduce or postpone grid overloads, and will, furthermore, reflect the current development in real EMSs.
A crucial limitation to the current work, and a future task that should be prioritized, is the lack of real-time communication with physical entities. While DT is a relatively new and broad subject [
4], a defining property is the use of communication between a physical entity and its virtual representation, continuously updating the virtual representation with data on the state of the physical entity. The work presented in this paper does not yet include this approach. An expected step for future work should then be to establish real-time communication with a number of DER entities. These DERs might either be physical or externally simulated entities; the latter might be preferable for developing and testing communication methods and protocols, since connecting and exchanging real-time data with numerous real DER entities might prove challenging at this state of the research.
Furthermore, the scenarios in this paper only include a limited number of DER technologies. More technologies, such as heat pumps, should be added in the future, and scenarios with different combinations of DERs should be conducted as well. While the interface approach should make it easier to integrate new DER agents into the already established framework, new DERs will also come with new characteristics that have not yet been or cannot be captured by commonalities between the DERs. For instance, heat pumps might be connected to the current electricity grid representation in the framework, but they also need to supply heat energy to fulfil a demand, and implementing this, either as a simple heat demand profile or a more complex building agent for space heating, might be a task which requires effort.
Finally, the focus of this paper is to discuss, test, and demonstrate the developed DERInGrid DT simulation framework. However, since the framework is considered a tool that can help decision-makers analyze possible future impacts in the electricity system, e.g., from DERs, the framework should be applied to a case where the impacts/responses (e.g., grid overloads) from certain stimuli (e.g., DER adoption) must be analyzed and used for practical purposes. For instance, a specific electricity distribution grid where a distribution system operator is interested in determining where and when overloads occur in the system if certain consumers adopt certain DERs. The operator can then use the results for planning and decision-making regarding grid reinforcement. In this regard, the framework must also be applicable for users without knowledge of the underlying simulation framework, and hence more work is needed to improve the understandability and user-friendliness of the DERInGrid framework.
8. Conclusions
The DT framework developed in this study has proven to be an effective tool for simulating the integration of DERs within electricity distribution grids. This paper proposes a framework, DERInGrid, for DT simulation. The framework is composed of four key modules—Distributed Energy Resource, the Electricity Distribution Grid, the Energy Management System, and the Electricity Consumer—and addresses the increased system complexity resulting from the transformation of consumers into prosumers.
The framework’s communication interface facilitates interactions among these modules, and it is flexible enough to accommodate various grid topologies and demand-side configurations. This flexibility allows for the exploration of various DER adoption rates and capacities, providing valuable insights for future grid planning and management.
The framework’s effectiveness was validated through case studies on two Danish distribution grids. These case studies incorporated scenarios with rooftop PV systems, batteries, and electric vehicles, considering different combinations of these technologies alongside hourly electricity pricing. The results demonstrated the framework’s ability to accurately depict the states of the grid, PV, EV, and battery systems with a 10 min resolution over periods ranging from a day to over a decade. It was found that the expected adoption of PVs and stationary batteries over a 15-year period, either separately or in conjunction, did not cause any overload occurrences. Contrarily, overload occurrences started happening after the adoption of 33 and 43 EVs in the two systems, respectively, signifying EVs as a risk factor in the operation of the future distribution grid.
The practical purpose of the framework is to enable DSOs to investigate and predict when and where overloads caused by future residential adoption of DERs will occur in the grid. Properly timing the grid reinforcements or implementing schemes to reduce peak power flows might enable large potential savings of expenditures for the operators. The insights provided by the simulation outputs might also be applicable to political decision makers to evaluate the consequences of certain policies in the energy sector.
A number of challenges were revealed as well, particularly regarding the simulation performance aspects such as memory usage and processing power and extensive wall clock times, requiring improvements to make the framework feasible for the simulation of larger and more complex systems.
In conclusion, the DT framework developed in this study offers a robust and flexible tool for simulating DERs within electricity distribution grids. It effectively addresses the challenges posed by the growing adoption of DERs and the transformation of consumers into prosumers. The framework’s successful validation underscores its potential as a valuable tool for future grid planning and management. As the adoption of DERs continues to grow, tools like this will become increasingly important in ensuring the stability and efficiency of our electricity distribution systems. As the state of development of the framework is still in an early phase, there is potential for future work, both regarding the addition of more DER technologies and energy management system control strategies, particularly ones that consider electricity prices as a decision parameter.


