
State of Health Estimation for Lithium-Ion Batteries with Deep Learning Approach and Direct Current Internal Resistance

Abstract
1. Introduction
2. Dataset
3. Health Feature Extraction Based on Ohm’s Law
3.1. SOH Definition
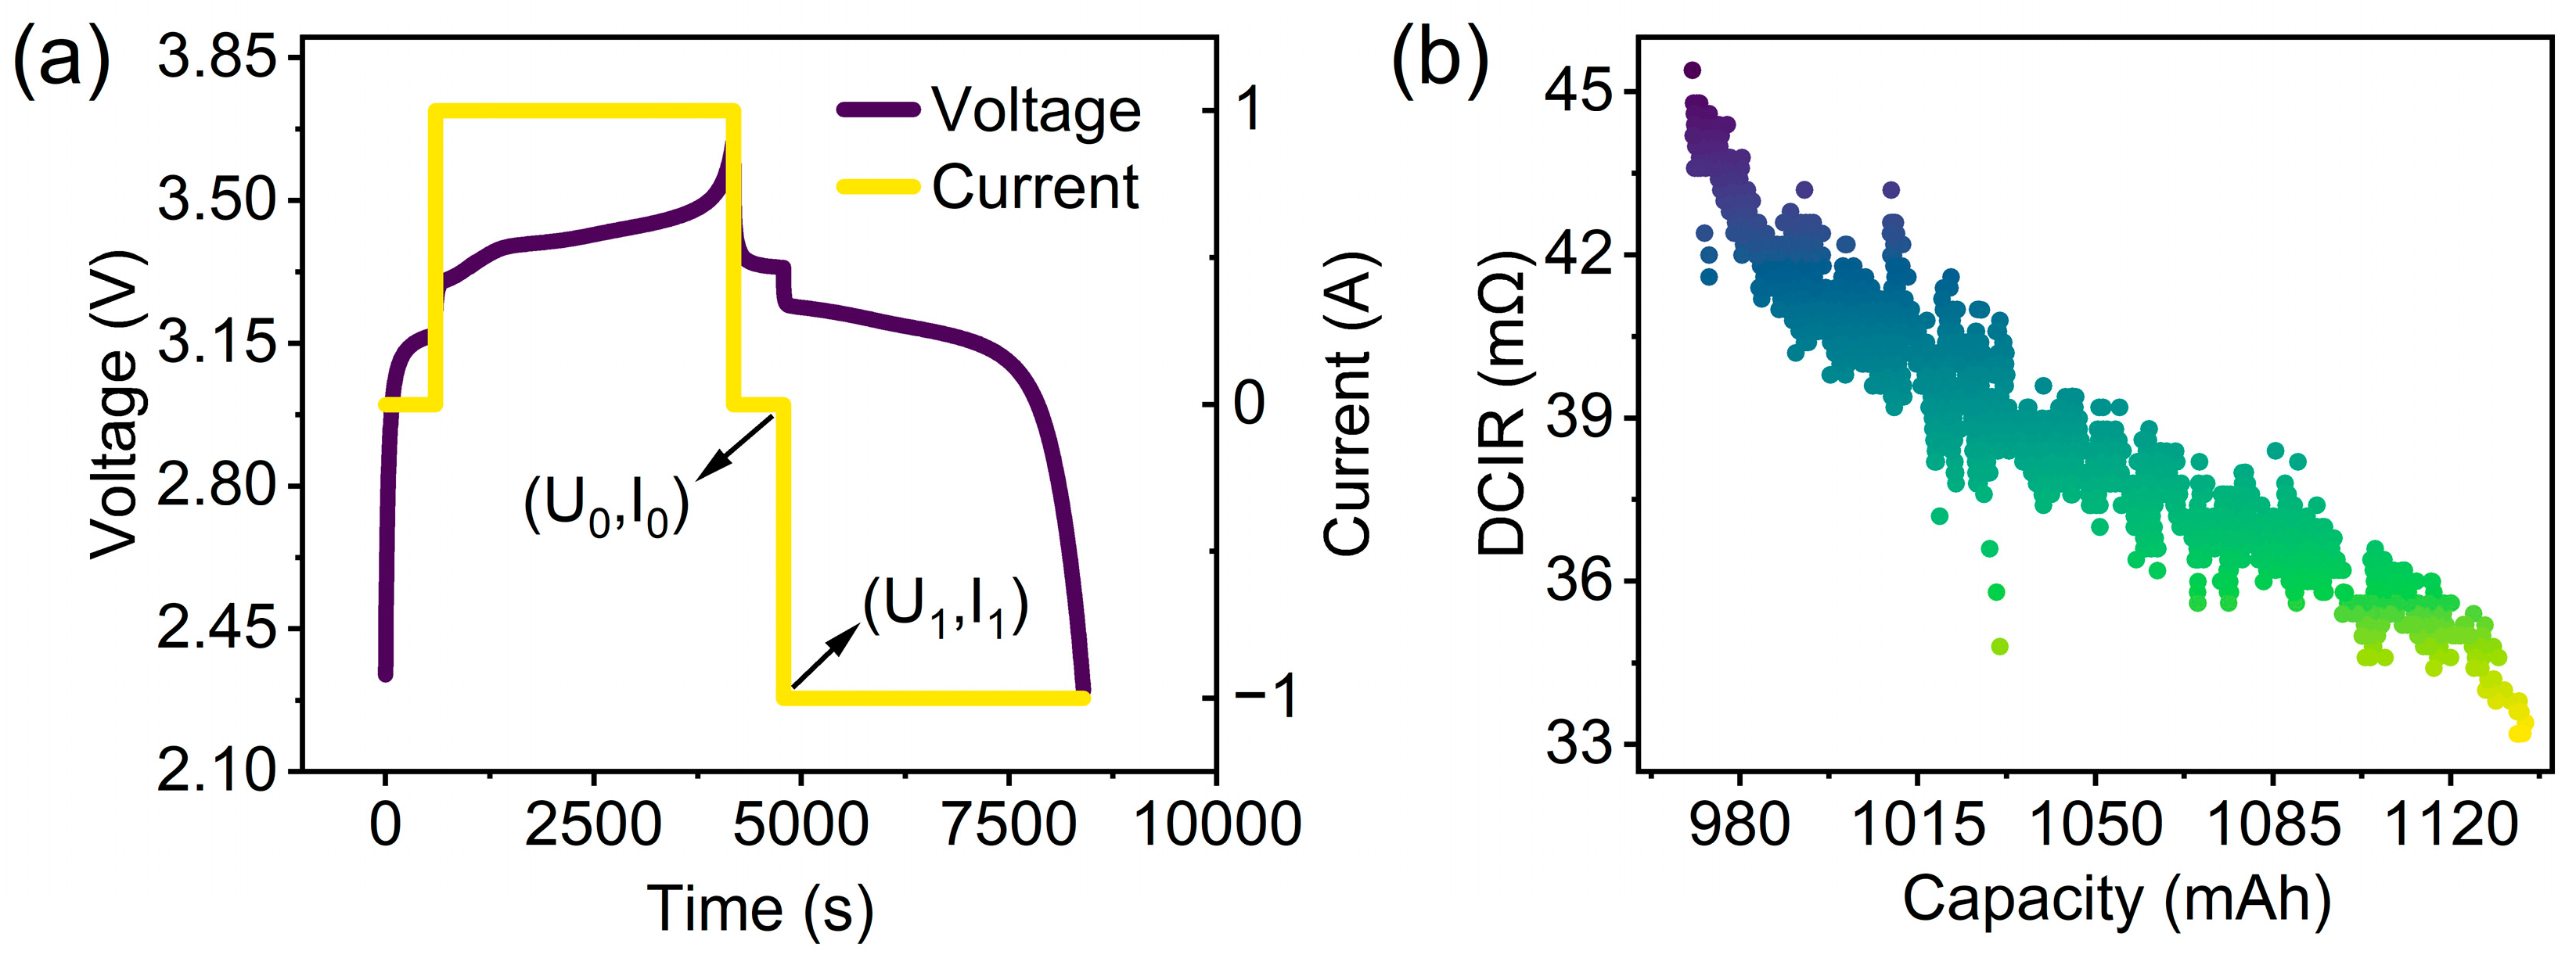
3.2. DCIR Feature
3.3. Feature Correlation Analysis
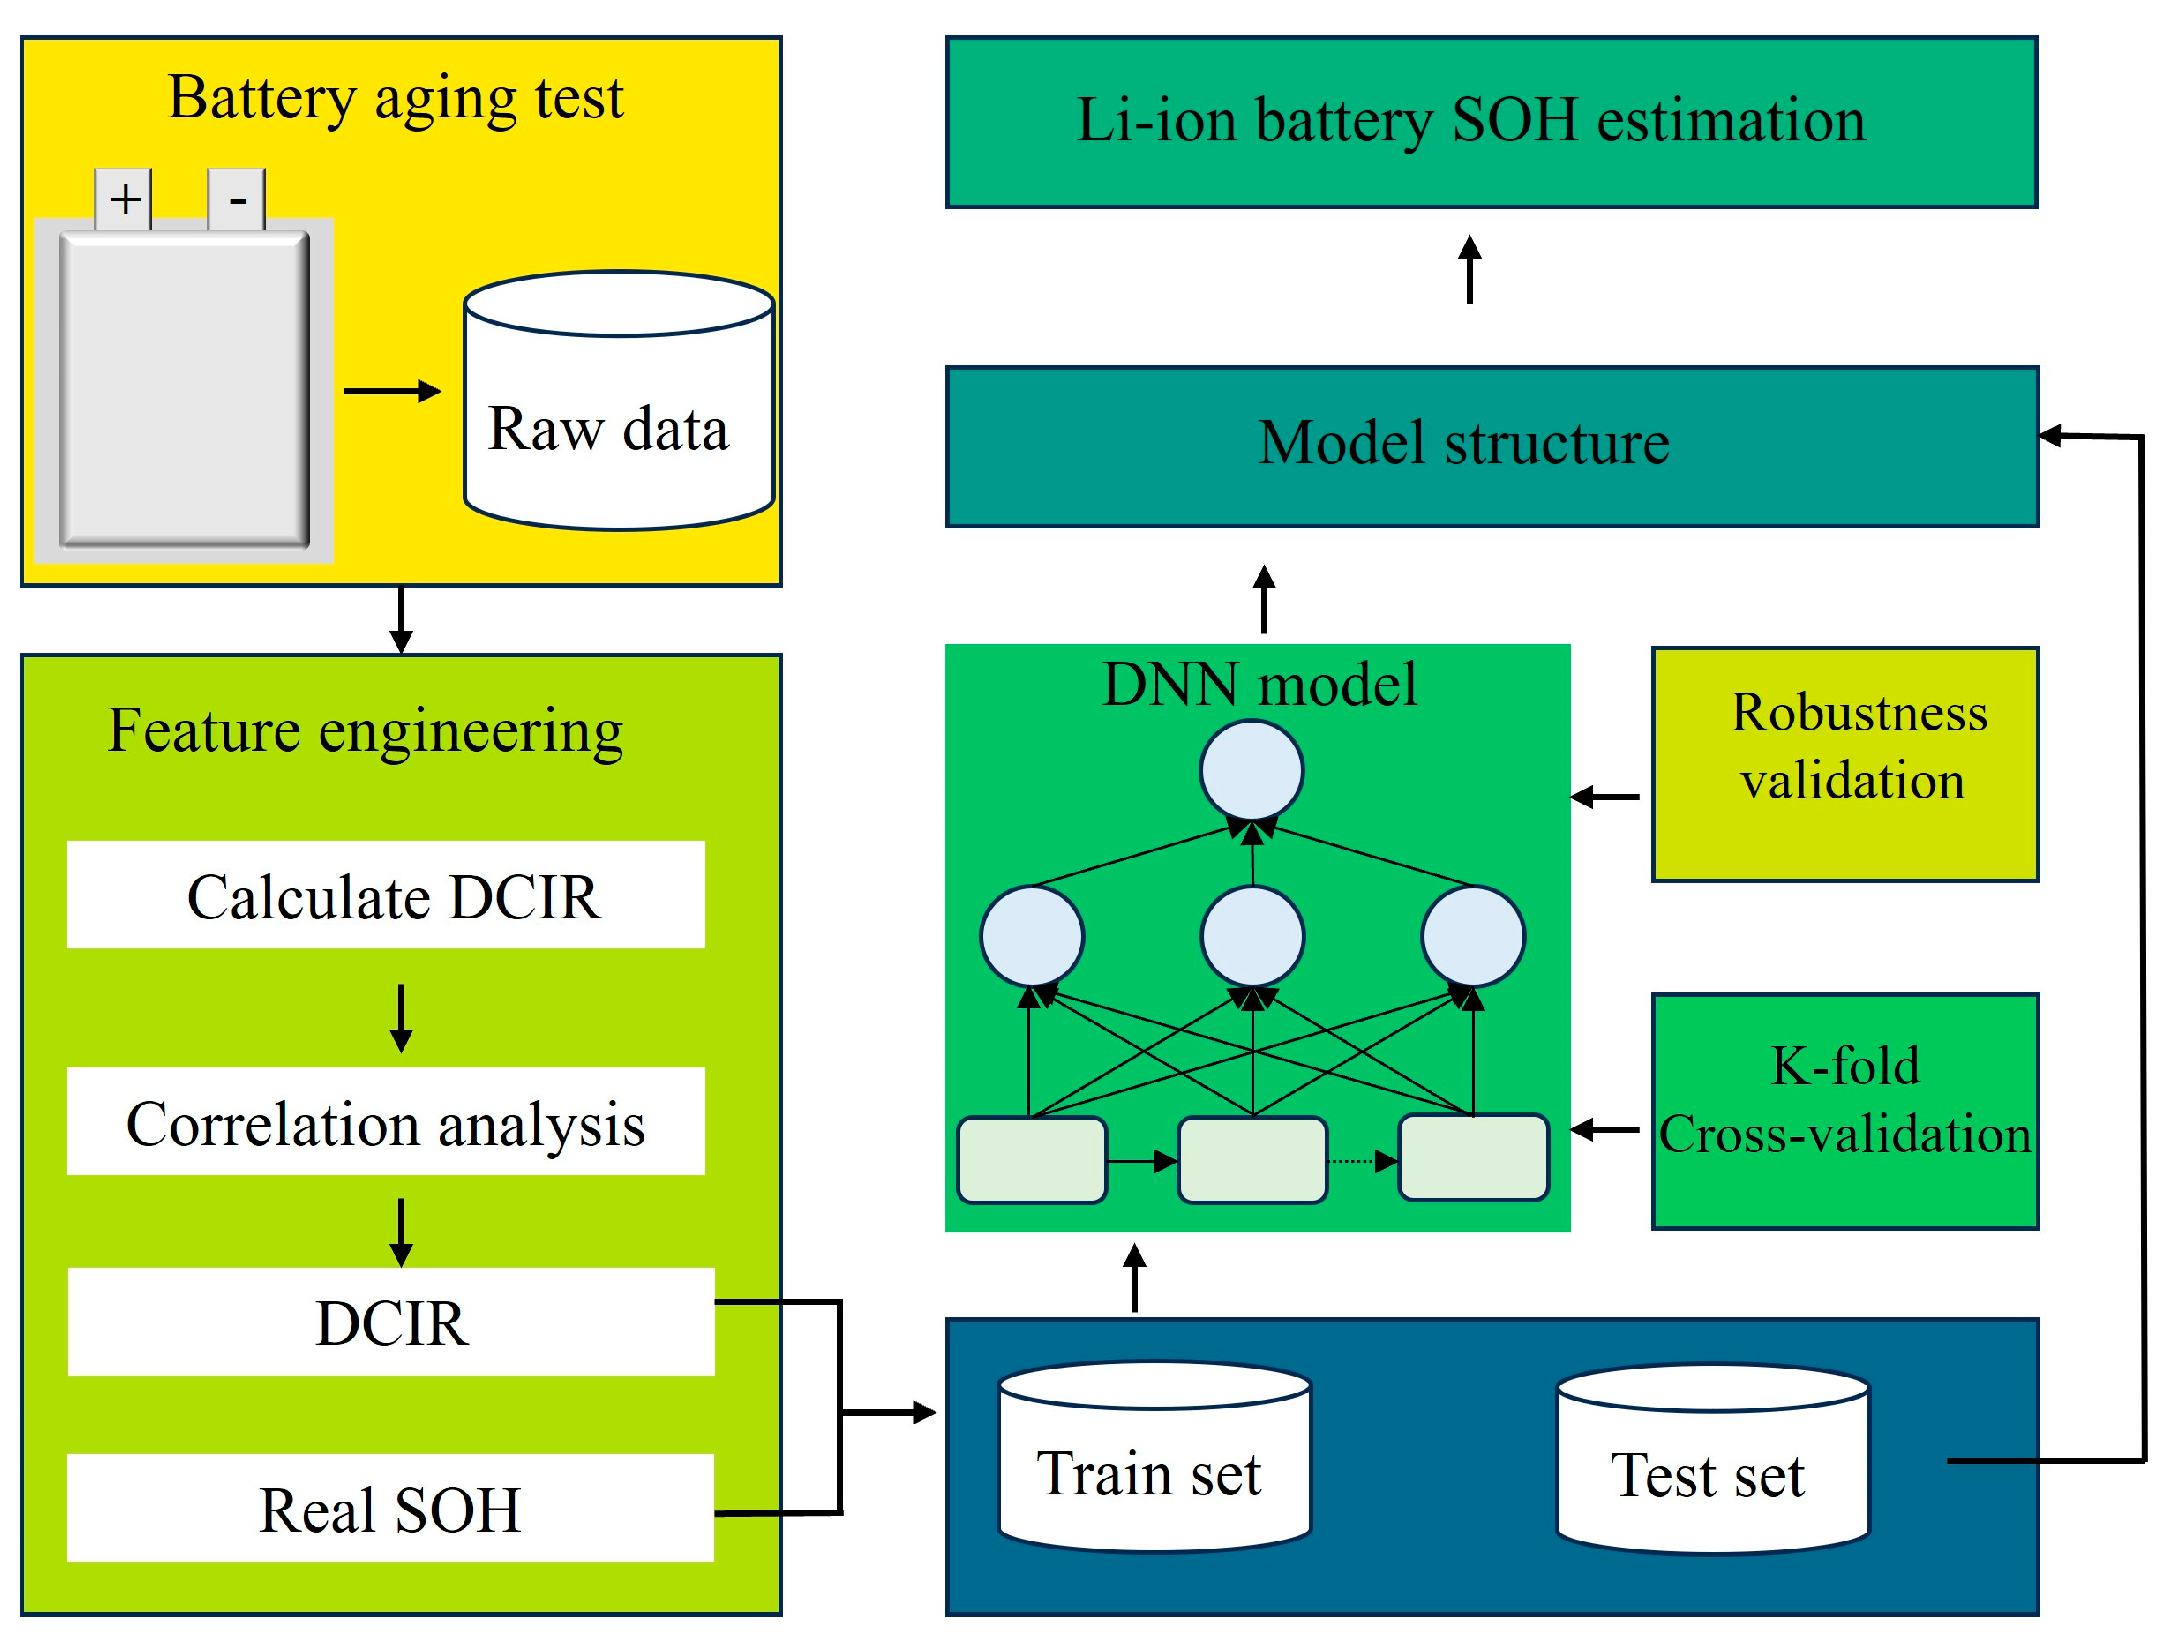
4. DNN-Based Model for Battery SOH Estimation
4.1. DNN Model Structure
4.2. Training of DNN
5. Results and Discussion
5.1. Model Evaluation Metrics
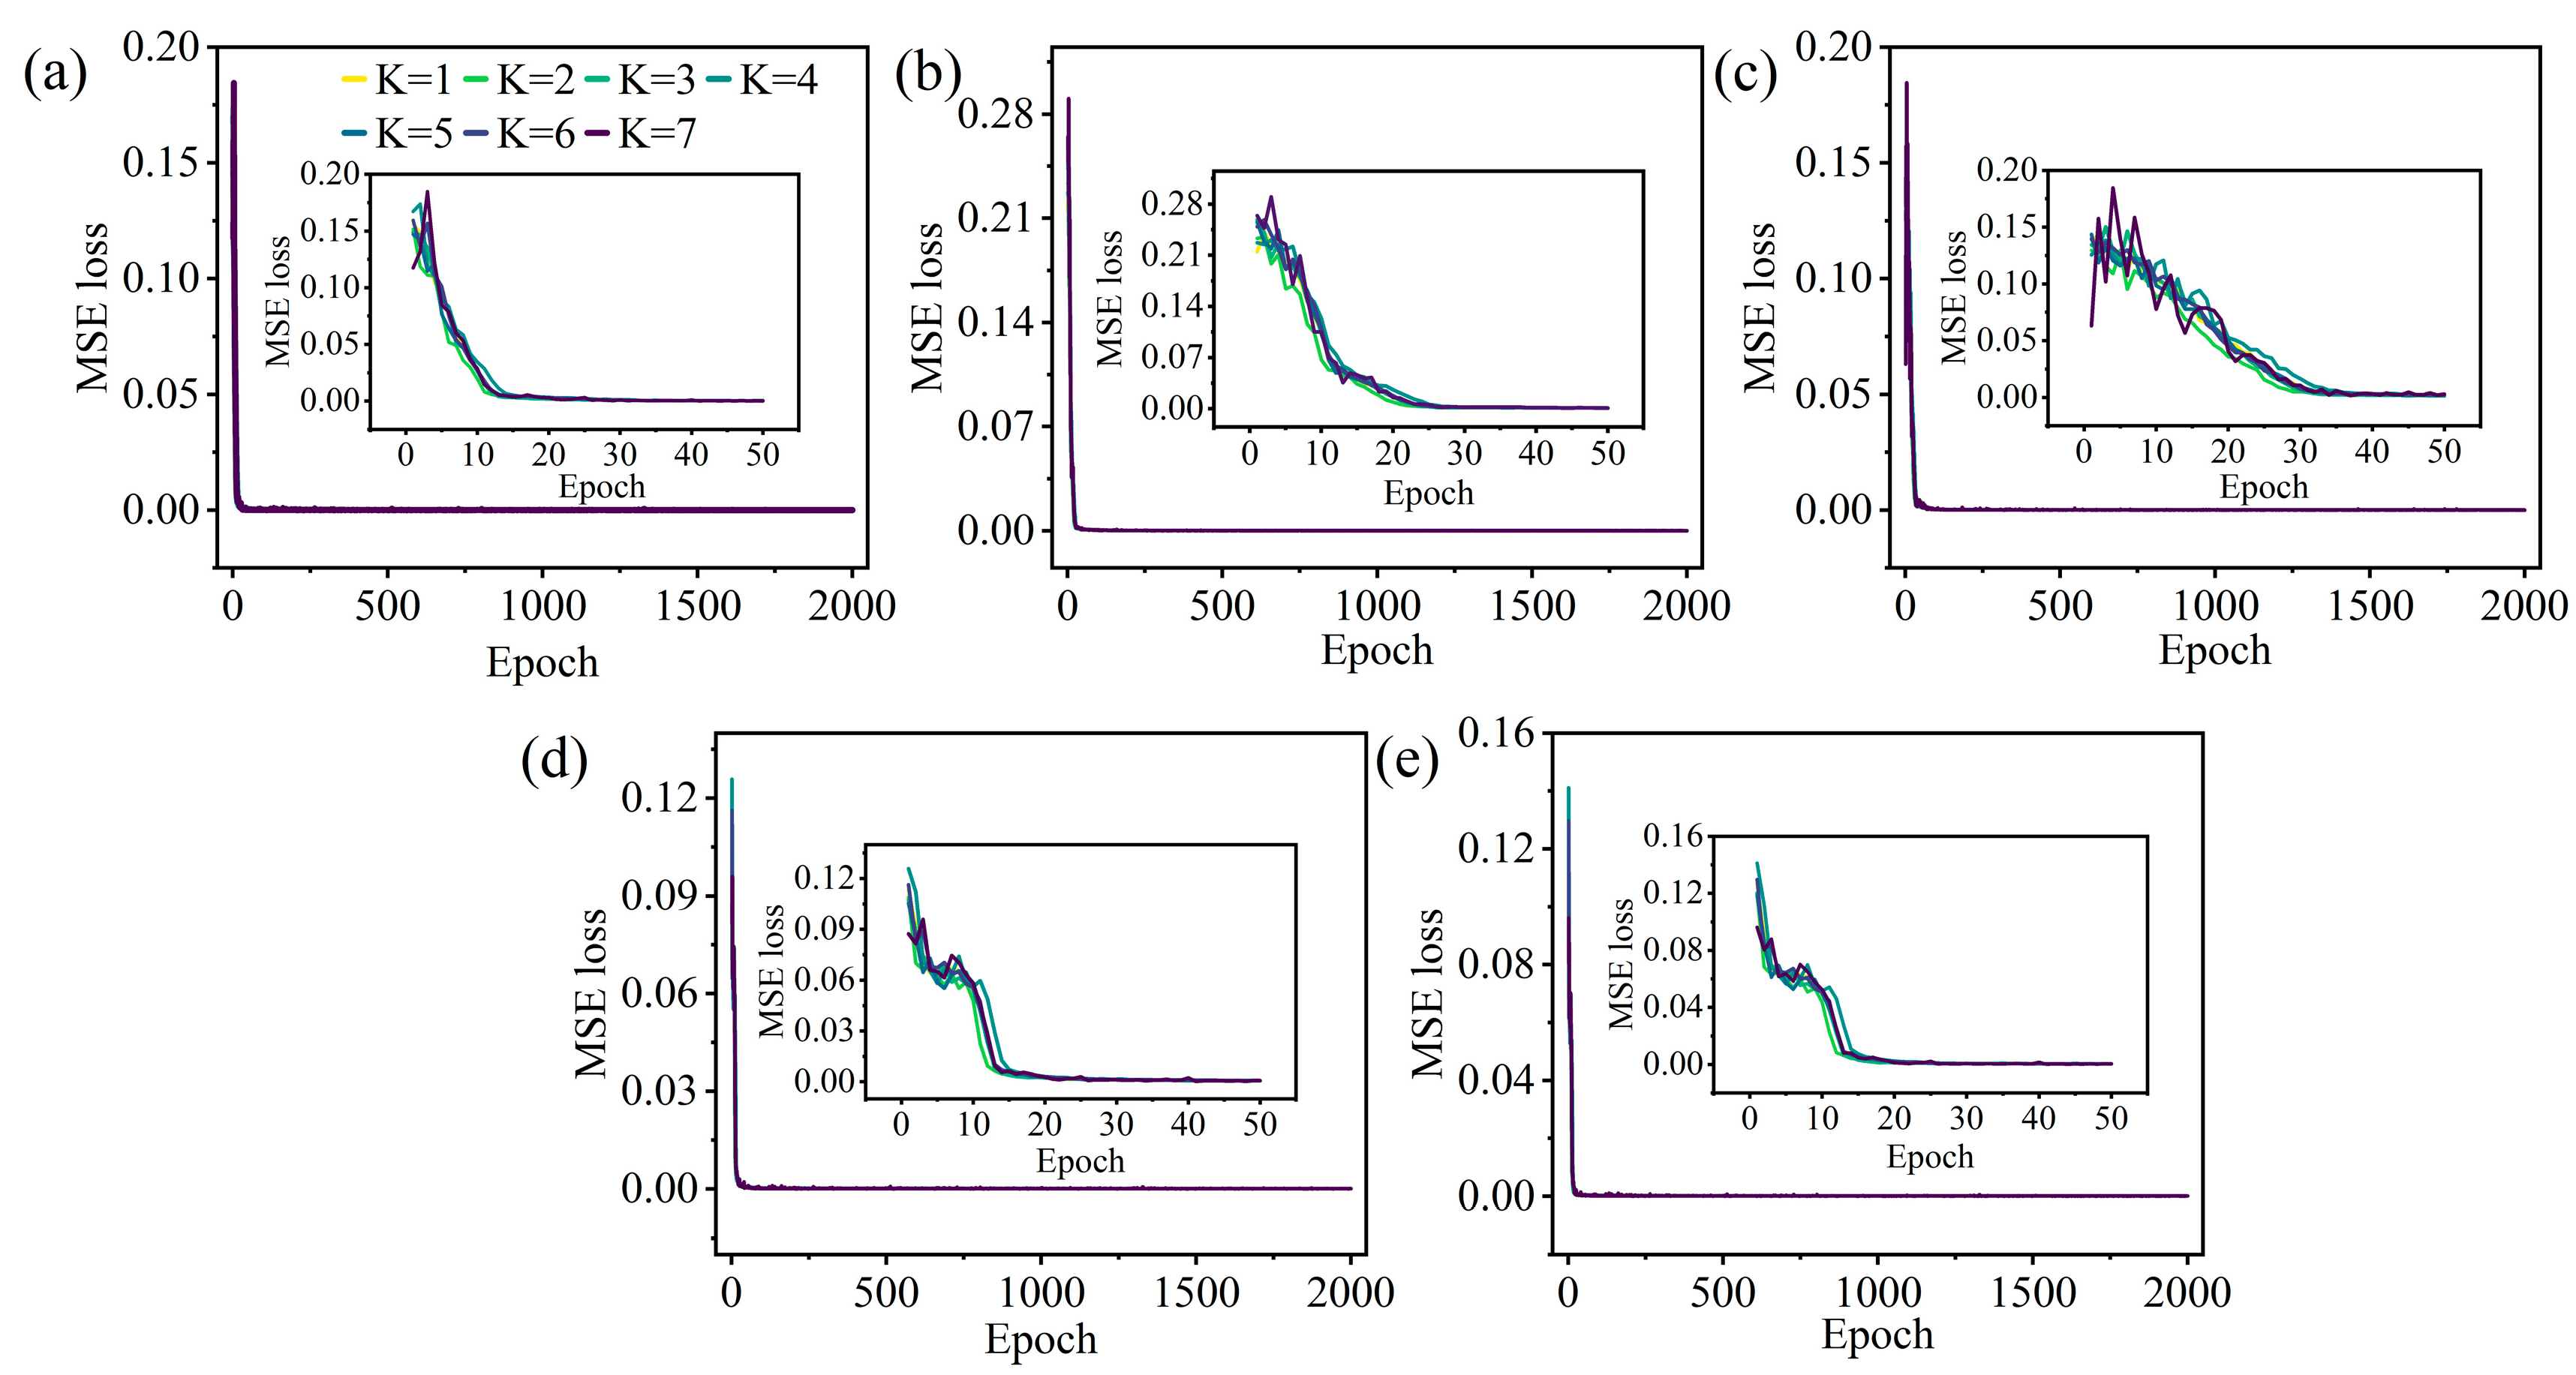
5.2. K-Fold Cross-Validation
5.2.1. Effects of Hyperparameter Settings on Estimation Performance
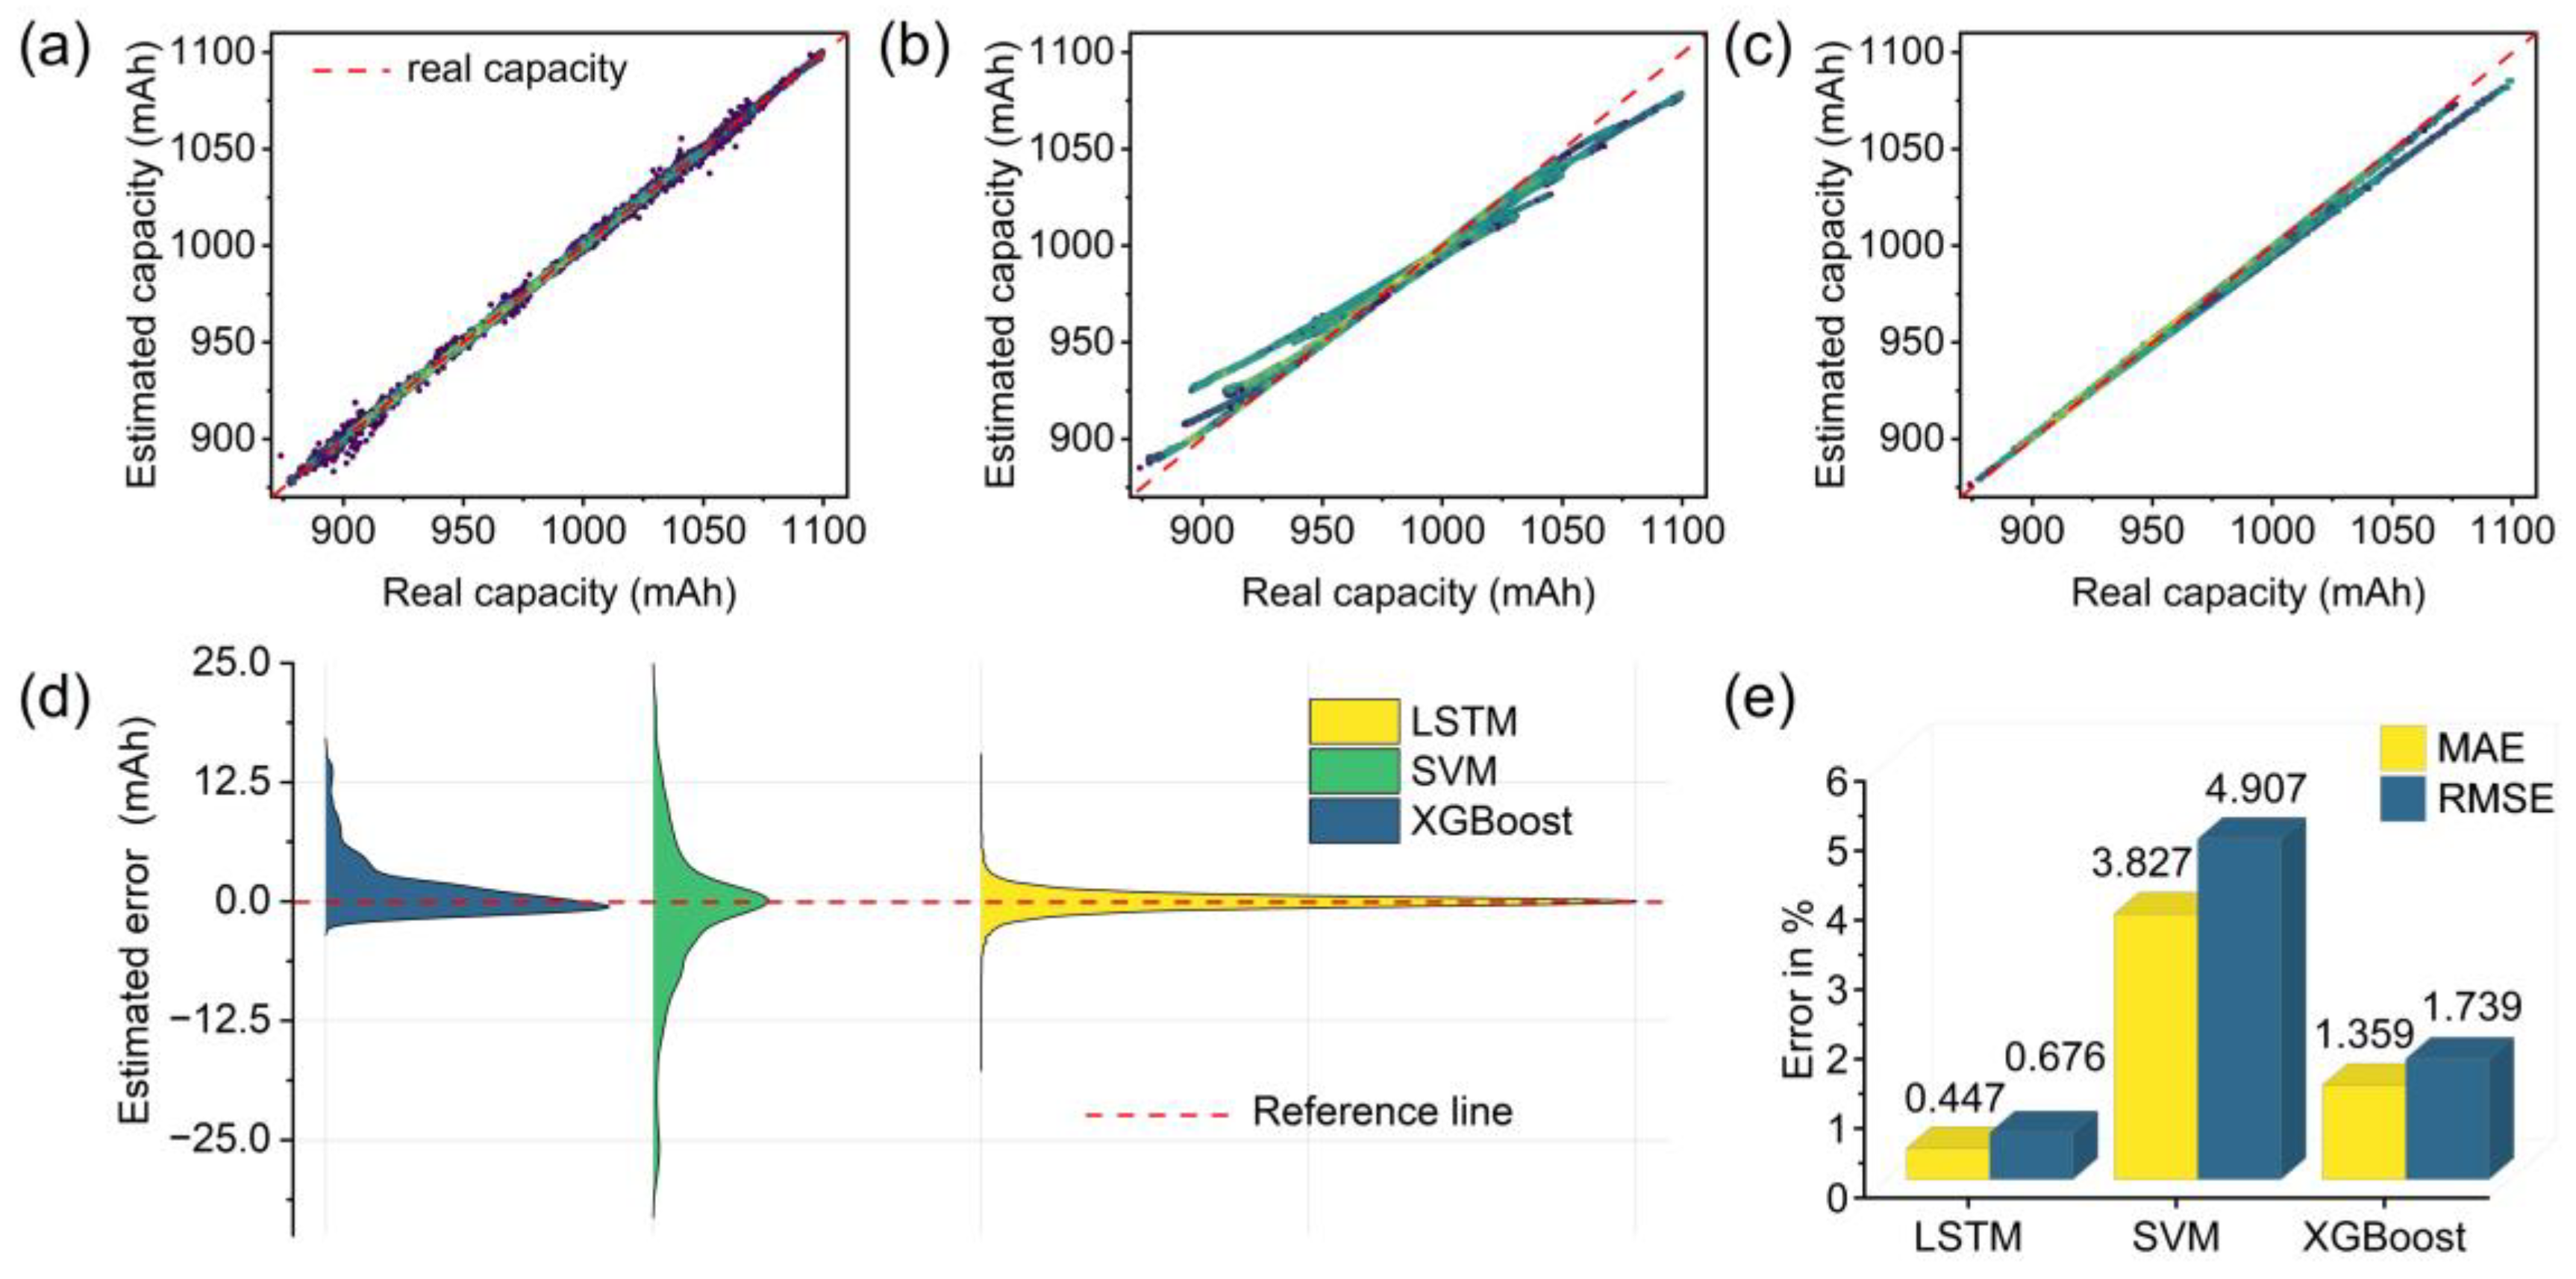
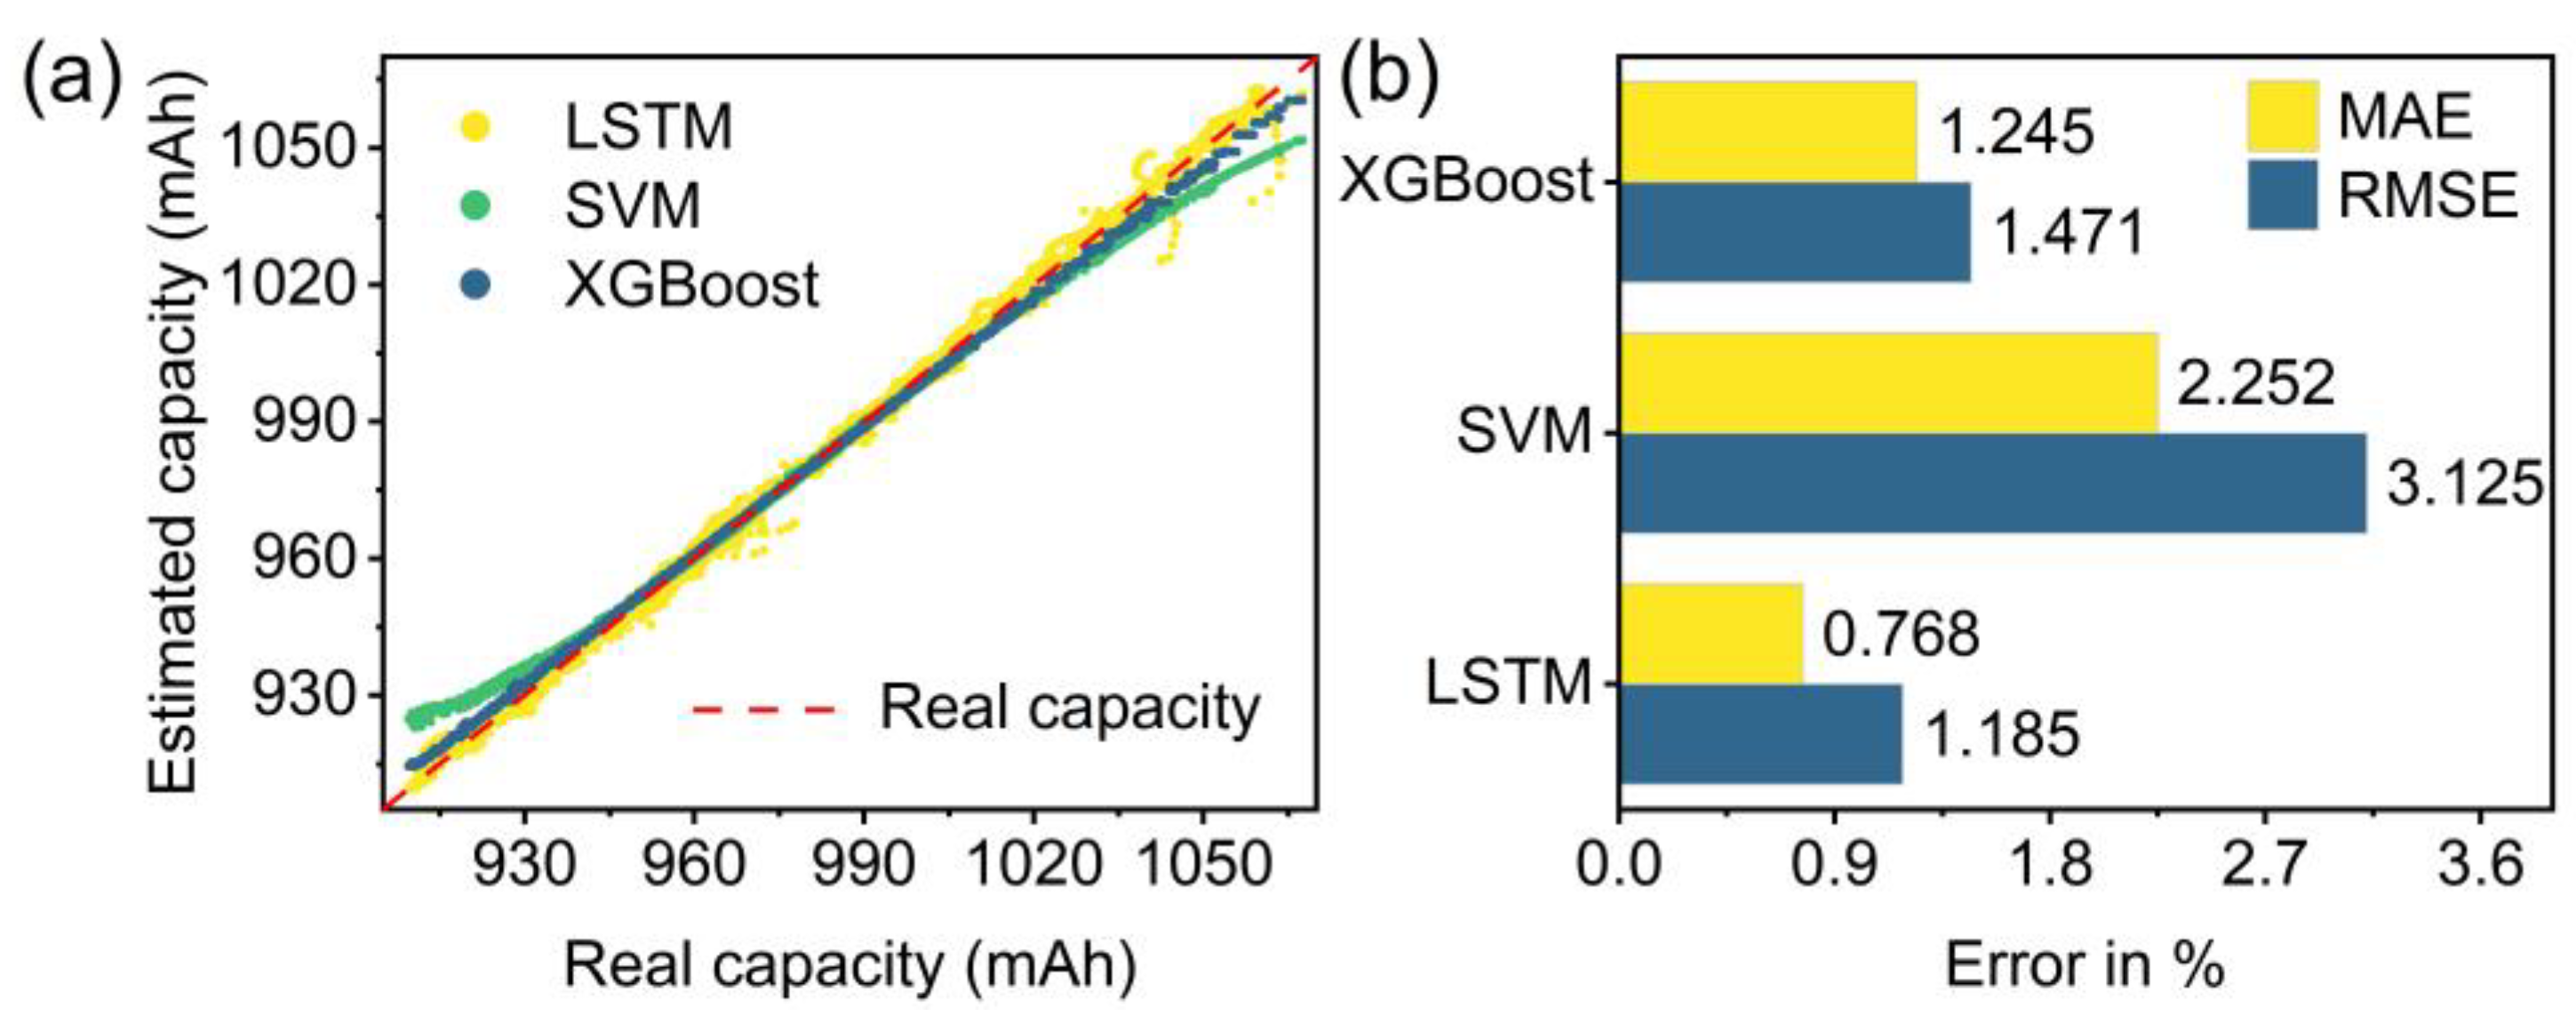
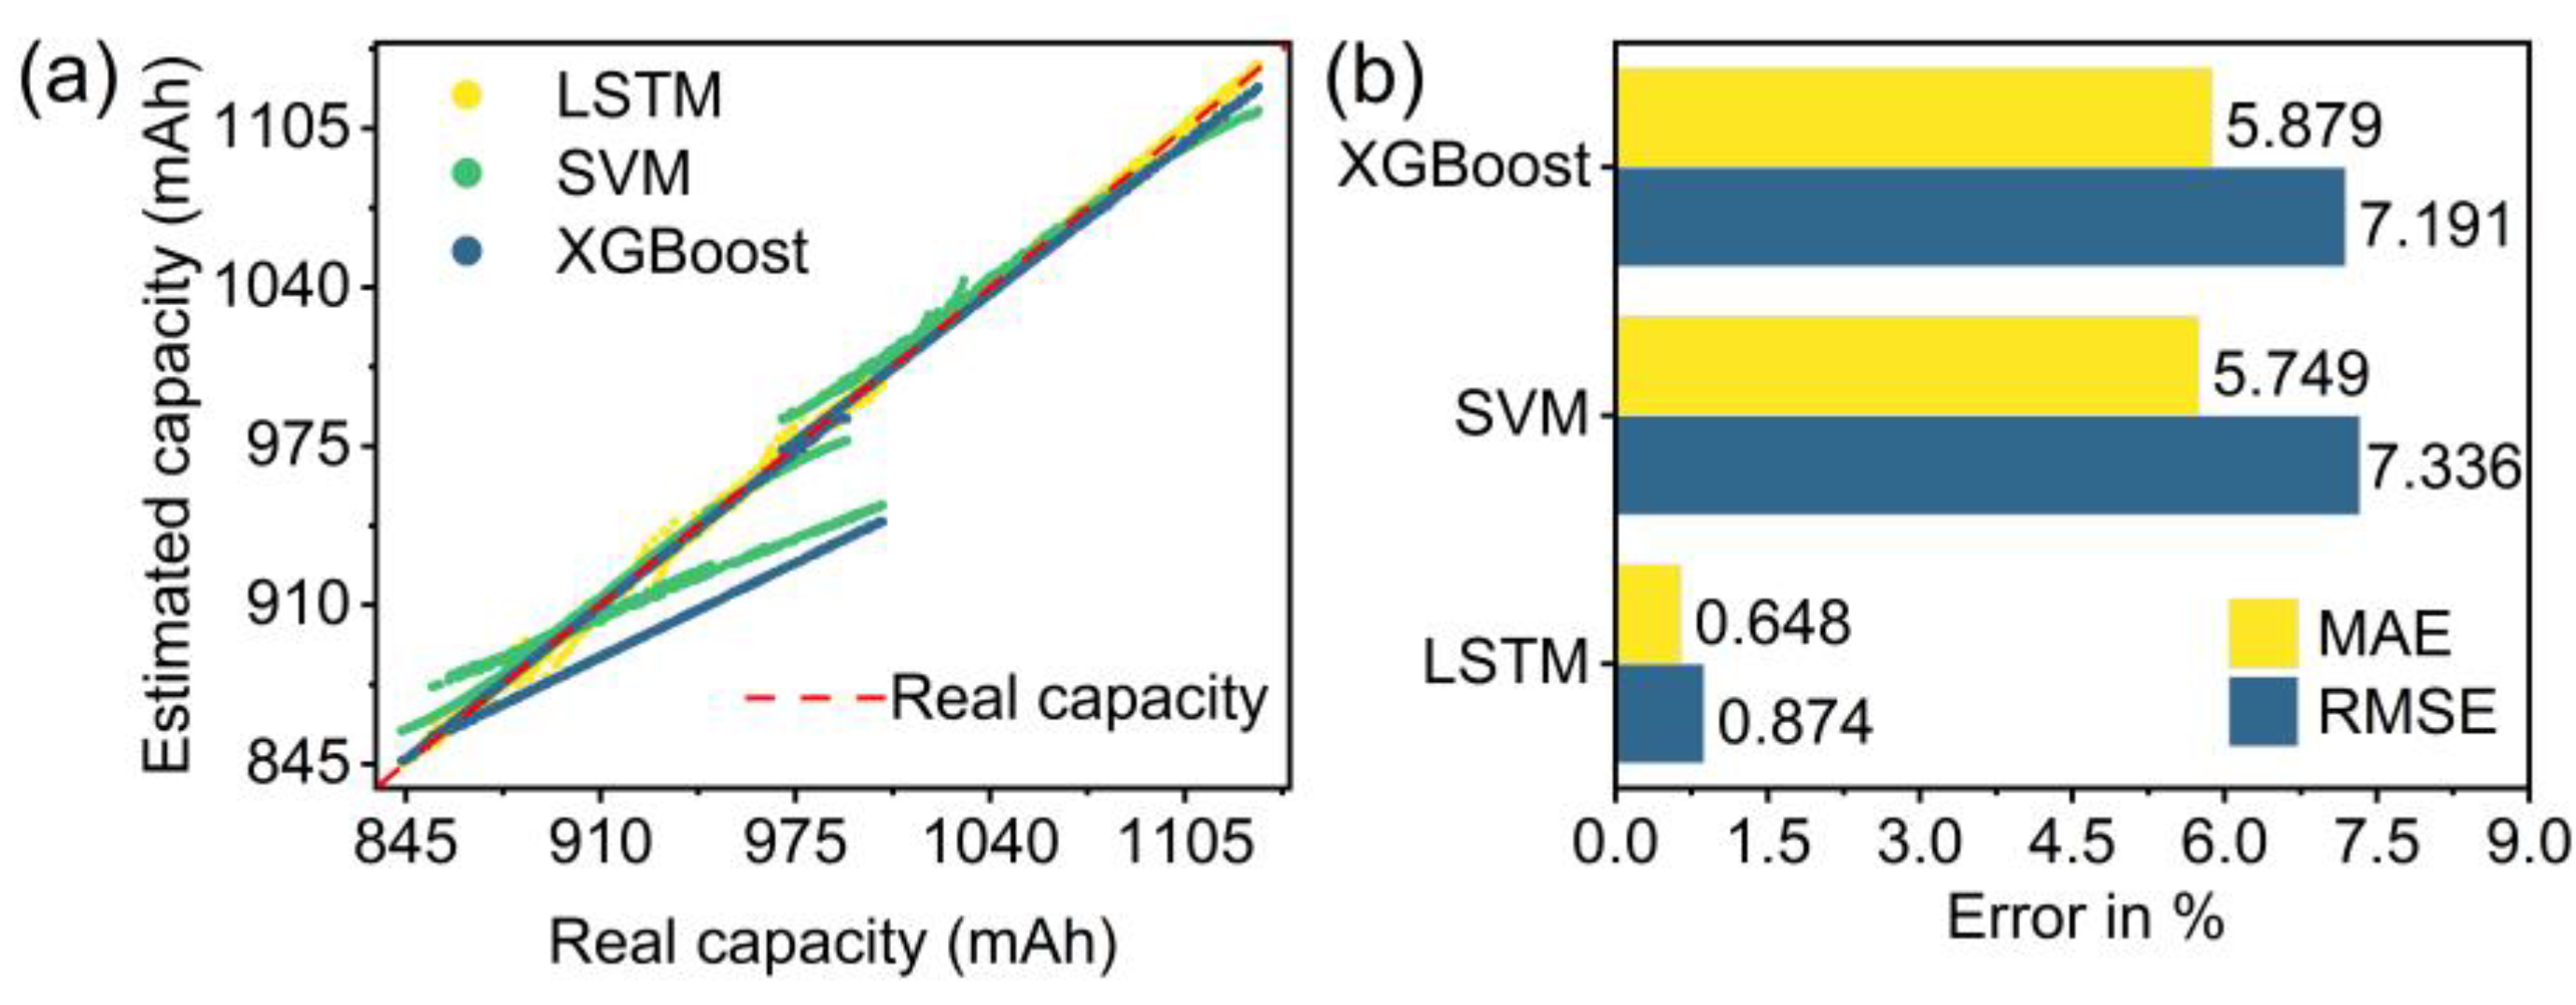
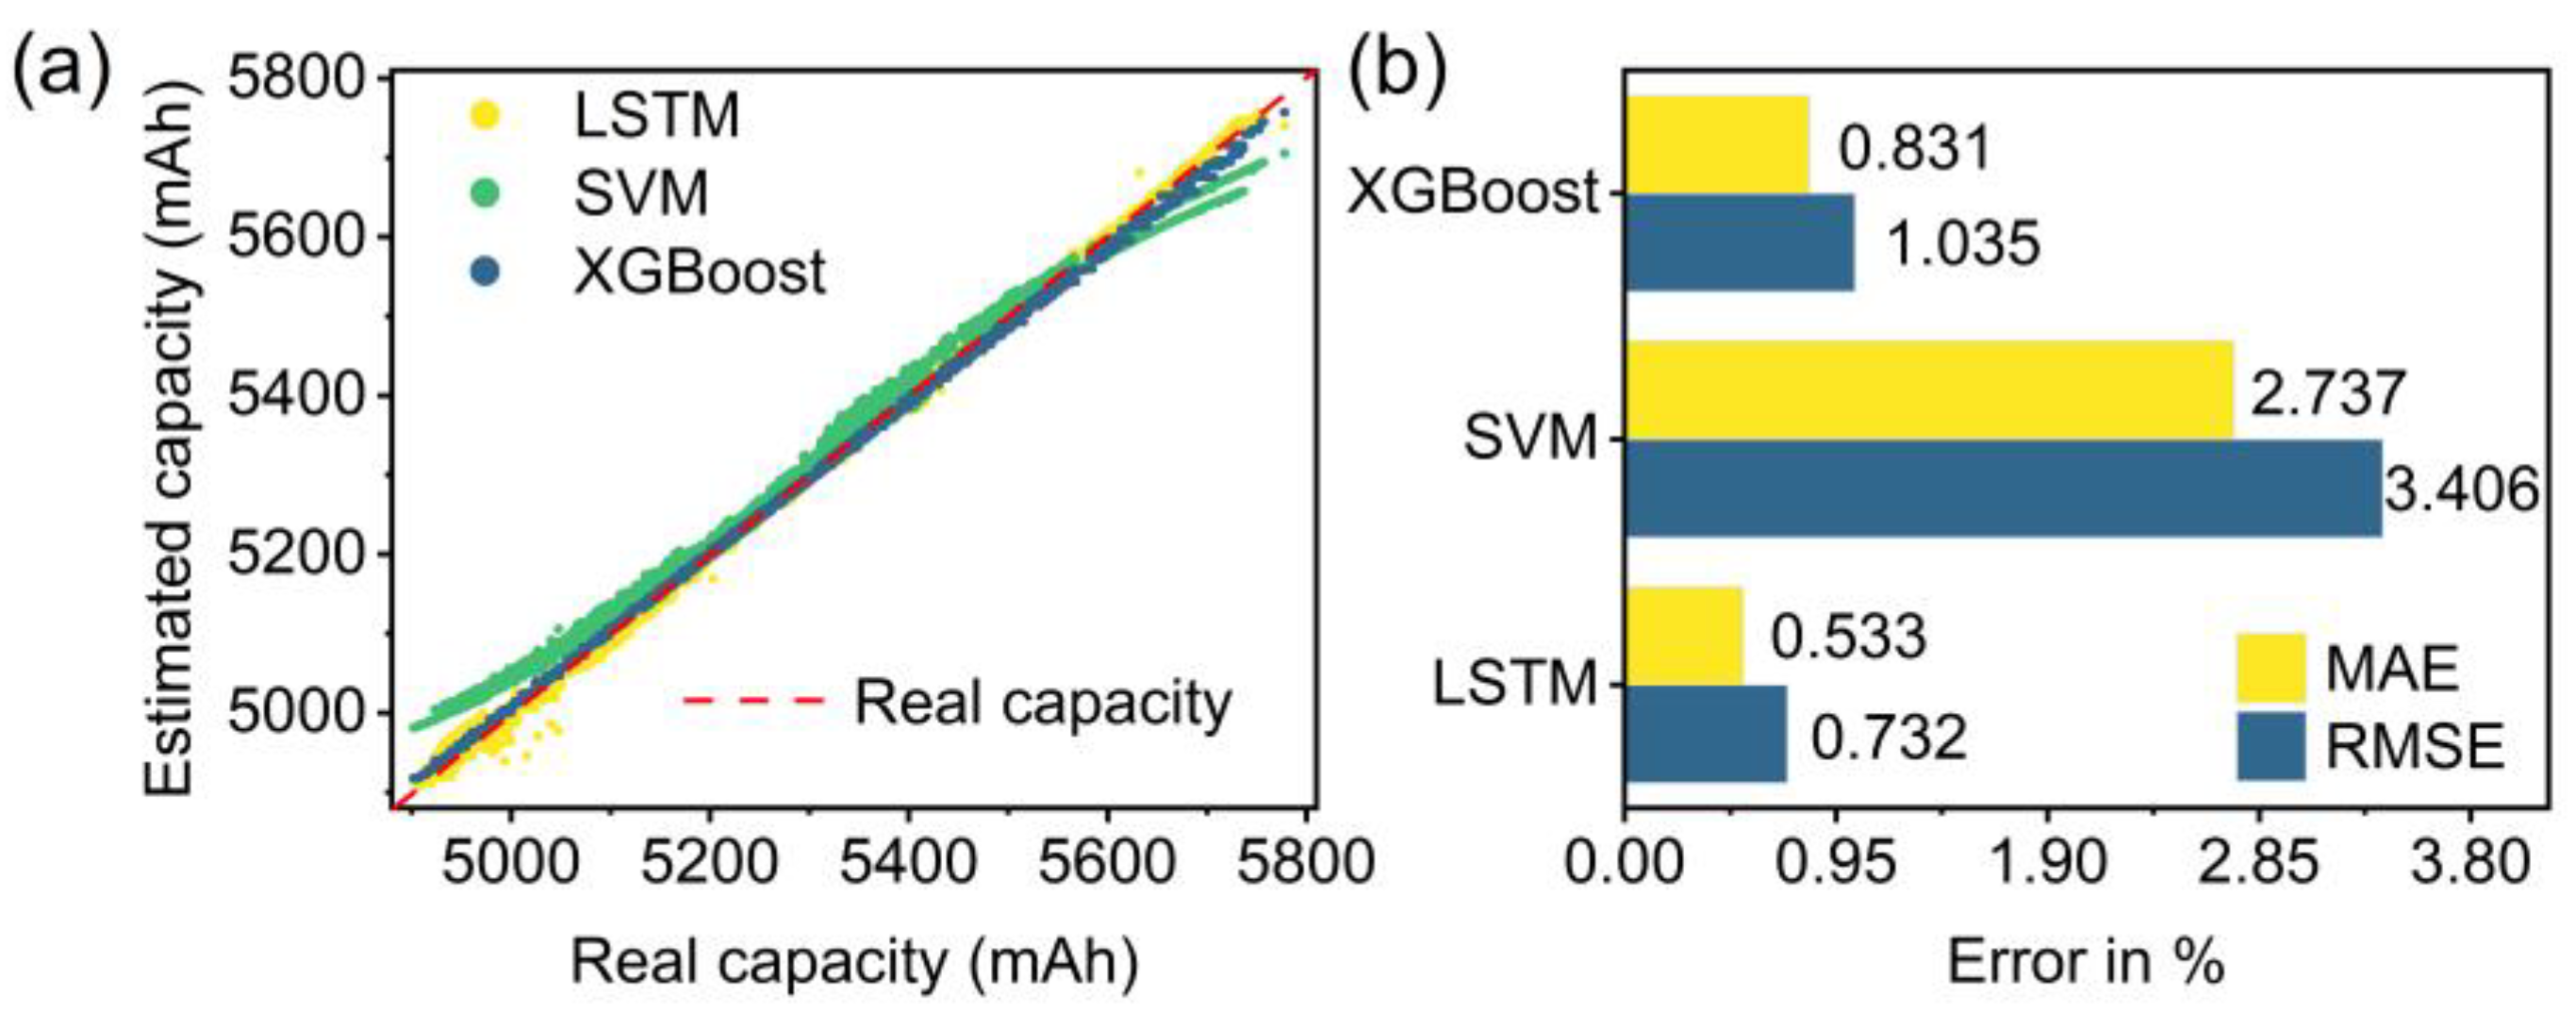
5.2.2. Comparison of DNN and Machine Learning Models
5.3. Robustness Validation
5.3.1. Validation of Cross-Temperature Change Condition
5.3.2. Validation of Cross-Charge and -Discharge Modes
5.3.3. Validation of Cross-Manufacturing Process
5.4. Comparison with Current Research Methods
5.5. Discussion and Outlook
6. Conclusions
Author Contributions
Funding
Data Availability Statement
Conflicts of Interest
Appendix A

Appendix B

| Test Set | Sigmoid | LogSigmoid | 32 | 64 | ||||
|---|---|---|---|---|---|---|---|---|
| MAE | MAE | MAE | RMSE | MAE | RMSE | MAE | RMSE | |
| B#1-1 | 0.497% | 0.646% | 0.527% | 0.676% | 0.395% | 0.520% | 0.347% | 0.458% |
| B#1-2 | 0.524% | 0.674% | 0.404% | 0.502% | 0.382% | 0.489% | 0.309% | 0.448% |
| B#1-3 | 0.733% | 1.061% | 0.264% | 0.415% | 1.258% | 1.939% | 0.520% | 0.769% |
| B#1-4 | 0.486% | 0.710% | 0.474% | 0.687% | 0.429% | 0.636% | 0.380% | 0.577% |
| B#1-5 | 0.941% | 1.469% | 0.889% | 1.364% | 0.800% | 1.263% | 0.757% | 1.217% |
| B#1-6 | 0.836% | 1.202% | 0.695% | 1.007% | 0.521% | 0.799% | 0.582% | 0.865% |
| B#1-7 | 0.907% | 1.400% | 0.813% | 1.241% | 0.698% | 1.080% | 0.713% | 1.095% |
| Experimental Section | Test Set | DNN | SVM | XGBoost | |||
|---|---|---|---|---|---|---|---|
| MAE | RMSE | MAE | RMSE | MAE | RMSE | ||
| 5.2.2 | B#1-1 | 0.294% | 0.383% | 4.869% | 5.982% | 3.767% | 4.738% |
| B#1-2 | 0.264% | 0.386% | 2.797% | 3.837% | 0.831% | 1.085% | |
| B#1-3 | 0.275% | 0.395% | 10.028% | 11.532% | 2.025% | 2.704% | |
| B#1-4 | 0.416% | 0.617% | 2.149% | 3.169% | 0.612% | 0.747% | |
| B#1-5 | 0.661% | 1.100% | 2.560% | 3.707% | 0.678% | 0.814% | |
| B#1-6 | 0.521% | 0.789% | 1.995% | 2.818% | 0.598% | 0.700% | |
| B#1-7 | 0.696% | 1.061% | 2.388% | 3.299% | 1.000% | 1.382% | |
| 5.3.1 | B#1-4 | 0.703% | 1.073% | 2.297% | 3.253% | 1.249% | 1.506% |
| B#1-6 | 0.833% | 1.295% | 2.207% | 2.996% | 1.241% | 1.437% | |
| 5.3.2 | B#2-1 | 0.385% | 0.506% | 3.674% | 4.475% | 1.602% | 2.062% |
| B#2-2 | 0.725% | 1.050% | 3.023% | 3.649% | 0.708% | 0.877% | |
| B#2-3 | 0.835% | 1.066% | 10.549% | 13.883% | 15.327% | 18.633% | |
| 5.3.3 | B#3-1 | 0.484% | 0.623% | 3.098% | 3.640% | 0.642% | 0.777% |
| B#3-2 | 0.581% | 0.842% | 2.376% | 3.172% | 1.020% | 1.294% | |
References
- Bresser, D.; Hosoi, K.; Howell, D.; Li, H.; Zeisel, H.; Amine, K.; Passerini, S. Perspectives of Automotive Battery R&D in China, Germany, Japan, and the USA. J. Power Sources 2018, 382, 176–178. [Google Scholar]
- Stallard, J.C.; Wheatcroft, L.; Booth, S.G.; Boston, R.; Corr, S.A.; De Volder, M.F.L.; Inkson, B.J.; Fleck, N.A. Mechanical Properties of Cathode Materials for Lithium-Ion Batteries. Joule 2022, 6, 984–1007. [Google Scholar] [CrossRef]
- Bila, M.; Opathella, C.; Venkatesh, B. Grid Connected Performance of a Household Lithium-Ion Battery Energy Storage System. J. Energy Storage 2016, 6, 178–185. [Google Scholar] [CrossRef]
- Bharathraj, S.; Adiga, S.P.; Patil, R.S.; Mayya, K.S.; Song, T.; Sung, Y. An Efficient and Chemistry Independent Analysis to Quantify Resistive and Capacitive Loss Contributions to Battery Degradation. Sci. Rep. 2019, 9, 6576. [Google Scholar] [CrossRef] [PubMed]
- Zhang, Q.; White, R.E. Capacity Fade Analysis of a Lithium Ion Cell. J. Power Sources 2008, 179, 793–798. [Google Scholar] [CrossRef]
- Birkl, C.R.; Roberts, M.R.; McTurk, E.; Bruce, P.G.; Howey, D.A. Degradation Diagnostics for Lithium Ion Cells. J. Power Sources 2017, 341, 373–386. [Google Scholar] [CrossRef]
- Vatanparvar, K.; Al Faruque, M.A. Electric Vehicle Optimized Charge and Drive Management. ACM Trans. Des. Autom. Electron. Syst. 2017, 23, 25. [Google Scholar] [CrossRef]
- Amir, S.; Gulzar, M.; Tarar, M.O.; Naqvi, I.H.; Zaffar, N.A.; Pecht, M.G. Dynamic Equivalent Circuit Model to Estimate State-of-Health of Lithium-Ion Batteries. IEEE Access 2022, 10, 18279–18288. [Google Scholar] [CrossRef]
- Topan, P.A.; Ramadan, M.N.; Fathoni, G.; Cahyadi, A.I.; Wahyunggoro, O. State of Charge (SOC) and State of Health (SOH) Estimation on Lithium Polymer Battery via Kalman Filter. In Proceedings of the 2016 2nd International Conference on Science and Technology-Computer (ICST), Yogyakarta, Indonesia, 27–28 October 2016; pp. 93–96. [Google Scholar]
- Liu, B.; Tang, X.; Gao, F. Joint Estimation of Battery State-of-Charge and State-of-Health Based on a Simplified Pseudo-Two-Dimensional Model. Electrochim. Acta 2020, 344, 136098. [Google Scholar] [CrossRef]
- Ng, M.F.; Zhao, J.; Yan, Q.; Conduit, G.J.; Seh, Z.W. Predicting the State of Charge and Health of Batteries Using Data-Driven Machine Learning. Nat. Mach. Intell. 2020, 2, 161–170. [Google Scholar] [CrossRef]
- Li, Y.; Liu, K.; Foley, A.M.; Zülke, A.; Berecibar, M.; Nanini-Maury, E.; Van Mierlo, J.; Hoster, H.E. Data-Driven Health Estimation and Lifetime Prediction of Lithium-Ion Batteries: A Review. Renew. Sustain. Energy Rev. 2019, 113, 109254. [Google Scholar] [CrossRef]
- Yang, D.; Zhang, X.; Pan, R.; Wang, Y.; Chen, Z. A Novel Gaussian Process Regression Model for State-of-Health Estimation of Lithium-Ion Battery Using Charging Curve. J. Power Sources 2018, 384, 387–395. [Google Scholar] [CrossRef]
- Li, X.; Yuan, C.; Li, X.; Wang, Z. State of Health Estimation for Li-Ion Battery Using Incremental Capacity Analysis and Gaussian Process Regression. Energy 2020, 190, 116467. [Google Scholar] [CrossRef]
- Yu, J. State of Health Prediction of Lithium-Ion Batteries: Multiscale Logic Regression and Gaussian Process Regression Ensemble. Reliab. Eng. Syst. Saf. 2018, 174, 82–95. [Google Scholar] [CrossRef]
- Feng, X.; Weng, C.; He, X.; Han, X.; Lu, L.; Ren, D.; Ouyang, M. Online State-of-Health Estimation for Li-Ion Battery Using Partial Charging Segment Based on Support Vector Machine. IEEE Trans. Veh. Technol. 2019, 68, 8583–8592. [Google Scholar] [CrossRef]
- Patil, M.A.; Tagade, P.; Hariharan, K.S.; Kolake, S.M.; Song, T.; Yeo, T.; Doo, S. A Novel Multistage Support Vector Machine Based Approach for Li Ion Battery Remaining Useful Life Estimation. Appl. Energy 2015, 159, 285–297. [Google Scholar] [CrossRef]
- Yang, D.; Wang, Y.; Pan, R.; Chen, R.; Chen, Z. State-of-Health Estimation for the Lithium-Ion Battery Based on Support Vector Regression. Appl. Energy 2018, 227, 273–283. [Google Scholar] [CrossRef]
- Gao, M.; Bao, Z.; Zhu, C.; Jiang, J.; He, Z.; Dong, Z.; Song, Y. HFCM-LSTM: A Novel Hybrid Framework for State-of-Health Estimation of Lithium-Ion Battery. Energy Rep. 2023, 9, 2577–2590. [Google Scholar] [CrossRef]
- Van, C.N.; Quang, D.T. Estimation of SoH and Internal Resistances of Lithium Ion Battery Based on LSTM Network. Int. J. Electrochem. Sci. 2023, 18, 100166. [Google Scholar]
- Goh, H.H.; Lan, Z.; Zhang, D.; Dai, W.; Kurniawan, T.A.; Goh, K.C. Estimation of the State of Health (SOH) of Batteries Using Discrete Curvature Feature Extraction. J. Energy Storage 2022, 50, 104646. [Google Scholar] [CrossRef]
- Li, Y.; Tao, J. CNN and Transfer Learning Based Online SOH Estimation for Lithium-Ion Battery. In Proceedings of the 2020 Chinese Control and Decision Conference (CCDC), Hefei, China, 22–24 August 2020; pp. 5489–5494. [Google Scholar]
- Yang, N.; Song, Z.; Hofmann, H.; Sun, J. Robust State of Health Estimation of Lithium-Ion Batteries Using Convolutional Neural Network and Random Forest. J. Energy Storage 2022, 48, 103857. [Google Scholar] [CrossRef]
- Lee, G.; Kwon, D.; Lee, C. A Convolutional Neural Network Model for SOH Estimation of Li-Ion Batteries with Physical Interpretability. Mech. Syst. Signal Process. 2023, 188, 110004. [Google Scholar] [CrossRef]
- Zhang, Z.; Min, H.; Guo, H.; Yu, Y.; Sun, W.; Jiang, J.; Zhao, H. State of Health Estimation Method for Lithium-Ion Batteries Using Incremental Capacity and Long Short-Term Memory Network. J. Energy Storage 2023, 64, 107063. [Google Scholar] [CrossRef]
- He, J.; Bian, X.; Liu, L.; Wei, Z.; Yan, F. Comparative Study of Curve Determination Methods for Incremental Capacity Analysis and State of Health Estimation of Lithium-Ion Battery. J. Energy Storage 2020, 29, 101400. [Google Scholar] [CrossRef]
- Li, L.; Cui, W.; Hu, X.; Chen, Z. A State-of-Health Estimation Method of Lithium-Ion Batteries Using ICA and SVM. In Proceedings of the 2021 Global Reliability and Prognostics and Health Management (PHM-Nanjing), Nanjing, China, 15–17 October 2021; pp. 5–9. [Google Scholar]
- Wang, Q.; Ye, M.; Cai, X.; Sauer, D.U.; Li, W. Transferable Data-Driven Capacity Estimation for Lithium-Ion Batteries with Deep Learning: A Case Study from Laboratory to Field Applications. Appl. Energy 2023, 350, 121747. [Google Scholar] [CrossRef]
- Naha, A.; Han, S.; Agarwal, S.; Guha, A.; Khandelwal, A.; Tagade, P.; Hariharan, K.S.; Kolake, S.M.; Yoon, J.; Oh, B. An Incremental Voltage Difference Based Technique for Online State of Health Estimation of Li-Ion Batteries. Sci. Rep. 2020, 10, 9526. [Google Scholar] [CrossRef]
- Lu, J.; Xiong, R.; Tian, J.; Wang, C.; Sun, F. Deep Learning to Estimate Lithium-Ion Battery State of Health without Additional Degradation Experiments. Nat. Commun. 2023, 14, 2760. [Google Scholar] [CrossRef]
- Yang, J.; Xia, B.; Huang, W.; Fu, Y.; Mi, C. Online State-of-Health Estimation for Lithium-Ion Batteries Using Constant-Voltage Charging Current Analysis. Appl. Energy 2018, 212, 1589–1600. [Google Scholar] [CrossRef]
- Roman, D.; Saxena, S.; Robu, V.; Pecht, M.; Flynn, D. Machine Learning Pipeline for Battery State-of-Health Estimation. Nat. Mach. Intell. 2021, 3, 447–456. [Google Scholar] [CrossRef]
- Zhu, J.; Wang, Y.; Huang, Y.; Bhushan Gopaluni, R.; Cao, Y.; Heere, M.; Mühlbauer, M.J.; Mereacre, L.; Dai, H.; Liu, X.; et al. Data-Driven Capacity Estimation of Commercial Lithium-Ion Batteries from Voltage Relaxation. Nat. Commun. 2022, 13, 2261. [Google Scholar] [CrossRef]
- Jones, P.K.; Stimming, U.; Lee, A.A. Impedance-Based Forecasting of Lithium-Ion Battery Performance amid Uneven Usage. Nat. Commun. 2022, 13, 4806. [Google Scholar] [CrossRef]
- Liu, Y.; Wang, L.; Li, D.; Wang, K. State-of-Health Estimation of Lithium-Ion Batteries Based on Electrochemical Impedance Spectroscopy: A Review. Prot. Control Mod. Power Syst. 2023, 8, 1–17. [Google Scholar] [CrossRef]
- Jiang, B.; Zhu, J.; Wang, X.; Wei, X.; Shang, W.; Dai, H. A Comparative Study of Different Features Extracted from Electrochemical Impedance Spectroscopy in State of Health Estimation for Lithium-Ion Batteries. Appl. Energy 2022, 322, 119502. [Google Scholar] [CrossRef]
- Zhang, Y.; Tang, Q.; Zhang, Y.; Wang, J.; Stimming, U.; Lee, A.A. Identifying Degradation Patterns of Lithium Ion Batteries from Impedance Spectroscopy Using Machine Learning. Nat. Commun. 2020, 11, 1706. [Google Scholar] [CrossRef]
- Qin, Q.; Li, X.; Wang, Z.; Wang, J.; Yan, G.; Peng, W.; Guo, H. Experimental and Simulation Study of Direct Current Resistance Decomposition in Large Size Cylindrical Lithium-Ion Battery. Electrochim. Acta 2023, 465, 142947. [Google Scholar] [CrossRef]
- Ruan, H.; Sun, B.; Jiang, J.; Zhang, W.; He, X.; Su, X.; Bian, J.; Gao, W. A Modified-Electrochemical Impedance Spectroscopy-Based Multi-Time-Scale Fractional-Order Model for Lithium-Ion Batteries. Electrochim. Acta 2021, 394, 139066. [Google Scholar] [CrossRef]
- Nyman, A.; Zavalis, T.G.; Elger, R.; Behm, M.; Lindbergh, G. Analysis of the Polarization in a Li-Ion Battery Cell by Numerical Simulations. J. Electrochem. Soc. 2010, 157, A1236. [Google Scholar] [CrossRef]
- Zhao, H.; Chen, Z.; Shu, X.; Shen, J.; Lei, Z.; Zhang, Y. State of Health Estimation for Lithium-Ion Batteries Based on Hybrid Attention and Deep Learning. Reliab. Eng. Syst. Saf. 2023, 232, 109066. [Google Scholar] [CrossRef]

| Cell Name | Nominal Capacity (mAh) | Current Rate (C) | Cut-off Voltage (V) | Cycling Temperature |
|---|---|---|---|---|
| B#1-1 | 1000 | 1/1 | 3.65/2.30 | 30 °C |
| B#1-2 | 1000 | 1/1 | 3.65/2.30 | 30 °C |
| B#1-3 | 1000 | 2/2 | 3.65/2.30 | 30 °C |
| B#1-4 | 1000 | 1/1 | 3.65/2.30 | Room |
| B#1-5 | 1000 | 1/1 | 3.65/2.30 | Room |
| B#1-6 | 1000 | 2/2 | 3.65/2.30 | Room |
| B#1-7 | 1000 | 2/2 | 3.65/2.30 | Room |
| B#2-1 | 1000 | 0.5/0.5 | 3.65/2.30 | Room |
| B#2-2 | 1000 | 0.5 + 1/2 | 3.30 + 3.65/2.30 | Room |
| B#2-3 | 1000 | 4/4 | 3.65/2.30 | Room |
| B#3-1 | 6000 | 1/1 | 3.65/2.30 | 30 °C |
| B#3-2 | 6000 | 0.5/0.5 | 3.65/2.30 | Room |
| Cell Name | ρ | Cell Name | ρ |
|---|---|---|---|
| B#1-1 | −0.948 | B#1-2 | −0.992 |
| B#1-3 | −0.818 | B#1-4 | −0.971 |
| B#1-5 | −0.938 | B#1-6 | −0.933 |
| B#1-7 | −0.865 | B#2-1 | −0.950 |
| B#2-2 | −0.986 | B#2-3 | −0.832 |
| B#3-1 | −0.969 | B#3-2 | −0.981 |
| Activation Function | Hidden Size | MAE | RMSE |
|---|---|---|---|
| ReLU | 128 | 0.447% | 0.676% |
| Sigmoid | 128 | 0.703% | 1.023% |
| LogSigmoid | 128 | 0.581% | 0.842% |
| ReLU | 64 | 0.515% | 0.776% |
| ReLU | 32 | 0.640% | 0.961% |
| Method | Refs. | Features | Data Sources | Estimation Error |
|---|---|---|---|---|
| HFCM-LSTM | [19] | HFCM extracts features from raw data | NASA Oxford | RMSE < 2.3% |
| LSTM | [25] | ICA | NASA | MAPE < 2% |
| ElasticNet XGBoost SVR | [33] | Statistical features | Laboratory experiment | RMSE < 1.7% |
| GPR | [36] | EIS | Laboratory experiment | MAE < 2.2% |
| CNN-LSTM-Attention | [41] | Temperature | Oxford | (MAE, RMSE) < 1.3% |
| DNN in this study | DCIR | Laboratory experiment | MAE < 0.768% RMSE < 1.185% |
Disclaimer/Publisher’s Note: The statements, opinions and data contained in all publications are solely those of the individual author(s) and contributor(s) and not of MDPI and/or the editor(s). MDPI and/or the editor(s) disclaim responsibility for any injury to people or property resulting from any ideas, methods, instructions or products referred to in the content. |
© 2024 by the authors. Licensee MDPI, Basel, Switzerland. This article is an open access article distributed under the terms and conditions of the Creative Commons Attribution (CC BY) license (https://creativecommons.org/licenses/by/4.0/).
Share and Cite
Sun, Z.; He, W.; Wang, J.; He, X. State of Health Estimation for Lithium-Ion Batteries with Deep Learning Approach and Direct Current Internal Resistance. Energies 2024, 17, 2487. https://doi.org/10.3390/en17112487
Sun Z, He W, Wang J, He X. State of Health Estimation for Lithium-Ion Batteries with Deep Learning Approach and Direct Current Internal Resistance. Energies. 2024; 17(11):2487. https://doi.org/10.3390/en17112487
Chicago/Turabian StyleSun, Zhongxian, Weilin He, Junlei Wang, and Xin He. 2024. "State of Health Estimation for Lithium-Ion Batteries with Deep Learning Approach and Direct Current Internal Resistance" Energies 17, no. 11: 2487. https://doi.org/10.3390/en17112487
APA StyleSun, Z., He, W., Wang, J., & He, X. (2024). State of Health Estimation for Lithium-Ion Batteries with Deep Learning Approach and Direct Current Internal Resistance. Energies, 17(11), 2487. https://doi.org/10.3390/en17112487