Article

Thermodynamic Comparison of the Steam Ejectors Integrated at Different Locations in Cogeneration Systems

School of Energy and Power Engineering, North China University of Water Resources and Electric Power, Zhengzhou 450045, China
*
Author to whom correspondence should be addressed.
These authors contributed equally to this work.
Energies 2024, 17(11), 2463; https://doi.org/10.3390/en17112463
Submission received: 17 April 2024 / Revised: 5 May 2024 / Accepted: 17 May 2024 / Published: 22 May 2024
(This article belongs to the Topic District Heating and Cooling Systems)

Abstract

:
Under the challenge of global energy transition, coal-fired cogeneration systems are undergoing a technical revolution towards enhanced efficiency, heating capacity, and flexibility. In this paper, four schemes using a steam ejector integrated into a cogeneration system are designed. Considering operational safety, integrated locations are selected at the front and back of high- and medium-pressure turbines. Subsequently, the thermodynamic and operational characteristics under both design and off-design conditions are analyzed based on a model built in EBSILON Professional. Finally, a sensitivity analysis of the heating process is conducted. The results show that the integration of steam ejectors can increase the waste heat recovery ratio of exhaust steam by 18.42–45.61% under design conditions. The largest waste heat recovery ratio is obtained in System 4, resulting in the power generation efficiency ( η g ) and gross energy utilization efficiency ( η p ) of 81.95% and 65.53%, respectively. Meanwhile, the steam ejector can expand the power-load regulation range of the cogeneration system, and System 4 has the lowest lower power limit among all the systems. The η p values of Systems 1–4 reach extreme values at different mixed steam pressures of the ejector. Increasing the pinch point temperature difference reduces the power load η g and η p of Systems 1–4. The results provide technical solutions for improving the heating capacity and efficient and flexible operation of cogeneration systems.

1. Introduction

Low-carbon energy systems are crucial for global energy transition to address the climate and energy crisis [1]. According to an International Energy Agency (IEA) report, coal remains the primary energy source for global energy systems [2,3]. Power from coal accounts for over 60% of China’s power generation and over 70% in India. Recently, the European Union has either restarted or delayed the operation of some coal-fired power plants owing to international circumstances. Meanwhile, coal-fired power generation in the US has decreased, but it still accounts for approximately 20% of the total power generation. Therefore, the development of low-carbon coal technologies is crucial for global energy systems [4].
In recent decades, cogeneration has been widely implemented as a low-carbon technology, owing to its thermal and environmental advantages [5]. Based on energy cascade utilization, the overall efficiency of the traditional coal-fired cogeneration system can reach 70–80% [6]. The main challenges of coal-fired cogeneration systems are as follows. (1) Irreversible exhaust steam loss: for operational safety, traditional cogeneration systems must retain some steam to cool the turbine blades, resulting in a large and irreversible exhaust steam loss [7]. (2) A narrow regulation range of the power load: the rapid increase in renewable energy has a significant effect on the supply-side composition and stability of the power grid [8]. However, owing to the coupling of heat and power, cogeneration systems frequently have a narrower power regulation range than power-only systems [9]. Therefore, increasing the operational flexibility of the existing coal-fired cogeneration systems would increase the share of renewable energy and reduce the energy storage and conversion devices like metal-ion batteries [10,11]. (3) Improvement of the heat capacity. Additionally, cogeneration systems are expected to have a higher heat capacity to replace heat-only boilers and achieve lower carbon emissions [12]. Consequently, more efficient and flexible cogeneration technologies with higher heating capacities are essential for innovations in coal-based energy technologies.
Although affected by economic and technical factors, waste heat recovery is a promising mechanism for technological upgrades in cogeneration systems [13,14]. On one hand, it can significantly reduce fuel consumption and increase heating capacity [15]. Driven by the thermal energy or electric power, the heat pump is commonly used in the waste heat recovery below 100 °C [16]. When the heat source temperature is in the range of 60–160 °C, the absorption heat pump (AHP) shows effective performance with the maximum energy and exergy production [17]. Integrated with the organic Rankine cycle (ORC) and AHP, the thermal efficiency of the cogeneration system could be improved by 9.38% [18]. Waste heat recovery with the high back-pressure technology could also significantly improve the heating capacity of the system [19,20]. On the other hand, waste heat recovery can improve the operational characteristics of cogeneration systems [21]. It has been proved that both the EHP and AHP had good application prospects in the flexibility enhancement of the cogeneration system [22]. And the utilization of heat pumps to recover waste heat can extend the feasible operating region of a cogeneration system and reduce the load rate by 10% [23].
Because it is simple and inexpensive compared with the above technologies, a steam ejector is also an alternative method of recovering waste heat [24]. In the steam ejector, high-pressure steam (driven steam) passes through a nozzle to generate a high-speed flow and a low-pressure zone. The low-pressure zone extracts low-pressure steam from outside and mixes it with the original steam. Subsequently, the mixed steam reaches the required medium pressure in the diffuser [25]. With a simple structure and nonpower-driven characteristics, steam ejectors are commonly used to provide heating, cooling, or refrigeration [26,27]. Steam ejectors also can improve both the thermodynamic performance and flexibility of cogeneration systems. A optimized steam ejector could increase the exergy efficiency by 6.1% of a cogeneration system [28]. And after the system integration, the peak load regulating capacity could increase by 94.80 MW for a 330 MW unit [29]. Steam ejectors are also highly compatible with various cogeneration technologies. Chen et al. [30] used a steam ejector to produce steam for an AHP, resulting in a low electricity cost of 0.0329 USD/kWh. Cao et al. [31] proposed a cogeneration system integrated with an ORC and a steam ejector, the thermal efficiency of which reached 79.0%. Fazali et al. [32] observed that the exergy efficiency of an integrated system, including gas turbine, ORC, and ejector could reach 40.76%. Zhang et al. [33] designed a novel cascade system based on a steam ejector and high-back-pressure technology, and the heating capacity increased by 4.21%.
The abovementioned studies analyzed the advantages of waste heat recovery using steam ejectors in a cogeneration system. However, various steam sources are available for the driven steam of steam ejectors in coal-fired cogeneration systems. The choice of the driving steam source has a significant impact on the thermodynamic and operational characteristics of the entire system. In addition, the performance of a system is significantly affected by the selection of the key parameters in the heat transfer process. Currently, these effects have not been analyzed or discussed.
In this paper, four options for integrating steam ejectors at different locations in the cogeneration system are designed. Based on the energy level from low to high, the sources of the driven steam are selected from the outlets of the medium-pressure turbine (MPT) and high-pressure turbine (HPT), the inlet of the MPT, and the main steam. Subsequently, the thermodynamic and operational characteristics under both design and off-design conditions are compared. Furthermore, a sensitivity analysis of the key parameters is performed to determine their influence on the thermodynamic performance.

2. System Description

In this paper, a typical 300 MW sub-critical coal-fired cogeneration power plant in Northern China is selected as the basic system (BS). In Section 2.1, the main parameters of the basic system are introduced. After the primary energy flow analysis of the basic system, four options for integrating steam ejectors at different locations in the cogeneration system are described in Section 2.2.

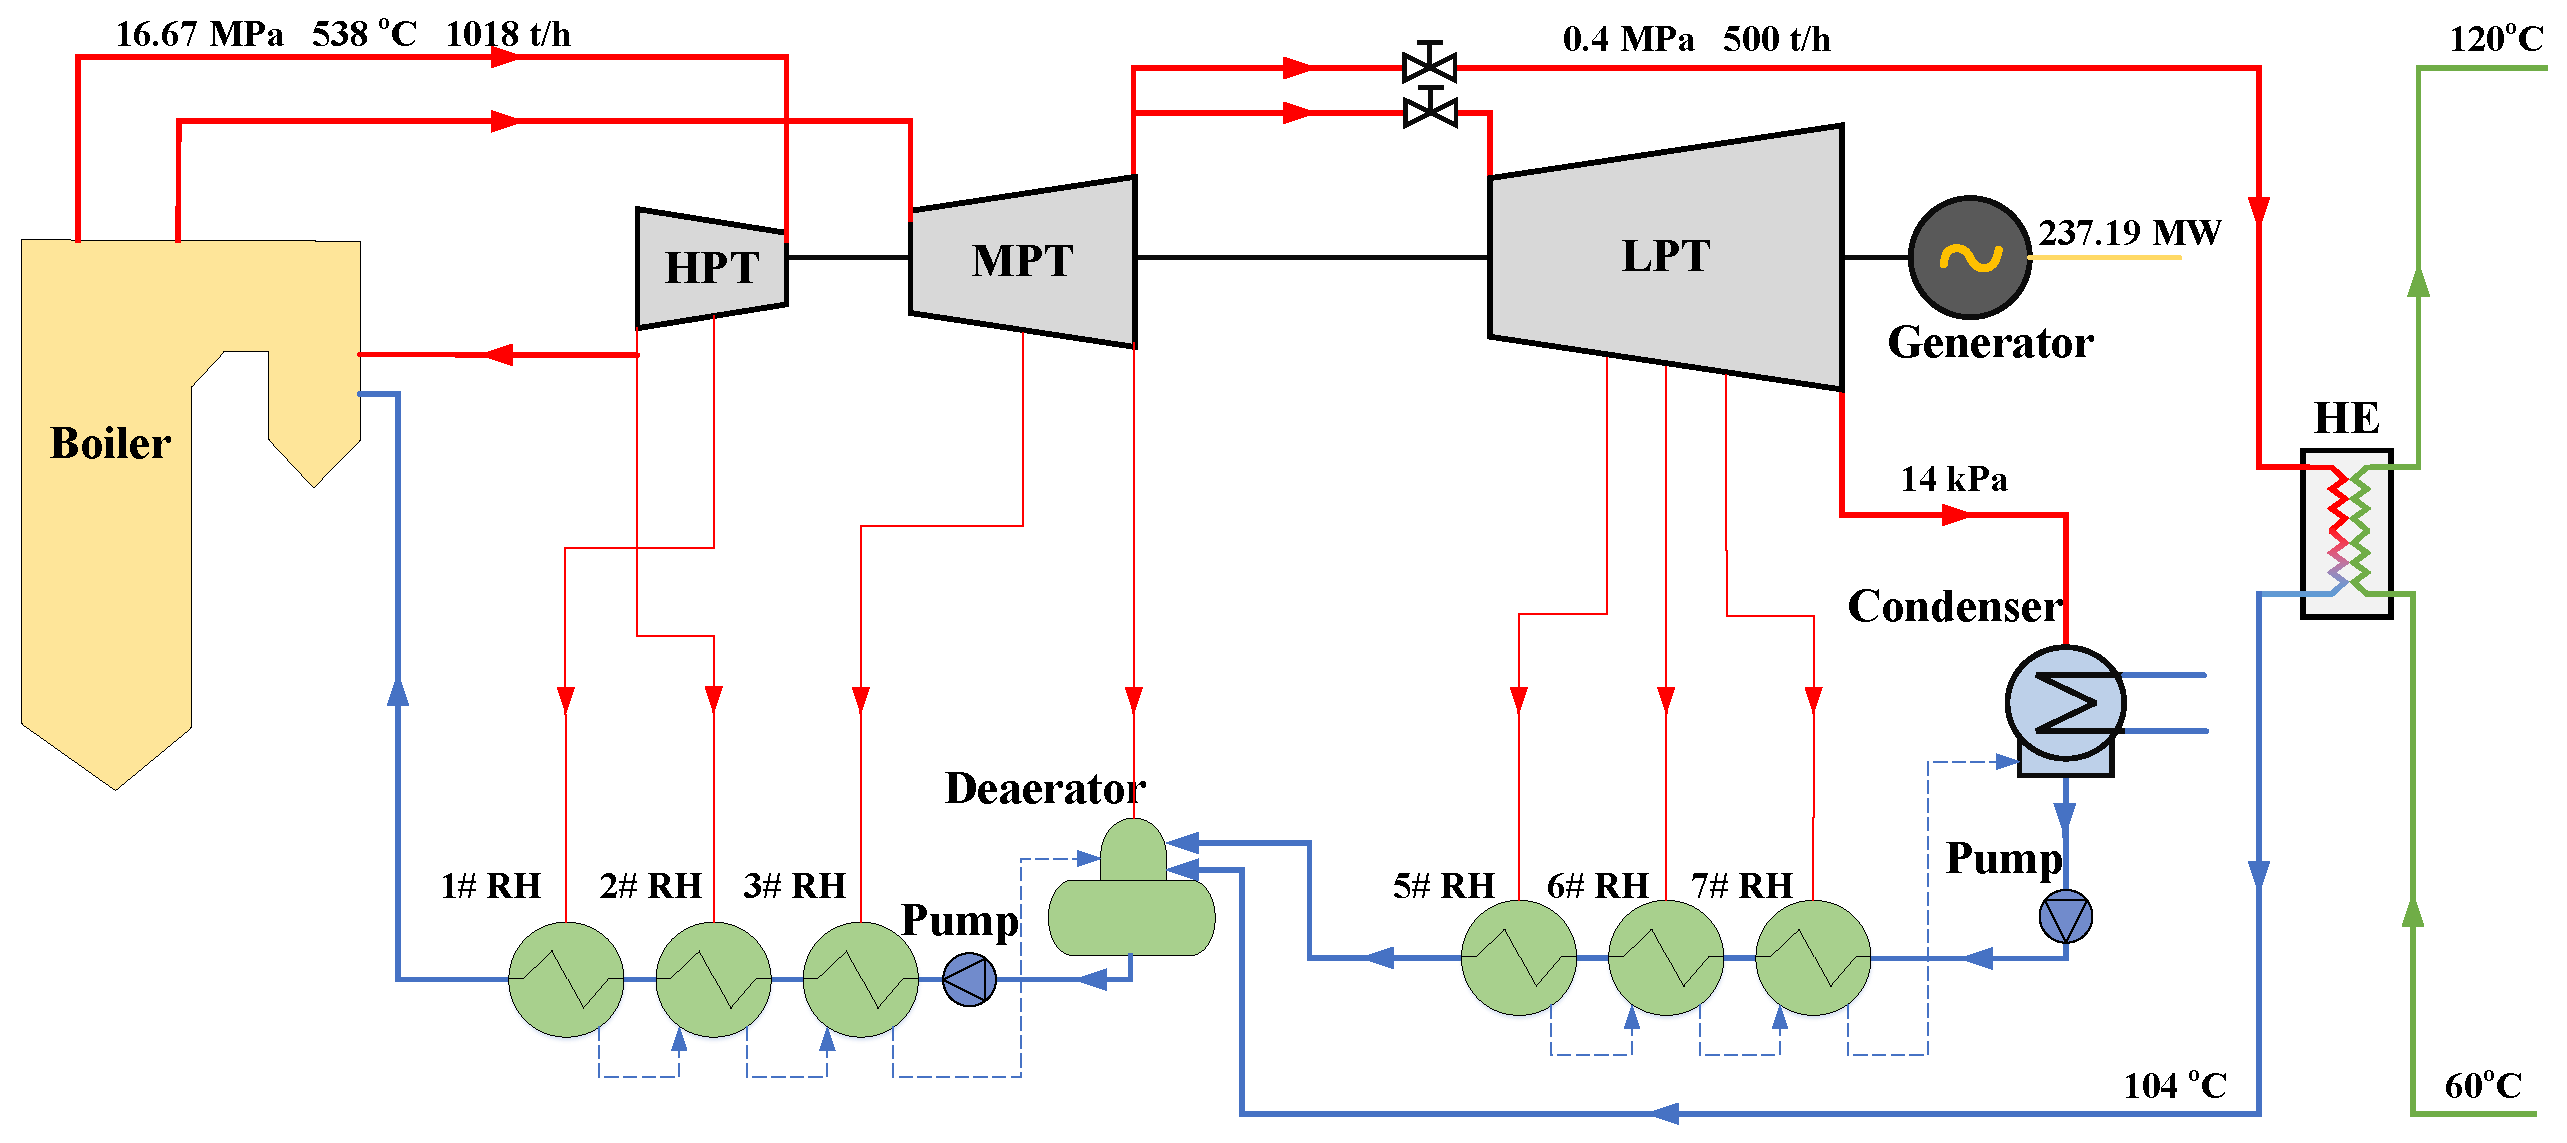
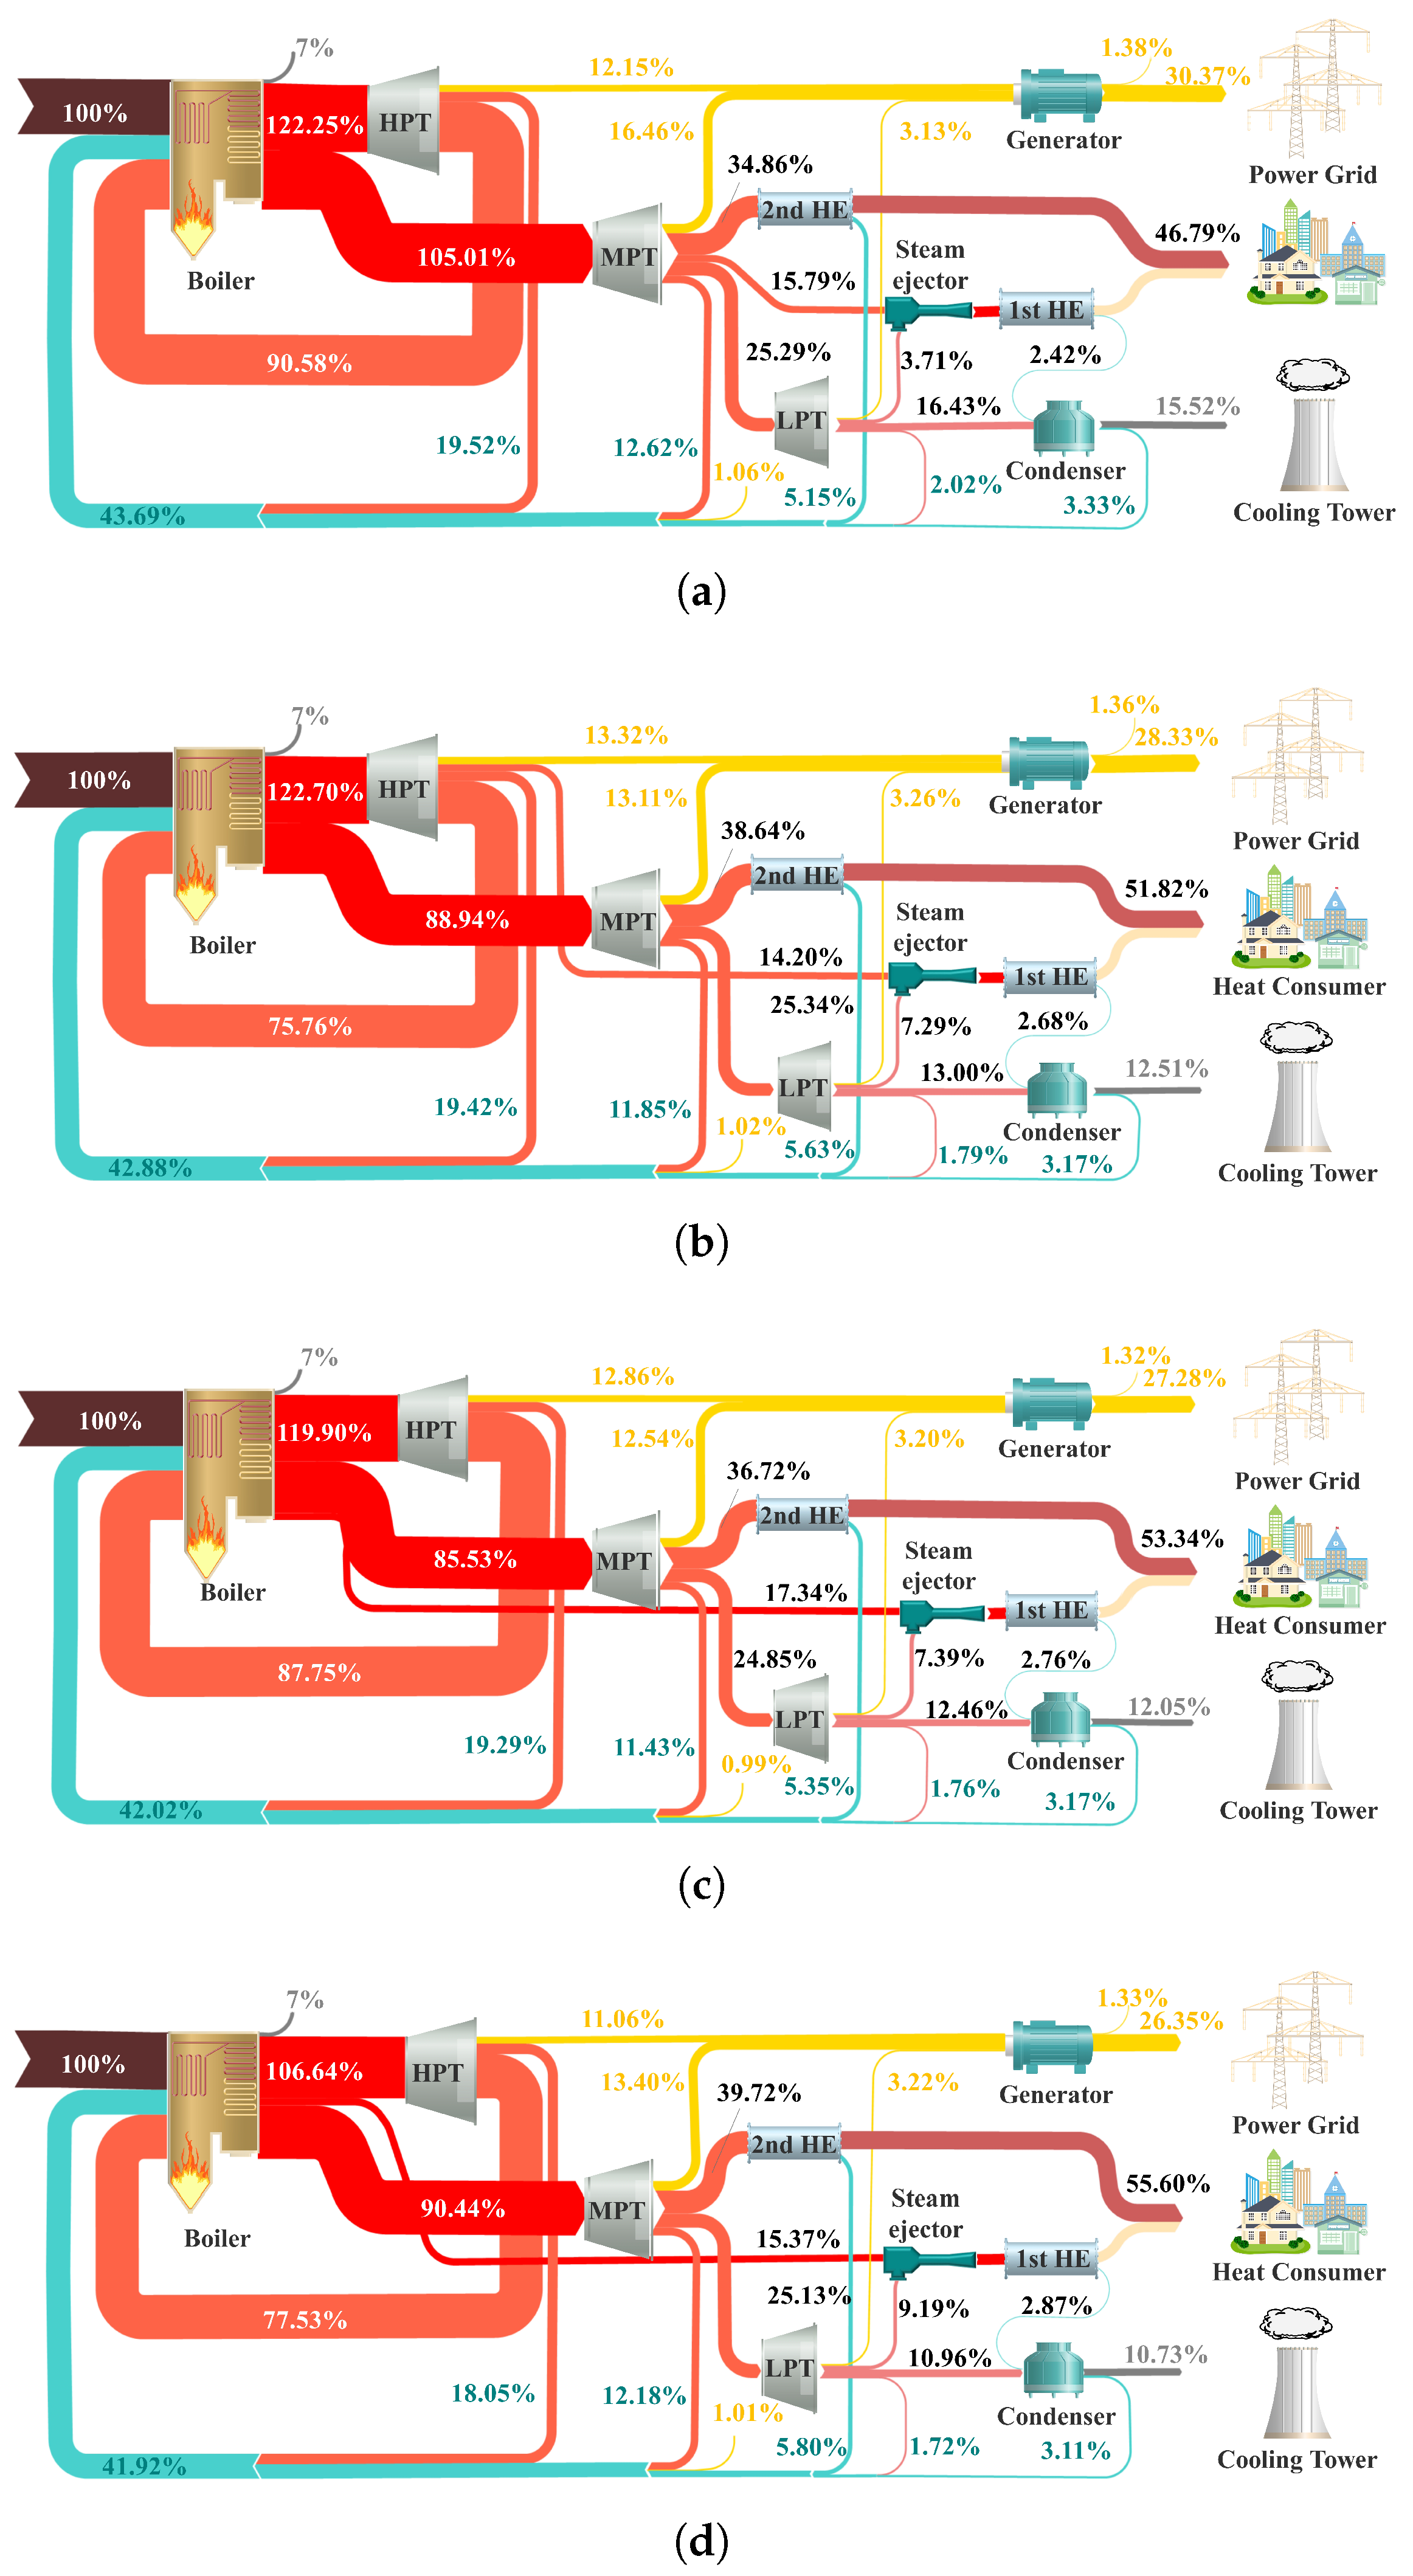
2.1. Traditional Coal-Fired Cogeneration System (Basic System)

A schematic of the basic system is shown in Figure 1. The power component of the system consists of three turbine cylinders: an HPT, MPT, and low-pressure turbine (LPT). The exhaust steam is condensed in the condenser and sent to the boiler through a regenerative system consisting of three low-pressure regenerative heaters (RHs), one deaerator, and three high-pressure RHs. The steam used for heating is extracted between the MPT and LPT. The pressure of the heating steam is maintained at or above 0.4 MPa to ensure an adequate temperature difference between steam and water in the heat exchanger (HE). This enables the hot-water outlet temperature to satisfy the district heating (DH) requirements. The main parameters under the turbine maximum continuous rating (TMCR) and maximum heating conditions of the basic system are listed in Table 1. Table 2 gives the main parameters of the regenerative system under the THA condition. All the data are collected from the design book of the turbine.
The Sankey diagram in Figure 2 shows the energy flow in the basic system. The power grid and DH system utilize 74.66% of the input energy, with 44.48% consumed by the DH system. The energy from the heating steam accounts for 52.19% of the total energy. This can significantly decrease the steam to the LPT and reduce exhaust steam loss. Subsequently, 7.71% of the total energy after the HE enters the regenerative system in the form of feedwater. Such cascade utilization of energy is the primary energy-saving mechanism of traditional cogeneration systems. However, in the DH network heater, the energy on the hot side primarily results from the latent heat of the heating steam condensation process, whereas the cold side is a nonphase-change process, resulting in a temperature increase. Therefore, the DH network heater is associated with significant irreversible exergy loss, which is consistent with the second law of thermodynamics. Meanwhile, a specific amount of steam must be retained to cool the blades for the safe operation of the LPT [34]. Thus, the loss of exhausted steam still accounts for 18.02% in the basic system even under maximum heating conditions.

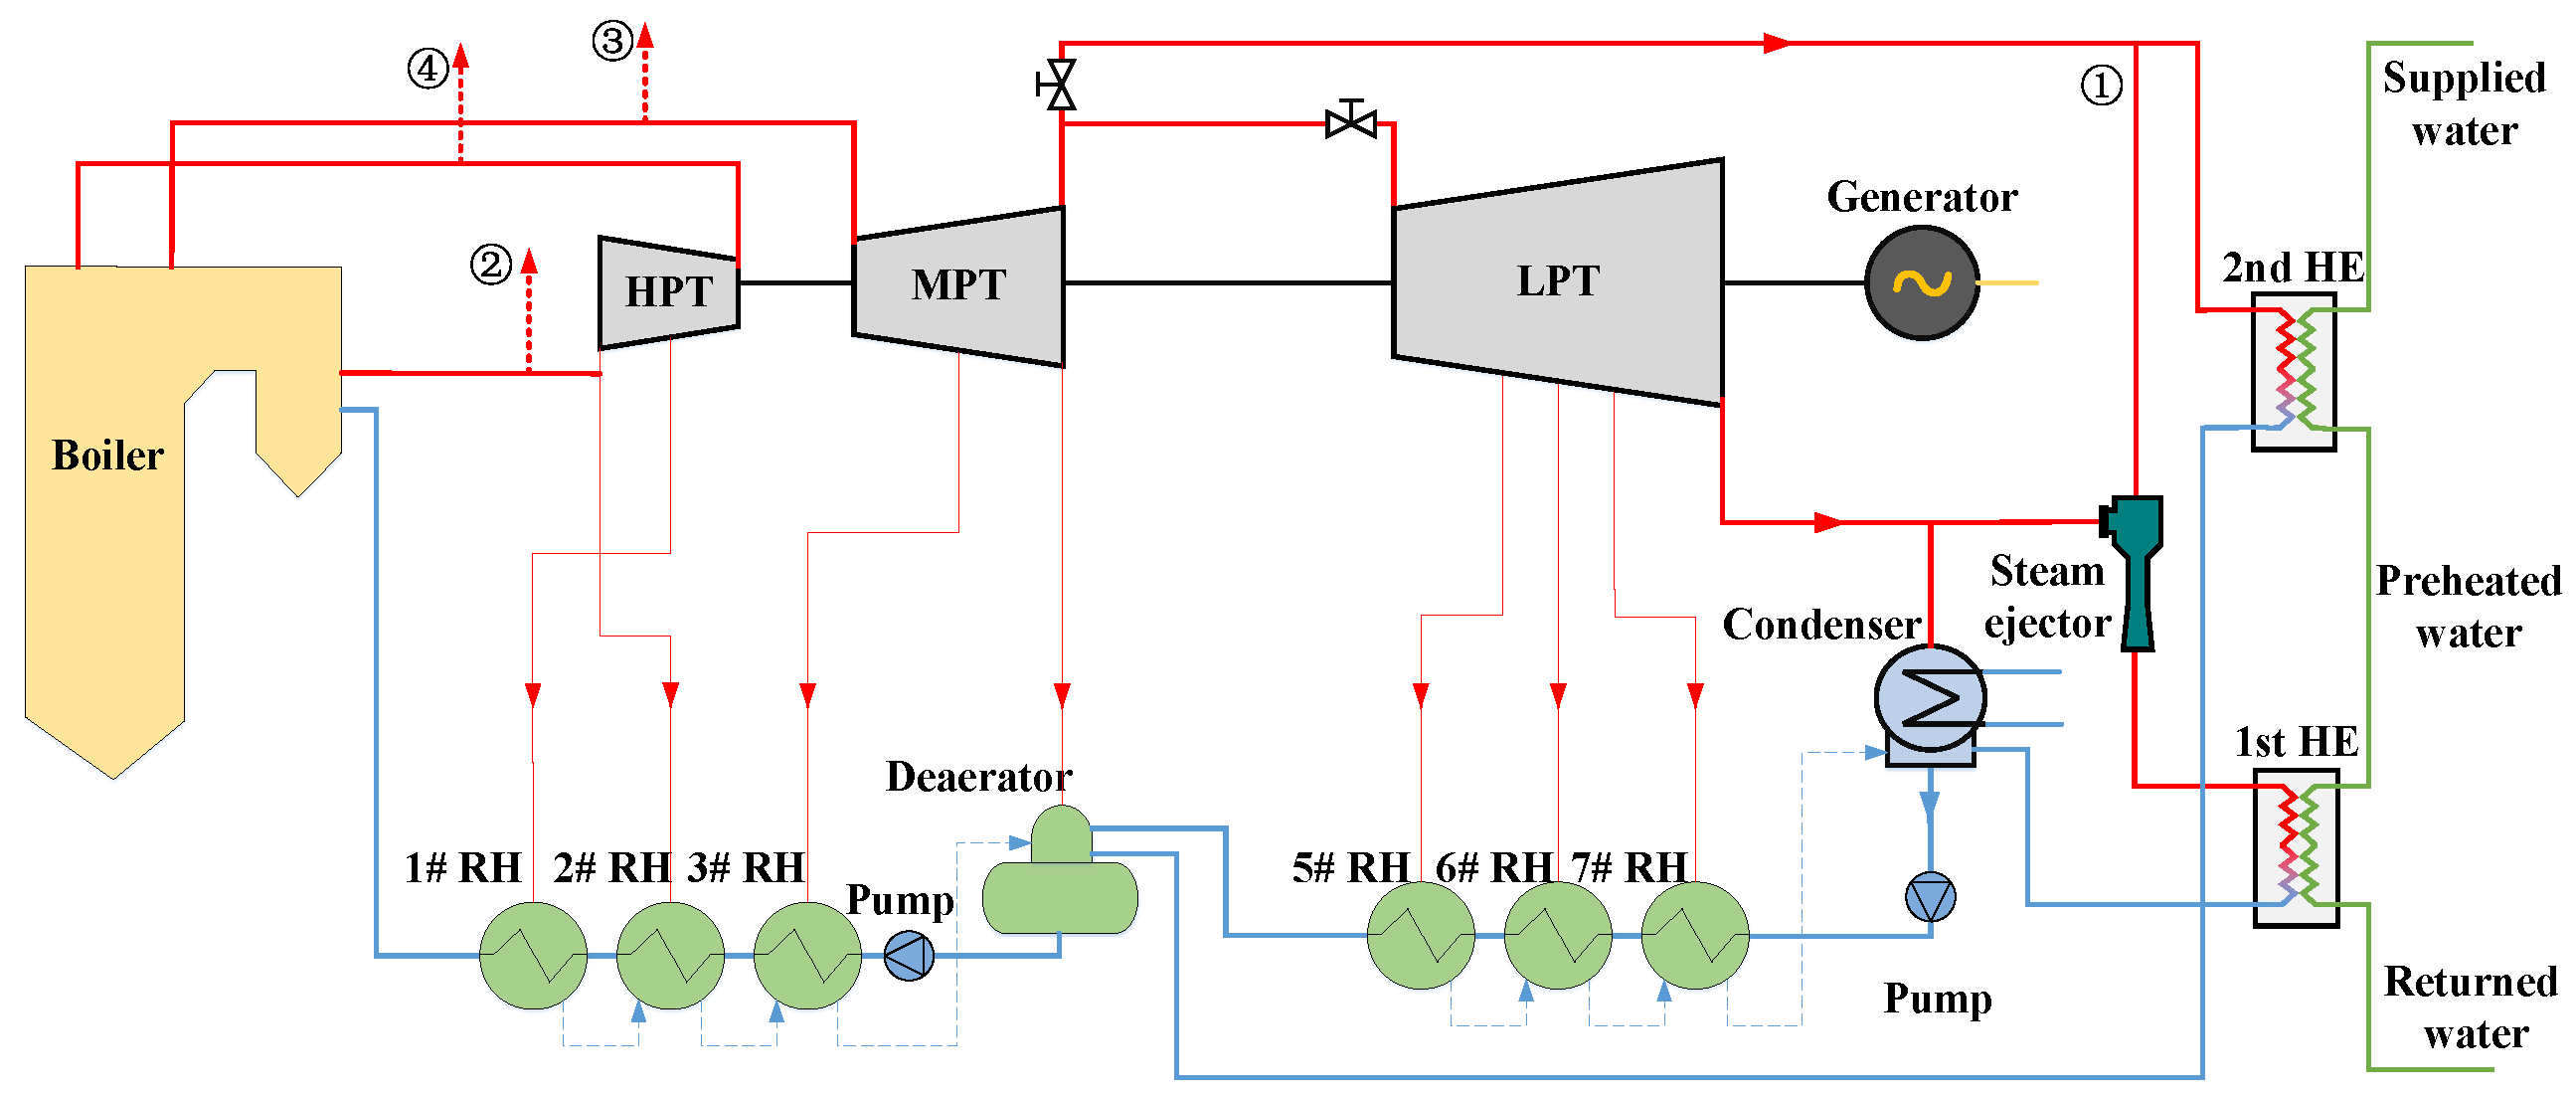
2.2. Cogeneration System Integrated with the Steam Ejector

For these reasons, a cogeneration system integrated with a steam ejector is suggested as shown in Figure 3. The steam ejector enables the driven steam to pass through a nozzle to create a low-pressure zone. Low-pressure steam is then extracted to produce medium-pressure steam. Consequently, the steam ejector recovers low-grade steam heat and controls the steam pressure levels. In this system, the driven and low-pressure steam of the ejector are the heating and exhaust steam, respectively. Additionally, the mixed steam from the ejector serves as the primary heat source for the returned water. After preheating in the first HE, the water is further heated in the second HE by the heating steam to attain the required temperature for the DH network.
Compared with the basic system, the following are the key benefits of the new system: (1) Recovery of waste heat from exhaust steam—the waste heat recovery of the exhaust steam can directly reduce the loss in the condenser, which accounts for 18.02% of the basic system. Although it has a slight impact on power generation, it can significantly increase the heat load of the system. Thus, the performance of the system can be improved by reducing gross loss. (2) Reduction in exergy loss in DH network heater: In the basic system, the heating steam is selected as the only heat source for the HE. The large mean temperature difference between steam and water results in a large exergy loss in the HE. The novel system uses a cascade heating process that employs low-grade steam (from the steam ejector) as the first-stage heat source and high-grade steam (from the heating steam) as the second-stage heat source. As a result of the optimization, the system exhibits a reduction in exergy loss compared with the basic system.
In addition to the above process, the steam driven by the ejector can be another source. In this study, the driven steam is extracted before and after each turbine. This is because the mass flow of the driven steam is large. If the driven steam is extracted from the inside of the turbine, a larger mass flow difference can result between the front and rear sides of the turbine. This is detrimental to operational stability and safety. Driven steam is listed based on the energy levels, ordered from low to high, as follows: Point 1: Steam between the MPT and LPT. Point 2: Steam after the HPT. Point 3: Steam before the MPT. Point 4: Steam before the HPT. These systems are identified asSystems 1 to 4, respectively. As shown in Figure 3, these four systems utilize the outlet steam from the steam ejectors as the first-stage heat source, whereas the steam extracted between the MPT and LPT is the second-stage heat source. All these systems share the same constraints on the mass flow rate of the main and exhausted steam as the reference system.

3. Calculation Model and Evaluation Method

In this section, the modeling software and assumptions are first introduced in Section 3.1. The evaluation methods of the overall performance and heating process are presented in Section 3.2, which are based on the first law of thermodynamics and the second law of thermodynamics, respectively.

3.1. Calculation Model

In this study, EBSILON professional (version 16.02, Iqony Solutions GmbH, Essen, Germany) is selected as the model platform, as it is widely used in energy system simulations and has been proven to be precise in many studies [35]. The following assumptions are adopted: (1) The operational mode of the boiler (steam generator) is a modified sliding pressure operation according to the design book. (2) The condenser pressure, temperature differences of RHs, pump efficiencies, and pressure loss ratios of the pipes remain unchanged in the off-design conditions. (3) The inlet steam pressure of the LPT is 0.4 MPa or higher with different steam mass flow rates. (4) The boiler efficiency ( η b ) and generator efficiency ( η g e n ) are 93% and 98.85%, respectively. (5) The turbine mechanical and heat losses are disregarded, and the off-design calculations follow Stodola’s cone law. Figure 4 shows the System 4 model constructed using EBSILON Professional.
The heat consumption of the boiler Q b can be calculated as
Q b = [ m s ( h s h g ) + m r ( h r , o u t h r , i n ) ] / η b
where m s and m r are the mass flow rates of the main and reheated steam, respectively (kg/s). h s , h g , h r , i n , and h r , o u t are the specific enthalpies of the main steam, given water, and the inlet and outlet of the reheat steam, respectively (kJ/kg).
The power output of each turbine stage P s is expressed as
P s = m i n ( h i n h o u t , i s ) η i s
where m i n is the mass flow rate of the inlet steam (kg/s). h i n and h o u t , i s are the specific enthalpies of the inlet and outlet steam in the isentropic process, respectively (kJ/kg). η i s is the isentropic efficiency (%).
The gross electric power P g is derived as
P g = i = 1 n P s η g e n
Based on the above assumptions and the model platform, Figure 5 provides a comparison between the simulated results and the values given in the design book of the turbine. The power-only conditions included the TMCR, turbine heat acceptance (THA), 75% THA, 50% THA, and 40% THA. The maximum relative error (RE) was −0.39% in the 75% THA condition. This demonstrates the high precision of the model used in this study.
The detailed process of the cascade heating system is shown in Figure 6. The performance of a steam ejector is typically evaluated using the compression ratio ( β ), expansion ratio ( σ ), and ejector coefficient ( μ ), which are expressed as [36]
β = p 3 p 2
σ = p 1 p 2
μ = m 2 m 1
where p 1 , p 2 , and p 3 are the pressures of the driven, exhaust, and mixed steams in the ejector, respectively (MPa); and m 1 and m 2 are the mass flow rates of the driven and exhaust steam, respectively (kg/s).
The heat loads of the first and second stages of the heating process are given by
Q 1 s t = m 3 h 3 m 4 h 4 = m 8 h 8 m 7 h 7
Q 2 n d = m 5 h 5 m 6 h 6 = m 9 h 9 m 8 h 8
where m 3 , m 4 , m 5 , m 6 , m 7 , m 8 , and m 9 are the mass flow rates of the mixed steam of the ejector, drain to condenser, heating steam, drain to deaerator, returned, preheated, and supplied water, respectively, (kg/s). Additionally, h 3 , h 4 , h 5 , and h 6 denote the enthalpies of the corresponding steam and water, respectively (kJ/kg).
Subsequently, the gross heat load Q g can be derived as
Q g = Q 1 s t + Q 2 n d
The heat load ratio of the first stage ( δ ), heated by the ejector outlet steam, can be expressed as follows:
δ = Q 1 s t Q g × 100 %

3.2. Evaluation Method

Except for the performance indicators of the ejector shown in Equations (4)–(6), the overall performance and heating process are also evaluated. The overall performance indicators are based on the first law of thermodynamics, which includes gross energy utilization efficiency η g and power generation efficiency η p . These indicators are given as follows [37]:
η g = Q g + P g Q b × 100 %
η p = P g Q b Q g / η b × 100 %
The performance indicators of the heating process, energy quality coefficient ( λ ), and exergy efficiency ( Ψ e x ), are based on the second law of thermodynamics [38]. λ represents the ratio of maximum useful work (exergy, E s ) to total energy input ( Q s ). For steam, λ s can be calculated as follows:
λ s = E s Q s
where T 0 and T s are the ambient and saturated-steam temperatures, respectively (K).
The energy quality coefficient of water ( λ w ) is given by
λ w = 1 T 0 T o u t T i n ln T o u t T i n
where T o u t and T i n are the inlet and outlet water temperatures, respectively, (K).
Subsequently, the exergy efficiency of the heating process Ψ e x is derived as follows:
Ψ e x = λ w λ s × 100 %

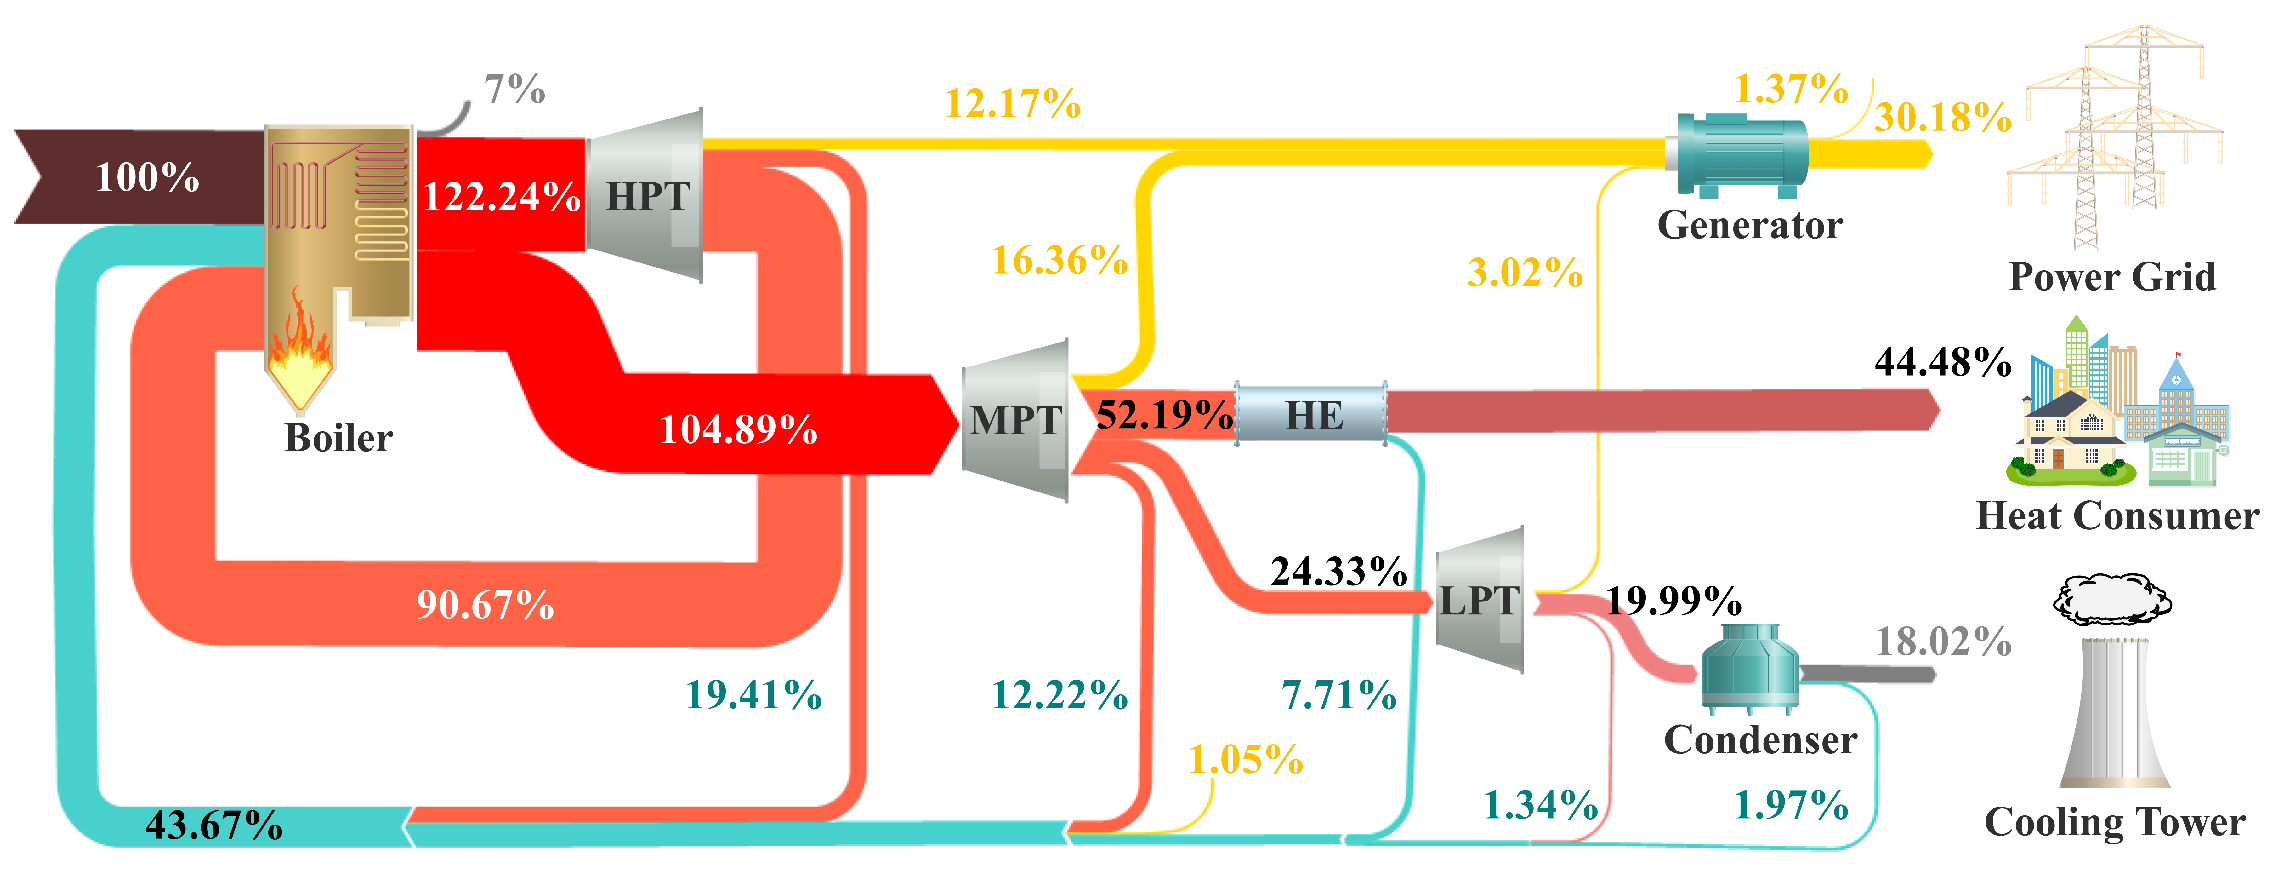
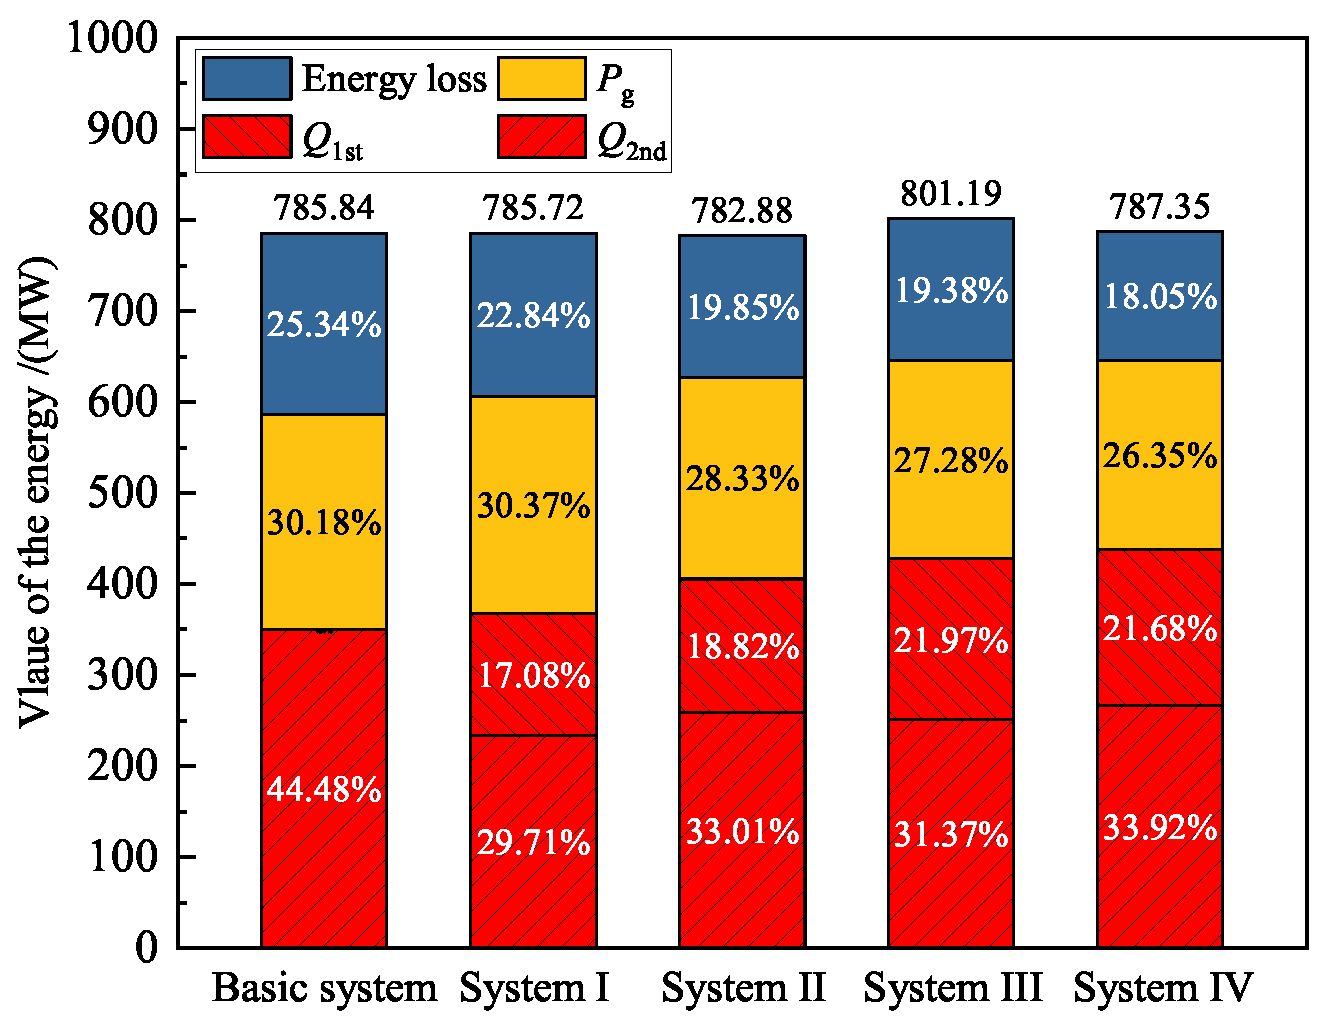
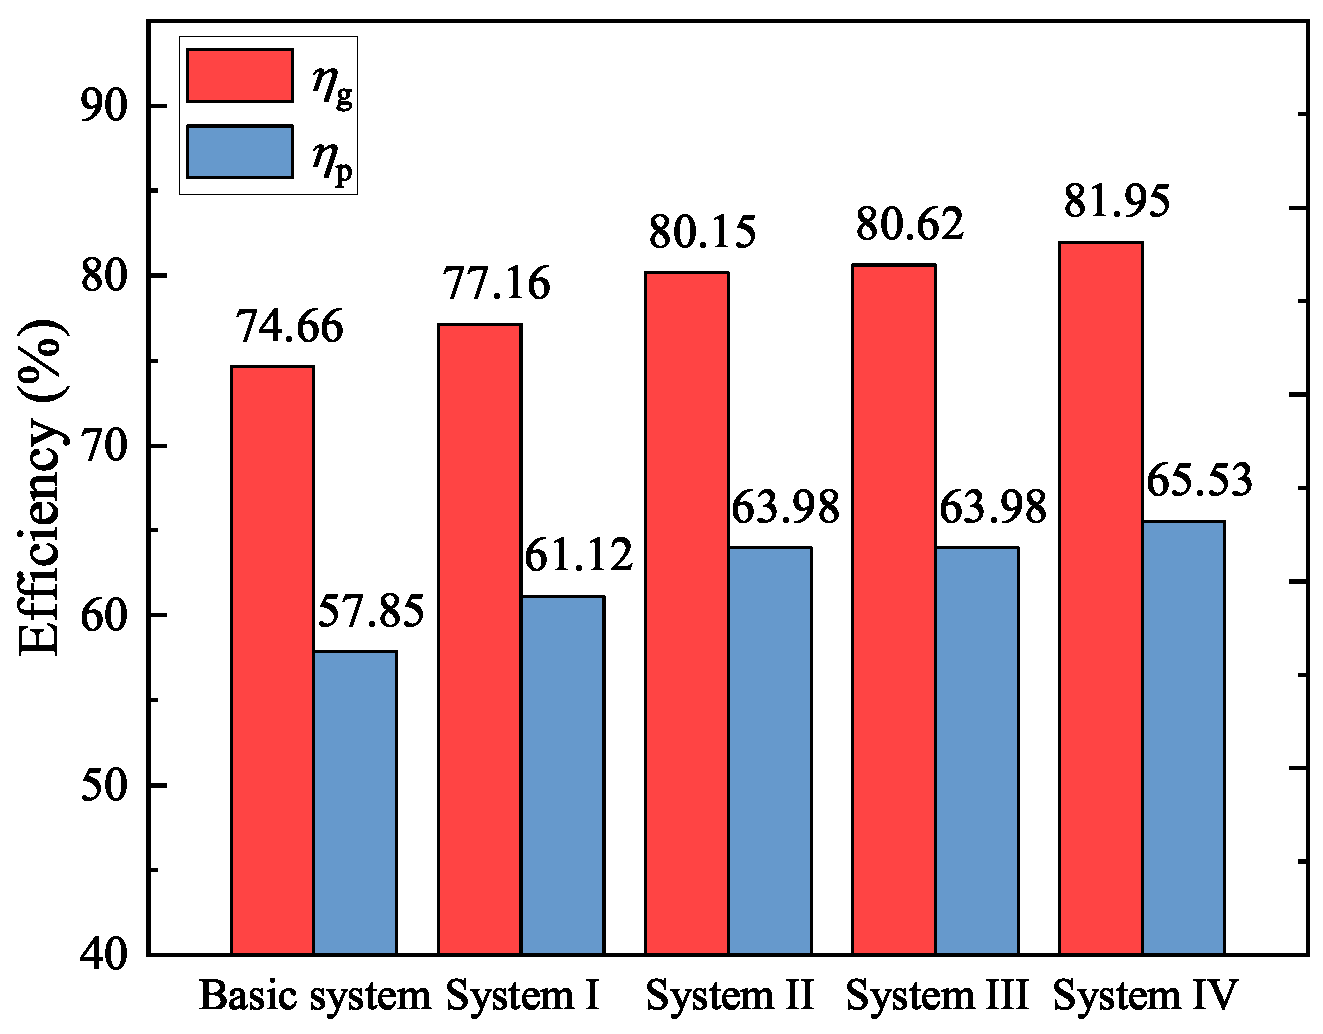
4. Result and Discussion

In this section, the overall thermodynamic performance and the heating process analysis under the design condition are first evaluated in Section 4.1 and Section 4.2. Then, the thermodynamic and operational performance under the off-design conditions are conducted in Section 4.3. In Section 4.4, the influence of two key parameters on the heating process and overall performance is analyzed. Finally, Section 4.5 gives the discussion of the above results.

4.1. Thermodynamic Performance under the Design Condition

Drive steam quality has a significant impact on the system performance. On one hand, the higher drive steam quality leads to greater power load decrement. On the other hand, it could also recover more waste heat from exhaust steam, resulting in higher heating capacity. Meanwhile, driven steam in System 3 has a lower steam pressure but a higher temperature than that in System 2. Therefor, detailed energy flow diagrams are needed to show the energy distribution within these systems, shown in Figure 7. The results indicate that as the driven steam quality of the steam ejector increases, P g decreases. However, both the mass flow rate of the recovered steam and Q g improve. Specifically, the proportion of P g decreases from 30.37% to 28.33%, 27.78%, and 26.35%, with decreases of 1.04%, 2.59%, and 4.02%, respectively. The proportion of Q g increases by 5.08%, 6.60%, and 8.86%, respectively. Moreover, the heat recovery ratios of the exhaust steam are 18.42%, 35.93%, 37.23%, and 45.61%. This can decrease exhaust steam loss from 15.52% to 12.51%, 12.05%, and 10.73%, respectively.
Figure 8 shows the comprehensive distributions of P g , Q g , and the losses of the five systems under the design conditions. As the driven steam quality of the ejector increases, P g and the energy loss decrease as Q g increases. The losses decrease from 199.13 MW in the basic system to 142.08 MW, reflecting a decrease of 57.05 MW. P g decreases from 237.19 MW to 207.50 MW, with a decrease of 29.69 MW, whereas Q g increases from 349.52 to 437.77 MW, with an increase of 88.25 MW. Note that the difference in losses and P g between System 2 and System 3 is minor, at 0.16 and 3.17 MW, respectively, but the difference in heat supply between them is significant, at 21.64 MW. This is because the driving steam pressures of the two systems are similar and the reheating process of the driven steam has minimal influence on P g .
Figure 9 presents a comparison of the η g and η p values for the five systems. As the quality of the driving steam improves, η g gradually increases from 74.66% to 81.95%, representing an increase of 7.29%. The corresponding η p also exhibits an upward trend, increasing from 57.85% to 65.53% in increments of 7.68%. Notably, Systems 2 and 3 share the same η p , both at 63.98%.

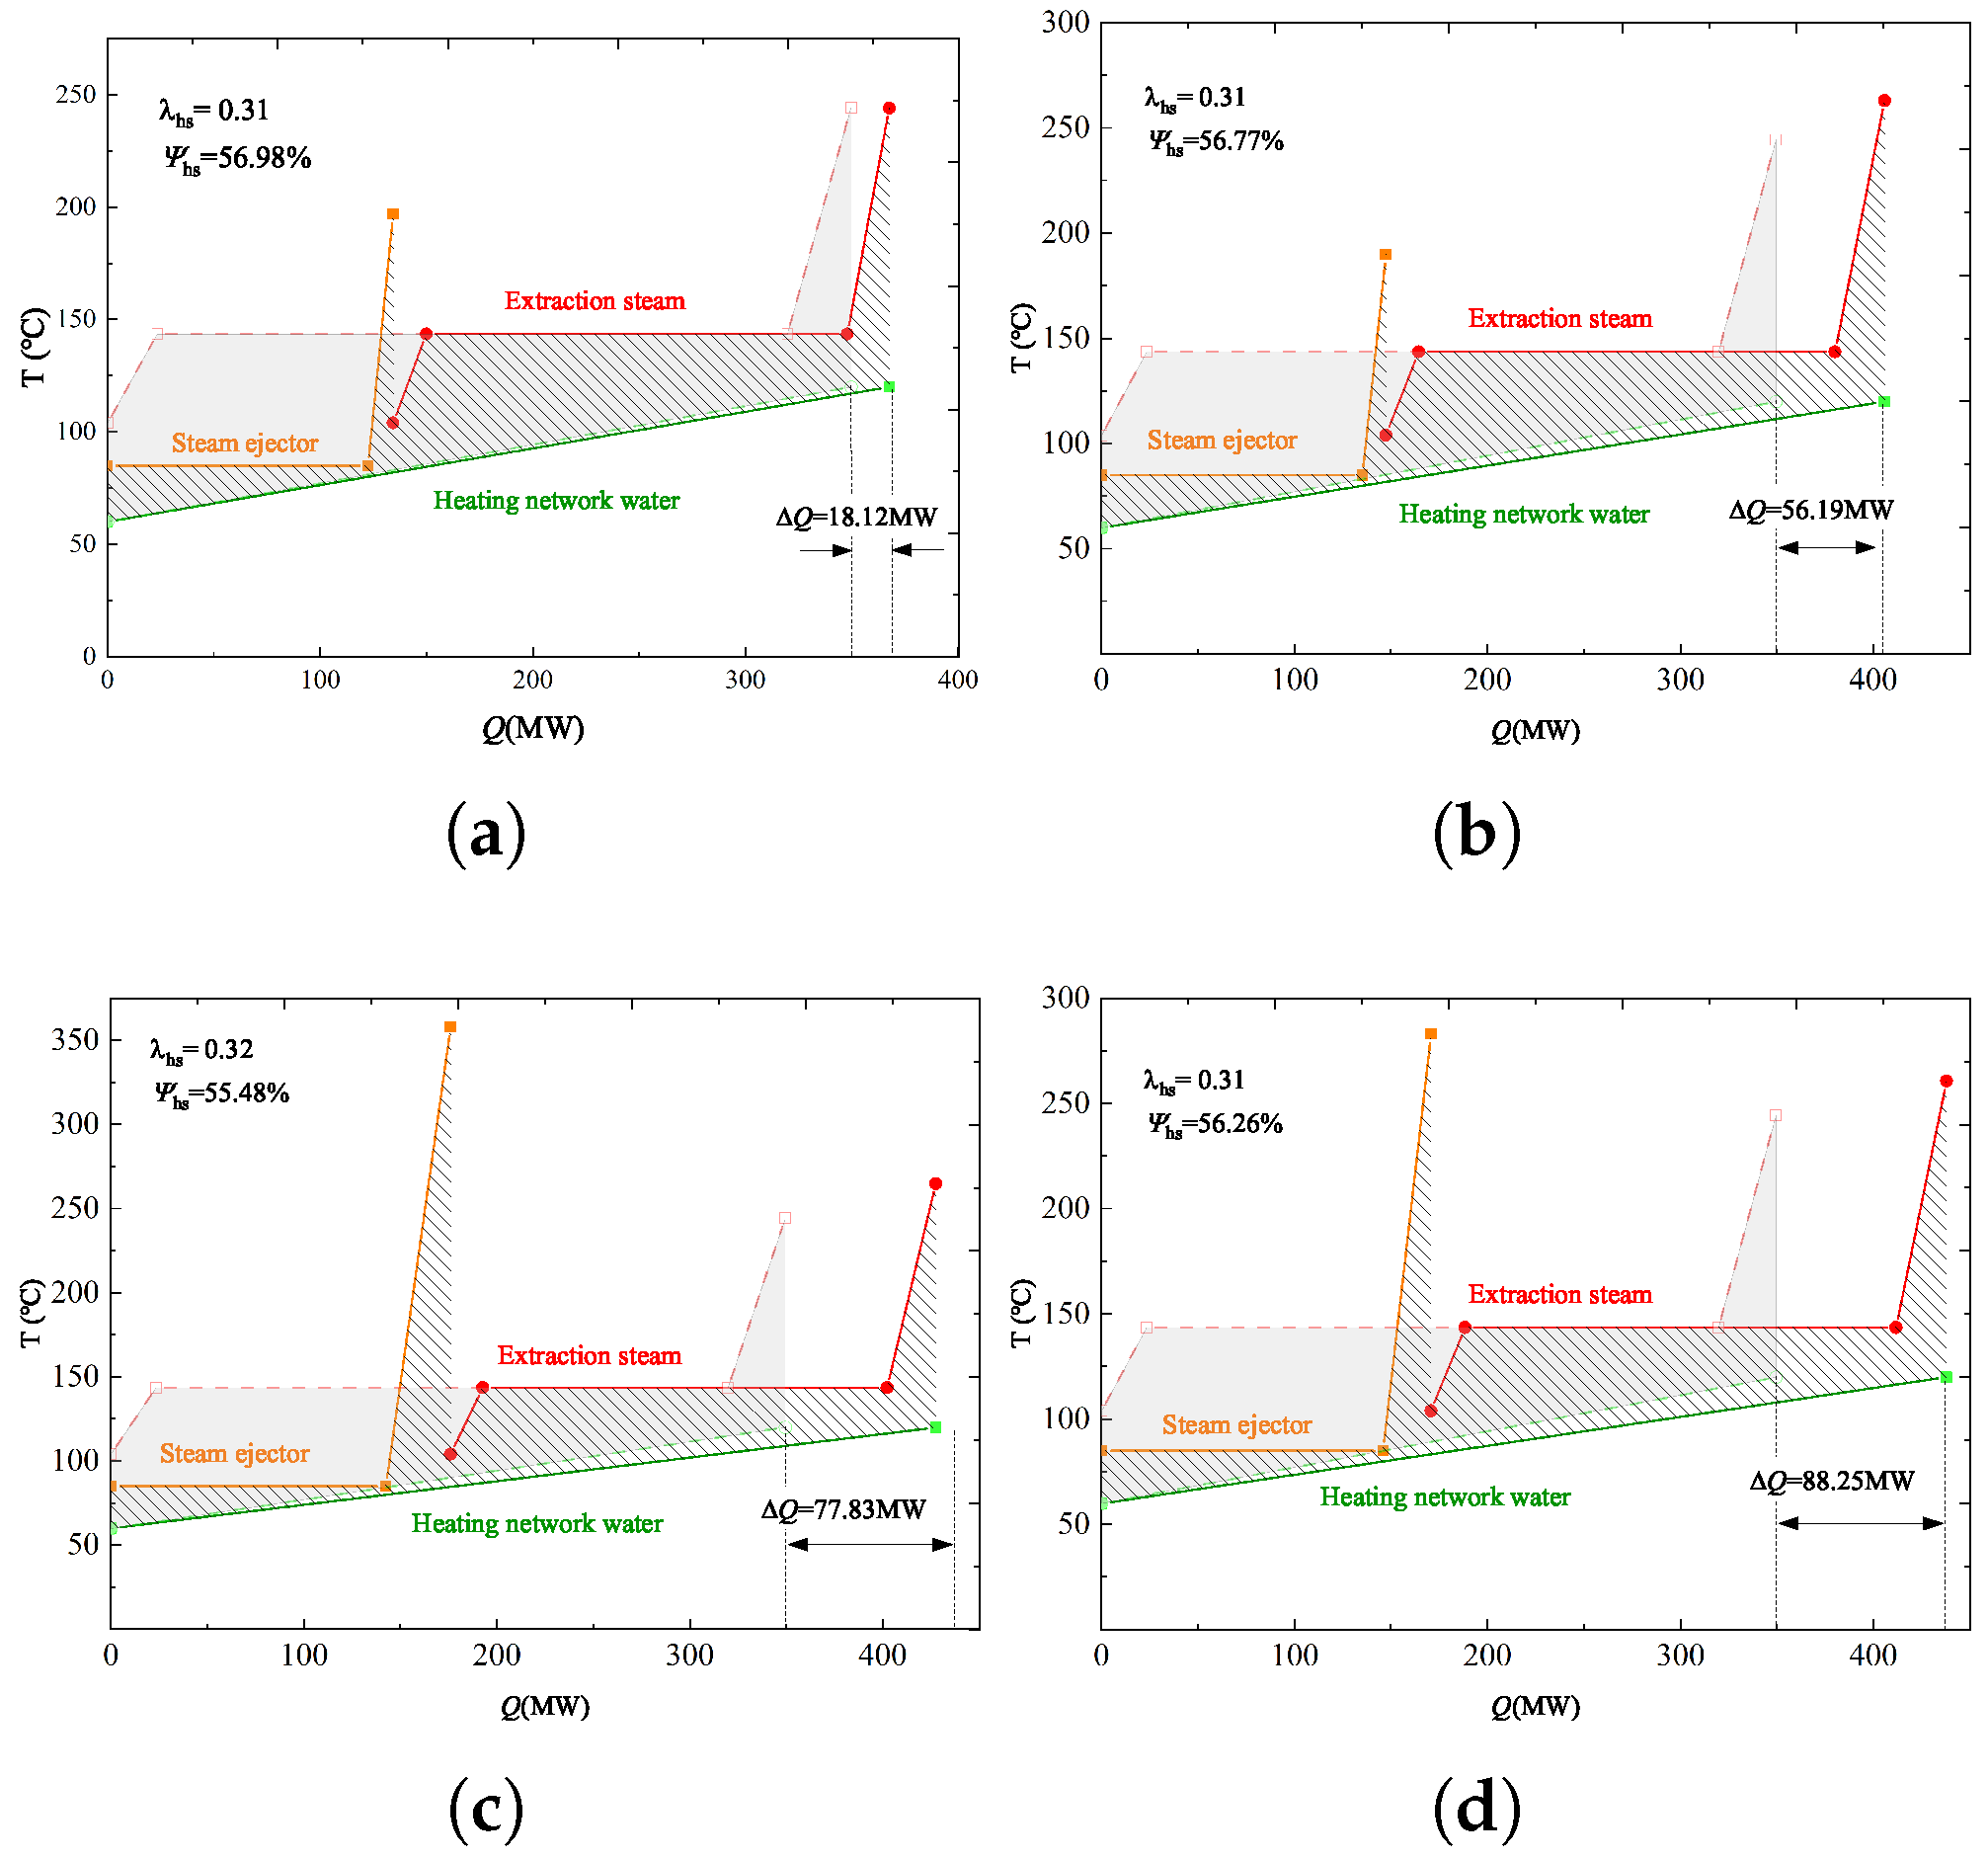
4.2. Heating Process Analysis under the Design Conditions

The integration of the steam ejector can change the performance of the heating process, not only Q g but also the thermodynamic characteristics. Figure 10 shows a comparison of the T-Q diagrams of the five systems. The Q g values of the systems with steam ejectors are higher than those of the basic system. As the quality of the driven steam improves, Q g successively increases by 18.12, 56.19, 77.83, and 88.25 MW in Systems 1–4, respectively. Additionally, in the low-temperature range (60–80 °C) of the first-stage heating process, the temperature difference is reduced significantly compared with the reference system. However, owing to the high superheat of the steam, exergy losses of the heat release process of the superheated steam are large, particularly for Systems 3 and 4. In the second stage, although the heat release processes are similar, the average temperature of the cold source (DH network water) is higher in Systems 1–4 than that in the basic system, which can also reduce the exergy loss.
Table 3 compares the thermodynamic performance indices of all systems. λ s , 2 n d is similar for Systems 1–4, but λ s , 1 s t is relatively low. Consequently, the λ s , 1 s t values of systems with a steam ejector are lower than those of the basic system. Among the novel systems, System 3 has the highest values of both λ s , 1 s t (0.275) and λ s (0.350), resulting in the lowest Q g (55.48%). Nonetheless, Ψ e x of System 3 is still 4.60% higher than that of the basic system.
Table 4 presents a performance comparison of the steam ejectors in Systems 1–4. System 4 recovers the most energy from exhausted steam, which is 72.34 MW, 43.18 MW higher than that of System 1. Meanwhile, μ of System 4 is the highest, reaching 0.78. The trend of μ follows that of σ . Although System 3 has a higher steam quality than System 2, the pressure loss during reheating results in a smaller σ for System 3 than that for System 2, resulting in a lower μ . Among Systems 1–4, System 3 has the highest heating ratio and driving steam energy, reaching 41.19% and 138.92 MW, respectively.

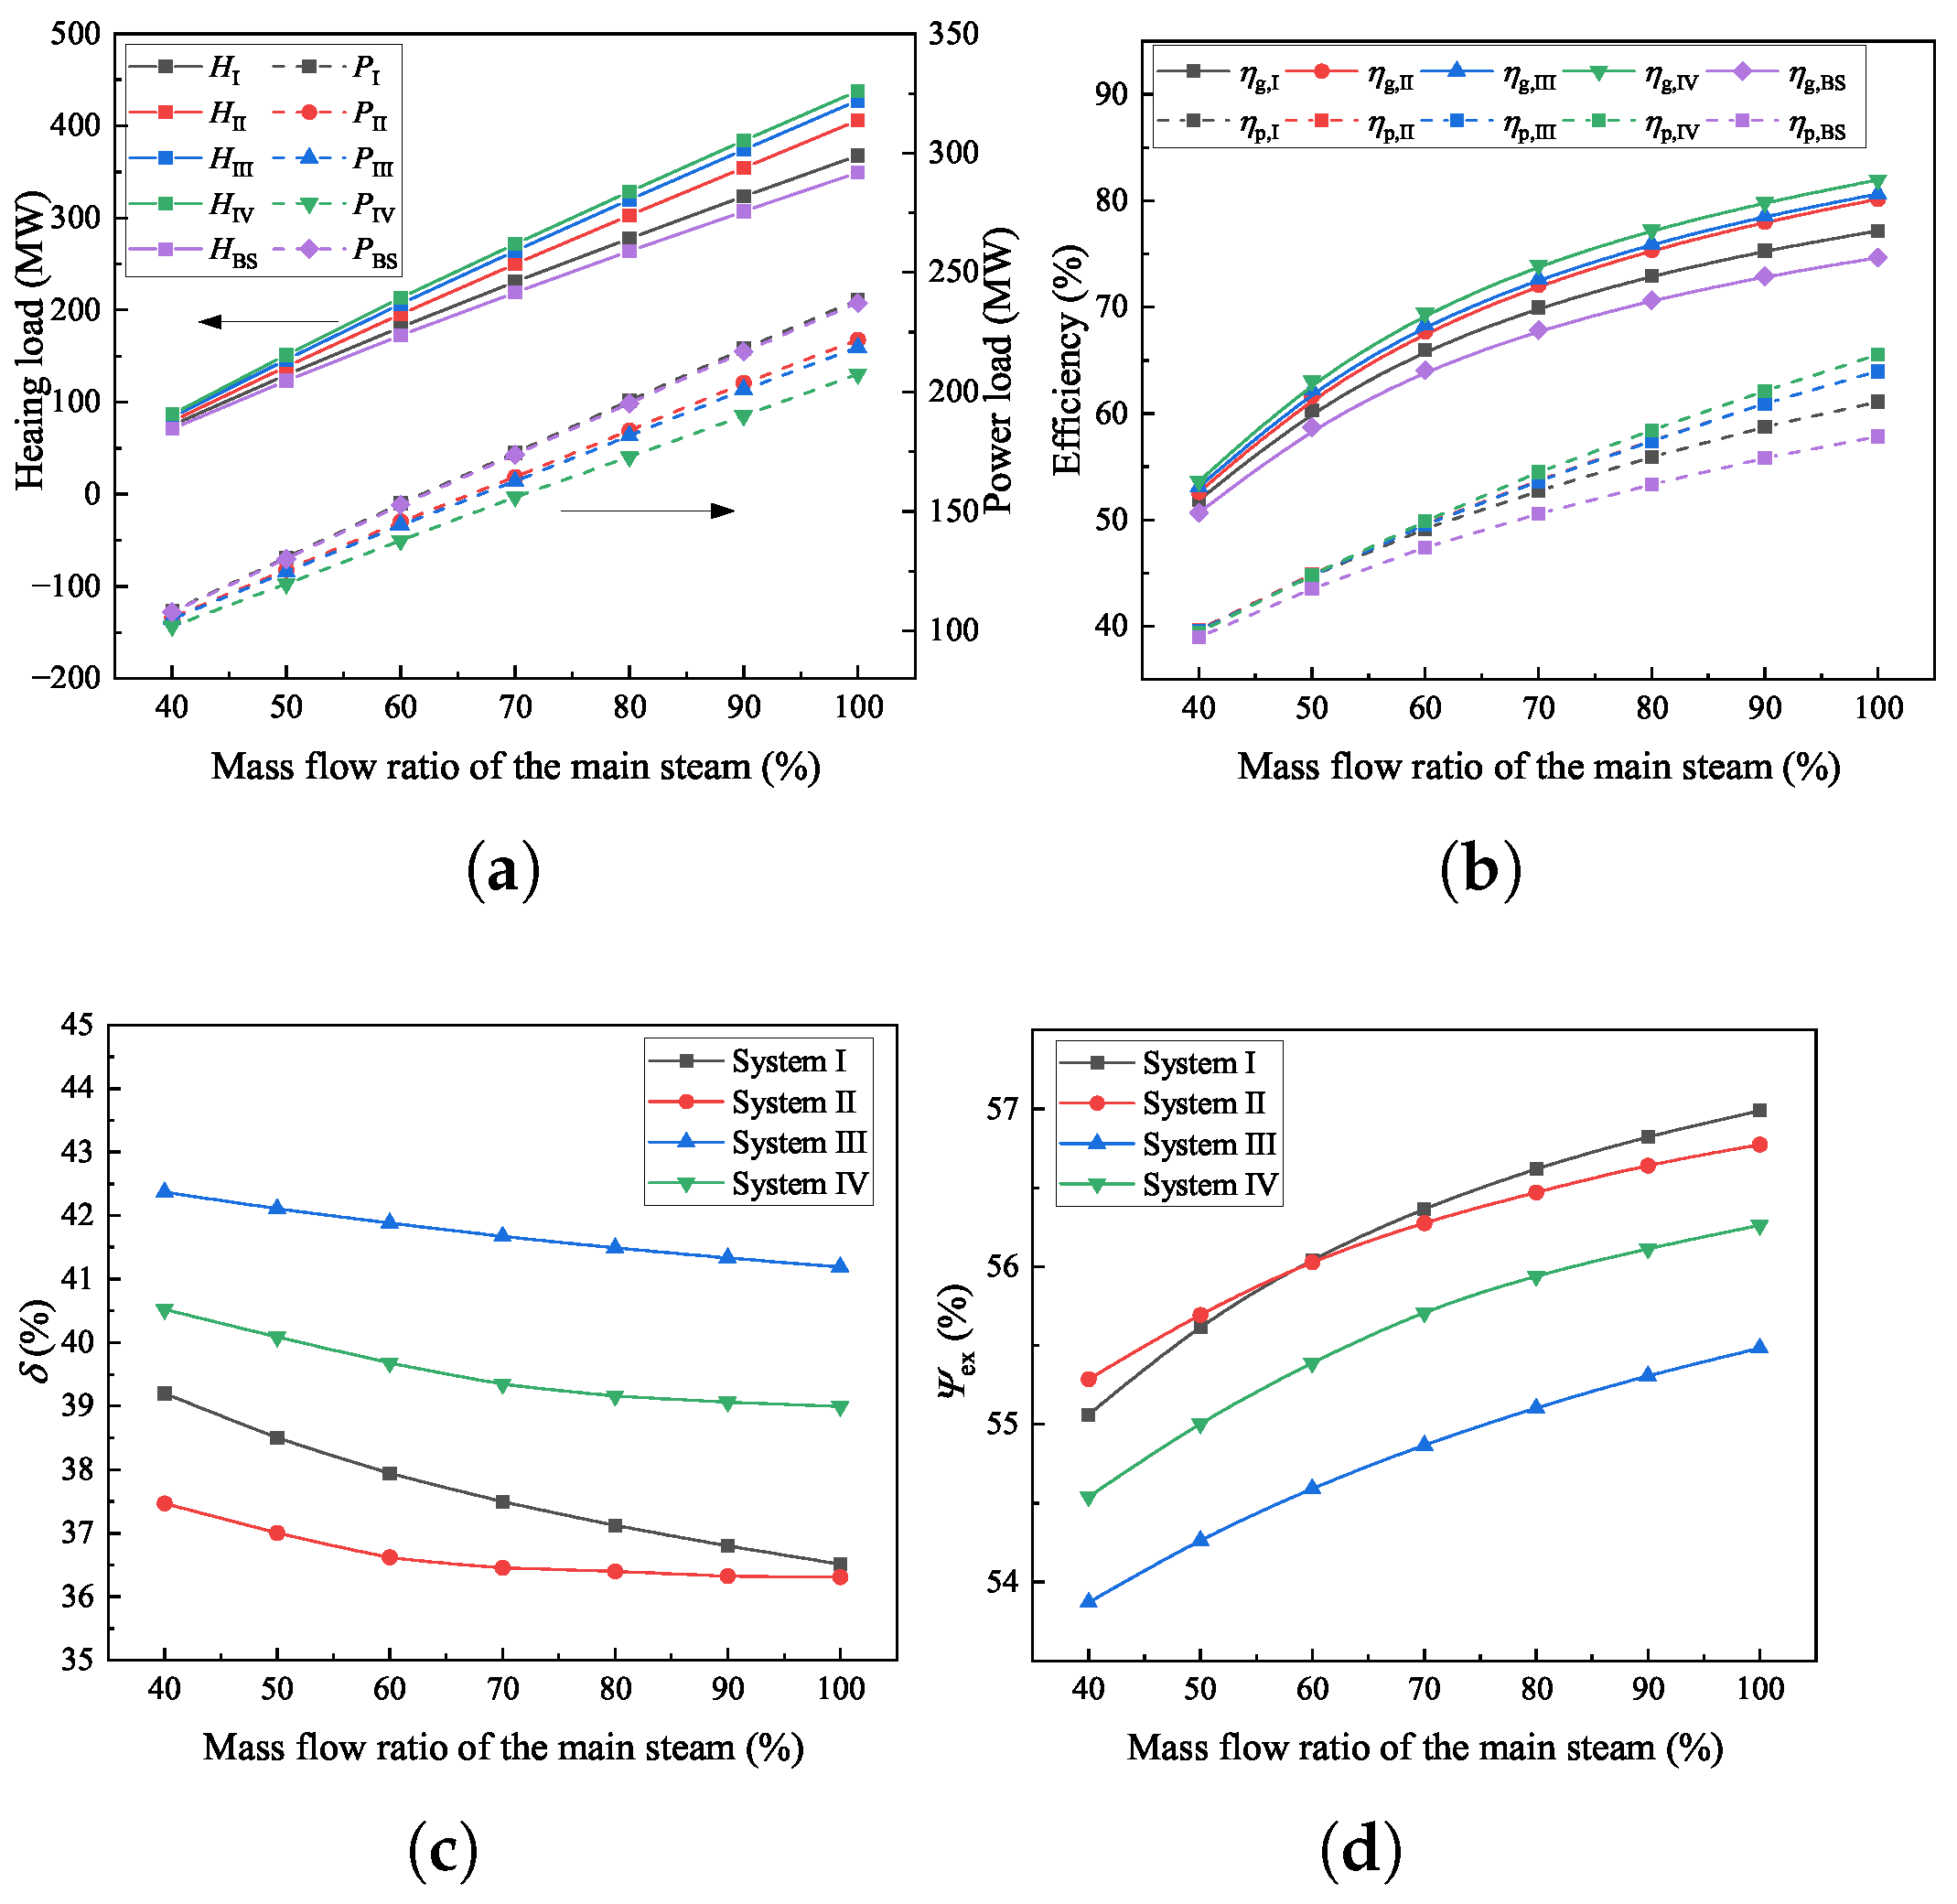
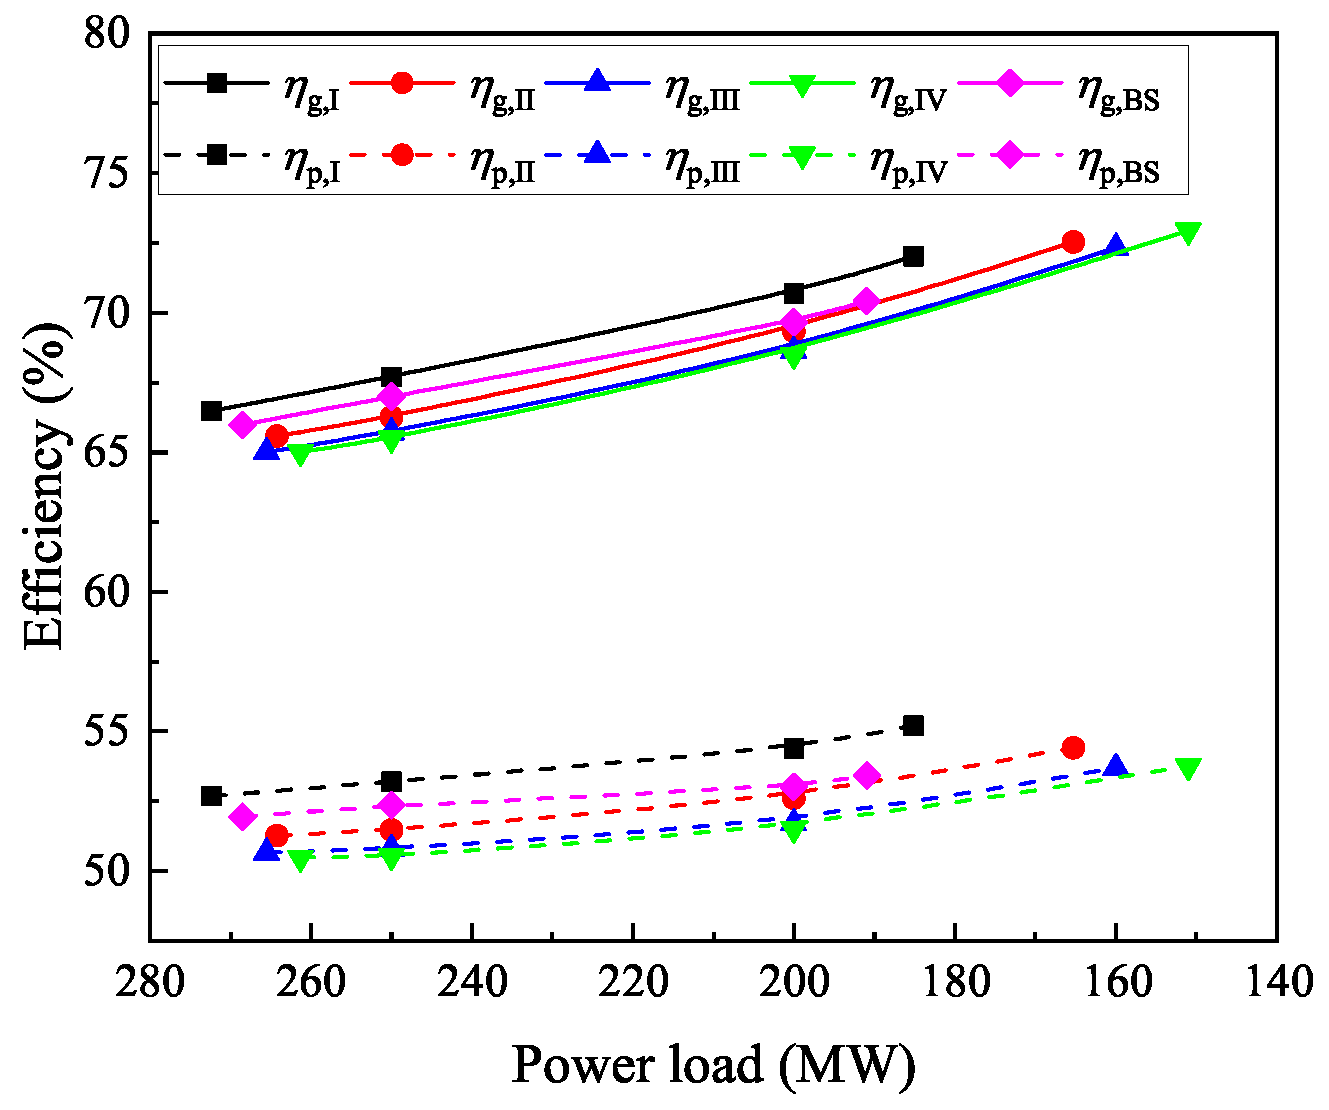
4.3. Thermodynamic and Operational Performance under the Off-Design Conditions

Considering that the system does not always operate with the maximum flow rate, the performance with different main-steam mass flow ratios is also conducted, shown in Figure 11. When the ratio decreases from 100% to 40%, System 4 has the largest reduction in Q g , with a decrement of 350.95 MW, whereas the corresponding reduction in P g is the lowest at 105.67 MW. In contrast, the reduction in Q g for the basic system is the lowest at 278.43 MW. The reduction in P g for the basic system is the largest at 130.54 MW. This can result in efficiency changes as shown in Figure 10b. With a decrease in the mass flow ratio, η g and η p of the five systems exhibit similar trends. This is because the flow rate of the exhaust steam remains constant under different conditions, resulting in a slight change in the exhaust steam loss. When the mass flow ratio decreases from 100% to 40%, the decrements in η g range from 23.96% to 28.32%, whereas those of η p range from 18.85% to 26.12%. Despite the largest decrease, η g and η p of System 4 remain the highest under different mass flow ratios.
Meanwhile, as the main steam flow ratio decreases, the heating ratio of the steam ejector increases slightly in Systems 1–4 as shown in Figure 10c. System 1 experiences the largest increase of 1.93%, from 56.99% to 55.06%. The heat load ratios of the steam ejector ( δ ) in Systems 2 and 4 change slightly as the flow ratio decreases from 100% to 70%, but exhibit a significant increase as it further decreases to 40%. The Ψ e x values of all four systems exhibit a decreasing trend, which is primarily attributed to the increase in the energy levels of the extraction steam and steam ejector as shown in Figure 10d. Furthermore, we can infer that the impact of the flow ratio changes on Ψ e x is insignificant. System 1 experiences the most significant change in Ψ e x among Systems 1–4, with a decrease of 2.69% when the flow ratio decreases from 100% to 40%.
Figure 12 shows the heat–power load operational regions of the five systems. At the same heat load, the upper and lower power limits of System 1 are slightly wider than those of the basic system. The upper power limits of Systems 2 and 3 remain relatively unchanged; however, the lower power limits are significantly lower than those of the basic system. Although the upper power load limit of System 4 is slightly lower than that of the basic system, its lower power load limit is lower than those of the other four systems.
With the constant heat load of 250 MW, Figure 13 gives the changes of η g and η p at different heat loads. η g and η p of all systems are increased with the decrement in the power load. The reason is that with the constant heat supply, the decreasing in power load is regulated by the reduction in the main steam flow. It could also lead to the decrement in the exhaust steam loss. With the same power load, η g and η p of System 1 are higher than those of the basic system when η g and η p of Systems 2–4 are lower. Among them, η g and η p of System 4 are the lowest in the power range of 261.32–190.94 MW.
The decrement in the lower power load limit could improve the regional share of renewable energy, which could provide peaking benefits to power plants. When the heat load is 250 MW, the lower power load limits of Systems 1–4 decrease by 4.79, 24.67, 30.96, and 39.97 MW, respectively, when compared with the basic system (190.94 MW). Assuming that the power is replaced by the renewal energy, the increasing powers would be 115.03, 592.12, 743.06, and 959.33 MWh per day with Systems 1–4, respectively. This would result in the standard coal consumption decrement of Systems 1–4 by 35.07, 180.52, 226.54, and 292.47 t, equivalent to the CO 2 emission reduction by 100.65, 518.11, 650.18, and 839.42 t, respectively [39]. Considering the peak-shaving policy, assuming that the subsidized price is 68 USD/MWh, the peaking revenue of Systems 1–4 would reach 7822, 40,264, 50,528, and 65,235 USD per day, respectively.

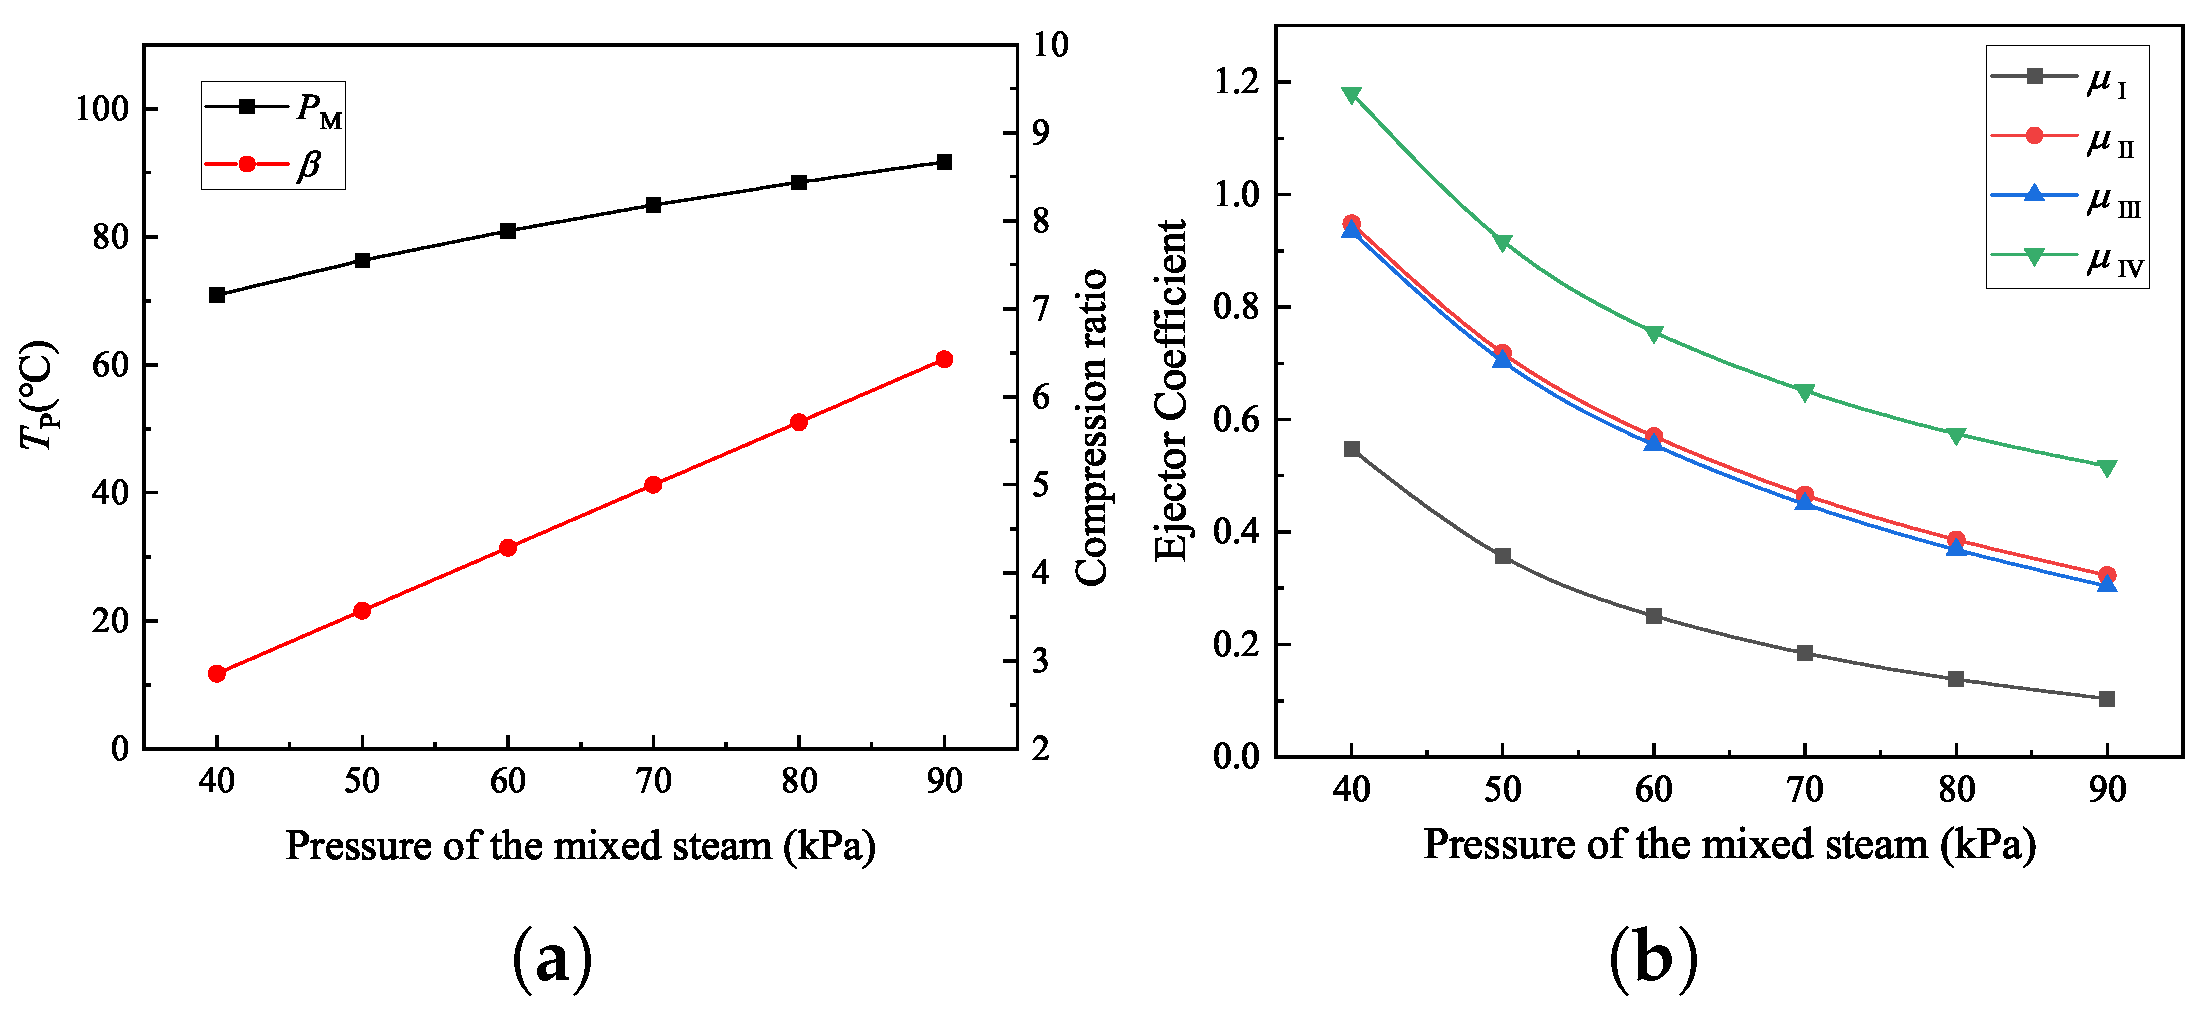
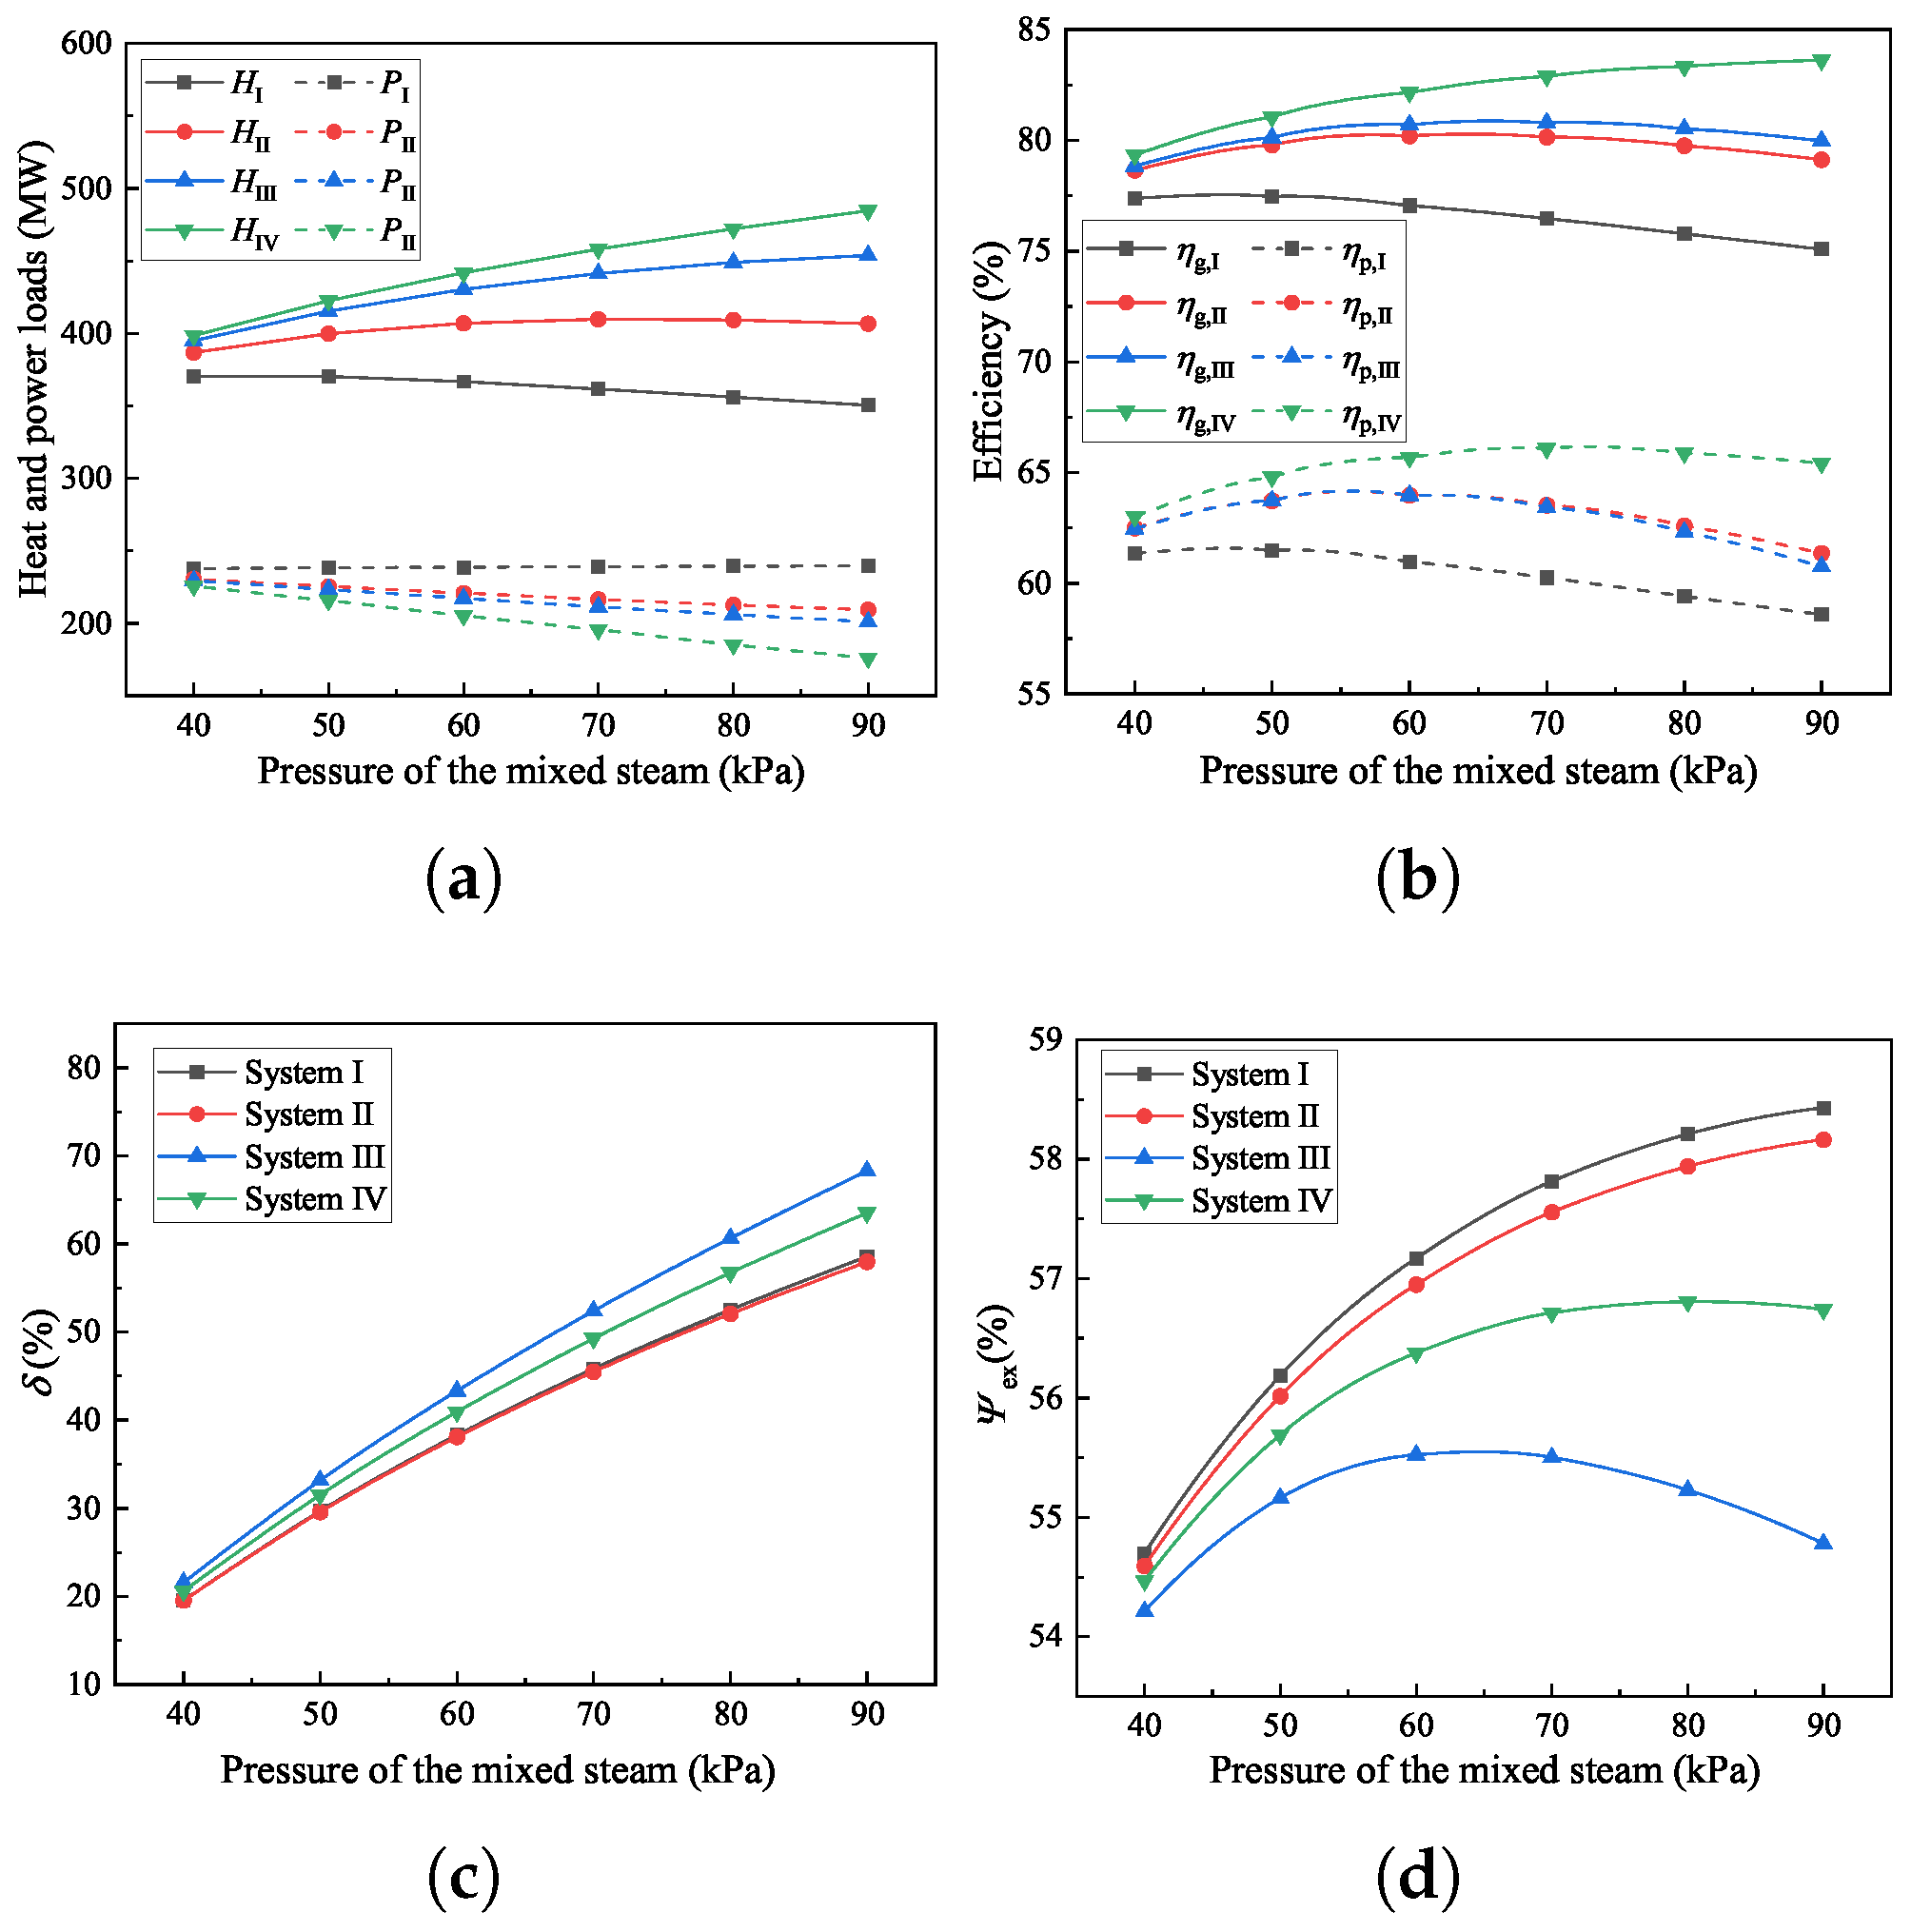
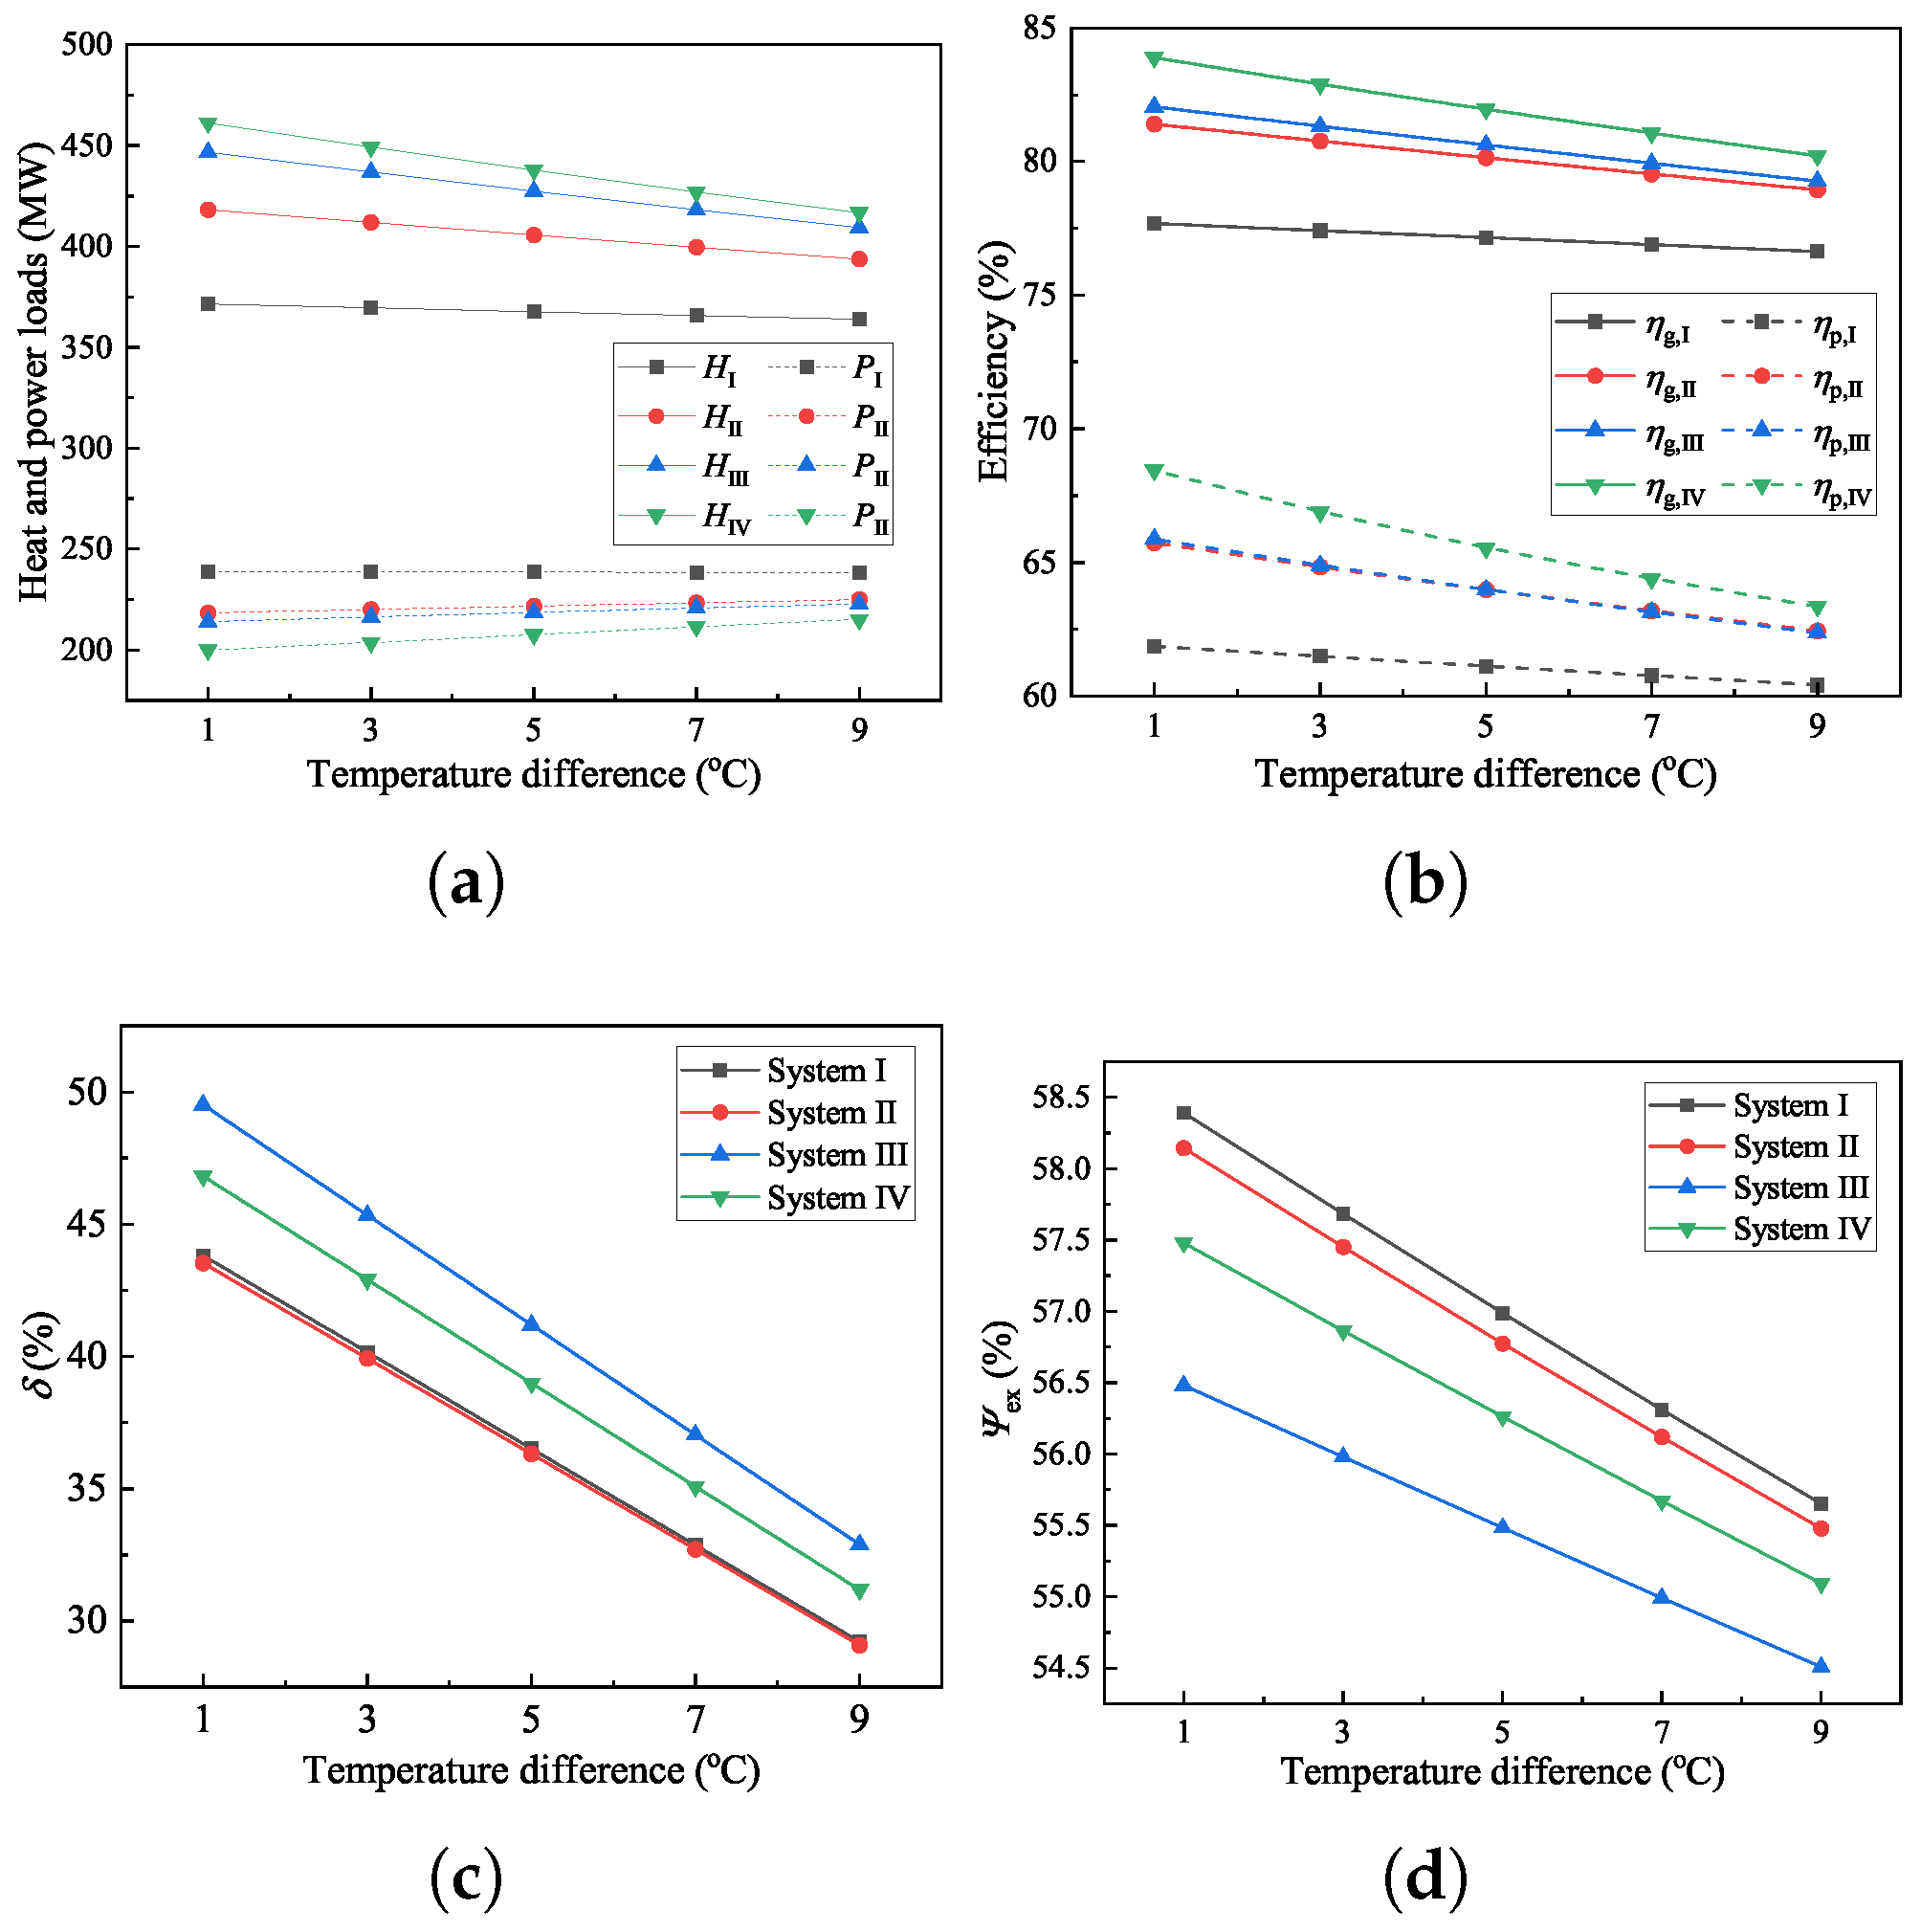
4.4. Sensitivity Analysis of the Heating Process

The heat load ratio of the steam ejector ( δ ) is directly affected by the temperature of the preheated water ( T P ), which subsequently influences the thermodynamic performance of the system. The two key parameters that can affect T P are the pressure of the mixed steam ( p M ) and pinch-point temperature difference ( Δ T P ) of the heating process. In this section, the influence of p M and Δ T P on the heating process and overall performance is analyzed.
As shown in Figure 14, an improvement in p M can result in increases in T P and β . As p M increases from 40 to 90 kPa, T P increases by 20.83 °C from 70.89 to 91.71 °C, whereas β increases by 3.57 from 2.86 to 6.43. Furthermore, the increment in β can reduce μ of the steam ejector as shown in Figure 14b. As p M increases from 40 to 90 kPa, the m u values of Systems 1–4 exhibit similar trends, with decrements of 0.44–0.66. A higher pressure of the extracted steam results in a larger decrease in μ .
Figure 15 shows the effect of p M on the performance of Systems 1–4. As p M increases from 40 to 90 kPa, the trends in P g and Q g differ. Q g of System 1 decreases from 370.22 to 350.35 MW, whereas P g increases slightly from 237.84 to 239.56 MW. However, the P g and Q g values of other systems show the opposite trend to System 1, increasing by 19.76–86.04 MW and decreasing by 20.96–49.89 MW, respectively, as shown in Figure 15a. This results in changes in η g and η g e n as shown in Figure 14b. The maximum η g e n values of Systems 1–4 are 61.48%, 63.97%, 63.96%, and 66.08%, respectively. The corresponding p M are 50, 60, 60, and 70 kPa, respectively. The η g of System 4 is increased from 79.35% to 83.62%, whereas the maximum η g of Systems 1–4 reach 77.45%, 80.19%, and 80.79%, respectively.
Meanwhile, as p M increases from 40 to 90 kPa, δ increases significantly as shown in Figure 15c. The four systems have different increments ranging from 38.41% to 46.68%, with System 3 having the largest increment. Ψ e x of Systems 1 and 2 exhibit an increasing trend when p M increases from 40 to 90 kPa, which are increases of 3.73% and 3.57%, respectively. The maximum Ψ values of Systems 3 and 4 are 55.52% and 56.80%, with corresponding p M values of 60 and 80 kPa, respectively.
Figure 16 shows the effect of Δ T P on the performance results of Systems 1–4. As Δ T P increases from 1 to 9 °C, the Q g values of all systems exhibit a decreasing trend. System 1 experiences the smallest decrement of 7.64 MW, whereas System 4 experiences the largest decrement of 44.55 MW. Correspondingly, P g of System 1 remains almost unchanged, whereas the P g values of Systems 2–4 increase by 6.67, 8.74, and 15.05 MW, respectively. Additionally, an increase in Δ T P causes a decrease in both η g and η g e n for all systems. As Δ T P increases from 1 to 9 °C, the η g values of Systems 1–4 decrease by 1.05%, 2.47%, 2.78%, and 3.68%, whereas the η g e n values decrease by 1.44%, 3.29%, 3.51%, and 5.09%, respectively.
As Δ T P increases from 1 to 9 °C, both heating ratios and Ψ e x of all systems exhibit decreasing trends. The decrease in δ in System 3 is the largest at 16.62%, whereas that of System 2 is the smallest at 14.44%. Meanwhile, the Ψ e x values of Systems 1–4 decrease slightly, decreasing by 1.98–2.74%.

4.5. Discussion

The above analysis shows that integrating steam injectors at different locations has different effects on the thermodynamic and operational characteristics of a system. From the thermodynamic analysis of the heating process, Systems 1 and 2 have higher exergy efficiencies, indicating that their heat transfer processes are more rational. However, System 4 is more advantageous in terms of efficiency in the maximum heat load, heat capacity, and lower power load limits. This is primarily caused by the difference in the quantity of recovered waste heat. Therefore, although this study reveals the potential of different integrated systems in terms of thermodynamic and operational characteristics, further improvement of the system is required. For example, the lower exergy efficiencies of the heat transfer process in Systems 3 and 4 are primarily caused by a high degree of superheating in the mixed steam of the ejector. The proper utilization of superheating aids in further improving system performance. In addition, the economic benefits of heat capacity and flexibility are highly influenced by the policies and development plans of the region; therefore, the results of this study must be combined with the actual loads and peaking policies of the region when they are used in practice. Our team will continue to conduct further studies.

5. Conclusions

In this study, coal-fired cogeneration systems integrated with steam ejectors at different locations are designed and modeled using EBSILON Professional. The thermodynamic and heating process analyses are performed under the design condition. Furthermore, the thermodynamic and operational characteristics of the five systems are compared under off-design conditions. Finally, sensitivity analyses are performed on the key parameters of the cascade-heating process.
Waste heat recovery using a steam ejector can significantly reduce exhaust steam loss in the cogeneration system. As the driving steam level increases, the heat recovery ratios of the exhaust steam under the design conditions are between 18.42% and 45.61% for Systems 1–4. Among them, System 4 has the most significant increase in Q g , resulting in increases of 7.29% in η g and 7.69% in η p compared with the basic system.
As the main steam mass flow ratio decreases, P g and Q g , as well as η g and η p , for all systems have a decreasing trend. System 4 experiences the largest reduction in Q g , whereas the corresponding reduction in P g is the smallest among Systems 1–4. Although System 4 experiences the greatest decline, it still has the highest η g and η p values among the different flow ratios. The operational analysis indicates that using a steam ejector can expand the power-load regulation range of a cogeneration system, and System 4 has the lowest low-power limit among all systems. With the heat load of 250 MW, System 1 has the highest η g and η p in the power range of 261.32–190.94 MW.
T P and the thermodynamic performance of the system are directly affected by p M of the ejector and Δ T P of the heating process. When p M increases, μ and Q g increase, whereas T P and P g decrease. The η p values of Systems 1–4 reach extreme values at different P M values. Increasing Δ T P can cause a reduction in P g , η g , and η p of Systems 1–4. Meanwhile, all systems exhibit a decreasing trend in their heating ratios and Ψ e x .
In conclusion, with the increment of the driving steam energy level, the maximum power load is decreased. Meanwhile, the heat recovery ratios of the exhaust steam and heating capacity are enhanced, resulting in increases in η g and η p . From the operational regulation point of view, the increment in the drive steam energy level could reduce both the upper and lower power limits of the system, and the latter reduction is more significant. This provides insight for improving the deep peaking capability of the cogeneration systems. The result contributes to a higher percentage of renewable energy in the region. In the next research, the following research directions will be conducted based on the paper: (1) detailed analysis of the coal saving, carbon reduction and economic benefit considering the specific policies and regional plan; (2) optimization scheme to decrease the superheat of mixed steam in Systems 3 and 4.

Author Contributions

Conceptualization, S.Z. and C.W.; methodology, S.Z.; software, C.W. and F.D.; validation, C.W., Z.T. and F.D.; formal analysis, S.Z.; investigation, C.W.; resources, S.Z.; data curation, F.D.; writing—original draft preparation, S.Z. and C.W.; visualization, Z.T.; supervision, S.Z.; project administration, S.Z. and C.W.; funding acquisition, S.Z. All authors have read and agreed to the published version of the manuscript.

Funding

The financial support from the National Natural Science Foundation of China (Grant No. 52206012) and Project of Central Plains Science and Technology Innovation Leading Talents of Henan Province (Grant No. 224200510022) are gratefully acknowledged.

Data Availability Statement

The original contributions presented in the study are included in the article, further inquiries can be directed to the corresponding author.

Conflicts of Interest

The authors declare no conflicts of interest.

Abbreviations

The following abbreviations are used in this manuscript:
AHPAbsorption heat pump
BSBasic system
DHDistrict heating
EHPElectric heat pump
HEHeat exchanger
HPTHigh-pressure turbine
LPTLow-pressure turbine
MPTMedium-pressure turbine
ORCOrganic Rankine cycle
RERelative error
RHRegenerative heater
THATurbine heat acceptance
TMCRTurbine maximum continuous rating

References

  1. Lu, D.; Peng, Y.; Sun, J. Dual-Stage Optimization Scheduling Model for a Grid-Connected Renewable Energy System with Hybrid Energy Storage. Energies 2024, 17, 737. [Google Scholar] [CrossRef]
  2. Coal 2022: Analysis and Forecast to 2025; Technical Report; International Energy Agency: Paris, France, 2022.
  3. Adamo, A.; De La Hoz, J.; Martín, H.; Rubio, J.; Coronas, S. An Analysis of the Development of the Cogeneration Sector in Spain: A Comprehensive Review of the Period 1980–2020 from a Regulatory Perspective. Energies 2024, 17, 625. [Google Scholar] [CrossRef]
  4. Armoo, E.A.; Mohammed, M.; Narra, S.; Beguedou, E.; Agyenim, F.B.; Kemausuor, F. Achieving Techno-Economic Feasibility for Hybrid Renewable Energy Systems through the Production of Energy and Alternative Fuels. Energies 2024, 17, 735. [Google Scholar] [CrossRef]
  5. Wang, X.; Cui, C.; Pan, C.; Zhang, C.; Ren, H.; Ghias, A.M. A Deep Reinforcement Learning Control Strategy to Improve the Operating Flexibility of CHP Units under Variable Load Conditions. Therm. Sci. Eng. Prog. 2024, 49, 102482. [Google Scholar] [CrossRef]
  6. Neacșa, A.; Panait, M.; Mureșan, J.D.; Voica, M.C.; Manta, O. The Energy Transition between Desideratum and Challenge: Are Cogeneration and Trigeneration the Best Solution? Int. J. Environ. Res. Public Health 2022, 19, 3039. [Google Scholar] [CrossRef] [PubMed]
  7. Gu, Z.; He, S.; Li, X.; Sun, P.; Wu, J.; Hu, H.; Zhang, Q.; Jiang, J. Hundred-Watt Implantable TEG Module for Large-Scale Exhaust Gas Waste Heat Recovery. Energies 2024, 17, 665. [Google Scholar] [CrossRef]
  8. Park, H. Locational Role Analysis of Energy Storage Systems Based on Optimal Capacity Needs and Operations under High Penetration of Renewable Energy. Energies 2024, 17, 743. [Google Scholar] [CrossRef]
  9. Wang, J.; You, S.; Zong, Y.; Træholt, C.; Dong, Z.Y.; Zhou, Y. Flexibility of Combined Heat and Power Plants: A Review of Technologies and Operation Strategies. Appl. Energy 2019, 252, 113445. [Google Scholar] [CrossRef]
  10. Figaj, R. Energy and Economic Sustainability of a Small-Scale Hybrid Renewable Energy System Powered by Biogas, Solar Energy, and Wind. Energies 2024, 17, 706. [Google Scholar] [CrossRef]
  11. Yu, Y.X. Sodium/Potassium Intercalation on the Cu4S4 Nanosheet Accompanied by a Surface Phase Transition and Their Competition with Protons. ACS Appl. Energy Mater. 2023, 6, 10048–10060. [Google Scholar] [CrossRef]
  12. Sun, F.; Zhao, X.; Chen, X.; Fu, L.; Liu, L. New Configurations of District Heating System Based on Natural Gas and Deep Geothermal Energy for Higher Energy Efficiency in Northern China. Appl. Therm. Eng. 2019, 151, 439–450. [Google Scholar] [CrossRef]
  13. Amaris, C.; Miranda, B.; Balbis-Morejón, M. Experimental Thermal Performance and Modelling of a Waste Heat Recovery Unit in an Energy Cogeneration System. Therm. Sci. Eng. Prog. 2020, 20, 100684. [Google Scholar] [CrossRef]
  14. Giordano, L.; Benedetti, M. A Methodology for the Identification and Characterization of Low-Temperature Waste Heat Sources and Sinks in Industrial Processes: Application in the Italian Dairy Sector. Energies 2022, 15, 155. [Google Scholar] [CrossRef]
  15. Farshi, L.G.; Khalili, S. Thermoeconomic Analysis of a New Ejector Boosted Hybrid Heat Pump (EBHP) and Comparison with Three Conventional Types of Heat Pumps. Energy 2019, 170, 619–635. [Google Scholar] [CrossRef]
  16. Abdelkareem, M.A.; Maghrabie, H.M.; Sayed, E.T.; Kais, E.C.A.; Abo-Khalil, A.G.; Radi, M.A.; Baroutaji, A.; Olabi, A. Heat Pipe-Based Waste Heat Recovery Systems: Background and Applications. Therm. Sci. Eng. Prog. 2022, 29, 101221. [Google Scholar] [CrossRef]
  17. Nandhini, R.; Sivaprakash, B.; Rajamohan, N. Waste Heat Recovery at Low Temperature from Heat Pumps, Power Cycles and Integrated Systems—Review on System Performance and Environmental Perspectives. Sustain. Energy Technol. Assess. 2022, 52, 102214. [Google Scholar] [CrossRef]
  18. Zhang, H.; Liu, Y.; Liu, X.; Duan, C. Energy and Exergy Analysis of a New Cogeneration System Based on an Organic Rankine Cycle and Absorption Heat Pump in the Coal-Fired Power Plant. Energy Conv. Manag. 2020, 223, 113293. [Google Scholar] [CrossRef]
  19. Zhao, S.; Wang, W.; Ge, Z. Thermodynamic, Operational, and Techno-Economic Analysis of the Cascade Heating System with a Double-Unit. Energy Conv. Manag. 2020, 226, 113558. [Google Scholar] [CrossRef]
  20. Chen, H.; Xiao, Y.; Xu, G.; Xu, J.; Yao, X.; Yang, Y. Energy-Saving Mechanism and Parametric Analysis of the High Back-Pressure Heating Process in a 300 MW Coal-Fired Combined Heat and Power Unit. Appl. Therm. Eng. 2019, 149, 829–840. [Google Scholar] [CrossRef]
  21. Chen, C.; Ge, Z.; Zhang, Y. Study of Combined Heat and Power Plant Integration with Thermal Energy Storage for Operational Flexibility. Appl. Therm. Eng. 2023, 219, 119537. [Google Scholar] [CrossRef]
  22. Wang, X.; Wu, Y.; Fu, L. Evaluation of Combined Heat and Power Plants with Electricity Regulation. Appl. Therm. Eng. 2023, 227, 120364. [Google Scholar] [CrossRef]
  23. Zhang, Y.; Ge, Z.; Yang, Y.; Hao, J.; Xu, L.; Du, X.; Træholt, C. Carbon Reduction and Flexibility Enhancement of the CHP-based Cascade Heating System with Integrated Electric Heat Pump. Energy Conv. Manag. 2023, 280, 116801. [Google Scholar] [CrossRef]
  24. Ahmed, F.; Chen, W. Investigation of Steam Ejector Parameters under Three Optimization Algorithm Using ANN. Appl. Therm. Eng. 2023, 225, 120205. [Google Scholar] [CrossRef]
  25. Paul, S.; Kumar, P.; Rao, S.M. Thermodynamic Analysis on the Effect of Supercritical CO2 Ejector in Cogeneration Cycle for Dairy Application. Therm. Sci. Eng. Prog. 2023, 39, 101729. [Google Scholar] [CrossRef]
  26. Siddiqui, M.A.; Khaliq, A.; Kumar, R. Proposal and Analysis of a Novel Cooling-Power Cogeneration System Driven by the Exhaust Gas Heat of HCCI Engine Fuelled by Wet-Ethanol. Energy 2021, 232, 120954. [Google Scholar] [CrossRef]
  27. Ifaei, P.; Safder, U.; Tayerani Charmchi, A.S.; Yoo, C. An Integrated Steam Jet Ejector Power Plant for Drought Adaptation Considering Water-Exergy Nexus in an Optimal Platform. Energy Conv. Manag. 2021, 227, 113622. [Google Scholar] [CrossRef]
  28. Pang, J.; Ge, Z.; Zhang, Y.; Du, X. Comparative Designs and Optimizations of the Steam Ejector for a CHP System. Appl. Therm. Eng. 2023, 226, 120345. [Google Scholar] [CrossRef]
  29. Liu, M.; Liu, M.; Wang, Y.; Chen, W.; Yan, J. Thermodynamic Optimization of Coal-Fired Combined Heat and Power (CHP) Systems Integrated with Steam Ejectors to Achieve Heat—Power Decoupling. Energy 2021, 229, 120707. [Google Scholar] [CrossRef]
  30. Chen, H.; Wang, Y.; Li, J.; Xu, G.; Lei, J.; Liu, T. Thermodynamic Analysis and Economic Assessment of an Improved Geothermal Power System Integrated with a Biomass-Fired Cogeneration Plant. Energy 2022, 240, 122477. [Google Scholar] [CrossRef]
  31. Cao, Y.; Dhahad, H.A.; Togun, H.; Haghghi, M.A.; Anqi, A.E.; Farouk, N.; Rosen, M.A. Seasonal Design and Multi-Objective Optimization of a Novel Biogas-Fueled Cogeneration Application. Int. J. Hydrogen Energy 2021, 46, 21822–21843. [Google Scholar] [CrossRef]
  32. Fazeli, A.; Zandi, S.; Golbaten Mofrad, K.; Salehi, G.; Khoshgoftar Manesh, M.H.; Shirmohammadi, R. Comparative Thermoeconomic Optimization and Exergoenvironmental Analysis of an Ejector Refrigeration Cycle Integrated with a Cogeneration System Utilizing Waste Exhaust Heat Recovery. Environ. Prog. Sustain. Energy 2022, 41, e13875. [Google Scholar] [CrossRef]
  33. Zhang, Y.; Xiong, N.; Ge, Z.; Zhang, Y.; Hao, J.; Yang, Z. A Novel Cascade Heating System for Waste Heat Recovery in the Combined Heat and Power Plant Integrating with the Steam Jet Pump. Appl. Energy 2020, 278, 115690. [Google Scholar] [CrossRef]
  34. Liu, M.; Liu, M.; Chen, W.; Yan, J. Operational Flexibility and Operation Optimization of CHP Units Supplying Electricity and Two-Pressure Steam. Energy 2023, 263, 125988. [Google Scholar] [CrossRef]
  35. Chen, W.; Zhang, S.; Ahmed, F.; Fan, J.; Chong, D.; Yan, J. Simulation Investigation on Performance of a Power—Water Cogeneration System Coupled with a Two-Stage Thermal Vapor Compressor. Case Stud. Therm. Eng. 2021, 28, 101435. [Google Scholar] [CrossRef]
  36. Tan, Z.; Feng, X.; Wang, Y. Performance Comparison of Different Heat Pumps in Low-Temperature Waste Heat Recovery. Renew. Sustain. Energy Rev. 2021, 152, 111634. [Google Scholar] [CrossRef]
  37. Zhao, S.; Ge, Z.; Sun, J.; Ding, Y.; Yang, Y. Comparative Study of Flexibility Enhancement Technologies for the Coal-Fired Combined Heat and Power Plant. Energy Conv. Manag. 2019, 184, 15–23. [Google Scholar] [CrossRef]
  38. Li, Y.; An, H.; Li, W.; Zhang, S.; Jia, X.; Fu, L. Thermodynamic, Energy Consumption and Economic Analyses of the Novel Cogeneration Heating System Based on Condensed Waste Heat Recovery. Energy Conv. Manag. 2018, 177, 671–681. [Google Scholar] [CrossRef]
  39. Ma, J.; Wu, Y.; Chen, X. A New Integration Scheme for CO2 Capture in Low-Rank Coal Fired Power Plants with Energy Savings. Appl. Therm. Eng. 2023, 228, 120476. [Google Scholar] [CrossRef]
Figure 1. Schematic of the coal-fired cogeneration system (basic system).
Energies 17 02463 g001
Figure 2. Energy flow of the basic system.
Energies 17 02463 g002
Figure 3. Schematic of the cogeneration system integrated with the steam ejector.
Energies 17 02463 g003
Figure 4. Schematic of the model in EBSILON Professional (System 4).
Energies 17 02463 g004
Figure 5. Comparison between simulated and designed values.
Energies 17 02463 g005
Figure 6. Diagram of the cascade heating system.
Energies 17 02463 g006
Figure 7. Energy flow of the novel system: (a) System 1; (b) System 2; (c) System 3; (d) System 4.
Energies 17 02463 g007
Figure 8. Energy distribution of the five systems under the design conditions.
Energies 17 02463 g008
Figure 9. Efficiencies of the five systems under the design conditions.
Energies 17 02463 g009
Figure 10. T-Q diagrams of the heating process in the five systems: (a) System 1; (b) System 2; (c) System 3; (d) System 4.
Energies 17 02463 g010
Figure 11. Thermodynamic performance with different main steam mass flow ratios: (a) Heat and power loads; (b) Efficiency; (c) Heat load ratio of the first stage; (d) exergy efficiency.
Energies 17 02463 g011
Figure 12. Heat–power loads operational region of the five systems.
Energies 17 02463 g012
Figure 13. Efficiencies at different power loads (H = 250 MW).
Energies 17 02463 g013
Figure 14. Influence of P M on the heating process: (a) T P and compression ratio; (b) Ejector coefficient.
Energies 17 02463 g014
Figure 15. Influence of P M on the thermodynamic performance: (a) Heat and power loads; (b) Efficiency; (c) Heat load ratio of the first stage; (d) exergy efficiency.
Energies 17 02463 g015
Figure 16. Influence of Δ T P on the thermodynamic performance: (a) Heat and power loads; (b) Efficiency; (c) Heat load ratio of the first stage; (d) exergy efficiency.
Energies 17 02463 g016
Table 1. Main parameters of the basic system.
ItemsUnitTMCRMaximum Heating (Design)
Main steam
     Mass flow ratet/h1017.921017.92
     PressureMPa16.6716.67
     Temperature°C538538
Reheated steam
     Mass flow ratet/h847.02839.05
     PressureMPa3.583.48
     Temperature°C538538
Extraction steam for heating
     Mass flow ratet/h500
     PressureMPa0.4
     Steam temperature°C244.28
     Drain water temperature°C104
Heat loadMW428.97
Power loadMW322245.47
Net power loadMW313.42237.19
Energy inputMW797.42797.42
Back pressurekPa1414
Table 2. Main parameters of the regenerative system under the THA condition.
ItemsUnitRH1RH2RH3DeaeratorRH5RH6RH7
PressureMPa6.203.981.901.030.630.260.089
Temperature°C390.4332.6442.7355.9294.5
EnthalpykJ/kg3151.53051.33343.33170.53049.92868.22677.8
Mass flowt/h69.4160.0033.6629.6043.6941.5047.60
Table 3. Comparison of thermodynamic performance results of the heating process.
ItemsBasic SystemSystem 1System 2System 3System 4
λ s , 1 s t 0.2460.2450.2750.260
λ s , 2 n d 0.3480.3480.3500.3500.350
λ s 0.3480.3110.3120.3190.315
λ w 0.1770.1770.1770.1770.177
Ψ e x 50.88%56.98%56.77%55.48%56.26%
Table 4. Performance of steam ejectors in Systems 1–4.
ItemsUnitSystem 1System 2System 3System 4
Extraction steamMW124.09111.20138.92120.98
Exhaust steamMW29.1657.0759.2072.34
Return waterMW18.9920.9622.0622.62
Compression ratio ( β )%4.134.134.134.13
Expansion ratio ( σ )%28.57234.40207.951190.71
Ejector coefficient ( μ )%0.270.600.580.78
δ %36.51%36.31%41.19%38.99%
Disclaimer/Publisher’s Note: The statements, opinions and data contained in all publications are solely those of the individual author(s) and contributor(s) and not of MDPI and/or the editor(s). MDPI and/or the editor(s) disclaim responsibility for any injury to people or property resulting from any ideas, methods, instructions or products referred to in the content.

