In this section, we focus on the previously described model and first discuss the entire process of chemical reactions between two ions in the porous media region. Subsequently, we explore the effects of various influencing factors, namely, porosity, ion concentration, and inflow velocity, on the chemical reactions.
3.1. Chemical Reaction and Heat Transfer Analysis in Fractured Porous Media Region
In the simulation of the - species transport model simulated in the fractured porous media region, the following initial conditions were considered at different time points: t = 750 years, 1500 years, 2250 years, and 3000 years. An analysis was conducted to examine the variations in porosity, velocity, temperature, and concentration field.
- (1)
Porosity Variation
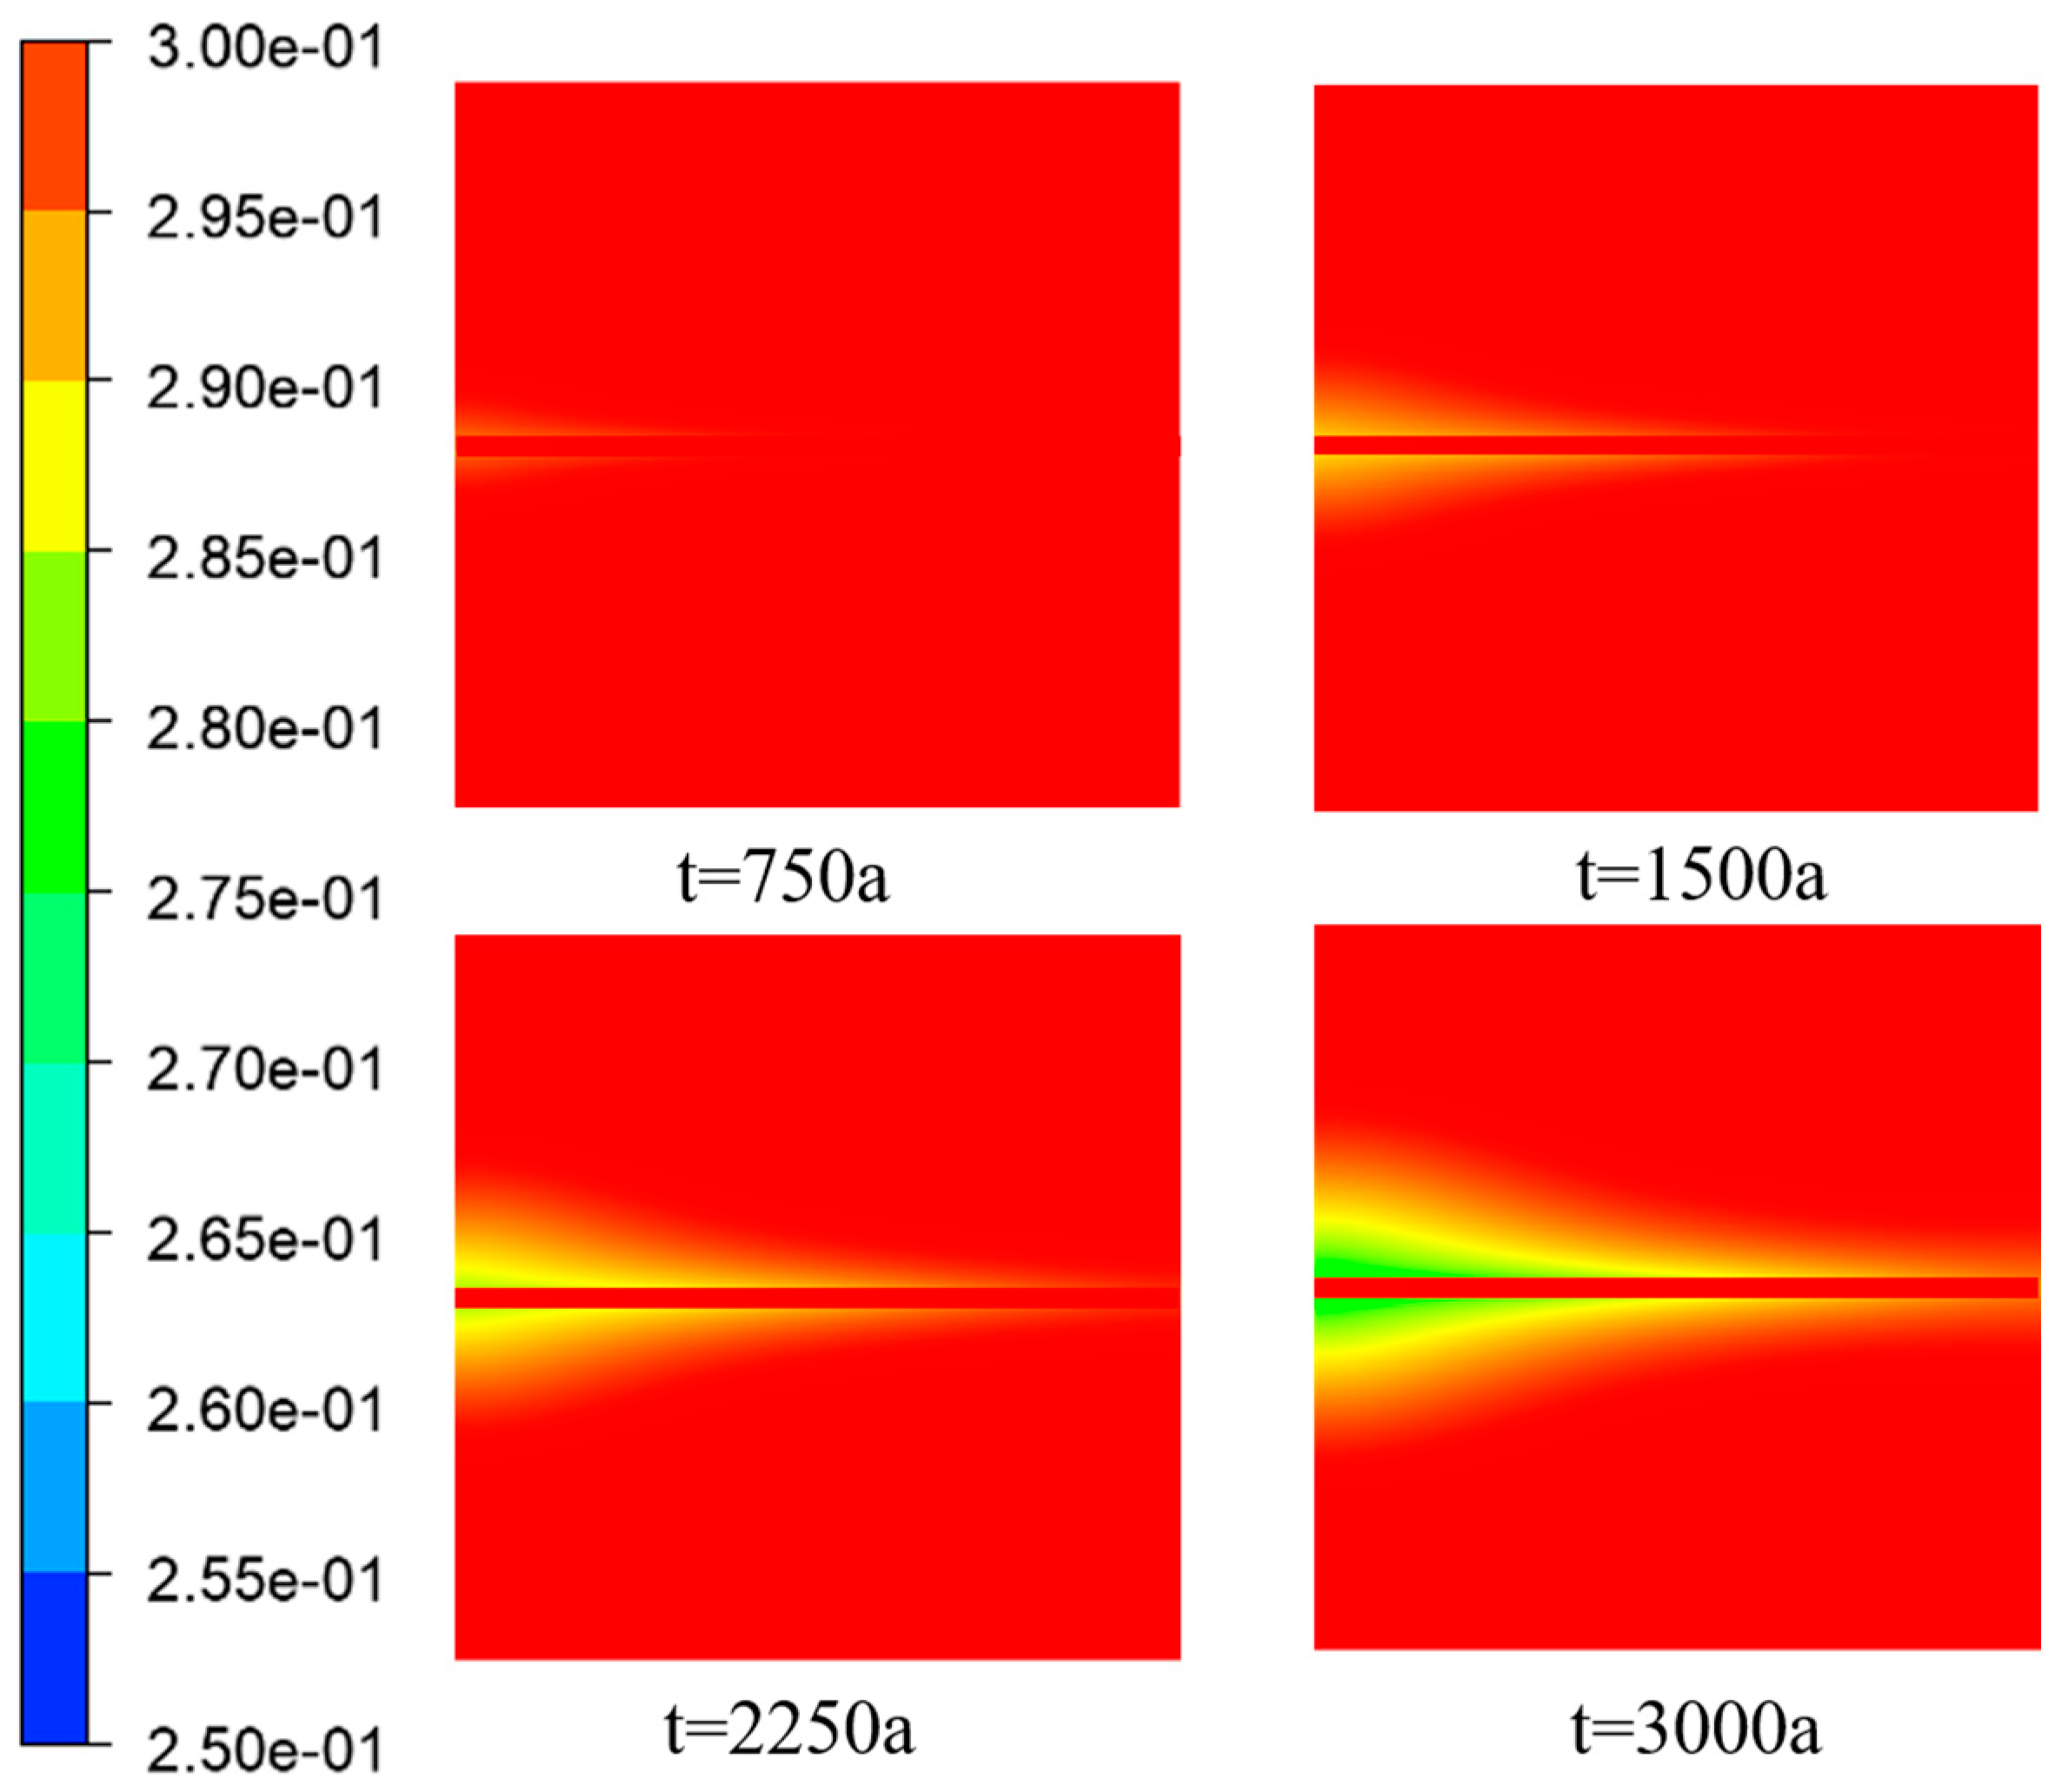
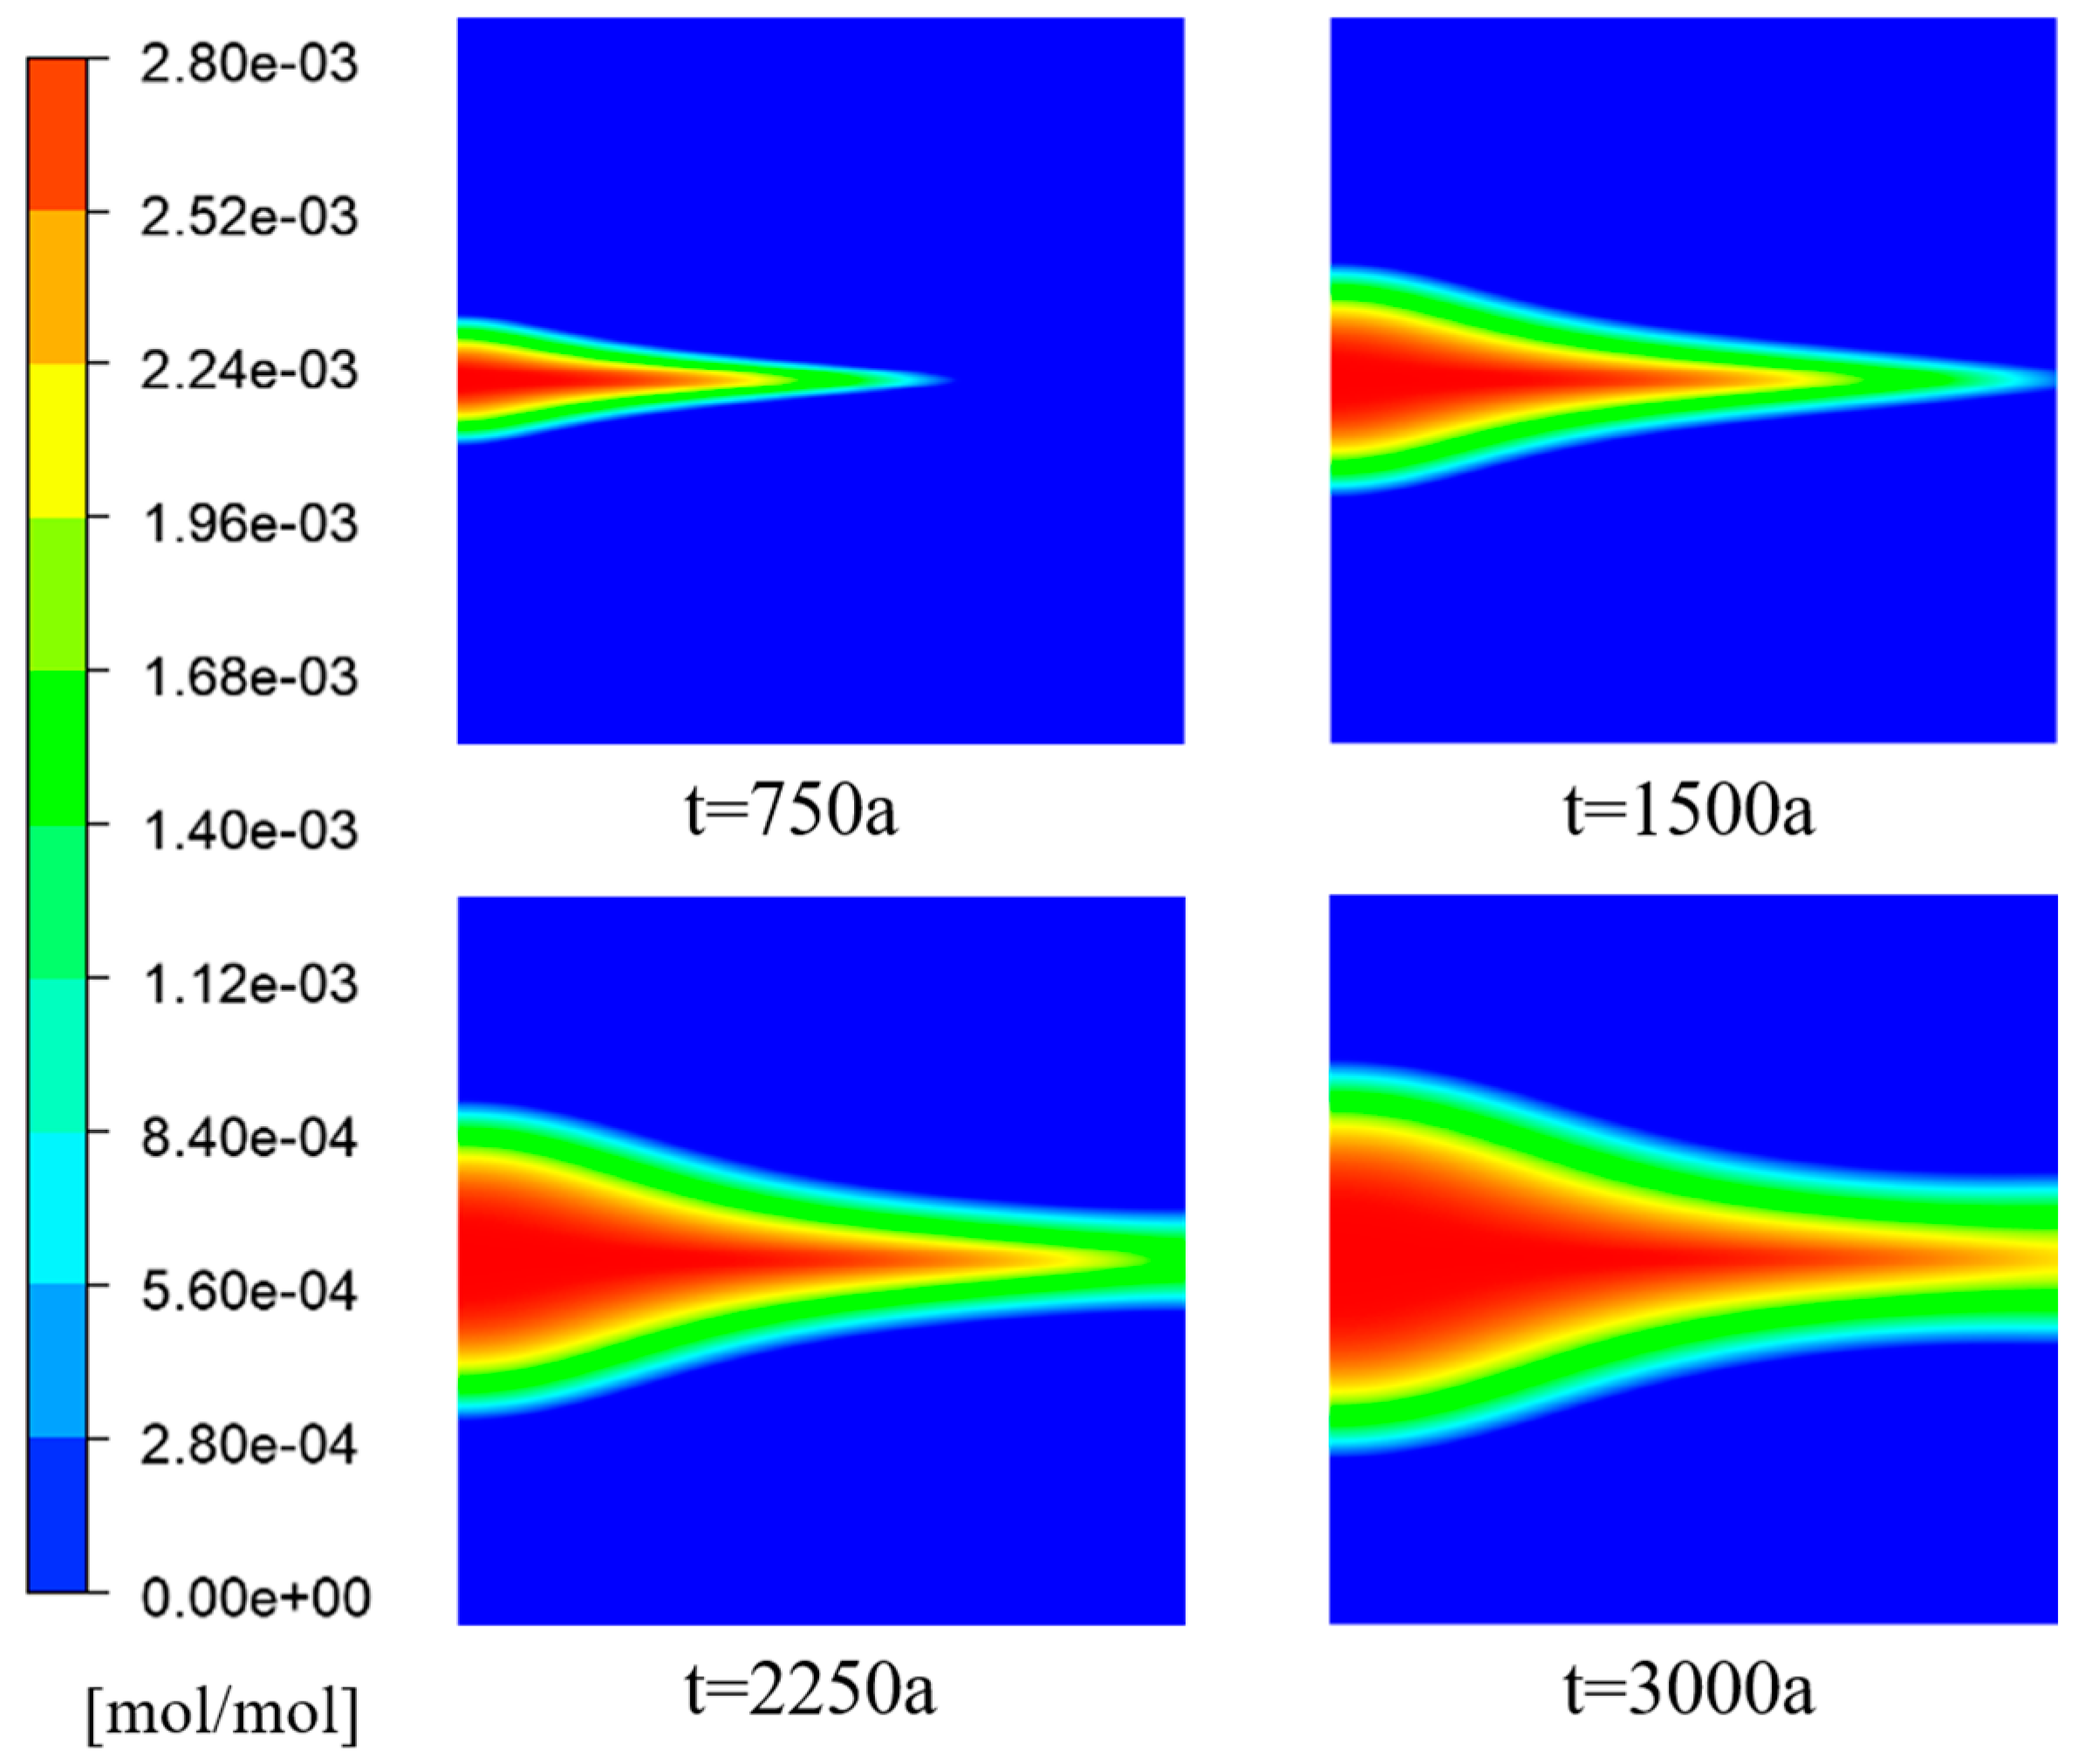
Figure 5 illustrates the distribution of porosity at different time intervals. The initial porosity of the porous media region is represented by the red color and had a value of 0.4. The green color indicates a decrease in porosity caused by the deposition of
, resulting in a reduction in porosity within the porous media framework. In the intermediate fracture region, the aperture was set to 1, corresponding to a porosity of 1. The deposition of
in this region was minimal, significantly less than in the porous media region. Consequently, the porosity within the fracture remains unchanged and was equal to 1. This section specifically focuses on discussing the variation in porosity within the porous media region on both sides of the fracture.
From
Figure 5 and
Figure 6, it can be observed that the porosity decreased in the X-direction on both sides of the fracture, including the inlet region, as the
reacted with
to form precipitates. It was determined that the Péclet number (
), which represents the ratio of convective transport rate to diffusive transport rate, was greater than 1. This indicated that convective transport slightly dominated over diffusive transport, causing most of the sulfate ions to flow within the fracture and diffuse into the porous media regions on both sides.
Ions naturally diffuse from areas of high concentration to areas of low concentration, and since the sulfate ion concentration is the highest at the inlet, diffusion initially occurs near the inlet region. In the absence of chemical reactions, ion diffusion would typically exhibit a triangular shape. However, in this study, an arc-shaped edge was observed at the inlet, indicating that the deposition of in the porous media region altered the porosity and hindered ion diffusion.
- (2)
Analysis of Flow and Heat Transfer
According to
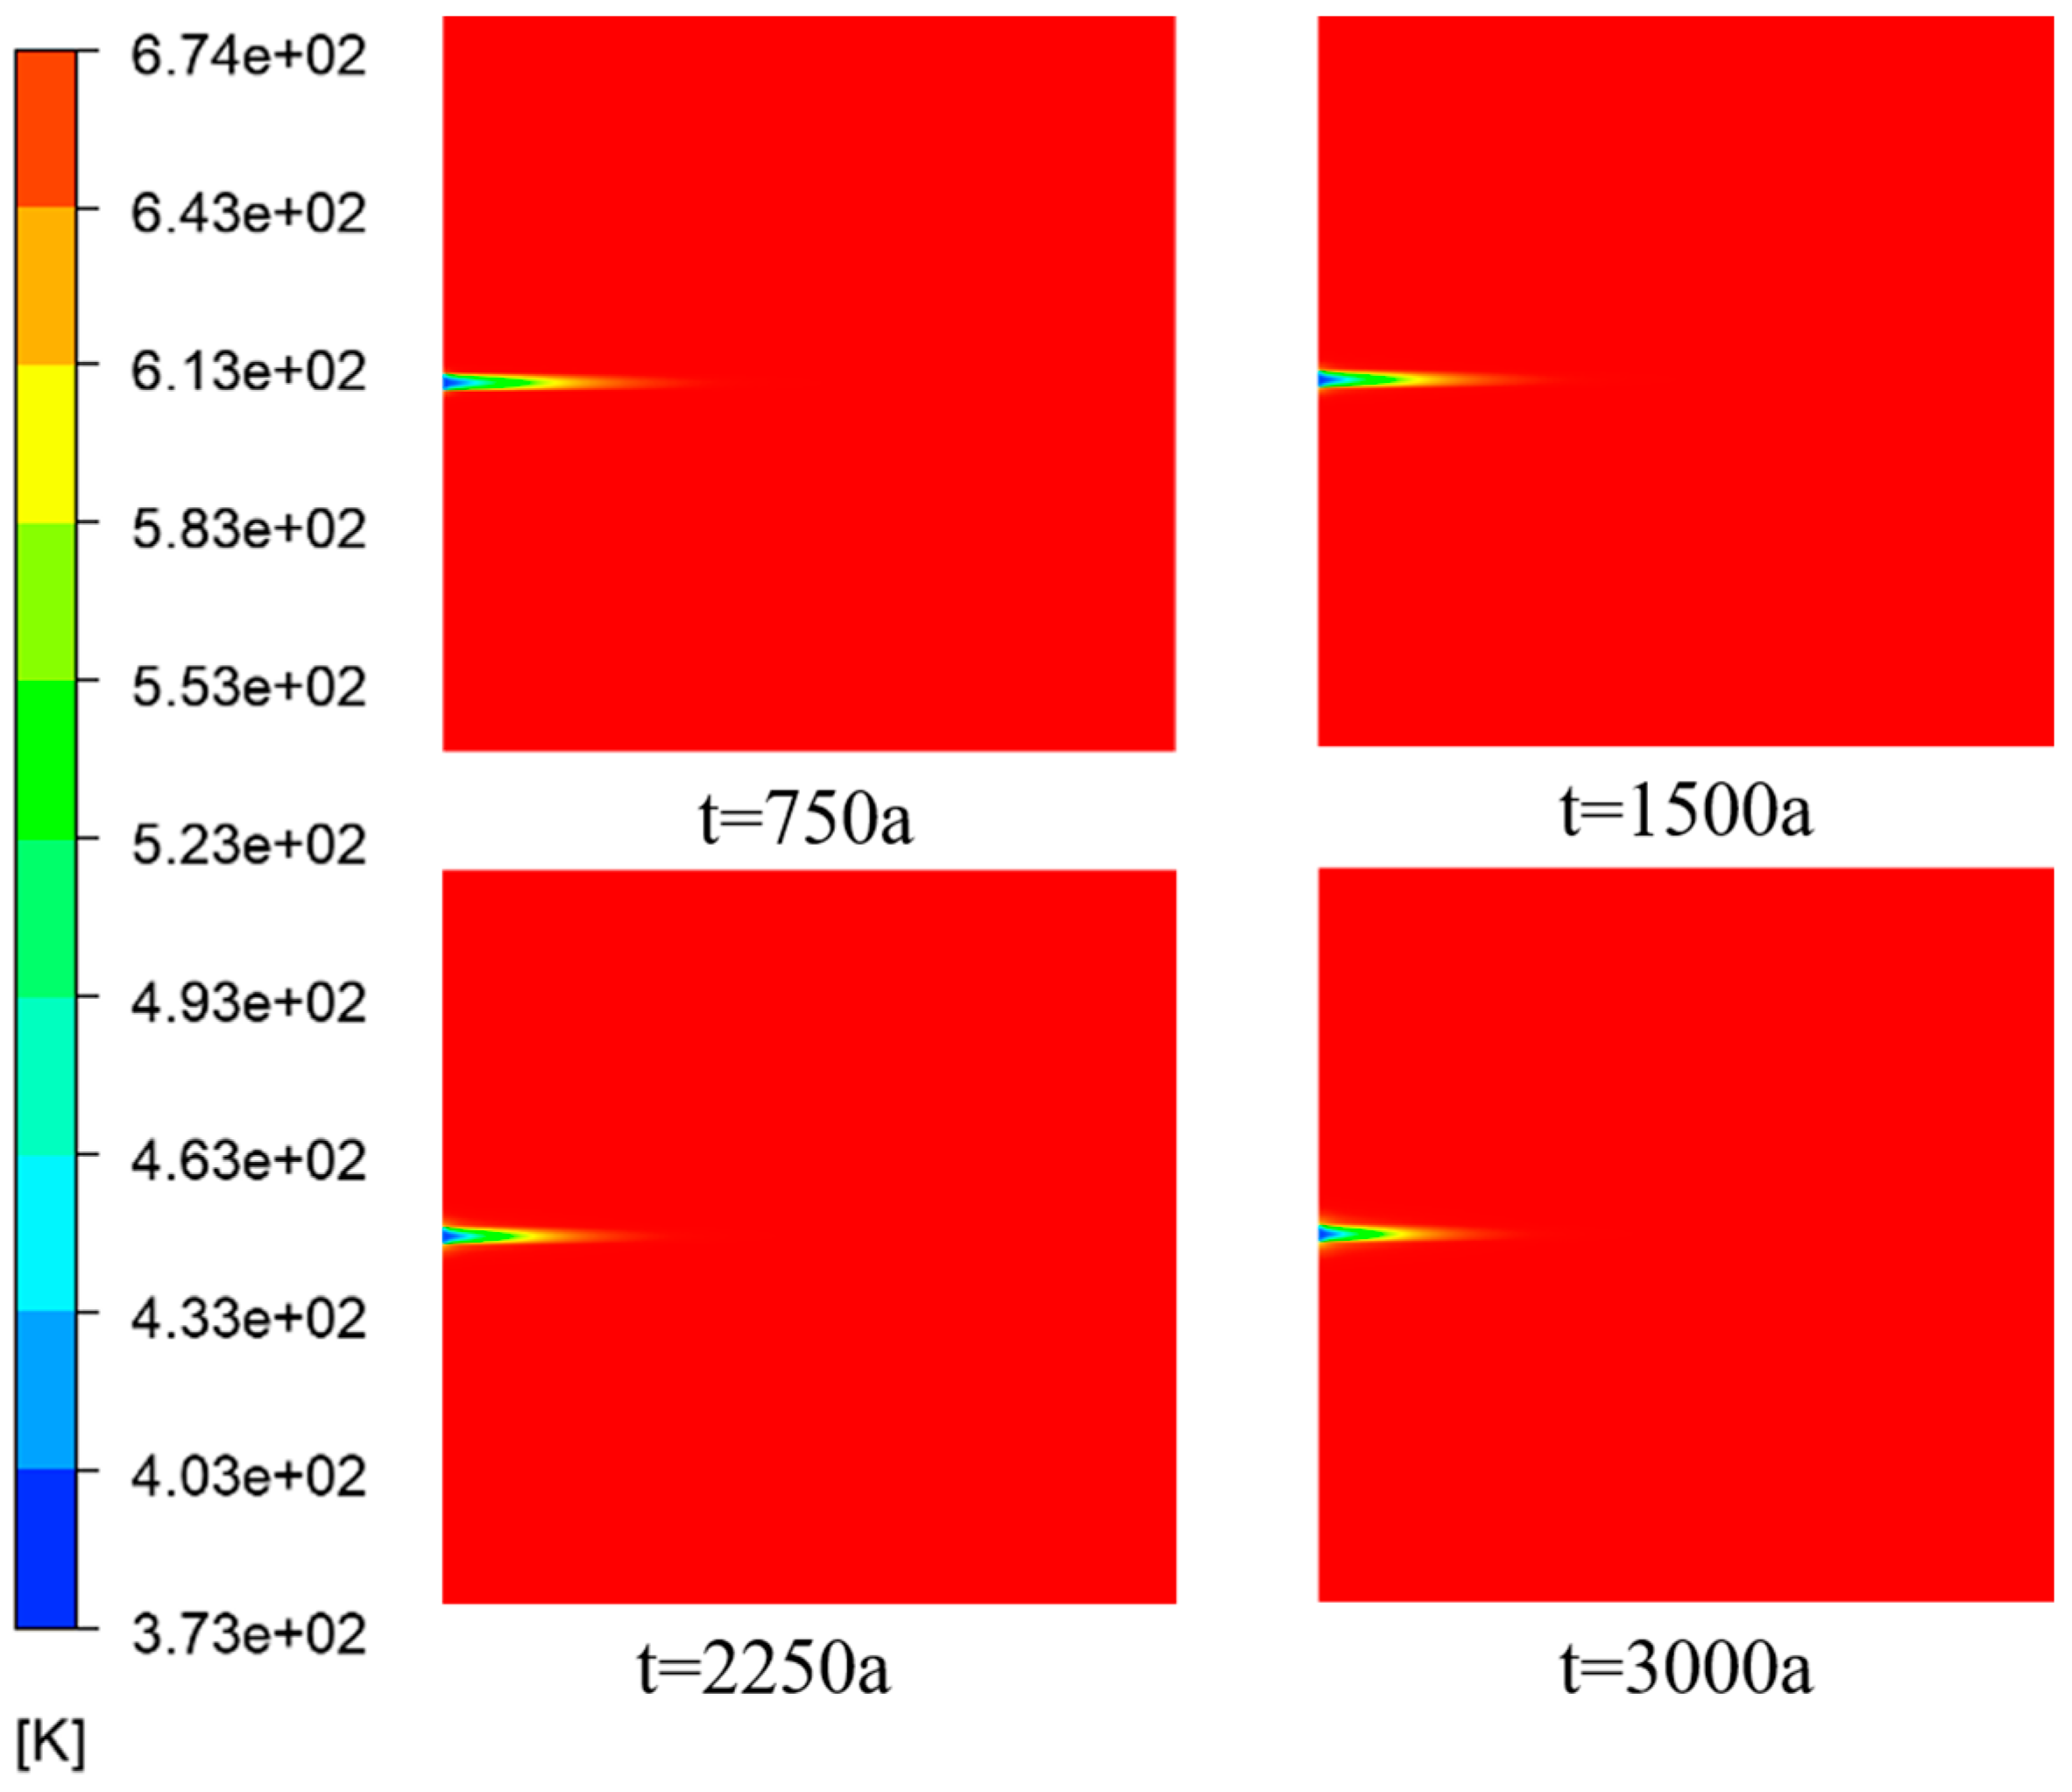
Figure 7, the temperature of the seawater containing
was lower compared with the temperature inside the porous media. This temperature difference drove convective heat transfer, resulting in heat transfer from the porous media to the incoming flow.
From
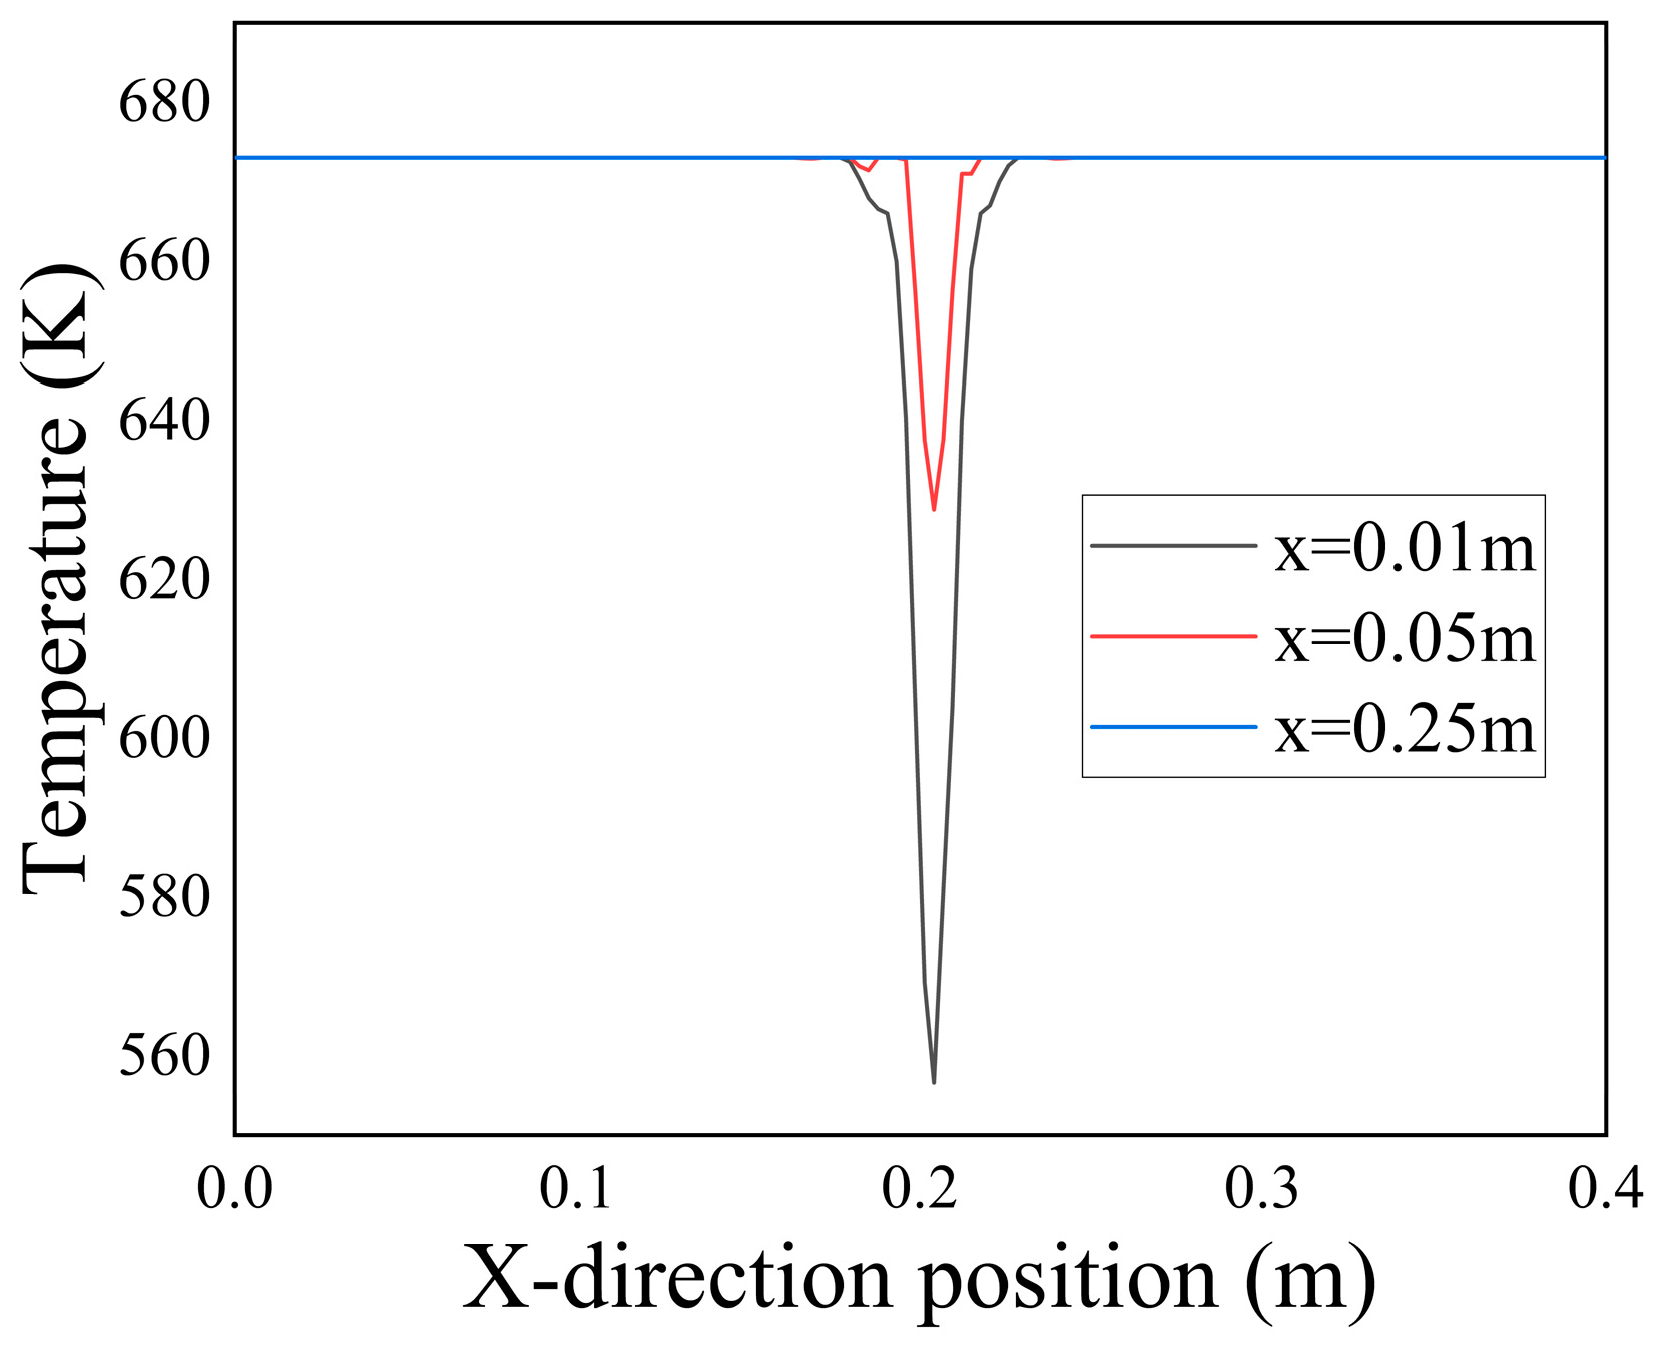
Figure 8, it is evident that there was a significant temperature difference at the inlet section of the fissure. Along the X-direction, the temperature difference between the fissure and the porous media region gradually diminished until it eventually reached equilibrium with the temperature of the hot fluid.
From
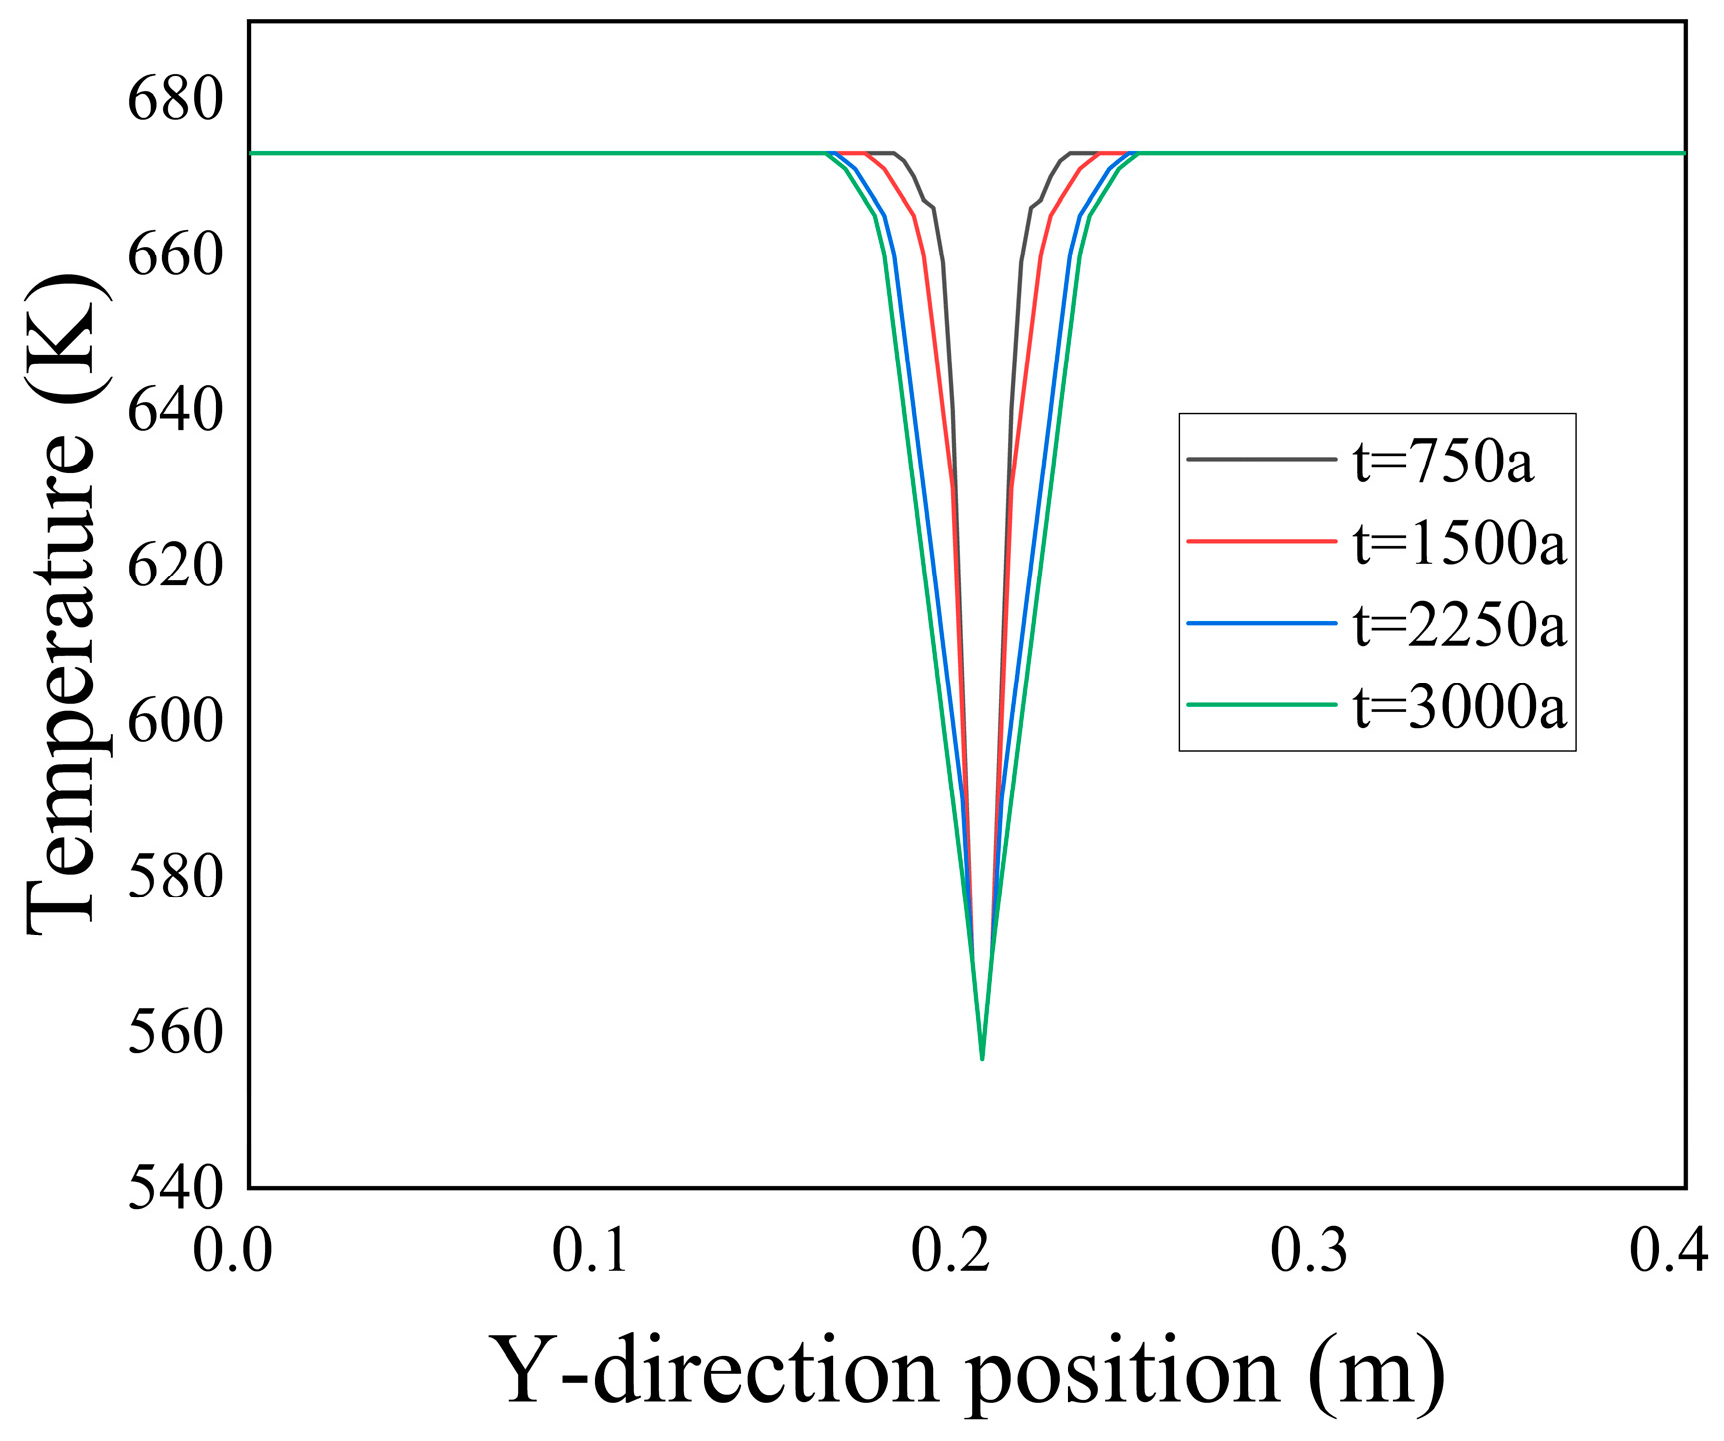
Figure 9, it can be observed that in the near-inlet region, the incoming low-temperature seawater maintained a consistent temperature, indicating minimal heat exchange with the surrounding porous media. As the flow progressed, the low-temperature seawater gradually diffused into the surrounding porous media, resulting in a widening temperature difference along the Y-axis at the inlet. Additionally, the rate at which the temperature difference expanded decreased gradually as the flow continued. This was attributed to the deposition of
at the interface between the two fluids, which hindered the heat transfer through the flow.
From
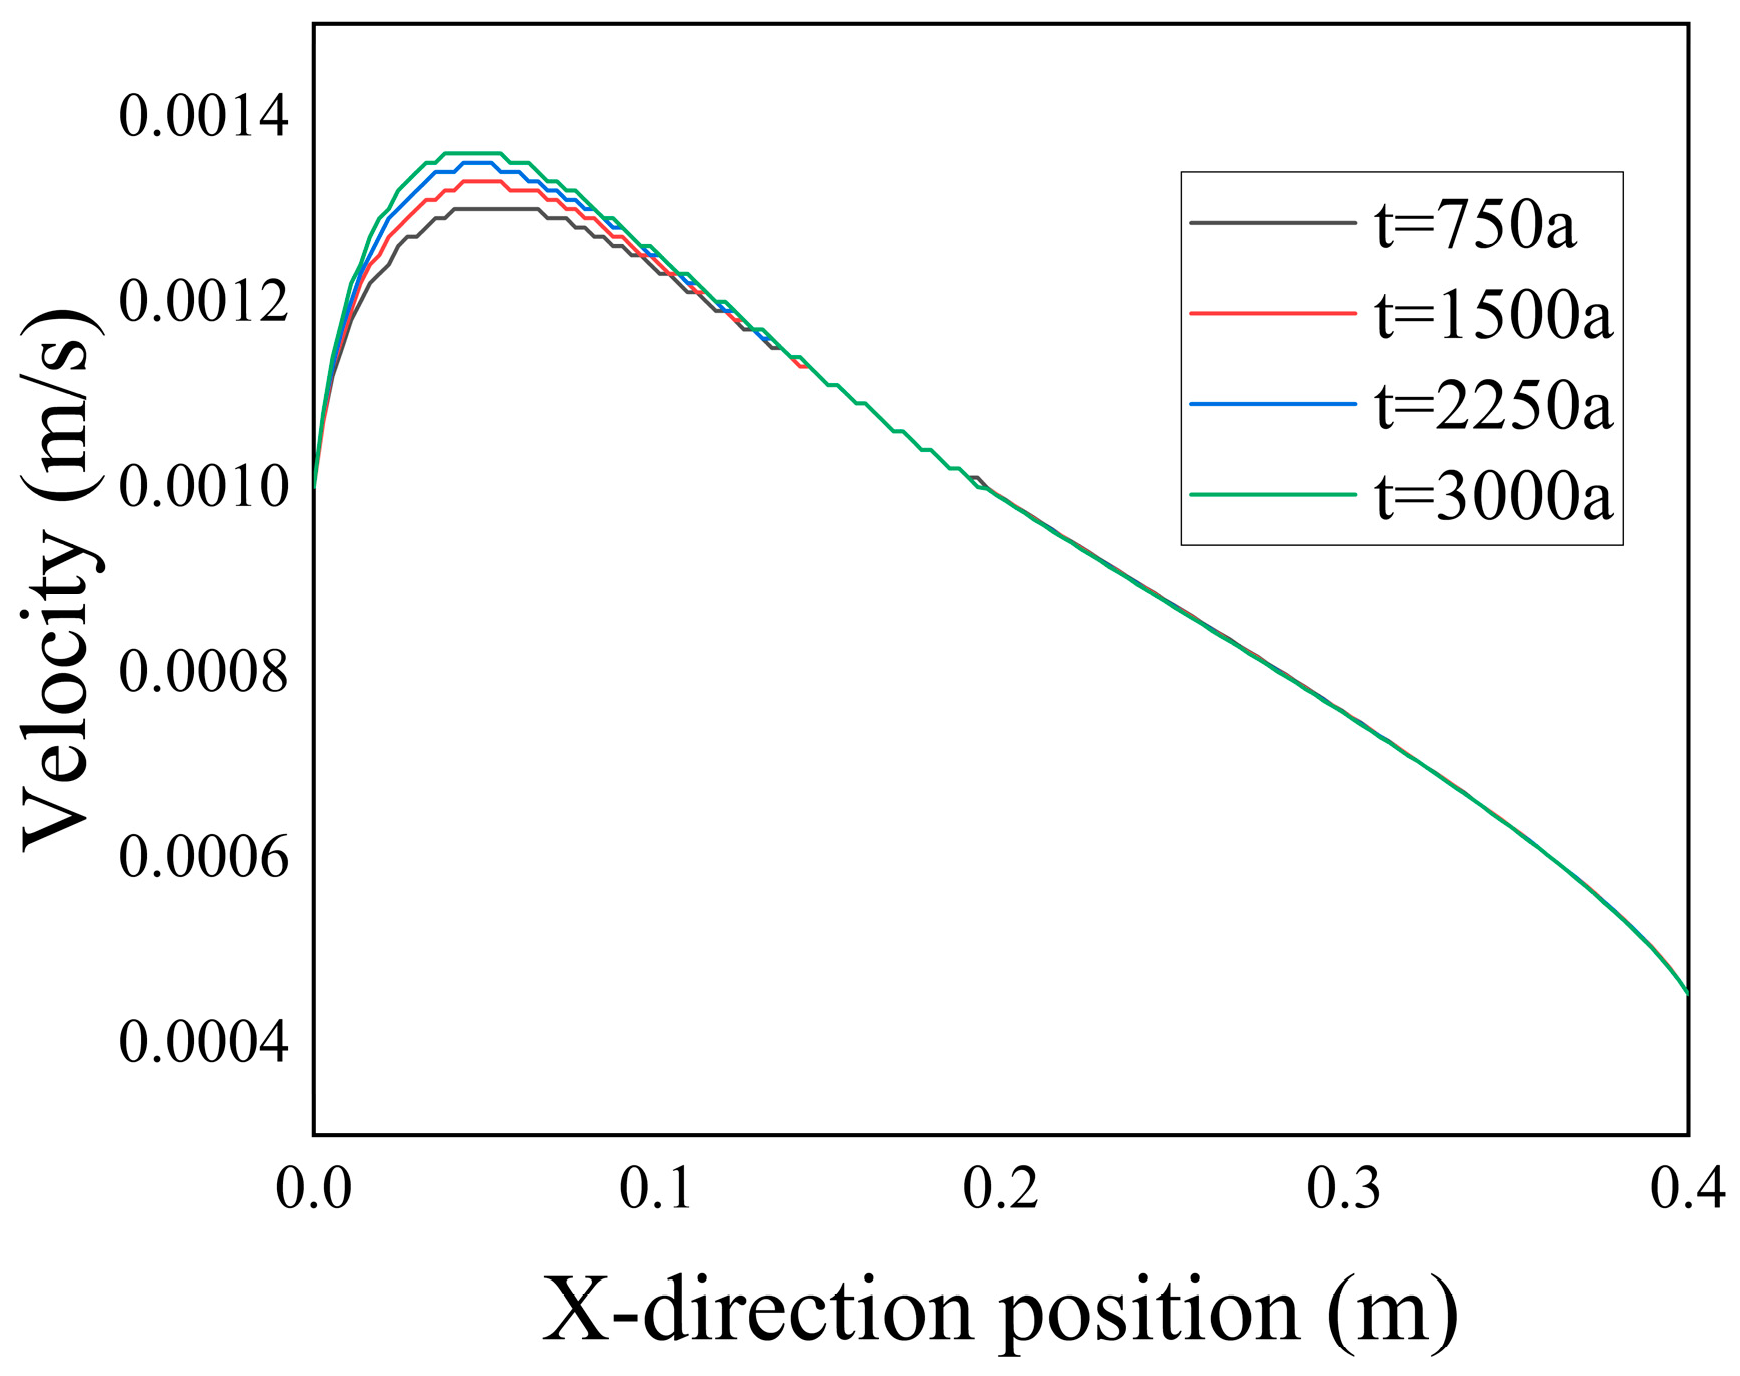
Figure 10, it can be observed that the inlet velocity within the computational domain was relatively low. Combined with
Figure 11, it is evident that the velocity first increased and then decreased within the range of
. The reasons for this phenomenon are as follows: First, due to the low resistance within the fractures, there was a converging effect on the fluid. Second, the reduced porosity on both sides of the fractures, as shown in
Figure 5, hindered the mixing of the two types of ions and restricted the diffusion, causing more low-temperature seawater to flow through the fractures. However, as the flow progressed, the maximum velocity within the fractures gradually decreased. This phenomenon could be attributed to the heightened intermingling of seawater and hydrothermal fluid, resulting in an increased degree of mixing and a reduction in temperature and density disparities within the flow field.
- (3)
Chemical Reaction Rate Analysis
From
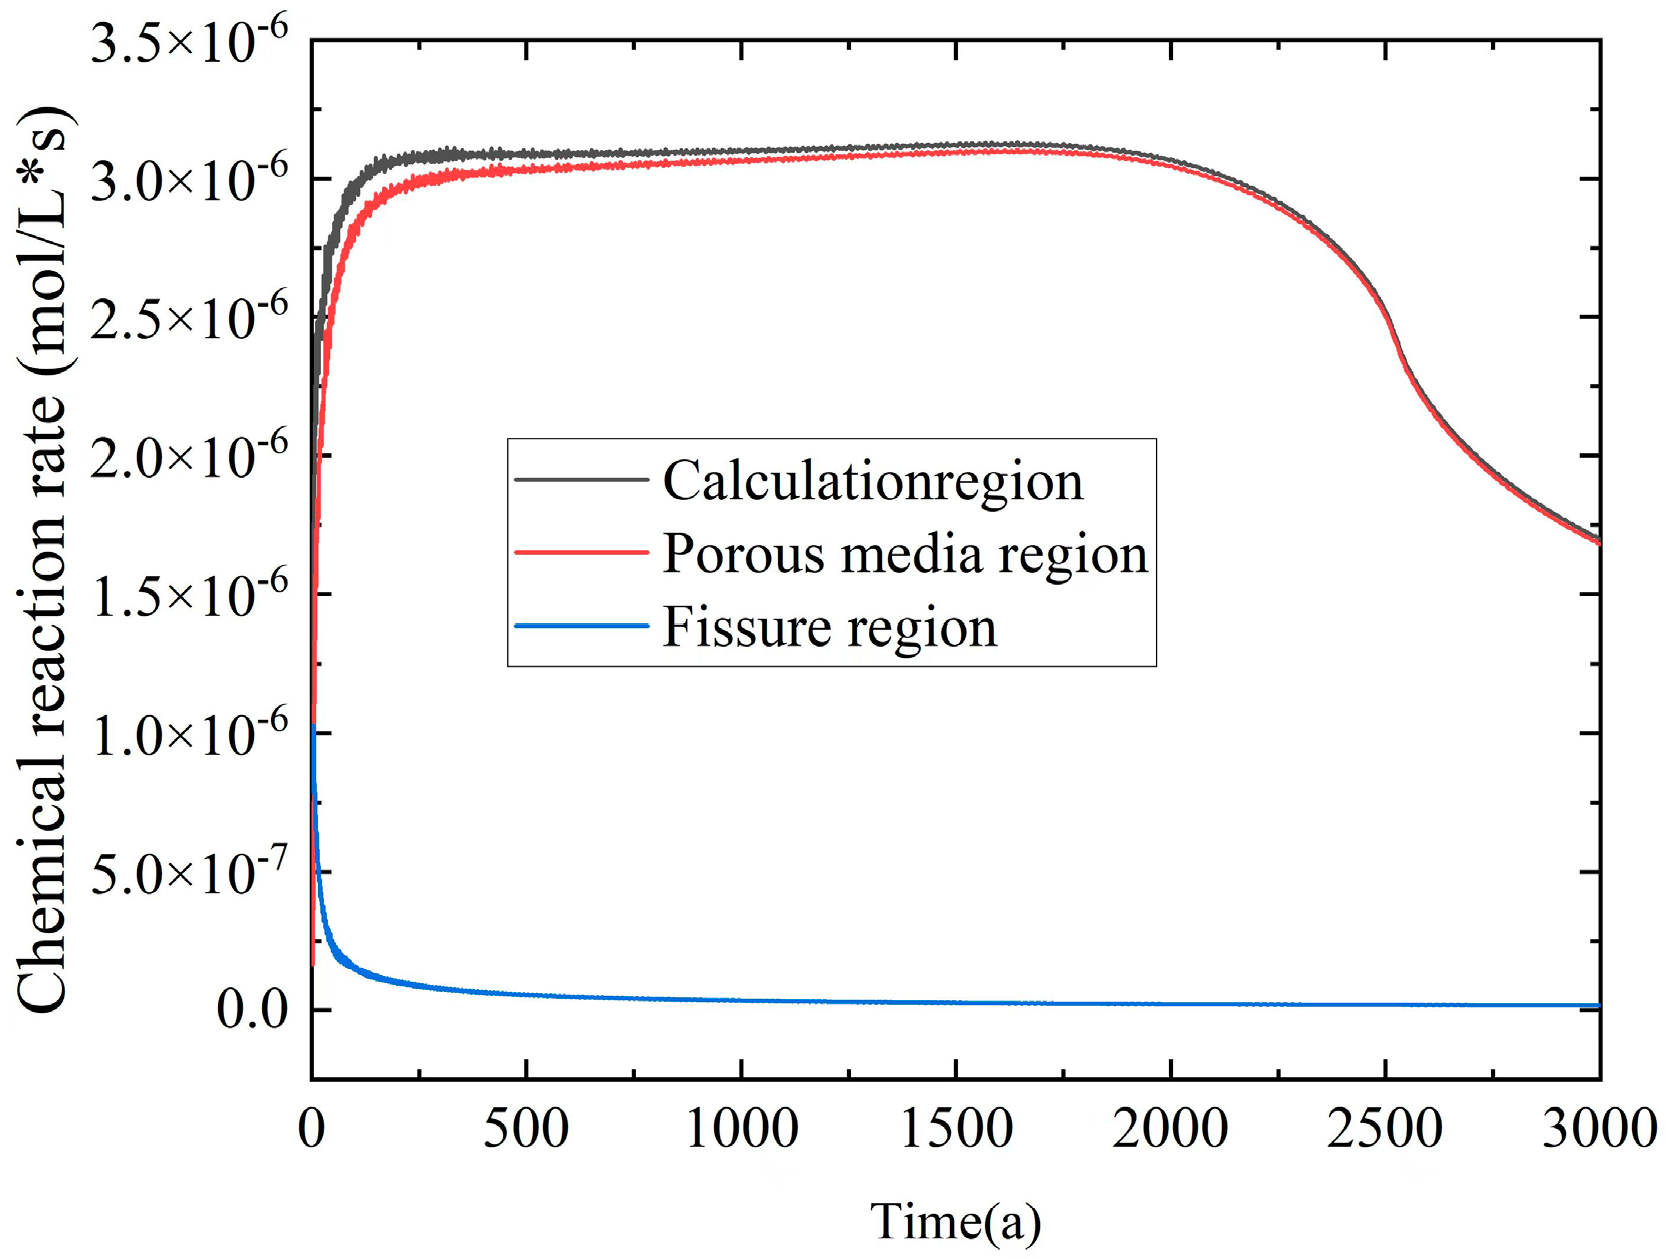
Figure 12, it can be observed that both the entire computational domain and the porous media region exhibited a pattern in which the chemical reaction rates initially increased rapidly, stabilized thereafter, and eventually decreased until they reached zero. In the fissure region, the chemical reaction rate rapidly dropped from 10
−6 mol/(L·s) to zero within the time interval of 0–100 a. This behavior could be attributed to the initial presence of calcium ions within the fissure region, leading to a rapid chemical reaction rate. However, as the incoming flow displaced the hot fluid quickly, the fissure became filled with
ions, leaving insufficient time for the
reaction to occur before the ions flowed away. It can be inferred that the primary occurrence of chemical reactions within the computational domain took place in the porous media region.
The chemical reaction rate primarily relies on ion concentrations. The variation in chemical reaction rates within the computational domain can be categorized into three phases: First, there was a rapid increase phase (0–200 a) characterized by the interaction of low-temperature seawater containing with the hot fluid containing This interaction led to an increase in reaction rate, as more was introduced. Subsequently, a stable phase (200–2250 a) followed, during which ion concentrations remain relatively constant, and the average temperature within the domain stabilized. This resulted in a gradual convergence of the reaction rate. Finally, a slow decrease phase (2250–3000 a) occurred as the ion concentrations and average temperatures decreased within the domain. Additionally, the accumulation of a significant quantity of at the ion interface inhibited further progress of the chemical reaction, leading to a decline in the chemical reaction rate.
3.2. Analysis of Influencing Factors
3.2.1. Influence of Porosity on Heat Transfer
- (1)
Porosity Variation
The porosity of rock is a significant physical property that affects the heat transfer and chemical reactions of fluids within its internal structure. In this section, the simulation of convective heat transfer and chemical reactions between seawater and hydrothermal fluids within fractured porous media was conducted for initial porosity values of 0.3, 0.4, and 0.5. Considering that the fractures possessed a hollow structure and experience minimal influence from
precipitation, which did not readily deposit within the fractures, such an influence could be neglected. Therefore, the subsequent three sections discuss only the variation in porosity within the porous media regions situated on both sides of the fractures.
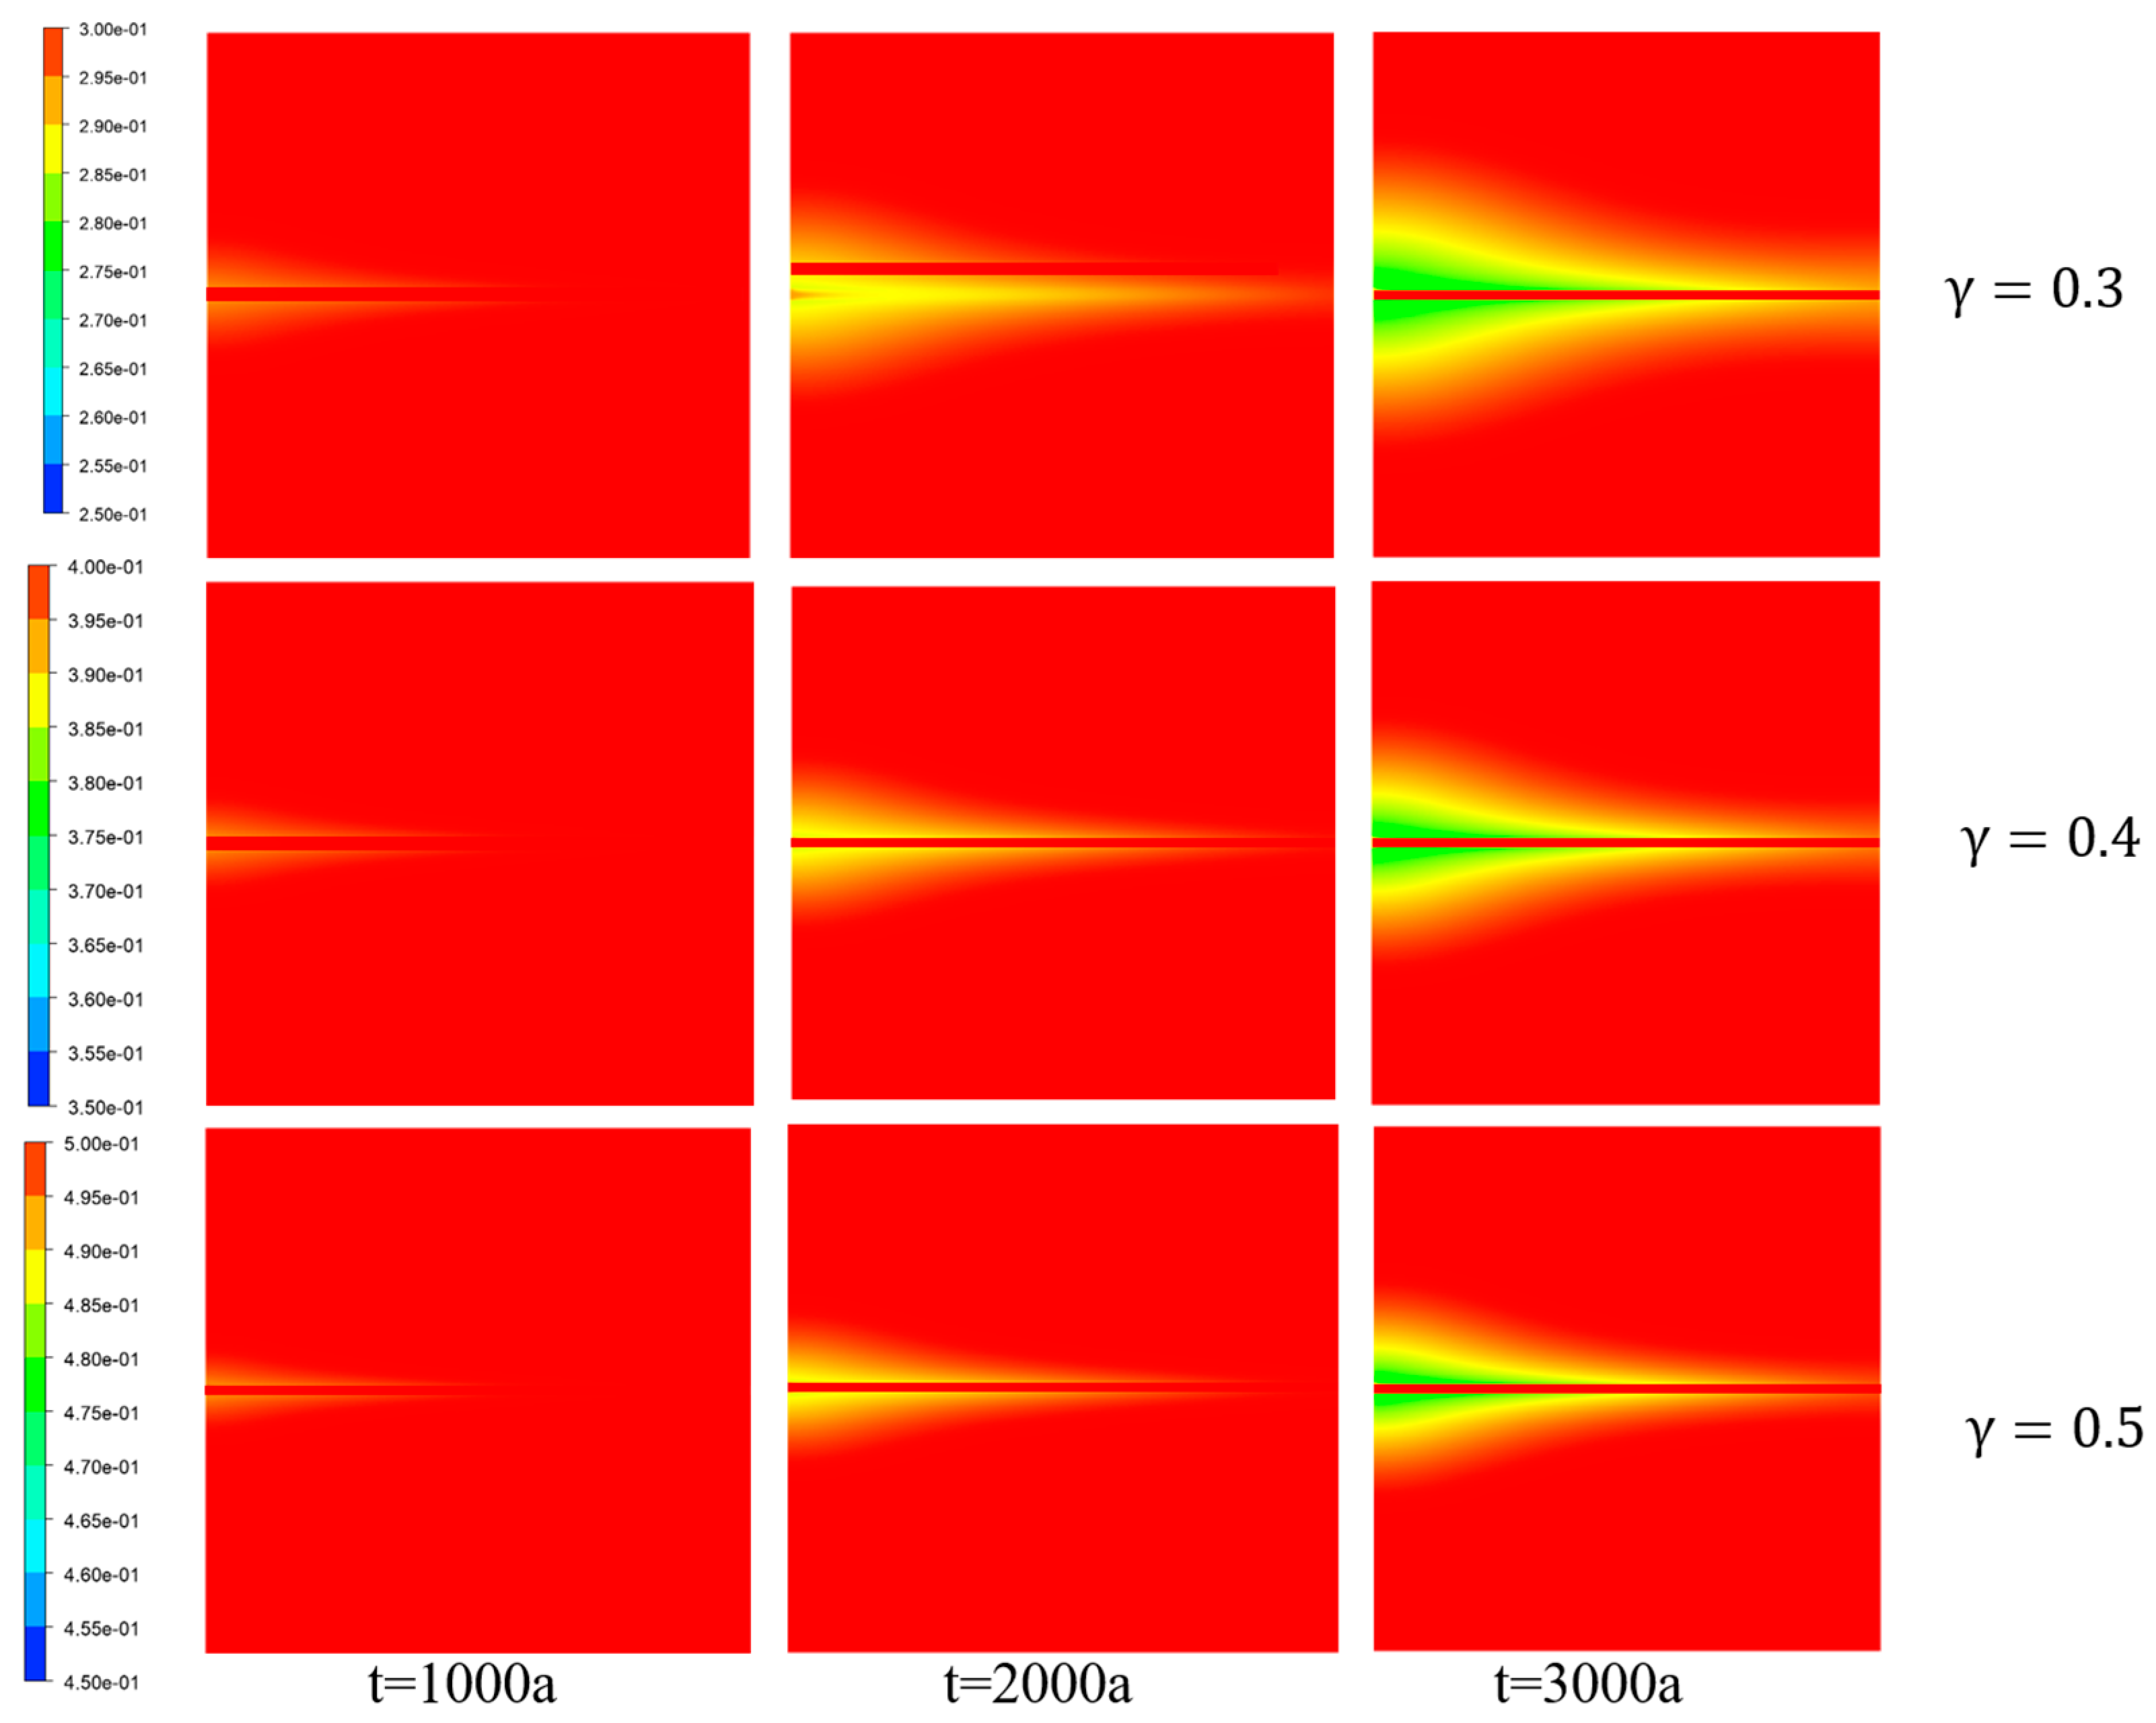
Figure 13 illustrates the porosity distribution of porous media with different initial porosity values, where different colors represent variations in porosity. The deposition of
onto the porous media framework led to a reduction in porosity.
The porosity gradually decreased along the X-direction on both sides of the fractures and decreased along the Y-direction at the inlet. This reduction can be primarily attributed to the deposition of
at the interfaces between the fractures and the two types of ions.
Figure 10 provides evidence that an increase in the initial rock porosity resulted in a smaller range of porosity variation within the porous media region. Combined with
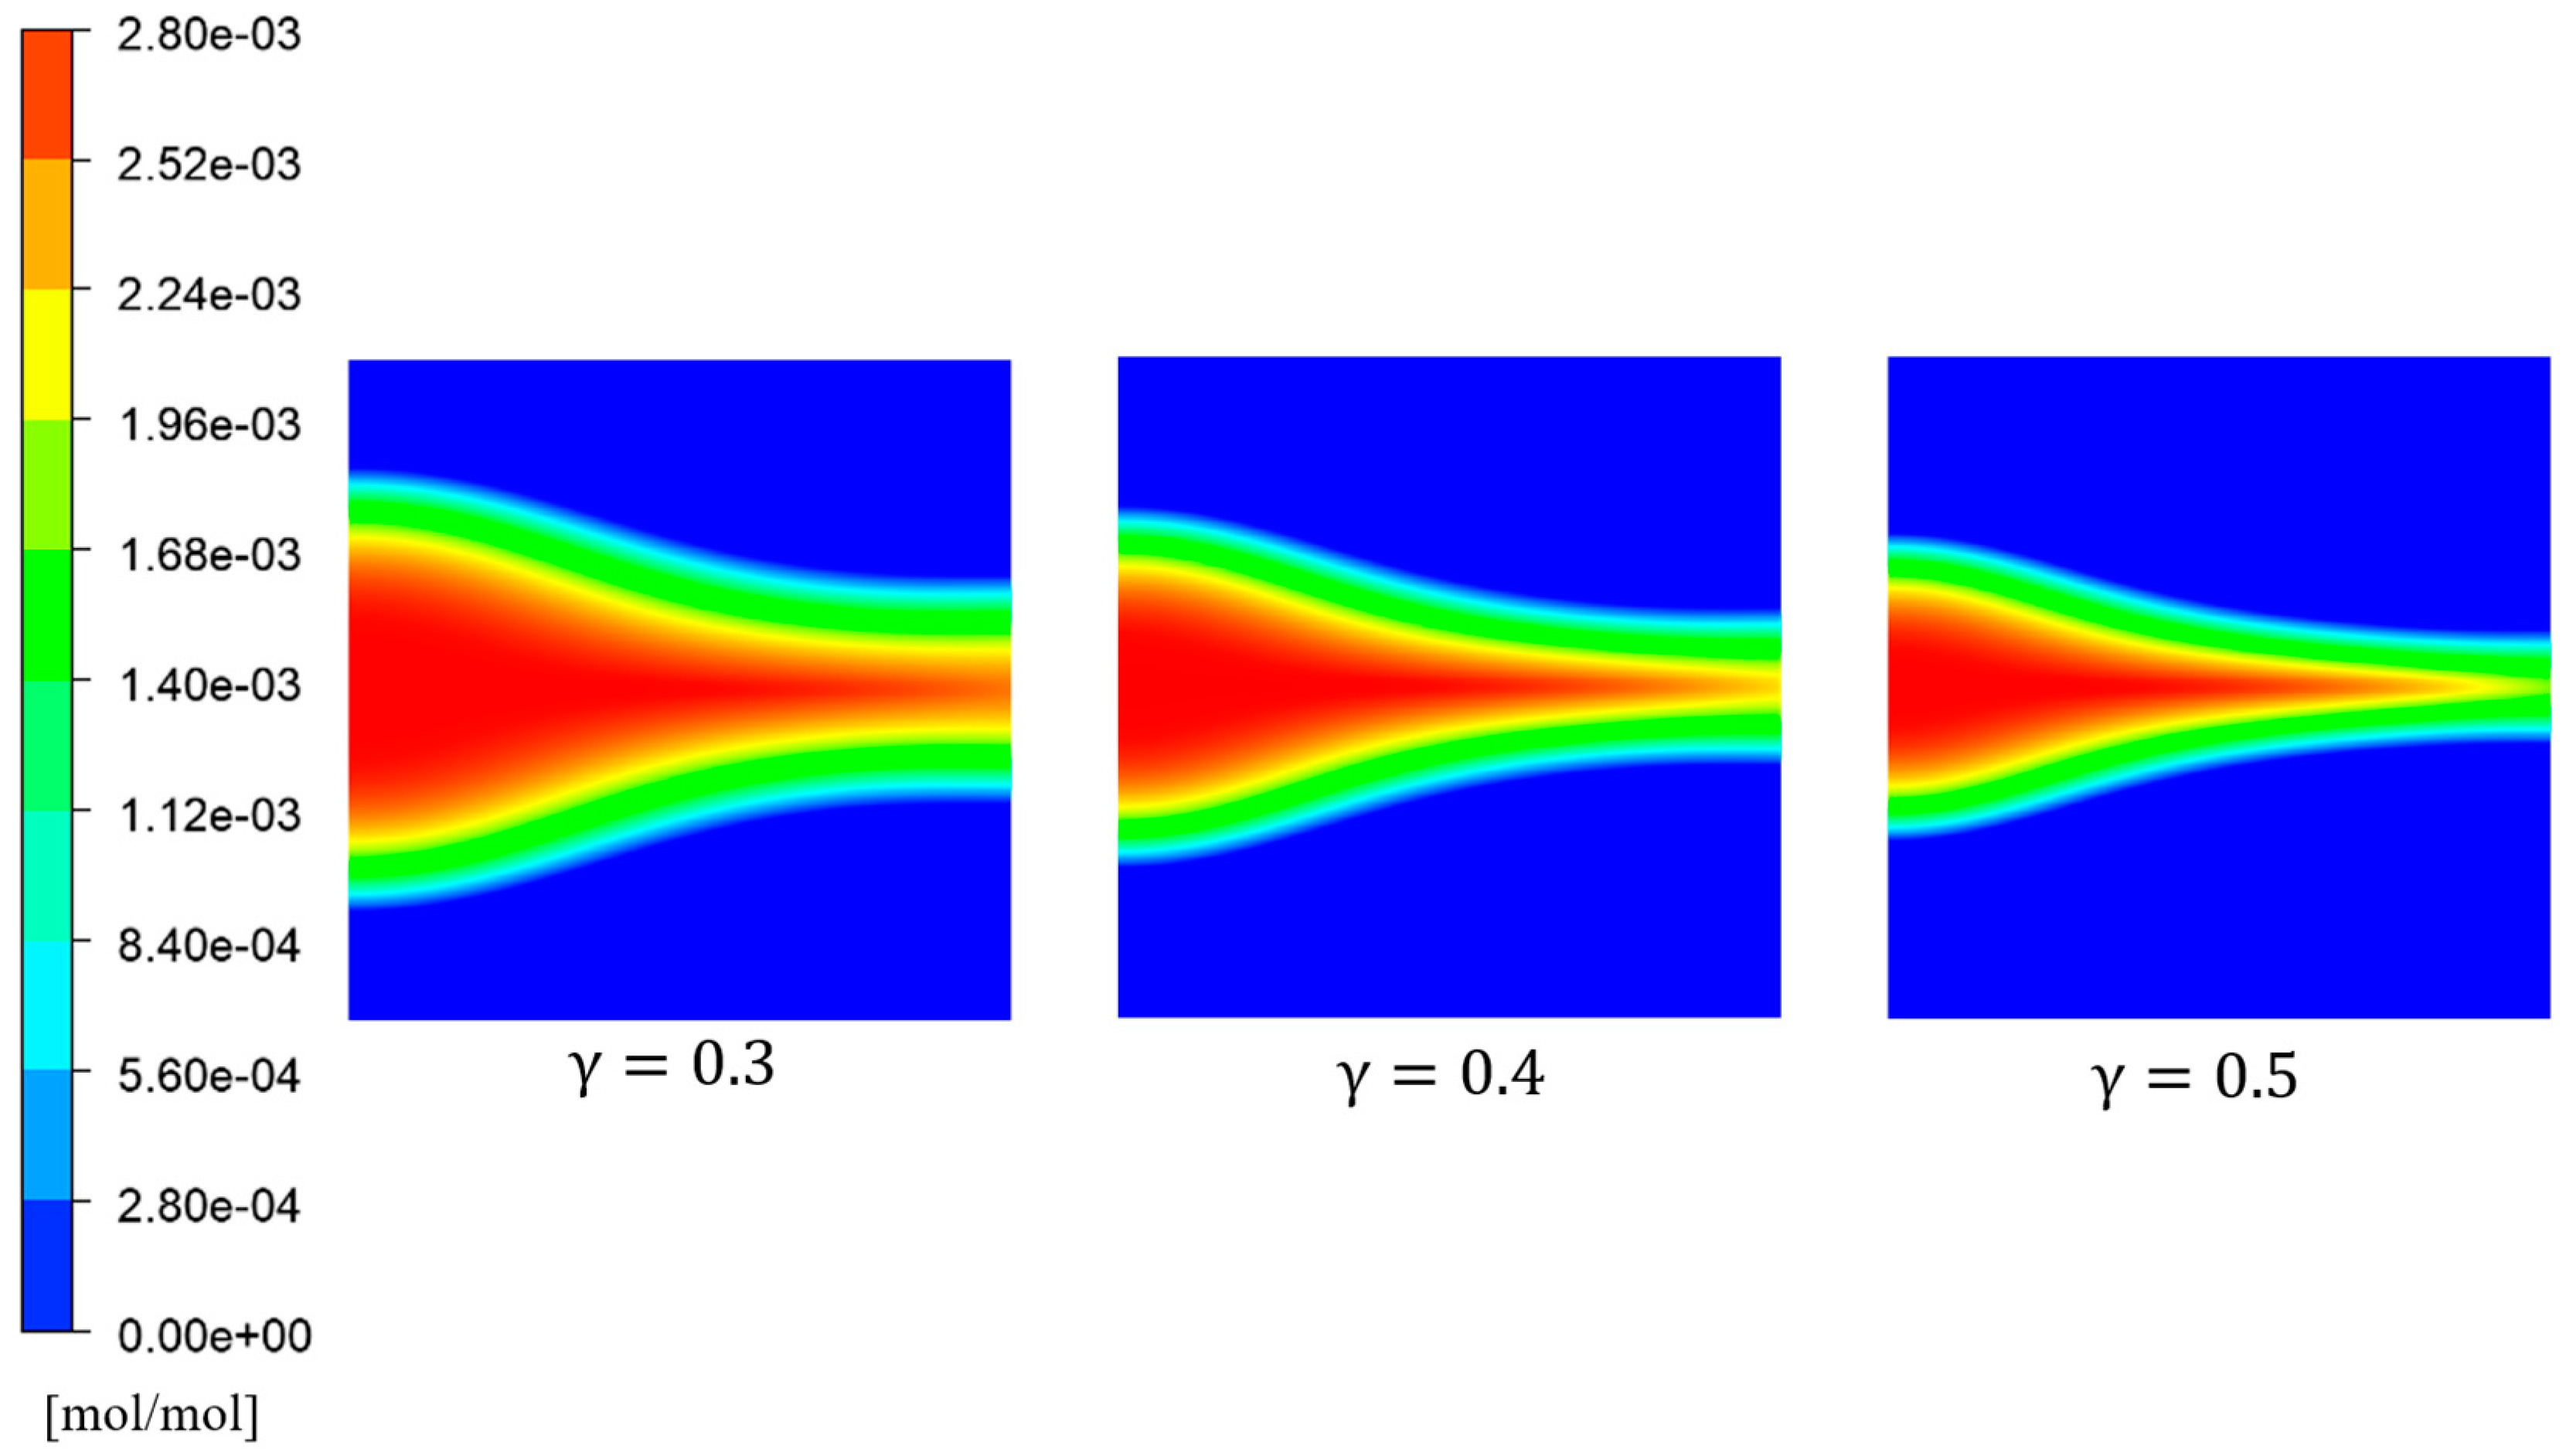
Figure 14, it can be inferred that the range of porosity variation was related to the distribution of
concentration. Moreover, a higher porosity level led to a narrower range of ion diffusion. This was because ion diffusion is mainly influenced by temperature, with higher temperatures facilitating faster ion movement. Combined with
Figure 15 and
Figure 16, a higher porosity corresponded to a lower average temperature within the porous media region, thereby affecting the ion diffusion.
Figure 14 depicts the distribution of
concentration for different initial porosity values. It can be observed that as the porosity increased, the extent of
diffusion gradually decreased. This was mainly attributed to the fact that lower porosity levels resulted in higher diffusion intensity within the porous rock, accompanied by weaker flow effects and lower average velocity. In porous rocks with low porosity, the range of sulfate ions diffusion was larger. However, as the porosity rose, the inflow velocity rose, causing the transportation of
ions before sufficient diffusion occurred.
- (2)
Analysis of the Convective Heat Transfer
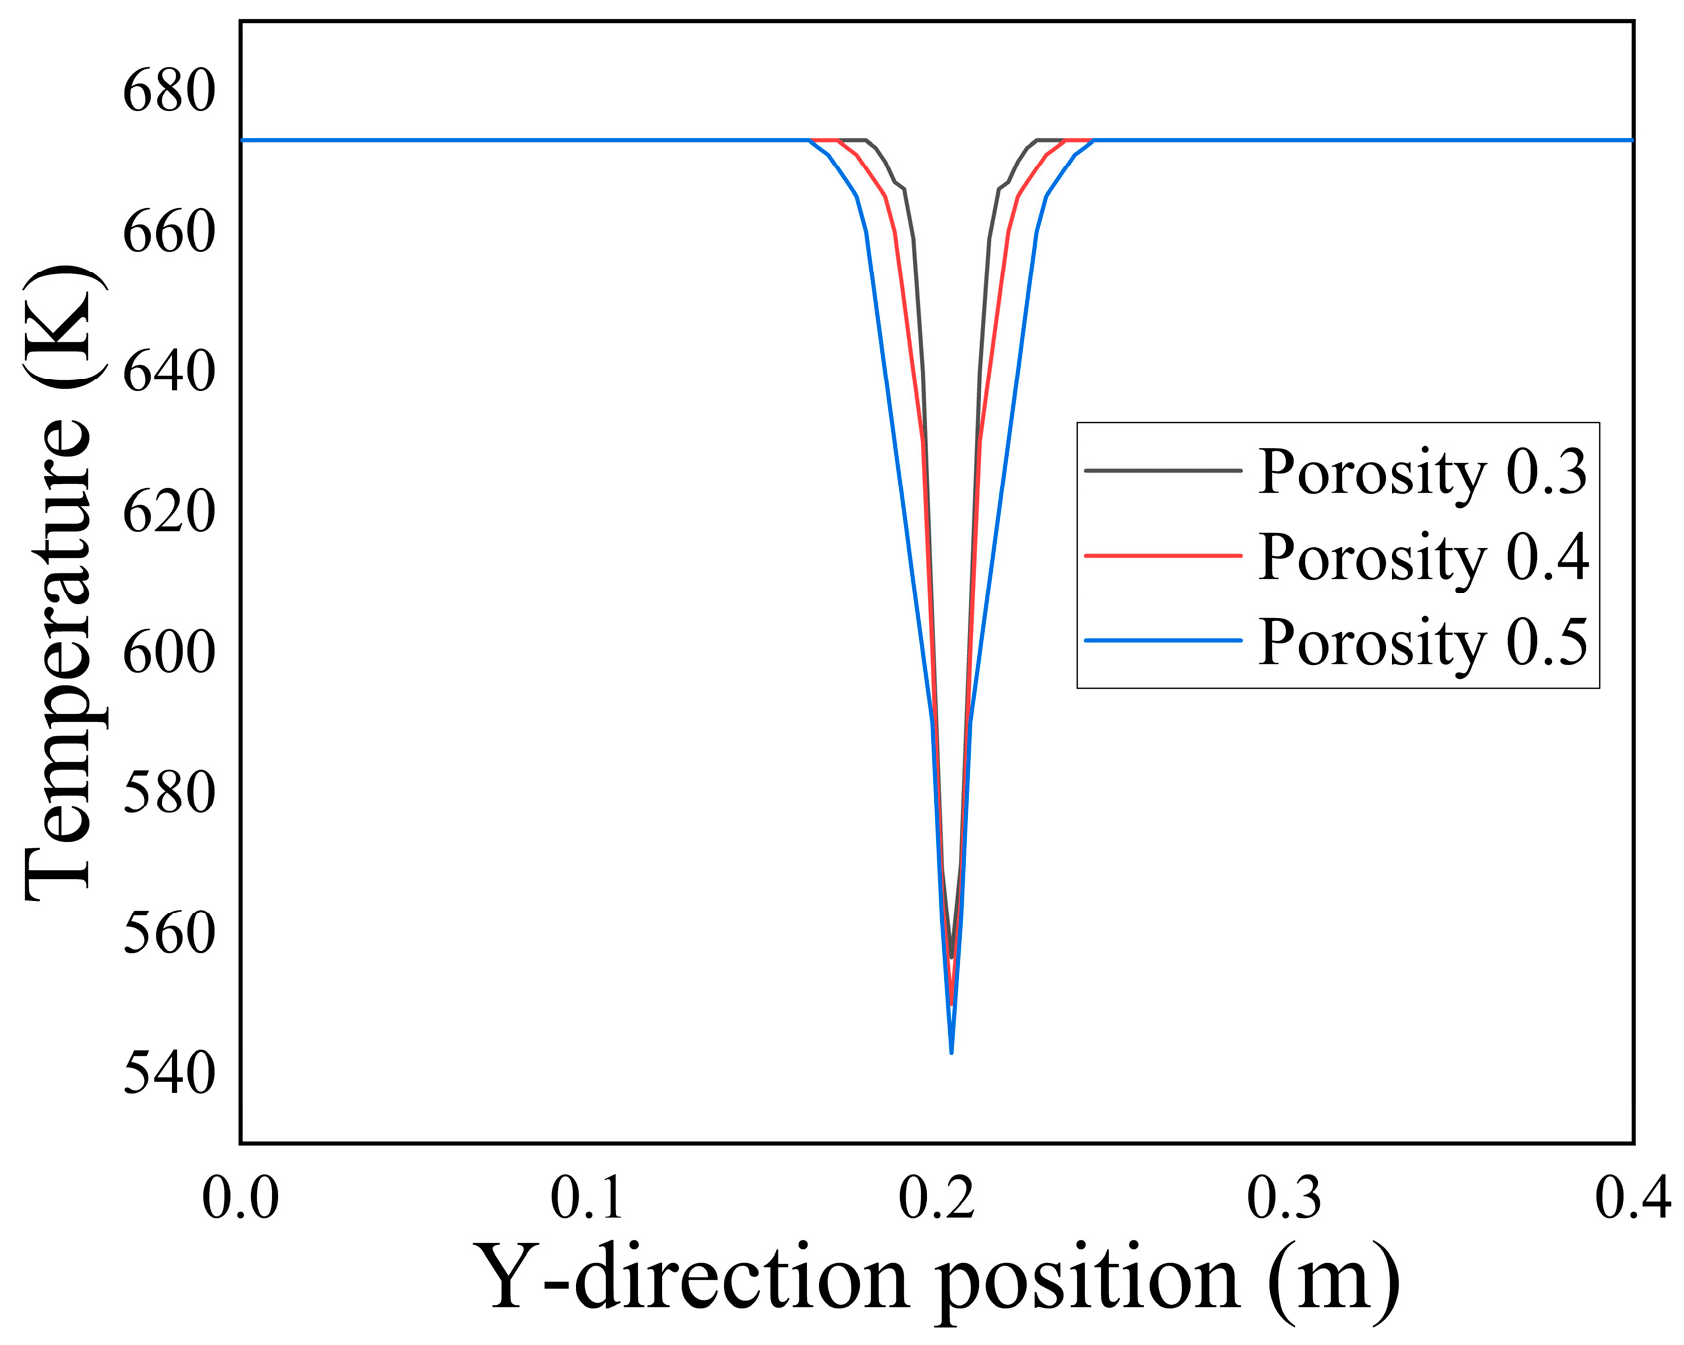
When low-temperature seawater was injected into the computational domain with different initial porosity values, heat exchange occurred between the injected seawater and the surrounding high-temperature hydrothermal fluids. This process led to a gradual increase in the inflow temperature, eventually approaching the overall temperature within the domain. Combined with
Figure 15 at t = 3000 a, the temperature distribution along the Y-axis at X = 0.1 m for different initial porosity values can be observed. It is evident that as the porosity increased, the range of temperature extension along the central axis of Y = 0.2 m at X = 0.1 m continuously expanded. This expansion could be attributed to the growing influx of low-temperature seawater into the porous media region as the porosity increased. Consequently, the heat exchange between the fluids was enhanced.
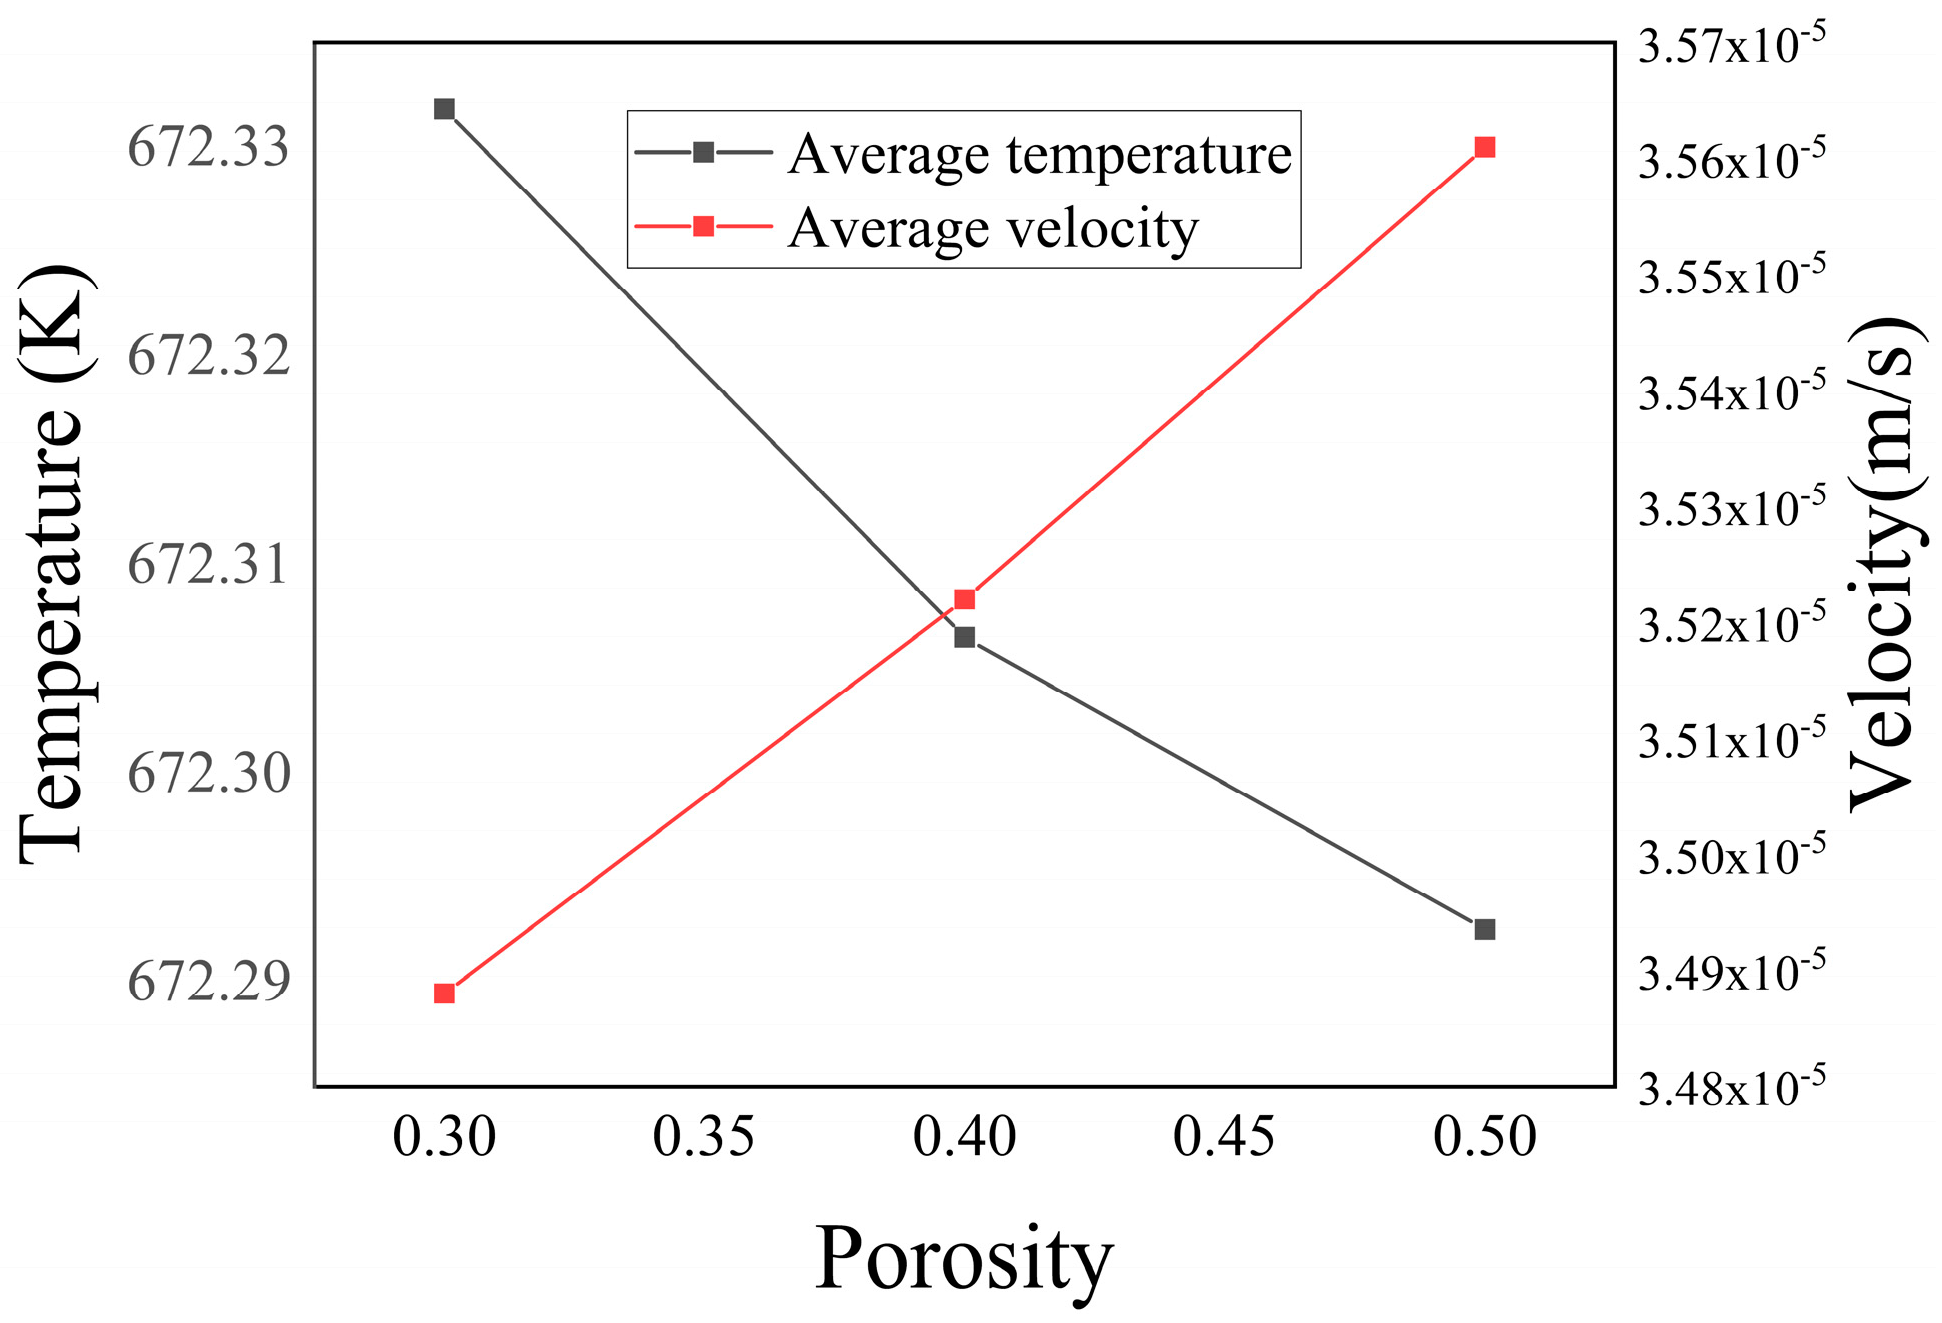
Figure 16 illustrates the relationship between the average temperature and average velocity in the porous media region in relation to porosity. The graph reveals that as the initial porosity increased, the average temperature within the porous media region decreased, while the average velocity increased. This observation could be attributed to the amplified influx of low-temperature seawater into the porous media as the porosity increased. Consequently, the increased flow velocity contributed to a decline in the average temperature across the entire domain.
- (3)
Chemical Reaction Rate Variation
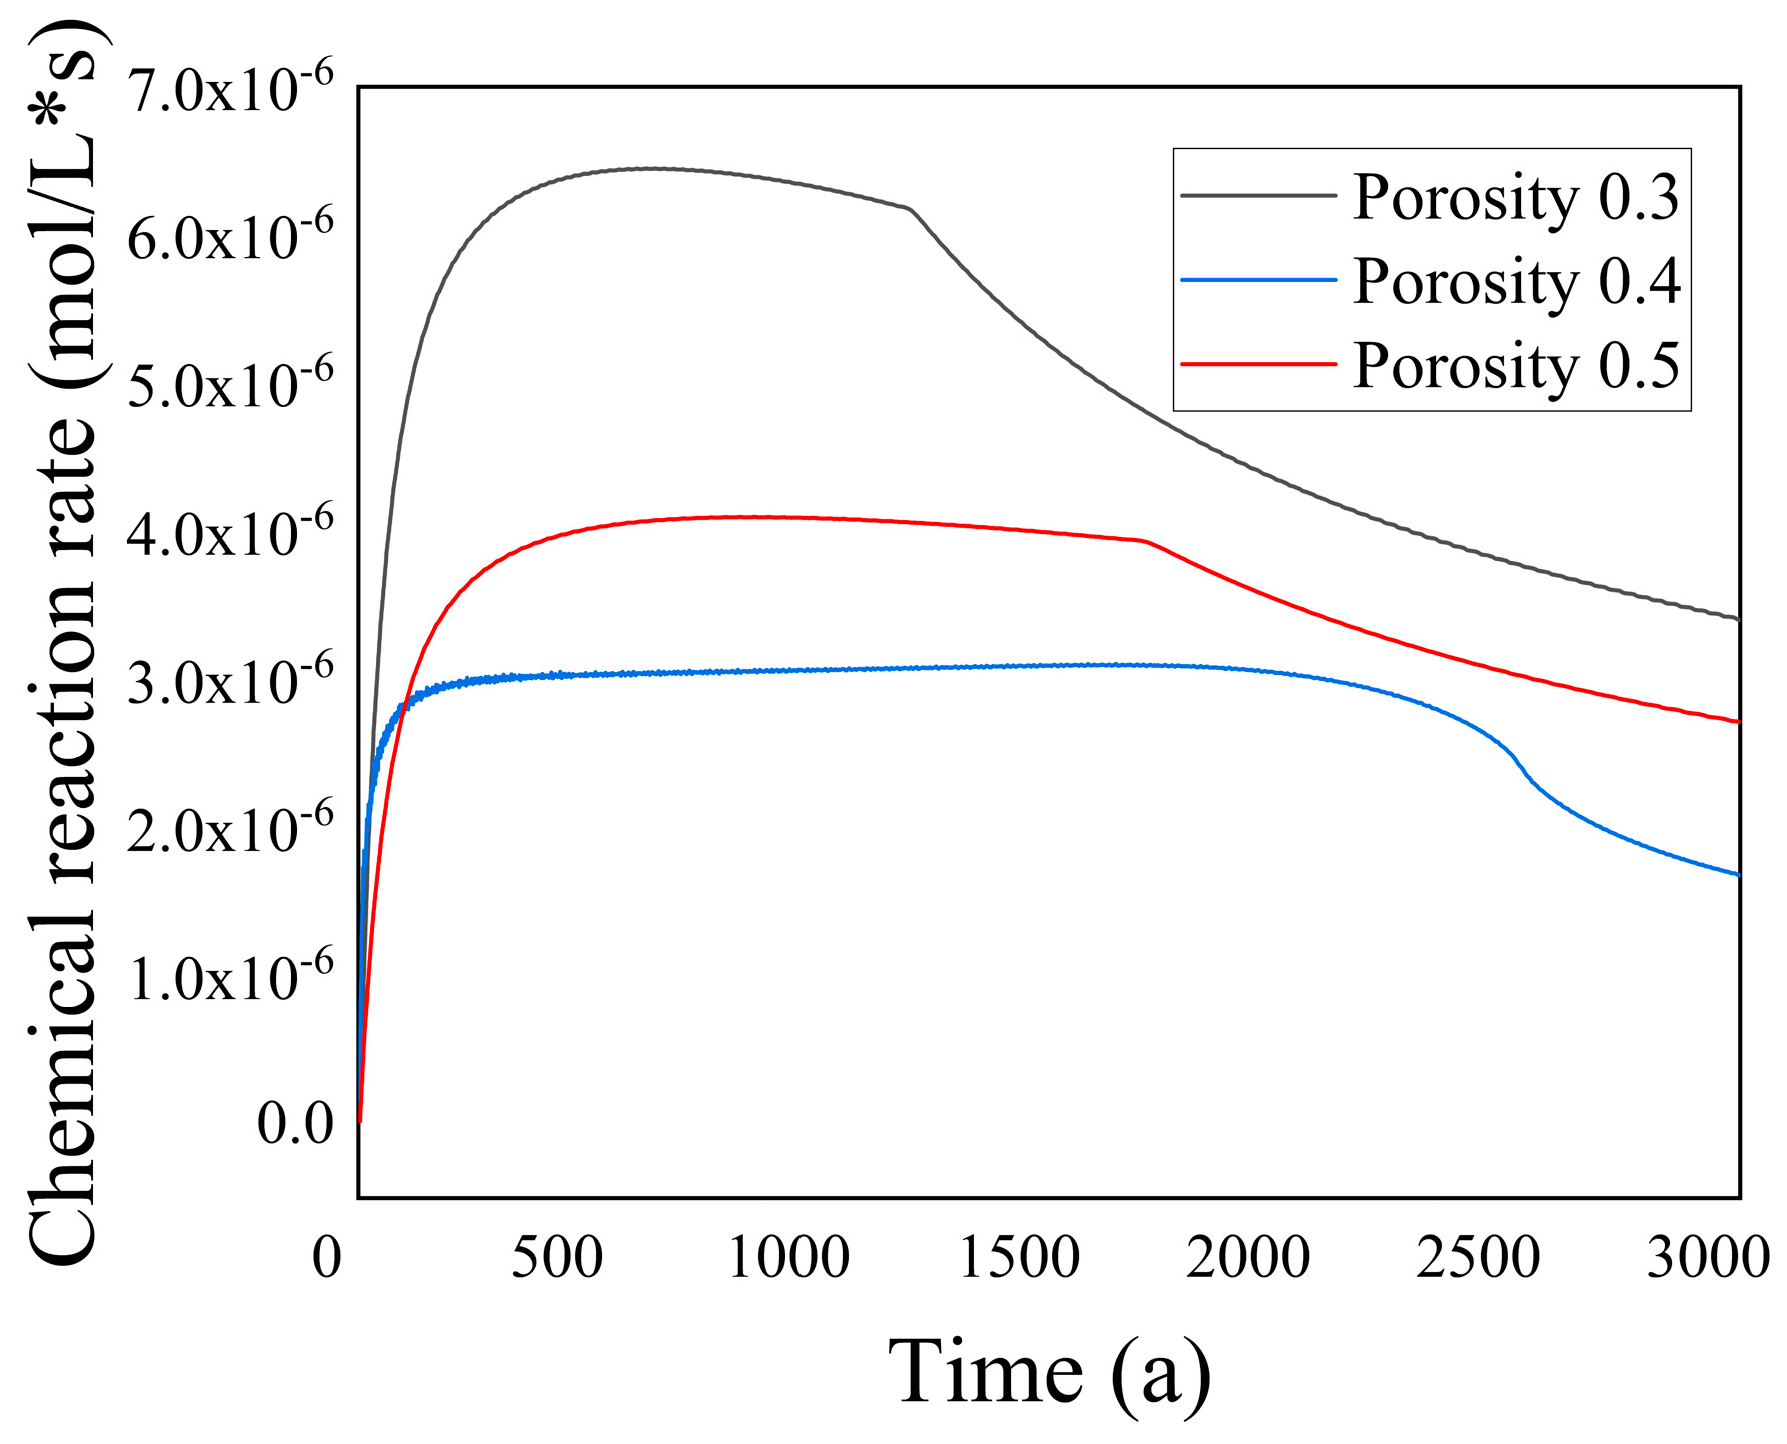
Figure 17 illustrates the variation in chemical reaction rates within the porous media region over time for different initial porosity values. The graph reveals a notable trend: as the porosity increased, the chemical reaction rate within the porous rock decreased. This phenomenon could be attributed to two primary factors. First, as the porosity increased, the flow channel aperture within the porous rock enlarges, resulting in a decrease in the overall resistance coefficient. This change facilitated fluid flow through the porous rock, leading to an increased influx of cold fluid within the same time frame. Consequently, the average temperature decreased. Additionally, considering Equations (6) and (7), the increase in porosity caused a reduction in the average temperature, subsequently lowering the chemical reaction rate constant within the porous rock.
Second, as the porosity increased, the internal pore size of the porous rock gradually expanded. This expansion allowed for a greater volume of cold fluid to pass through within the same time period, resulting in an increase in the average velocity. As a result, some ions did not have sufficient time to react with ions before being carried away by the flow.
3.2.2. Influence of the Ion Concentration on the Heat Transfer
- (1)
Porosity Variation
The reactant concentration plays a crucial role in determining the chemical reaction rate, as an increase in reactant concentration typically leads to an acceleration of the reaction within a certain concentration range. According to
Table 1, it can be observed that in the seawater and hydrothermal fluids, the concentration of
was much greater than that of
. Therefore, the rate of the chemical reaction primarily depended on the concentration of
. Hence, in this section, we conducted simulations of the convective heat transfer and chemical reactions between seawater and hydrothermal fluids within fractured porous media, considering different concentrations of
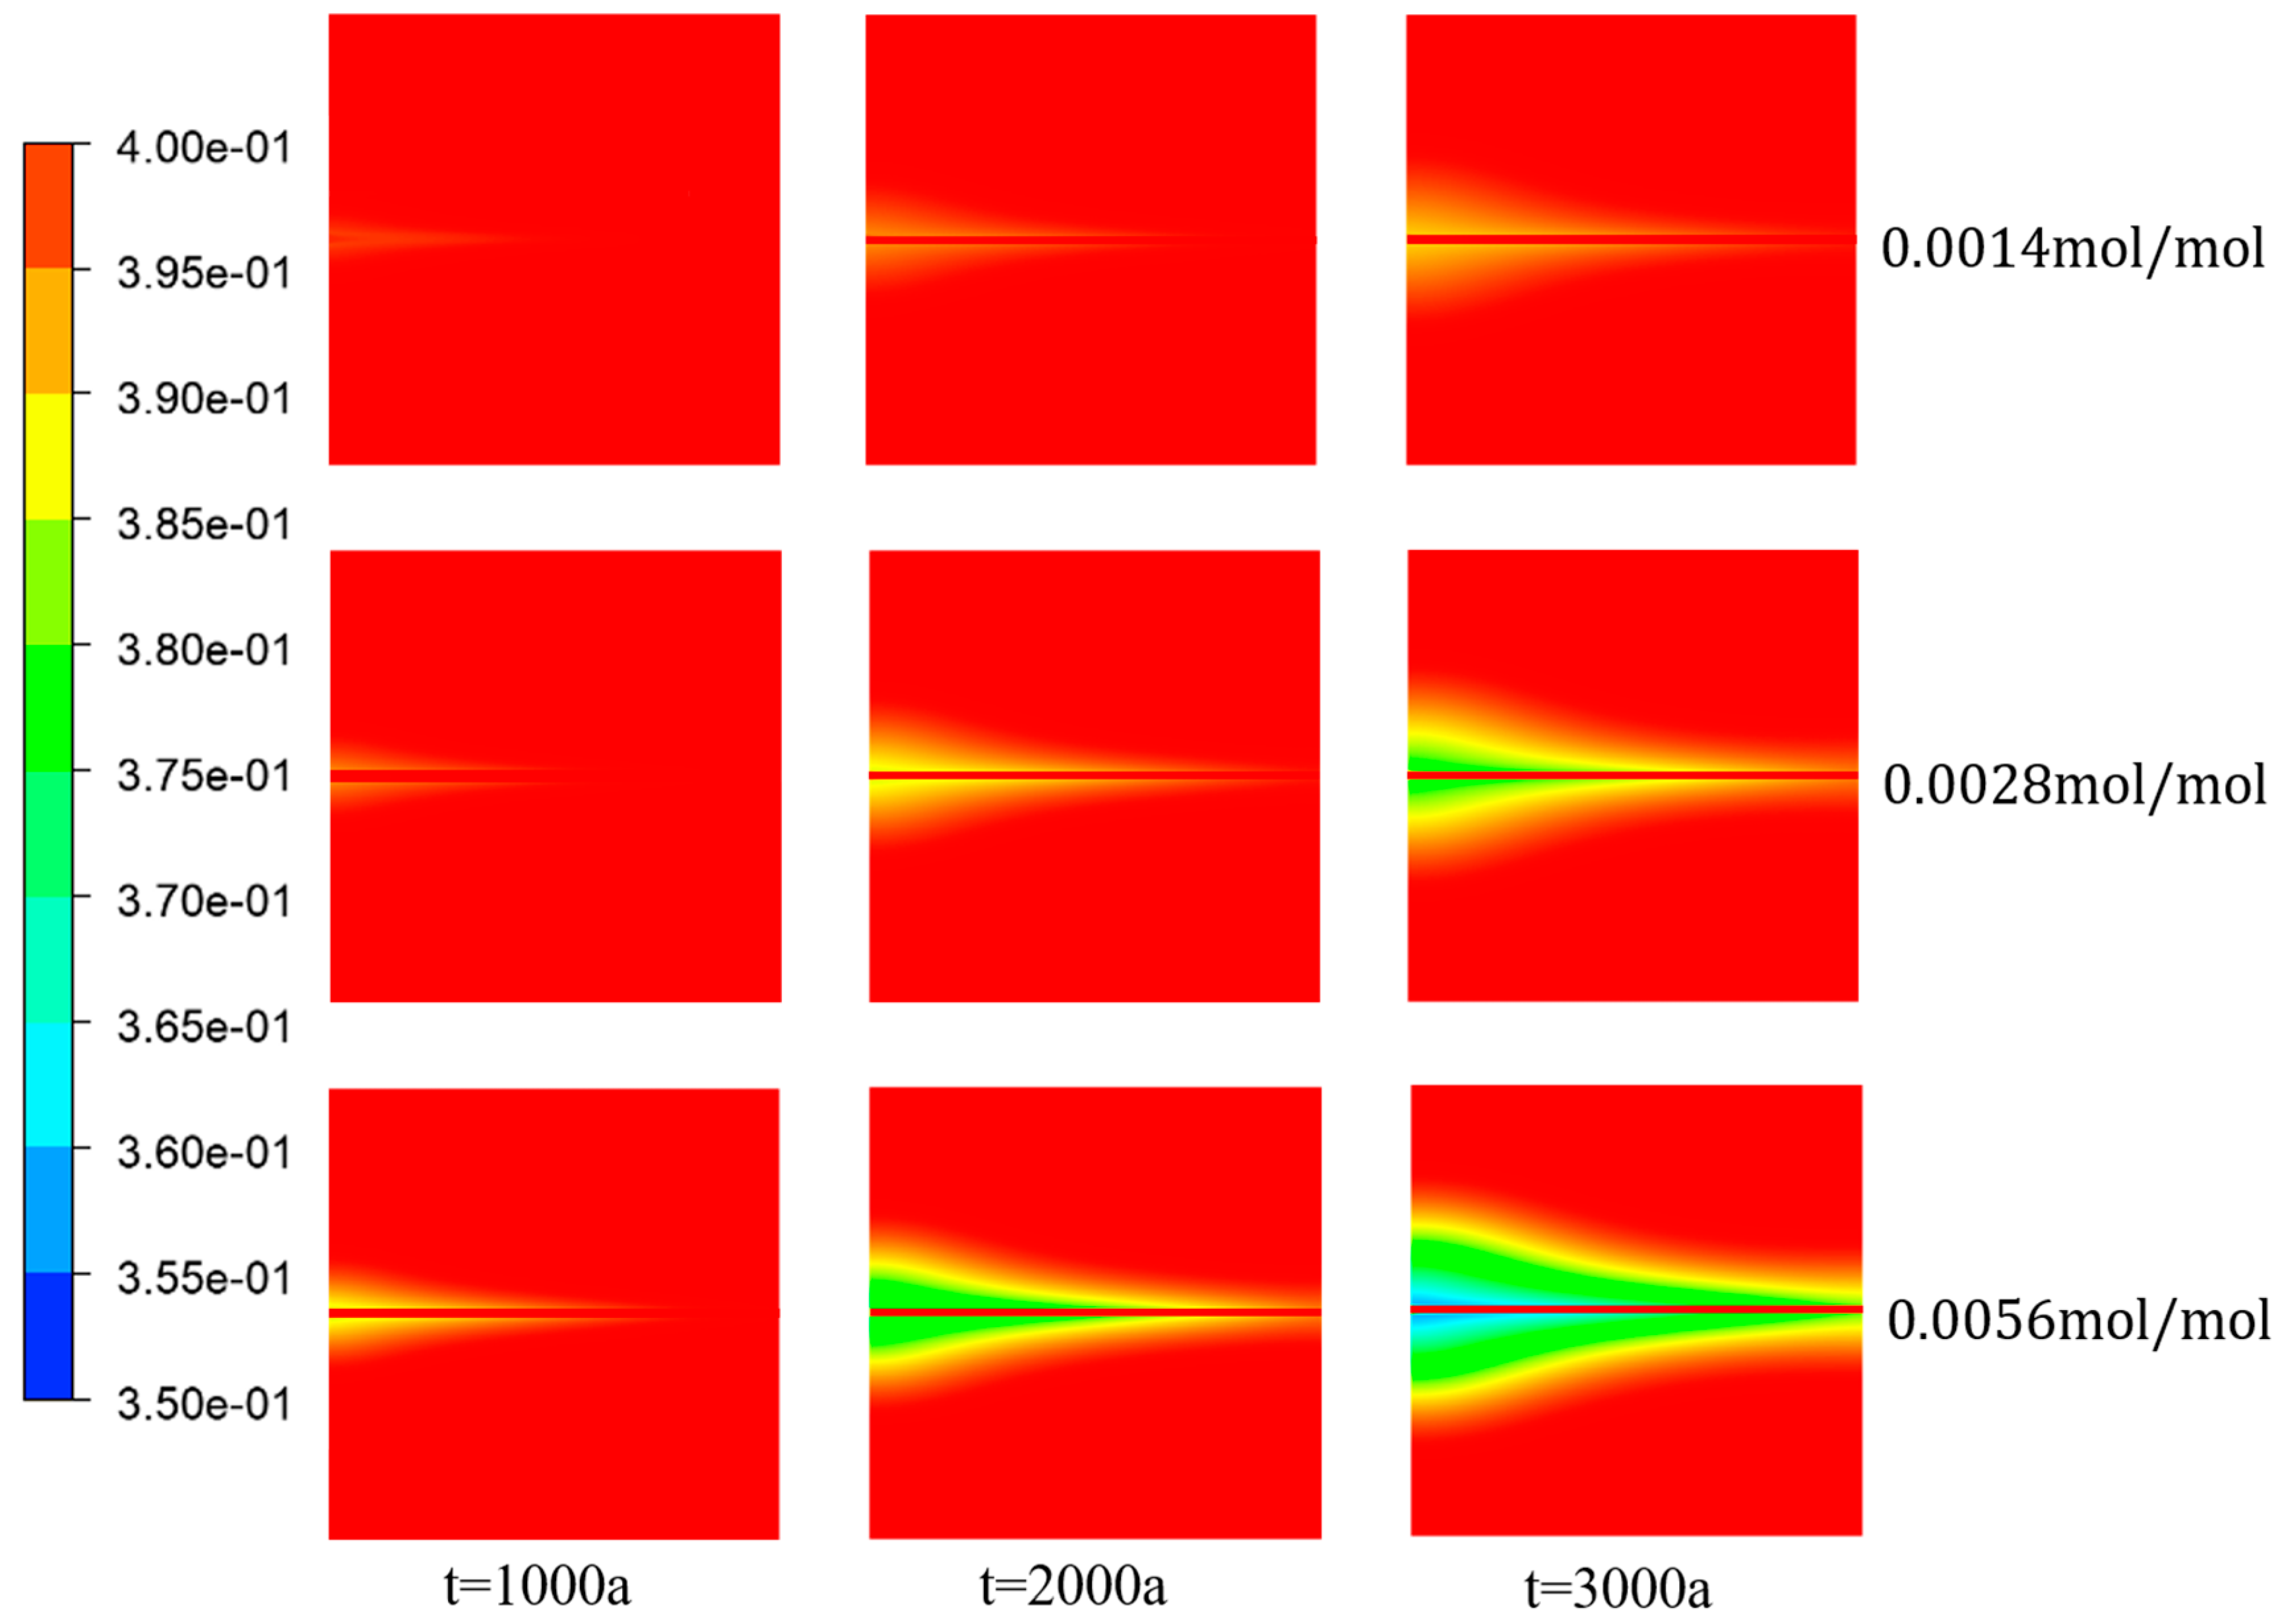
, specifically 0.0014 mol/mol, 0.0028 mol/mol, and 0.0056 mol/mol.
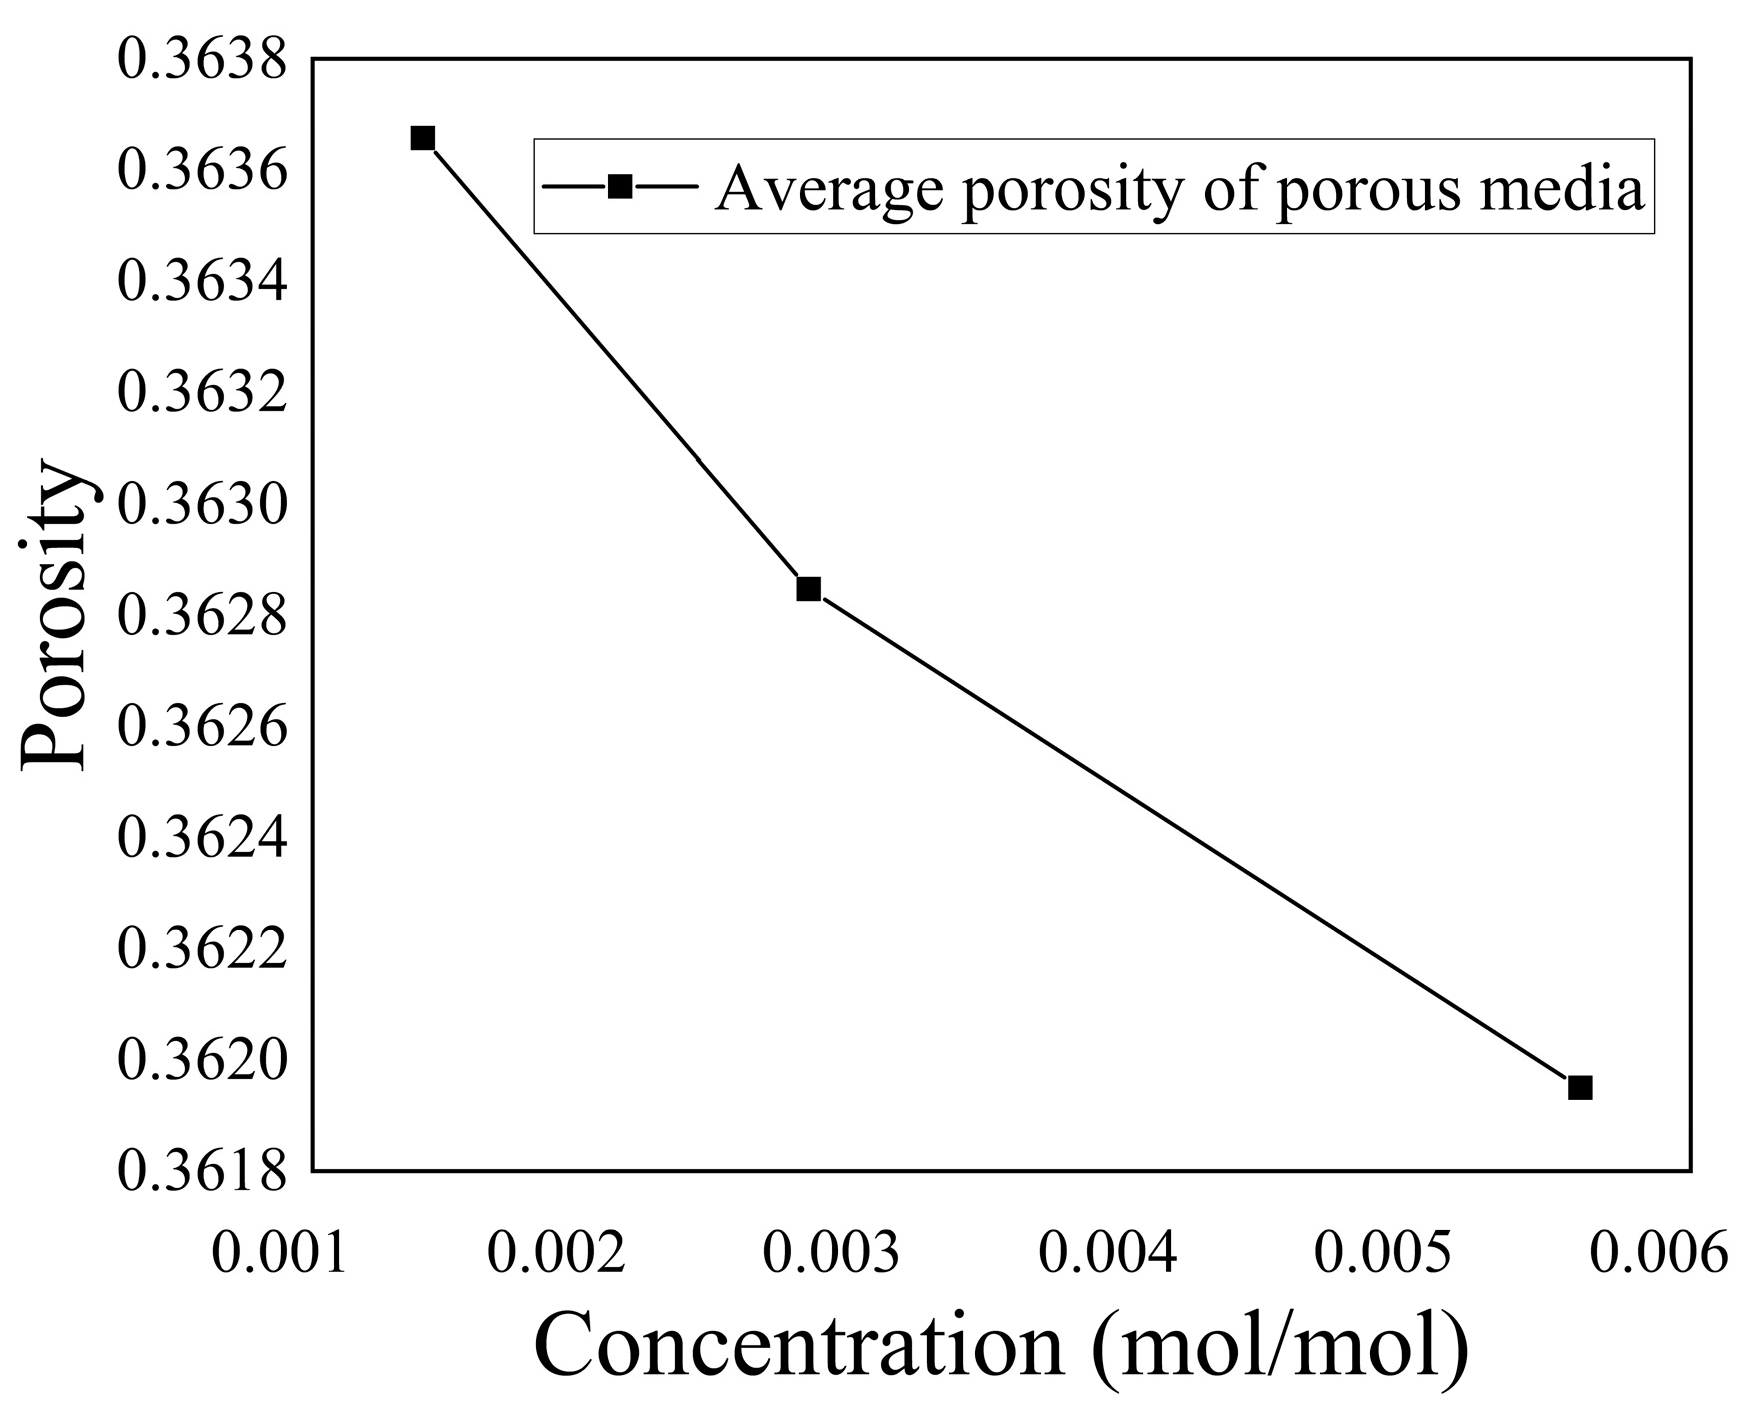
Figure 18 and
Figure 19 illustrate the variation in porosity and the average porosity variation in the porous media region, respectively, for different concentrations of
. The graphs demonstrate a clear trend, where within a specific range of ion concentrations, the porosity within the domain gradually decreased as the ion concentration increased. This finding was consistent with Equations (6) and (7), which indicate that the chemical reaction rate is directly proportional to the first power of the
concentration. Therefore, an increase in
concentration enhanced the chemical reaction rate, leading to the deposition of more
within the porous media region over a given period. Consequently, this deposition reduced the porosity of the porous media and the average porosity decreased by 0.495%.
- (2)
Heat Transfer Analysis
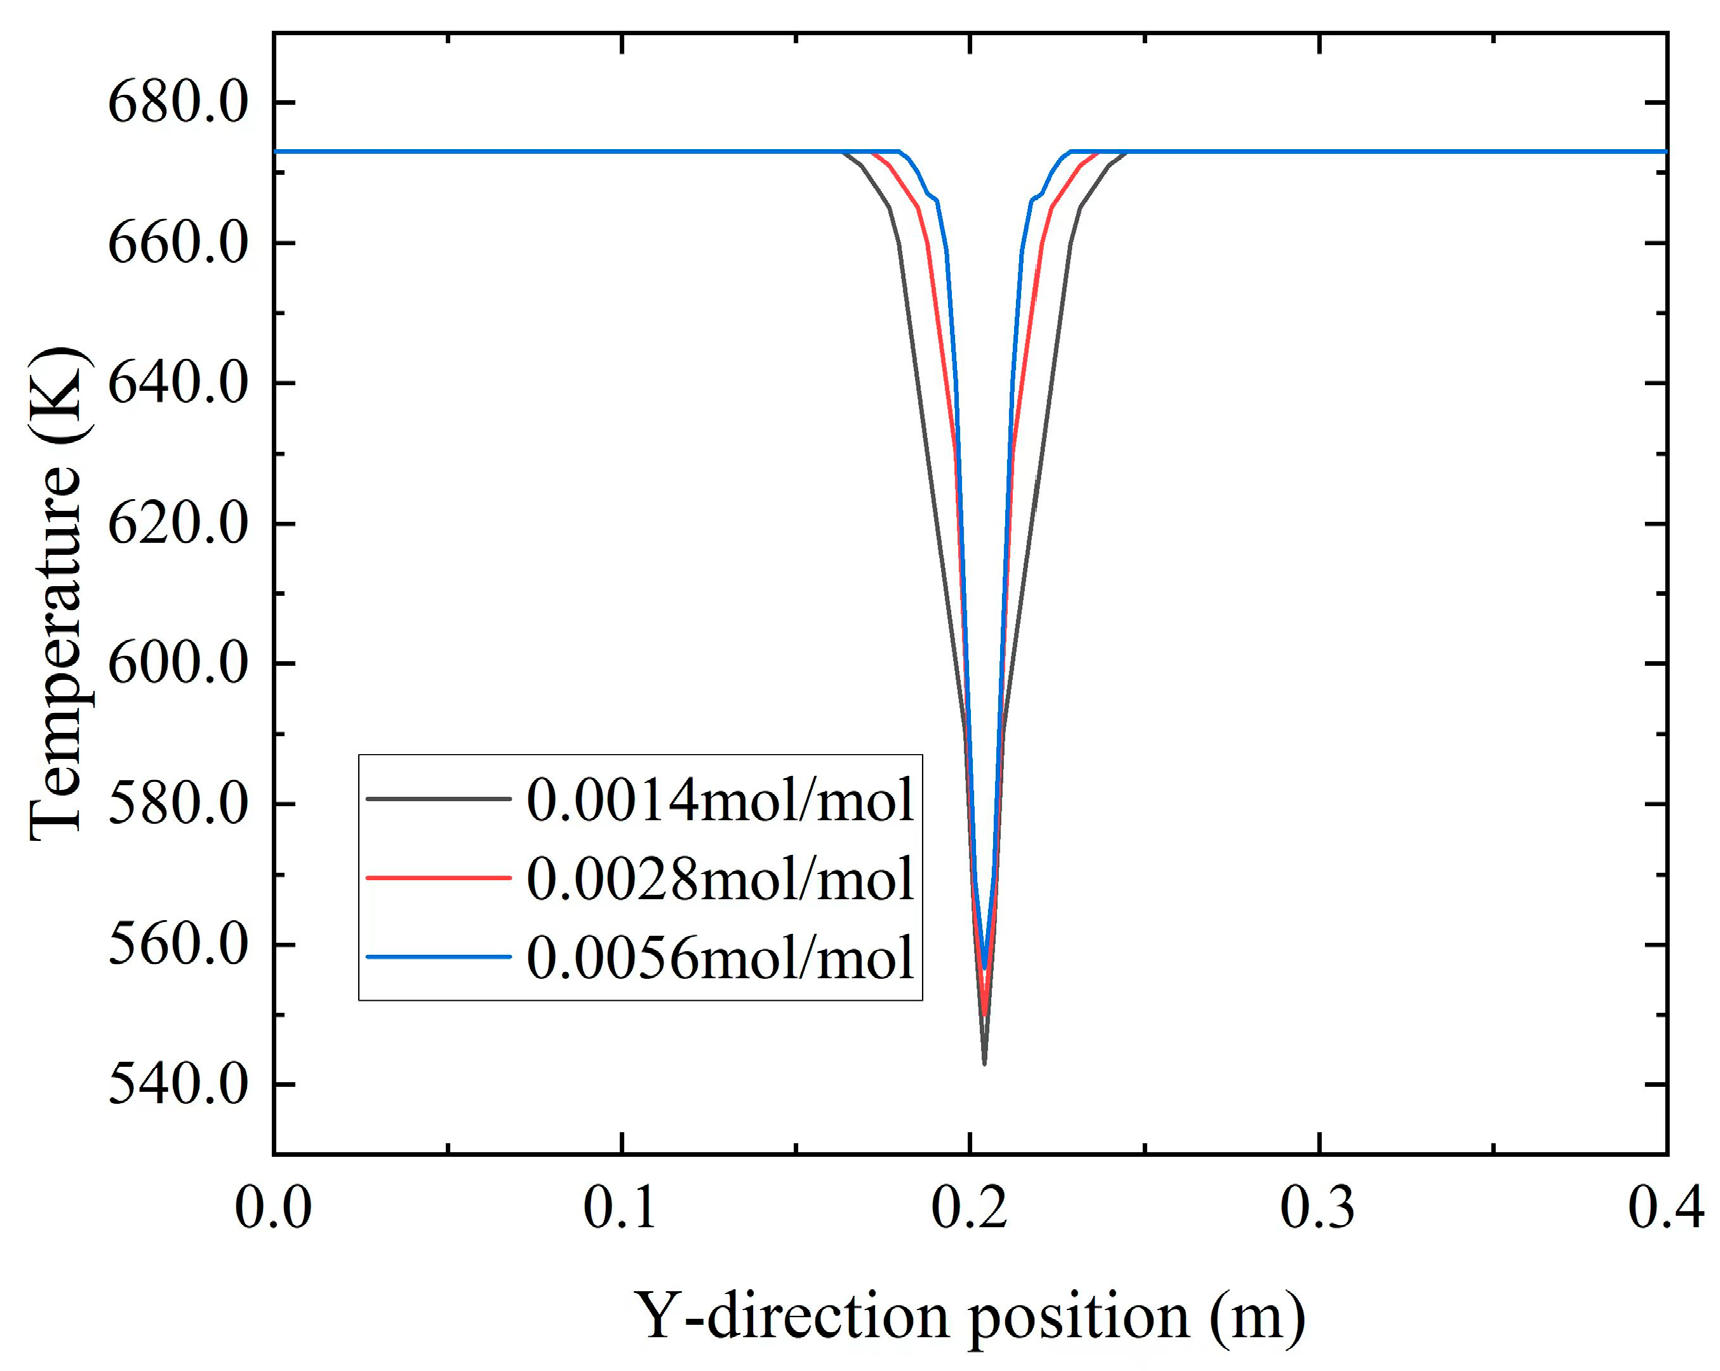
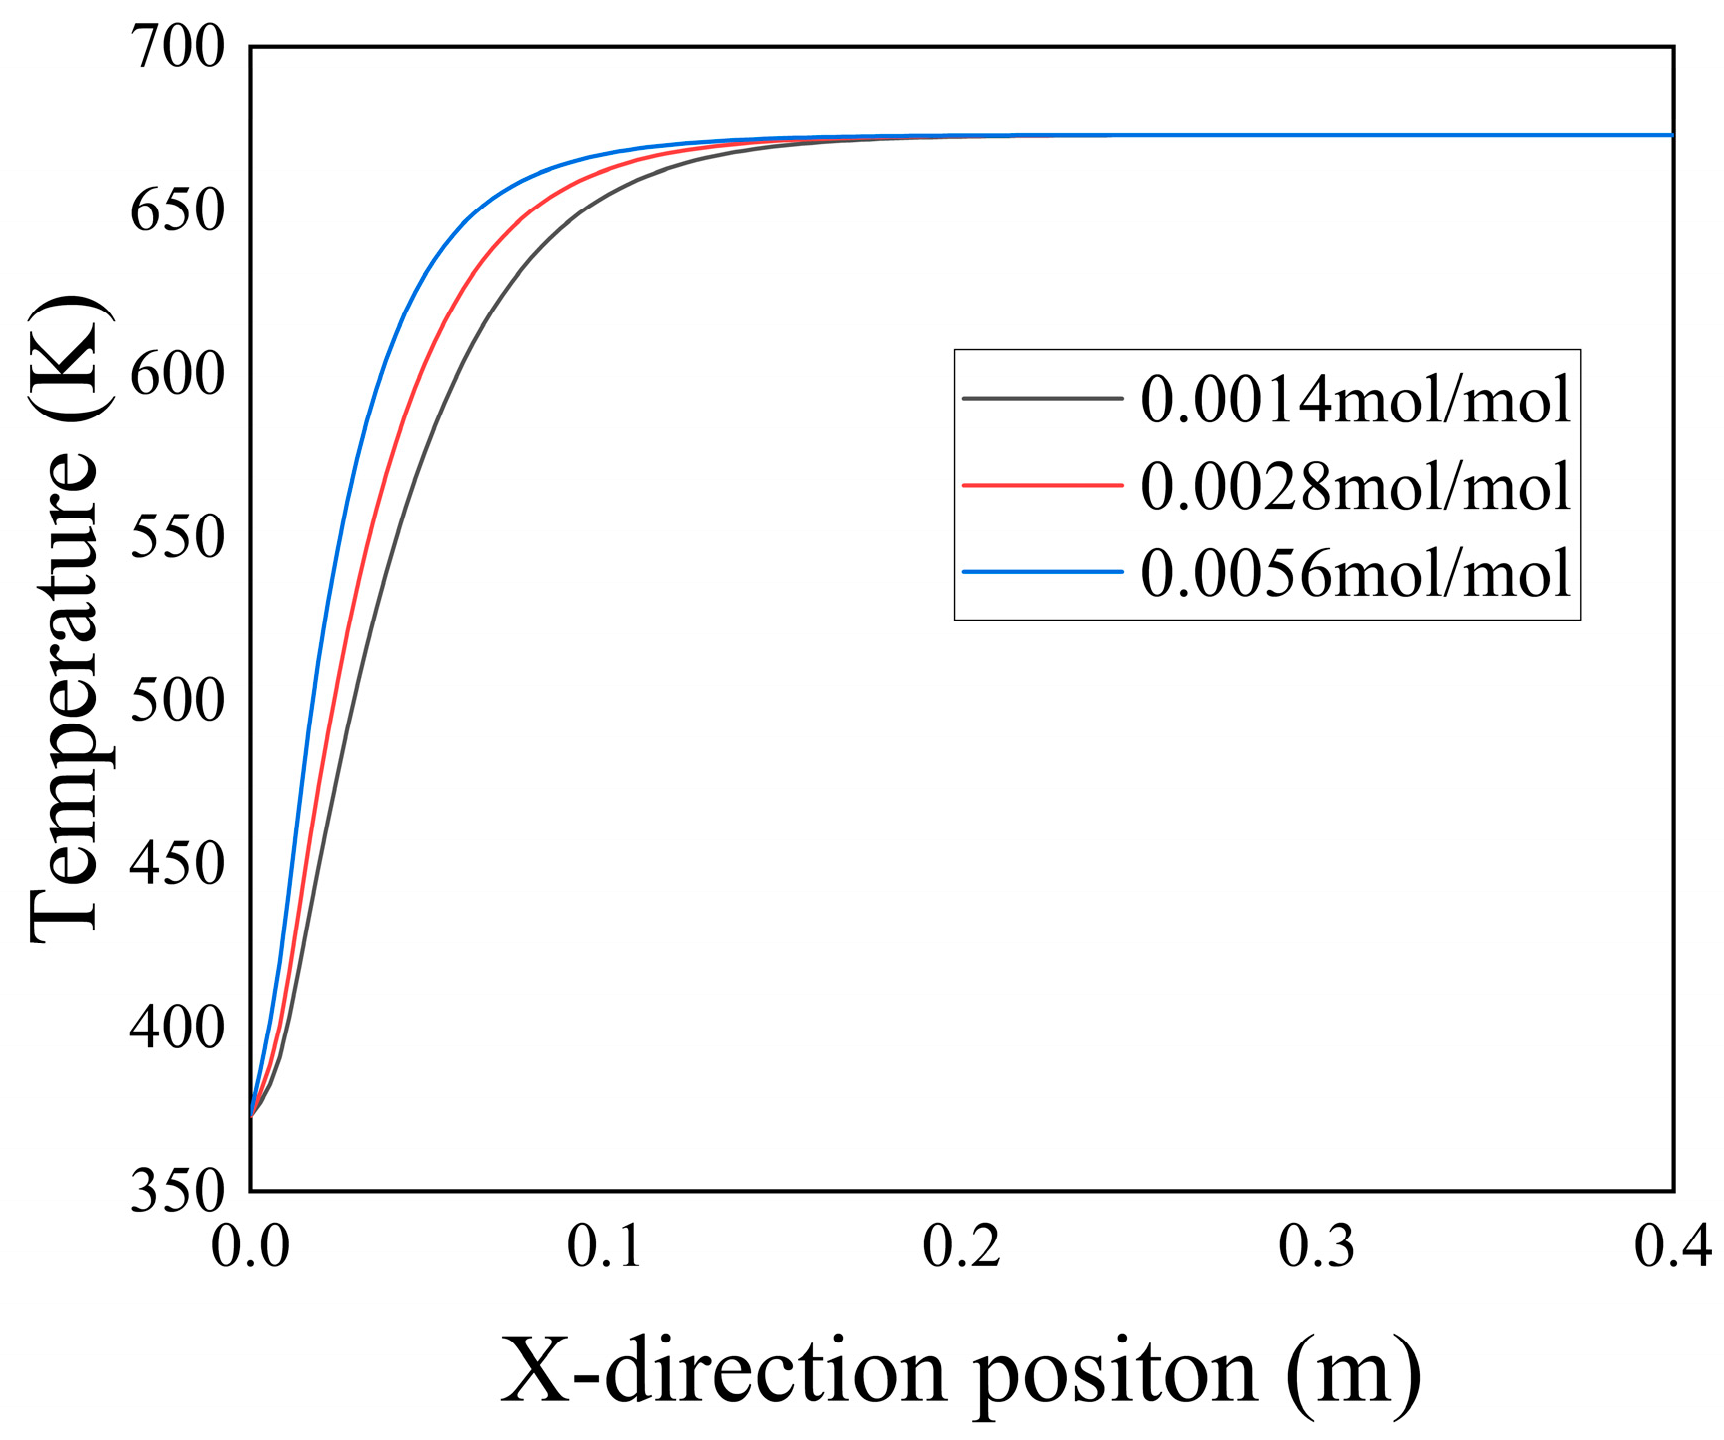
Figure 20 illustrates the temperature distribution along the Y-axis at X = 0.1 m for different
concentrations at t = 3000 a. The graph reveals that with the injection of low-temperature seawater and an increase in
concentration, the temperature gradient in the Y-direction near the inlet section intensified. This phenomenon could be attributed to the elevated ion concentration, which promoted the formation of
precipitation, as shown in
Figure 18. The deposition of
reduced the porosity of the porous media, hindering the diffusion of low-temperature seawater toward the high-temperature hydrothermal fluid. Consequently, this alteration affected the convective heat transfer between the two fluids at the inlet section, resulting in an increased temperature gradient at that location.
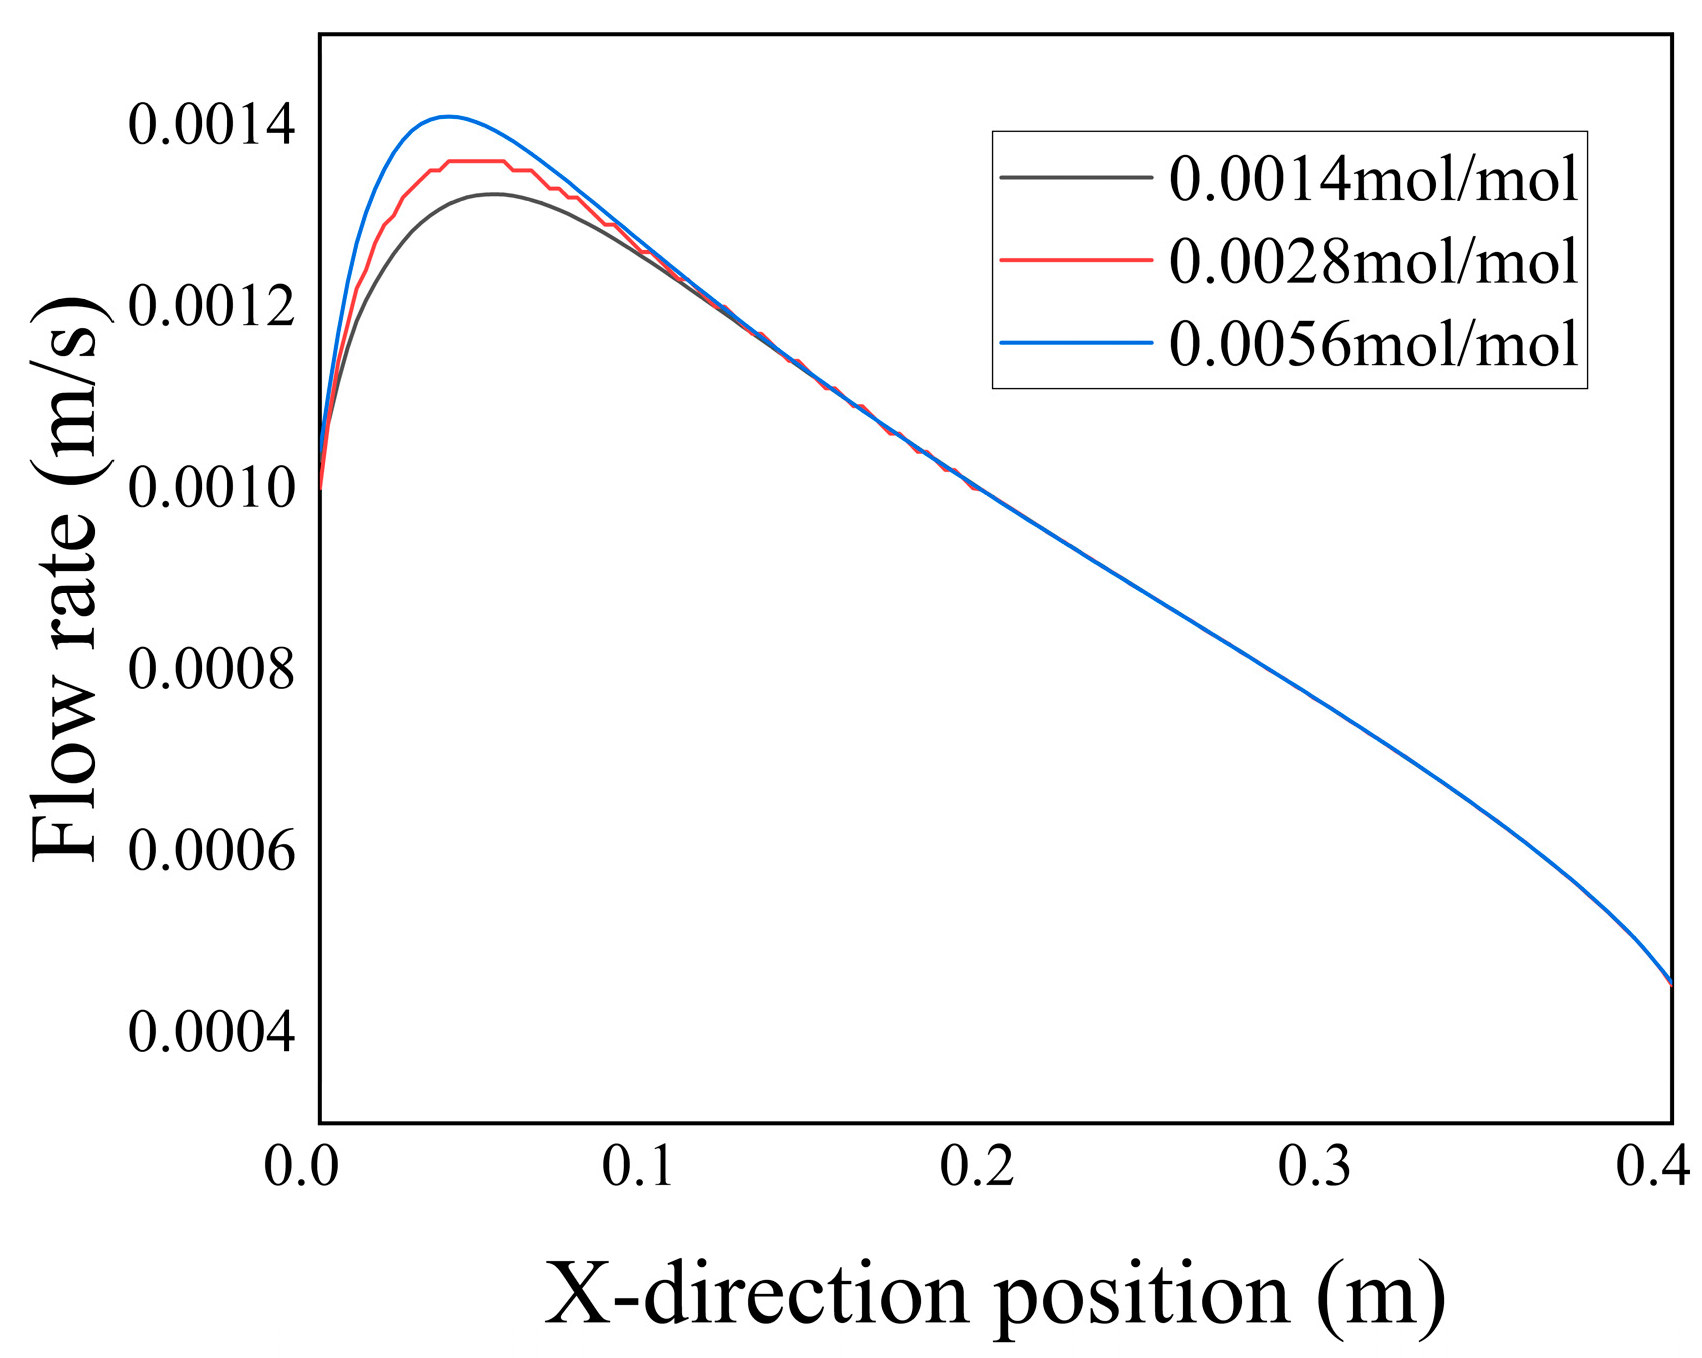
Figure 21 illustrates the distribution of velocity along the Y-axis at the axis line Y = 0.2 m for varying concentrations of
at t = 3000 a. Combined with
Figure 19, it can be observed that an augmentation in sulfate ion concentration led to the deposition of
, subsequently reducing the porosity. Consequently, the infiltration of low-temperature seawater into the porous media diminished. As a result, the maximum flow velocity of the low-temperature seawater entering the fractures increased.
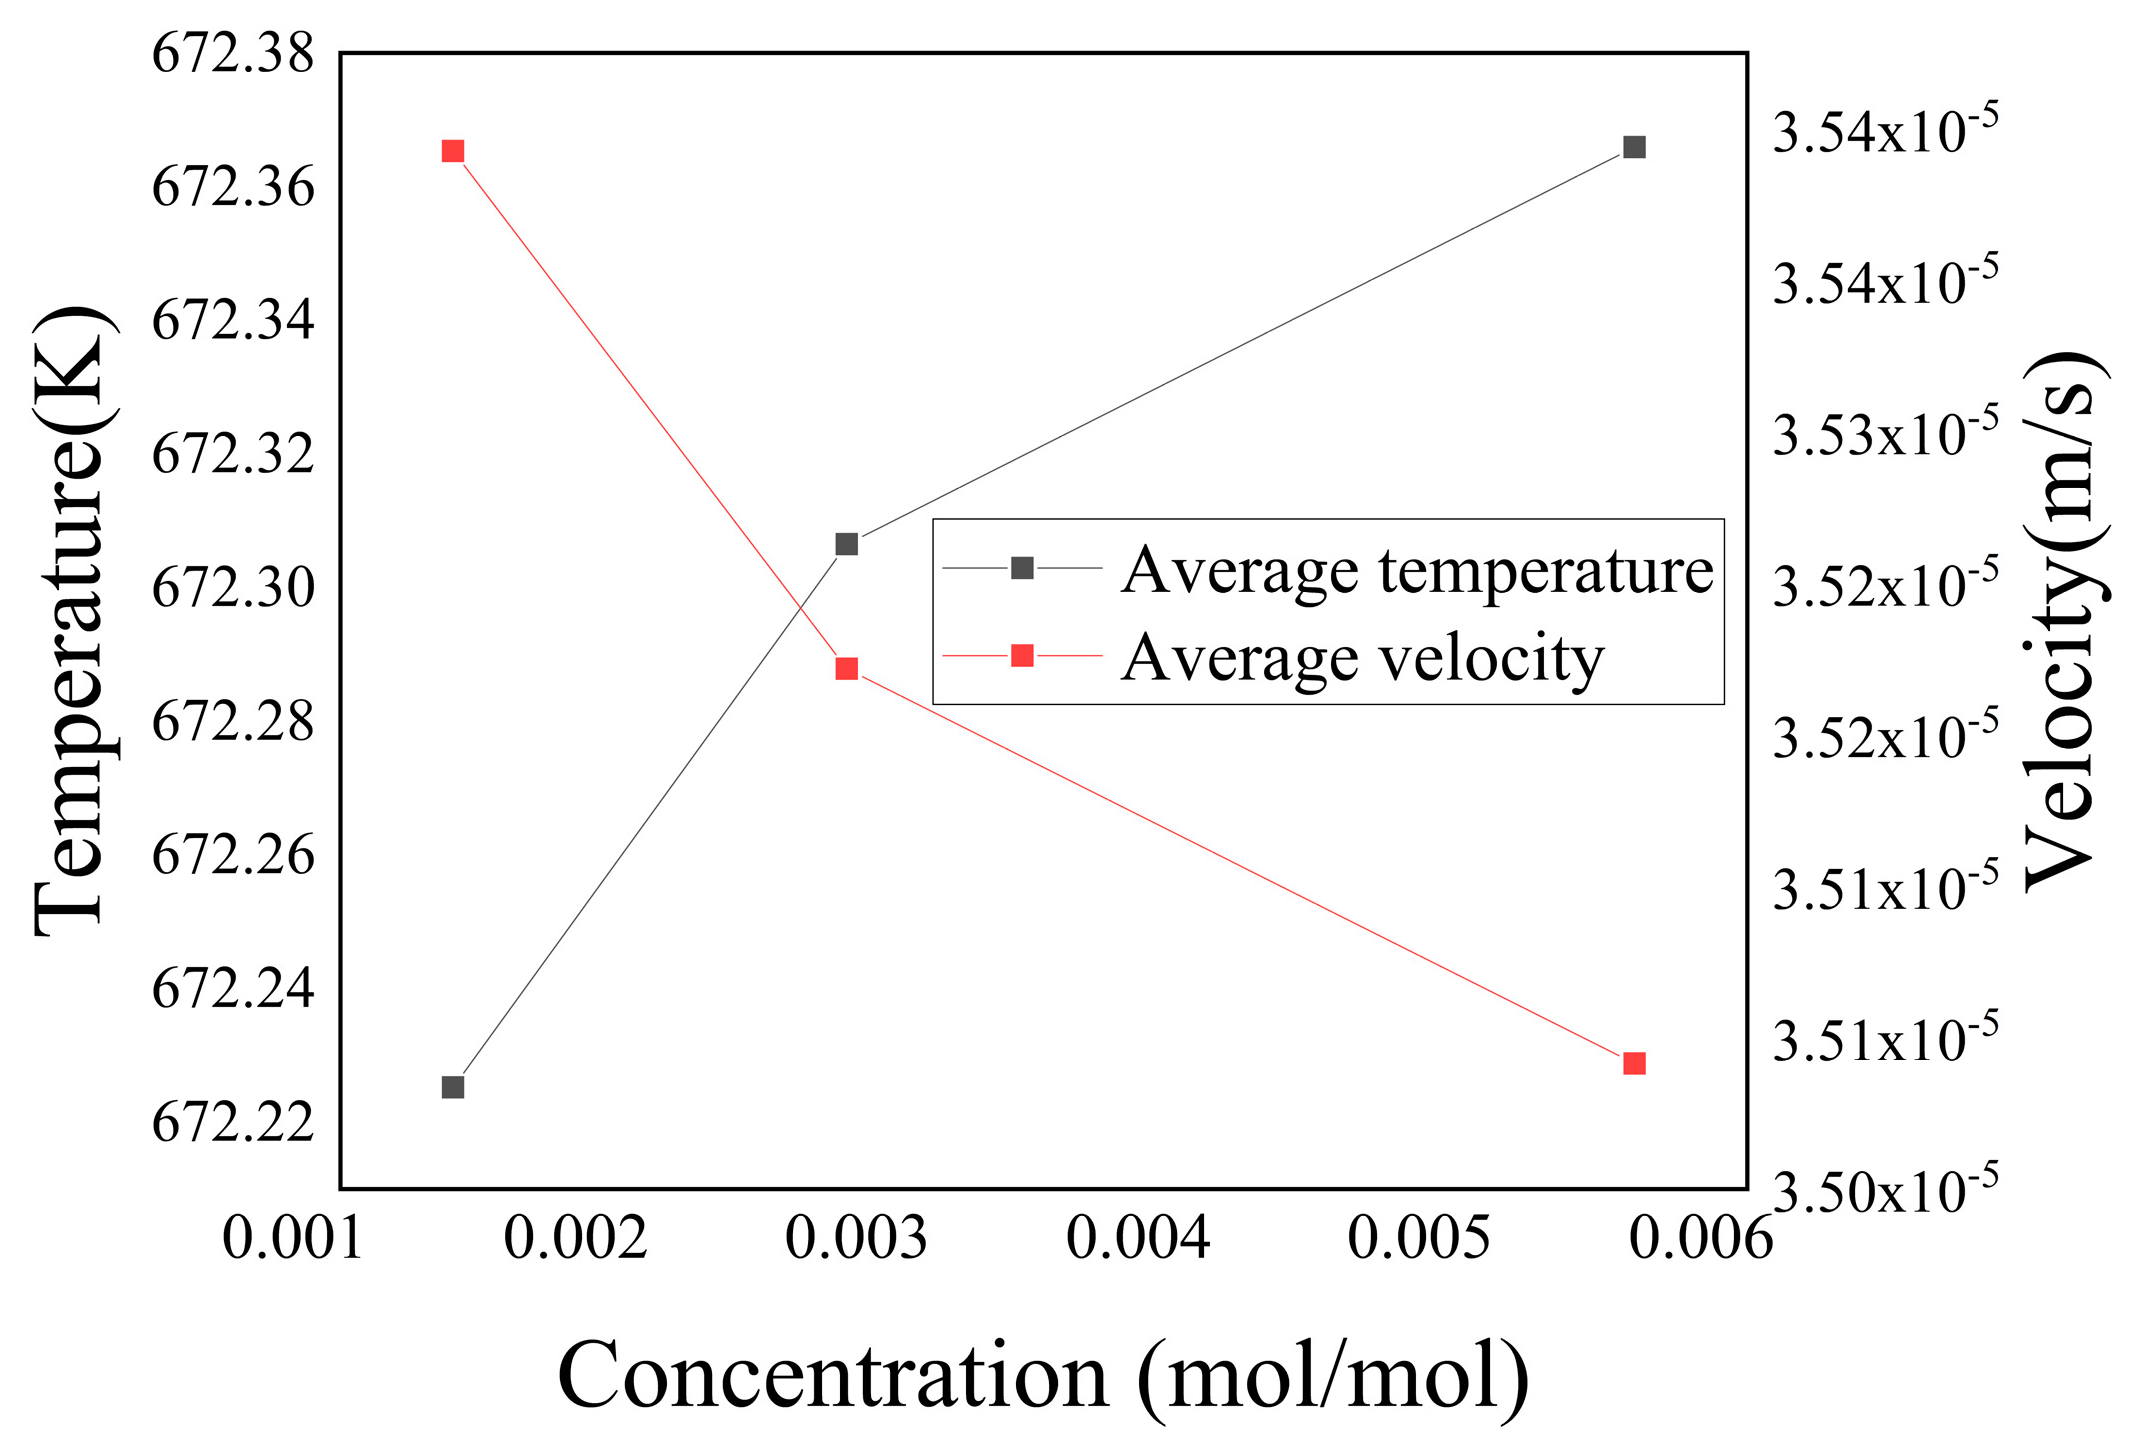
Figure 22 represents the variations in average temperature and average velocity within the porous media region with different concentrations of sulfate ions
at t = 3000 a. The figure demonstrates that as the concentration of
increased, the average temperature within the porous media region gradually rose, while the average velocity continuously decreased. Combined with
Figure 22, it is evident that an increase in sulfate ion concentration led to a decrease in the porosity of the porous media region on both sides of the fractures. Consequently, this reduction in porosity impeded the mixing of the two ions, hindered chemical reactions, and limited heat exchange between the two fluids. Consequently, the average temperature within the porous media region decreased. Simultaneously, the reduction in porosity led to a gradual decline in the volume of fluid infiltrating into the porous media region, resulting in a decrease in the average flow velocity.
- (3)
Chemical Reaction Rate Analysis
Figure 23 illustrates the spatiotemporal distribution of chemical reaction rates in the entire computational domain and the porous medium region for different concentrations of
. The figure reveals that as the concentration of
increased, the chemical reaction rate within the flow domain continuously rose. This was attributed to the direct proportionality between the chemical reaction rate and ion concentration, with
present in significantly higher quantities than
. Consequently, higher concentrations of
led to greater chemical reaction rates. Additionally, referring to
Figure 22, the overall increase in average temperature throughout the flow domain elevated the chemical reaction rate constant. These mutually reinforcing factors contributed to the overall increase in the chemical reaction rate.
When t > 2250 a, the chemical reaction rate for the concentration of 0.0028 mol/mol of gradually became lower than that of the 0.0014 mol/mol group. This could be attributed to the later stages of the reaction, where the accumulation of due to the higher concentration of led to a rapid reduction in porosity. As a result, the hinderance to fluid infiltration from the fractures into the porous medium region intensified. At this point, the inhibitory effect of reduced porosity on ion diffusion outweighed the promoting effect of increased ion concentration on the chemical reaction.
3.2.3. Impact of Inflow Velocity on Flow and Heat Transfer
- (1)
Variation in Porosity
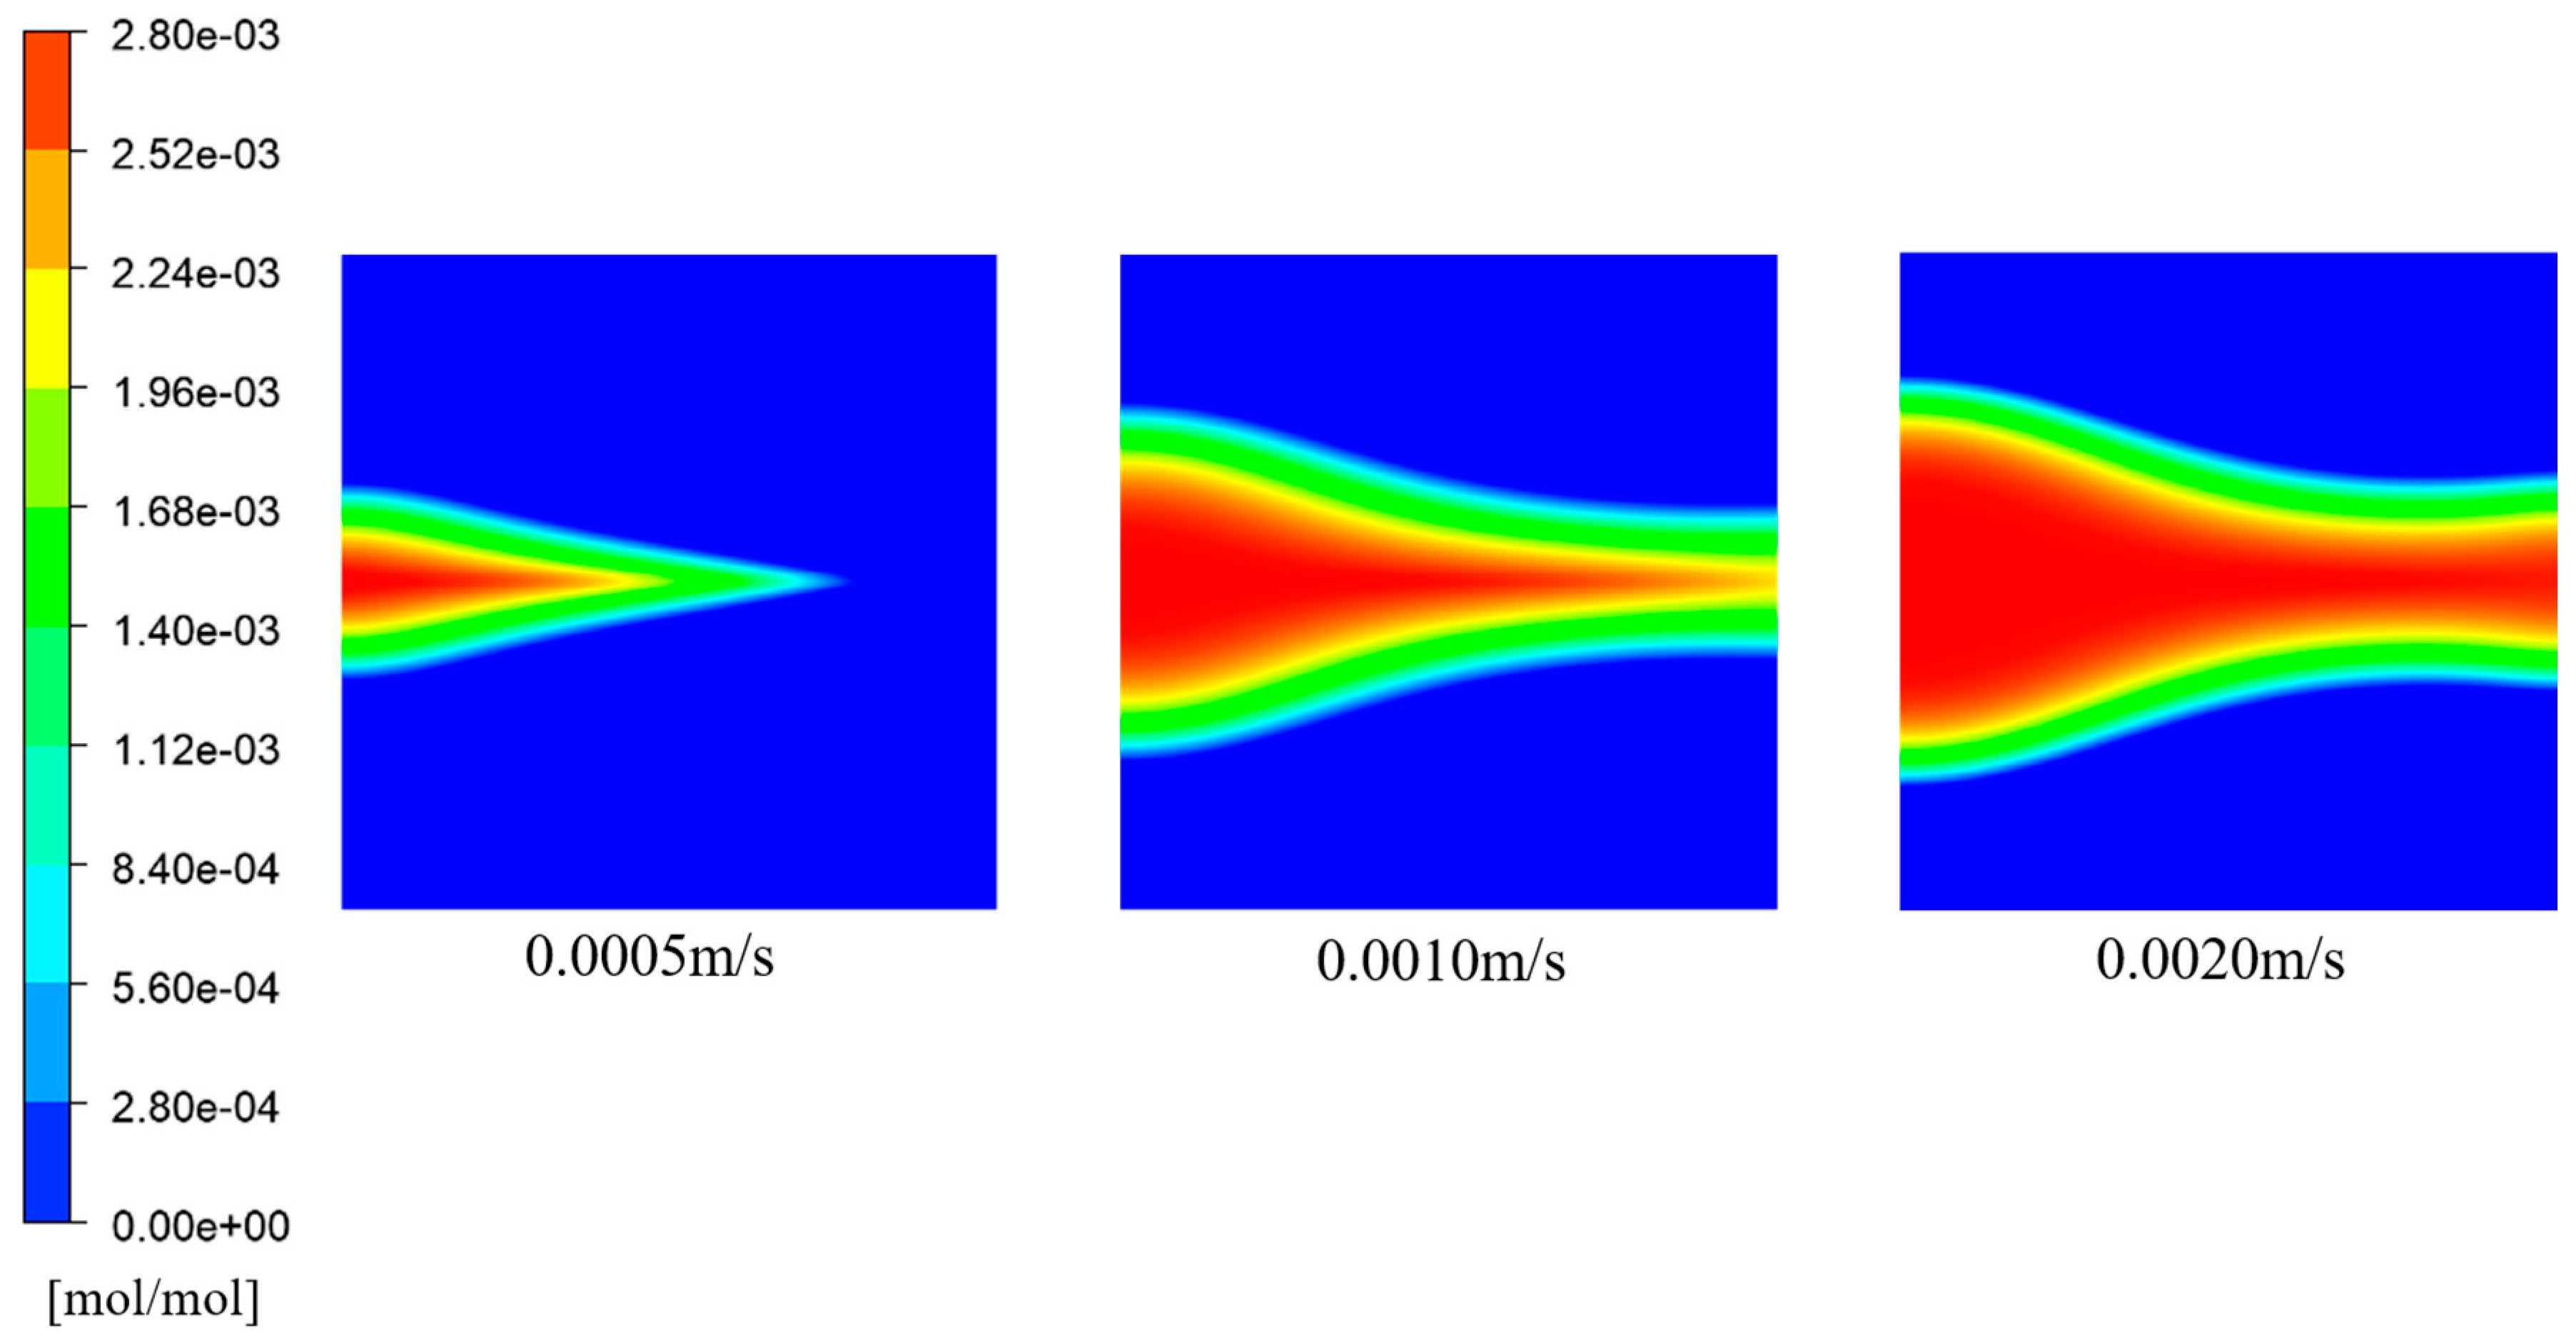
The inflow velocity plays a crucial role in determining the degree of mixing between ions, thereby influencing the fluid flow, heat transfer, and chemical reactions between the ions. It is an important factor that affects heat exchange and mineral deposition/dissolution in the hydrothermal reaction zone on the seafloor. In this section, simulations were conducted for inflow velocities of 0.0005 m/s, 0.0010 m/s, and 0.0020 m/s to investigate the flow and heat transfer, as well as the chemical reaction and deposition of seawater and hydrothermal fluid in the fractured porous medium region.
Figure 24 and
Figure 25 depict the variations in porosity for different inflow velocities and the distribution of
concentration at t = 3000 a for different inflow velocities, respectively. Similar to the findings in the previous section, the porosity gradually decreased along the X-direction on both sides of the fracture, with a significant decrease near the inlet. With increasing inflow velocity, the overall porosity gradually decreased; this was primarily concentrated in the regions adjacent to the fracture.
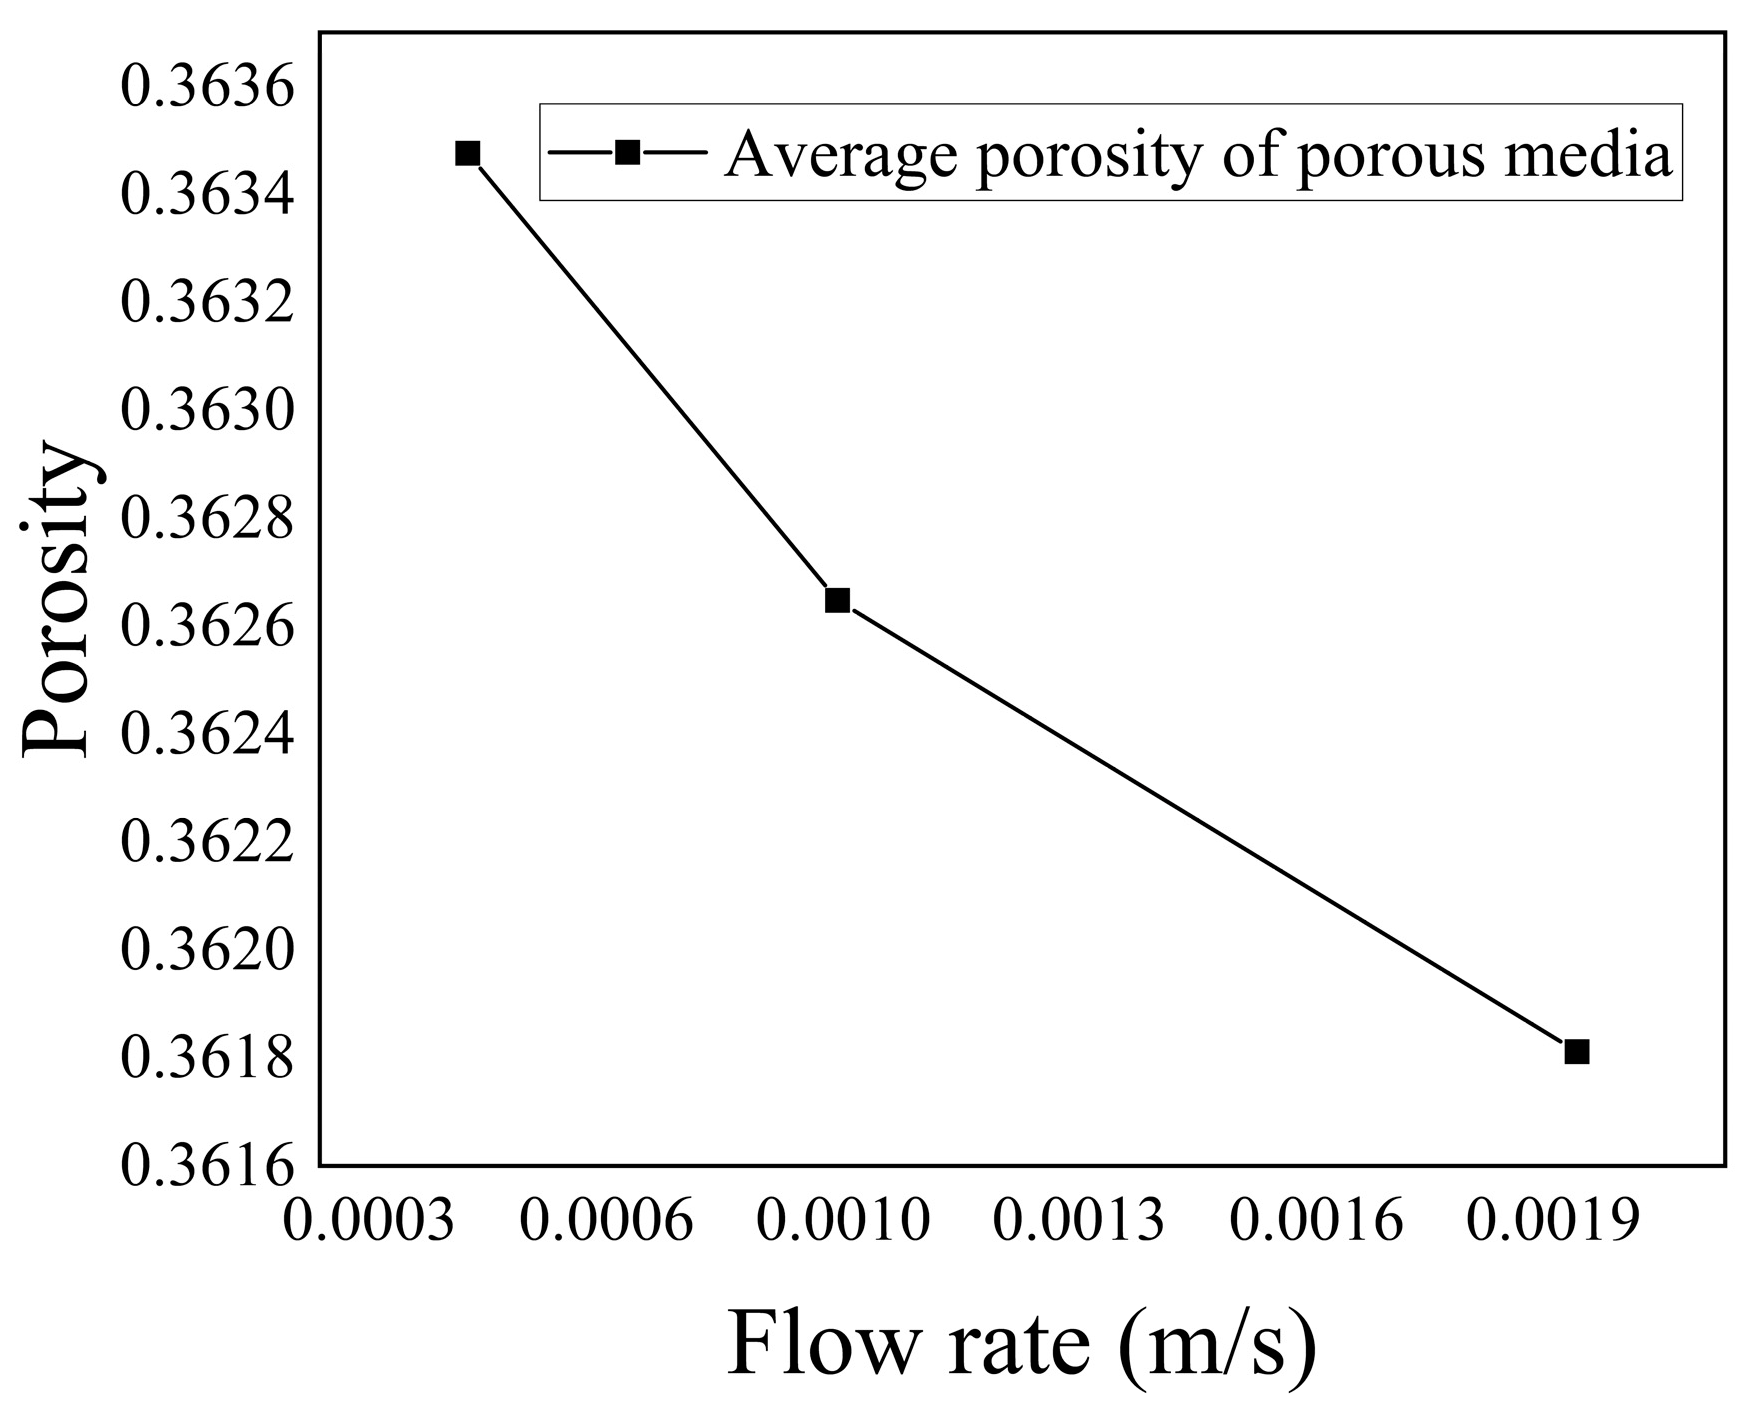
Figure 25 shows the variation in the average porosity in the porous medium region with inflow velocity. It can be observed that as the inflow velocity increased, the average porosity of the entire porous medium region decreased. This was attributed to the enhanced flow rate of low-temperature seawater, which resulted in an increased concentration of
within the flow domain. Consequently, the chemical reaction rate increased, leading to an increased deposition of
within the porous medium, gradually obstructing the pore space and reducing the porosity. According to
Figure 26, the average porosity decreased by 0.468%.
- (2)
Heat Transfer Analysis
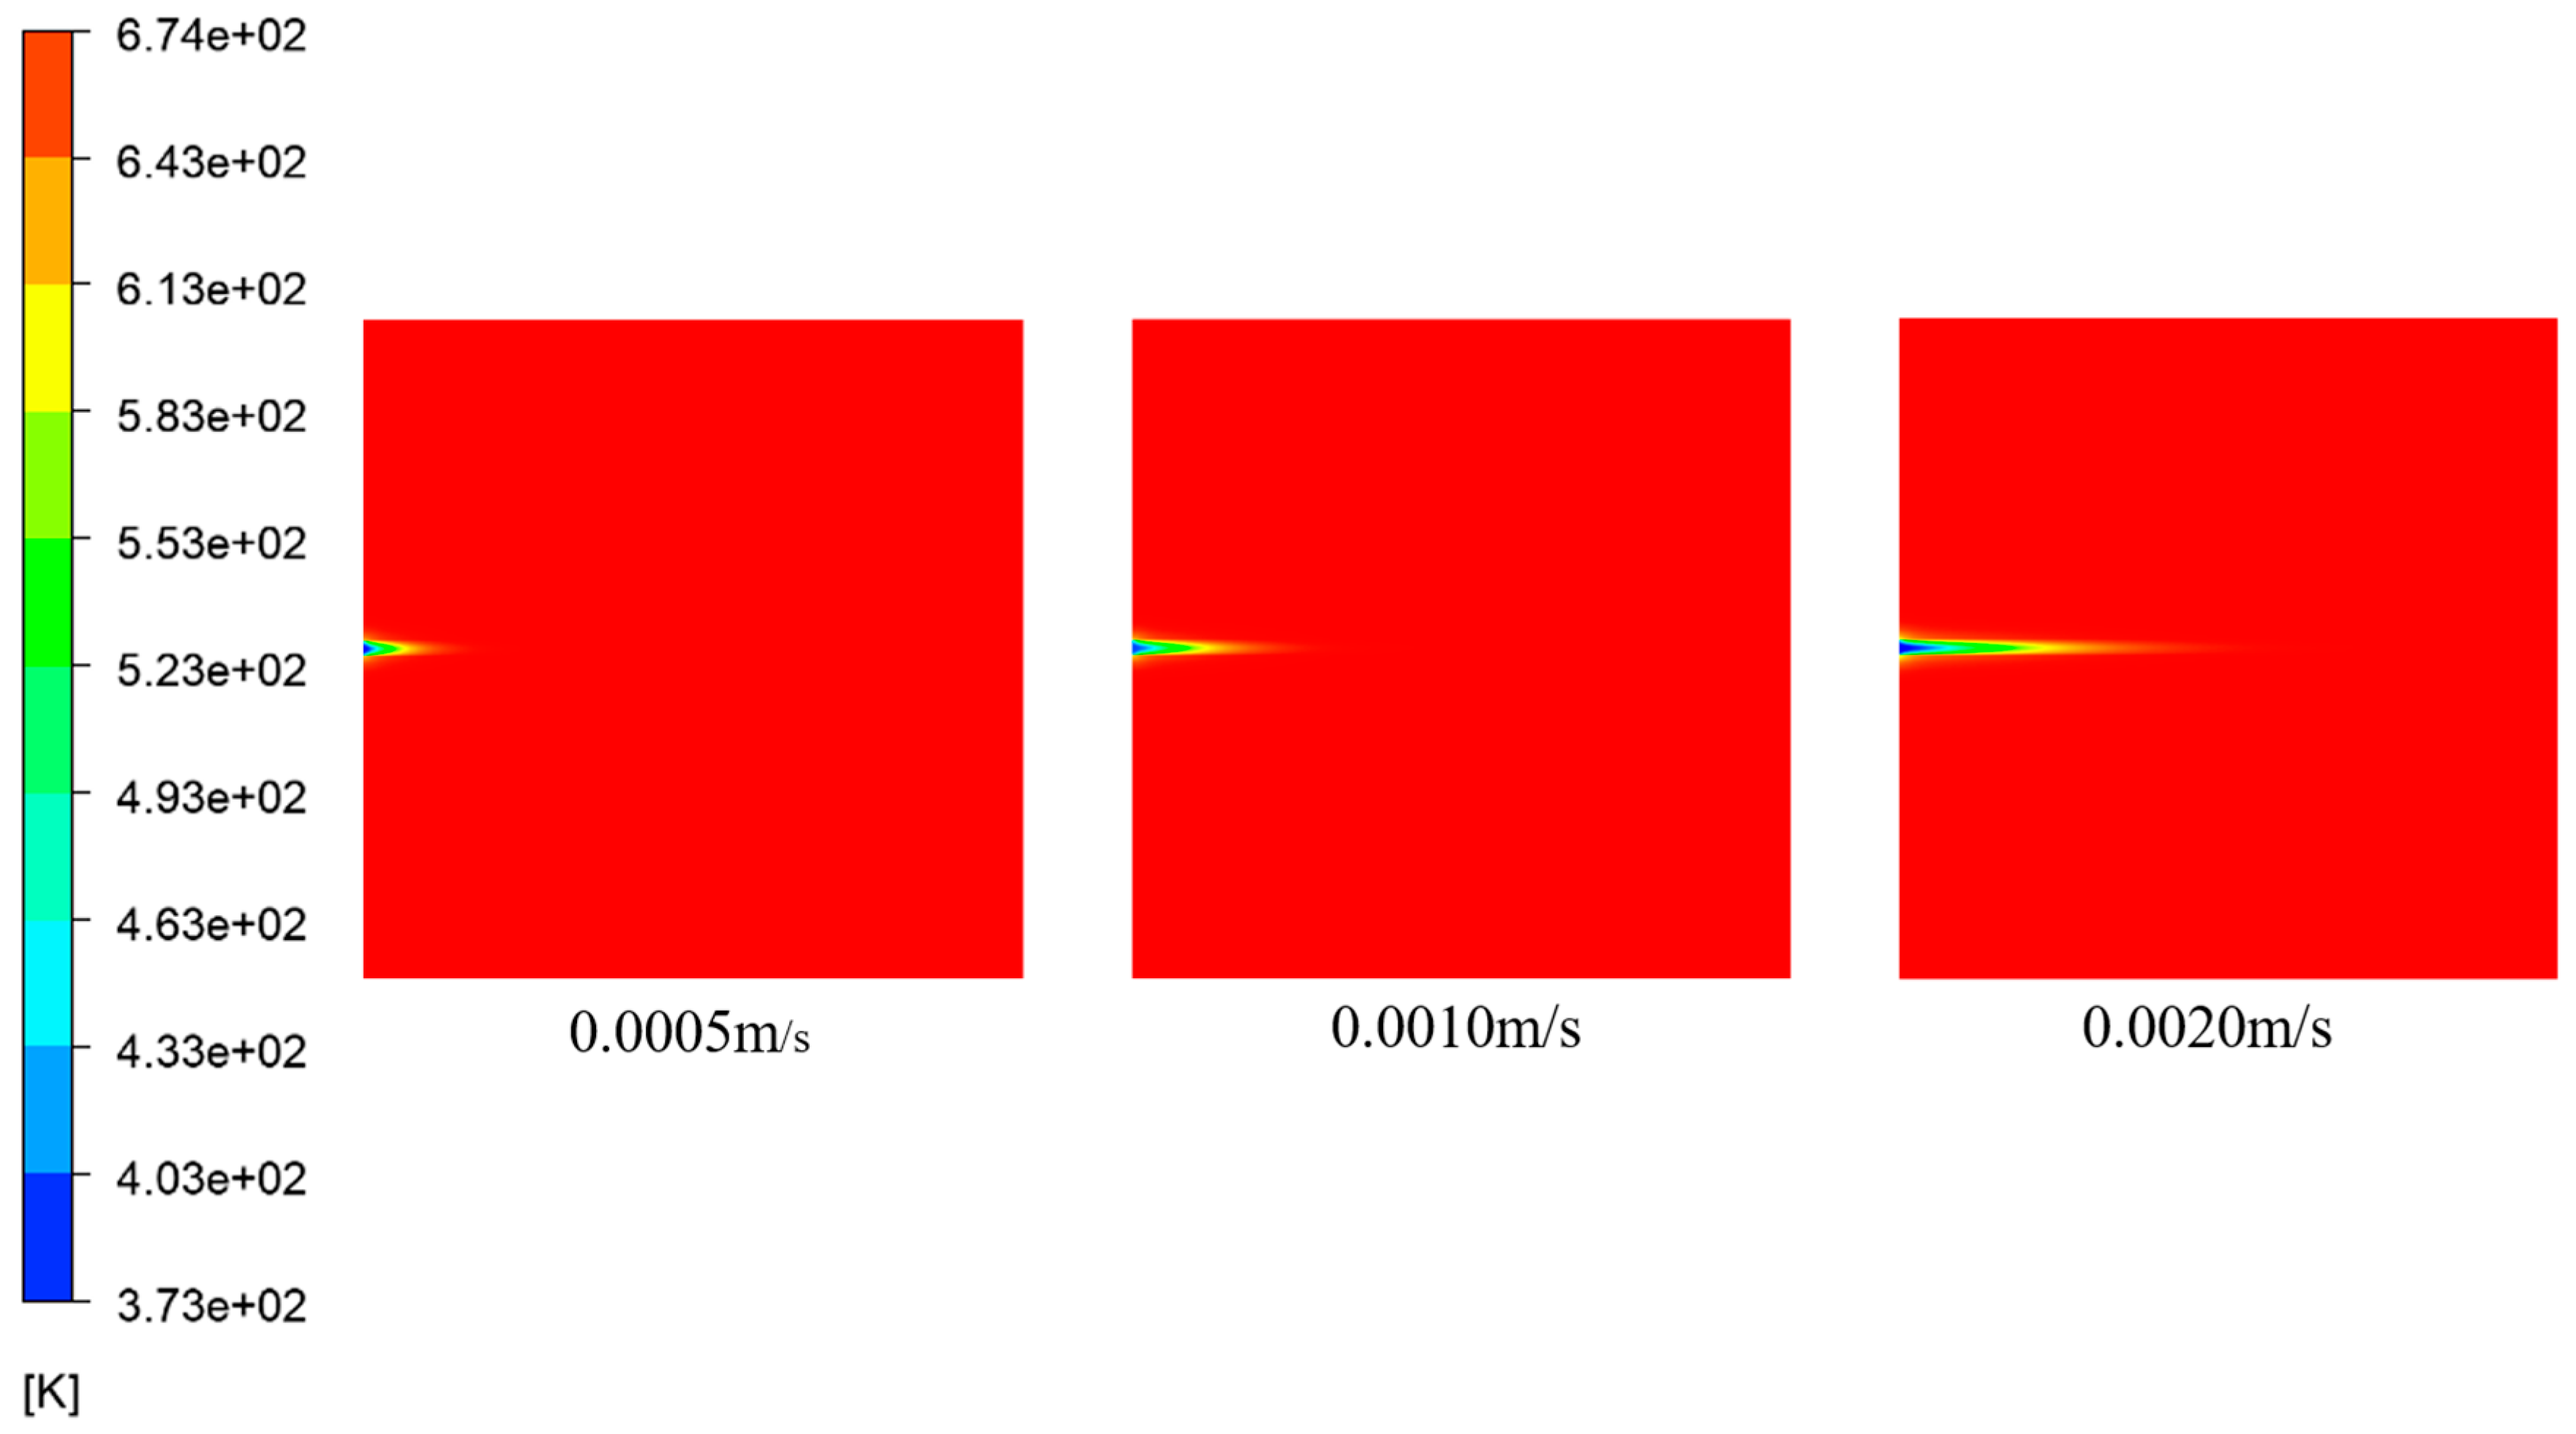
Figure 27 and
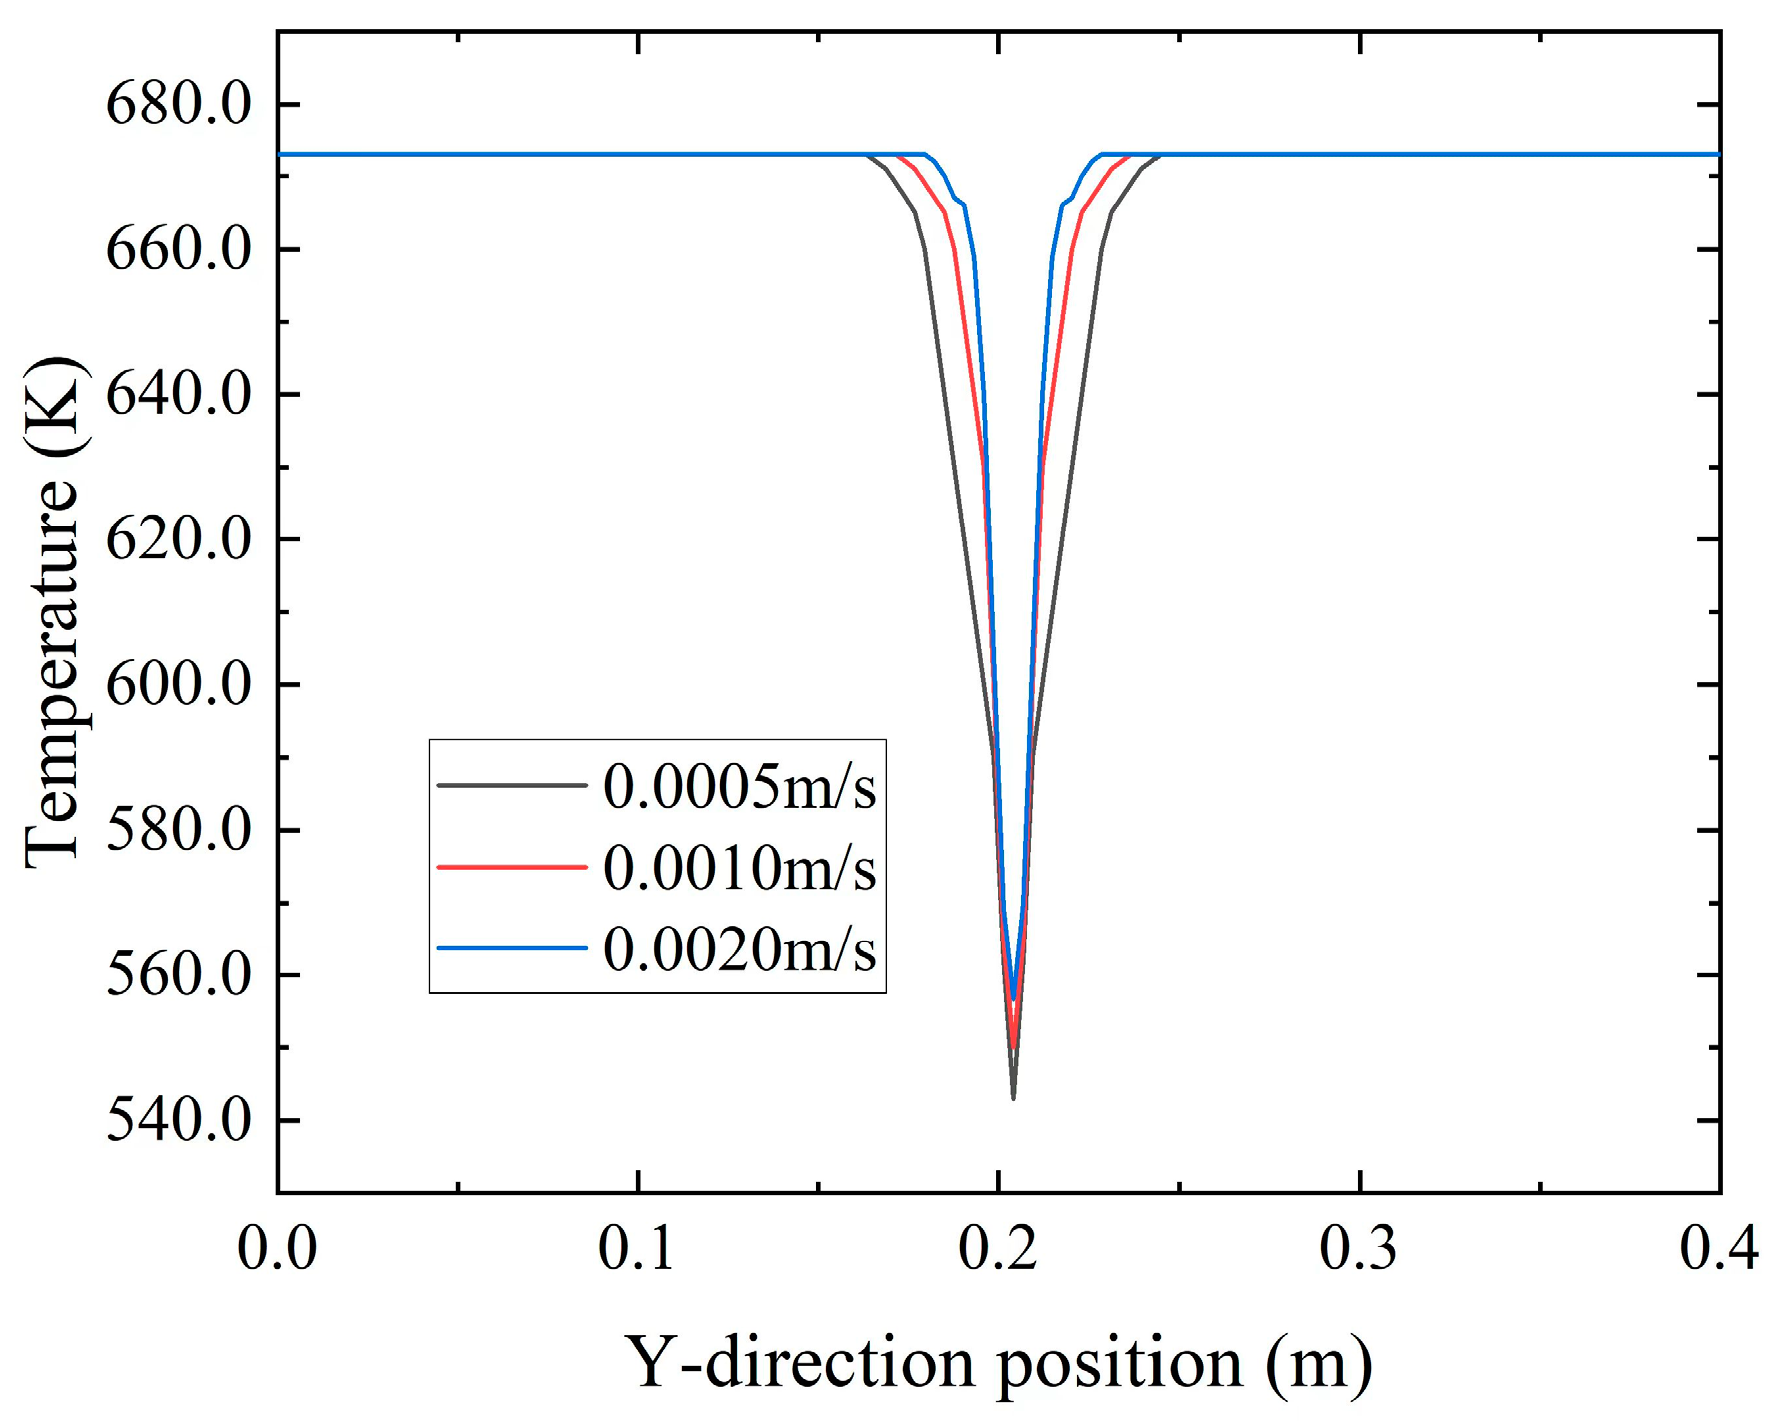
Figure 28 show the temperature distribution at t = 3000 a for various inflow velocities and the corresponding temperature distribution along the Y-axis at Y = 0.2 m, respectively. These figures illustrate that an increase in the inflow velocity led to a downstream extension of the low-temperature region along the X-axis. Specifically, when the inflow velocity was v = 0.0005 m/s, the length of the low-temperature region was x = 0.0931 m. As the inflow velocity increased to v = 0.0010 m/s, the length of the low-temperature region expanded to x = 0.162 m. Similarly, when the inflow velocity was v = 0.0020 m/s, the length of the low-temperature region further elongated to x = 0.269 m. This phenomenon occurred due to the augmented flow rate of the incoming fluid. As a result, the fluid predominantly traversed less obstructed areas within the fractures, resulting in an elongation of the low-temperature region within the fractures.
Figure 29 depicts the temperature distribution along the Y-axis at X = 0.1 m for various inflow velocities at t = 3000 a. The graph reveals that as the inflow velocity increased, the range of temperature diffusion toward the porous medium region diminished, particularly near the inlet. At higher velocities, the low-temperature fluid remained predominantly confined within the fractures. This phenomenon was attributed to excessively high inflow velocities, which created a channel along the central axis. Consequently, the central region exhibited higher porosity, while the porosity on both sides decreased. The deposition of
predominantly occurred on the sides of the central axis, impeding ion mixing. Simultaneously, it hampered heat transfer between the fluids, preventing excessive diffusion of low-temperature seawater into the porous medium region.
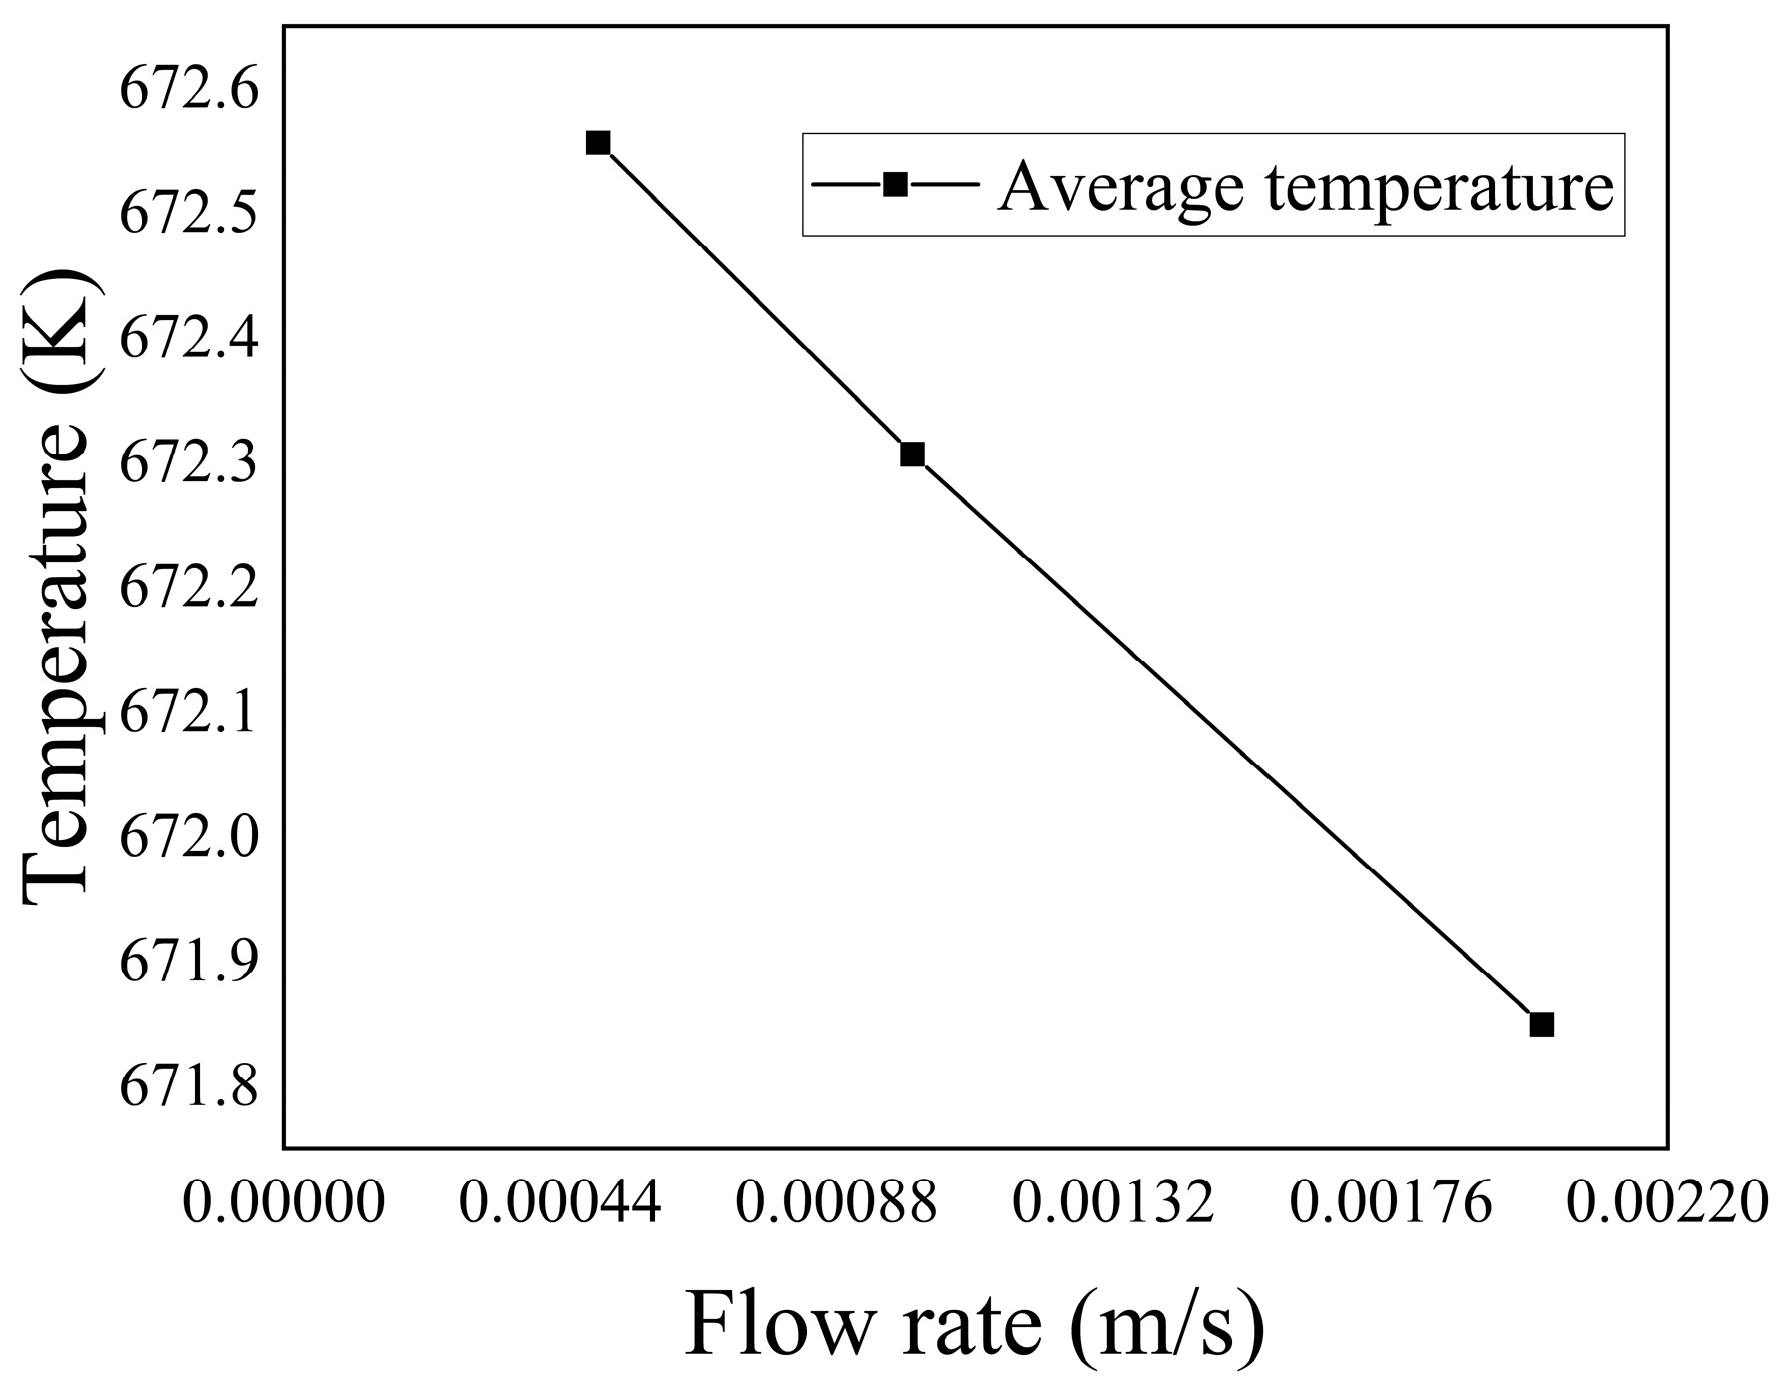
Figure 30 depicts the relationship between inflow velocities and the average temperature within the porous medium region. It demonstrates that as the inflow velocity increased, the flow rate of the low-temperature fluid also increased, resulting in a decrease in the average temperature within the porous medium.
- (3)
Chemical Reaction Rate
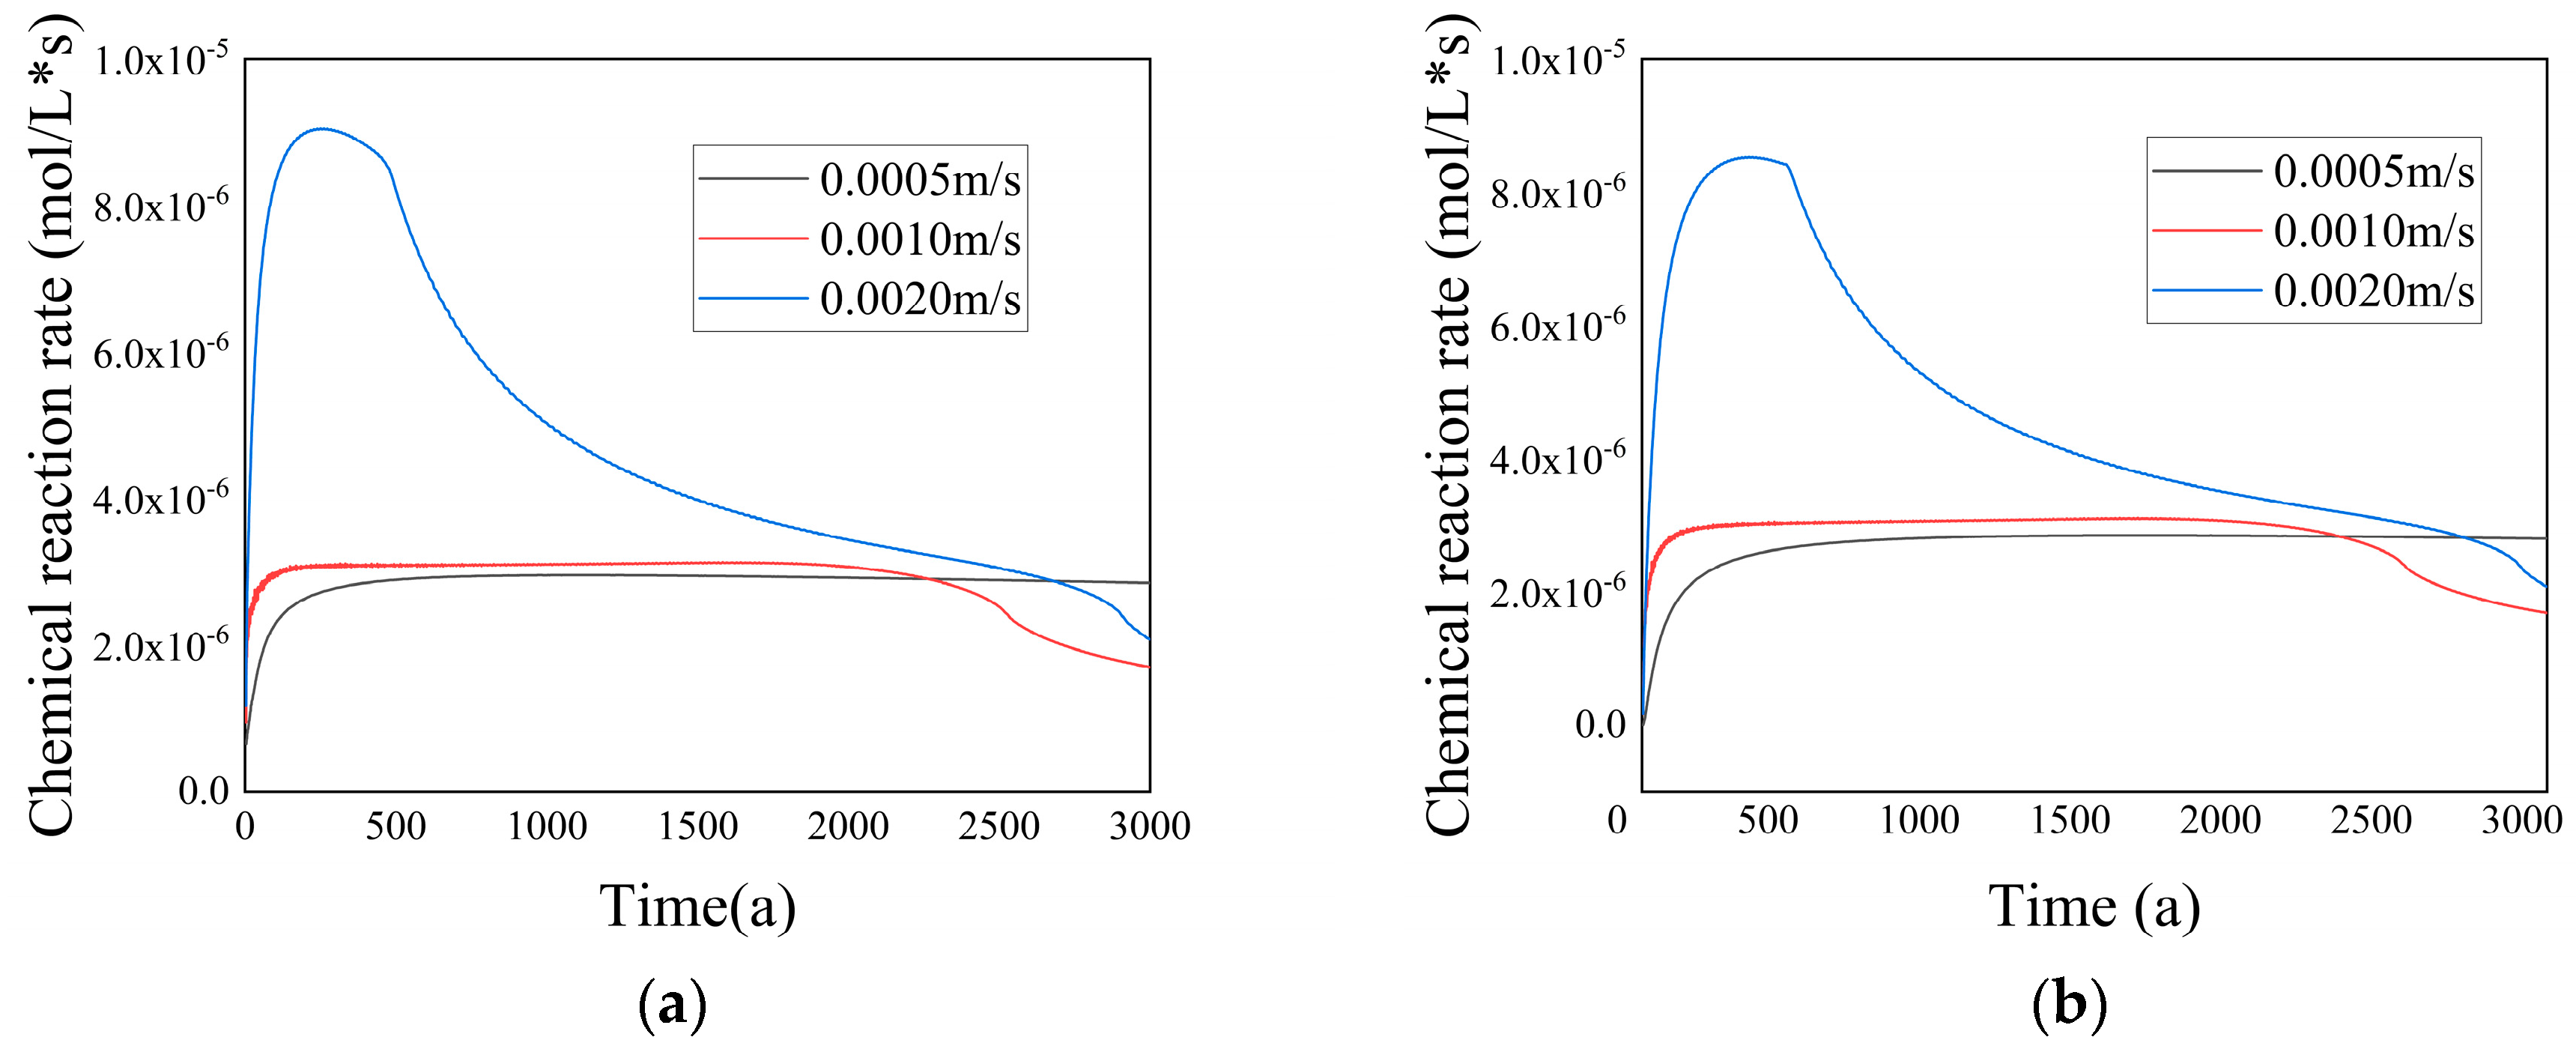
Figure 31 exhibits the temporal evolution of the chemical reaction rate in both the entire computational domain and the porous medium region at various inflow velocities. It can be observed that within a certain velocity range, the chemical reaction rate increased as the velocity rose. This was because of the elevated inflow velocity, which corresponded to a higher flow rate of low-temperature seawater. Consequently, the ion concentration experienced a rapid surge, resulting in an accelerated chemical reaction rate. The time required for the chemical reaction rate to reach a steady state diminished accordingly. At higher velocities, advection became the dominant transport mechanism in the flow domain, minimizing ion diffusion and causing ions to be carried away before sufficient diffusion could occur. As a result, the chemical reaction became unstable. However, at lower inflow velocities, the chemical reaction rate remained stable for a longer time. In cases of lower inflow velocity, both diffusion and advection significantly influenced the heat transfer and chemical reactions within the flow domain. The reduced inflow velocity limited the transport of ions, resulting in a slower formation rate of
. This led to a more stable flow state and a correspondingly stable chemical reaction rate.
With increasing velocity, the chemical reaction rate approached zero at a faster rate. This was because excessively high inflow velocities gradually formed channels along the central axis, resulting in a higher porosity in the central region and a lower porosity on both sides. The precipitation of predominantly occurred on the sides of the central axis, hindering ion mixing.
Additionally, the graph reveals that for t > 2300 a and t > 2650 a, the chemical reaction rates for the inflow velocity groups of 0.0010 m/s and 0.0020 m/s were lower compared with the inflow velocity group of 0.0005 m/s. This was because the porosity in the porous medium region gradually decreased as the inflow velocity increased. The reduction in porosity hampered the effective mixing of the two ions, resulting in a decrease in the chemical reaction rate.

