Article

Effects of CO2 Geosequestration on Opalinus Clay

1
School of Engineering, Robert Gordon University, Aberdeen AB10 7GJ, UK
2
Department of Petroleum Engineering, Faculty of Engineering, Koya University, Koya KOY45, Kurdistan Region–F.R., Iraq
*
Author to whom correspondence should be addressed.
Energies 2024, 17(10), 2431; https://doi.org/10.3390/en17102431
Submission received: 8 April 2024 / Revised: 14 May 2024 / Accepted: 16 May 2024 / Published: 19 May 2024
(This article belongs to the Section B3: Carbon Emission and Utilization)

Abstract

:
CO2 geosequestration is an important contributor to United Nations Sustainable Development Goal 13, i.e., Climate Action, which states a global Net-Zero CO2 emissions by 2050. A potential impact of CO2 geosequestration in depleted oil and gas reservoirs is the variations in induced pressure across the caprocks, which can lead to significant local variations in CO2 saturation. A detailed understanding of the relationship between the pressure gradient across the caprock and local CO2 concentration is of utmost importance for assessing the potential of CO2 geosequestration. Achieving this through experimental techniques is extremely difficult, and thus, we employ a coupled Computational Fluid Dynamics (CFD) and Finite Element Method (FEM) based solver to mimic sub-critical CO2 injection in Opalinus Clay under various pressure gradients across the sample. The geomechanical and multiphase flow modelling utilising Darcy Law helps evaluate local variations in CO2 concentration in Opalinus Clay. Well-validated numerical results indicate favourable sub-critical CO2 geosequestration under a positive pressure gradient across Opalinus Clay. In the absence of a positive pressure gradient, a peak CO2 concentration of 5% has been recorded, which increases substantially (above 90%) as the pressure gradient across the sample increases.

1. Introduction

Carbon capture and storage (CCS) has become a viable technology in the search for sustainable energy solutions and the reduction of anthropogenic greenhouse gas emissions. The main component of CCS is the injection of CO2 into deep geological formations, where it may be safely stored for geologically long periods. These formations often consist of salty aquifers or depleted oil and gas reservoirs. The behaviour of subsurface formations, particularly the caprock, which serves as a primary seal to inhibit the upward migration of injected CO2, is crucial to the effectiveness and safety of CCS. Shale formations are among the most popular options for caprock materials due to their low permeability and widespread occurrence. However, little is known about the hydromechanical response of shale caprocks to CO2 injection [1]. Shale formations are often chosen as caprocks for CO2 storage reservoirs due to their fine-grained structure and low permeability [2]. To ensure the long-term containment of injected CO2, these caprocks must remain intact. Therefore, it is essential to understand how shale caprocks react to CO2 injection to assess the security and feasibility of CCS operations [3,4]. The hydromechanical response of shale caprocks to CO2 injection involves a complex interplay of fluid flow and geomechanical deformation [5,6]. The injection of CO2 alters the shale’s pore pressure and fluid content, thereby affecting its mechanical characteristics [7]. These interconnected processes have the potential to impact caprock structural integrity and CO2 confinement [8,9].
The hydromechanical reaction of shale caprocks to CO2 injection can effectively be modelled and analysed using numerical methods [10]. Finite Element Method (FEM) is often employed to evaluate the mechanical integrity of reservoir rocks and caprocks under the stresses induced by CO2 injection [11]. It aids in predicting probable deformation, fractures, and important elements in guaranteeing the long-term containment of CO2. The assessment of CO2 saturation and hydromechanical response has been studied extensively using Computational Fluid Dynamics (CFD) to model fluid flow within reservoirs and surrounding formations, accounting for factors such as porosity, permeability, and fluid properties [12,13]. Moreover, CFD is used for evaluating risks involved with the dispersion of CO2 in the atmosphere as a result of leakage, leading to its high-velocity release [14]. Such studies provide accurate predictions of gas phase transportation and help evaluate the risks involved in CCS projects. In order to describe the complex behaviour of shale caprocks when CO2 is injected into them, the numerical models can accurately predict the multiphase flow mechanisms and complex constitutive linkages [15,16]. While significant progress has been made in the accuracy of numerical predictions, numerous unknowns and challenges persist in predicting the hydromechanical response of shale caprocks to CO2 injection [17,18]. These include validating the numerically predicted results against laboratory and field tests, accurately representing shale variability, understanding fluid-rock interactions, and addressing coupled processes at various spatial and temporal scales.
Apart from validating the numerical models, another important factor is the assessment of CO2 geosequestration in shale caprocks like Opalinus Clay. This requires local measurements of CO2 concentration within the caprock, which is not easily achievable using experimental techniques. Numerical modelling, however, can be used to evaluate local CO2 concentration in caprocks. Resolving this critical issue is crucial for enhancing our understanding of shale caprock behaviour for CO2 storage and improving the predictive capability of numerical models [19]. The design, management, and risk assessment of CCS projects are significantly impacted by these findings, which also influence methods to maintain the integrity and efficacy of CO2 storage in shale formations over the long term [20,21].
Regional pressure variations play a significant role in dictating CO2 geosequestration in geological formations [22,23]. The extent of CO2 geosequestration significantly impacts how much CO2 can be stored in shale caprocks. However, published literature is severely lacking in analysing this important aspect of CO2 geosequestration. Thus, we aim to bridge this gap in scientific knowledge through numerical modelling. A coupled CFD-FEM model utilizing Darcy’s Law is employed to better understand the complex dynamics of local variations in CO2 concentration in shale caprock Opalinus Clay, which is the primary aim of this investigation. It is envisaged that through the results obtained through this investigation, well-informed decisions can be made in future while planning CCS projects and evaluating their technical feasibility and economic viability.

2. CFD-FEM Model

A coupled CFD-FEM model has been utilized to model the complex geomechanical and multiphase flow behaviour of sub-critical CO2 injection in a water-saturated sample of Opalinus Clay. As there are two phases involved in the numerical model, i.e., water and CO2, where CO2 injection leads to water displacement in the sample, their mass balance is modelled as follows:
t φ S β ρ β · ρ β u β Ψ β = 0
where β represents a phase, φ is porosity, S is saturation, ρ is density, u is Darcy velocity, and Ψ is the source term. The Darcy velocity (u) can be expressed as:
u β = k a K r β μ β P β
where ka is absolute permeability, K r is relative permeability, and P is pore pressure. The source term (Ψ) in Equation (1) can be defined as:
Ψ β = ρ β α B ε v o l t
here, α is the Biot coefficient and ε v o l is volumetric strain, which is modelled as:
ε v o l = 1 2 d 2 + d ε i j = 1 2 d i x j + d j x i
where d is the displacement of the sample. The effects of gravity are ignored, and thus, the pressure gradient acts as the only driving force for the transport of CO2 within the sample. The relationship between the Biot coefficient ( α ) in Equation (3) and Biot Modulus (M) is:
1 M = φ K d + α B φ K s
where K d is the drained bulk modulus and K s is the solid bulk modulus. Moreover:
t φ S β ρ β = 1 M S β ρ β p β t
Now, the governing mass conservation equation can be obtained for the fully coupled numerical model as:
φ K d + α B φ K s S β ρ β p β t · k a K r β ρ β μ β P β = ρ β α B ε v o l t
The force equilibrium (or solid deformation) can be represented as:
· σ + ρ β φ + ρ β g = 0
σ = σ α B P β I
where σ and σ are total and effective stress, respectively, and I is the second-order identity tensor. The porosity (φ) is dependent on the elastic modulus (E) as [24]:
l n E E i = d φ i φ
As the caprock sample undergoes compression, the ability of multiphase flow through it changes. Thus, the permeability (k) can be modelled as [25]:
k = k i 1 ± 1 2 9 1 ν 2 2 π Δ σ E 2 1 / 3 2
where k i is the initial matrix permeability. The positive sign refers to dilatational loading, while the negative sign corresponds to compression loading.
The effective viscosity ( μ e f f ) is modelled as:
μ e f f = ρ t o t a l K r w ρ w μ w K r g ρ g μ g
while the total density is represented as:
ρ t o t a l = S w ρ w + S g ρ g
The Brooks and Corey model [26] has been utilized to find out the saturation of each phase in the caprock as:
S g = ( S i g S r g ) ( 1 S r g S r w )
S w = ( S i w S r w ) ( 1 S r g S r w )
where the subscripts i, r, w, g represent initial, residual, water, and gas (CO2), respectively.

3. Methods and Materials

3.1. Opalinus Clay Model and Properties

The Opalinus Clay caprock has been modelled as a 35 mm × 12 mm two-dimensional (2D) rectangular flow domain having a bulk density of 2.75 g/cm3, as considered by Minardi et al. [27]. 2D geometric modelling of Opalinus Clay is appropriate given the expected laminar flow in the domain and the absence of Reynolds stresses. Moreover, 2D modelling significantly reduces the computational cost provided that the model is well-validated against experimental data. The different properties of the Opalinus Clay model are summarized in Table 1.

3.2. Meshing of the Flow Domain

The numerical work builds upon the experimental findings of Minardi et al. [27] and posits that CO2 is injected into the model under different pressure gradients across the Opalinus Clay model. This injection pressure is countered by water pressure acting in the opposite direction to offset the impact of CO2 injection. Thus, CO2 displaces water in the model. To assess CO2 saturation response, the flow domain has been spatially discretised, as illustrated in Figure 1. The mesh shown here comprises 0.9 × 10⁴ structured elements.
To ensure the numerical predictions are robust and independent of mesh sizing used [10], four additional meshes are generated, comprising 0.5 × 10⁴, 0.6 × 10⁴, 0.75 × 10⁴ and 2 × 10⁴ elements. All the meshes generated are analysed for sample displacement (d), a key parameter later used to validate our numerical model against the experimental data [27]. The results of the mesh independence tests are depicted in Figure 2. Notably, as the number of elements increased from 0.5 × 10⁴ to 0.9 × 10⁴, the displacement also increased. However, the difference in displacement between 0.9 × 10⁴ and 2 × 10⁴ elements was negligible. Consequently, the mesh with 0.9 × 10⁴ elements, shown in Figure 1, has been selected for further analysis.

3.3. Scope of Work

As this investigation evaluates the potential of sub-critical CO2 geosequestration in Opalinus Clay, the maximum injection pressure of CO2 is limited to 8 MPa [27]. Extensive numerical investigations have been carried out under two specific conditions, i.e., no pressure gradient across the Opalinus Clay sample and a positive pressure gradient.
P i n P o u t = = 0   no   pressure   gradient   > 0   positive   presure   gradient  
where Pin is CO2 injection pressure (limited to 8 MPa), and Pout is the pressure at the outlet of the model. For no pressure gradient condition, Pin and Pout remain the same, while for positive pressure gradient, Pin > Pout. The complete scope of the work is presented in Table 2.

3.4. Numerical Model Setup

COMSOL Multiphysics 6.1 has been used to analyse two-phase fluid flow in Opalinus Clay, which has been modelled as porous media, incorporating geomechanics. Both the poroelastic module (which couples Darcy’s law with solid mechanics) and multiphase modules (which couples Darcy’s law with phase transportation) are utilized. The numerical model’s execution involves updating porosity values based on generated strain in the caprock following convergence at each time step. An adaptive time-stepping method has been used, which automatically adjusts the actual time step size in order to achieve solver convergence. CO2 injection total time is 48 h and is based on the experimental work of Minardi et al. [27].
The updated porosity values are used to determine spatially varying elastic modulus. The Opalinus Clay model’s permeability is defined as a function of volumetric strain. Updated values are iteratively returned to the property definition after each time step (t + Δt). The PARADISO (Parallel Direct Solver) with a pivoting perturbation of 10−8 is utilized to solve the nonlinear system of equations in conjunction with the Newton nonlinear method.

4. Results and Discussion

This section presents the results obtained from the numerical investigations, highlighting the role of pressure gradient across Opalinus Clay in CO2 geosequestration. The primary multiphase flow parameter that has been analysed is the concentration of CO2 in Opalinus Clay, as it clearly demonstrates the potential of CO2 sequestration in geological formations, which cannot be easily measured through experimental procedures.

4.1. Validation of the Numerical Model

In order to gain confidence in the numerical results obtained, the numerical model has been validated against the experimental data. Minardi et al. [27] experimentally studied the injection of sub-critical CO2 in the Opalinus Clay core sample at different injection and outlet pressures, summarised in Table 3, and measured the core sample’s vertical displacement (d). The scope of work includes the conditions considered by Minardi et al. [27]. It can be clearly seen that the numerically predicted vertical displacement of the Opalinus Clay model matches accurately with experimentally measured vertical displacement of the core sample (maximum difference of 5%), clearly demonstrating the efficacy of the developed numerical model to be used for other pressure gradient conditions summarized in Table 2.

4.2. CO2 Saturation under No Pressure Gradient

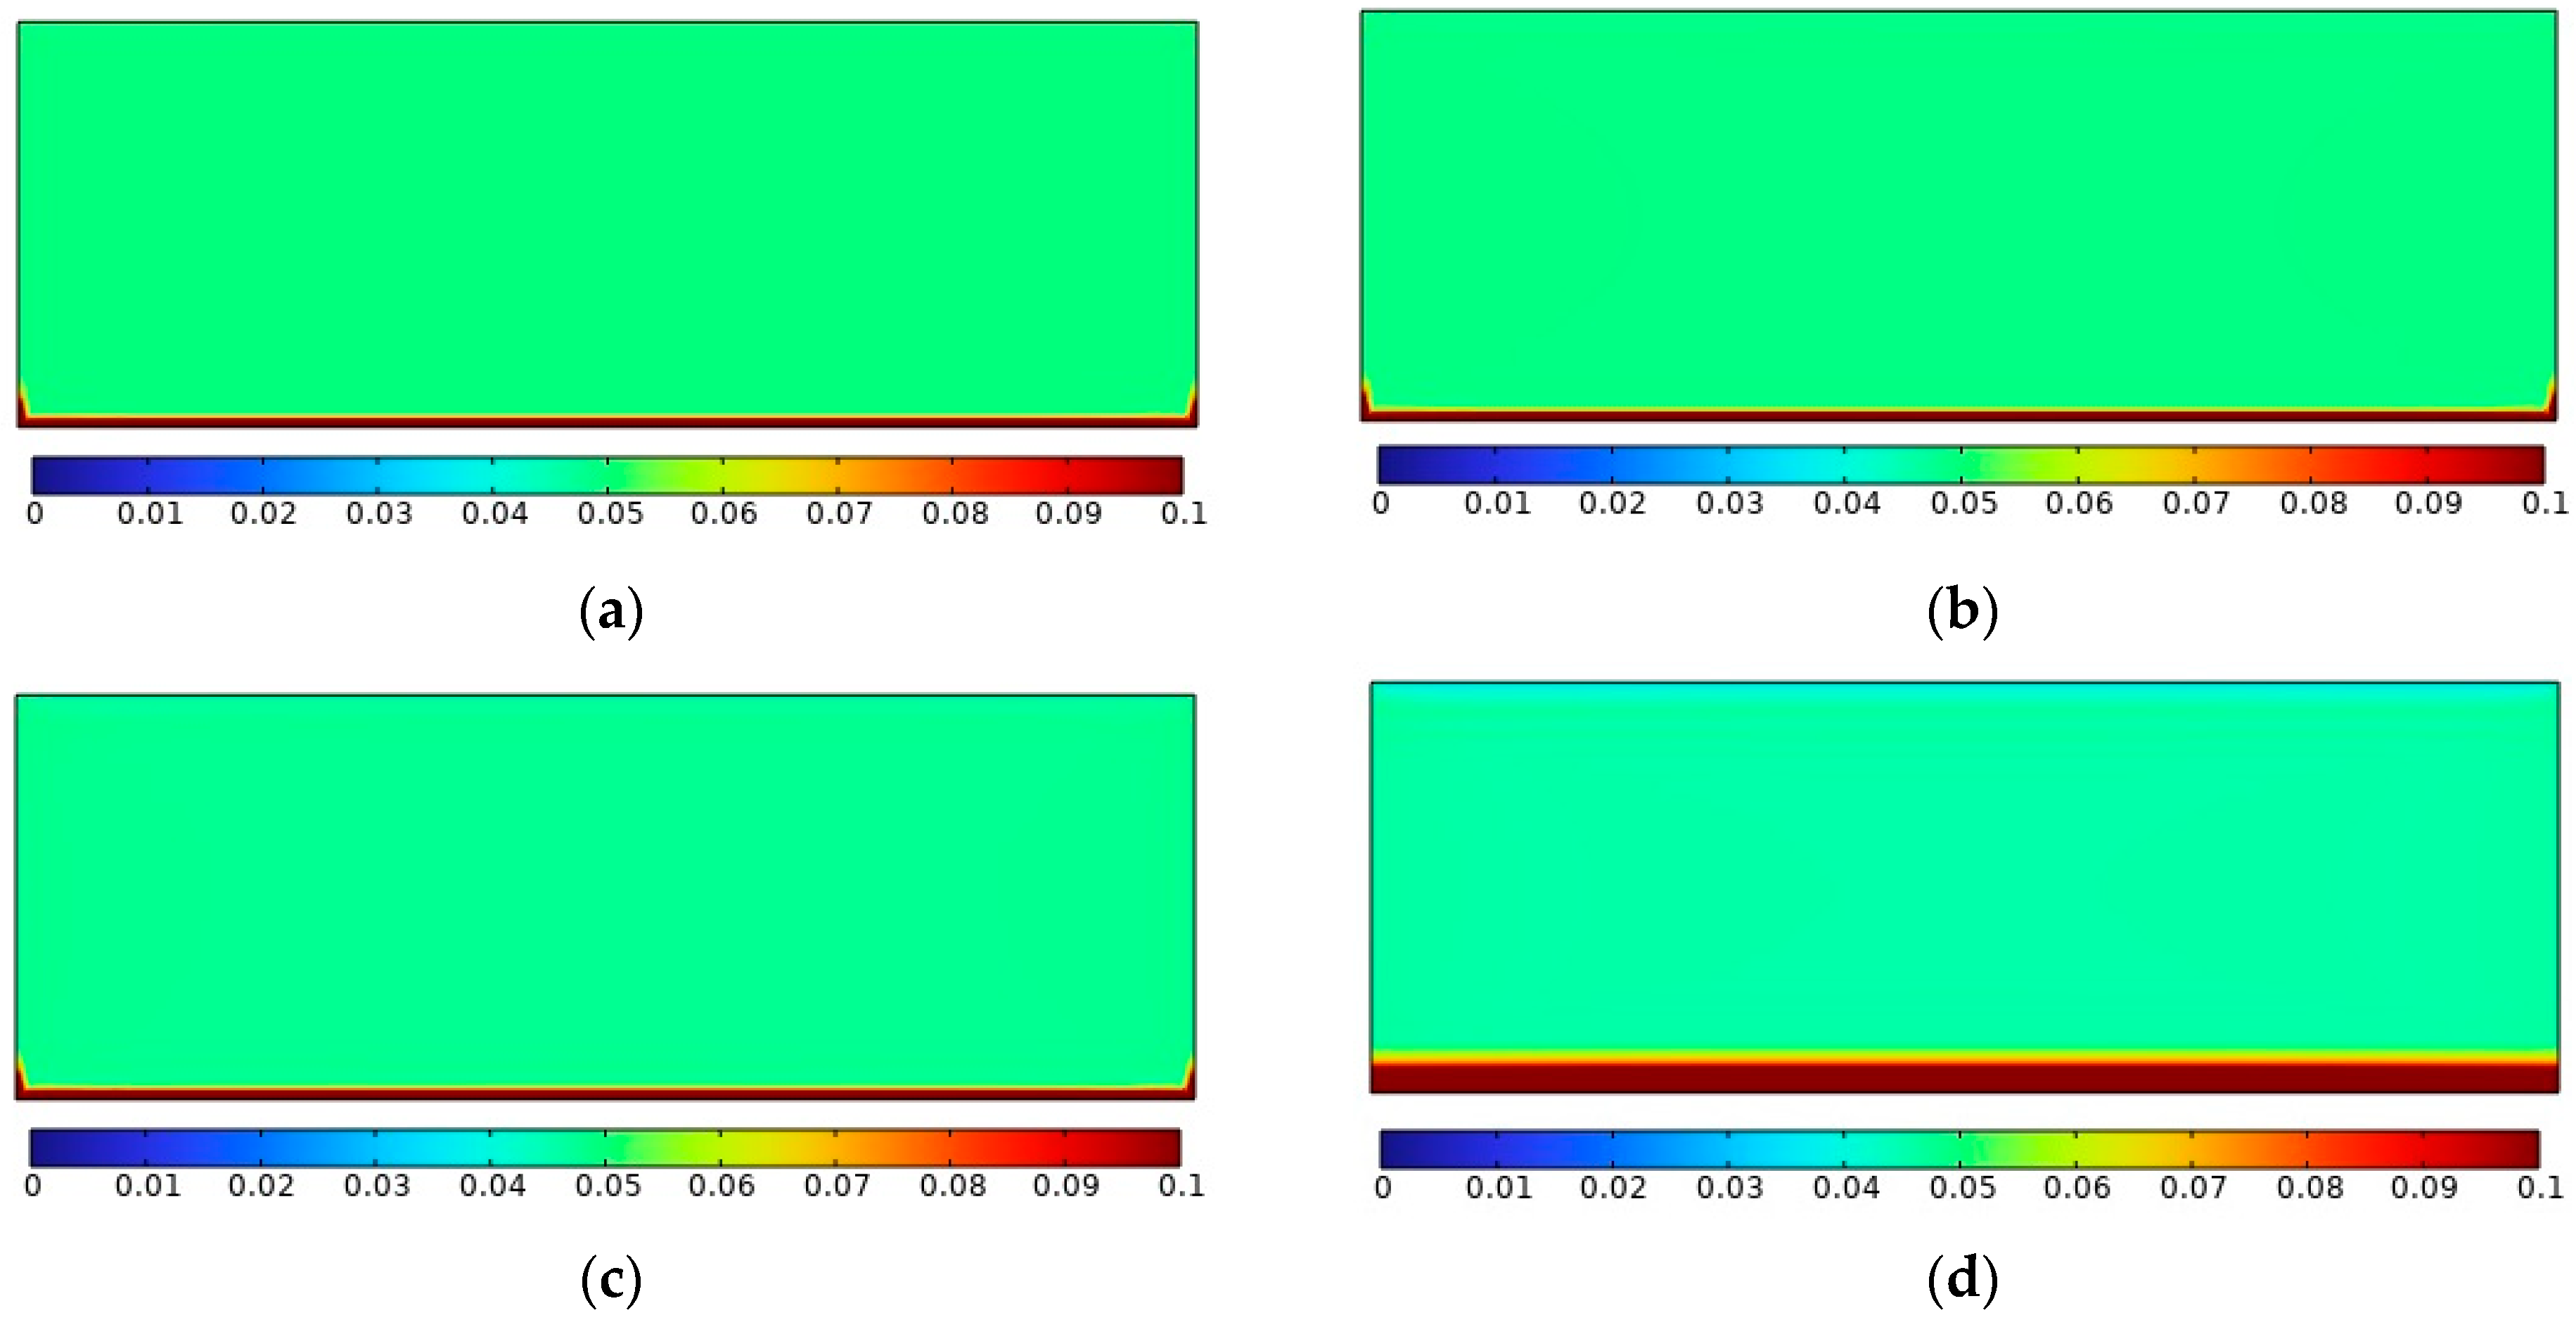
This section provides detailed qualitative and quantitative analyses of the numerical results obtained for no pressure gradient across the Opalinus Clay sample, corresponding to the Pressure Gradient [No] in Table 2. Thus, this section’s CO2 injection and outlet pressures remain the same. Figure 3 depicts CO2 saturation in the Opalinus Clay sample for the different injection pressures considered, i.e., 1 MPa, 2 MPa, 4 MPA, and 8 MPa. It can be clearly seen that as CO2 is injected into the sample, despite no pressure difference between the inlet and outlet boundaries of the sample, CO2 concentration increases in the vicinity of the inlet boundary of Opalinus Clay. Increasing CO2 injection pressure further saturates the clay sample from the inlet boundary side, i.e., CO2 penetrates the inlet boundary further downstream and gets stored in the sample. The scale in Figure 3 has been kept constant (0% to 10% concentration) for the different injection pressure values for effective comparison purposes. Interestingly, even when CO2 injection pressure increases eightfold (between Figure 3a,d), the peak CO2 concentration value doesn’t change noticeably, a phenomenon that needs further investigation.
Figure 4 depicts CO2 concentration profiles in the axial direction of the Opalinus Clay model under no pressure gradient and for different injection pressures considered. The Y-axis shows the length of the sample while the X-axis shows CO2 concentration, the scale of which has been zoomed in to show concentration variations from 4% to 6% only. It can be seen that at a CO2 injection pressure of 1 MPa, its concentration is very high (100%) until y/Y < 0.05. This is potentially due to the boundary condition in the numerical solver. At y/Y = 0.05, a CO2 concentration of 5% has been recorded, which then remains the same throughout the clay sample. Increasing CO2 injection pressure to 2 MPa and 4 MPa decreases CO2 concentration to 4.9% and 4.8%, respectively, throughout the sample; however, no significant change occurs near the inlet boundary, i.e., these concentration values are obtained at y/Y = 0.05. As the injection pressure increases to 8 MPa, which is very close to CO2’s critical pressure, we observe three significant changes. Firstly, at y/Y = 0.05, a CO2 concentration of 12% is recorded, which eventually drops to 5% at y/Y = 0.1. Thus, CO2 is injected deeper into the clay sample at this injection pressure. Secondly, between 0.1 < y/Y < 0.95, a constant CO2 concentration of 4.5% is recorded. When the injection pressure increased from 1 MPa to 2 MPa, this concentration decreased by 2%. When the injection pressure increased from 2 MPa to 4 MPa, this concentration further decreased by 2%. When the injection pressure increased from 4 MPa to 8 MPa (still two folds increase), this concentration decreased by 6.25%. Thus, although near-inlet CO2 concentration has more than doubled, inner sample concentration has decreased.
Lastly, it can be observed that CO2 concentration drastically decreases (to 3.9%) near the outlet boundary of the numerical model. As this has not been observed in the case of injection pressure of 1 MPa, and some minor decrease is observed at 2 MPa and 4 MPa, it is anticipated that this phenomenon is not due to the boundary condition at the outlet boundary of the model, rather seems influenced by the operating pressure of the sample. In conclusion, the potential of sub-critical CO2 geosequestration in Opalinus Clay is severely limited and is not the preferred method.

4.3. CO2 Saturation under Positive Pressure Gradient

This section presents the numerical results obtained under positive pressure gradient conditions when the outlet pressure is kept constant at 0 MPa (gauge). Figure 5 depicts spatial variations in CO2 concentration at different injection pressures considered. The scale of these variations has been fixed to 84% to 100% based on the results obtained. As observed in the case of no pressure gradient cases, CO2 concentration increases from the inlet boundary side; the same is observed in the case of the positive pressure gradient. However, contrary to no pressure gradient, significantly higher CO2 concentration and considerable axial variations are observed. It can be seen in the figure that as the injection pressure increases, and consequently the pressure gradient, CO2 concentration increases significantly in the Opalinus Clay model, clearly demonstrating favourable CO2 sequestration in Opalinus Clay when subjected to the positive pressure gradient. A sudden positive jump in CO2 concentration at the outlet boundary is visible and is attributed to the operating pressure, which needs further analysis.
Figure 6 depicts the axial CO2 concentration profiles in the Opalinus Clay model at different injection pressures while the outlet pressure is kept constant at 0 MPa. At y/Y = 0 (inlet boundary), the concentration of CO2 is 100%, irrespective of the pressure gradient. Moving axially downstream, CO2 concentration drops, but this drop is dependent on the pressure gradient. As the pressure gradient increases, this drop in CO2 concentration also decreases; thus, a higher pressure gradient leads to higher CO2 storage in Opalinus Clay. Contrary to no pressure gradient cases, the axial CO2 concentration profiles do not remain constant till the outlet boundary. Rather, the curves are (somewhat) C-shaped, i.e., CO2 concentration, moving downstream from the inlet boundary, keeps decreasing till y/Y = 0.7 before increasing again till the outlet boundary (i.e., y/Y = 1.0). CO2 concentration recovery of almost 5% is recorded for all the cases under consideration. In conclusion, a higher pressure gradient leads to higher CO2 concentration in Opalinus Clay, facilitating CO2 geosequestration.

4.4. Effects of Outlet Pressure on CO2 Saturation

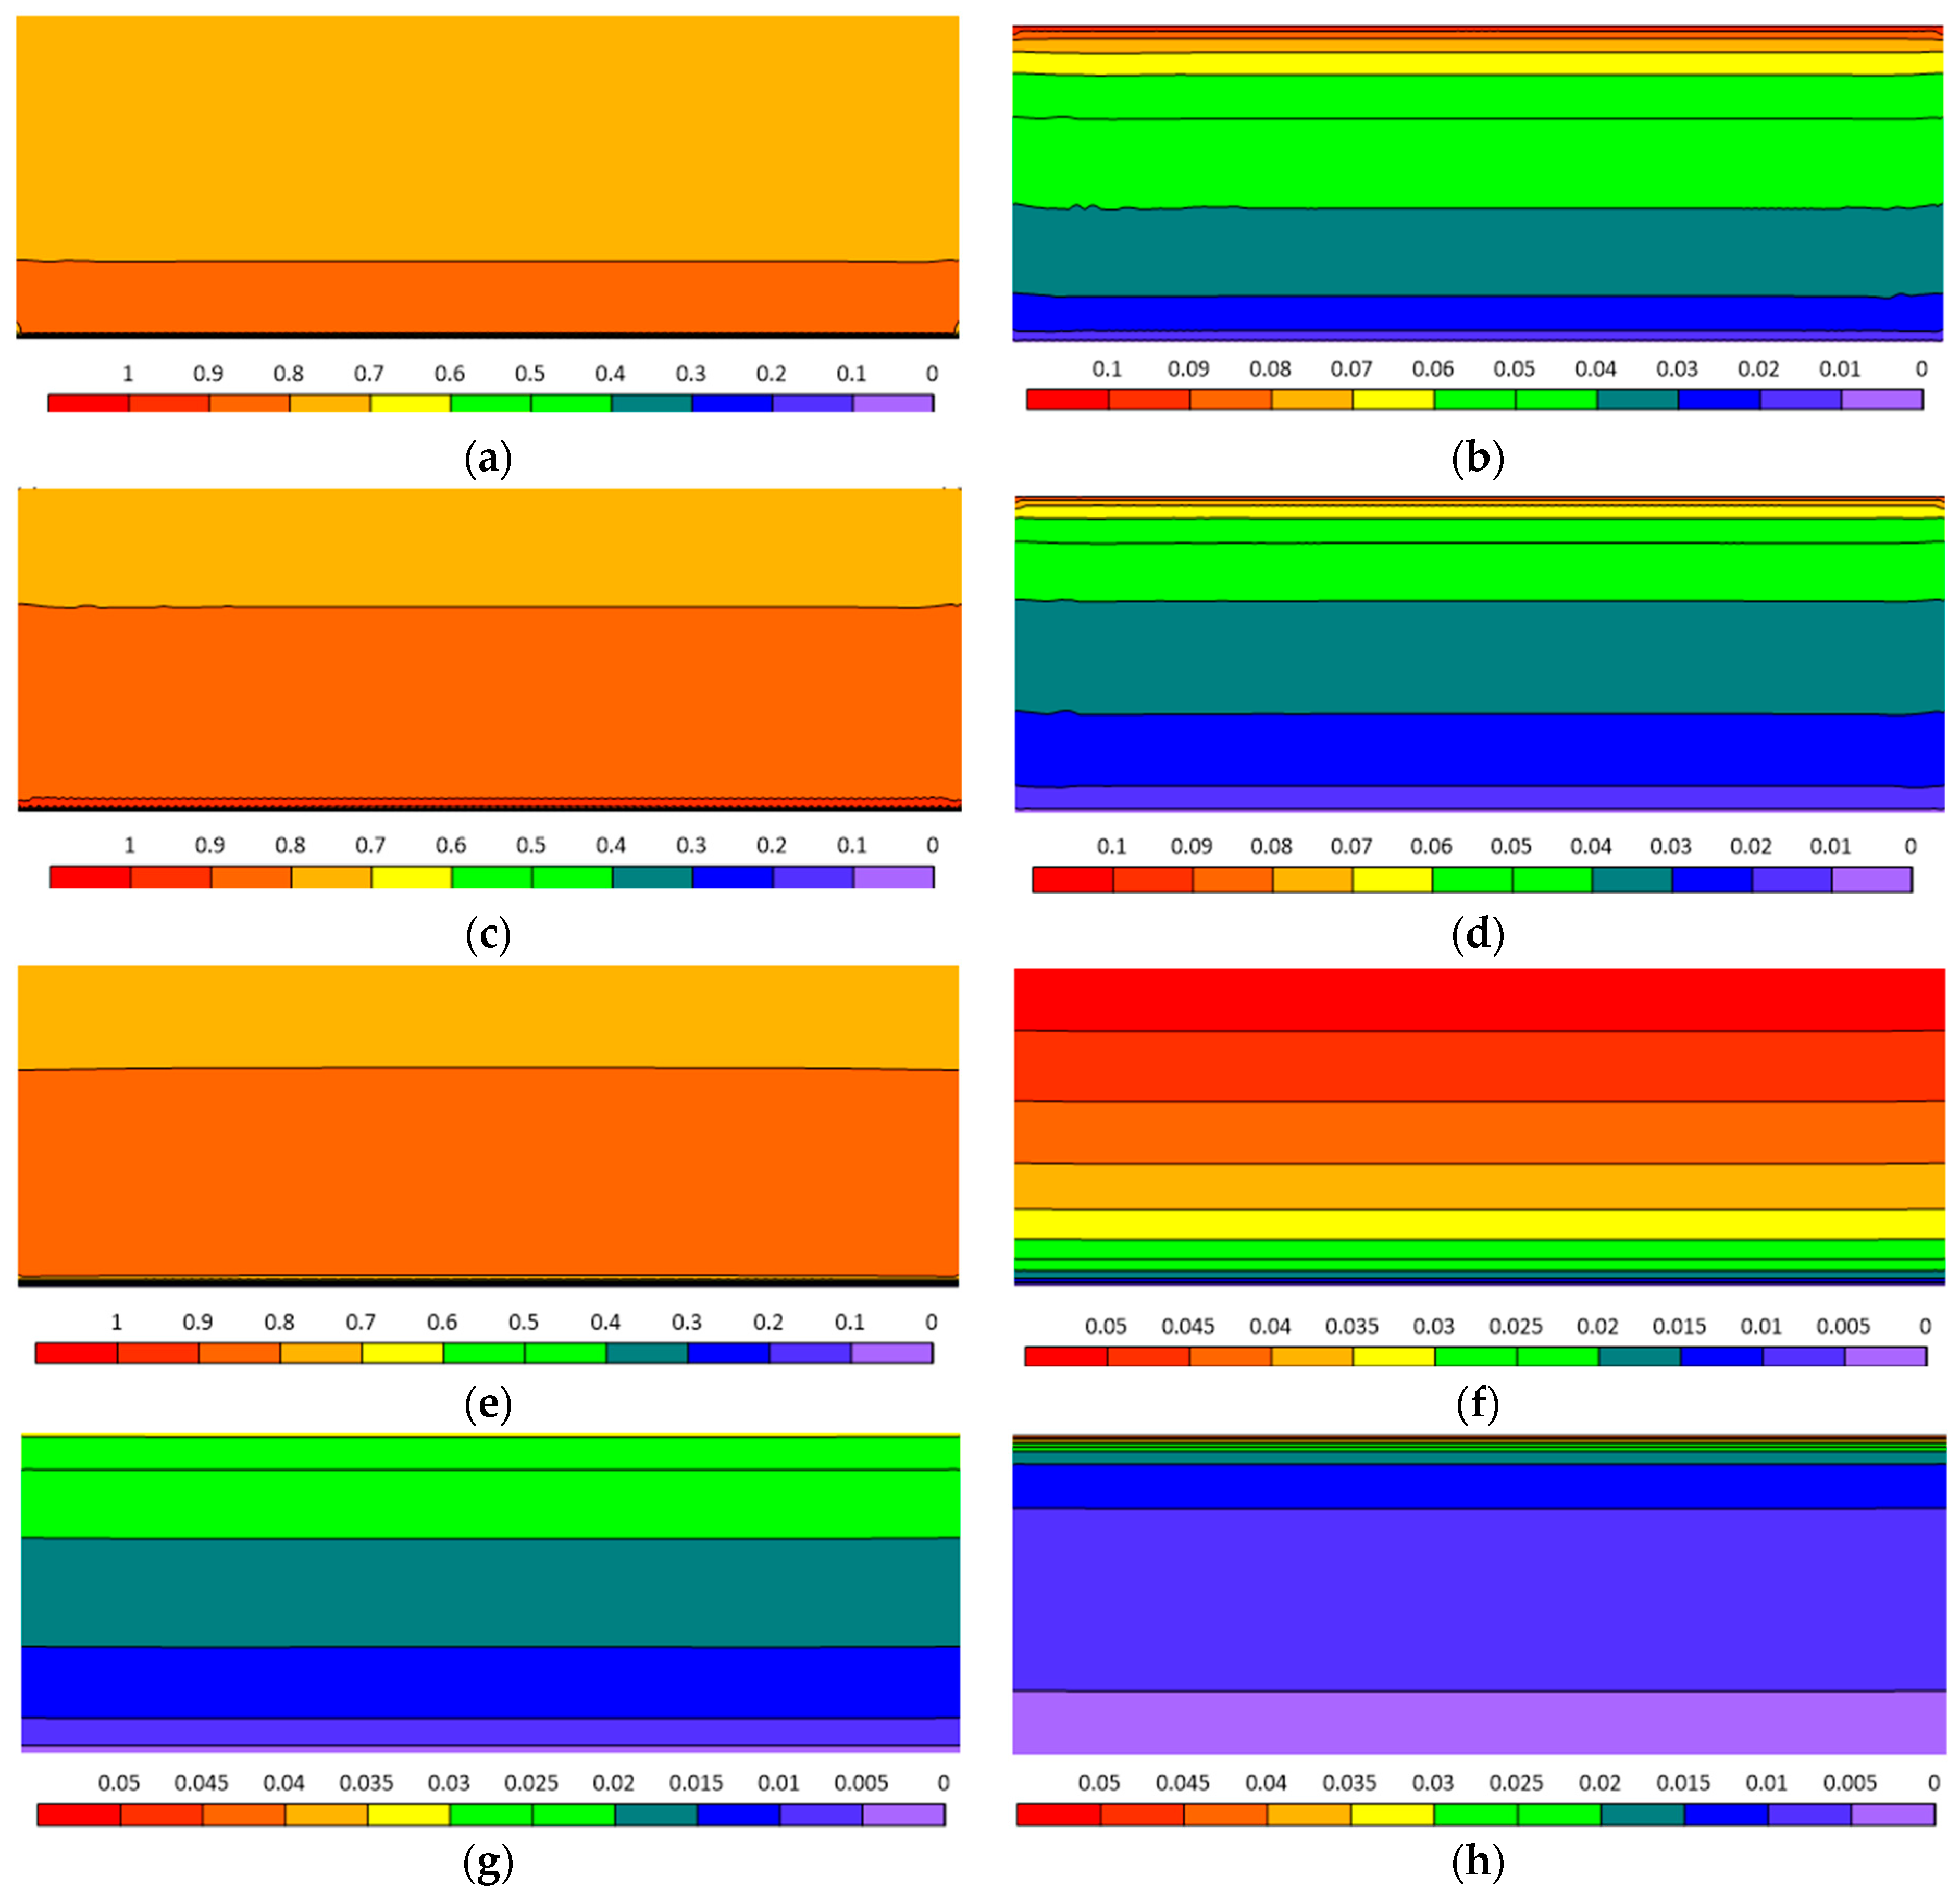
In the previous section, a positive pressure gradient was considered based on increasing injection pressure (Pin), while the outlet pressure (Pout) was kept constant at 0 MPa. In order to understand the impact of outlet pressure on CO2 geosequestration, this section presents detailed analyses of the effects of increasing the outlet pressure on CO2 concentration in the Opalinus Clay model. Figure 7 depicts the difference in CO2 concentration in the Opalinus Clay model with respect to lower pressure gradient/s; thus, Figure 7a is basically the CO2 concentration contour at (Pin = 2; Pout = 1) minus CO2 concentration contour obtained for (Pin = 2; Pout = 2), while Figure 7b corresponds to (Pin = 2; Pout = 0) minus (Pin = 2; Pout = 1). Hence, Figure 7a depicts the difference in CO2 concentration between a low positive pressure gradient and no pressure gradient, while Figure 7b depicts the difference between a high positive pressure gradient and a low positive pressure gradient. Expectedly (from earlier results), as a pressure gradient (of 1 MPa) is introduced across the Opalinus Clay model, CO2 concentration shoots up, and thus we see very large difference values (mostly brown). In comparison, when the pressure gradient rises further by 1 MPa, CO2 concentration increases further; however, the difference is not as high as observed in Figure 7a. This further highlights the impact of pressure gradient on CO2 storage in Opalinus Clay. The same is observed for Pin of 4 MPa however, as the injection pressure doubles, the penetration of CO2 is observed further downstream the inlet boundary (as seen in Figure 7c). Meanwhile, very interestingly, increasing the pressure gradient leads to lesser changes near the inlet boundary. This is because CO2 has already reached a very high concentration level in the near-inlet zone (as depicted in Figure 6), and thus, there is less margin for further enhancing CO2 concentration in the near-inlet region. Following this explanation, it can be seen that in Figure 7e–h, the increase in CO2 concentration slows down till we observe in Figure 7h that the increase in CO2 concentration is only marginal. Thus, we conclude that knowing the injection pressure of CO2 alone is not enough to predict CO2 concentration in Opalinus Clay and that outlet pressure plays a significant role in dictating the extent of CO2 geosequestration.
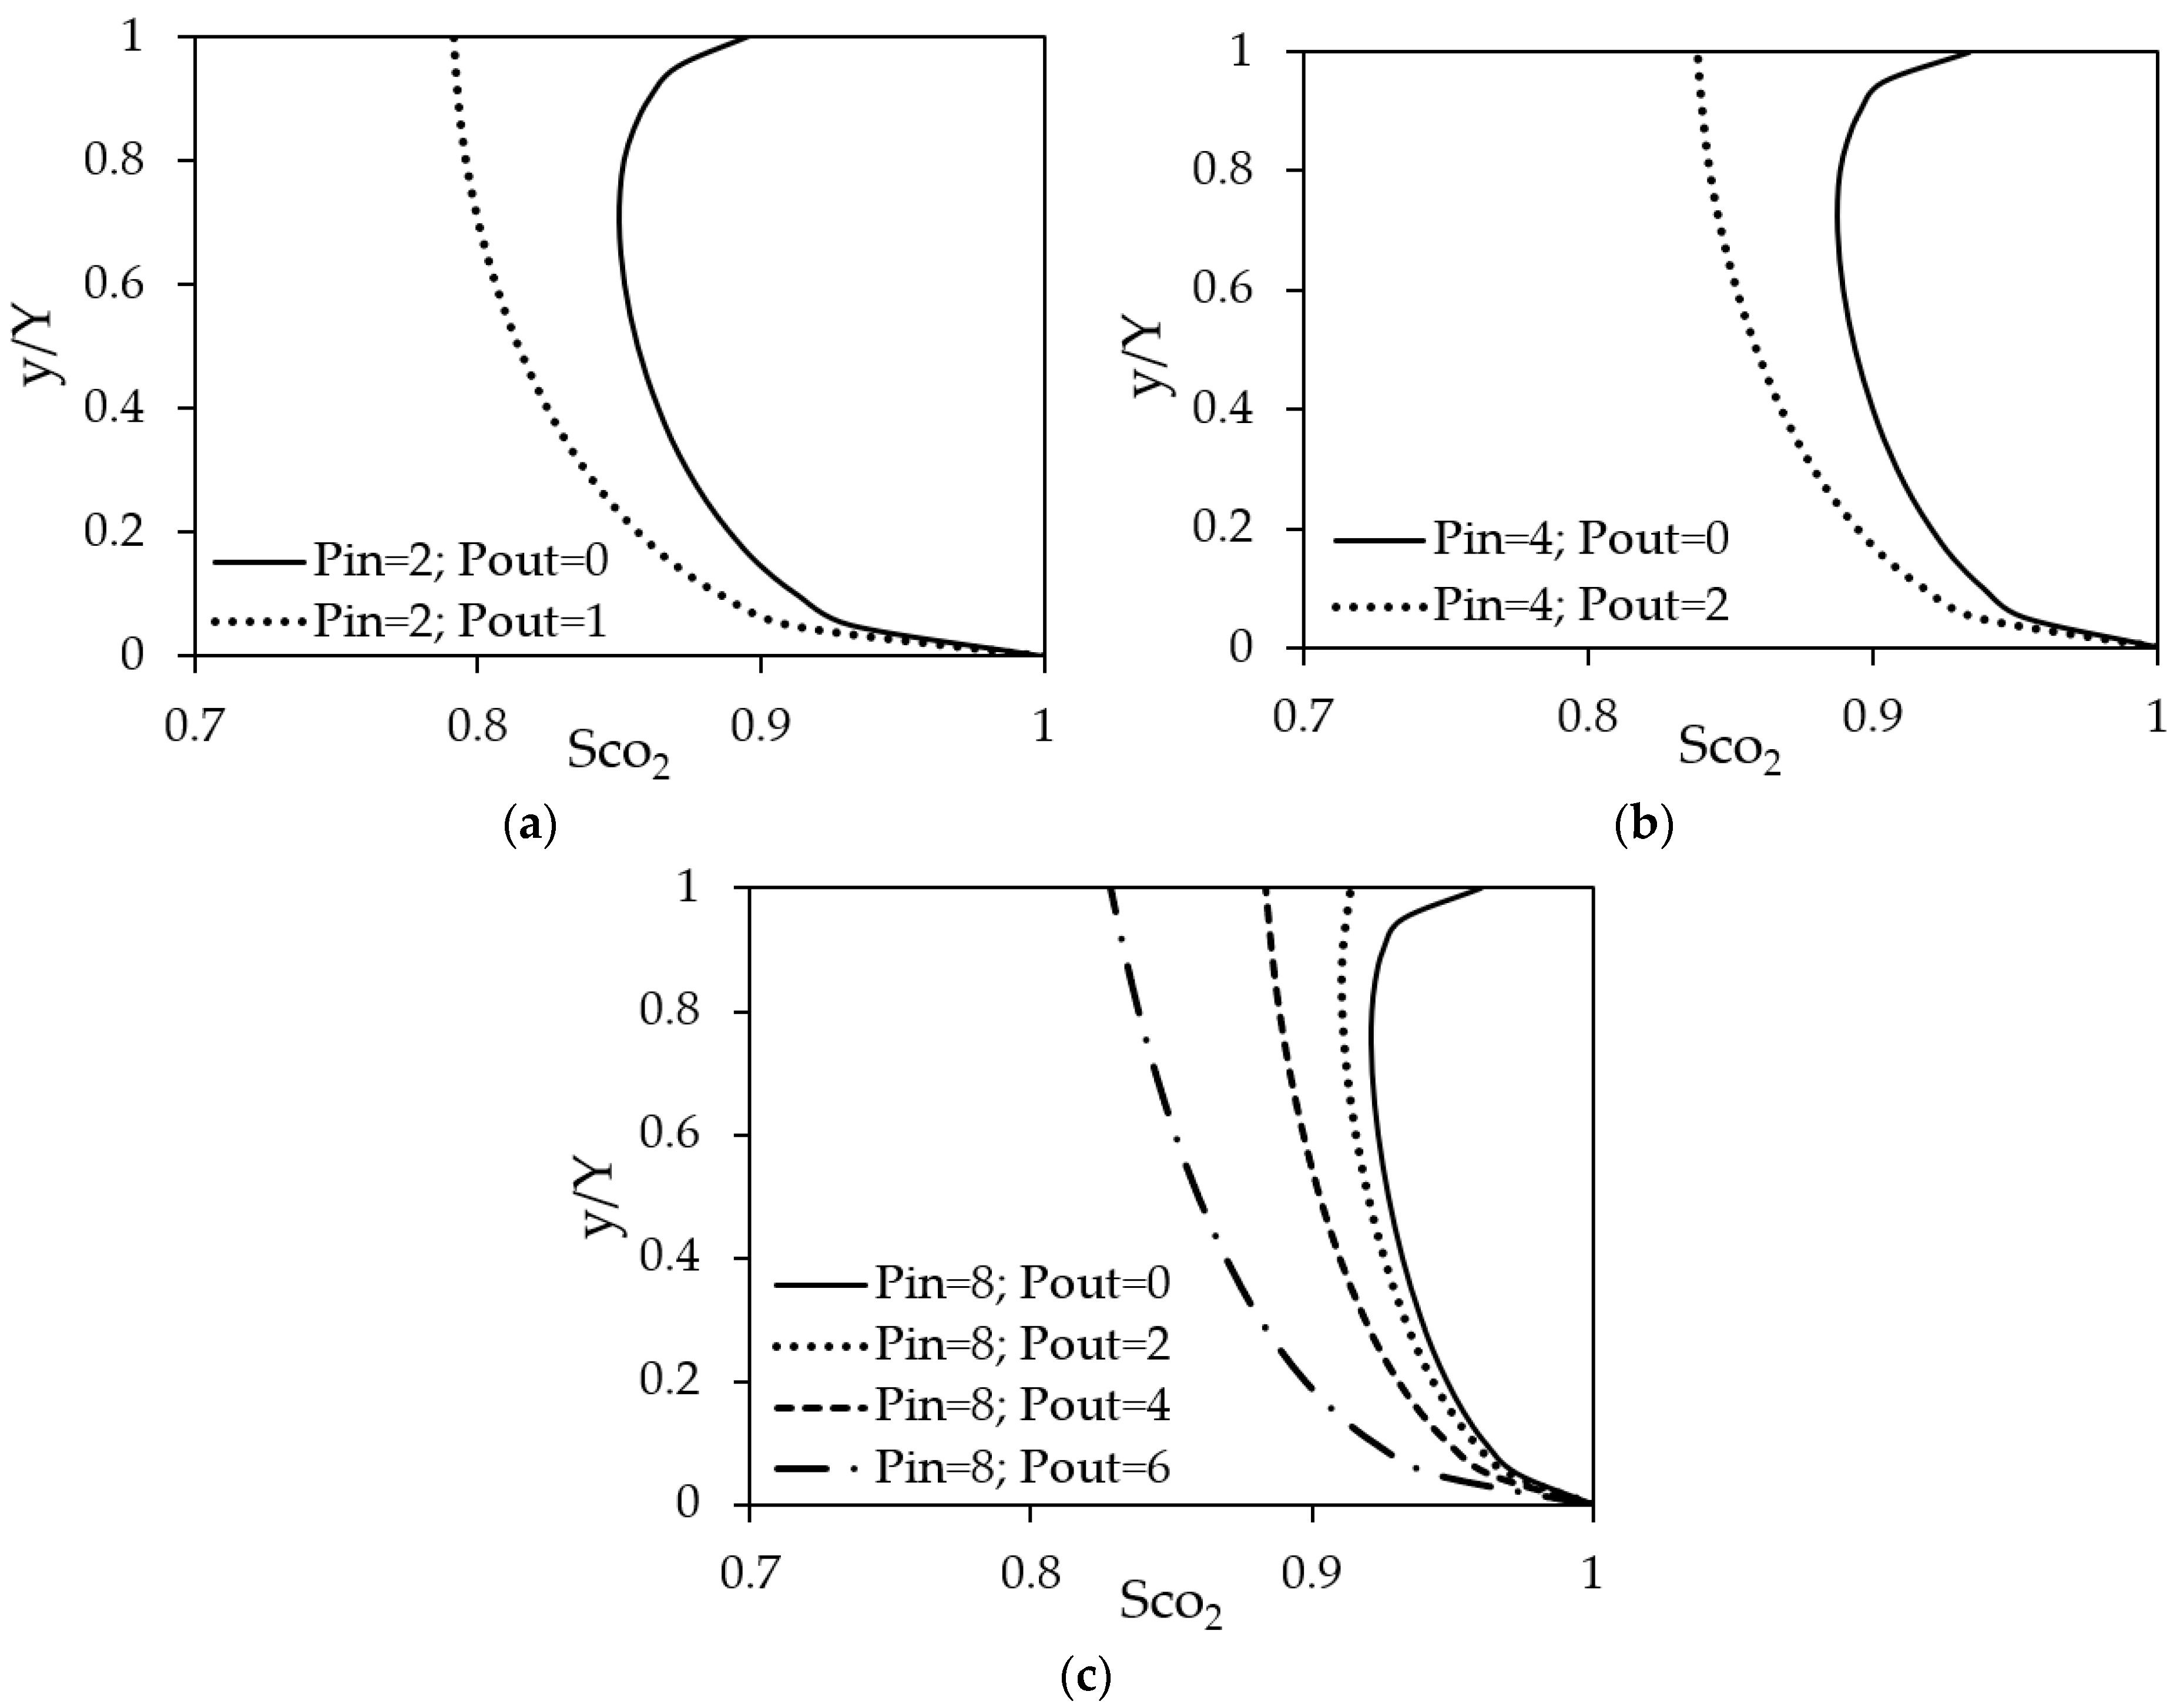
Realising that the aforementioned explanation needs further (quantitative) analyses, CO2 concentration profiles in the axial direction have been drawn in Figure 8 for all the remaining cases from Table 2. It is noteworthy that these profiles do not show differences in CO2 concentration, as was the case in Figure 7. Each graph in the figure is drawn in order to highlight the effect of outlet pressure on CO2 concentration in the Opalinus Clay model. The solid line curves are the same as shown in Figure 6, for injection pressures of 2 MPa, 4 MPa, and 8 MPa. It can be seen in Figure 8a that increasing the outlet pressure to 1 MPa, which consequently results in a lower pressure gradient, leads to significantly lower CO2 concentration in Opalinus Clay. While in the case of a 2 MPa pressure gradient, the lowest CO2 concentration recorded was 85% at y = Y = 0.7, in the case of a 1 MPa pressure gradient, the lowest CO2 concentration of 79% is observed at the outlet boundary. It is also noteworthy that with a reduced pressure gradient, the curve does not resemble the C-shape anymore; rather, a gradual decrease in CO2 concentration is observed from y = Y = 0.05 to 1. The same trends are observed at injection pressures of 4 MPa and 8 MPa.

5. Conclusions

The pressure gradient across caprocks plays an important role in CO2 geosequestration. Numerical investigations have been carried out to evaluate the role of CO2 injection pressure and the core (downstream) pressure towards local CO2 concentration in the Opalinus Clay model. A coupled geomechanical and multiphase flow model based on CFD-FEM coupling, has been employed to gauge the complex nature of this phenomena. Detailed investigations and extensive quantitative analyses have revealed a number of interesting facts. Based on the results obtained, we conclude the following:
  • Sub-critical CO2 injection in Opalinus Clay for geosequestration is possible under the right conditions.
  • Sub-critical CO2 injection in Opalinus Clay under no pressure gradient leads to very low CO2 concentration (maximum 5%).
  • An increase in pressure gradient leads to higher CO2 concentration in Opalinus Clay.
  • An increase in outlet pressure results in lower CO2 concentration in the model.
  • For optimal sub-critical CO2 geosequestration in Opalinus Clay, the injection pressure should be 8 MPa, and the outlet pressure should be minimum, ideally close to 0 MPa.
It is envisaged that the results of this study will aid in deciding the appropriateness of the geological formation for CCS projects, leading towards their technical feasibility and economic viability.

Author Contributions

H.K.H. contributed to conceptualization, data preparation, simulation, technical testing, writing, and interpretation. T.A., identified as the corresponding author, played a key role in the conceptualization, review, editing, feedback, supervision, model accuracy assessments, and writing. All authors have read and agreed to the published version of the manuscript.

Funding

The research received no external funding.

Data Availability Statement

Data is contained within the article.

Conflicts of Interest

The authors declare no conflicts of interest.

References

  1. Rigby, S.P.; Alsayah, A.; Seely, R. Impact of Exposure to Supercritical Carbon Dioxide on Reservoir Caprocks and Inter-Layers during Sequestration. Energies 2022, 15, 7538. [Google Scholar] [CrossRef]
  2. Allen, M.J.; Faulkner, D.R.; Worden, R.H.; Rice-Birchall, E.; Katirtsidis, N.; Utley, J.E.P. Geomechanical and petrographic assessment of a CO2 storage site: Application to the Acorn CO2 Storage Site, offshore United Kingdom. Int. J. Greenh. Gas Control 2020, 94, 102923. [Google Scholar] [CrossRef]
  3. Raza, A.; Gholami, R.; Rezaee, R.; Rasouli, V.; Rabiei, M. Significant aspects of carbon capture and storage—A review. Petroleum 2019, 5, 335–340. [Google Scholar] [CrossRef]
  4. Hawez, H.K.; Asim, T. Impact of Regional Pressure Dissipation on Carbon Capture and Storage Projects: A Comprehensive Review. Energies 2024, 17, 1889. [Google Scholar] [CrossRef]
  5. Kim, S.; Hosseini, S.A. Study on the ratio of pore-pressure/stress changes during fluid injection and its implications for CO2 geologic storage. J. Pet. Sci. Eng. 2017, 149, 138–150. [Google Scholar] [CrossRef]
  6. Rahman, M.J.; Fawad, M.; Mondol, N.H. 3D Field-Scale Geomechanical Modeling of Potential CO2 Storage Site Smeaheia, Offshore Norway. Energies 2022, 15, 1407. [Google Scholar] [CrossRef]
  7. Favero, V.; Laloui, L. Impact of CO2 injection on the hydro-mechanical behaviour of a clay-rich caprock. Int. J. Greenh. Gas Control 2018, 71, 133–141. [Google Scholar] [CrossRef]
  8. Song, Y.; Jun, S.; Na, Y.; Kim, K.; Jang, Y.; Wang, J. Geomechanical challenges during geological CO2 storage: A review. Chem. Eng. J. 2023, 456, 140968. [Google Scholar] [CrossRef]
  9. Hu, Q.; Wang, Q.; Zhang, T.; Zhao, C.; Iltaf, K.H.; Liu, S.; Fukatsu, Y. Petrophysical properties of representative geological rocks encountered in carbon storage and utilization. Energy Rep. 2023, 9, 3661–3682. [Google Scholar] [CrossRef]
  10. Hawez, H.; Sanaee, R.; Faisal, N.H. Multiphase Flow Modelling in Fractured Reservoirs using a Novel Computational Fluid Dynamics Approach. In Proceedings of the 55th US Rock Mechanics/Geomechanics Symposium, Virtual, 18–25 June 2021. [Google Scholar]
  11. Ladubec, C.; Gracie, R.; Craig, J. An extended finite element method model for carbon sequestration. Int. J. Numer. Methods Eng. 2015, 102, 316–331. [Google Scholar] [CrossRef]
  12. Lesueur, M.; Rattez, H.; Zwarts, S.; Hajibeygi, H. Upscaling rocks mechanical properties to study Underground Hydrogen Storage feasibility. Symp. Energy Geotech. 2023, 2023, 2–3. [Google Scholar] [CrossRef]
  13. Ismail, I.; Gaganis, V. Carbon Capture, Utilization, and Storage in Saline Aquifers: Subsurface Policies, Development Plans, Well Control Strategies and Optimization Approaches—A Review. Clean Technol. 2023, 5, 609–637. [Google Scholar] [CrossRef]
  14. Mazzoldi, A.; Hill, T.; Colls, J.J. Assessing the risk for CO2 transportation within CCS projects, CFD modelling. Int. J. Greenh. Gas Control 2011, 5, 816–825. [Google Scholar] [CrossRef]
  15. Liu, X.; Asim, T.; Zhu, G.; Mishra, R. Theoretical and experimental investigations on the combustion characteristics of three components mixed municipal solid waste. Fuel 2020, 267, 117183. [Google Scholar] [CrossRef]
  16. Vafaie, A.; Cama, J.; Soler, J.M.; Kivi, I.R.; Vilarrasa, V. Chemo-hydro-mechanical effects of CO2 injection on reservoir and seal rocks: A review on laboratory experiments. Renew. Sustain. Energy Rev. 2023, 178, 113270. [Google Scholar] [CrossRef]
  17. Singh, D.; Charlton, M.; Asim, T.; Mishra, R.; Townsend, A.; Blunt, L. Quantification of additive manufacturing induced variations in the global and local performance characteristics of a complex multi-stage control valve trim. J. Pet. Sci. Eng. 2020, 190, 107053. [Google Scholar] [CrossRef]
  18. Cappa, F.; Guglielmi, Y.; Nussbaum, C.; De Barros, L.; Birkholzer, J. Fluid migration in low-permeability faults driven by decoupling of fault slip and opening. Nat. Geosci. 2022, 15, 747–751. [Google Scholar] [CrossRef]
  19. Crisci, E.; Ferrari, A.; Giger, S.B.; Laloui, L. Hydro-mechanical behaviour of shallow Opalinus Clay shale. Eng. Geol. 2019, 251, 214–227. [Google Scholar] [CrossRef]
  20. Liu, X.; Zhu, G.; Asim, T.; Zhang, Y.; Mishra, R. The innovative design of air caps for improving the thermal efficiency of CFB boilers. Energy 2021, 221, 119844. [Google Scholar] [CrossRef]
  21. COMSOL. Subsurface Flow Module User Guide, Version 6.0; COMSOL: Burlington, MA, USA, 2022. [Google Scholar]
  22. Chin, L.Y.; Raghavan, R.; Thomas, L.K. Fully Coupled Geomechanics and Fluid-Flow Analysis of Wells With Stress-Dependent Permeability. SPE J. 2000, 5, 32–45. [Google Scholar] [CrossRef]
  23. Winhausen, L.; Khaledi, K.; Jalali, M.; Bretthauer, M.; Amann, F. The Anisotropic Behavior of a Clay Shale: Strength, Hydro-Mechanical Couplings and Failure Processes. J. Geophys. Res. Solid Earth 2023, 128, e2023JB027382. [Google Scholar] [CrossRef]
  24. Sanaee, R.; Oluyemi, G.F.; Hossain, M.; Oyeneyin, M.B. Stress effects on flow partitioning in fractured reservoirs: Equivalent porous media versus poro-elasticity coupled modeling. In Proceedings of the 47th US Rock Mechanics/Geomechanics Symposium, San Francisco, CA, USA, 23–26 June 2013; American Rock Mechanics Association: San Francisco, CA, USA, 2013; Volume 3, pp. 2329–2337. [Google Scholar]
  25. Bai, M.; Elsworth, D. Modeling of subsidence and stress-dependent hydraulic conductivity for intact and fractured porous media. Rock Mech. Rock Eng. 1994, 27, 209–234. [Google Scholar] [CrossRef]
  26. Brooks, R.H.; Corey, A.T. Properties of Porous Media Affecting Fluid Flow. J. Irrig. Drain. Div. 1966, 92, 61–88. [Google Scholar] [CrossRef]
  27. Minardi, A.; Stavropoulou, E.; Kim, T.; Ferrari, A.; Laloui, L. Experimental assessment of the hydro-mechanical behaviour of a shale caprock during CO2 injection. Int. J. Greenh. Gas Control 2021, 106, 103225. [Google Scholar] [CrossRef]
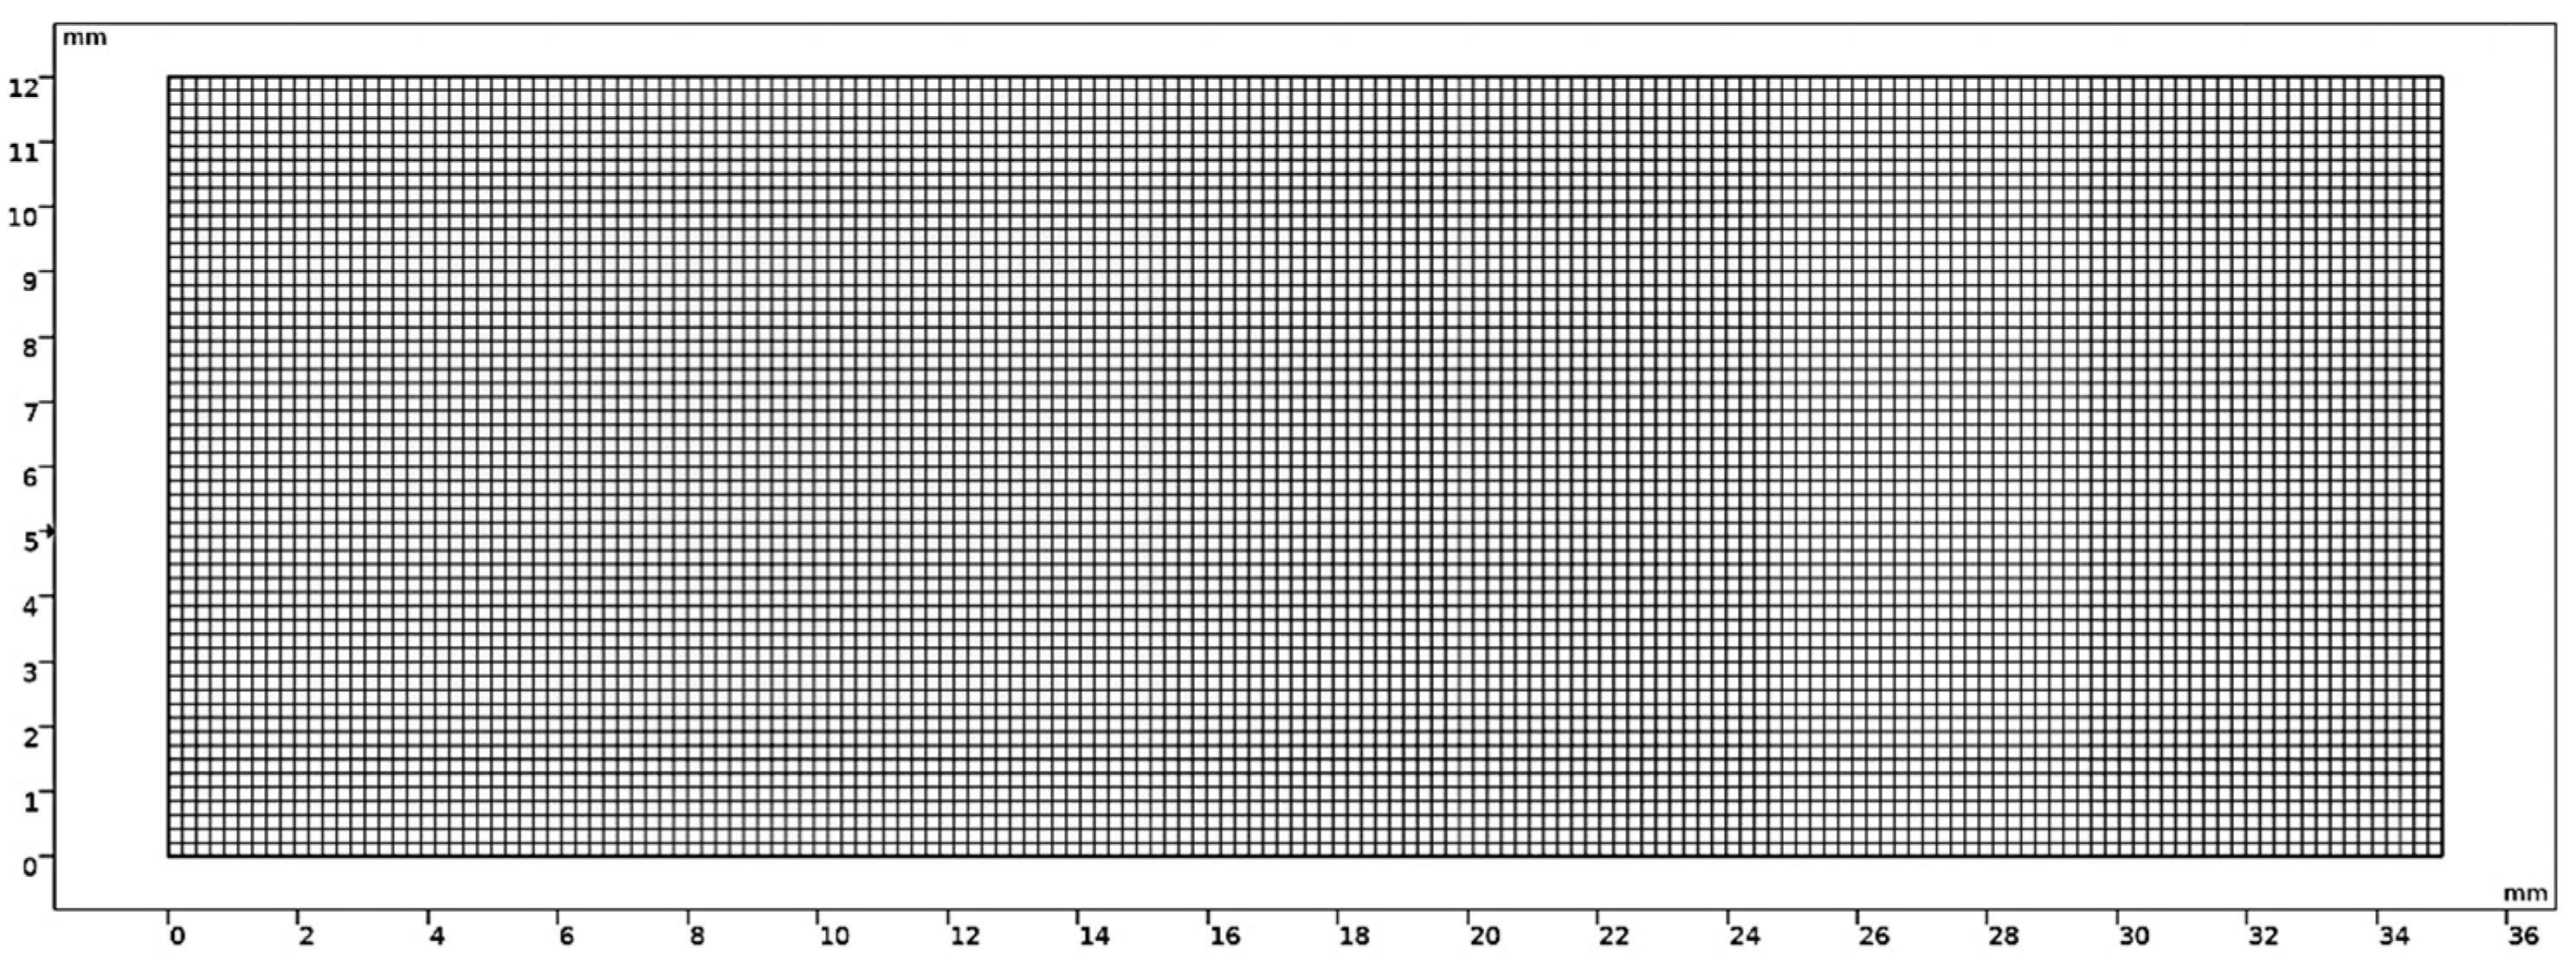
Figure 1. The meshing of the flow domain.
Energies 17 02431 g001
Figure 2. Mesh independence test results.
Energies 17 02431 g002
Figure 3. Spatial variations in CO2 concentration under no pressure gradient and injection pressures of (a) 1 MPa (b) 2 MPa (c) 4 MPa (d) 8 MPa.
Energies 17 02431 g003
Figure 4. CO2 concentration profiles in Opalinus Clay at different injection pressures under no pressure gradient.
Energies 17 02431 g004
Figure 5. Spatial variations in CO2 concentration under positive pressure gradient and injection pressures of (a) 1 MPa; (b) 2 MPa; (c) 4 MPa; (d) 8 MPa.
Energies 17 02431 g005
Figure 6. CO2 concentration profiles in Opalinus Clay at different injection pressures under a positive pressure gradient.
Energies 17 02431 g006
Figure 7. Differences in CO2 concentration between successive levels of pressure gradient. (a) (Pin = 2; Pout = 1) − (Pin = 2; Pout = 2); (b) (Pin = 2; Pout = 0) − (Pin = 2; Pout = 1); (c) (Pin = 4; Pout = 2) − (Pin = 4; Pout = 4); (d) (Pin = 4; Pout = 0) − (Pin = 4; Pout = 2); (e) (Pin = 8; Pout = 6) − (Pin = 8; Pout = 8); (f) (Pin = 8; Pout = 4) − (Pin = 8; Pout = 6; (g) (Pin = 8; Pout = 2) − (Pin = 8; Pout = 4); (h) (Pin = 8; Pout = 0) − (Pin = 8; Pout = 2).
Energies 17 02431 g007
Figure 8. CO2 concentration profiles in Opalinus Clay for different levels of pressure gradients: (a) Pin = 2 MPa; (b) Pin = 4 MPa; (c) Pin = 8 MPa.
Energies 17 02431 g008
Table 1. Properties of Opalinus Clay model [27].
PropertyValue
Initial Porosity0.1 [-]
Initial Permeability2.4 × 10−20 [m2]
Young Modulus6 [GPa]
Poisson ratio0.25 [-]
Initial Pore Pressure1 [atm]
Entry capillary pressure5 [Pa]
Pore size distribution index0.67 [-]
Biot-Willis coefficient0.76 [-]
Table 2. Scope of the numerical modelling.
PinPoutPressure Gradient
(MPa)(MPa)
11No
0Yes
22No
1Yes
0Yes
44No
2Yes
0Yes
88No
6Yes
4Yes
2Yes
0Yes
Table 3. Comparison of numerical and experimental vertical displacement of Opalinus Clay sample.
PinPoutdexperimentaldnumericalDifference
(MPa)(MPa)(mm)(mm)(%)
220.0040.0042+5.0
420.0070.0068+2.8
Disclaimer/Publisher’s Note: The statements, opinions and data contained in all publications are solely those of the individual author(s) and contributor(s) and not of MDPI and/or the editor(s). MDPI and/or the editor(s) disclaim responsibility for any injury to people or property resulting from any ideas, methods, instructions or products referred to in the content.