Article

Energy Management of Hydrogen Hybrid Electric Vehicles—Online-Capable Control

by
David Machacek
1,*,
Nazim Yasar
1,
Fabio Widmer
1,
Thomas Huber
2 and
Christopher Onder
1,*
1
IDSC, ETH Zurich, Sonneggstrasse 3, 8092 Zurich, Switzerland
2
Robert Bosch GmbH, 71701 Schwieberdingen, Germany
*
Authors to whom correspondence should be addressed.
Energies 2024, 17(10), 2369; https://doi.org/10.3390/en17102369
Submission received: 10 April 2024 / Revised: 2 May 2024 / Accepted: 7 May 2024 / Published: 14 May 2024
(This article belongs to the Special Issue Sustainable and Low Carbon Development in the Energy Sector)

Abstract

:
The results shown in this paper extend our research group’s previous work, which presents the theoretically achievable hydrogen engine-out NO x eo (H 2 -NO x eo ) Pareto front of a hydrogen hybrid electric vehicle (H 2 -HEV). While the Pareto front is calculated offline, which requires significant computing power and time, this work presents an online-capable algorithm to tackle the energy management of a H 2 -HEV with explicit consideration of the H 2 -NO x eo trade-off. Through the inclusion of realistic predictive data on the upcoming driving mission, a model predictive control algorithm (MPC) is utilized to effectively tackle the conflicting goal of achieving low hydrogen consumption while simultaneously minimizing NO x eo . In a case study, it is shown that MPC is able to satisfy user-defined NO x eo limits over the course of various driving missions. Moreover, a comparison with the optimal Pareto front highlights MPC’s ability to achieve close-to-optimal fuel performance for any desired cumulated NO x eo target on four realistic routes for passenger cars.

1. Introduction

A major challenge of today’s society is to decrease the worldwide CO 2 emissions, of which a major part stems from the transportation sector. In 2022, it was accountable for almost one-fourth of the global CO 2 emissions [1]. Hence, a major part of global decarbonization politics includes ever more stringent emission legislation in this sector [2,3]. This signifies an extension of technological choices for the light-duty market in the EU. However, currently, the traditional combustion engine is still the predominant propulsion technology. In 2023, the global light-electric-vehicle sales accounted for roughly 16% of new-car sales [4]. Therefore, the need to find alternatives to the conventional combustion engine incentivizes investments into advanced propulsion technologies that can comply with the current tank-to-wheel CO 2 goal and offer the potential for well-to-wheel and life cycle net zero CO 2 emissions.

1.1. Context and Motivation

Hydrogen is the simplest energy carrier for vehicles, produced from electricity generated by renewable power plants [5]. It can be utilized in two ways: First, hydrogen can be used in fuel cells to generate an electric current, which is used to power an electric motor or stored in a battery. Second, hydrogen can be burned in a hydrogen internal combustion engine (H 2 ICE), which directly provides mechanical power. Both technologies have advantages and disadvantages. The fuel cell is known to emit only water and reaches high efficiency [6] but requires a high degree of hydrogen purity [7]. The H 2 ICE can burn hydrogen, even of low purity, but produces NO x emissions in the process. In this text, the focus is put on the H 2 ICE and how to tackle engine-out NO x eo emissions.
Strategies to operate H 2 ICEs with extremely low NO x eo emissions usually rely on ultra-lean hydrogen combustion [8,9], which is achieved by using adequate turbocharging [10,11]. However, ultra-lean combustion limits the achievable power density of H 2 ICEs, thus limiting their applicability in mobile applications. One possible solution for this issue is the use of a secondary torque source, such as an electric motor, to assist the H 2 ICE. The result is a H 2 -HEV with two onboard energy storage devices, i.e., hydrogen and a battery. This also introduces an additional degree of freedom, which is typically managed by an energy management system (EMS) algorithm. In the following, a literature review on such algorithms is provided. Particular emphasis is placed on EMS algorithms that explicitly consider NO x emissions.

1.2. Literature Review

The EMS algorithm is concerned with the distribution of the driver’s power request between the vehicle’s different propulsion components. The presented algorithms can be divided into two categories: offline algorithms, which require a large amount of computational power and are used to evaluate the theoretical potential of a system, and online-capable controllers, which are computationally much leaner and can thus be implemented on a real vehicle. In this text, the focus is placed on online-capable EMS controllers.
The earliest EMS controllers reported in the literature are based on simple heuristics (e.g., [12]). Their main goal is to minimize the vehicle’s fuel consumption. However, the power distribution not only affects fuel consumption but also has a widespread impact on a vehicle’s powertrain components. While more and more control objectives can be incorporated into an appropriately designed EMS, this naturally leads to an increase in complexity. Also, the inclusion of predictive data to plan the vehicle’s battery usage for the upcoming driving mission has been studied [13]. The integration of thermal effects in the power distribution decision process is investigated in [14,15]. The authors of [16] show that in the case of a diesel HEV, the decision of the EMS also has a large influence on its NO x emissions. Compared with HEVs powered by traditional fuels, the literature on EMS algorithms for H 2 -HEVs is scarce, especially with a focus on NO x emissions.
The authors of [17] investigate the NO x emissions resulting from simulations of a parallel H 2 -HEV on the worldwide harmonized light-duty test cycle. However, they lack the use of an advanced EMS control algorithm, as their main focus is the investigation of the propulsion architecture. The only study which discusses the connection between the EMS and the H 2 -NO x eo trade-off of a H 2 -HEV is presented in [18]. Here, a strong emphasis is laid on the potential of H 2 -HEVs to reduce NO x eo emissions via the dedicated use of the system’s degrees of freedom to satisfy the driver’s power request. The discussed degrees of freedom are managed by the EMS and include, among others, the power distribution between the H 2 ICE and the electric motor, and the driving mode. The presented study shows that given an optimal use of the EMS algorithm, reduced NO x eo emissions can only be achieved with an increased amount of H 2 consumption. Such a trade-off is described by using a Pareto curve.
Figure 1 shows a Pareto curve depicting the optimal normalized H 2 -NO x eo trade-off of a mixed H 2 -HEV on a specific driving mission. Each point on this curve represents one optimal EMS calibration. This means that for each point on this curve, accumulated NO x eo emissions cannot be decreased without increasing H 2 consumption, and vice versa. Points above the curve are called Pareto sub-optimal, points below the curve cannot be reached. The H 2 -optimal EMS calibration is depicted by the point farthest to the right on the Pareto curve. The NO x eo -optimal EMS calibration is depicted by the point farthest to the left on the Pareto curve. As the DP algorithm is used, the results represent the global optimum. However, DP cannot be practically implemented on a real vehicle due to its immense requirements for computational power and computation time.
The following three conclusions are drawn in the presented study:
(a) 
The potential for NO x reduction is much larger for H 2 -HEVs than for conventional diesel-powered HEVs, as well as standard H 2 vehicles.
(b) 
Although ultra-lean combustion of hydrogen–air mixtures allows H 2 ICEs to emit near-zero NO x eo emissions, this is a highly delicate process. Small deviations from the chosen operating point of the H 2 ICE can increase the instantaneous NO x eo emissions by over two orders of magnitude.
(c) 
The mixed hybrid drivetrain architecture is required to achieve consistent NO x eo reductions across a wide range of challenging driving missions. However, it is more complex than the standard parallel or series hybrid architectures.
Point (b) suggests the use of an online optimization-based control algorithm to balance the delicate H 2 -NO x eo trade-off. Point (c), however, complicates the use of online optimization-based control algorithms, as the mixed hybrid drivetrain architecture introduces integer control variables, resulting in a mixed-integer optimization problem. Currently, there is no online-capable controller in the literature that achieves similar performance to what is predicted by the offline computed potential analysis presented in [18].

1.3. Research Statement

This paper aims at closing this gap. An MPC algorithm is used for the EMS algorithm, since the incorporation of conflicting control goals, such as the delicate H 2 -NO x eo trade-off, is straightforward in optimization problems. A careful separation of the integer and the continuous control variables allows for the circumvention of solving a mixed-integer optimization problem online. To summarize, the contribution of this publication is twofold:
  • To the authors’ best knowledge, this publication presents the first online-capable EMS controller for a H 2 -HEV, explicitly accounting for the H 2 -NO x eo trade-off.
  • A case study, using the same mixed H 2 -HEV as discussed in [18], allows for a comparison between the proposed online-capable EMS controller and the full theoretically reachable Pareto front obtained by the DP algorithm. The results show that the proposed online-capable controller reaches close-to-optimal performance on all investigated driving missions, covering a broad range of driving scenarios.

1.4. Paper Structure

The remainder of this paper is organized as follows: In Section 2, the investigated mixed H 2 -HEV is introduced. Moreover, a simplified mathematical model, which is later leveraged to formulate an optimization problem suitable for online-capable control, is presented. In Section 3, a method to avoid solving a mixed-integer program is presented. Moreover, a convex optimization problem which can be solved quickly is presented. In Section 4, the proposed EMS controller structure is presented. In Section 5, the EMS algorithm is compared with the DP-optimal solution in a case study encompassing in total four different driving missions. In Section 6, the main contributions are summarized, and an outlook on future research is presented.

2. Modeling

In this section, first, the investigated vehicle is outlined, and a sketch of the EMS optimization problem including NO x eo is presented. Second, a motivation for the MPC-based controller structure is given; this then requires some model simplifications to ensure the online-capable use of the MPC’s optimization problem.

2.1. Map-Based Powertrain Model

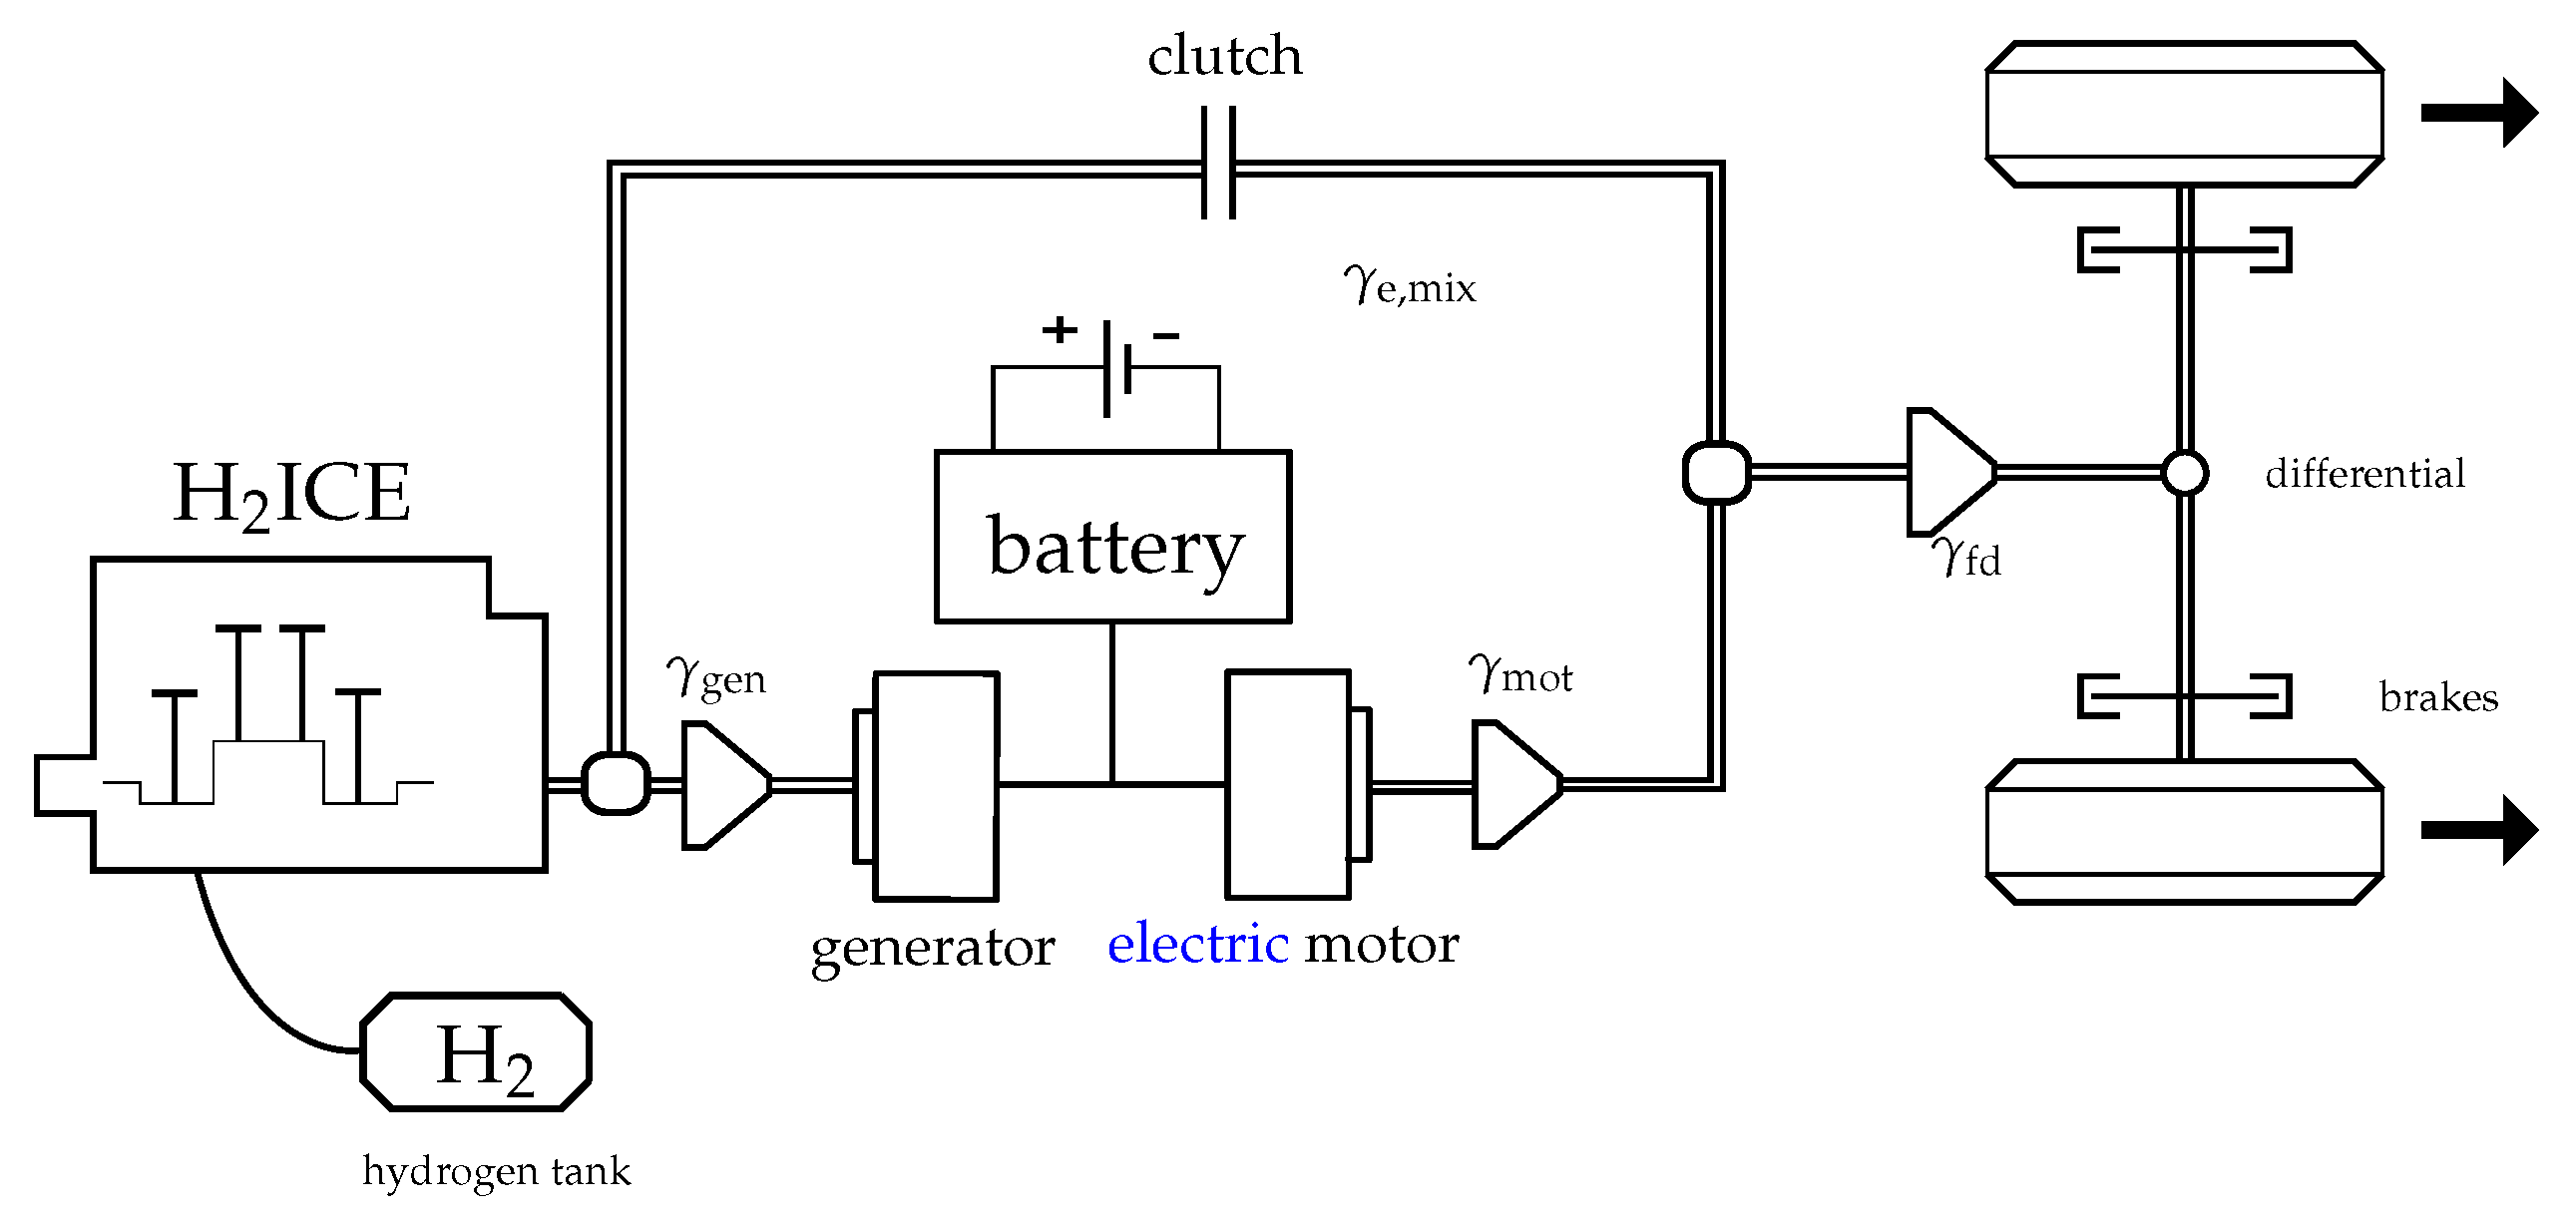
Figure 2 depicts a schematic representation of the vehicle’s powertrain discussed in this text. The component models are characterized by using maps created from testbench measurements, which is why they will be together referred to as the “map-based” model from here on. The maps for the H 2 ICE and the motor and generator are given in the following; however, a detailed description of the map-based model is provided in [18].
m ˙ f map = f ( ω e , T e ) ,
m ˙ NO x map = f ( ω e , T e ) ,
P l mot / gen map = f ( ω m o t / g e n , T m o t / g e n ) .
where ω e denotes the engine speed; T e denotes the engine torque; and ω m o t / g e n and T m o t / g e n denote the speed and torque of the electric motor or the generator, respectively. The battery state of charge is described by the variable SoC and is modeled by using a Thevenin equivalent circuit model.
The vehicle under investigation is a so-called mixed H 2 -HEV. It is equipped with one electric motor; which provides propulsive power and is used for regenerative braking; a H 2 ICE, which is connected to the wheels via a clutch and a fixed transmission ratio; and a generator. The H 2 ICE and the generator together form the engine–generator unit. A mixed hybrid electric vehicle can be operated in three different driving modes, which are introduced in the following.

2.1.1. Driving Modes

The driving modes are denoted by M { 1 , 2 , 3 } in this work and are listed in Table 1. In series mode, the H 2 ICE is operating, but it is mechanically decoupled from the wheels. Any requested power is fully delivered by the electric motor, and the H 2 ICE is only used to generate electric power through the generator. In parallel mode, the H 2 ICE is operating and is mechanically coupled to the wheels. In this mode, both propulsion systems (H 2 ICE and electric motor) can provide power to the wheels. In EV mode, the H 2 ICE is off and mechanically decoupled from the wheels. The entire torque request is met by the electric motor.

2.1.2. Rotational Speeds

Depending on the driving mode, the rotational speeds of the individual powertrain components can be calculated. From the vehicle speed (v) and the wheel radius ( r w ), the wheel speed is calculated as
ω w = v r w .
As the electric motor is always mechanically coupled to the wheels, its speed is directly defined by
ω mot = ω w · γ fd · γ mot ,
where γ fd and γ mot are the fixed gear ratios of the final drive and the electric motor, respectively. Although the engine is not always mechanically coupled to the wheels, it is always mechanically coupled to the generator. Therefore, ω e is defined by the generator speed ( ω gen ):
ω e = ω gen γ gen ,
where γ gen is the fixed gear ratio of the generator.
The generator speed depends on the driving mode. In parallel mode, ω gen is fixed by the vehicle speed. In EV mode, the generator is not used, and its speed is zero. In series mode, the generator is mechanically decoupled from the wheels, but its speed can be chosen freely, as it does not depend on the vehicle speed.
ω gen [ ω gen min , ω gen max ] , if M = 1 , = ω w · γ fd · γ gen , if M = 2 , = 0 , if M = 3 .
where ω gen min and ω gen max represent physical limits imposed by the engine idle speed and the maximum engine speed.

2.1.3. EMS Including NO x eo

By using the map-based model and the description of the rotational speeds, the following sketch of the EMS optimization problem including NO x eo is stated:
min T e , T mot , T gen , ω gen , M t 0 t f m ˙ f map d t
s . t . d SoC d t = f ( SoC , I b )
SoC ( t 0 ) = SoC 0
SoC ( t f ) = SoC 0
d m NO x d t = m ˙ NO x map
m NO x ( t 0 ) = 0
m NO x ( t f ) = m ¯ NO x target
T req GB = T mot GB , if M = 1 , T e GB + T mot GB + T gen GB , if M { 2 , 3 }
T gen GB = T e GB , if M = 1 ,
where I b denotes the electrical current flowing from the battery and the subscript GB denotes the evaluation of the corresponding torques at the level of the gearbox (introduced further down in the text). The goal of this optimization problem is to minimize the cumulated hydrogen consumption over the driving mission, which starts at time instance t 0 and ends at time instance t f . Additionally, a cumulated NO x eo target has to be satisfied at the end of the driving mission. Constraint (8h) ensures that the torque request ( T req ) of the driver must be met by the sum of all the drivetrain’s components. Note that this optimization problem is a multi-objective, nonlinear, mixed-integer program and as such, in general, notoriously hard to solve. One time- and resource-consuming solution approach based on the DP algorithm is presented in [18]. However, the aim of this publication is to derive an online-capable controller, and the DP algorithm cannot be used for energy management due to its low computational efficiency.
One control method which is well known to cope with multi-objective goals and nonlinear system dynamics is based on the model predictive control scheme. Therefore, such a controller architecture is aimed for. However, the technique of model predictive control relies on solving an optimization problem. Therefore, the formulation of a simplified version of the sketch presented in Equation (8), which allows for fast and efficient numerical optimization, is needed. One possible ally is the family of convex optimization problems, as there exist highly efficient solvers to compute their solution quickly. In order to formulate a convex optimization problem, two steps must be taken: First, a simplified model needs to be introduced, which allows for the formulation of a convex optimization problem. Second, the mixed-integer nature of the optimal control problem in Equation (8) needs to be circumvented by dropping the driving mode from the control space.

2.2. Simplified Powertrain Model

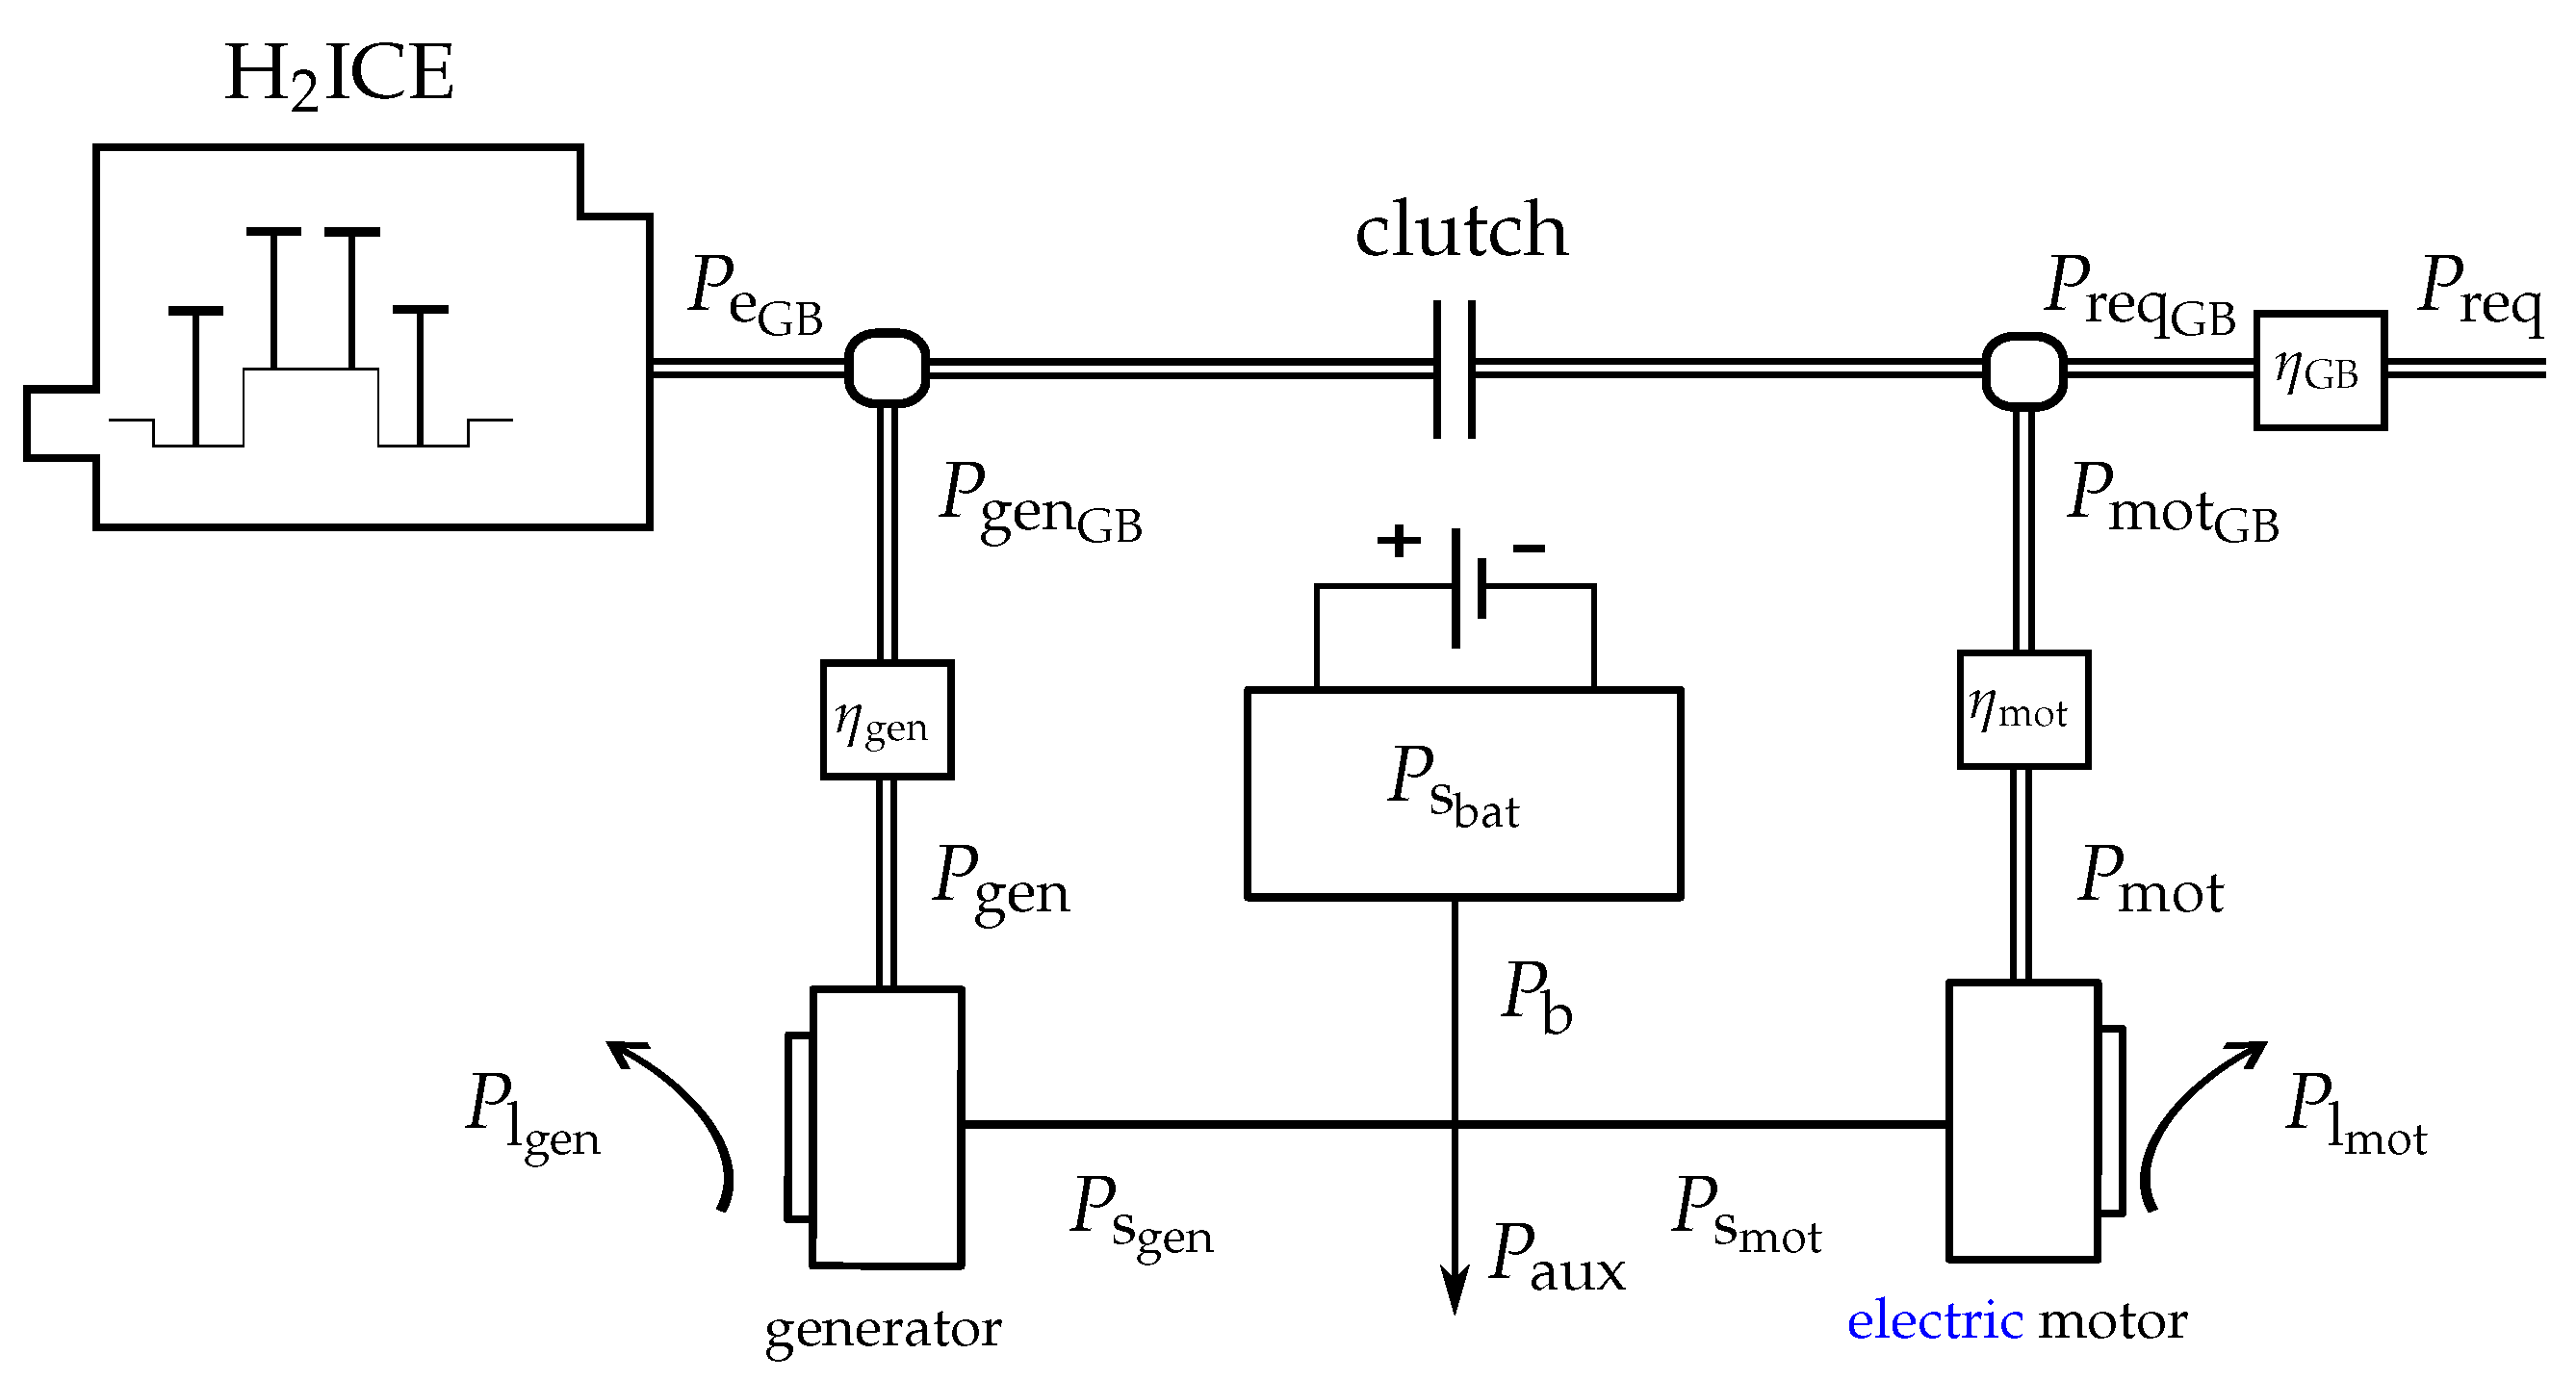
The goal with the simplified model structure is to approximate the map-based model with the use of convex functions. Figure 3 depicts the power flows in the powertrain. The vehicle’s differential and the final drive are lumped together, forming the gearbox, which has constant efficiency ( η GB ). The power request after the gearbox is defined as
P req GB = P req ÷ η GB , if P req 0 P req · η GB , if P req < 0 .
The gearboxes of the electric motor and the generator have constant efficiencies η mot and η gen . Based on these, the electric motor power and the generator power at the gearbox level are calculated as follows:
P mot GB = P mot · η mot , if P mot 0 , P mot ÷ η mot , if P mot < 0 ,
P gen GB = P gen · η gen ,
where P mot and P gen are the motor’s and generator’s mechanical power. The electric motor losses and generator losses are denoted by P l mot and P l gen . The sum of the electrical components’ mechanical power and their losses is referred to as their source power:
P s mot = P mot + P l mot ,
P s gen = P gen + P l gen .
The battery source power ( P s b ) includes the battery losses and is modeled by using a piece-wise quadratic approximation:
P s b = r 1 + · P b + r 2 + · P b 2 , if P b 0 r 1 · P b + r 2 · P b 2 , if P b < 0 .
where the model parameters r 1 + , r 2 + and r 1 , r 2 are used to distinguish between battery charging and discharging losses. The value P b is defined as the summed power, which is required by the electric motor, the generator, and the vehicle’s auxiliaries:
P b = P s mot + P s gen + P aux .
The rest of the simplified model is divided into two different modeling structures, depending on the driving mode. In parallel mode, the powertrain components’ rotational speeds are predefined by the vehicle speed, which means that speed-dependent model parameters can be utilized. In series mode, additional speed-independent model parameters need to be identified for the generator and the H 2 ICE.

2.2.1. Parallel Mode

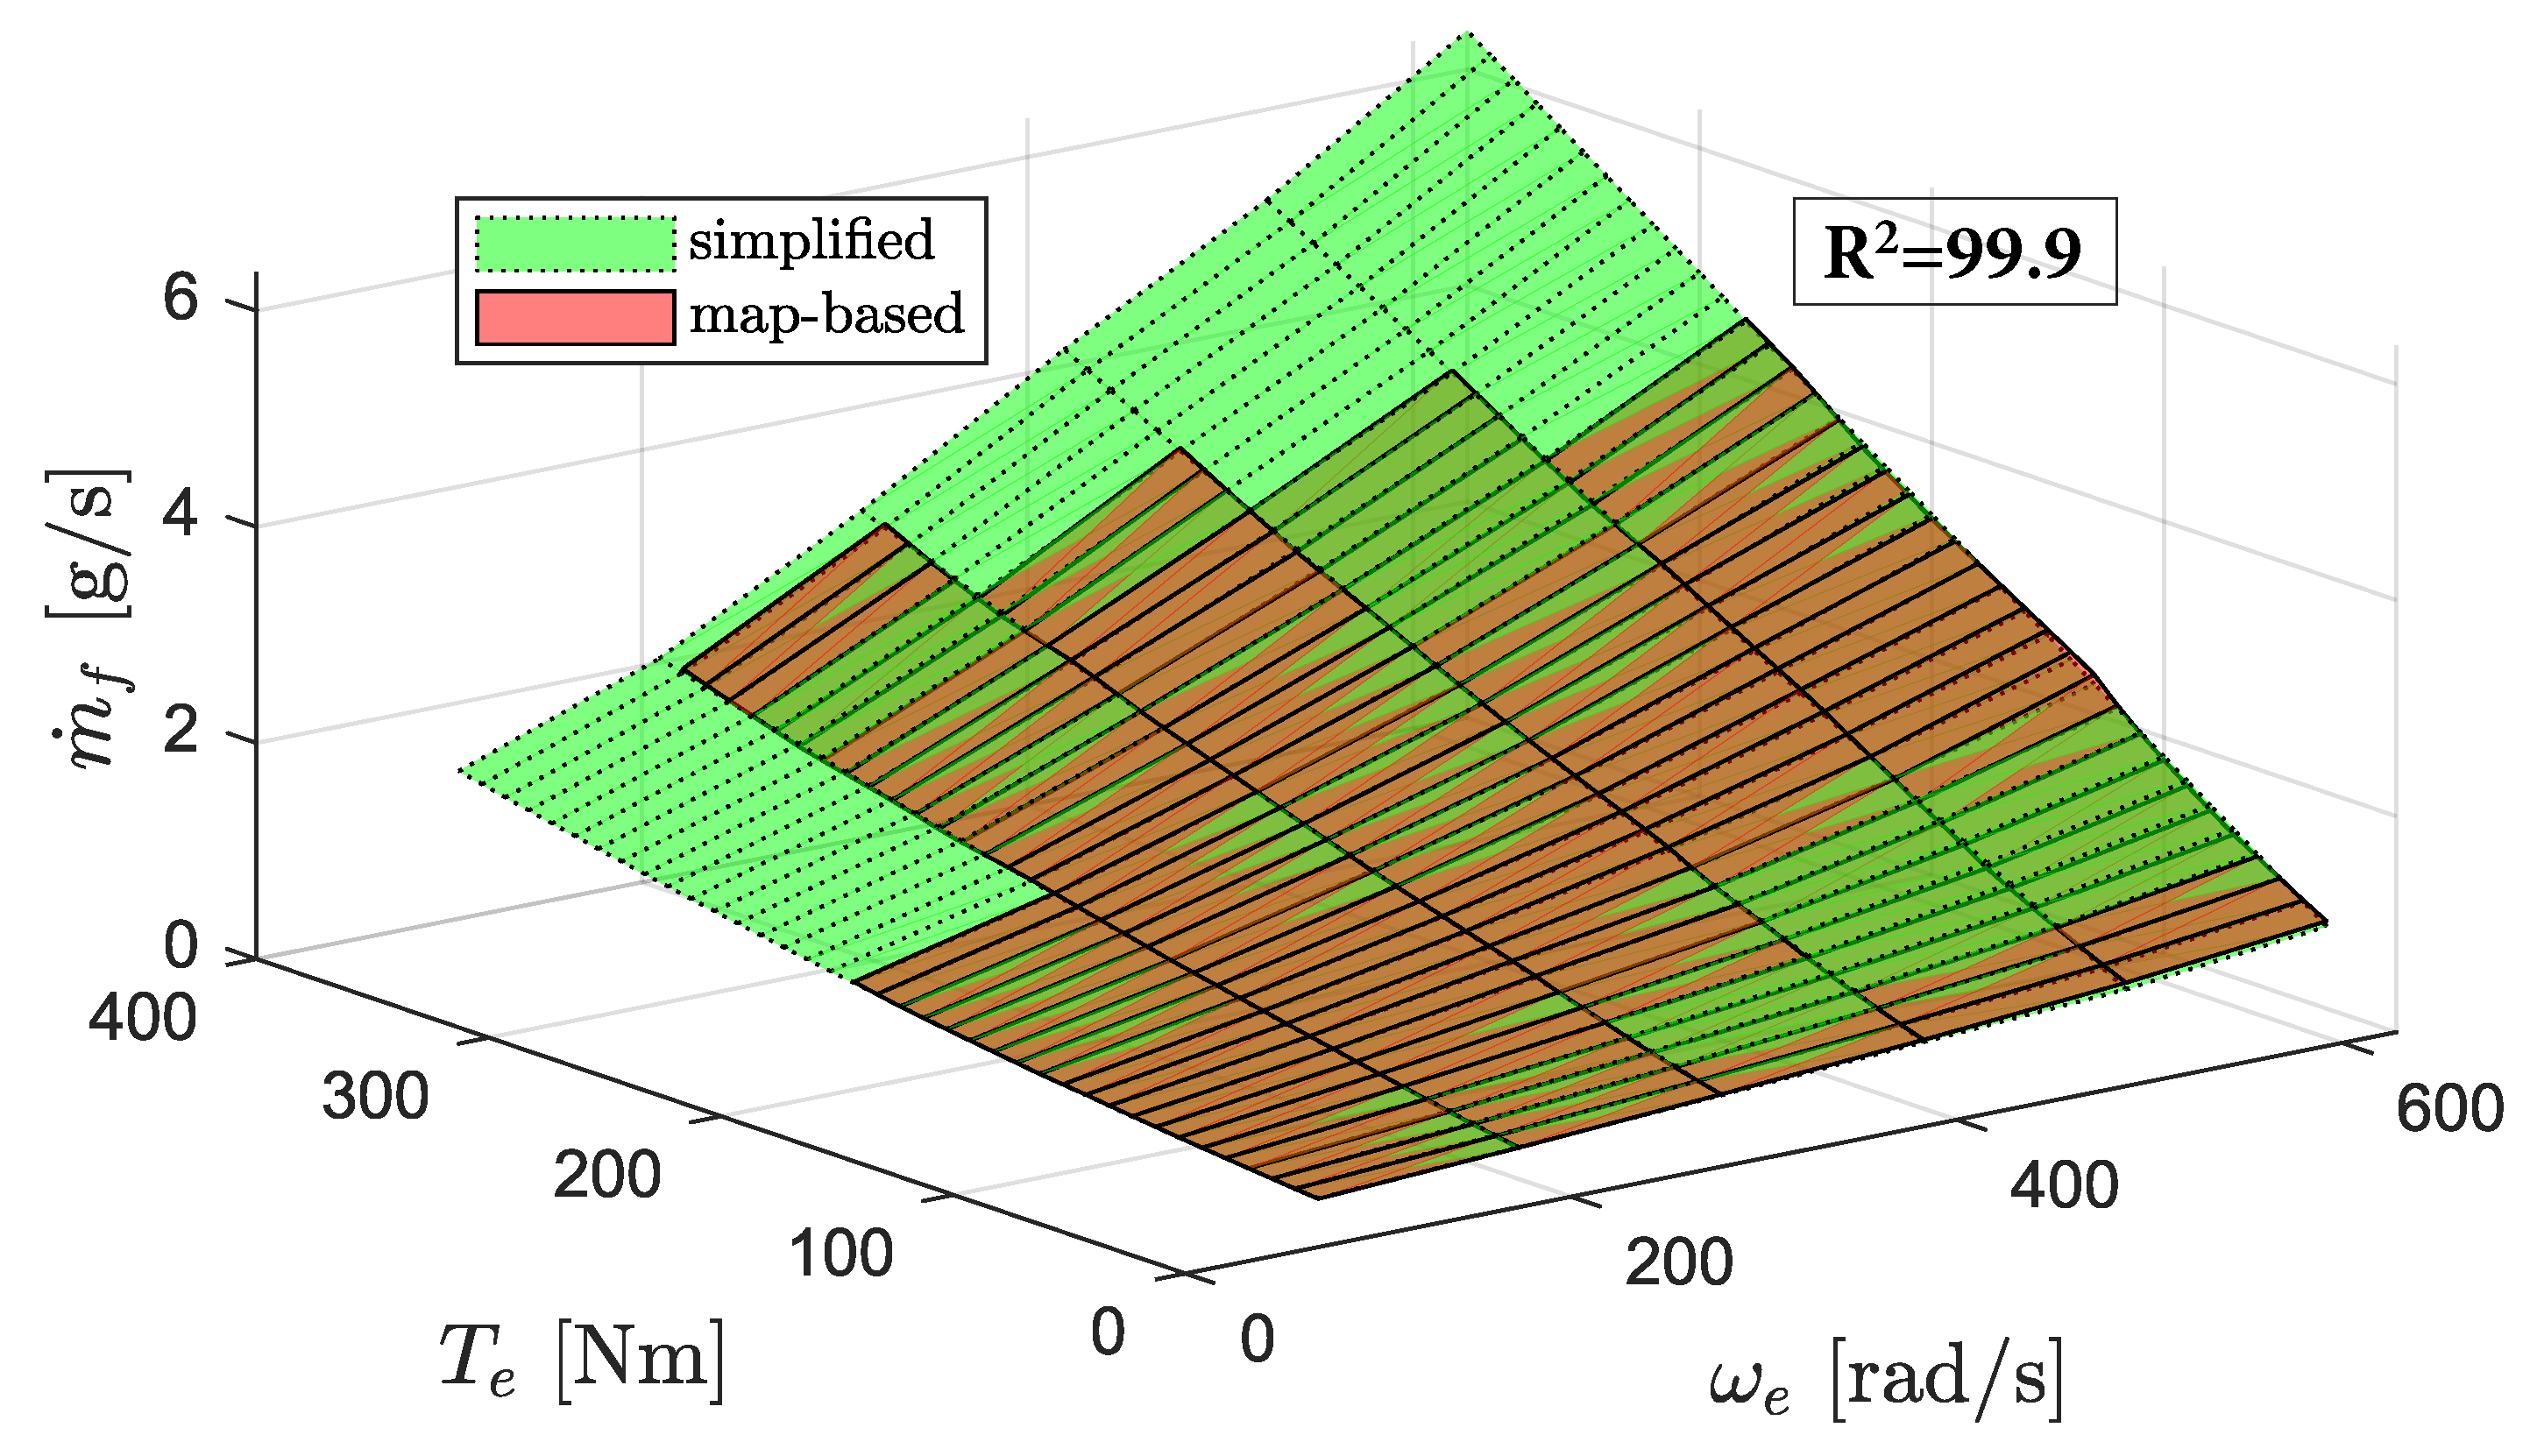
The hydrogen consumption map is approximated by using a speed-dependent quadratic Willans approach:
m ˙ f = f 0 ( ω e ) + f 1 ( ω e ) · P e GB + f 2 ( ω e ) · P e GB 2 .
Figure 4 shows the model fit for the entire hydrogen map.
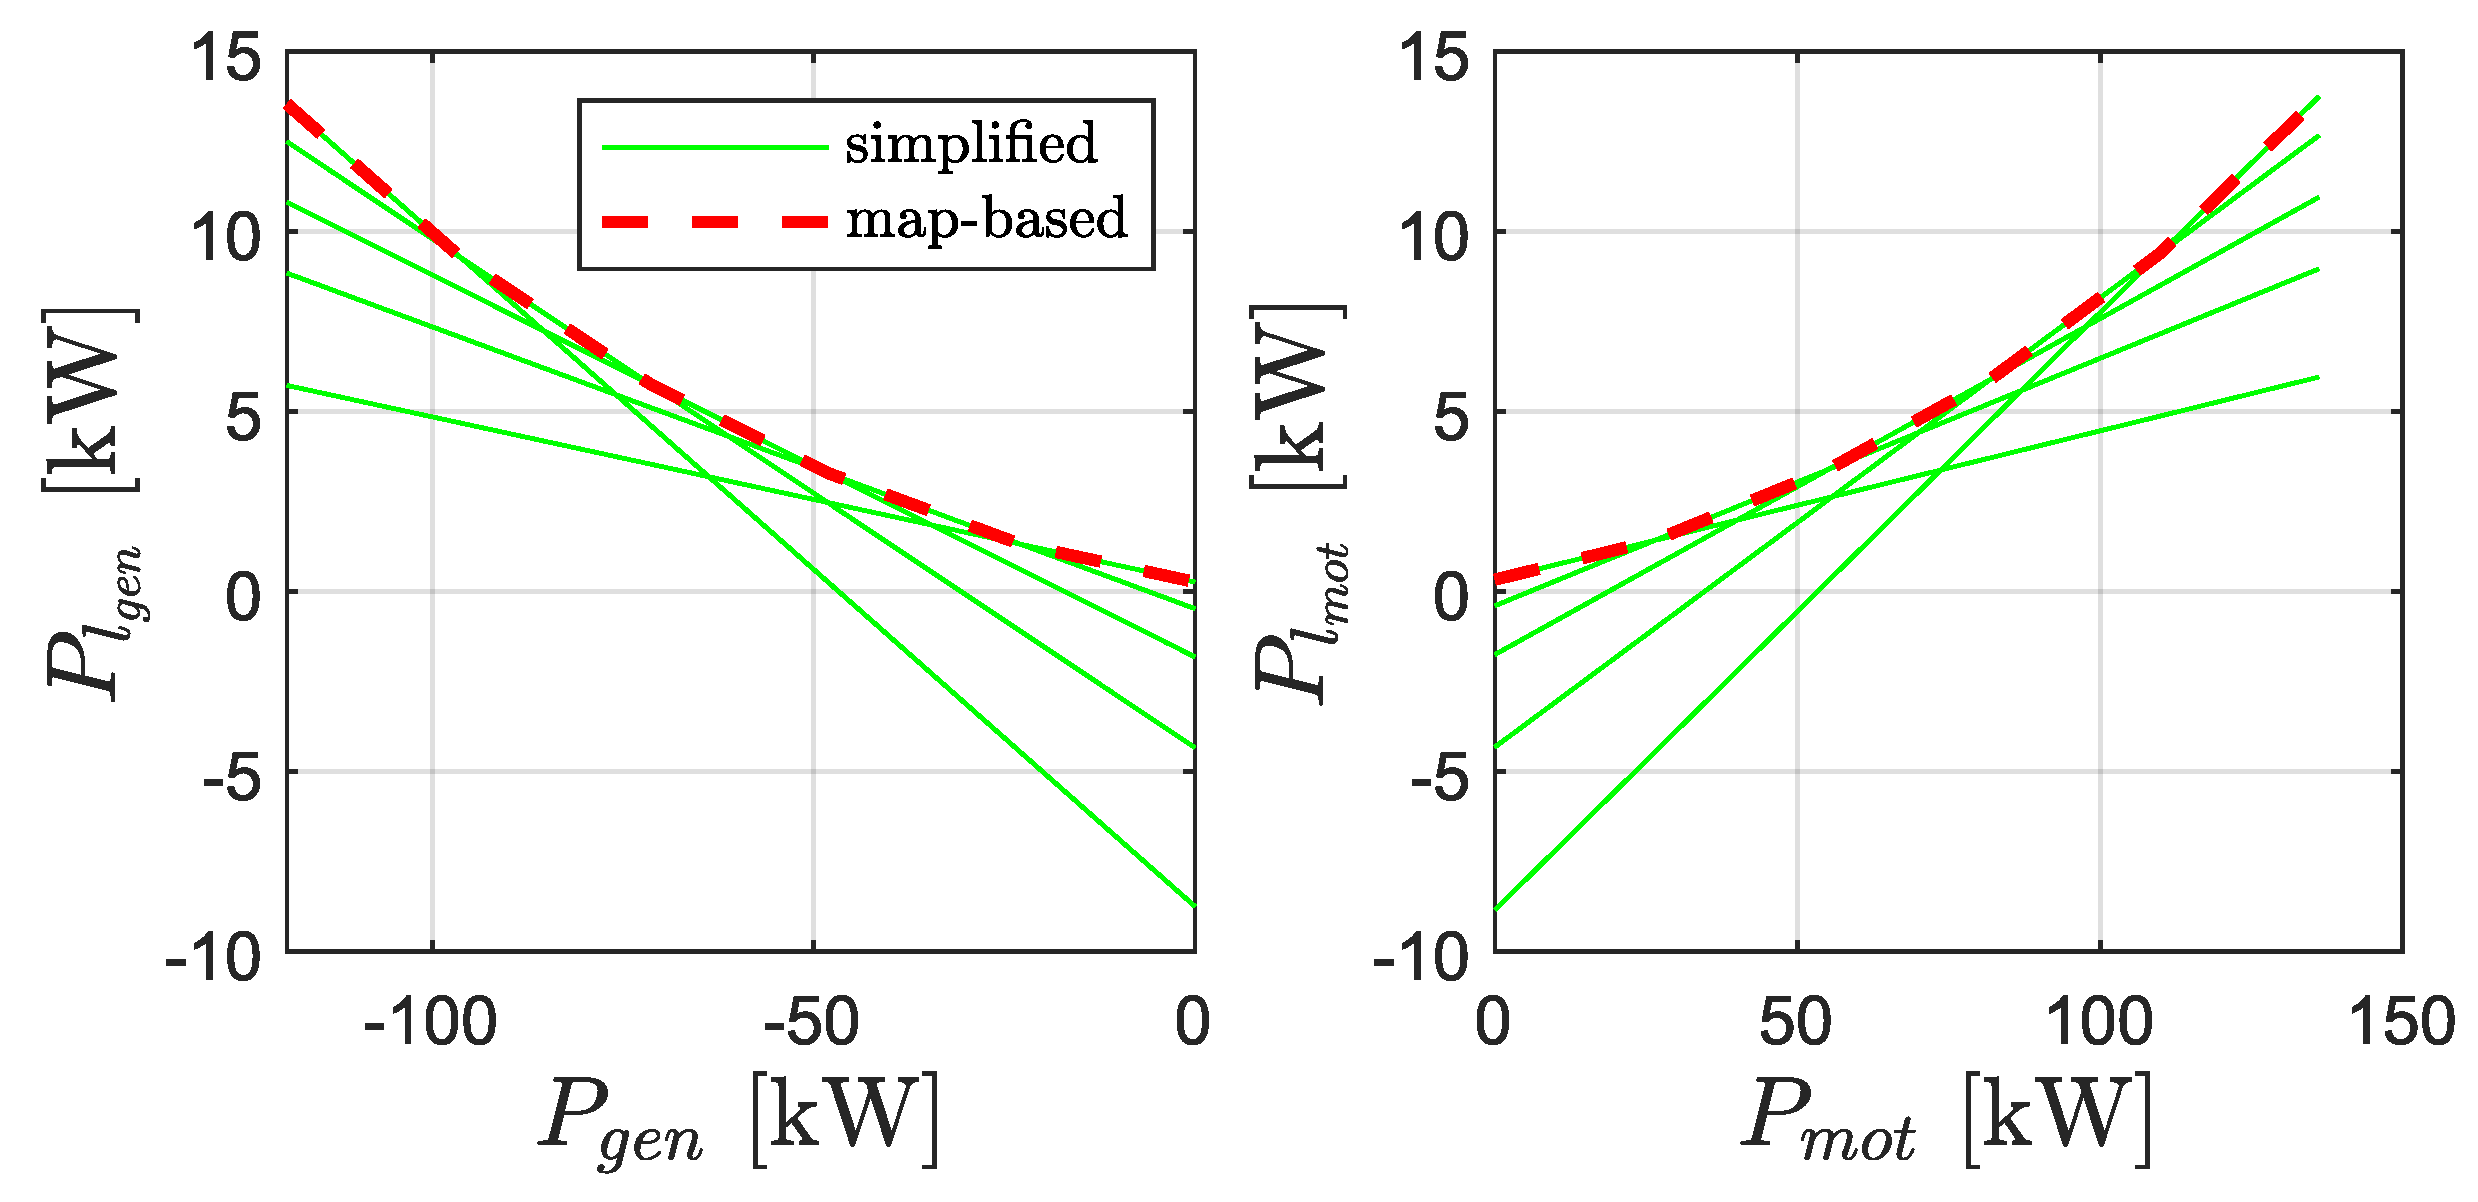
The electric motor and generator losses are both approximated by using a speed-dependent piece-wise affine model:
P l mot = max j { a 0 , j ( ω mot ) + a 1 , j ( ω mot ) · P mot } , for j { 1 , , 5 } , P l gen = max j { b 0 , j ( ω gen ) + b 1 , j ( ω gen ) · P gen } , for j { 1 , , 5 } .
The model accuracy is found to be sufficient when using five affine functions. Figure 5 shows the model fit for the electric motor and generator evaluated for one rotational speed of the corresponding component.
The NO x eo emission map is approximated by using a speed-dependent piece-wise affine model:
m ˙ NO x = max j { d 0 , j ( ω e ) + d 1 , j ( ω e ) · P e GB } , for j { 1 , , 10 } .
The model accuracy is found to be sufficient when using 10 affine functions. Figure 6 shows the model fit for the entire NO x eo emission map.

2.2.2. Series Mode

Operating the vehicle in series mode detaches the engine–generator unit from the rest of the drivetrain, which allows one to choose its operating point independently of the vehicle speed. For example, to produce fixed generator power P gen , the selection of ( ω gen , T gen ) can be optimized. From a control perspective, the series mode increases the flexibility of using the individual propulsion systems to satisfy EMS controller goals. From a system modeling perspective, however, the additional degree of freedom impedes the formulation of convex functions. This challenge is tackled by performing the pre-optimization of the engine–generator unit, covering all its operating conditions. The goal is to predefine, for each obtainable generator power, which combinations of generator speed and generator torque are optimal candidates with respect to hydrogen consumption and/or NO x eo emissions. The pre-optimization is based on the following extended cost function:
J = m ˙ f + ψ · m ˙ NO x .
where the trade-off factor, ψ , is used as a weight factor to reflect the H 2 -NO x eo trade-off. Algorithm 1 is used to perform the pre-optimization. In the following, it is explained in detail:
  • Step 1: The generator power and the trade-off factor ( ψ ) are discretized.
  • For each realizable P gen , all possible combinations ( ω e , T e ) that result in P gen ( j ) are identified. By using the map-based model, the corresponding hydrogen consumption m ˙ f map and the NO x eo emissions m ˙ NO x map are calculated (steps 3–5).
  • By looping over all ψ , Equation (19) is used to formulate the extended cost for all identified pairs of ( ω e ,   T e ) and the corresponding trade-off weight ψ (step 7).
  • Minimizing the extended cost function over all previously identified operating points ( ω e ,   T e ) yields the optimal engine operating point ( ω e * ,   T e * ) for the corresponding ψ (step 8).
  • Finally, for the generator power ( P gen ( j ) ) and the trade-off parameter ( ψ ), the following optimal values are stored for later use: optimal engine power ( P e * ), optimal hydrogen consumption ( m ˙ f * ), and optimal NO x eo emissions ( m ˙ NO x * ) (steps 9–11).
Algorithm 1 Pre-optimization for series mode.
  1:
P s gen Uniformly distributed vector [ 80   kW , 0   kW ]
  2:
ψ Uniformly distributed vector [ 0 , 150 ]
  3:
ω e Uniformly distributed vector [ ω e min , ω e max ]
  4:
for  j { 1 , 2 , , | P s gen | }  do
  5:
        T e for each entry in ω e , find T e that results in P s gen [ j ] according to Equations (3),
(11) and (13)
  6:
        m ˙ f f ( ω e , T e ) ▹ Equation (1)
  7:
        m ˙ NO x f ( ω e , T e ) ▹ Equation (2)
  8:
       for  k { 1 , 2 , , | ψ | }  do
  9:
            J m ˙ f + ψ [ k ] · m ˙ NO x ▹ Equation (19)
10:
            i * arg min J ▹ index of minimizer in J
11:
            m ˙ f * m ˙ f [ i * ]
12:
            m ˙ NO x * m ˙ NO x [ i * ]
13:
            P e GB * ω e [ i * ] · T e [ i * ]
14:
            P s gen * P s gen [ j ]
15:
            ψ * ψ [ k ]
16:
           Store ( P e GB * , ψ * , m ˙ f * , P s gen * , m ˙ NO x * )
17:
        end for
18:
end for
19:
Return:  m ˙ f = f ( ψ , P e GB ) ▹ based on stored variables
20:
Return:  P s gen = f ( ψ , P e GB ) ▹ based on stored variables
21:
Return:  m ˙ NO x = f ( ψ , P e GB ) ▹ based on stored variables
Here, the lower bound P ̲ s gen = 80 kW is sufficiently large to cover the entire relevant range of engine–generator usage. The upper generator bound of 0 kW is set, as the generator is not used to provide additional mechanical propulsion power at the wheel. Setting the trade-off factor to its lower bound of ψ = 0 results in an objective solely concerned about hydrogen consumption. Setting ψ = 150 , on the other hand, results in an objective that is solely concerned about NO x eo emissions. Further increasing ψ does not change the result of step 8. Thus, selecting ψ [ 0 , 150 ] represents the complete achievable H 2 -NO x eo trade-off.
Based on the results of the pre-optimization, the following model parameters are fitted. Notably, compared with the modeling approach for the parallel mode, these mappings have no explicit dependency on rotational speeds.
Figure 7 shows the approximation for the generator source power and the hydrogen consumption based on above pre-optimized values. The generator source power is approximated by using a hyperplane:
P s gen = β 0 + β 1 · P e GB + β 2 · ψ .
The hydrogen consumption is approximated by using multiple hyperplanes:
m ˙ f = max j { ϕ 0 , j + ϕ 1 , j · P e + ϕ 2 , j · ψ } , for j { 1 , , 5 } .
The model accuracy is found to be sufficient when using 5 hyperplanes.
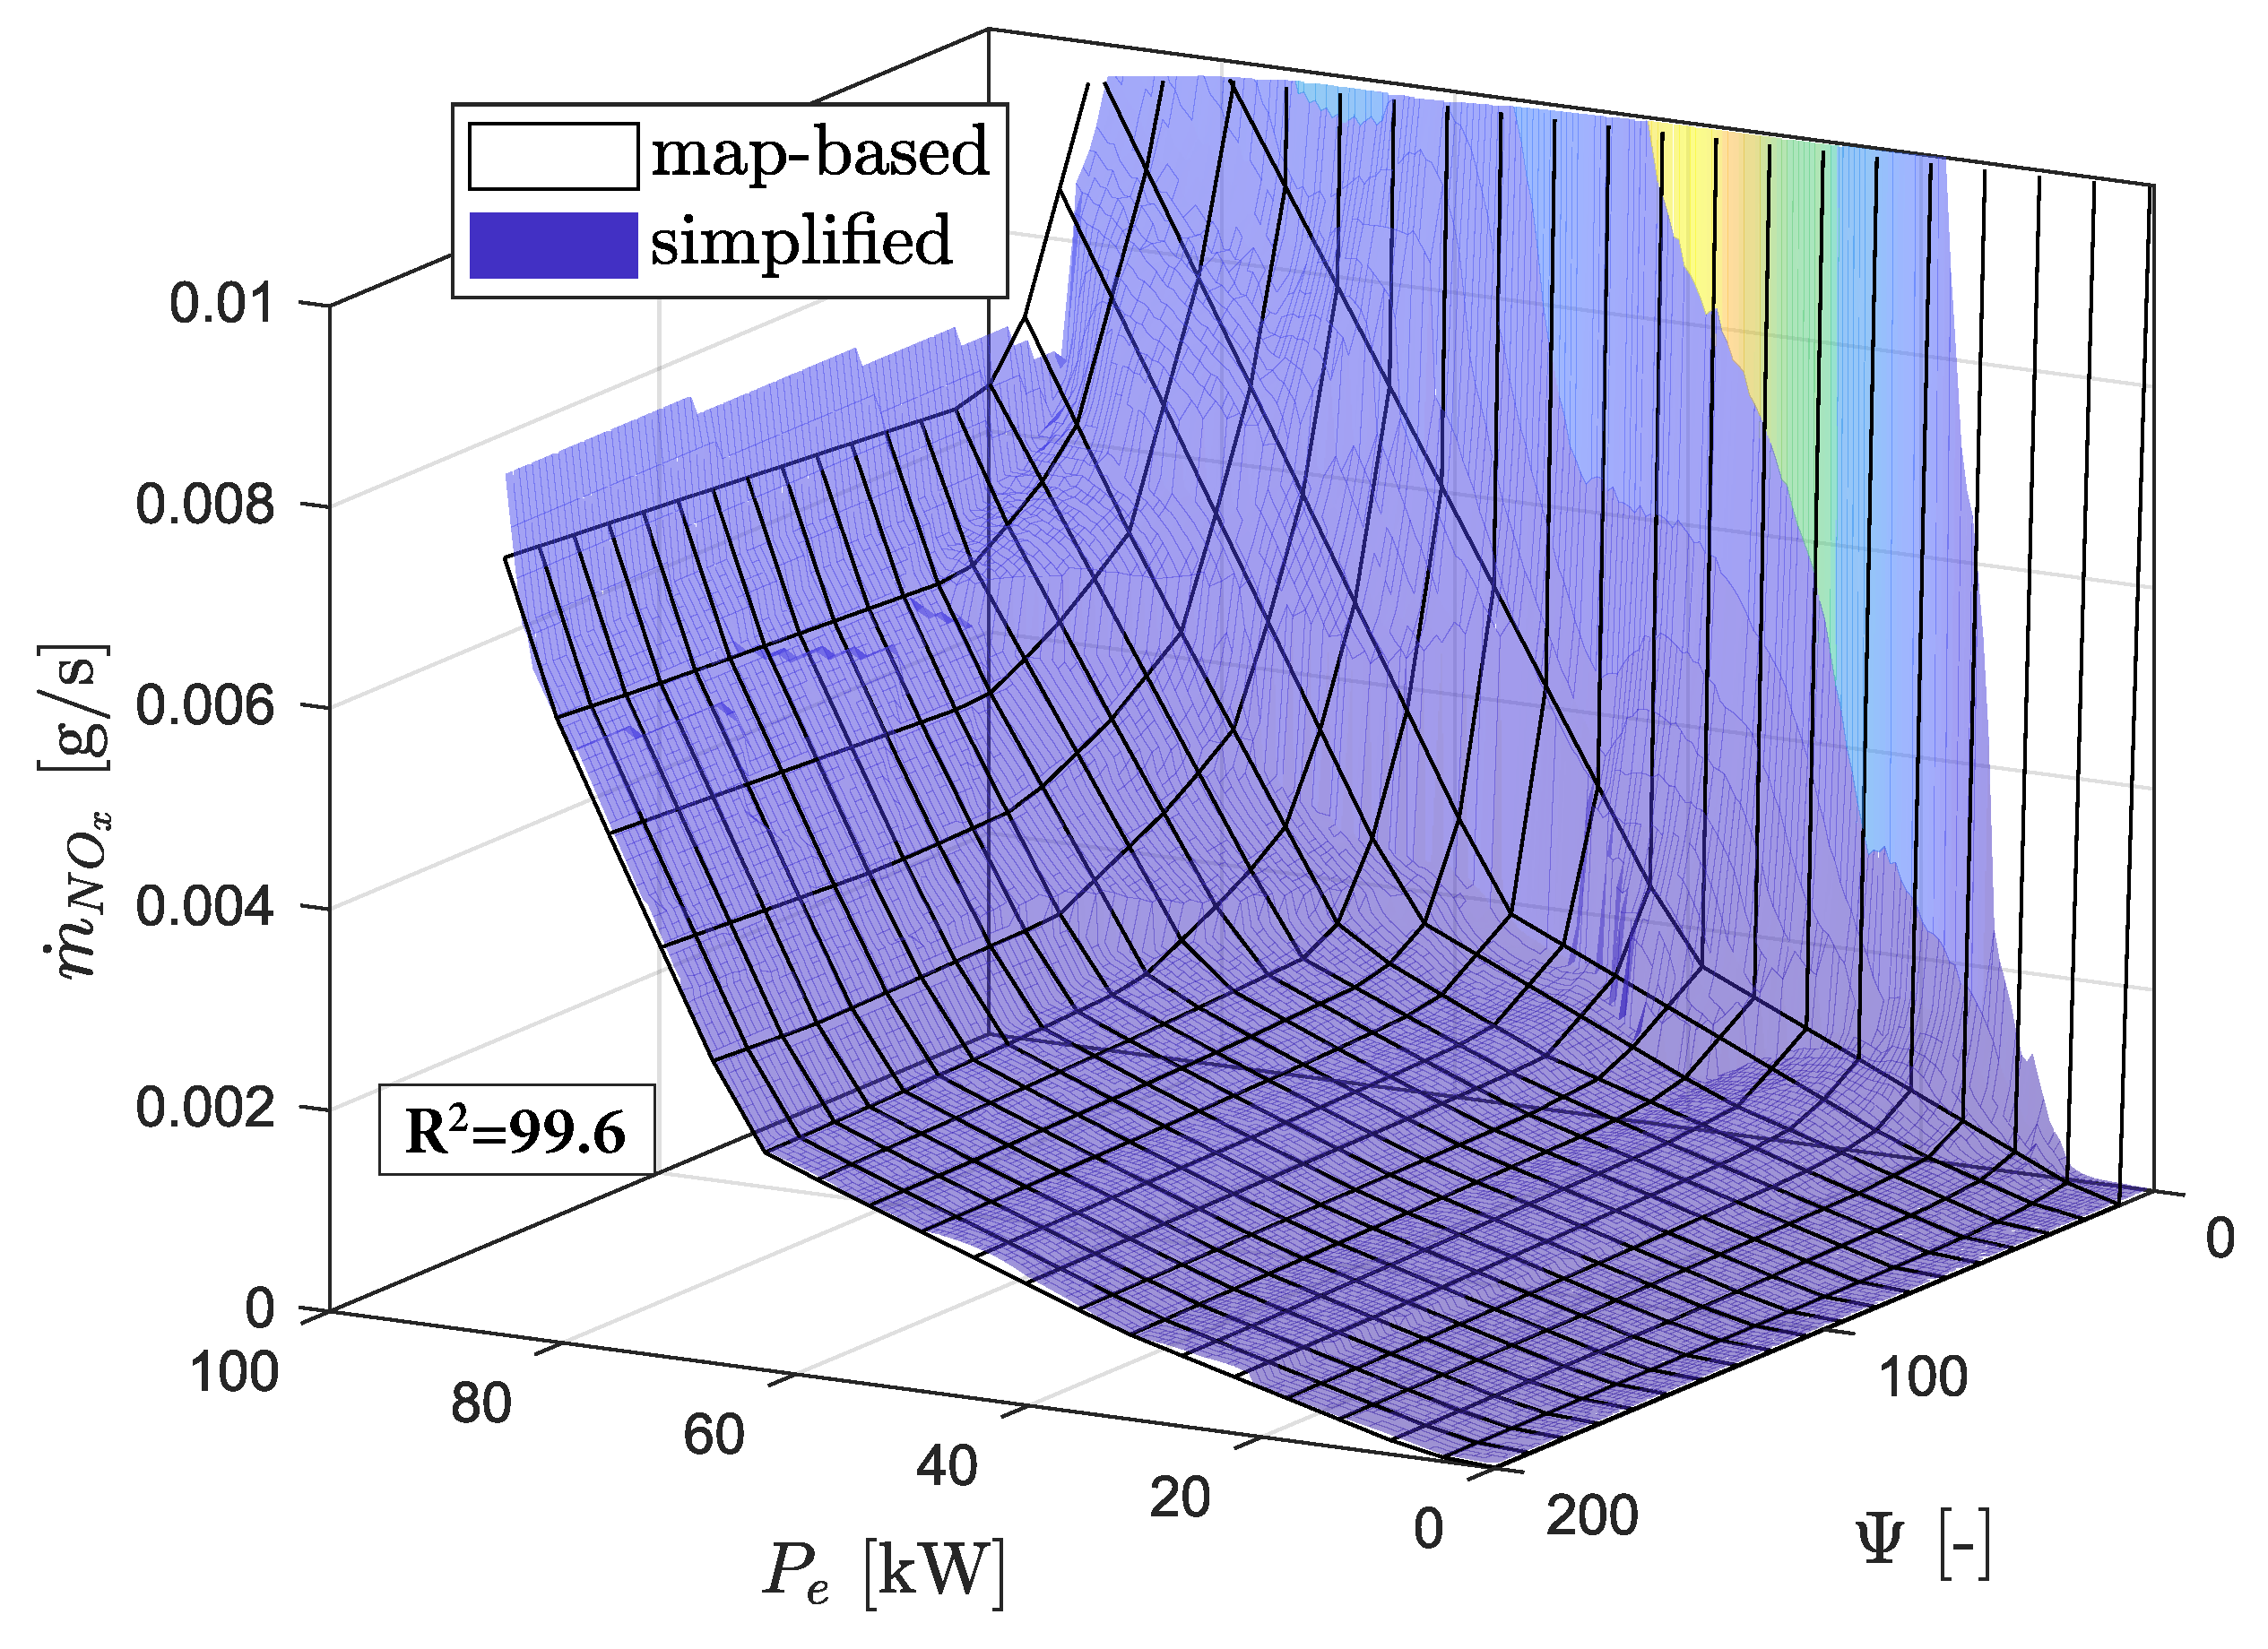
Figure 8 depicts the approximation of the NO x eo emissions in series mode, consisting of multiple hyperplanes.
m ˙ NO x = max j { δ 0 , j + δ 1 , j · P e + δ 2 , j · ψ } , for j { 1 , , 17 } .
The fitting process is performed by using a slightly adapted version of the convex adaptive partitioning algorithm [19].
The convex adaptive partitioning algorithm is free to decide the number of hyperplanes and converges at the number of 17.

2.3. Optimization Parameters

The simplified model provides an approximation of the drivetrain components. Next, to arrive at the formulation of an optimization problem, the set of dynamic states and the set of control inputs are described.
The dynamic states are the accumulated NO x eo and the SoC:
x = m NO x SoC .
The differential equation for the accumulated NO x eo is defined by Equations (18) and (22) and reads as
d m NO x d t = δ 1 , j · P e + δ 2 , j · ψ + δ 0 , j , if M = 1 d 1 , j · P e + d 0 , j , if M = 2 .
The differential equation for the SoC is defined as follows:
d SoC d t = P s b Q 0 ,
where Q 0 denotes the battery capacity and P s b denotes the battery source power.
The control inputs for the simplified powertrain model are given in the vector
u = P e GB P mot GB P gen GB ψ .
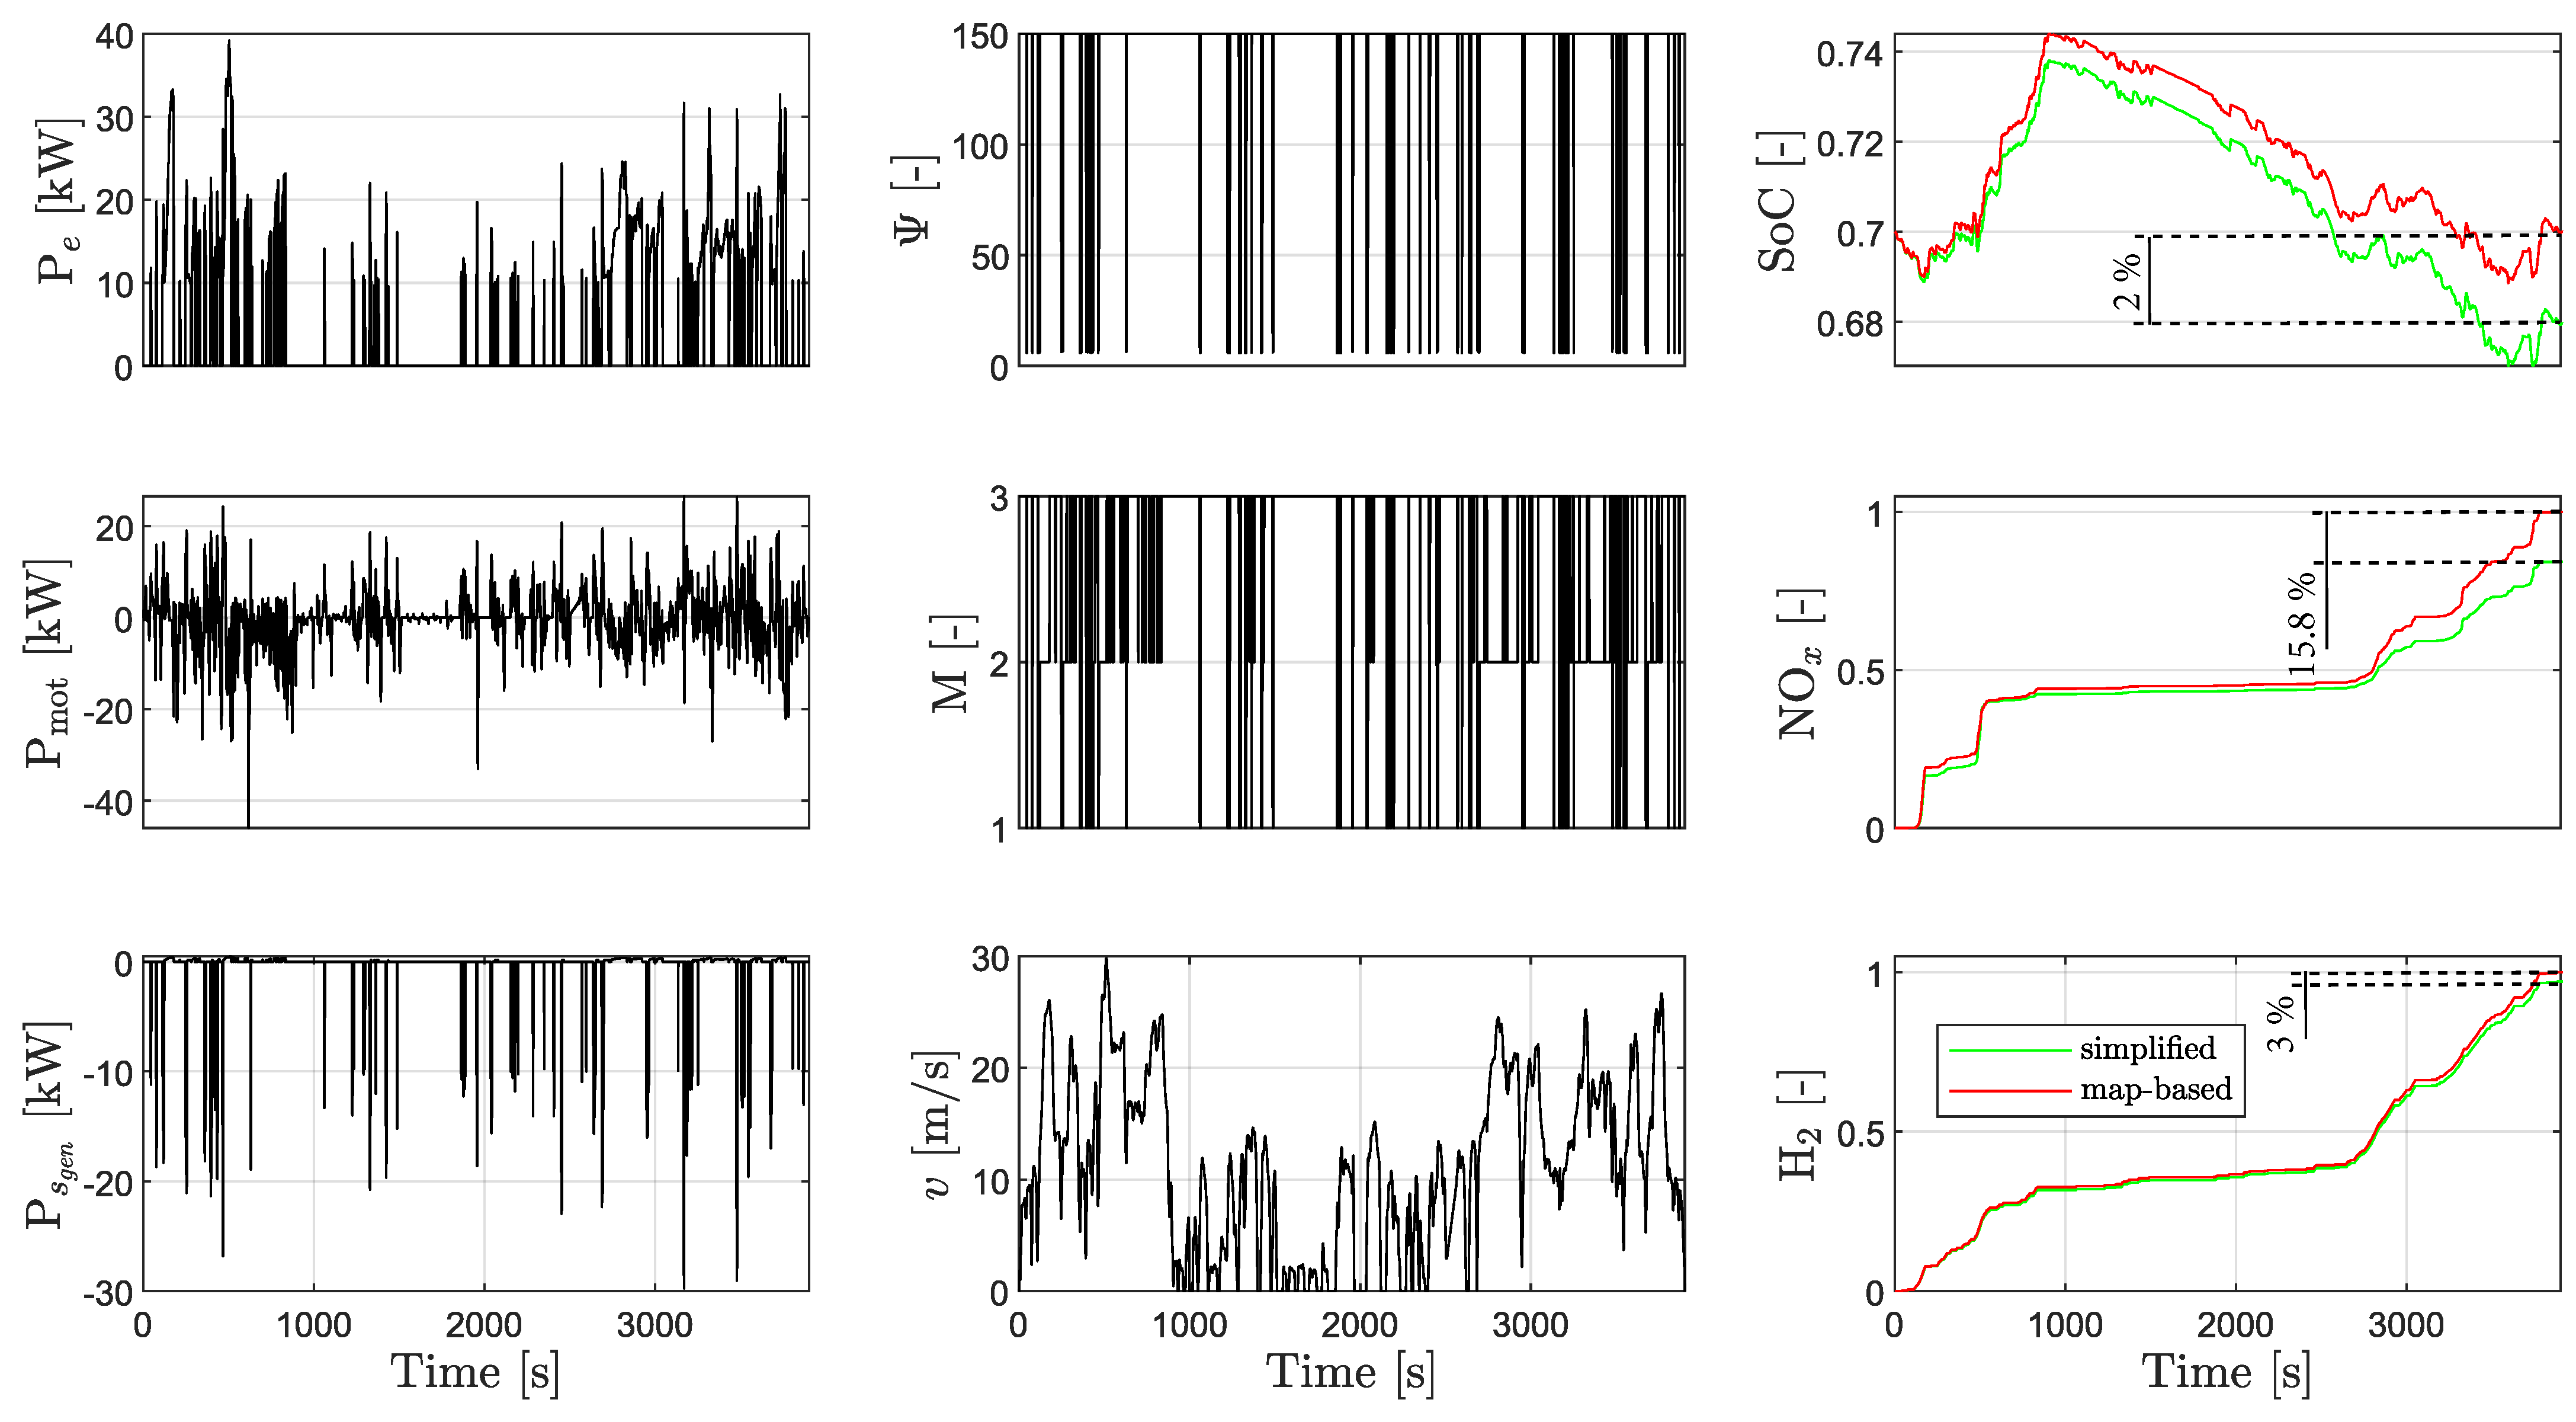
A validation of the simplified model description is presented in Figure 9. Both models are simulated by using the input trajectories depicted by the black lines. The resulting trajectories for SoC and NO x eo and the resulting hydrogen consumption are depicted by using the red lines and the green lines.
An offset results when the input trajectories are evaluated on the simplified model. The offset of 3% in hydrogen consumption and the offset of 2% in the final SoC are limited. However, the offset of 15.8% in cumulated NO x eo emissions is larger. Nevertheless, the accuracy of the simplified model was found to be good enough for its use as a control-oriented model.

3. Control-Oriented Optimization Problem

In this section, the simplified model description is leveraged to formulate a convex optimization problem. However, in order to omit the formulation of a mixed-integer program (see Equation (8)), a time-resolved trajectory of integer driving mode M has to be found in advance.

3.1. Driving Mode Estimation

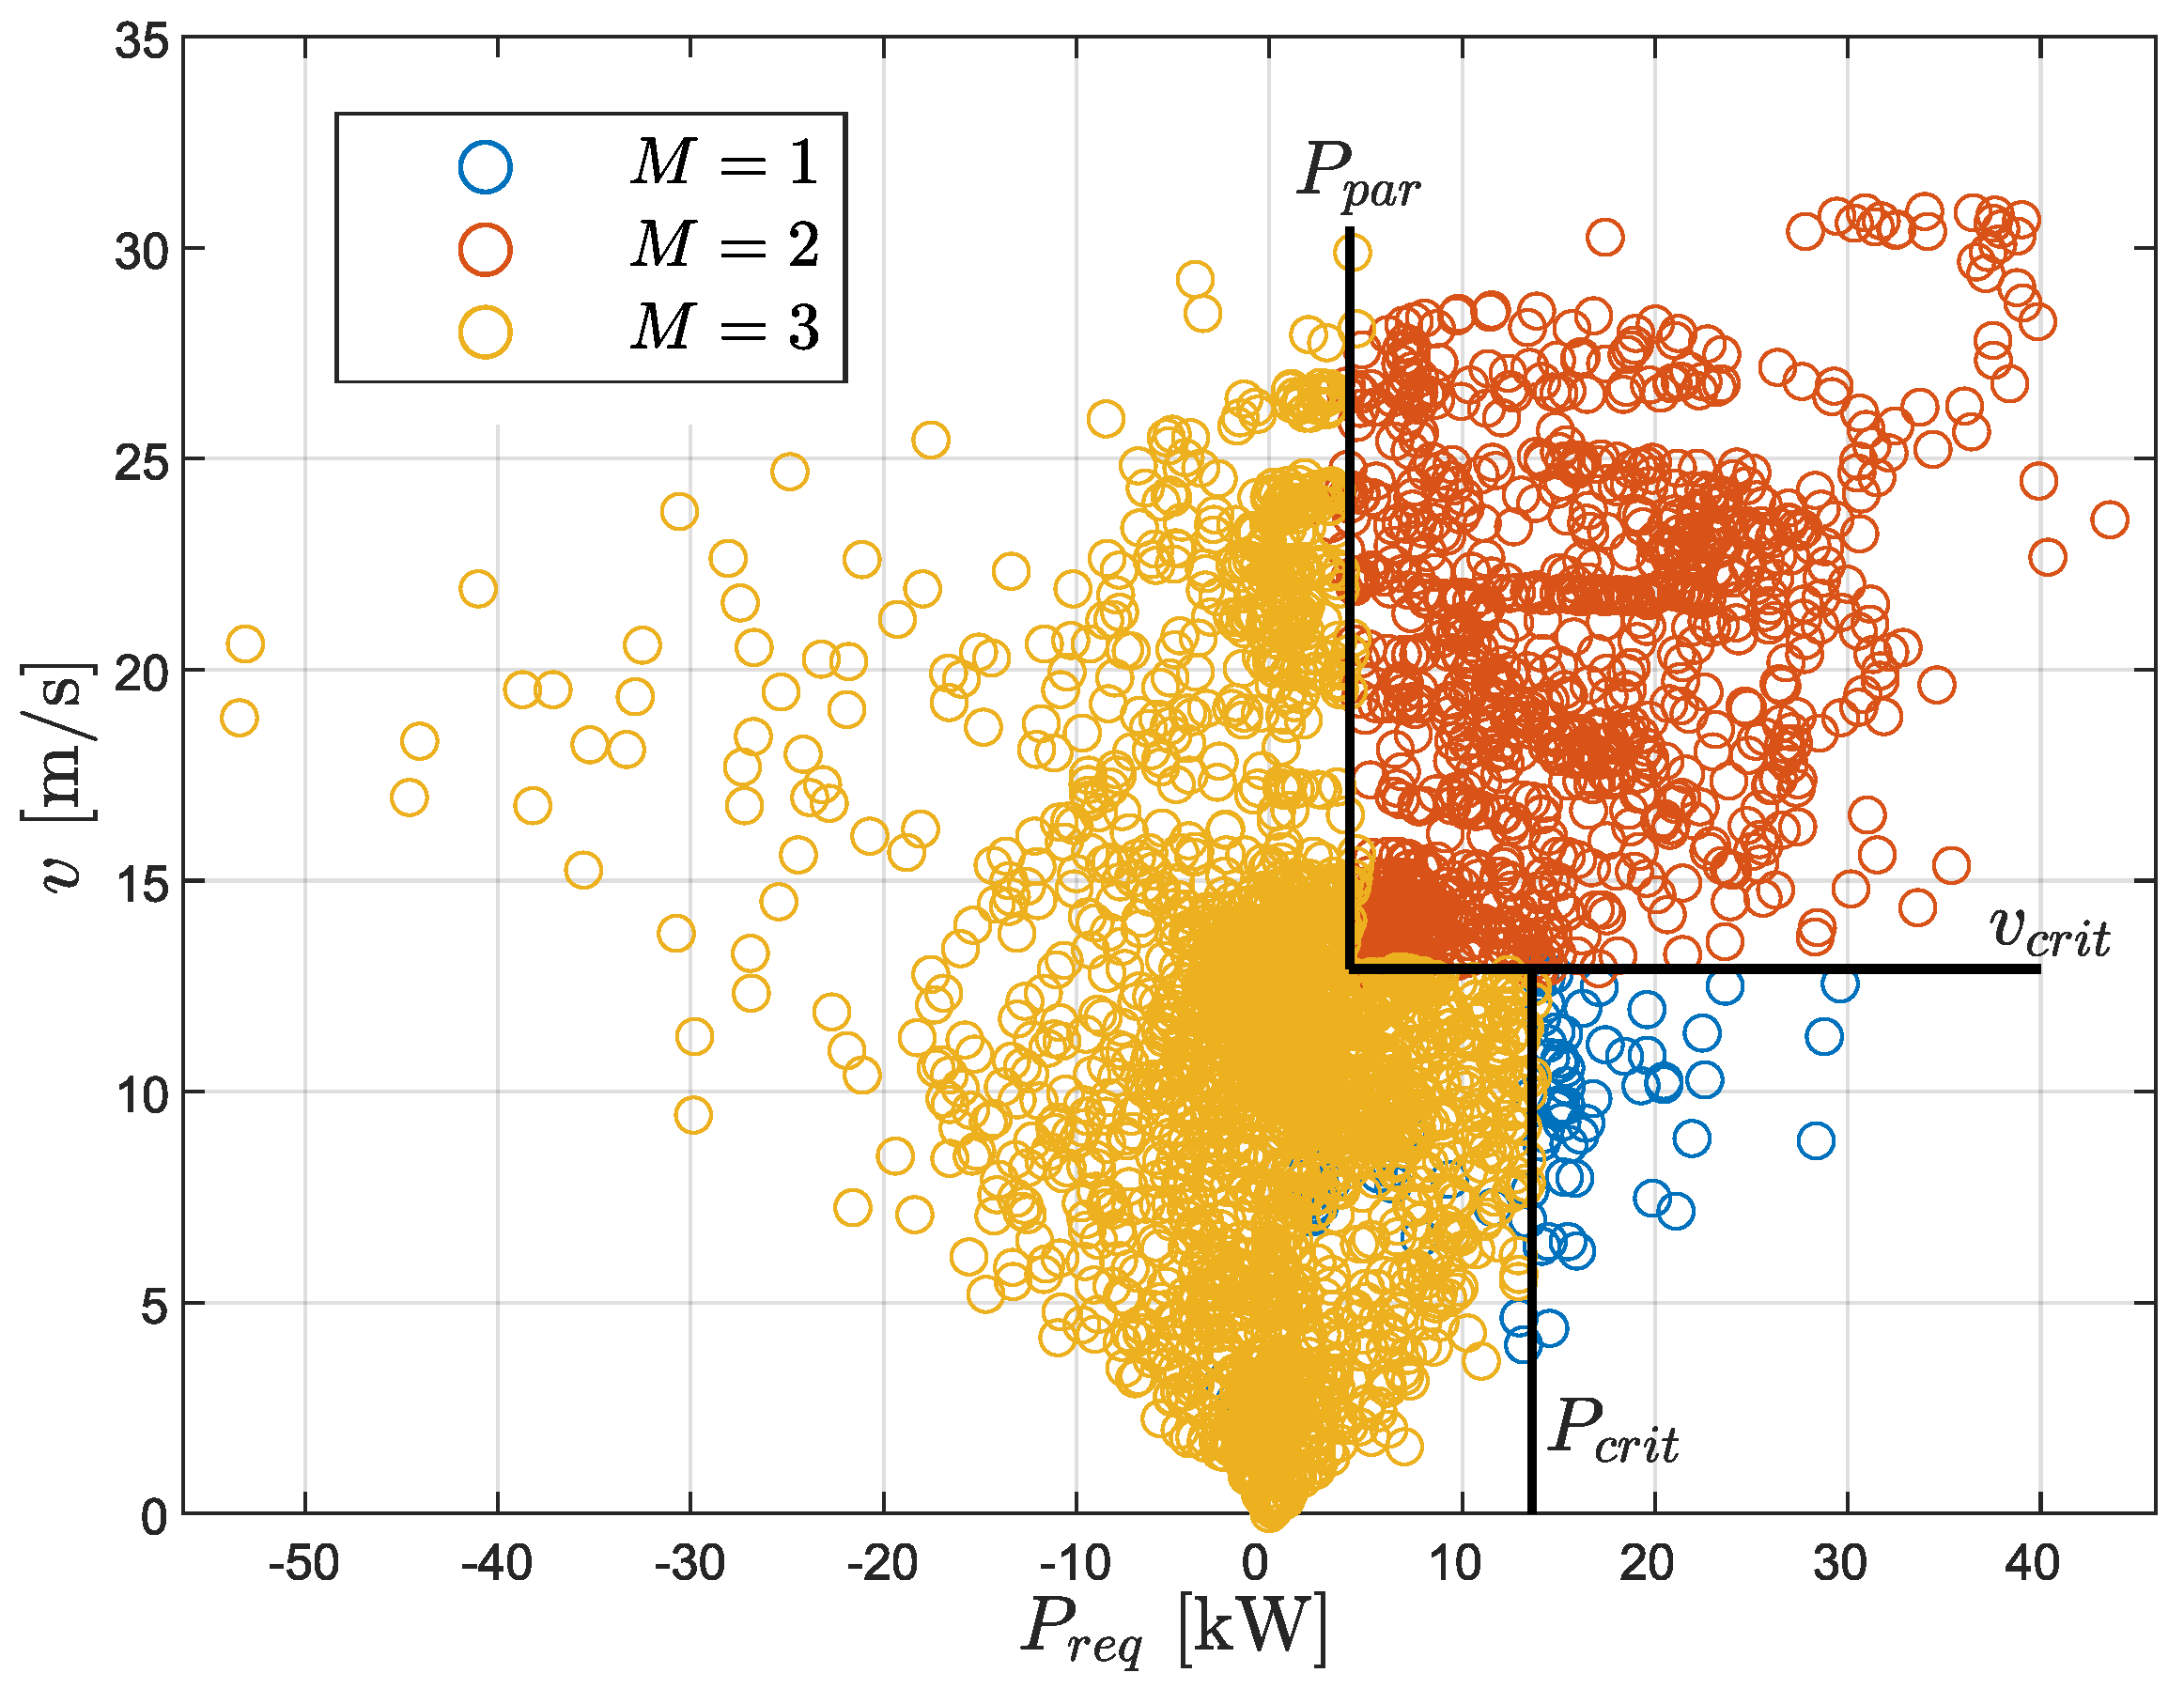
The estimation of the optimal driving mode, M, is based on the work published in [20]. Here, the authors propose a map which is defined on the ( P req v ) plane to estimate the optimal driving mode. If the map is chosen carefully, a close-to-optimal estimation of the driving mode is possible based on the vehicle velocity and the power request. An exemplary map used in this work is depicted in Figure 10. It is obtained by solving Equation (8) by using the DP algorithm for a specific driving mission. The parameters P crit , v crit , and P par describe regions to estimate the optimal driving mode. By assuming predictive knowledge of the vehicle’s upcoming time-resolved velocity and power request, a time-resolved estimation of the future optimal driving mode can also be made.

3.2. Convex Optimization Problem

Based on an estimation of the time-resolved trajectory for the integer driving mode (M), the convex optimization problem, which is from here on referred to as the COP , is explained step-by-step in the following.

3.2.1. Cost Function and Dynamics

The cost function and dynamic state equations of the COP read as follows:
min u t 0 t f ( m ˙ f + κ P e · ϵ P e ) d t + κ NO x · ϵ NO x
s . t . d SoC d t = Equation ( 25 )
SoC ( t 0 ) = SoC 0
SoC ( t f ) SoC ¯ RTG
d m NO x d t = Equation ( 24 )
m NO x ( t 0 ) = m NO x , 0
m NO x ( t f ) m ¯ NO x RTG + ϵ NO x
P e GB P e GB max + ϵ P e
ϵ P e 0
ϵ NO x 0
The cost function (27a) consists of three parts: First, there is the integral of the hydrogen consumption, m ˙ f , just as in the original formulation in (8a). Second, there is the integral of the quantity κ P e · ϵ P e , which, together with Equation (27h,i), represents a soft constraint on engine power. It is used to ensure that the optimization problem remains feasible, even if an unrealistically high power request is predicted. A detailed explanation is provided in [20]. Third, there is the scalar term κ NO x · ϵ NO x , which, together with Equation (27g,j), represents a soft constraint on accumulated NO x eo . It is used to ensure that disturbances leading to increased NO x eo cannot lead to an infeasible optimization problem. It is important to ensure that constraints are only softened if no feasible solution with strict constraint compliance exists. Thus, the weights κ P e and κ NO x have to be at least as high as the corresponding optimal Lagrange multipliers for the original problem [21]. Since these Lagrange multipliers are not known a priori, the weighting is chosen very large, i.e., 10 5 , here.
The definition of the dynamic states requires three ingredients: First, both dynamic states are initialized with the values of SoC 0 and m NO x , 0 (Equation (27c,f)). Second, the evolution of the dynamic states is defined by Equation (27b,e). Third, the terminal conditions for both dynamic states are given by Equation (27d,g).

3.2.2. Power Split

The goal of the COP is to satisfy the time-resolved power request trajectory optimally by using the optimal control inputs u . In the following, the power balance is described depending on the driving mode:
M = 1 : ̲ P req GB = P mot GB P s gen = β 1 · P e GB + β 2 · ψ + β 0
M = 2 : ̲ P req GB = P gen GB + P mot GB + P e GB
M = 3 : ̲ P req GB = P mot GB P e GB = 0 P gen GB = 0
Based on the optimal power distribution, the hydrogen consumption, NO x eo emissions, and electric losses result are formulated by using constraint relaxations.

3.2.3. Constraint Relaxations

In the following, equality constraints (16)–(18), (21), and (22) are relaxed, which is necessary to obtain a convex feasible set for the optimization parameters:
m ˙ f α i P e GB + β i s + γ i , i { 1 , , 5 } , if M = 1 f 0 + f 1 P e GB + f 2 P e GB 2 , if M = 2 0 , if M = 3 ,
m ˙ NO x α i P e GB + β i s + γ i , i { 1 , , 17 } , if M = 1 α i P e GB + γ i , i { 1 , , 10 } , if M = 2 0 , if M = 3 ,
P l gen 0 , if M { 1 , 3 } α i P gen + γ i , i { 1 , , 5 } , if M = 2 ,
P l mot α i P mot + γ i , i { 1 , , 5 } .
An in-depth explanation of constraint relaxations is presented in [22]. However, intuitively, each parameter subject to the relaxed Equation (31a–d) should be as small as possible to accumulate as little hydrogen consumption, NO x eo emissions, or electrical losses as possible. Therefore, the equations hold with equality if used within an optimization problem.

3.2.4. Battery

The following set of constraints reformulates the convex battery model introduced by Equations (14) and (15):
P b tot = P s mot + P s gen + P aux
P b tot = P b + + P b
P s b , 1 r 1 + P b + + r 2 + ( P b + ) 2
P s b , 2 r 1 P b + r 2 ( P b ) 2
P s b P s b , 1 + P s b , 2
P b + 0
P b 0 .
The auxiliary variables P b tot , P b + , P b , P s b , 1 , and P s b , 2 are introduced to formulate the piece-wise quadratic battery model using convex set representations. Equation (32c,d) are relaxed equality constraints.

3.2.5. Input and State Domains

The feasible control input domain and state domain are given in the following:
u U
x X ,
where U includes the physical limitations of the propulsion systems. Feasible set X consists of constant upper and lower battery bounds, i.e., SoC ∈ [0.5, 0.9]. It is important to note that the COP is a convex optimization problem only if the driving mode (M) is known in advance. The COP is parsed by using the software package YALMIP, R2023 [23] and solved by using the solver MOSEK, v10.1.31 [24]. Euler forward integration is used, and the time discretization is set to 1 s.

4. Controller Structure

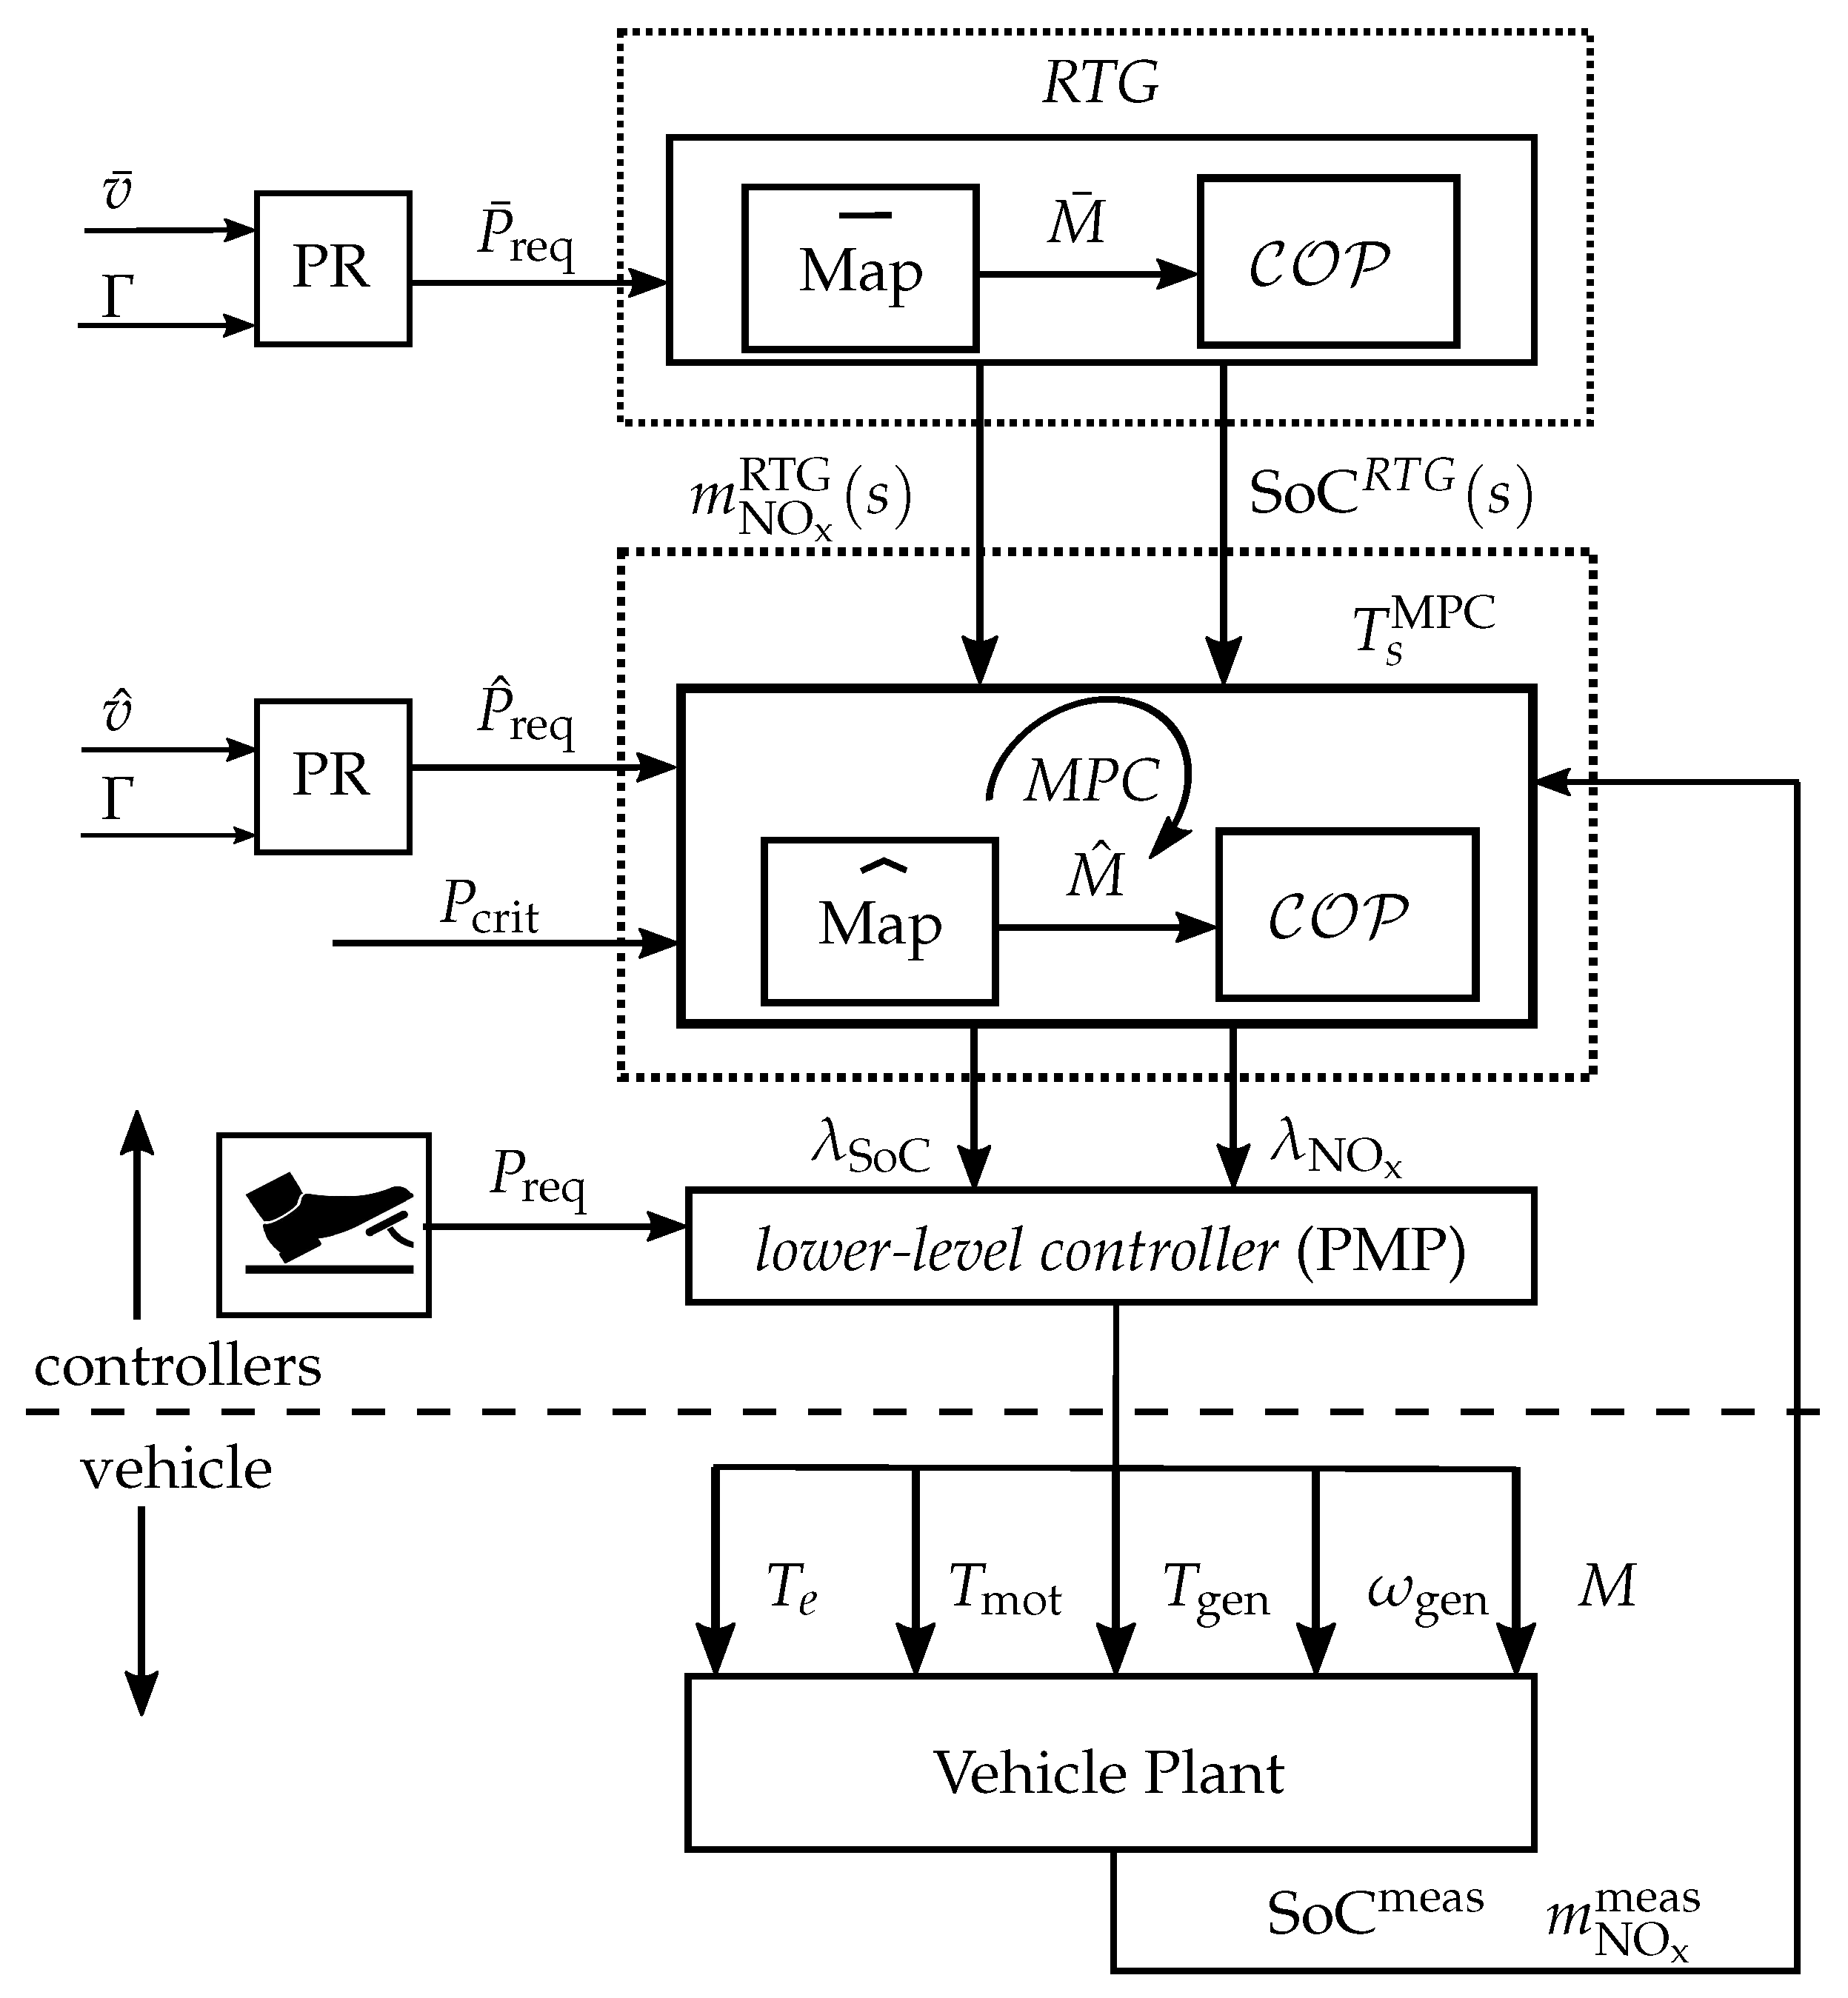
In this section, the proposed control architecture to calculate the vehicle control inputs is presented. The overall controller architecture is presented in Figure 11 and is based on the work presented in [20]. The controller consists of three controller levels: the lower-level controller; the so-called MPC; and the reference trajectory generator, which is from here on referred to as the RTG. Each controller level receives a power request signal, i.e., P req , P ^ req , and P ¯ req , respectively. The corresponding power request signals are either determined by the driver or calculated by using the elevation profile ( Γ ) of the driving mission and a corresponding predicted velocity signal ( v ¯ or v ^ ). As predictive data are likely to be imperfect and of lower accuracy for long-term predictions than for short-term predictions, the accents { } ¯ and { } ^ are used to denote signals of differing prediction accuracy. The corresponding power request signals are calculated in the block labeled PR by using a set of equations of the longitudinal vehicle dynamics [25].
In the following, a bottom-up approach is used to explain the overall controller structure in detail. The focus is on the communication between the individual controller levels.

4.1. Lower-Level Controller

The lower-level controller calculates the powertrain control inputs T e , T mot , T gen , ω gen , and M in a real-time-feasible fashion. It is a non-predictive controller and obtains the current value P req . The control inputs are passed on to the vehicle plant model, which can be interpreted as a digital twin of the mixed H 2 -HEV. The battery SoC and the accumulated NO x eo emissions can be accessed from the vehicle plant model in a causal fashion. They are denoted with SoC meas and m NO x meas . The lower-level controller is based on the concept of Pontryagin’s minimum principle (PMP) and requires knowledge of the so-called costates, which can be interpreted as equivalent cost terms in a local Hamiltonian minimization problem [26]. The theory of PMP states that for an optimization problem, there exists one costate variable for each dynamic state variable. Therefore, two costates are required for the EMS at hand: λ SoC and λ N O x . Given an estimation of the costates, the calculation of controller inputs based on the application of PMP has already been shown multiple times (see, e.g., [27]) and is thus not further discussed in this text.

4.2. MPC

The MPC is used to estimate the value of the optimal costates, which are required by the lower-level controller. It solves the COP based on medium-term time-resolved predictive information for the power request of the upcoming driving mission. In Equation (27), the parameter t f is replaced by t 0 + H p , where H p denotes the length of the predictive information and is called the prediction horizon. The MPC also consists of a map, denoted in Figure 11 by the block Map ^ , which is defined on the ( P ^ req v ^ ) plane, and the COP . This map is not static but is adapted over time by using a learning algorithm, which is explained in detail in [20]. The controller is updated every T s MPC seconds, where each update includes the following steps: The map is used to estimate the time-resolved optimal driving mode M ^ based on the predicted power request. The dynamic states of the COP (Equation (27c,f)) are initialized by using the signals SoC meas and m NO x meas . The terminal conditions for the dynamic states (Equation (27d,g)) are set. This is performed by using interpolation of the spatially defined vectors SoC RTG ( s ) and m NO x RTG ( s ) and the predicted vehicle position s ( t 0 + H p ) at the end of the prediction horizon. The two costates λ SoC and λ N O x are obtained by solving the COP [20].

4.3. Reference Trajectory Generator

The reference trajectory generator is used to calculate suitable reference state trajectories for the MPC. The use of reference trajectories for online-capable EMS algorithms is a well-documented technique (see, e.g., [28]). Typically, these approaches only encompass a reference for the battery. In order to ensure the possibility to aim at a user-defined long-term NO x eo target m ¯ NO x t , a NO x eo trajectory also needs to be included in this work. The RTG is a predictive algorithm, receiving long-term time-resolved predictive information for the power request of the entire driving mission. It consists of a map, denoted in Figure 11 by the block Map ¯ , which is defined on the ( P ¯ req v ¯ ) plane, and the COP . The map is used to estimate the time-resolved optimal driving mode M ¯ based on the predicted power request. The COP in the RTG is set up only once and solved prior to departure. The initialization of the dynamic states is performed by using the current battery SoC and m NO x , 0 = 0 (Equation (27c,f)). The terminal condition for the battery is set to be charge-sustaining (Equation (27d)), and the terminal condition for the cumulated NO x eo emissions is set to the user-defined long-term target m ¯ NO x t .
Algorithm 2 explains the procedure for obtaining reference trajectories. First, the algorithm is initialized with a user-defined NO x eo target and a critical power request ( P crit RTG ) (see Figure 10). After calculating the predicted power request for the entire driving mission, the COP is solved iteratively by using the estimated optimal driving mode, resulting from the current P crit RTG . If the optimal control problem can be solved while respecting the user-defined NO x eo , i.e., ϵ NO x RTG = 0 , the resulting optimal state trajectories are used as reference trajectories for the MPC. In most cases, only one iteration suffices. However, Equation (27g) is checked for slacking first. If this constraint requires slacking, then the resulting NO x eo trajectory does not satisfy the user-defined accumulated NO x eo target. If this trajectory were used as a reference for the MPC, the controller would track a NO x eo target, which is different from the user-defined target by design. If slacking is needed, P crit RTG is decreased for the next iteration. This allows one to use the series mode more often, allowing for more ultra-low NO x eo operating points of the H 2 ICE. During simulation, it was seen that decreasing P crit RTG below 40 kW did not lead to noticeable changes in the solution of the COP . It was, therefore, used as a termination criterion. If the termination criterion is met but slacking is still required, the resulting reference state trajectories are used. However, the NO x eo state trajectory is linearly scaled to m ¯ NO x t . Although such a post-processing results is an infeasible NO x eo state trajectory for the RTG, it can be feasible for the MPC, which calculates optimal solutions based on different predictive data.
Algorithm 2 RTG iterations.
1:
Initialize:
 
       m ¯ NO x t
 
       P crit RTG = 12,000 W
 
       ϵ NO x RTG = 1
2:
P ¯ req RTG Γ ¯ , v ¯
3:
while   ϵ NO x RTG 0 | P crit RTG > 40 kW  do
4:
     M map { P ¯ req , v ¯ }
5:
    { SoC RTG , m NO x RTG , ϵ NO x RTG } solve COP ( P ¯ req , M )
6:
    if  ϵ NO x RTG 0  then
7:
          P crit RTG = P crit RTG − 500 W
8:
    end if
9:
end while

5. Case Study

This section provides a case study on the performance of the MPC. To quantify the performance of controllers, the following relative performance criteria are used:
e NO x = 1 m NO x ( t f ) m ¯ NO x t ,
e SoC = 1 SoC ( t f ) SoC ( t 0 ) ,
e H 2 = m H 2 ( t f ) + Q 0 · ( SoC ( t f ) SoC ( t 0 ) ) η H 2 ICE const · η gen const · H l / m H 2 DP 1 .
The first two criteria, i.e., the NO x eo error ( e NO x ) and the SoC error ( e SoC ), quantify the violation of the user-defined NO x eo target and the charge sustainability constraint at the end of the driving mission, respectively. The corrected hydrogen error ( e H 2 ) denotes the additional fuel spent with respect to the DP-optimal result. To account for the additional energy stored in the battery at the end of the driving mission, the fuel consumption is corrected by using the lower heating value of hydrogen ( H l ), constant engine efficiency η H 2 ICE const = 35 %, and constant generator efficiency η gen const = 90 %.
For all results, the MPC’s prediction horizon is set to 450 s. The MPC’s update time is T s = 2 s. The map-based model is used as the vehicle plant.
Overall, after introducing the driving missions, the subsequent case study is built in three steps, which together form an inductive approach to analyze the proposed controller’s performance. First, the controller’s ability to adhere to a single NO x eo target is investigated on one specific driving mission. Second, on the same driving mission, the full range of achievable NO x eo targets is investigated. Third, the controller’s performance is analyzed for a broad range of different realistic driving missions.

5.1. Driving Missions

Figure 12 depicts the four driving missions that are used in the remainder of this text to test the performance of the suggested EMS algorithm. The first driving mission is extracted from the open-source software SUMO, v1.20.0 [29] and is referred to as urban cycle. The second driving mission is based on recorded sensor data of a real vehicle and features a mix of urban driving, rural driving, and highway driving and is referred to as real driving cycle. The third and fourth driving missions are generated from combinations of measured and simulated velocity profiles. They are used to represent extreme driving conditions and are referred to as mountain driving cycle and highway driving cycle.
The driving missions are visualized in Figure 12 over the travel distance s. The visualization includes three velocity trajectories for each mission in the upper plot and the elevation profile in the lower plot. The blue lines depict the actual vehicle speed v, which is interpreted as the driver’s request and is not known in advance by the MPC and the RTG. The red lines depict a predicted velocity ( v ^ ), which is available to the MPC. The dashed black lines depict a crude velocity estimation ( v ¯ ), which could represent, for instance, the legal speed limits.

5.2. Single-NO x eo -Target Adherence

First of all, the MPC’s ability to comply with a user-defined NO x eo target is analyzed. Here, two sources of disturbance are investigated. First, the model mismatch between the map-based model and the simplified model is always present. Second, the MPC relies on inaccurate predictive data. To distinguish between the performance losses resulting from either of the two disturbances, a Prescient MPC, which has access to the entire trajectory of the actual vehicle speed for the entire driving mission, is introduced. Together with the full elevation profile, the Prescient MPC, therefore, has perfect knowledge of the entire upcoming driving mission, which means that the only disturbance to this controller remains the model mismatch.
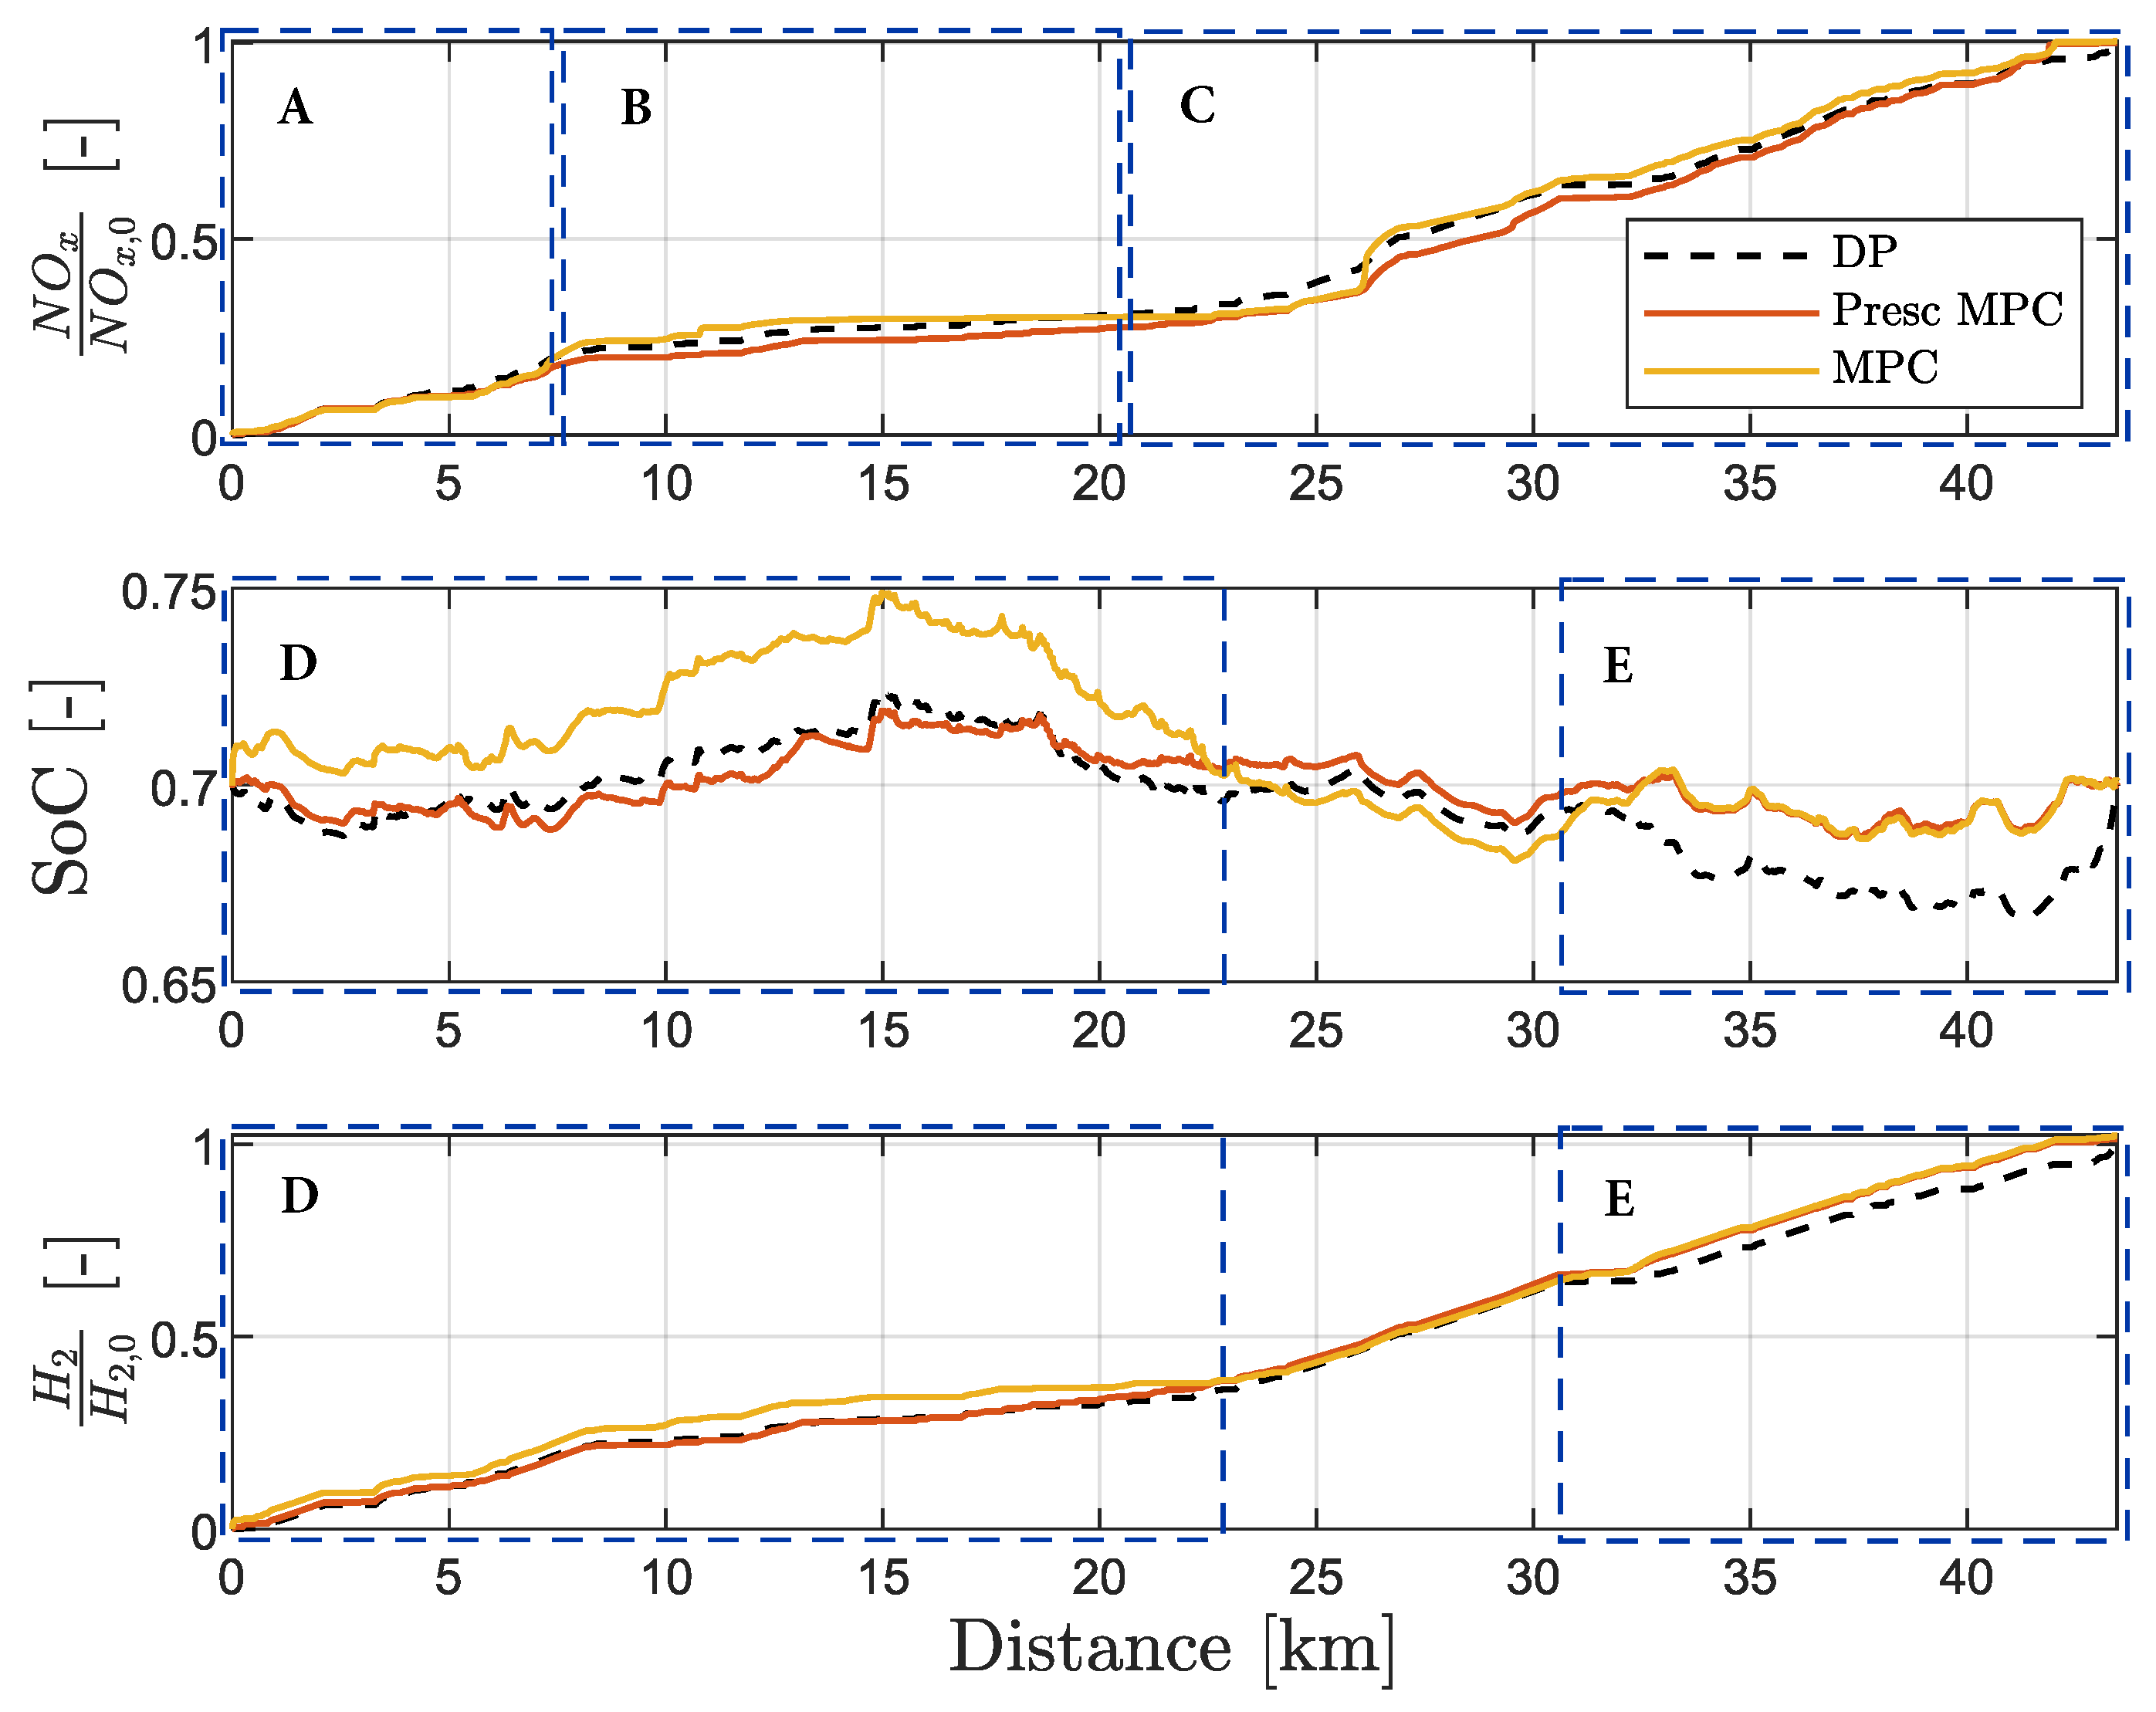
Figure 13 shows a comparison between the results obtained by the DP algorithm, the Prescient MPC, and the MPC on the real driving cycle. For all three methods, the same NO x eo target is chosen. The upper plot shows the accumulated NO x eo emissions, normalized by the amount achieved by the DP algorithm. Both MPC controllers are able to satisfy the NO x eo target. When looking at the three trajectories, it can be observed that all three methods have a similar way of distributing the NO x eo emissions across the driving mission: In time window A, the NO x eo emissions are comparably high. In time window B, all algorithms choose to emit less NO x eo emissions than in the first part of the driving mission. Finally, in time window C, all three algorithms show increased NO x eo emissions. The Prescient MPC yields a NO x eo error of 0.01 %, and the MPC yields a NO x eo error of 0.4 %. It is, therefore, concluded that realistic velocity mispredictions have a very low impact on satisfying the NO x eo target on this driving mission and for this specific NO x eo target.
The middle plot depicts the SoC trajectories. In time window D, the MPC chooses to divert from the SOC trajectory chosen by the DP algorithm and the Prescient MPC. This is a result of the mispredictions and its reduced prediction horizon. Even though, in time window E, both model predictive controllers choose a less aggressive use of the battery than the DP algorithm, both algorithms are able to operate the vehicle in charge-sustaining mode.
The bottom plot depicts the corrected hydrogen error of the three algorithms. Time windows D and E highlight the reflection of the algorithms’ different choices of battery usage in their corresponding hydrogen allocation strategy. If an algorithm chooses to charge the battery more than the DP algorithm, its hydrogen consumption is increased as a result of transferring energy from the hydrogen storage into the battery. Ultimately, both model predictive controllers result in close-to-optimal hydrogen consumption: the Prescient MPC reaches e H 2 = 1.3%, and the MPC reaches e H 2 = 2.3%. The slightly lower hydrogen consumption of the Prescient MPC is due to its access to perfect predictive data, which are leveraged to calculate a better estimation of the costates.
In this subsection, it was shown that the MPC is able to comply with one user-defined NO x eo target and satisfy charge-sustaining vehicle operation in the real driving cycle while reaching close-to-optimal hydrogen consumption. Moreover, the additional loss of optimality by using realistic predictive data instead of perfect predictive data is found to be marginal. The next step is to show that the proposed MPC is able to satisfy all physically possible choices of NO x eo targets, without the need to adjust or re-tune the controller.

5.3. NO x eo -Target Expansion

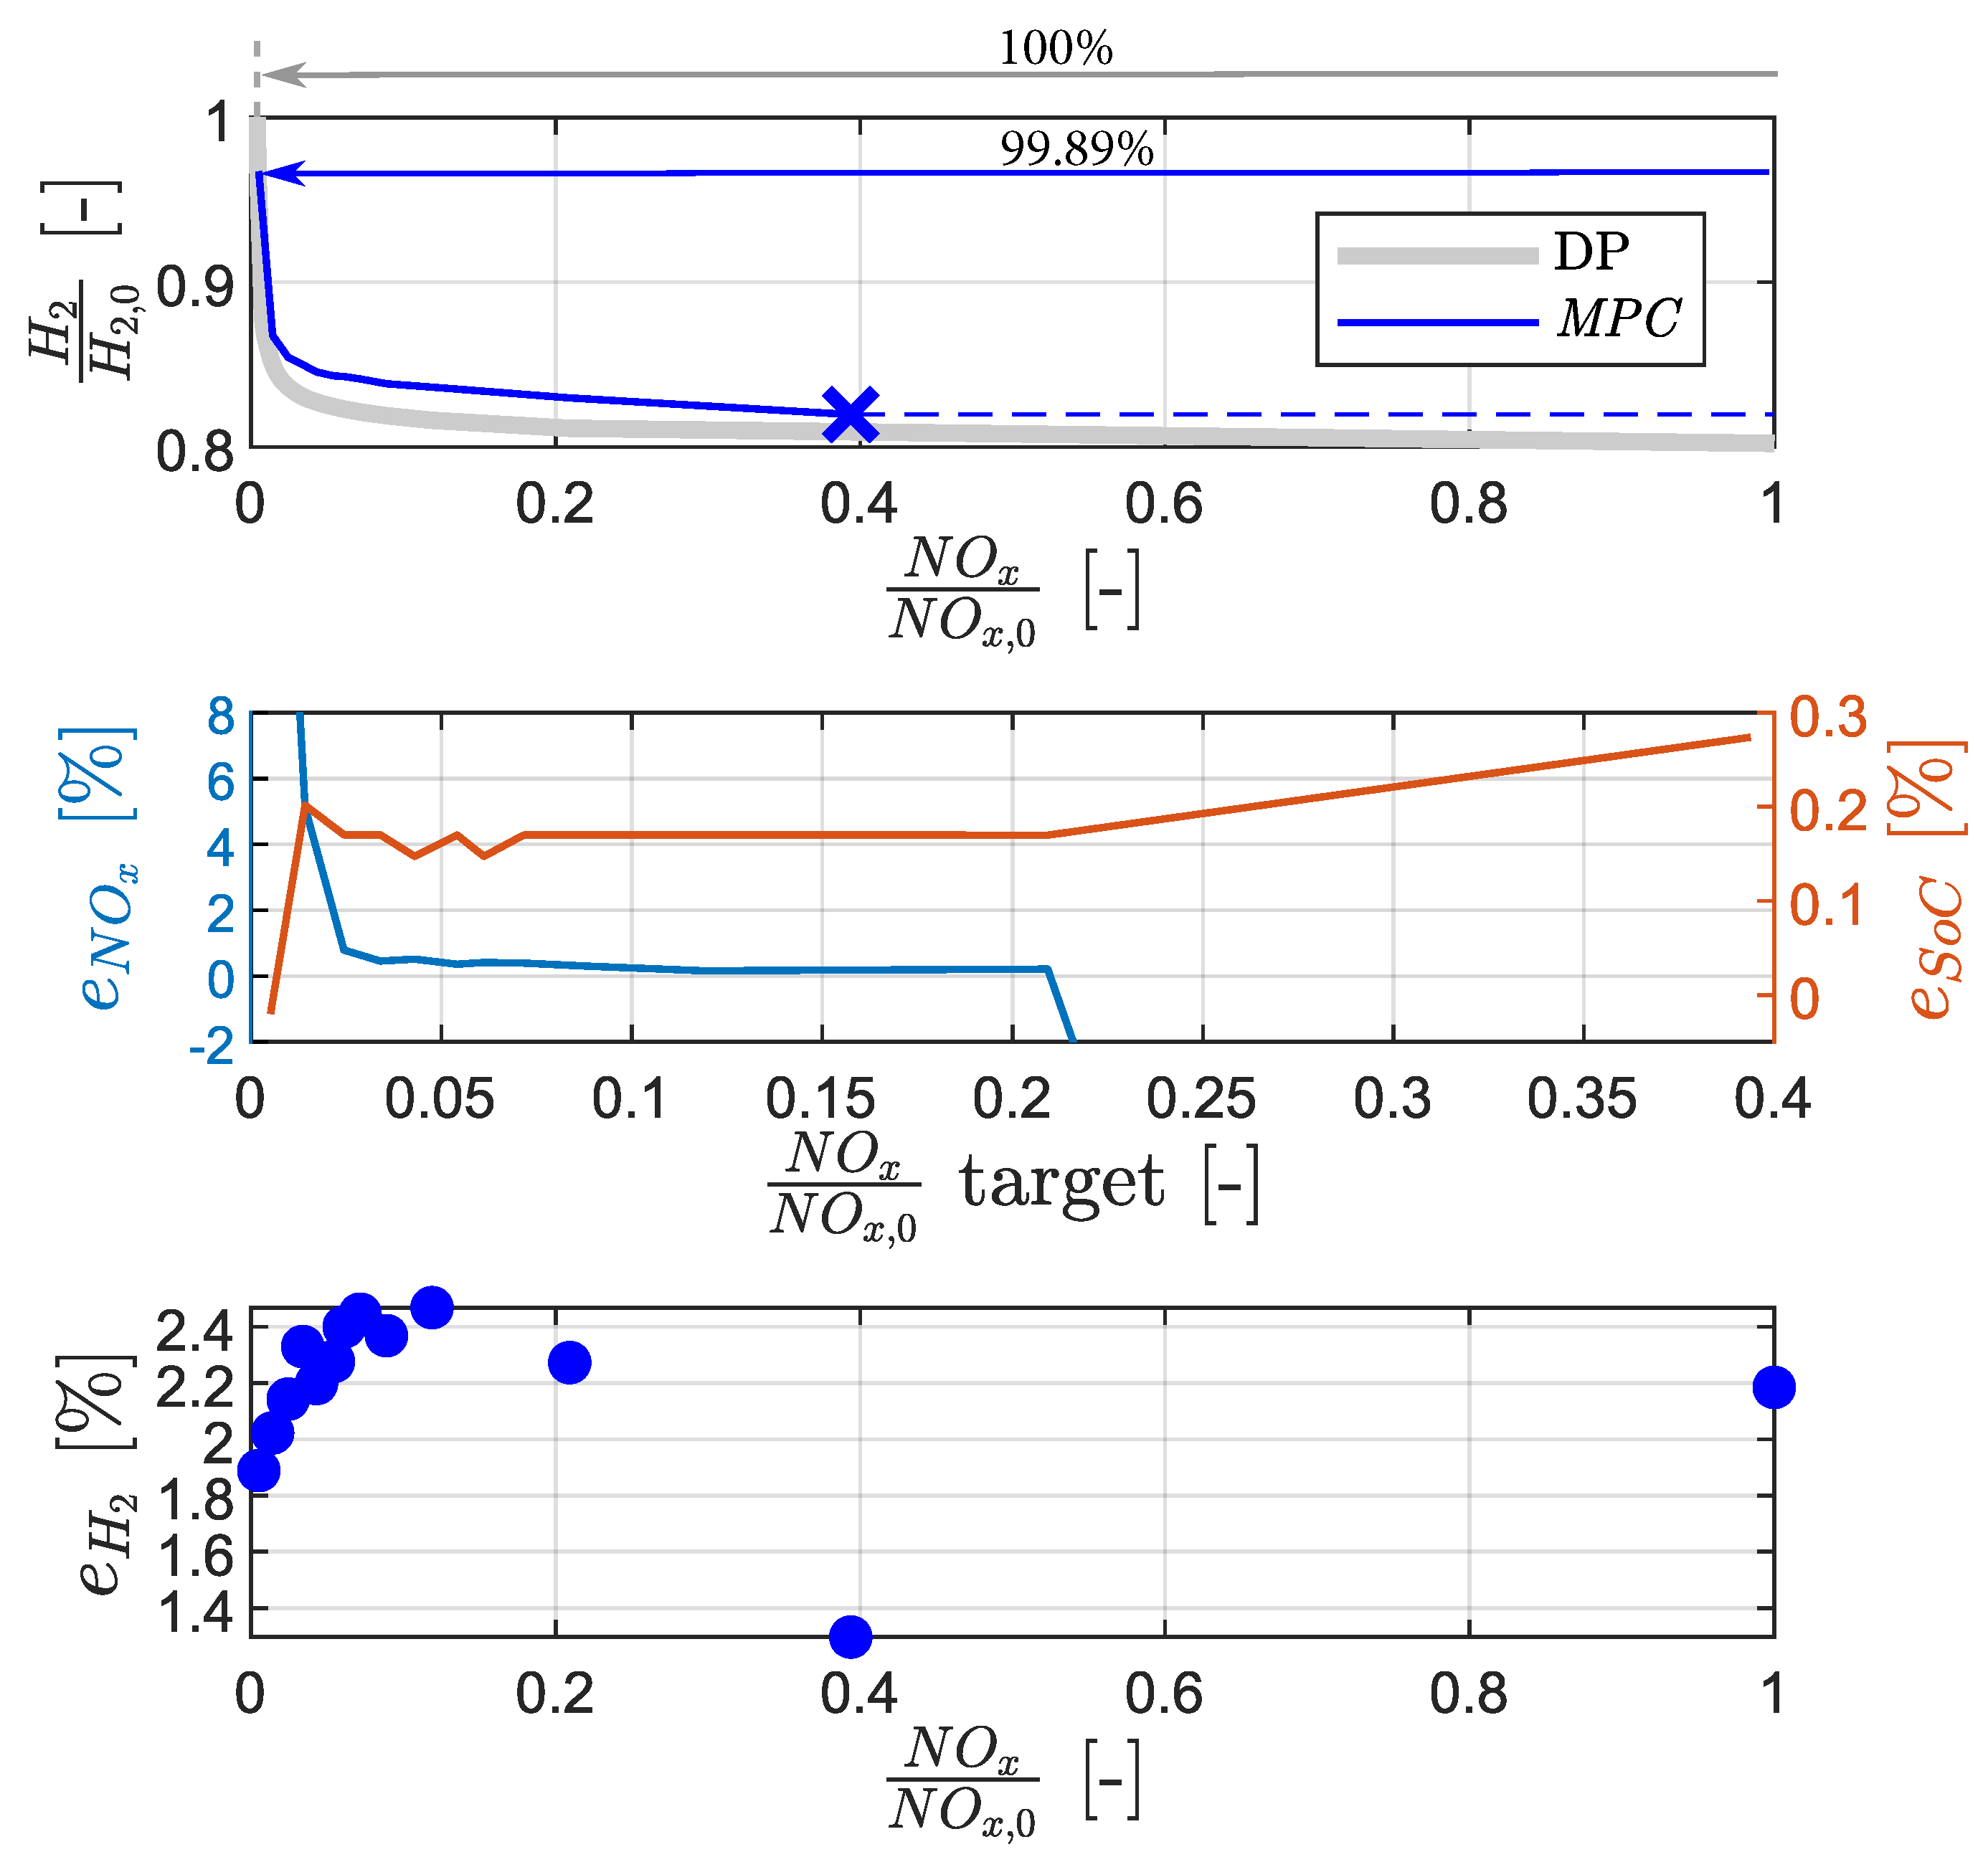
To investigate the ability of the MPC to reach different NO x eo targets, a simulation study is performed on the real driving cycle for varying NO x eo targets. Figure 14 includes a total of three plots, which are explained in detail in the following paragraphs.
The top plot shows the entire physically achievable H 2 -NO x eo Pareto front in gray. This is calculated offline, using the DP algorithm with perfect predictive data and the full map-based model. The gray arrow depicts the maximum amount of NO x eo reduction over the H 2 optimal solution calculated by the DP algorithm for this driving mission. It is defined as 100%. The blue curve depicts the performance achieved by the online-capable MPC, which is subject to model mismatch and mispredictions, as mentioned above. This curve will from now on be referred to as the MPC’s performance front. Its results are obtained by running twelve simulations on the real driving cycle with twelve different NO x eo targets spanning the entire Pareto front. The MPC is able to reproduce a large part of the offline achievable Pareto front, including extremely low NO x eo targets, recovering more than 99% of the NO x eo reduction potential over the H 2 -optimal solution. The dashed blue line is a horizontal extension of the point that is marked by a blue X. It serves as a visual aid and depicts a part of the Pareto front that cannot be reached by the MPC, even if the NO x eo target is set to a higher value. This is a result of the model mismatch which is introduced by using the simplified emission models, which underestimate NO x eo . However, as indicated by the DP-optimal Pareto front, there is an extremely flat trade-off between H 2 and NO x eo in this region. Consequently, the benefits in H 2 efficiency are offset by a significant surplus of NO x eo emissions.
The middle plot depicts the MPC’s NO x eo error and SoC error for all twelve iterations. The blue line is very steep when approaching the lowest NO x eo targets of the theoretically reachable Pareto front. This shows that more NO x eo is emitted by the MPC; thus, these targets cannot be achieved by the online-capable controller. However, already for the NO x eo target, which is only 1.4% of the maximum NO x eo emissions on this driving mission, the MPC’s NO x eo error is 5% and is well contained below 1% for higher NO x eo targets. The region of very high NO x eo targets is here visualized by the steeply declining error towards negative values, highlighting that the MPC cannot achieve extremely high NO x eo targets. This part corresponds to the region represented by the dashed blue line in the top plot.
The bottom plot shows the MPC’s corrected hydrogen consumption error for the different NO x eo targets. It shows that for the entire achievable Pareto front, the MPC is able to operate the vehicle with close-to-optimal hydrogen consumption.
In this subsection, it was shown that the MPC is able to achieve close-to-optimal hydrogen consumption consistently for a wide variety of NO x eo targets. Furthermore, the MPC can achieve almost the entire possible NO x eo reduction potential that was predicted by DP. This shows that the MPC is able to reproduce almost the entire H 2 -NO x eo Pareto front on the real driving cycle. To conclude the case study, it remains to be shown whether these results can be generalized to other driving missions.

5.4. Driving Mission Generalization

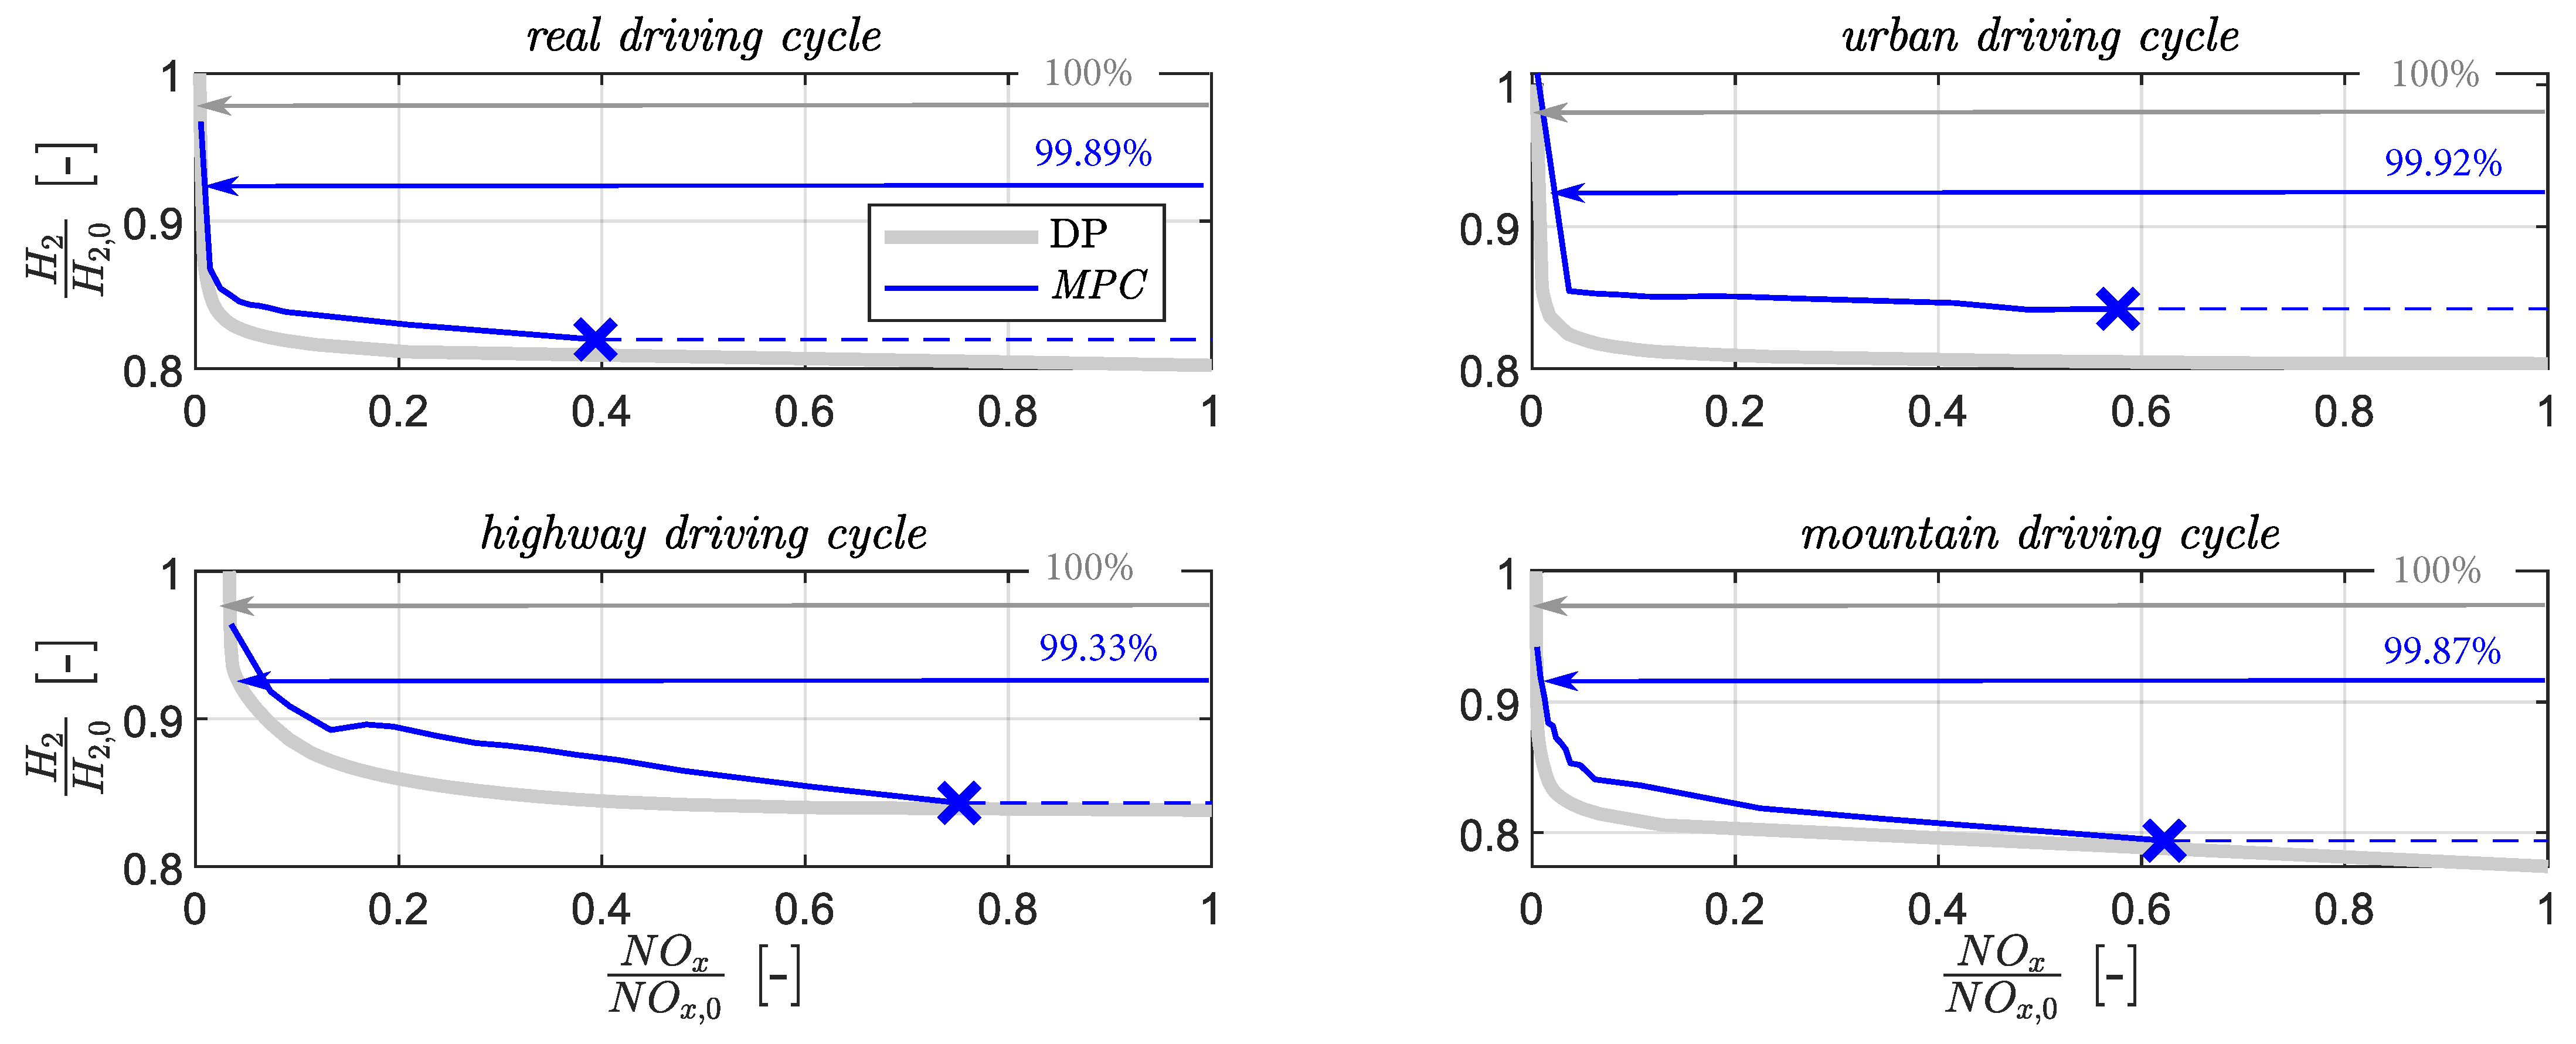
In the following, the MPC’s ability to reproduce the H 2 -NO x eo Pareto front is presented for a broad range of driving missions. Figure 15 depicts the comparison between the offline calculated DP-optimal Pareto fronts and the MPC’s online calculated performance fronts obtained for the urban driving mission, the mountain driving mission, and the highway driving mission. For the sake of comparison, the results obtained for the real driving mission are also included. The gray lines depict the entire, physically achievable H 2 -NO x eo Pareto front, calculated by the DP algorithm with perfect predictive data and the full map-based model. The blue curves represent the performance fronts achieved by the online-capable MPC, which is subject to model mismatch, as well as mispredictions. Its results are obtained by running multiple simulations on the corresponding drive mission but with different NO x eo targets.
On all four driving missions, the MPC is able to reach extremely low NO x eo emissions, recovering more than 99% of the NO x eo reduction potential over the H 2 -optimal solution. It cannot capture the theoretically possible EMS calibrations to the far right-hand side of the Pareto front which result in the lowest possible H 2 consumption. However, as indicated by the DP-optimal Pareto fronts, there is an extremely flat trade-off between H 2 and NO x eo for all investigated driving missions in this region. Consequently, the benefits in H 2 efficiency are offset by a significant surplus of NO x eo emissions.
Table 2 summarizes the MPC’s performance fronts for all investigated driving missions. The two columns e H 2 mean and e H 2 max represent the mean and the maximum values, respectively, of all the e H 2 resulting from the simulation on the corresponding driving mission and the individual NO x eo targets. Two things can be noted here: First, in all four driving missions, the maximum hydrogen error is close to the mean hydrogen error. This suggests that variance in the controller performance can be characterized as low. Second, across all four driving missions, the mean hydrogen error is similar. This suggests that the controller performance is similarly consistent across different driving missions. Overall, these results show that the proposed MPC is able to provide predictable, close-to-optimal hydrogen consumption for a wide variety of driving missions and for almost the entire physically reachable range of H 2 -NO x eo trade-off.

6. Conclusions

To the authors’ best knowledge, this paper provides the first results of an online-capable control algorithm for the EMS of a H 2 -HEV explicitly including NO x eo emissions. The algorithm is based on a multi-level control approach and features a supervisory MPC algorithm, which solves a convex optimization problem. The proposed controller is evaluated in a case study, comprising three levels of complexity: First, the controller is shown to be able to satisfy a user-defined NO x eo target while operating the vehicle in charge-sustaining mode and achieving close-to-optimal hydrogen consumption. Second, the controller is shown to be able to extend its close-to-optimal hydrogen consumption to a wide range of different NO x eo targets. Third, it is shown that the proposed controller exhibits predictable performance for a wide variety of driving missions. In all tested scenarios, an increase of 4.66% at most in hydrogen consumption is observed compared with the globally optimal solution. More importantly, for each driving mission, more than 99% of the possible NO x eo reduction potential can be reached by the online-capable MPC controller. In summary, this means that the proposed controller can almost fully exploit the theoretical potential of an H 2 -HEV regarding the H 2 -NO x eo trade-off.
It is important to emphasize that the obtained NO x eo stem from a map, which is derived from steady-state measurements. While these maps can predict the NO x eo emissions of an H 2 ICE well during steady-state operation, higher NO x eo emissions may occur during transient operating point switches of the H 2 ICE. Therefore, no statements regarding compliance with legislative limits should be made.
In future research, the development and inclusion of an additional dynamic NO x eo emission model and its inclusion in the MPC could be looked into. Also, the possibility to adjust the H 2 -NO x eo trade-off online could lead to changed requirements for the exhaust gas aftertreatment system. This could create an avenue for exploring the optimization of EMS calibration in conjunction with the design and operation of the exhaust gas aftertreatment system.

Author Contributions

Conceptualization, D.M., N.Y., T.H. and C.O.; methodology, D.M., N.Y. and T.H.; software, D.M. and N.Y.; validation, D.M.; writing—original draft preparation, D.M.; writing—review and editing, D.M. and F.W.; visualization, D.M. and F.W.; supervision, C.O. All authors have read and agreed to the published version of the manuscript.

Funding

This research received no external funding.

Data Availability Statement

The original contributions presented in the study are included in the article, further inquiries can be directed to the corresponding authors.

Conflicts of Interest

Author Thomas Huber was employed by the company Robert Bosch GmbH. The remaining authors declare that the research was conducted in the absence of any commercial or financial relationships that could be construed as a potential conflict of interest.

Abbreviations

The following abbreviations are used in this manuscript:
CO 2     carbon dioxide
COP convex optimization problem
DPdynamic programming
EMSenergy management system
EUEuropean Union
EVelectric vehicle
GBgearbox
H 2 hydrogen
H 2 ICEhydrogen combustion engine
HEVhybrid electric vehicle
MPCmodel predictive control
NO x nitrogen oxides
NO x eo engine-out nitrogen oxides
OCPoptimal control problem
PMPPontryagin’s minimum principle
PRpower request (block diagram schematic)
RTGreference trajectory generator
SoCstate of charge

References

  1. IEA. CO2 Emissions in 2022; International Energy Agency: Paris, France, 2022. [Google Scholar]
  2. EPA. epa.gov. 2021. Available online: https://www.epa.gov/regulations-emissions-vehicles-and-engines/final-rule-revise-existing-national-ghg-emissions (accessed on 8 June 2023).
  3. EU Regulation. Regulation (EU) 2019/631 of the European Parliament and of the Council of 17 April 2019 Setting CO2 Emission Performance Standards for New Passenger Cars and for New Light Commercial Vehicles, and Repealing Regulations (EC) No 443/2009 and (EU) No 510/2011. 2019. Available online: https://eur-lex.europa.eu/legalcontent/EN/TXT (accessed on 10 January 2024).
  4. IEA. Global EV Outlook 2023; International Energy Agency: Paris, France, 2024. [Google Scholar]
  5. Hänggi, S.; Elbert, P.; Bütler, T.; Cabalzar, U.; Teske, S.; Bach, C.; Onder, C. A review of synthetic fuels for passenger vehicles. Energy Rep. 2019, 5, 555–569. [Google Scholar] [CrossRef]
  6. Hassan, Q.; Azzawi, I.D.; Sameen, A.Z.; Salman, H.M. Hydrogen Fuel Cell Vehicles: Opportunities and Challenges. Sustainability 2023, 15, 11501. [Google Scholar] [CrossRef]
  7. Lider, A.; Kudiiarov, V.; Kurdyumov, N.; Lyu, J.; Koptsev, M.; Travitzky, N.; Hotza, D. Materials and techniques for hydrogen separation from methane-containing gas mixtures. Int. J. Hydrogen Energy 2023, 48, 28390–28411. [Google Scholar] [CrossRef]
  8. Sementa, P.; de Vargas Antolini, J.B.; Tornatore, C.; Catapano, F.; Vaglieco, B.M.; Sánchez, J.J.L. Exploring the potentials of lean-burn hydrogen SI engine compared to methane operation. Int. J. Hydrogen Energy 2022, 47, 25044–25056. [Google Scholar] [CrossRef]
  9. Zhao, F.C.; Sun, B.G.; Yuan, S.; Bao, L.Z.; Wei, H.; Luo, Q.H. Experimental and modeling investigations to improve the performance of the near-zero NOx emissions direct-injection hydrogen engine by injection optimization. Int. J. Hydrogen Energy 2023, 49, 713–724. [Google Scholar] [CrossRef]
  10. Güler, İ.; Kılıçaslan, A.; Küçük, T.; Corsini, D. Transient and altitude performance analysis of hydrogen fuelled internal combustion engines with different charging concepts. Int. J. Hydrogen Energy 2023, 49, 1112–1122. [Google Scholar] [CrossRef]
  11. Bao, L.Z.; Sun, B.G.; Luo, Q.H. Experimental investigation of the achieving methods and the working characteristics of a near-zero NOx emission turbocharged direct-injection hydrogen engine. Fuel 2022, 319, 123746. [Google Scholar] [CrossRef]
  12. Sciarretta, A.; Back, M.; Guzzella, L. Optimal control of parallel hybrid electric vehicles. IEEE Trans. Control. Syst. Technol. 2004, 12, 352–363. [Google Scholar] [CrossRef]
  13. Ambühl, D. Energy Management Strategies for Hybrid Electric Vehicles. Ph.D. Thesis, ETH Zurich, Zürich, Switzerland, 2009. [Google Scholar]
  14. Machacek, D.T.; Barhoumi, K.; Ritzmann, J.M.; Huber, T.; Onder, C.H. Multi-level model predictive control for the energy management of hybrid electric vehicles including thermal derating. IEEE Trans. Veh. Technol. 2022, 71, 10400–10414. [Google Scholar] [CrossRef]
  15. Hu, Q.; Amini, M.R.; Kolmanovsky, I.; Sun, J.; Wiese, A.; Seeds, J.B. Multihorizon model predictive control: An application to integrated power and thermal management of connected hybrid electric vehicles. IEEE Trans. Control. Syst. Technol. 2021, 30, 1052–1064. [Google Scholar] [CrossRef]
  16. Ritzmann, J.; Peterhans, C.; Chinellato, O.; Gehlen, M.; Onder, C. Model Predictive Supervisory Control for Integrated Emission Management of Diesel Engines. Energies 2022, 15, 2755. [Google Scholar] [CrossRef]
  17. Kyjovskỳ, Š.; Vávra, J.; Bortel, I.; Toman, R. Drive cycle simulation of light duty mild hybrid vehicles powered by hydrogen engine. Int. J. Hydrogen Energy 2023, 48, 16885–16896. [Google Scholar] [CrossRef]
  18. Machacek, D.T.; Ozan, N.; Huber, T.; Onder, C.H. Energy Management of Hydrogen Hybrid Electric Vehicles—A Potential Study. arXiv 2023, arXiv:2309.09804. [Google Scholar]
  19. Hannah, L.A.; Dunson, D.B. Multivariate convex regression with adaptive partitioning. J. Mach. Learn. Res. 2013, 14, 3261–3294. [Google Scholar]
  20. Machacek, D.T.; van Dooren, S.; Huber, T.; Onder, C.H. Learning-Based Model Predictive Control for the Energy Management of Hybrid Electric Vehicles Including Driving Mode Decisions. IEEE Trans. Veh. Technol. 2023, 73, 5113–5127. [Google Scholar] [CrossRef]
  21. Kerrigan, E.C.; Maciejowski, J.M. Soft Constraints and Exact Penalty Functions in Model Predictive Control. In Proceedings of the United Kingdom Automatic Control Council (UKACC) International Conference on Control, Cambridge, UK, 6–8 July 2000. [Google Scholar]
  22. Murgovski, N.; Johannesson, L.; Hu, X.; Egardt, B.; Sjöberg, J. Convex relaxations in the optimal control of electrified vehicles. In Proceedings of the 2015 American control conference (ACC), Chicago, IL, USA, 1–3 July 2015; pp. 2292–2298. [Google Scholar]
  23. Lofberg, J. YALMIP: A toolbox for modeling and optimization in MATLAB. In Proceedings of the 2004 IEEE International Conference on Robotics and Automation (IEEE Cat. No. 04CH37508), Taipei, Taiwan, 2–4 September 2004; pp. 284–289. [Google Scholar]
  24. MOSEK ApS. The MOSEK Optimization Toolbox for MATLAB Manual; Version 9.0.; MOSEK ApS: Copenhagen, Denmark, 2019. [Google Scholar]
  25. Guzzella, L.; Sciarretta, A. Vehicle Propulsion Systems; Springer: Berlin/Heidelberg, Germany, 2013; Volume 3. [Google Scholar]
  26. Boltyanskiy, V.; Gamkrelidze, R.; Mishchenko, Y.; Pontryagin, L. Mathematical Theory of Optimal Processes; John Wiley & Sons: Hoboken, NJ, USA, 1962. [Google Scholar]
  27. Kim, N.; Cha, S.; Peng, H. Optimal control of hybrid electric vehicles based on Pontryagin’s minimum principle. IEEE Trans. Control. Syst. Technol. 2010, 19, 1279–1287. [Google Scholar]
  28. Ambuhl, D.; Guzzella, L. Predictive reference signal generator for hybrid electric vehicles. IEEE Trans. Veh. Technol. 2009, 58, 4730–4740. [Google Scholar] [CrossRef]
  29. Behrisch, M.; Bieker, L.; Erdmann, J.; Krajzewicz, D. SUMO–simulation of urban mobility: An overview. In Proceedings of the SIMUL 2011, The Third International Conference on Advances in System Simulation. ThinkMind, Barcelona, Spain, 23–29 October 2011. [Google Scholar]
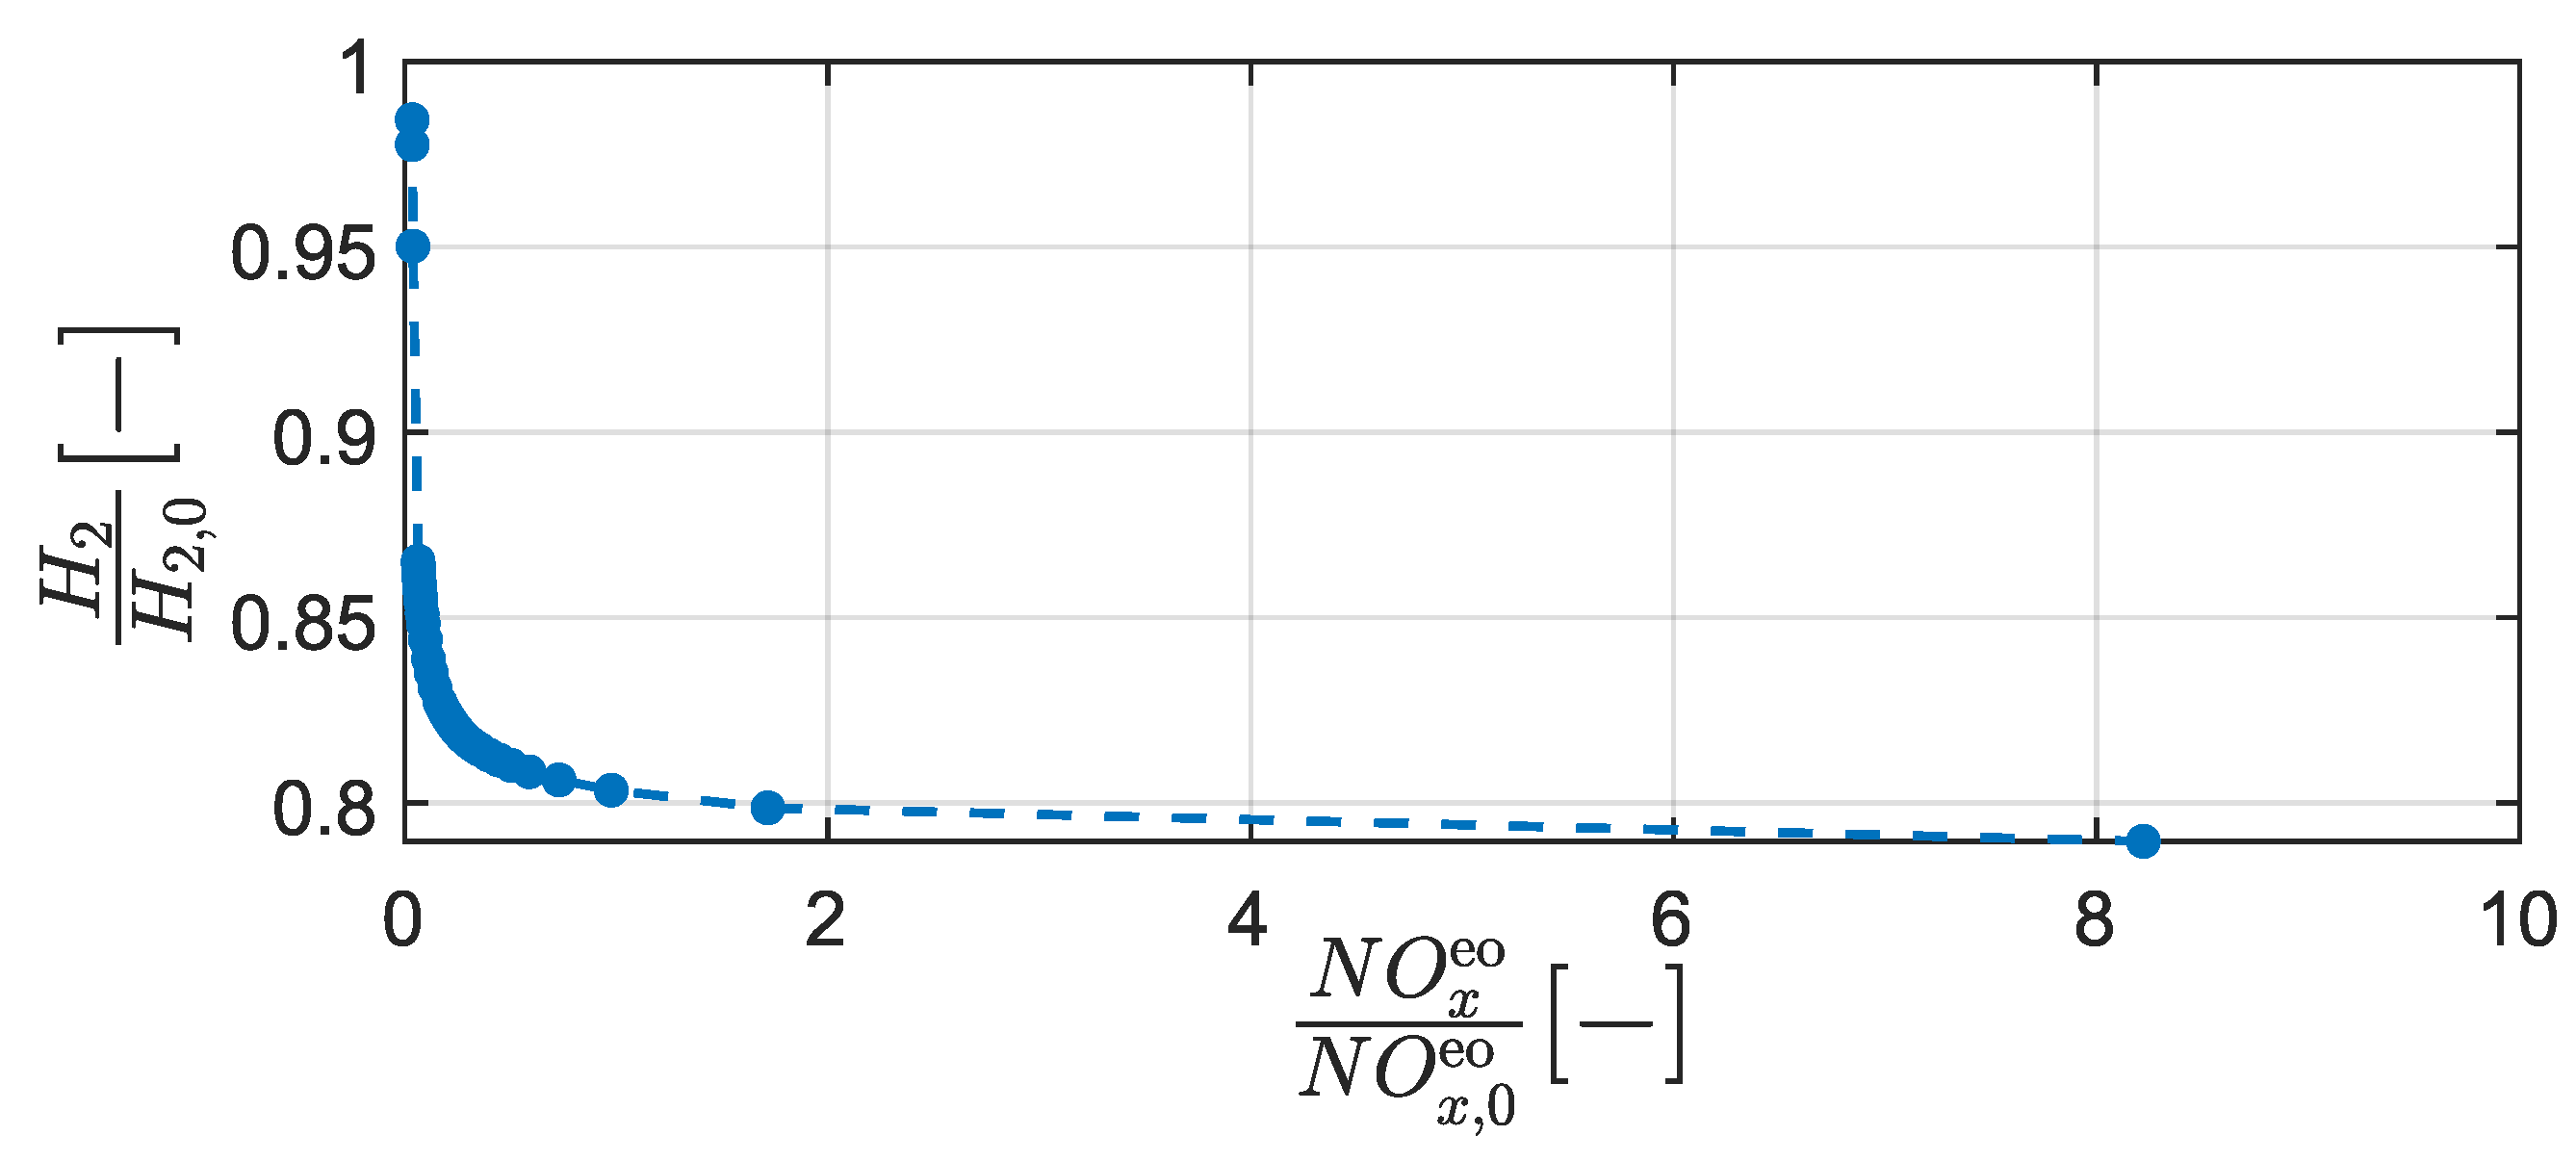
Figure 1. A Pareto curve representing the H 2 -NO x eo trade-off of a series H 2 -HEV.
Energies 17 02369 g001
Figure 2. A schematic of the mixed H 2 -HEV drivetrain considered in this paper. The double-bar lines indicate a mechanical connection. The single-bar lines indicate electrical connections.
Energies 17 02369 g002
Figure 3. A schematic overview of the power flows in the mixed H 2 -HEV. The double-bar lines indicate a mechanical connection. The single-bar lines indicate electrical connections.
Energies 17 02369 g003
Figure 4. Comparison between the map-based model and the simplified model for the hydrogen consumption in parallel mode.
Energies 17 02369 g004
Figure 5. Comparison between the map-based model and the simplified model for the electric motor losses and the generator losses in parallel mode evaluated at ω gen = 4000 rpm and ω mot = 4000 rpm.
Energies 17 02369 g005
Figure 6. Comparison between the map-based model and the simplified model for the NO x eo emissions in parallel mode.
Energies 17 02369 g006
Figure 7. (Upper plot) Comparison between the map-based model and the simplified model for the hydrogen consumption in series mode. (Lower plot) Comparison between the map-based model and the simplified model for the generator source power in series mode.
Energies 17 02369 g007
Figure 8. Comparison between the map-based model and the simplified model for the NO x eo emissions in series mode.
Energies 17 02369 g008
Figure 9. Comparison between the map-based and the simplified models. The black trajectories are used as inputs. The resulting state trajectories of the map-based and the simplified models are visualized with red and green lines, respectively.
Energies 17 02369 g009
Figure 10. Optimal driving mode distribution for the mixed H 2 -HEV, obtained with the DP algorithm.
Energies 17 02369 g010
Figure 11. Schematic illustration of the multi-level controller structure consisting of three controller levels: RTG, MPC, and lower-level controller.
Energies 17 02369 g011
Figure 12. Driving missions investigated in the case study. The blue velocity lines are the actual driving missions. The red lines are predicted signals, which are available to the MPC. The black lines are crude velocity predictions, which are available to the RTG.
Energies 17 02369 g012
Figure 13. The performance analysis of the MPC for one NO x eo target for the real driving cycle.
Energies 17 02369 g013
Figure 14. The performance analysis of the MPC for the entire reachable H 2 -NO x eo performance front for the real driving cycle.
Energies 17 02369 g014
Figure 15. The performance analysis of the MPC with a focus on the H 2 -NO x eo performance front on all four driving missions.
Energies 17 02369 g015
Table 1. Driving modes of the mixed H 2 -HEV investigated in this paper.
Series modeH 2 ICE = ONclutch = OPEN M = 1
Parallel modeH 2 ICE = ONclutch = CLOSED M = 2
EV modeH 2 ICE = OFFclutch = OPEN M = 3
Table 2. Key characteristics regarding the hydrogen consumption of the MPC over its entire performance front.
e H 2 mean e H 2 max
Real driving mission2.18%2.47%
Urban driving mission4.66%5.13%
Mountain driving mission3.79%6.62%
Highway driving mission4.15%6.91%
Disclaimer/Publisher’s Note: The statements, opinions and data contained in all publications are solely those of the individual author(s) and contributor(s) and not of MDPI and/or the editor(s). MDPI and/or the editor(s) disclaim responsibility for any injury to people or property resulting from any ideas, methods, instructions or products referred to in the content.