Article

From Retrofitting to Renewables: Navigating Energy Transition Pathways for European Residential Space Heating

by
Steven S. Salim
1,2,*,
Stefan L. Luxembourg
1,
Francesco Dalla Longa
1,2 and
Bob van der Zwaan
1,2,3,*
1
TNO Energy Transition Studies, 1043 NT Amsterdam, The Netherlands
2
Faculty of Science, University of Amsterdam, 1098 XH Amsterdam, The Netherlands
3
School of Advanced International Studies, Johns Hopkins University, 40126 Bologna, Italy
*
Authors to whom correspondence should be addressed.
Energies 2024, 17(10), 2363; https://doi.org/10.3390/en17102363
Submission received: 5 April 2024 / Revised: 3 May 2024 / Accepted: 7 May 2024 / Published: 14 May 2024
(This article belongs to the Section C: Energy Economics and Policy)

Abstract

:
Transformative actions are crucial across all sectors emitting greenhouse gases. Nonetheless, energy transition research to date displays a notable imbalance, with a larger emphasis on the supply side than on the demand side. The present study addresses this inequity by focusing on residential sector space heating demand, a frequently overlooked energy service that currently contributes substantially to global greenhouse gas emissions. Our primary objective is to pinpoint effective climate policies and space heating strategies that align with the EU’s ambitious targets for emission reduction. We employ the recently developed TIMES-Europe model to conduct a comprehensive analysis of the residential sector’s policy frameworks, technological advancements, and associated costs. This analysis aims to determine the measures necessary to meet ambitious climate objectives within the European context. To achieve this, we formulate four distinct scenarios, each representing varying levels of ambition and collaboration among EU member states, thereby providing insight into the pathways toward achieving these targets. By implementing current intended EU policies on the renovation of dwellings, we project a substantial reduction of at most 850 PJ, or, i.e., a 19% decrease, in yearly energy demand for space heating between 2020 and 2050. In contrast, if the recent pace of dwelling renovation within the EU were to continue, space heating energy savings from renovation would only amount to less than 400 PJ/yr (i.e., a 9% reduction) in the same period. In our more ambitious climate scenarios, phasing out fossil fuels leads to widespread electrification of the European residential sector, and by 2050, electricity from heat pumps and electric boilers accounts for over 68% of the total residential sector space heating demand. The outcomes of our study underline the importance of implementing the currently planned EU policies. We also demonstrate the necessity for collaboration among EU member states in order to attain the common European climate targets under the most effective resource allocation.

1. Introduction

The accumulation of greenhouse gases (GHGs) in the atmosphere is the main origin of the global temperature rise observed over the last 150 years [1]. The ramifications of the ensuing climate crisis are already observable at present, affecting all economic sectors as well as individuals [2]. The unprecedented threat from the growing climate crisis requires concerted global efforts to drastically reduce GHG emissions in all sectors. Yet, energy transition studies exhibit an imbalance in their coverage, with a stronger emphasis on the supply side (i.e., production of electricity and fuels) than on the demand side (i.e., energy consumption in the residential, commercial, and transport sectors) [3].
To address the underreporting of the demand side in energy transition studies to date, this paper presents an in-depth analysis of space heating in the European residential sector. Space heating is responsible for a large share of energy demand in dwellings, with significant environmental repercussions and notable potential for GHG emissions reduction. In 2020, European residential space heating constituted around 65% of the total energy service demand, amounting to about 6500 PJ [4]. The primary energy sources used to meet this demand were natural gas (34%), biomass (21%), electricity (17%), direct heat (14%), liquids (11%), and solid (3%) fossil fuels [5]. These energy sources collectively resulted in 313 million metric tons of CO2 equivalents (313 MtCO2eq) of GHG emissions [6].
Several studies have investigated possible decarbonization pathways for the European residential sector [7,8,9,10,11,12,13,14,15]. For instance, the analysis by [12] focuses on energy efficiency investment decisions in the EU residential sector, considering the market and non-market barriers, policy instruments, and consumer behaviors. The analysis by [13] shows the impact of the EU decarbonization policy in Central, Southern, and Eastern Europe, while [14,15] focus on the EU decarbonization policy implications at the country level. The above-mentioned studies reveal a gap in the current literature—a misalignment between the scope of EU policies and the regions under investigation. This disparity often results in inconsistencies between analyses of regional scenarios and overarching EU policies on the one hand and those focusing primarily on pathways for individual EU member states on the other hand. To fill these research gaps, we propose additional literature that scrutinizes policy at a regional level (i.e., EU27 and the UK) while ensuring a sufficient level of detail in the analysis of policy implications at the country level. Among others, this approach enables us to explore the diverse trajectories from varying degree of collaboration among EU member states.
In the present paper, we examine the aforementioned subject from a pan-European perspective, recognizing the significant impact of the EU on the formulation of climate policies worldwide [3,16]. Under the European climate law, EU countries are obliged to cut GHG emissions in 2030 by at least 55% in comparison to those in 1990 (see, e.g., the Fit for 55 initiative [17]) and become climate-neutral societies by 2050 (as stipulated in the European Green Deal [18]). Despite these ambitious aspirations for achieving net-zero GHG emissions in 2050, the European residential sector faces multiple challenges regarding the pathway toward this goal. These challenges encompass the diversity in energy portfolios, mitigation potentials, and socio-economic contexts across European countries [19,20], variations in dwelling conditions [21], and differences in resource allocation priorities of individual EU member states [22]. Adequately navigating these challenges is crucial to effectively drive the energy transition and achieve sustainable outcomes across the entire European residential sector.
At the European level, several proposals have been made for policies and strategies aimed at unlocking the GHG emissions reduction potential within the residential sector. These initiatives encompass, for instance, the EU Energy Efficiency Directive [23], the EU Energy Performance of Buildings Directive (EPBD) [24], and the EU energy savings strategy recently reinforced in the REPowerEU plan [25]. These policies generally adopt a twofold strategy. First, they promote accelerating the annual renovation rate of dwellings by advancing, e.g., thermal insulation for dwellings, thereby reducing energy demand from residential buildings [26]. This forms a critical step toward greater energy conservation. Second, they target technology efficiency improvements, such as the adoption of high-efficiency boilers for space heating and efficiency optimization of various household appliances. As the 2030 milestone year for current climate targets rapidly approaches, it is crucial to advocate for appropriate new short- and long-term climate policies and challenge inadequate existing ones.
Our primary goal in this study is to identify and evaluate suitable climate policies for the European residential sector. Focusing on residential space heating, we offer a comprehensive analysis of the intricate relationship between policies, technologies, and system expenditures needed to achieve the ambitious climate targets of the EU. For our analysis, we use TIMES-Europe, a newly developed European energy system model, which allows for assessing and gauging the efficacy of energy and climate policies in Europe. TIMES-Europe incorporates a detailed bottom-up representation of technology, which we consider essential for thoroughly investigating potential energy transition pathways. Additionally, it facilitates a comprehensive assessment of the effectiveness of the EU’s energy and climate policies. The model covers all EU countries with sufficient per-country detail, allowing us to examine policy implementation and its implications on both a country-by-country basis and for the EU as a whole. The methodology of energy system modeling with the newly developed TIMES-Europe model is explained in Section 2, which provides the modeling details most relevant to our study. We present our main results in Section 3 and discuss our insights, based on these findings, in Section 4. In Section 5, we draw some overall conclusions and formulate several recommendations for future research.

2. Methodology and Scenario Description

We provide a concise description of the TIMES-Europe model, focusing particularly on its representation of the residential sector. Detailed information about the other sectors in the model, as well as its core set up and functioning, can be found in Luxembourg et al. [27]. TIMES-based models are well-established tools to study long-term energy transition scenarios [28] that have been amply reported in scientific publications, including some by ourselves, as attested, for instance, with studies on the potential for geothermal energy deployment in Europe [29], on electricity and hydrogen trade between Europe and North Africa [30], and the impact of innovation on CCS deployment in Europe [31]. Other energy systems research with TIMES-based models include, for example, a study on the potential of sector coupling in projections for the European energy system [32], an examination of the influence of variable renewable energy options in long-term energy scenarios for Norway [33], and an analysis of decarbonization strategies for light-duty passenger vehicles in Ireland [34].
TIMES-Europe calculates the least-cost European energy system under multiple exogenous constraints and conditions. These may include, among others, energy policies, energy supply availabilities, energy demand projections, and emission reduction targets. In the current version, the geographical scope of TIMES-Europe encompasses the 27 member states of the European Union plus the UK and represents energy generation in all main supply sectors (i.e., the power, heat, and upstream sectors) and energy consumption in all main demand sectors (i.e., the transport, residential, commercial, agricultural, and industrial sectors). TIMES-Europe matches supply and demand on a yearly basis between 2015 and 2100, in time steps of 5 to 10 years. For some technologies, this match is performed on the level of sub-annual timeslices in order to capture the main variations in seasonal and daily energy production and consumption patterns. In the current version of TIMES-Europe, the residential module operates on a yearly basis.

2.1. TIMES-Europe Residential Sector

The schematic for the residential sector in TIMES-Europe is depicted in Figure 1. Population growth projections serve as the primary exogenous driver to quantify the size of the future dwelling stock, as expressed in Equation (1) as follows:
Dwelling   Stock year   x = Dwelling   Stock   year   x - 1 × Population year   x   Population year   x - 1 Decoupling   factor
Equation (1) is used to generate country-level projections of dwelling stock between 2015 and 2050. As described in [27], population projections are taken from Eurostat [35], and the exponent in the equation (decoupling factor) is used to adjust how readily the dwelling stock reacts to changes in population.
We estimate the requirements for space heating per dwelling (SH) through a simultaneous bottom-up and top-down approach, which we developed based on [27,36]. We employ the physical characteristics of the European dwelling stocks, categorizing residential dwellings into three dwelling archetypes (i.e., detached houses, semi-detached houses, and apartments), and seven construction periods (i.e., pre-1945, 1945–1969, 1970–1979, 1980–1989, 1990–1999, 2000–2009, and 2010–2015). Older dwellings (i.e., pre-1945 and 1945–1969), if not renovated, typically require more energy to provide adequate space heating in comparison to more recent dwellings due to the usually lower insulation quality of the envelope [37].
To calculate SH, first, we define a dwelling constant that represents the energy needed to reach the base temperature of 18 °C, following the Eurostat convention [38], calculated using Equation (2) as follows:
Dwelling   Constant   a ,   p   W   = DE U-Value DE W m 2   temp ×   Surface   Area DE m 2
where
DE = Dwelling envelope (i.e., windows, roof, and walls);
a = Dwelling archetype;
p = Dwelling construction period.
The U-Value data, which indicate the rate at which heat transfers through the dwelling envelope, are obtained from [21,37]. Second, the space heating requirement ‘SH bottom-up’, linked to the physical characteristics of dwellings, is determined using Equation (3) as follows:
SH a , p bottom-up kWh Dwellings = Dwelling   Constant   a ,   p   W     ×   HDD   ×   24   1000
in which data for the average heating degree day (HDD) per country over the period 1979–2021 were obtained from Eurostat [38], with HDD representing the extent to which the average daily temperature falls below a predetermined base temperature (i.e., 18 °C). Third, ‘SH top-down’, linked to the actual final energy consumption, was calculated using Equation (4) as follows:
SH a , p   top-down PJ 000 Dwellings =   SH   Final   energy   ( PJ ) Dwelling   Stock   ( 000 Dwellings )
in which final energy data at the country level for the year 2015 are sourced from [5]. Fourth, we introduce a correction factor, ‘c’, to accurately reproduce observed country-level spaced heating values in 2015. This factor calibrates the space heating demand to account for unconsidered elements, such as non-heated spaces and behavioral variations, as expressed in Equation (5) as follows:
c = SH a , p   top-down PJ 000 Dwellings SH a , p bottom-up kWh Dwellings   /   3 . 6   ×   10 6  
Finally, we combine Equations (3)–(5) to establish an endogenous link between dwelling element performance and space heating demand in any given model year as follows:
SH   a , p PJ 000 Dwellings = c   ×   SH a , p bottom-up kWh Dwellings 3 . 6   ×   10 6
Through Equation (6), the retrofitting of dwelling elements (i.e., improvements in U-Value) is endogenized within the model optimization routine, which enables us to simulate the effect of energy-saving measures on residential space heating demand.
The residential sector module of TIMES-Europe incorporates energy-saving measures that enhance the insulation of the dwelling envelope, thereby endogenously decreasing the demand for space heating via Equation (7). Table 1 provides a breakdown of the energy-saving measures implemented in TIMES-Europe for the present study. These are divided into three packages, shallow, medium, and deep retrofitting, which achieve different levels of insulation enhancements, depending on the dwelling construction period. The measures are organized as bundles of improvements in specific dwelling elements as detailed in Table 1 using the cost calculation in Appendix A. Shallow retrofitting, characterized by minimal U-Value reduction, offers the least investment cost option. In contrast, deep retrofitting, with substantial U-Value reduction, presents the highest cost.
The amount of energy savings resulting from retrofitting can be determined by calculating the disparity between the space heating requirements of the dwelling before and after the U-Value improvements, as specified in Equation (7) as follows:
SM a , p PJ 000 Dwellings = SH a , p pre-retrofit PJ 000 Dwellings -   SH a , p retrofitted PJ 000 Dwellings
where
SM = Total energy saving;
SHpre-retrofit = Dwelling space heating energy requirement before retrofitting;
SHretrofitted = Dwelling space heating energy requirement after retrofitting.
The space heating energy requirement before and after retrofitting are calculated using Equations (2), (3) and (6), in which we specify, respectively, suitable pre- and post-retrofitting U-Value.
TIMES-Europe includes an extensive set of end-use technologies (i.e., heat pumps, boilers, and district heating) to fulfill residential space heating demand, with corresponding CO2 emission profiles that depend on the energy carrier they utilize. We implement a lower limit for the availability factor of space heating supply technologies in order to ensure their effective deployment. This lower bound decreases over time to incorporate the declining space heating demand resulting from retrofitting processes. The rate of decrease is controlled by a feedback loop process. Initially, we run a base scenario (i.e., without policy intervention) from which we extract the rate of space heating energy demand reduction resulting from renovation. We then use this rate to adjust the decline of the availability factor and iterate this process until the reduction in the lower bound of the availability factor stabilizes (i.e., the amount of energy savings from retrofitting does not undergo significant changes with a new input of the decline rate).
The techno-economic data for the abovementioned technologies were obtained from the JRC database [36] and the TNO factsheets [39]. Several conditions are established to uphold the physical characteristics of technologies and to align with the official EU policies on the Renewable Energy Directive [40]. (i) The potential for the deployment of heat pumps is constrained to dwellings with a minimum energy label of C, which corresponds to dwellings with a space heating capacity requirement of less than 12.2 kWth [39]. (ii) We do not permit additional growth of fossil fuel-based boilers beyond the projected level for 2035.
The availability of energy carriers originates from other parts of TIMES-Europe, specifically power supply and the upstream sectors. We use historical fossil fuel prices (i.e., before 2020) on the basis of data provided in the IEA 2021 World Energy Outlook [41]. Simultaneously, we adopt projections from Duić et al. [42] to exogenously set future fuel prices in TIMES-Europe (see Table 2). This study assesses fuel pricing from a system perspective, exclusively considering base prices without factoring in additional fees, such as taxes and surcharges. It reports projections of fuel prices based on extraction prices, import prices, and the fuel dependency ratio (which represents the ratio of the level of self-extracted fuel against that of imported fuel).

2.2. Scenario Overview

We use TIMES-Europe to evaluate how the interaction between climate ambition and the degree of collaboration among EU member states may impact the energy mix of the European residential sector. For this purpose, we designed four scenarios, My Delay, Our Delay, My Action, and Our Action, each with a distinct level of collaboration (i.e., target and burden sharing) and climate control ambition (see Figure 2). My Delay illustrates a future with a lack of collaboration efforts, in which Europe falls short of achieving its overall climate target. Our Delay describes a future with full cooperation, but the outcome of climate mitigation efforts still falls short of the official target. In contrast, My Action expresses a situation in which the climate target is achieved at the level of the individual member states, albeit through a fragmented approach without sharing responsibilities between member states. Our Action exhibits the case of profound commitment to ambitious climate efforts that are realized through a collaborative approach, in which member states act together to achieve the targets in the most efficient manner. This setup was chosen to reflect two of the main uncertainties, which prominently feature in the current debate among research scholars and policymakers regarding the energy transition in the European residential sector [43,44,45].
In Table 3, we present the parametrization of our four scenarios, in terms of the modeling constraints that we adopted to stylistically simulate climate policy and the level of collaboration among EU member states. The two cases in which mitigation efforts fall short of the official climate target, i.e., both Delay scenarios, represent a continuation of current trends. In the two cases in which the climate target is attained, i.e., both Action scenarios, we assume full implementation of the measures from the EPBD [24], the EU Renovation Wave [26], and the EU recommendations for the promotion of nearly zero-energy buildings (NZEB) [46]. The climate target in our scenarios is defined by specific objectives in four key areas: (i) fossil fuel use in the residential sector, (ii) annual retrofitting rate, (iii) renewable electricity generation, and (iv) deployment of heat pumps. Objectives (i), (ii), and (iii) are applied either to each member state separately or to Europe as a whole in the partial and full collaboration scenarios, respectively. Thus, in the full collaboration scenarios, a member state is permitted to not attain its climate target, provided that other member states exceed their respective climate targets. Objective (iv) is applied for Europe as a whole in all scenario variants since a comprehensive overview of individual country targets for heat pumps is not available at the time of writing.
We assume that the power sector in TIMES-Europe meets the goal of a 60% renewable energy supply by 2030. In the two full collaboration scenarios, the collective 60% renewable energy supply is distributed across Europe. This implies that specific member states may fall below this target, providing other countries compensate for this shortcoming, which ensures that the overall continental total remains at 60%. Conversely, in the partial collaboration scenarios, each country is obliged to attain a minimum of 60% renewable electricity generation.

3. Results

We present our findings in two parts. First, we provide an integrated European perspective on the residential space heating transition. Second, we analyze our modeling results at the country level to highlight variations in the adoption of sustainable heating solutions across Europe.

3.1. Space Heating Transition at the European Level

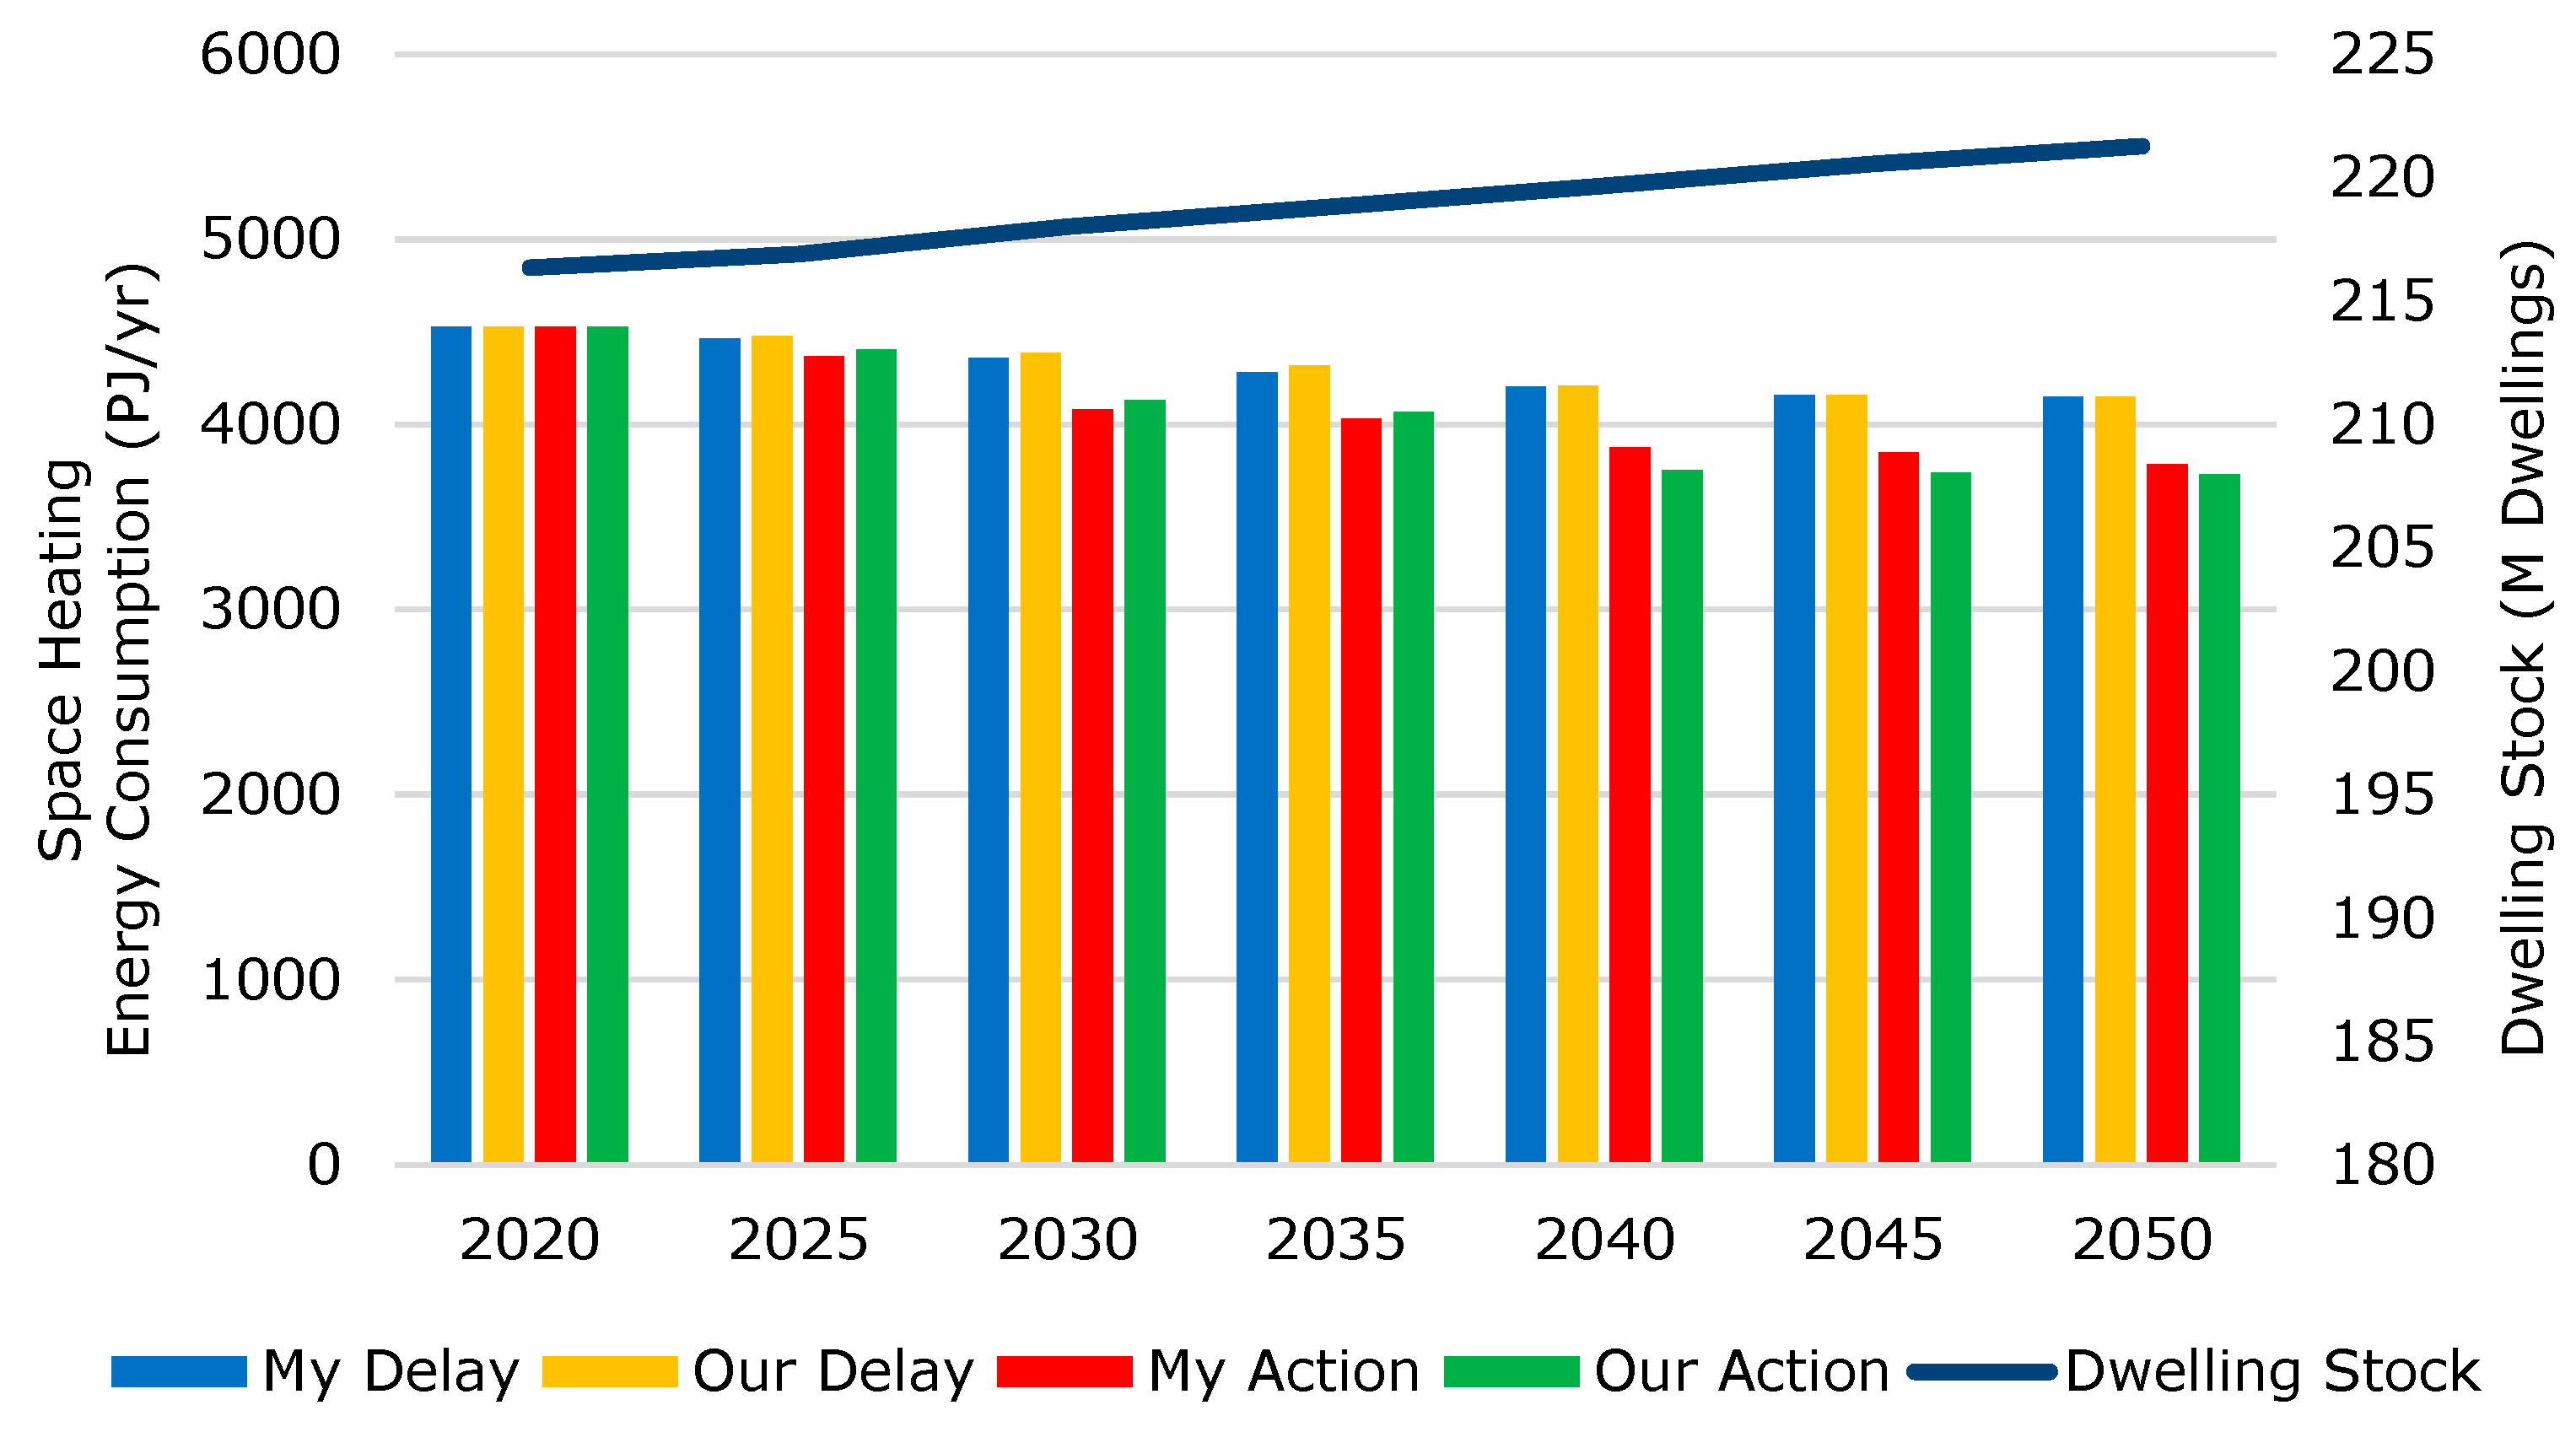
Figure 3 illustrates our TIMES-Europe projections of annual energy consumption for residential space heating (PJ/yr, on the left y-axis) and dwelling stock growth (in millions, on the right y-axis) for all four scenarios until 2050. We observe that although the total dwelling stock increases, the energy consumption for space heating steadily declines. The reduction in space heating energy consumption and its decoupling with growth in the number of dwellings is more pronounced in the two successful climate action scenarios in comparison to the two scenarios in which climate policy falls short. In the two scenarios in which the climate target is achieved, this reduction amounts to approximately 850 PJ/yr between 2020 and 2050, which is more than twice the reduction observed in the two scenarios in which climate action remains delayed (approximately 400 PJ/yr) in the same period. Until 2035, the two partial collaboration scenarios show a slightly lower energy consumption in comparison to the full collaboration scenarios. However, this pattern reverses after 2040.
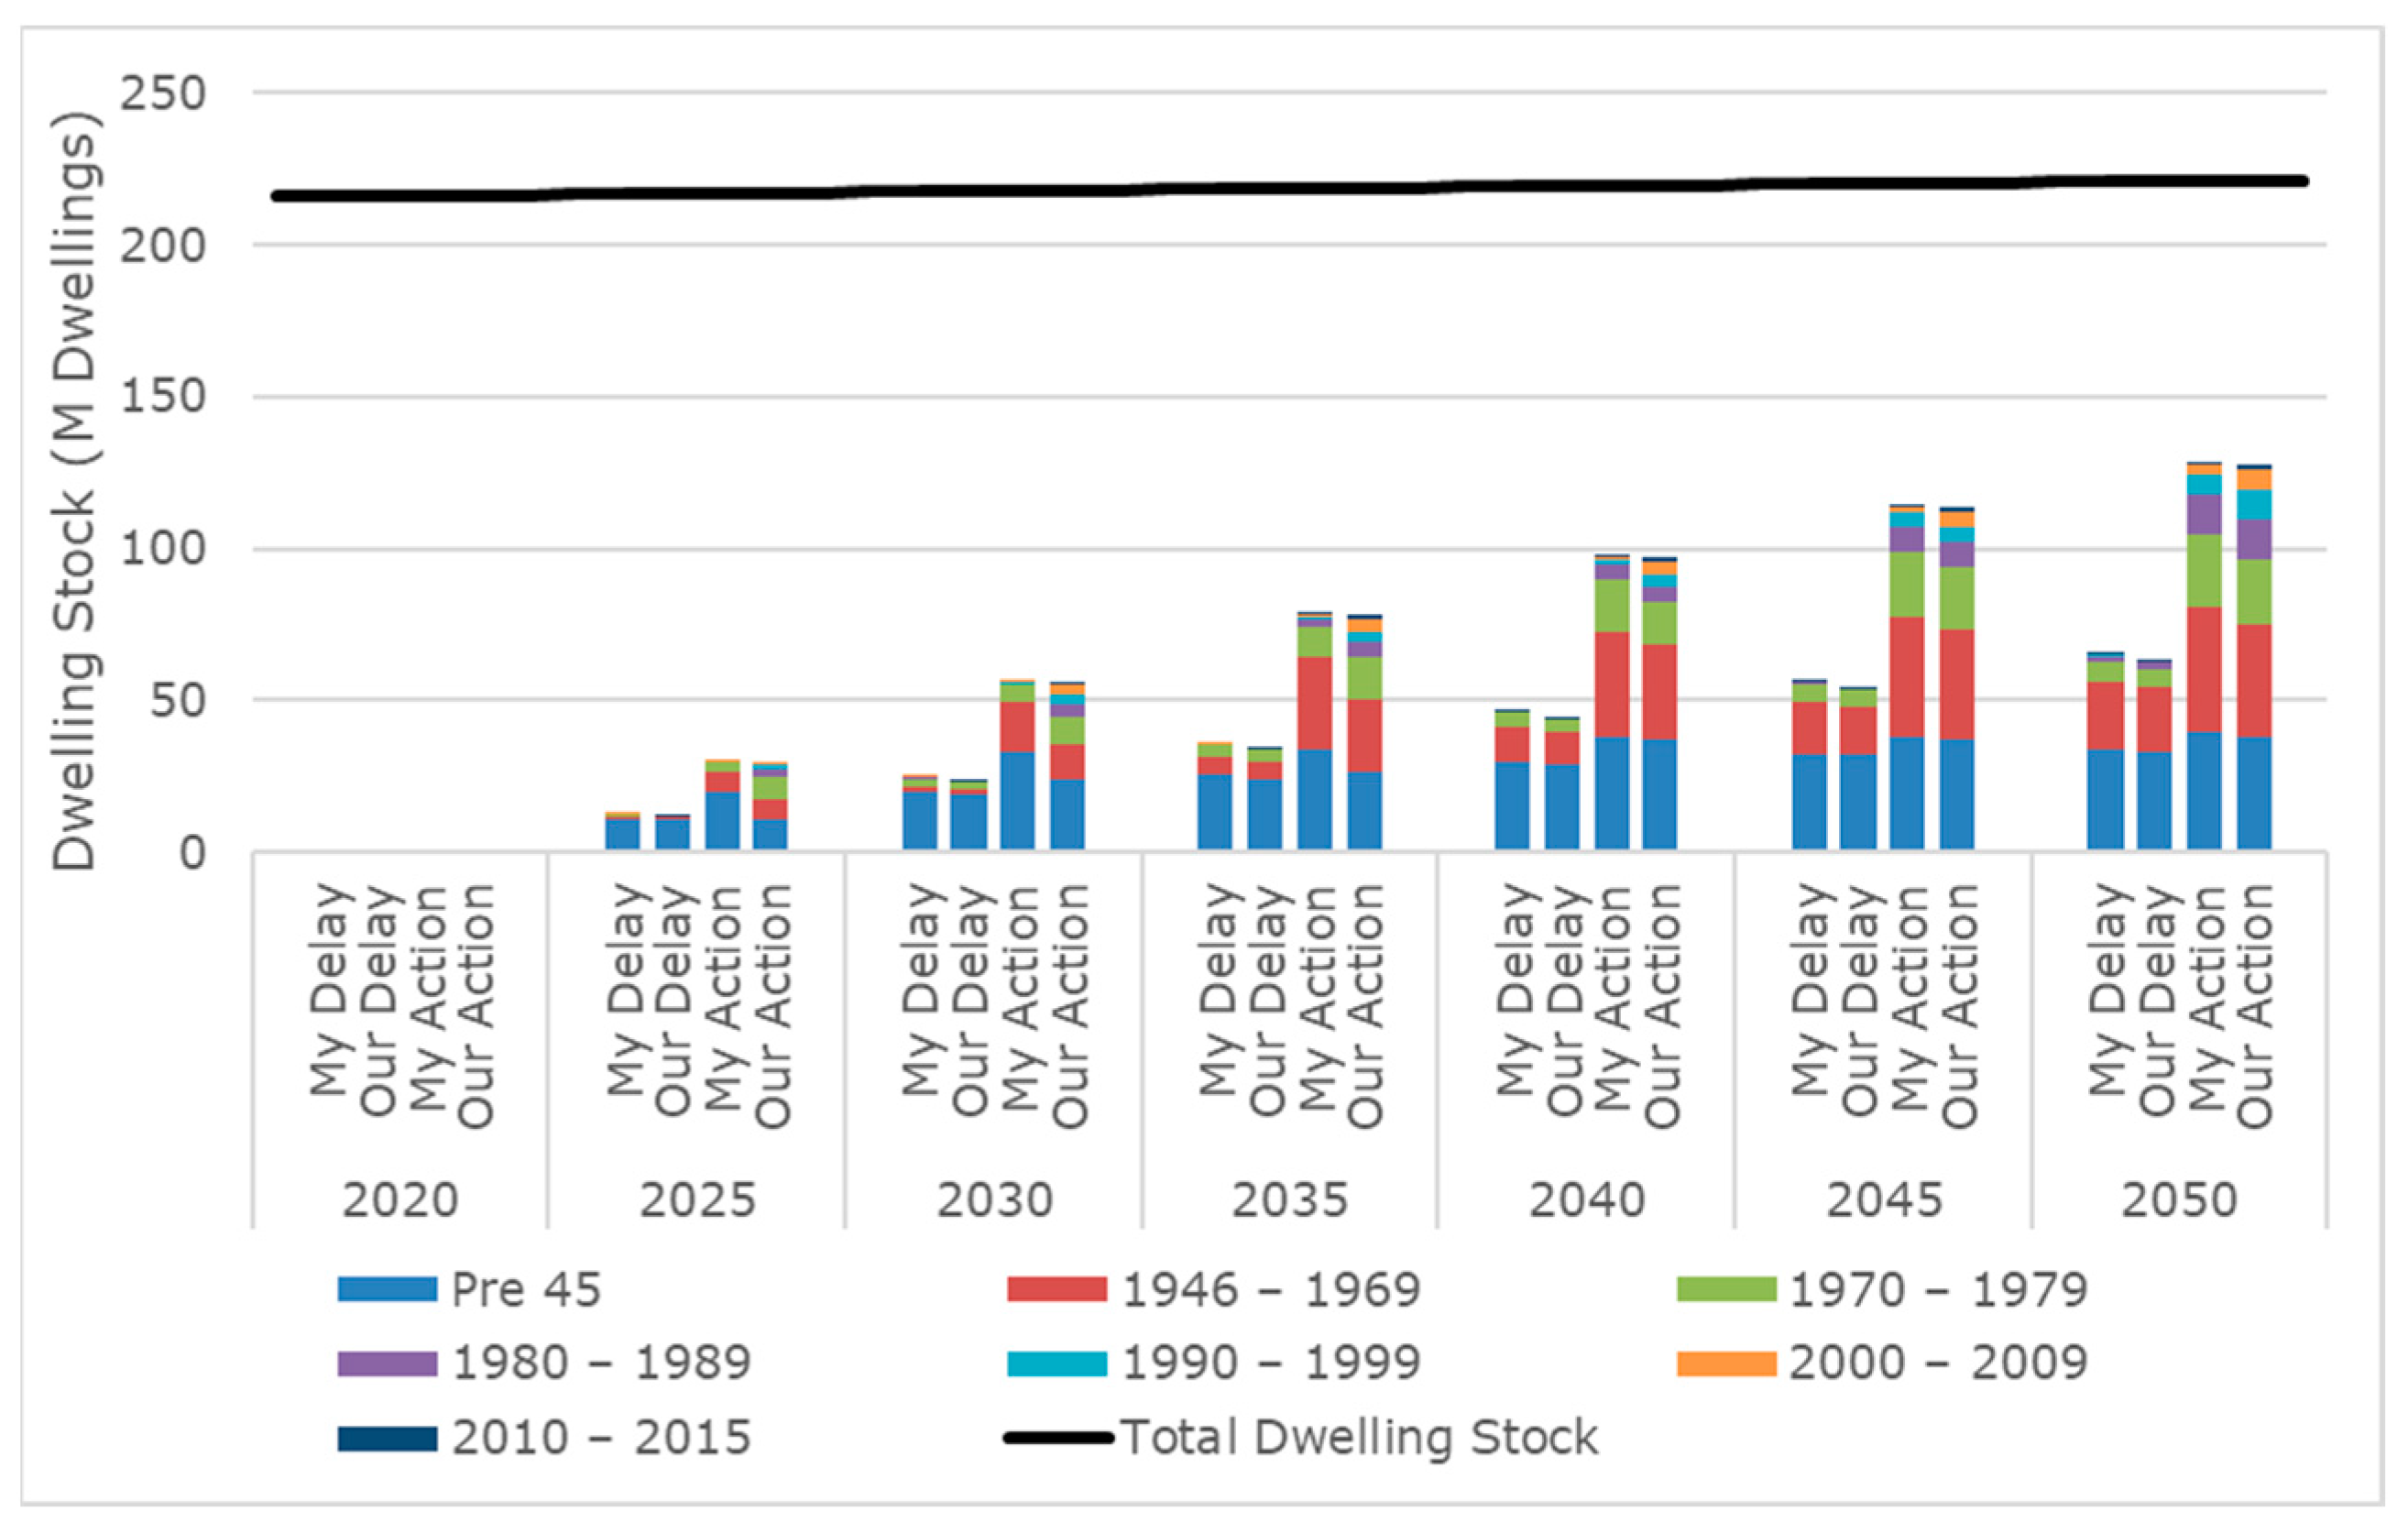
In Figure 4, we display the evolution of the composition of renovated dwellings and the growth of the overall dwelling stock for all four scenarios. Further details regarding the composition of renovated dwellings can be found in Appendix B. The total dwelling stock is projected to reach approximately 221 million by 2050. By then, we project that for the ambitious climate scenarios, approximately 125 million dwellings have undergone renovation, whereas for the fall-short climate policy scenarios, only roughly 60 million dwellings have undergone renovation. These figures correspond, respectively, to 56% and 27% of the total dwelling stock being renovated by mid-century. Note that this is consistent with the 3% and 1% annual renovation rates in the respective scenarios when considering that the renovation can only affect ‘old’ dwellings, i.e., dwellings that were not renovated in previous model years. As in Figure 3, we see only relatively small differences between the full versus partial collaboration scenarios. Across all scenarios, older dwellings dominate the renovation composition. During the early decades, in the partial collaboration scenarios, the proportion of older dwellings is higher in comparison to that in the full collaboration scenarios. This difference is most pronounced in the short term, until 2035, but gradually diminishes over time, leveling out in 2040. By 2050, the share of older dwellings in the renovated stock will be substantially higher in the delayed climate action scenarios in comparison to that in the scenarios in which the climate target is achieved.
Figure 5 displays our projections for the dwelling retrofitting expenditures (in billion Euros) until 2050. The two successful scenarios show clearly higher costs than the scenarios in which climate policy is delayed. By 2050, the annual retrofitting costs in the former are about twice as high as those in the latter scenarios. The partial collaboration scenarios exhibit significantly higher retrofitting investments in the near term than the full collaboration scenarios, although this gap narrows by 2050. Moreover, this difference is more pronounced in the ambitious climate policy scenarios in comparison to those in which climate policy falters.
Figure 6 presents our projections with TIMES-Europe for the mix of technologies deployed to fulfill residential space heating demand. In the ambitious climate scenarios, we observe a rapid decrease in fossil fuel consumption, reaching zero by 2040. However, in the delayed climate policy scenarios, fossil fuel usage persists until 2050. The consumption of natural gas decreases overall and will continue to play a substantial role in supplying space heating demand until 2050. Across all scenarios, oil and coal use phases out by 2035, whereas direct heat consumption (through notably geothermal and district heating) remains relatively constant throughout the entire simulation period. Biomass usage declines over our modeling horizon, with a steeper reduction in the delayed climate policy scenarios in comparison to those in which climate policy is ambitious and successful. The additional biomass in the latter set of scenarios is deployed mainly to replace the use of natural gas. We observe a substantial increase in electrification in the residential sector, primarily driven by the use of heat pumps and electric boilers. The rate of electrification is slightly higher in the full collaboration scenarios in comparison to the partial collaboration scenarios.
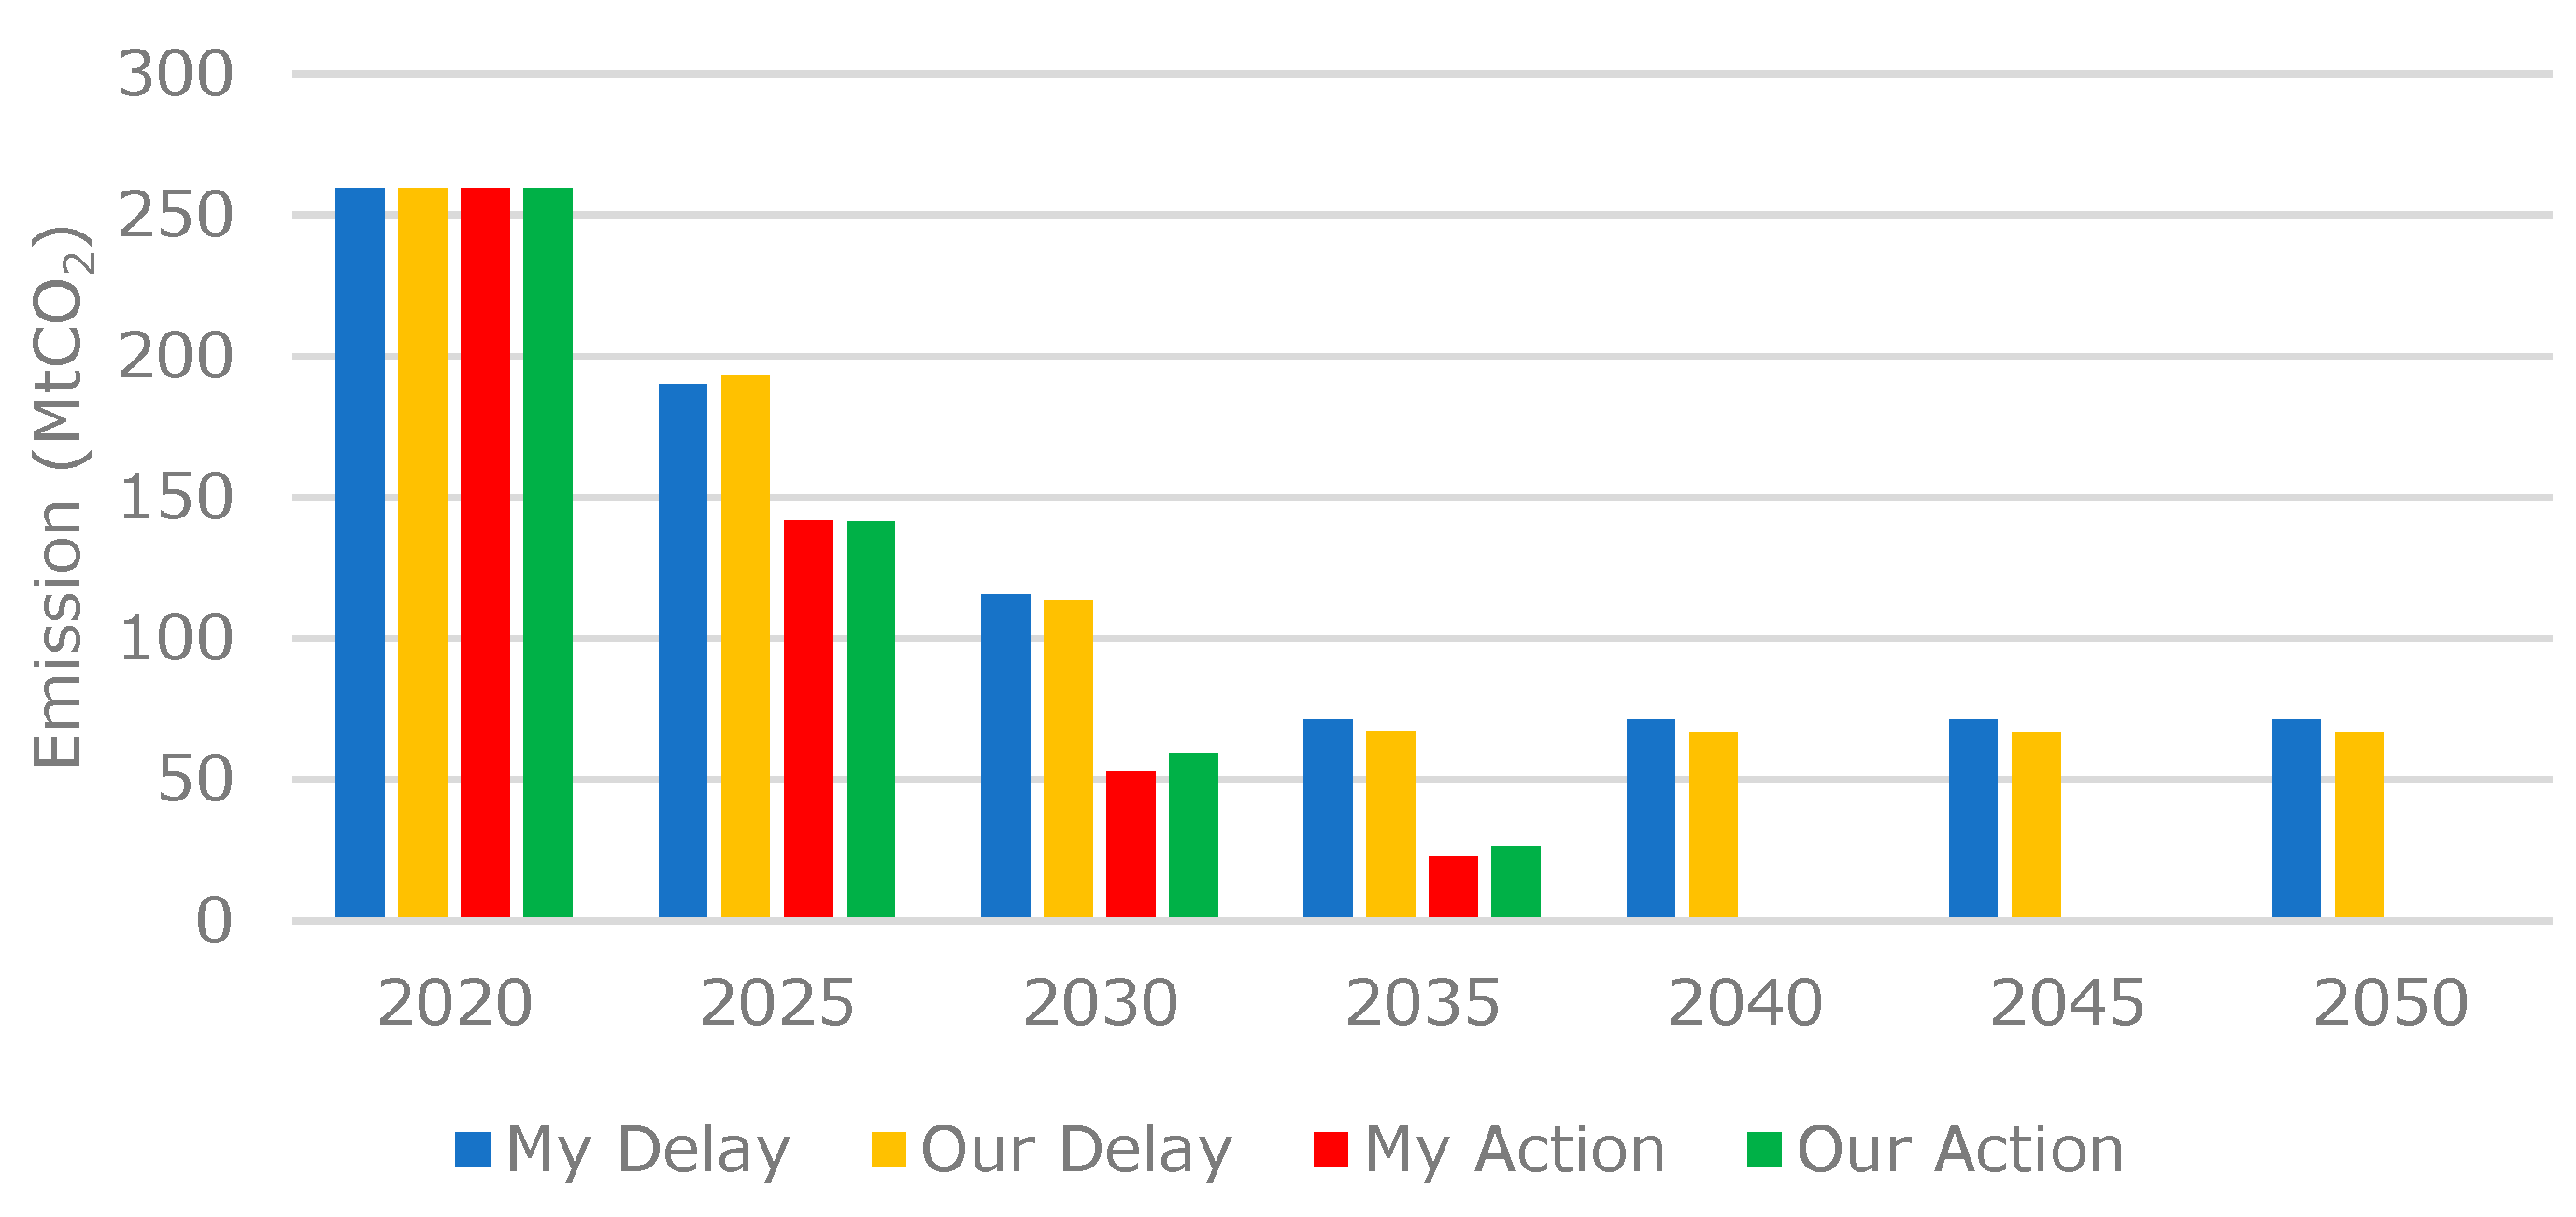
In Figure 7, we present our projections for the reduction in CO2 emissions (in MtCO2) from residential space heating in Europe. The bar chart displays the development of the total level of CO2 emissions for the EU27 and UK combined. Across all scenarios, we observe reductions in the total level of emissions. By 2040, the ambitious climate policy scenarios achieve zero emissions, whereas the delayed climate policy scenarios still yield approximately 70 MtCO2 of emissions in 2050.

3.2. Space Heating Transition at the Country Level

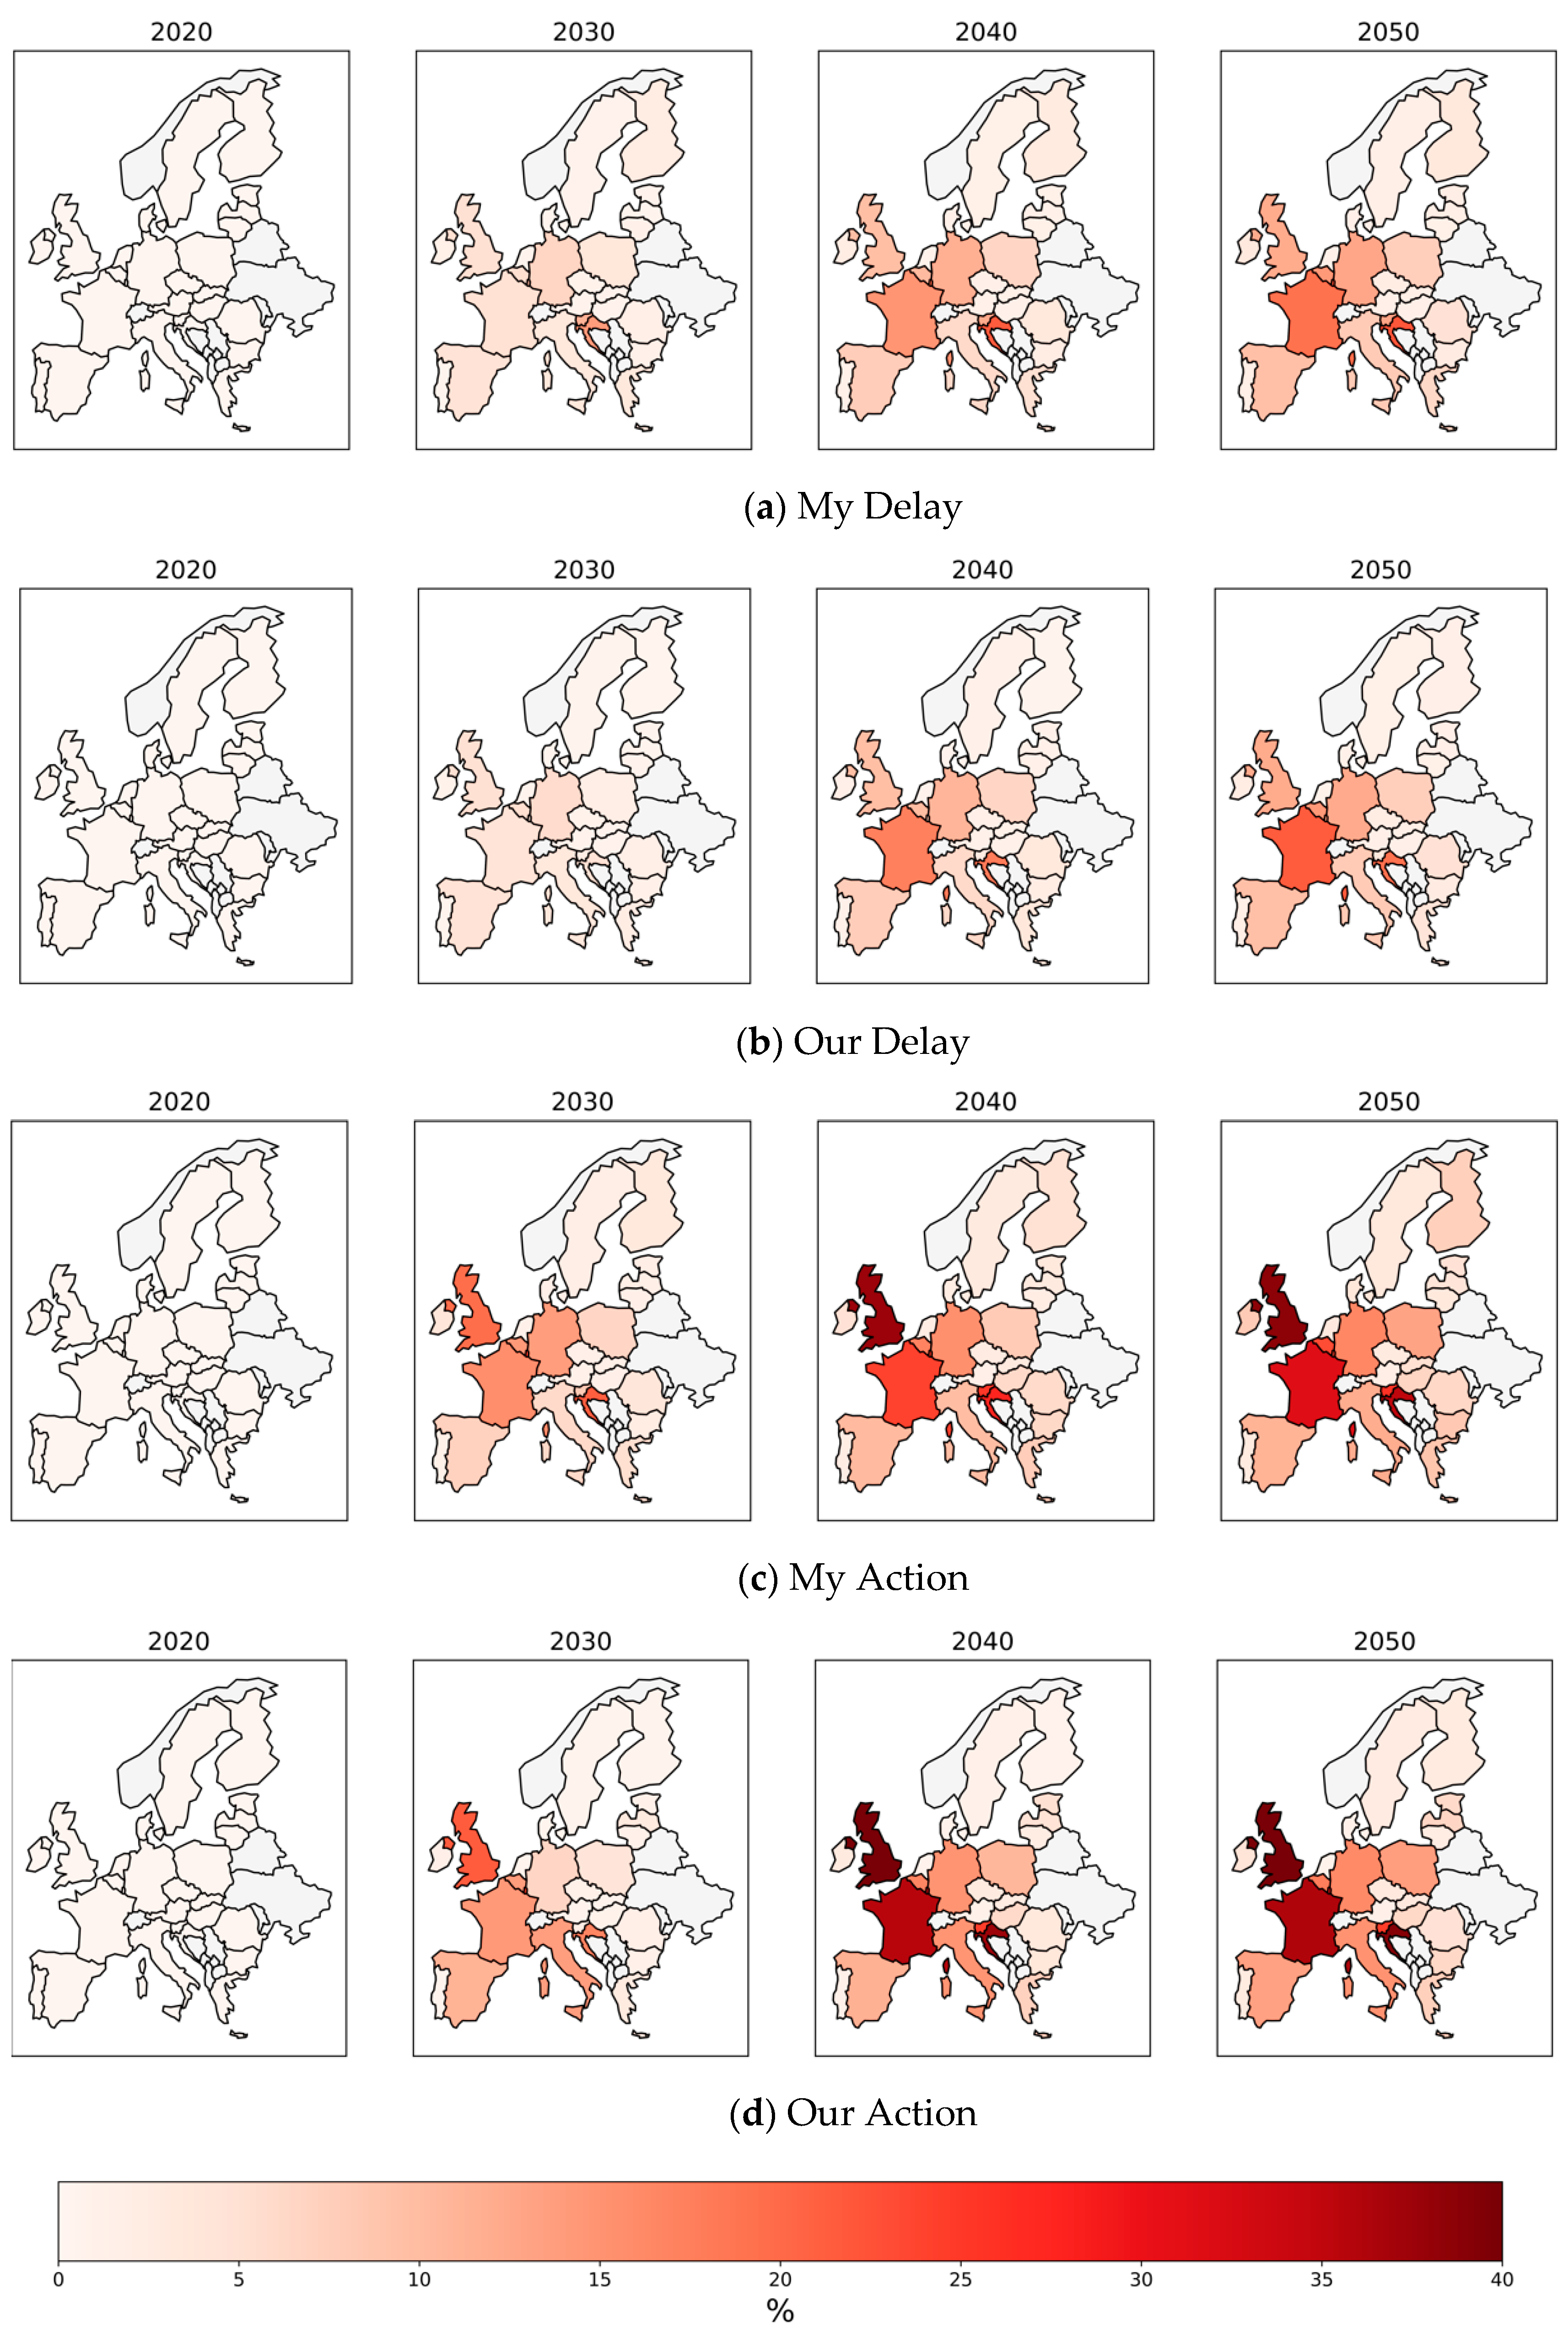
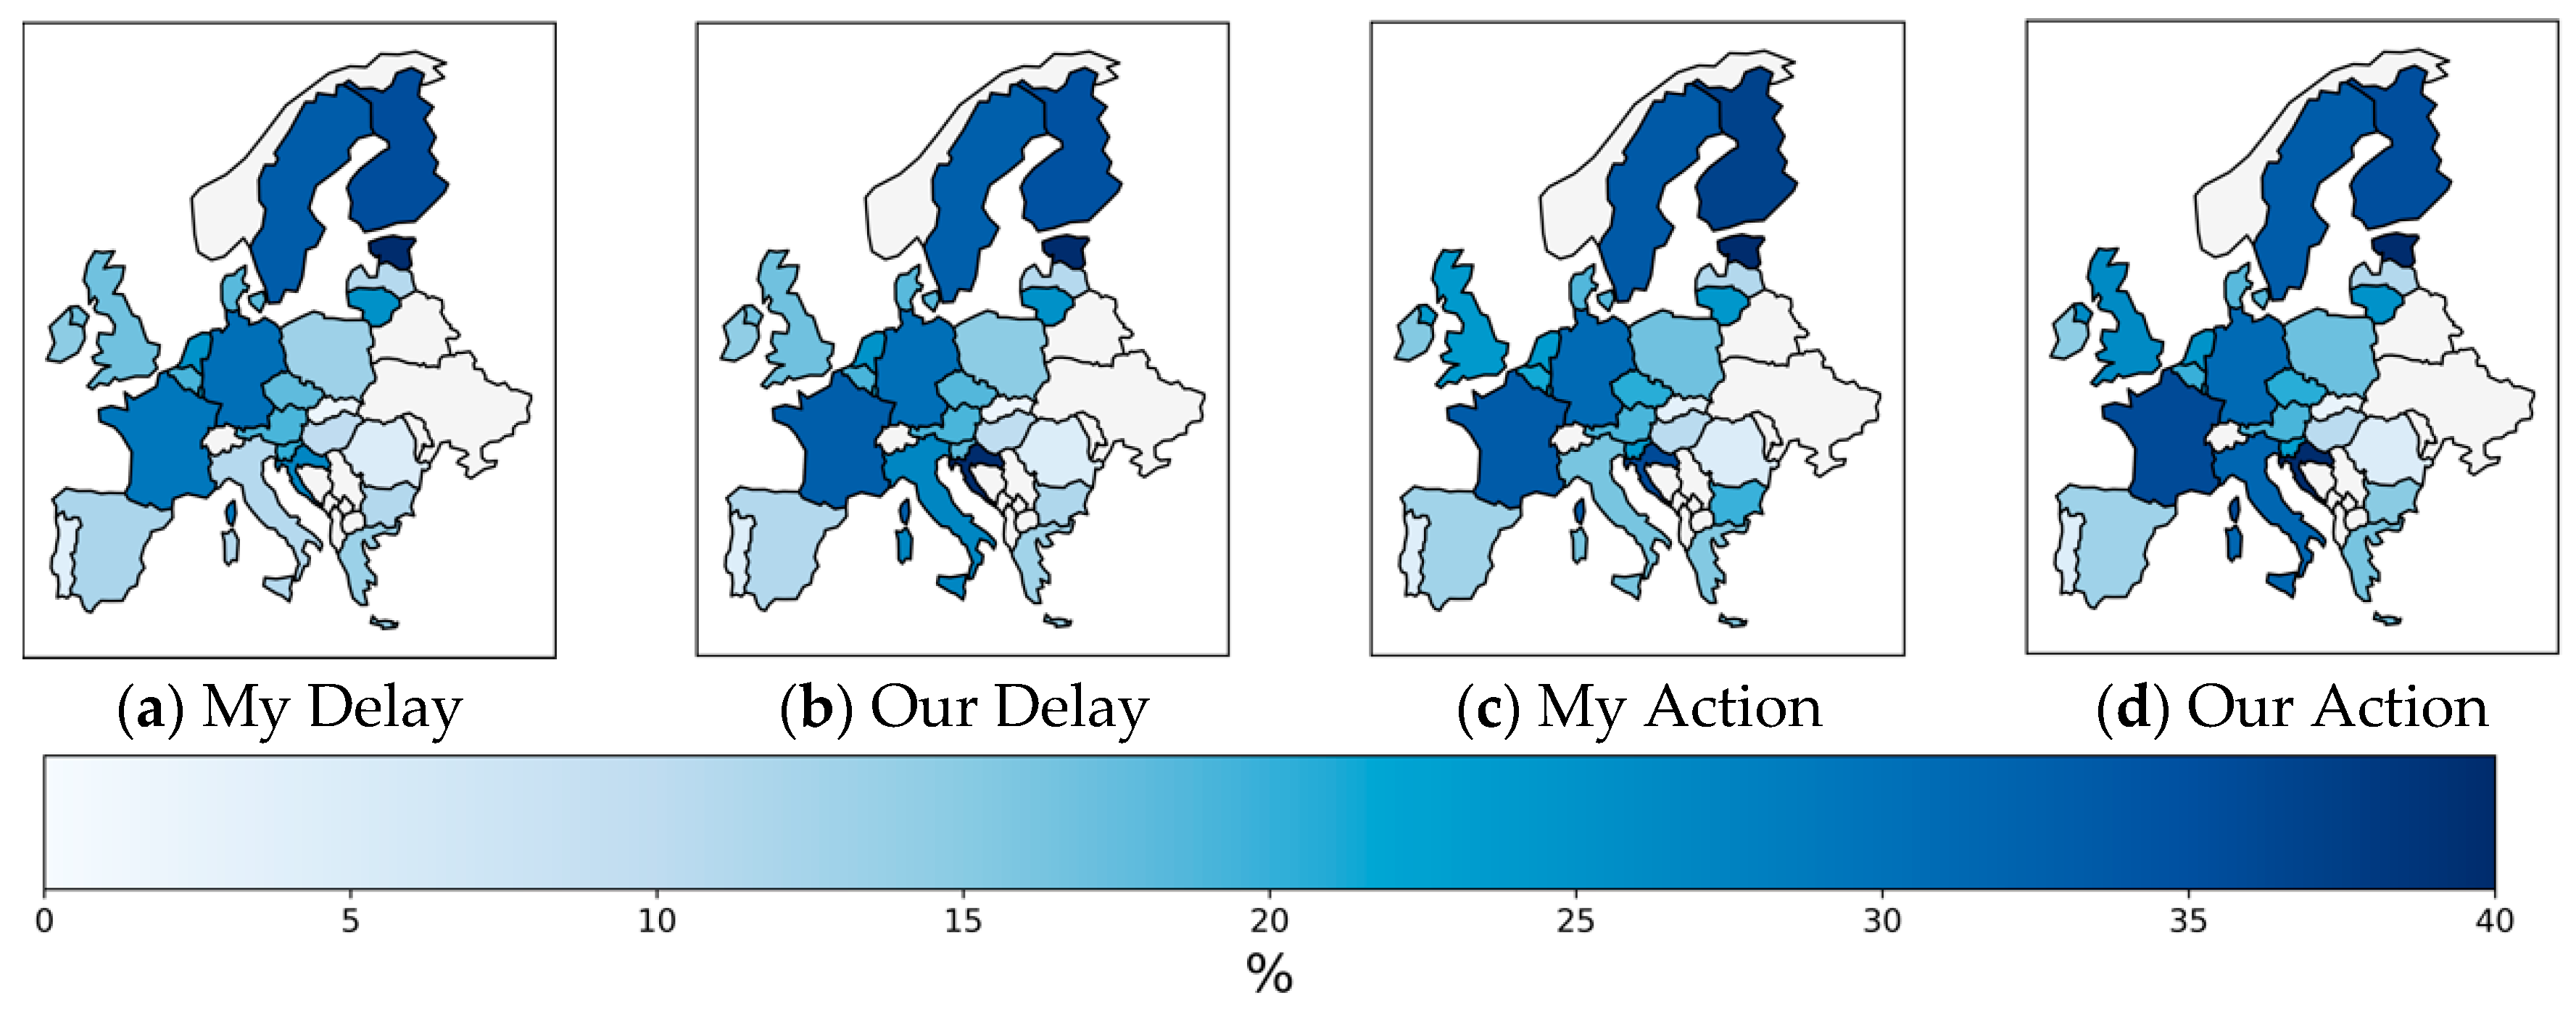
In Figure 8, we present our projections for the reduction in space heating energy consumption from renovation across all four scenarios throughout our modeling horizon in 2050. The maps in Figure 8 display the relative percentage reduction in space heating as a result of renovations. Across all scenarios, the greatest energy savings from retrofitting are primarily realized in intermediate latitude countries. The percentage of energy savings is higher in the ambitious climate scenarios in comparison to that in the delayed climate scenarios. In the fully collaborative scenarios, France and Croatia display clearly higher energy savings from retrofitting compared to the scenarios with only partial collaboration. Conversely, some countries, such as Finland, show lower energy savings in the Our scenarios compared to the My scenarios.
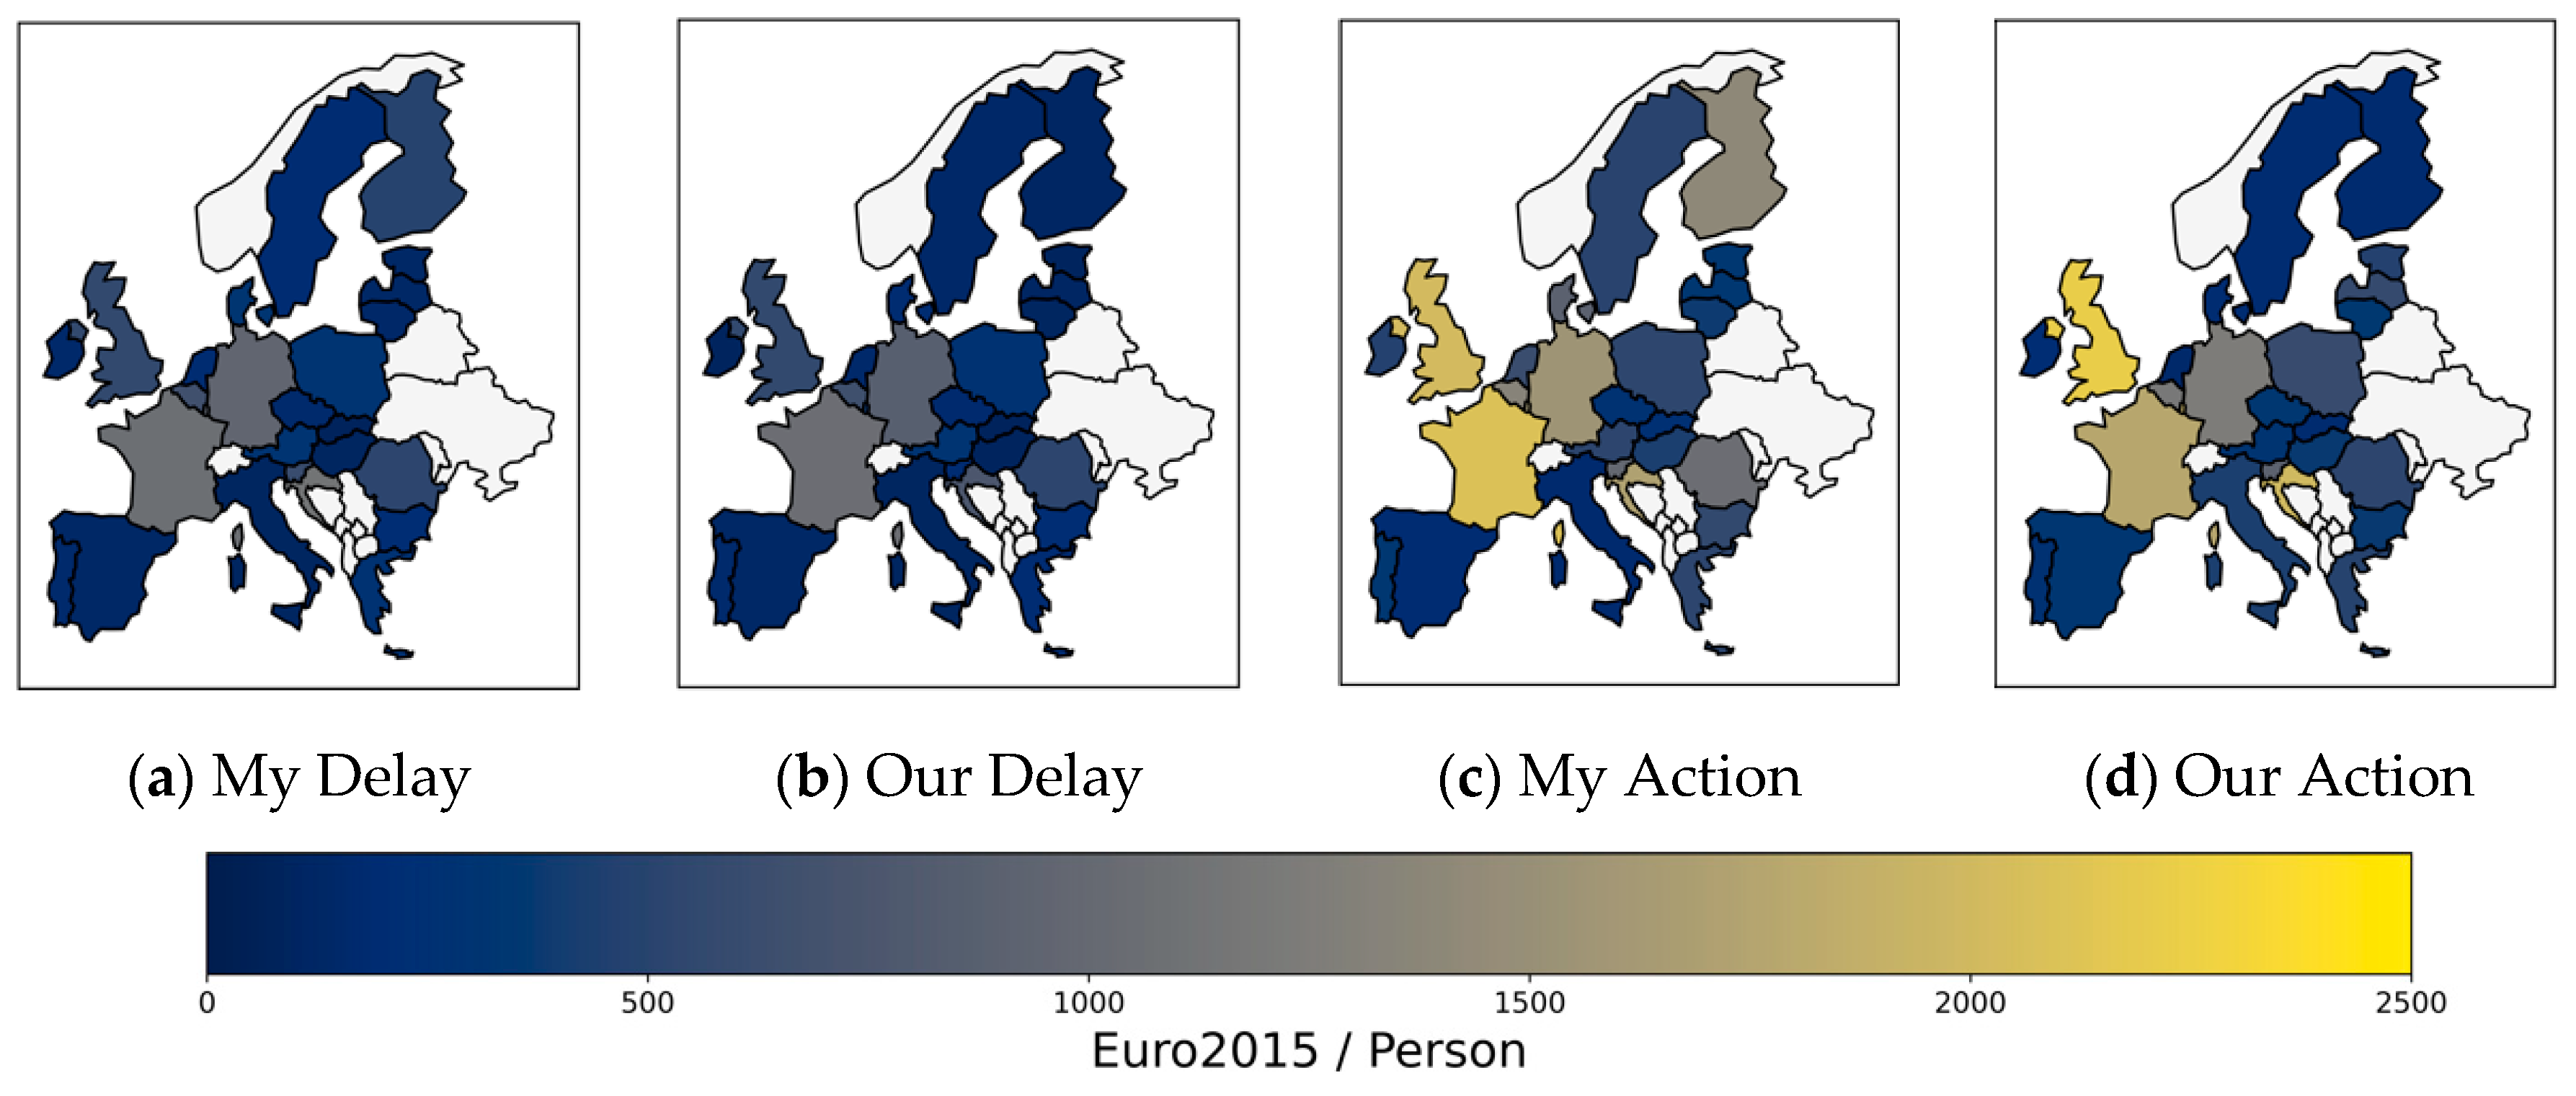
Figure 9 provides insights into the cumulative renovation costs per capita between 2020 and 2050. In the delayed climate policy scenarios, we observe lower investments per person in comparison to the ambitious climate action scenarios. Regardless of the scenario, several countries in mid-latitude Europe (UK, France, Belgium, Germany, and Croatia) bear relatively high-cost burdens compared to the rest of Europe, with the difference being more apparent in the ambitious climate control scenarios. In Our Action, the UK, Latvia, and Croatia exhibit higher renovation costs per person than in My Action. Conversely, France, Germany, and Finland show slightly lower costs per person in the Our Action scenario in comparison to the My Action scenario.
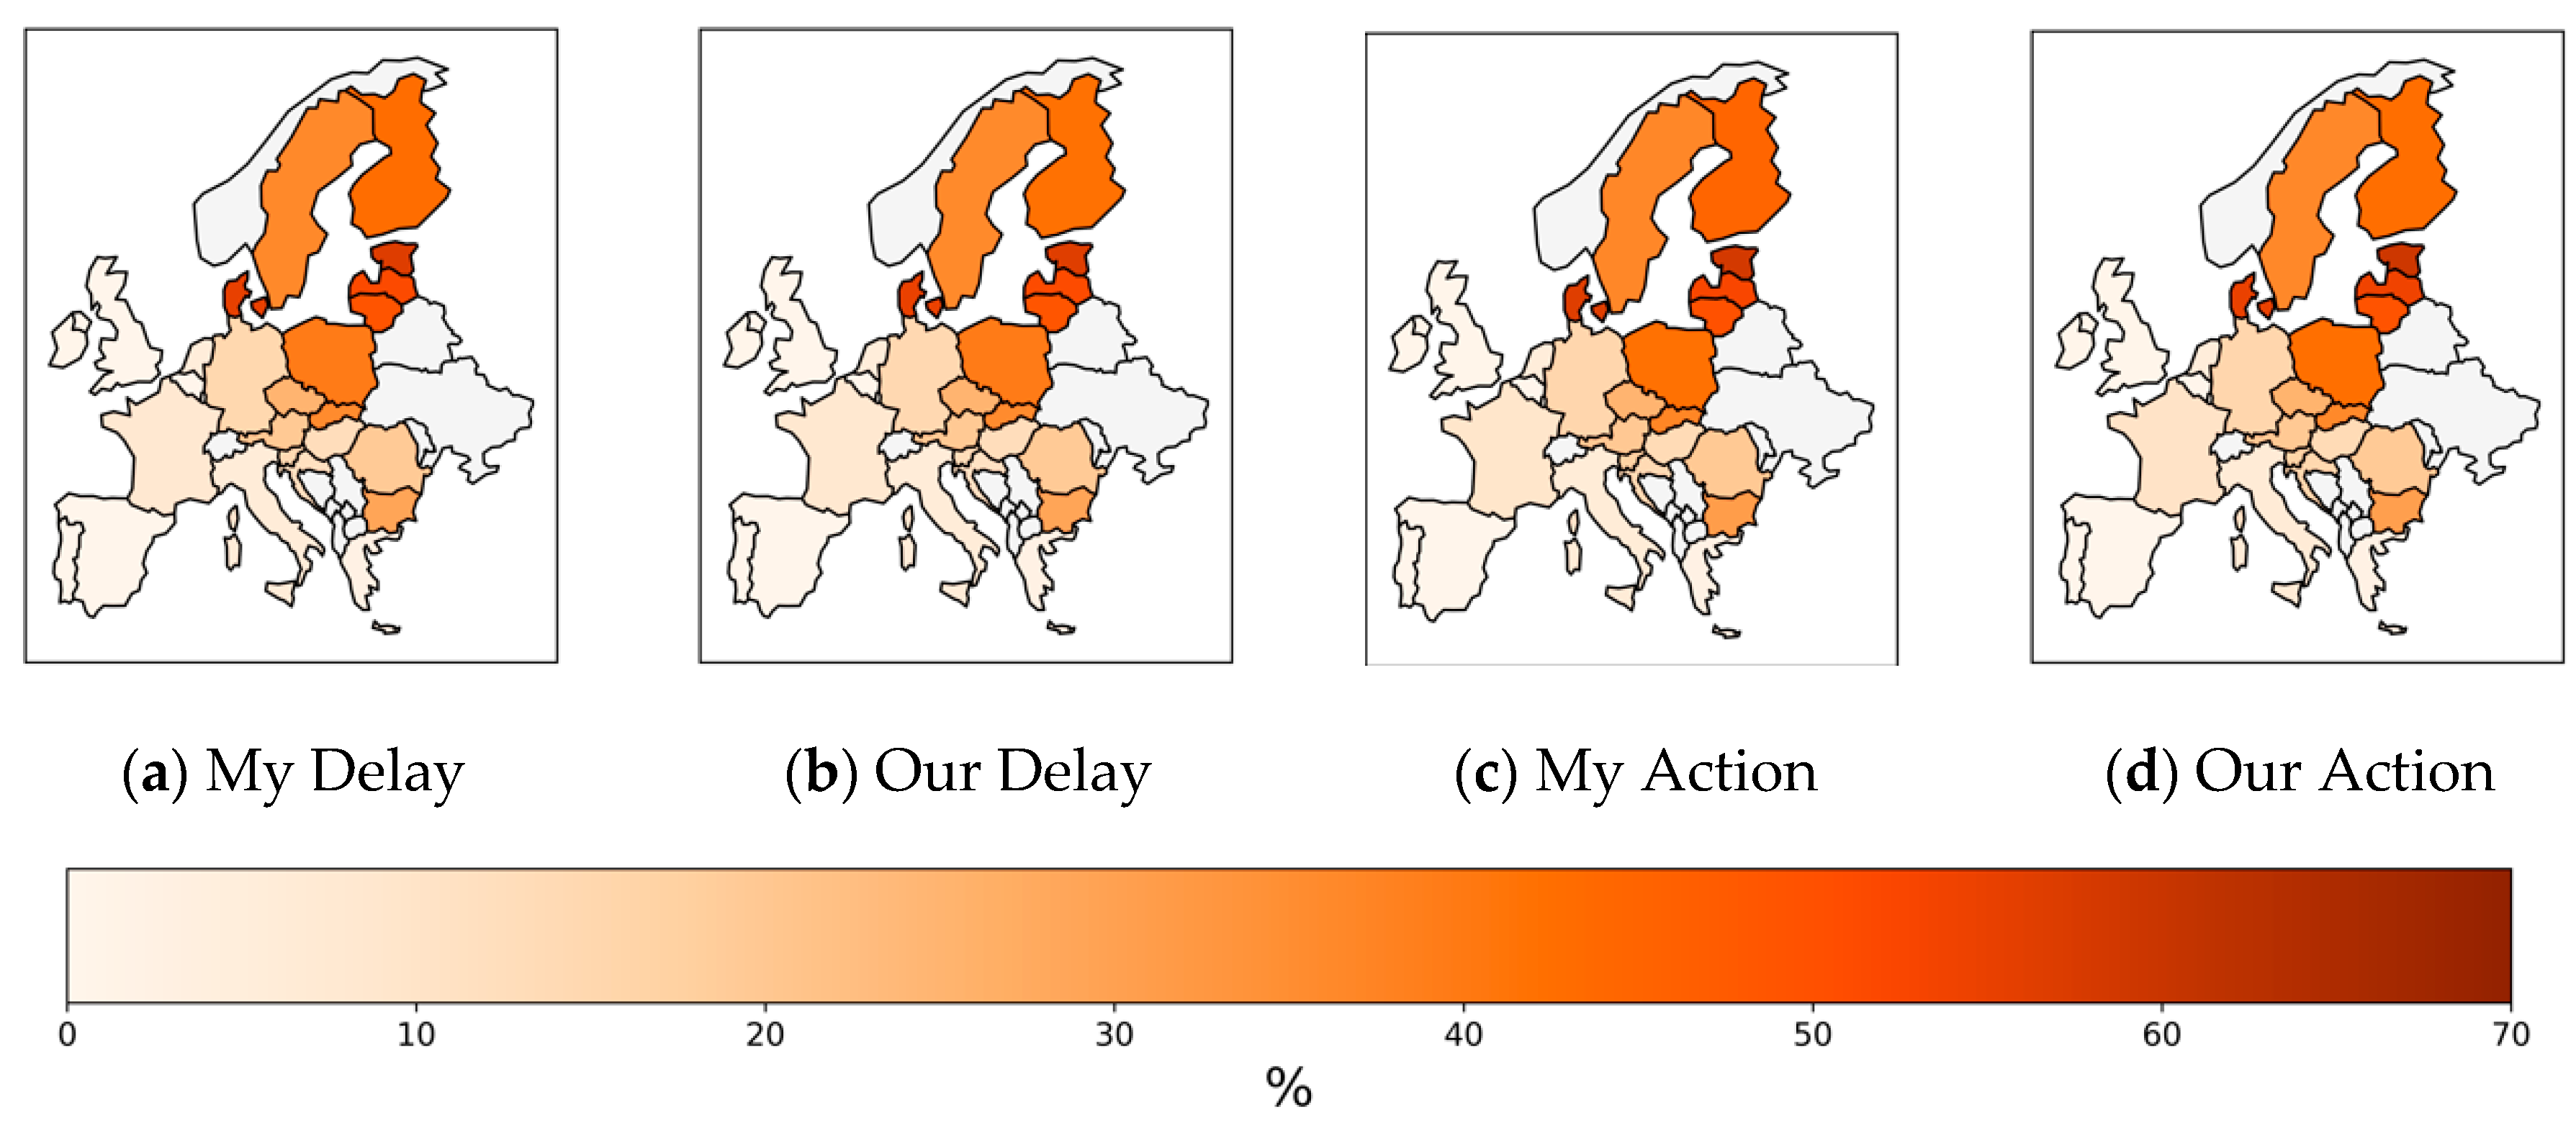
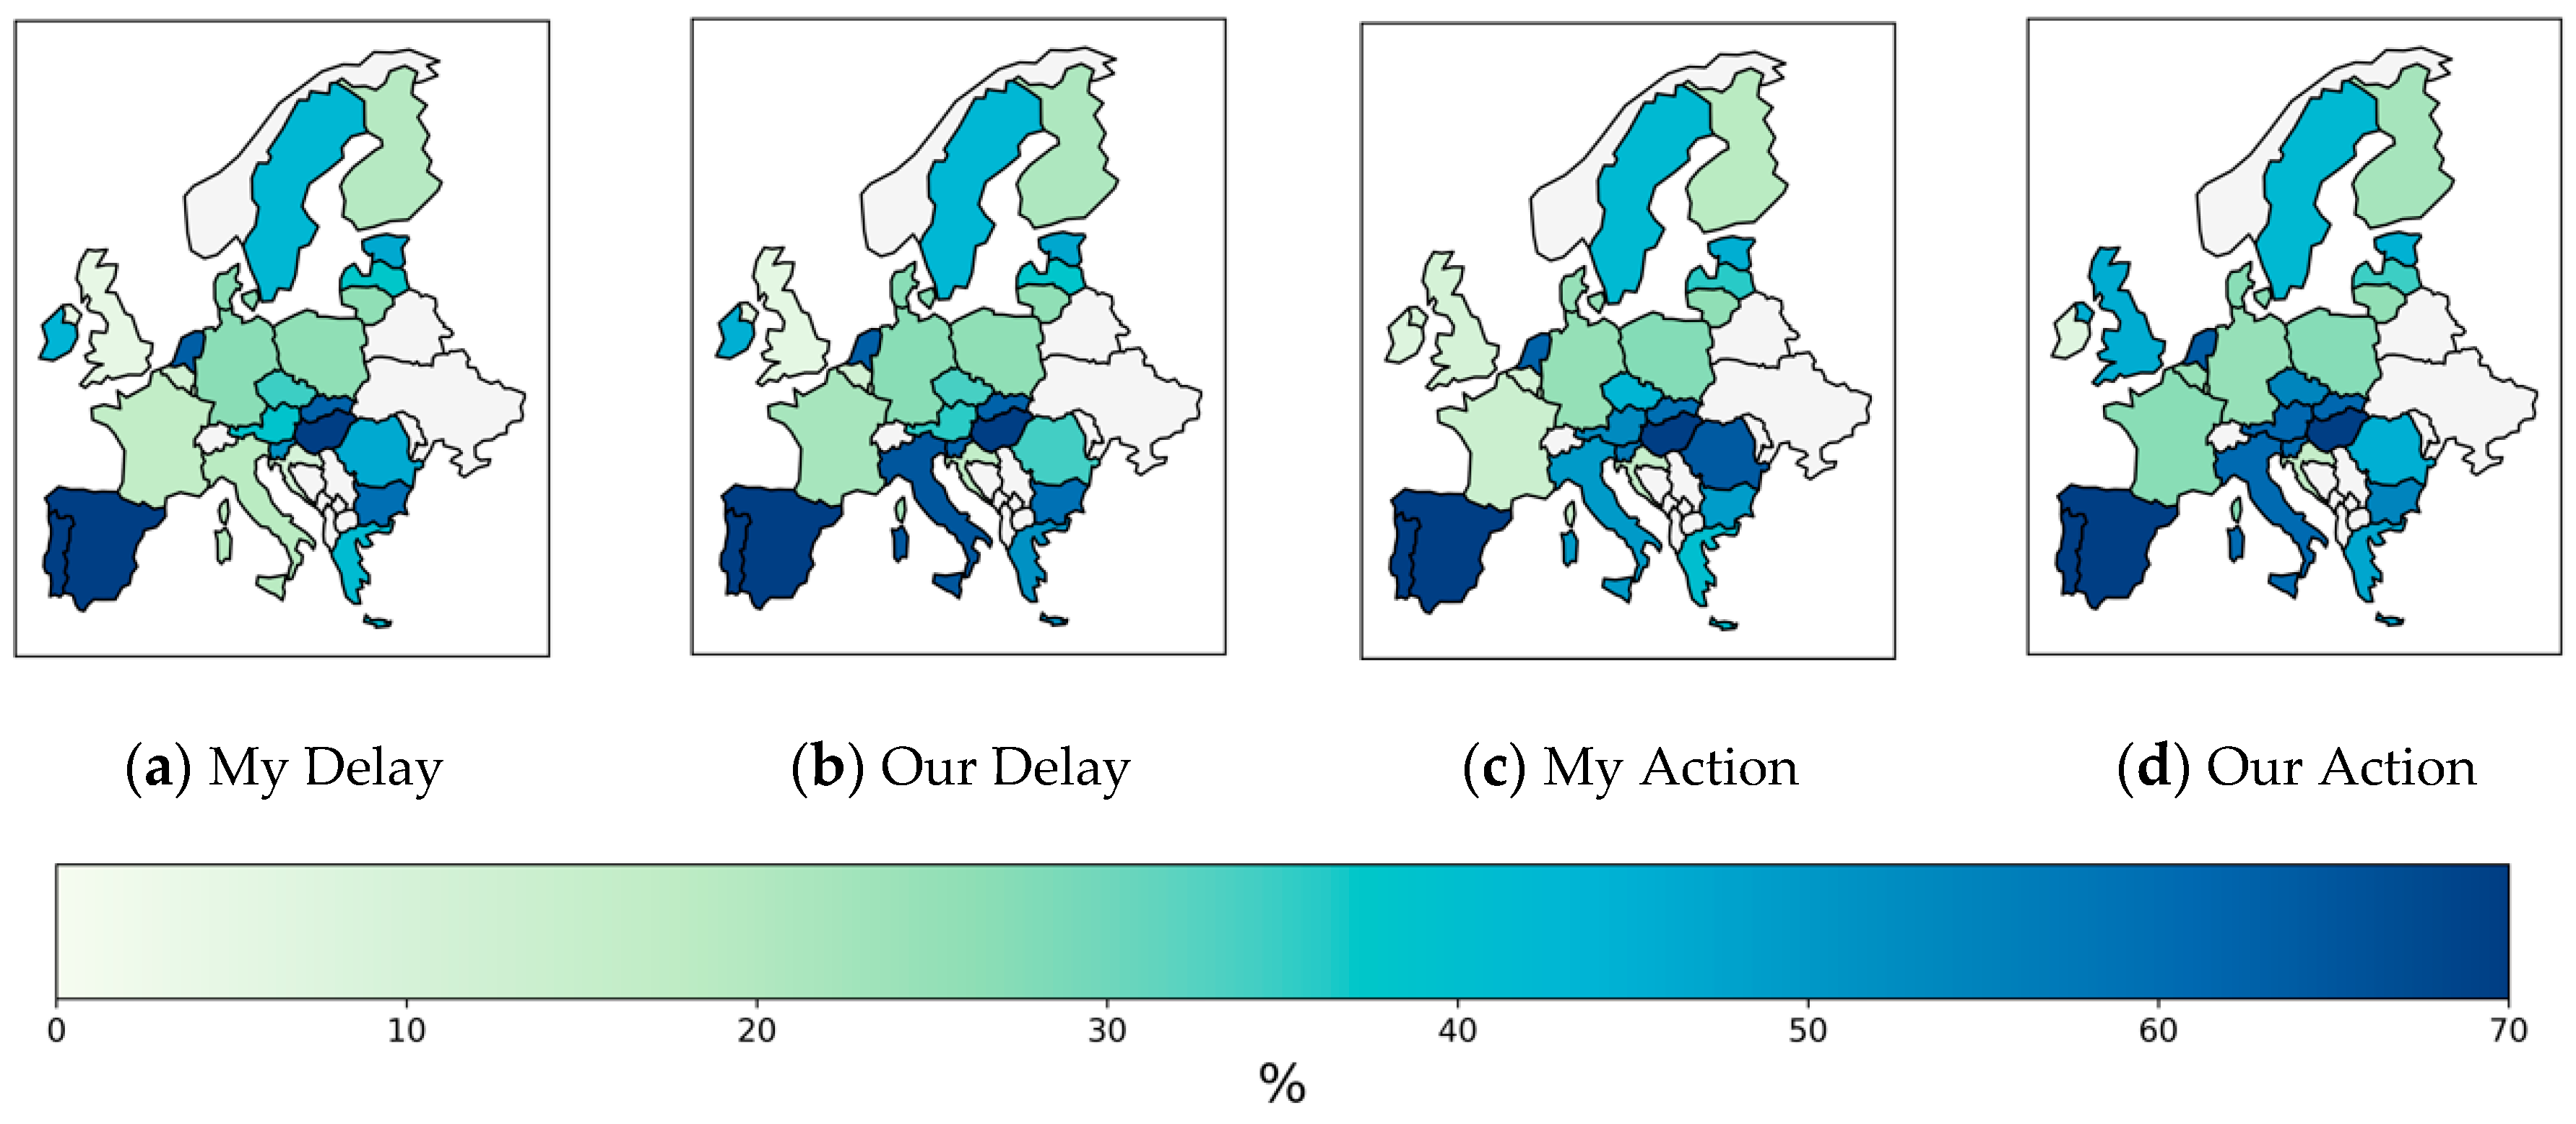
We present geographical variations in the space heating technology mix in 2050, focusing on the share of heat pumps (Figure 10), direct heat (Figure 11), electric boilers (Figure 12), and biomass-based boilers (Figure 13). Across all scenarios, we observe that heat pumps are primarily used in high- and mid-latitude European countries. Direct heat consumption stands out prominently in the Baltics and Scandinavia across all four scenarios. The utilization of electric boilers is mainly concentrated in Southern and Eastern European countries. Biomass usage is more prevalent in mid-latitude Europe, and it is significantly lower in the short-fall climate control scenarios than in the ambitious climate action scenarios.
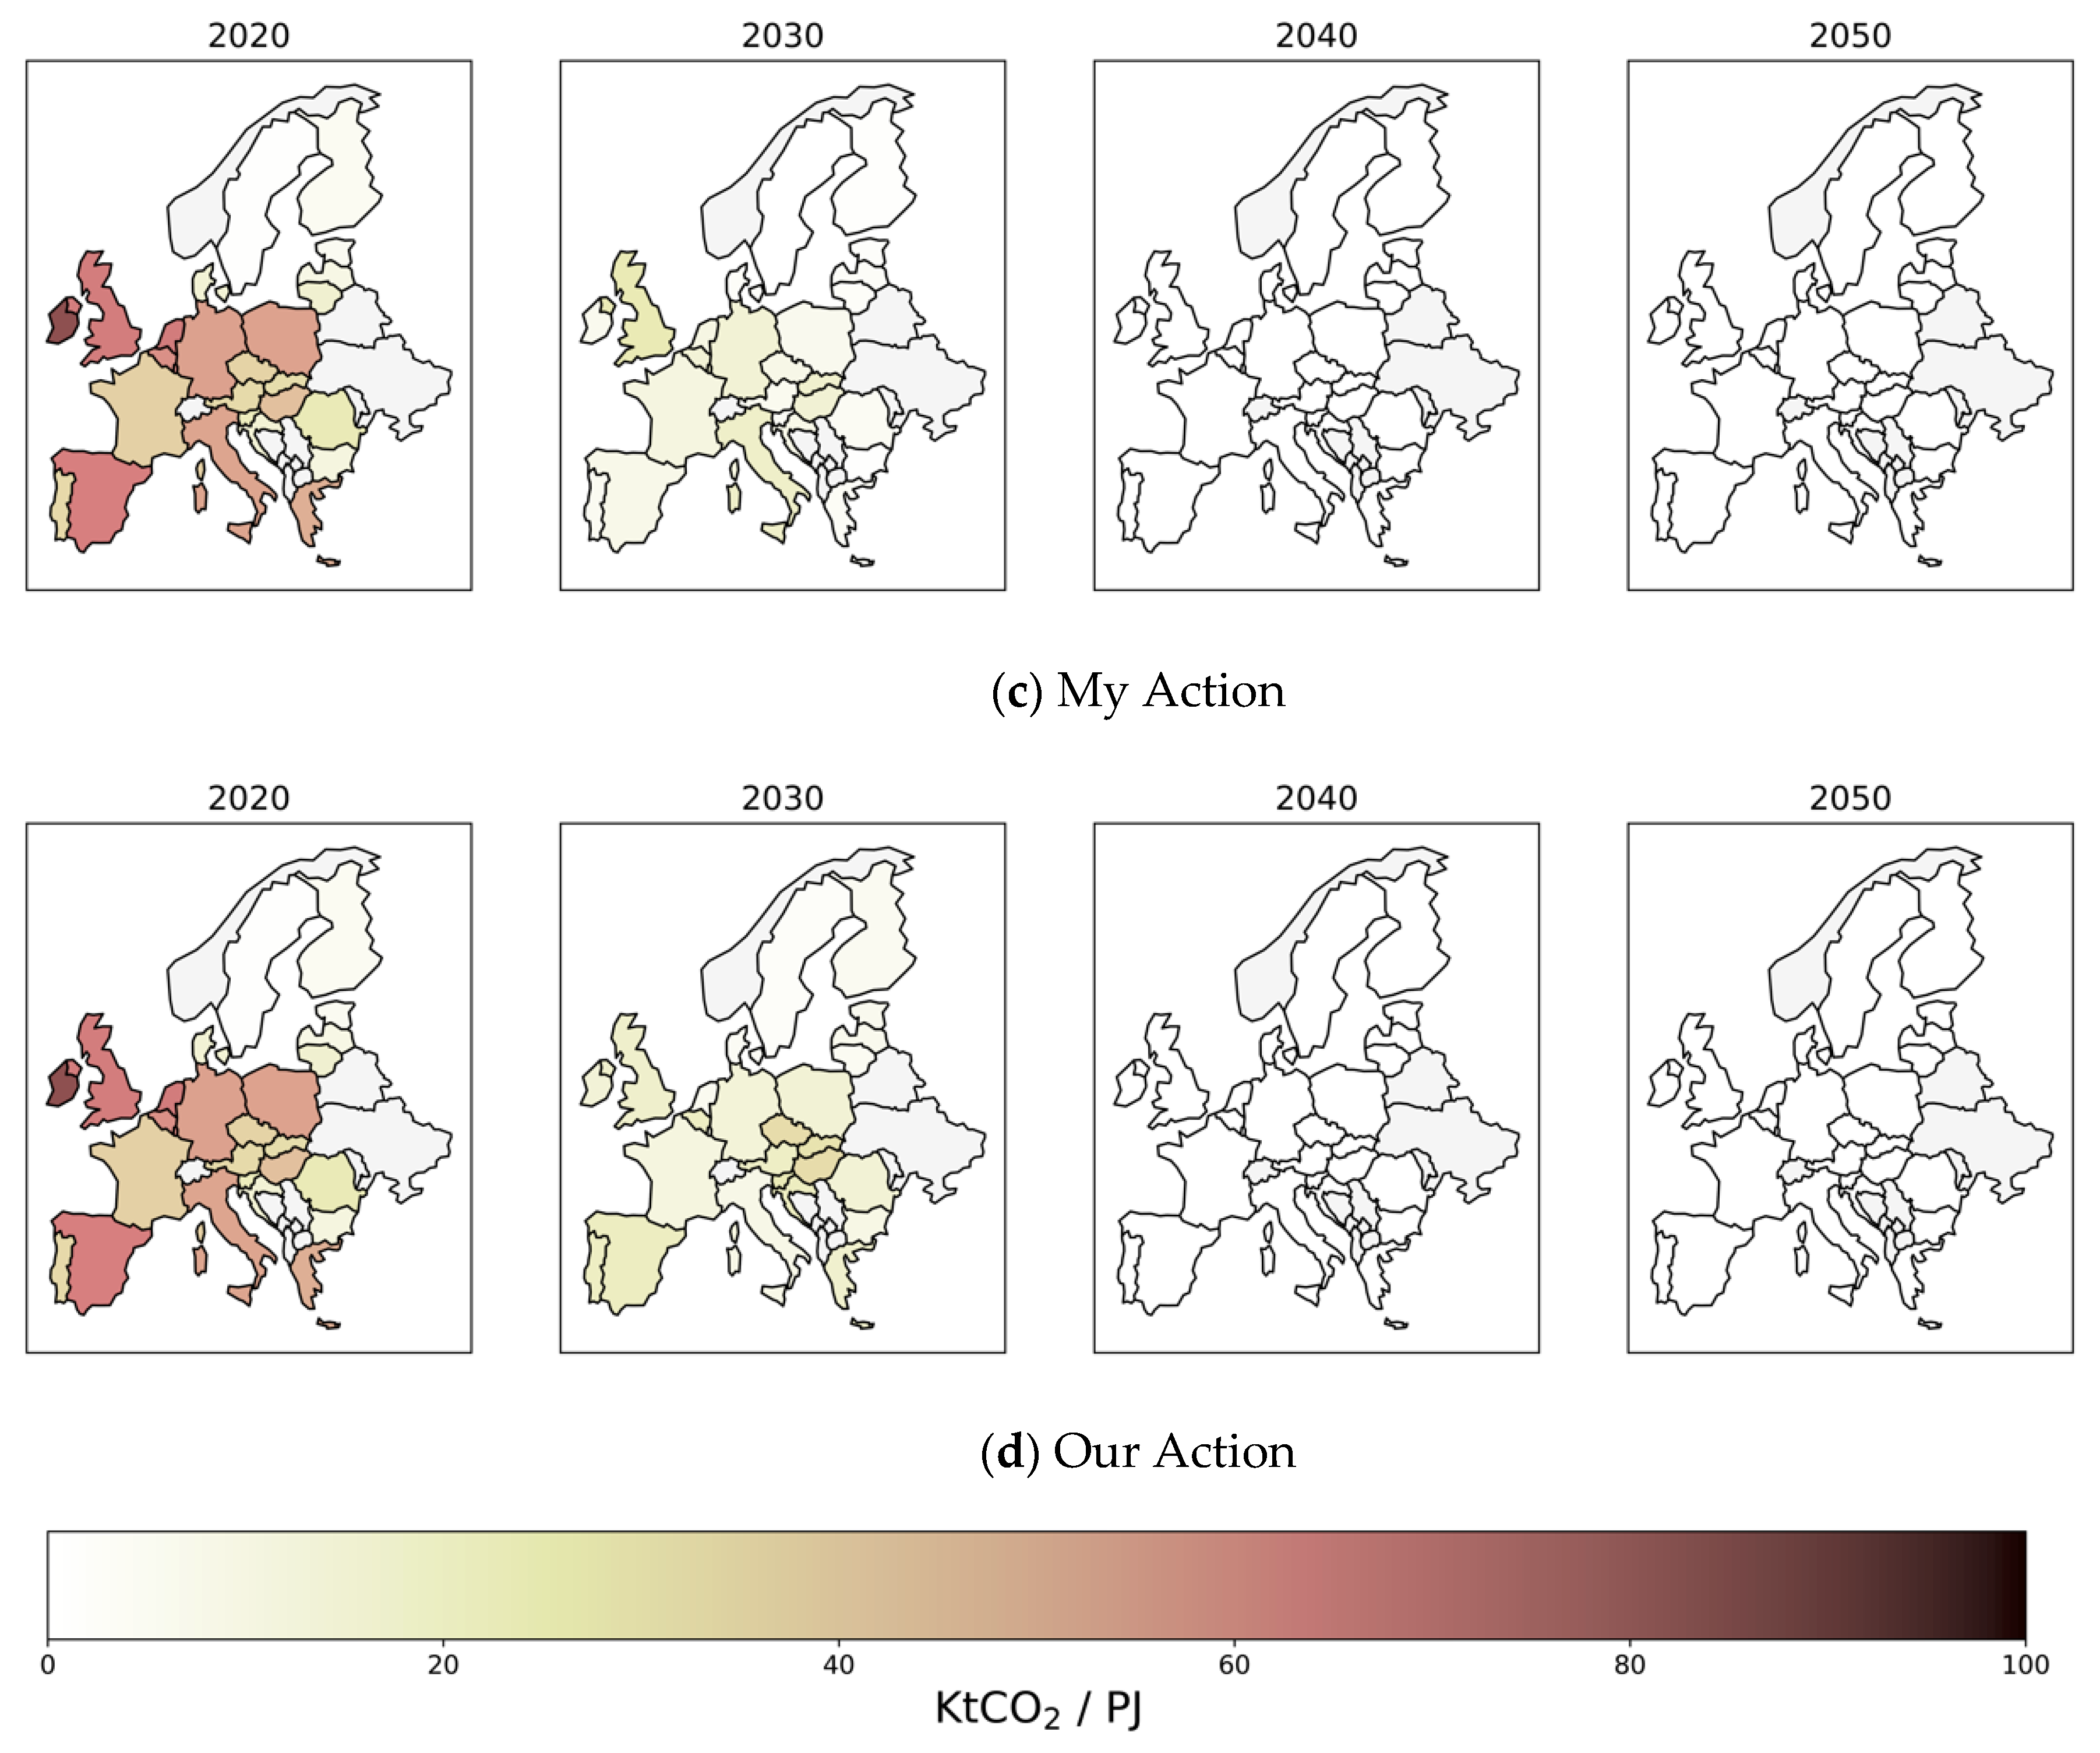
In all scenarios, we observe a decline in fossil fuel consumption for residential space heating across Europe, as depicted in Figure 14. While the use of fossil fuels decreases, the delayed climate action scenarios project its persistence in the form of natural gas until 2050 (see Figure 6). Conversely, fossil fuels will be completely phased out by 2040 in all countries in the ambitious climate control scenarios. In the My Action scenario, a consistent decline rate in fossil fuel use is observed across Europe. However, in the Our Action scenario, the rate of decline varies among European countries; notably, Spain, Portugal, Belgium, Croatia, Hungary, and Czechia show higher fossil fuel utilization in 2030 compared to the My Action scenario before phasing it out completely in 2040. Moreover, in the Our Action scenario, there is a slight increase in fossil fuel use between 2020 and 2030, such as in Hungary, Croatia, Austria, and Slovenia, before it is phased out by 2040.
Figure 15 illustrates the evolution of the CO2 emission intensity per unit of space heating energy consumption. The overall trends are very similar to those observed for fossil fuel consumption in Figure 14. In the ambitious climate action scenarios, it is evident that all countries achieve zero CO2 emission intensity by 2040. Conversely, in the delayed climate control scenarios, we see that the reduction in space heating emission intensity never reaches a level of zero entirely due to the persistent use of natural gas. The My Action scenario presents a pathway in which all countries contribute equally to the overall ambitious climate target achievement. However, in the Our Action scenario, we observe a variety of trajectories across EU member states in reaching an overall zero level of space heating emission intensity.

4. Discussion

In all scenarios, we observe an evident decoupling between population growth and the energy requirements for space heating, as depicted in Figure 3. Despite the projection of an increasing dwelling stock driven by population growth, we find a notable reduction in the energy needs for space heating. In 2050, the achieved climate control scenarios have the potential to reduce residential space heating demand by 19% compared to the 2020 level. In contrast, the climate target scenarios falling short result in only a 9% reduction in space heating demand. This projected decrease is a result of the implementation of energy-saving measures. The ambitious climate scenarios yield higher energy savings due to a more aggressive rate of dwelling renovations, as opposed to the delayed climate action scenarios.
Based on Figure 4, we can assess the composition of renovated dwellings based on the construction period. In all scenarios, the dwelling renovation efforts prioritize older dwellings, which typically have the highest energy demand and hence possess the largest energy savings potential. This trend is particularly evident in the My Action scenario, in which limited collaboration materializes to reach ambitious climate targets, without target sharing. In the short term, up to 2035, we project slightly greater energy savings from renovation in the My Action scenario in comparison to the Our Action scenario. In Our Action, where we depict shared responsibility, it proves more cost-effective to renovate relatively newer dwellings in member states in which renovation costs are low rather than consistently prioritizing older dwellings, such as in the My Action scenario. Consequently, up to 2035, fewer old dwellings undergo renovation in the Our Action scenario, resulting in lower energy savings from retrofitting than in My Action. This trend reverses from 2040 onwards, where we observe that the retrofitting target in the Our Action scenario is fulfilled primarily by renovating relatively old dwellings, with fewer new dwellings being renovated in comparison to the My Action scenario. As a result, Our Action realizes higher energy savings from 2040 onwards. In connection with these findings, we observe higher annual costs in the My Action scenario in comparison to the Our Action scenario until 2040 (see Figure 5).
In Figure 6, we observe a consistent consumption of direct heat in all scenarios, partially influenced by a model constraint of direct heat supply at least above the 2015 level. This specific constraint is intended to take into account the renewable heating target as renounced under article 24 in [40] (i.e., through district heating and geothermal). The deployment of heat pumps and electric boilers is consistently higher in full collaboration scenarios than in each corresponding partial collaborative scenario. This is due to lower endogenous electricity prices in the former compared to those in the latter. The difference in electricity prices results from distinct assumptions that control renewable energy supply in the power sector simulated in TIMES-Europe. In the full collaboration scenarios, there is an aggregated 60% renewable energy supply throughout Europe, whereas in the partial collaboration scenarios, each country is obliged to achieve on its own at least 60% electricity supply through renewable energy generation. In full collaboration scenarios, the 60% renewable electricity target can be achieved by deploying renewable energy technologies where they are the most cost-effective. This leads to lower overall power system costs and subsequently results in a lower endogenous electricity price. The higher electrification rate, achieved through increased penetration of heat pumps and electric boilers, leads to a reduction in the use of other fuels, particularly biomass, which provides between 4% and 24% of space heating across the various scenarios. A notable disparity is evident between scenarios that meet the climate target and those that fall short of it, as illustrated in Figure 7. In the former, designed to rapidly achieve our climate objectives and driven by the zero-emission policy target, a transition away from fossil fuels will be realized around 2040. In contrast, in the latter, which lacks ambitious climate policies, fossil fuels continue to be used without substantial reduction until 2050. Consequently, a distinct contrast in emission levels across Europe becomes evident. The reduction in emissions up to 2035 in the delayed climate control scenarios is attributed to the removal of inefficient coal and oil boilers. Conversely, gas boilers remain relatively attractive for supplying residential space heating beyond 2040, which results in a relatively constant emissions level beyond that year.
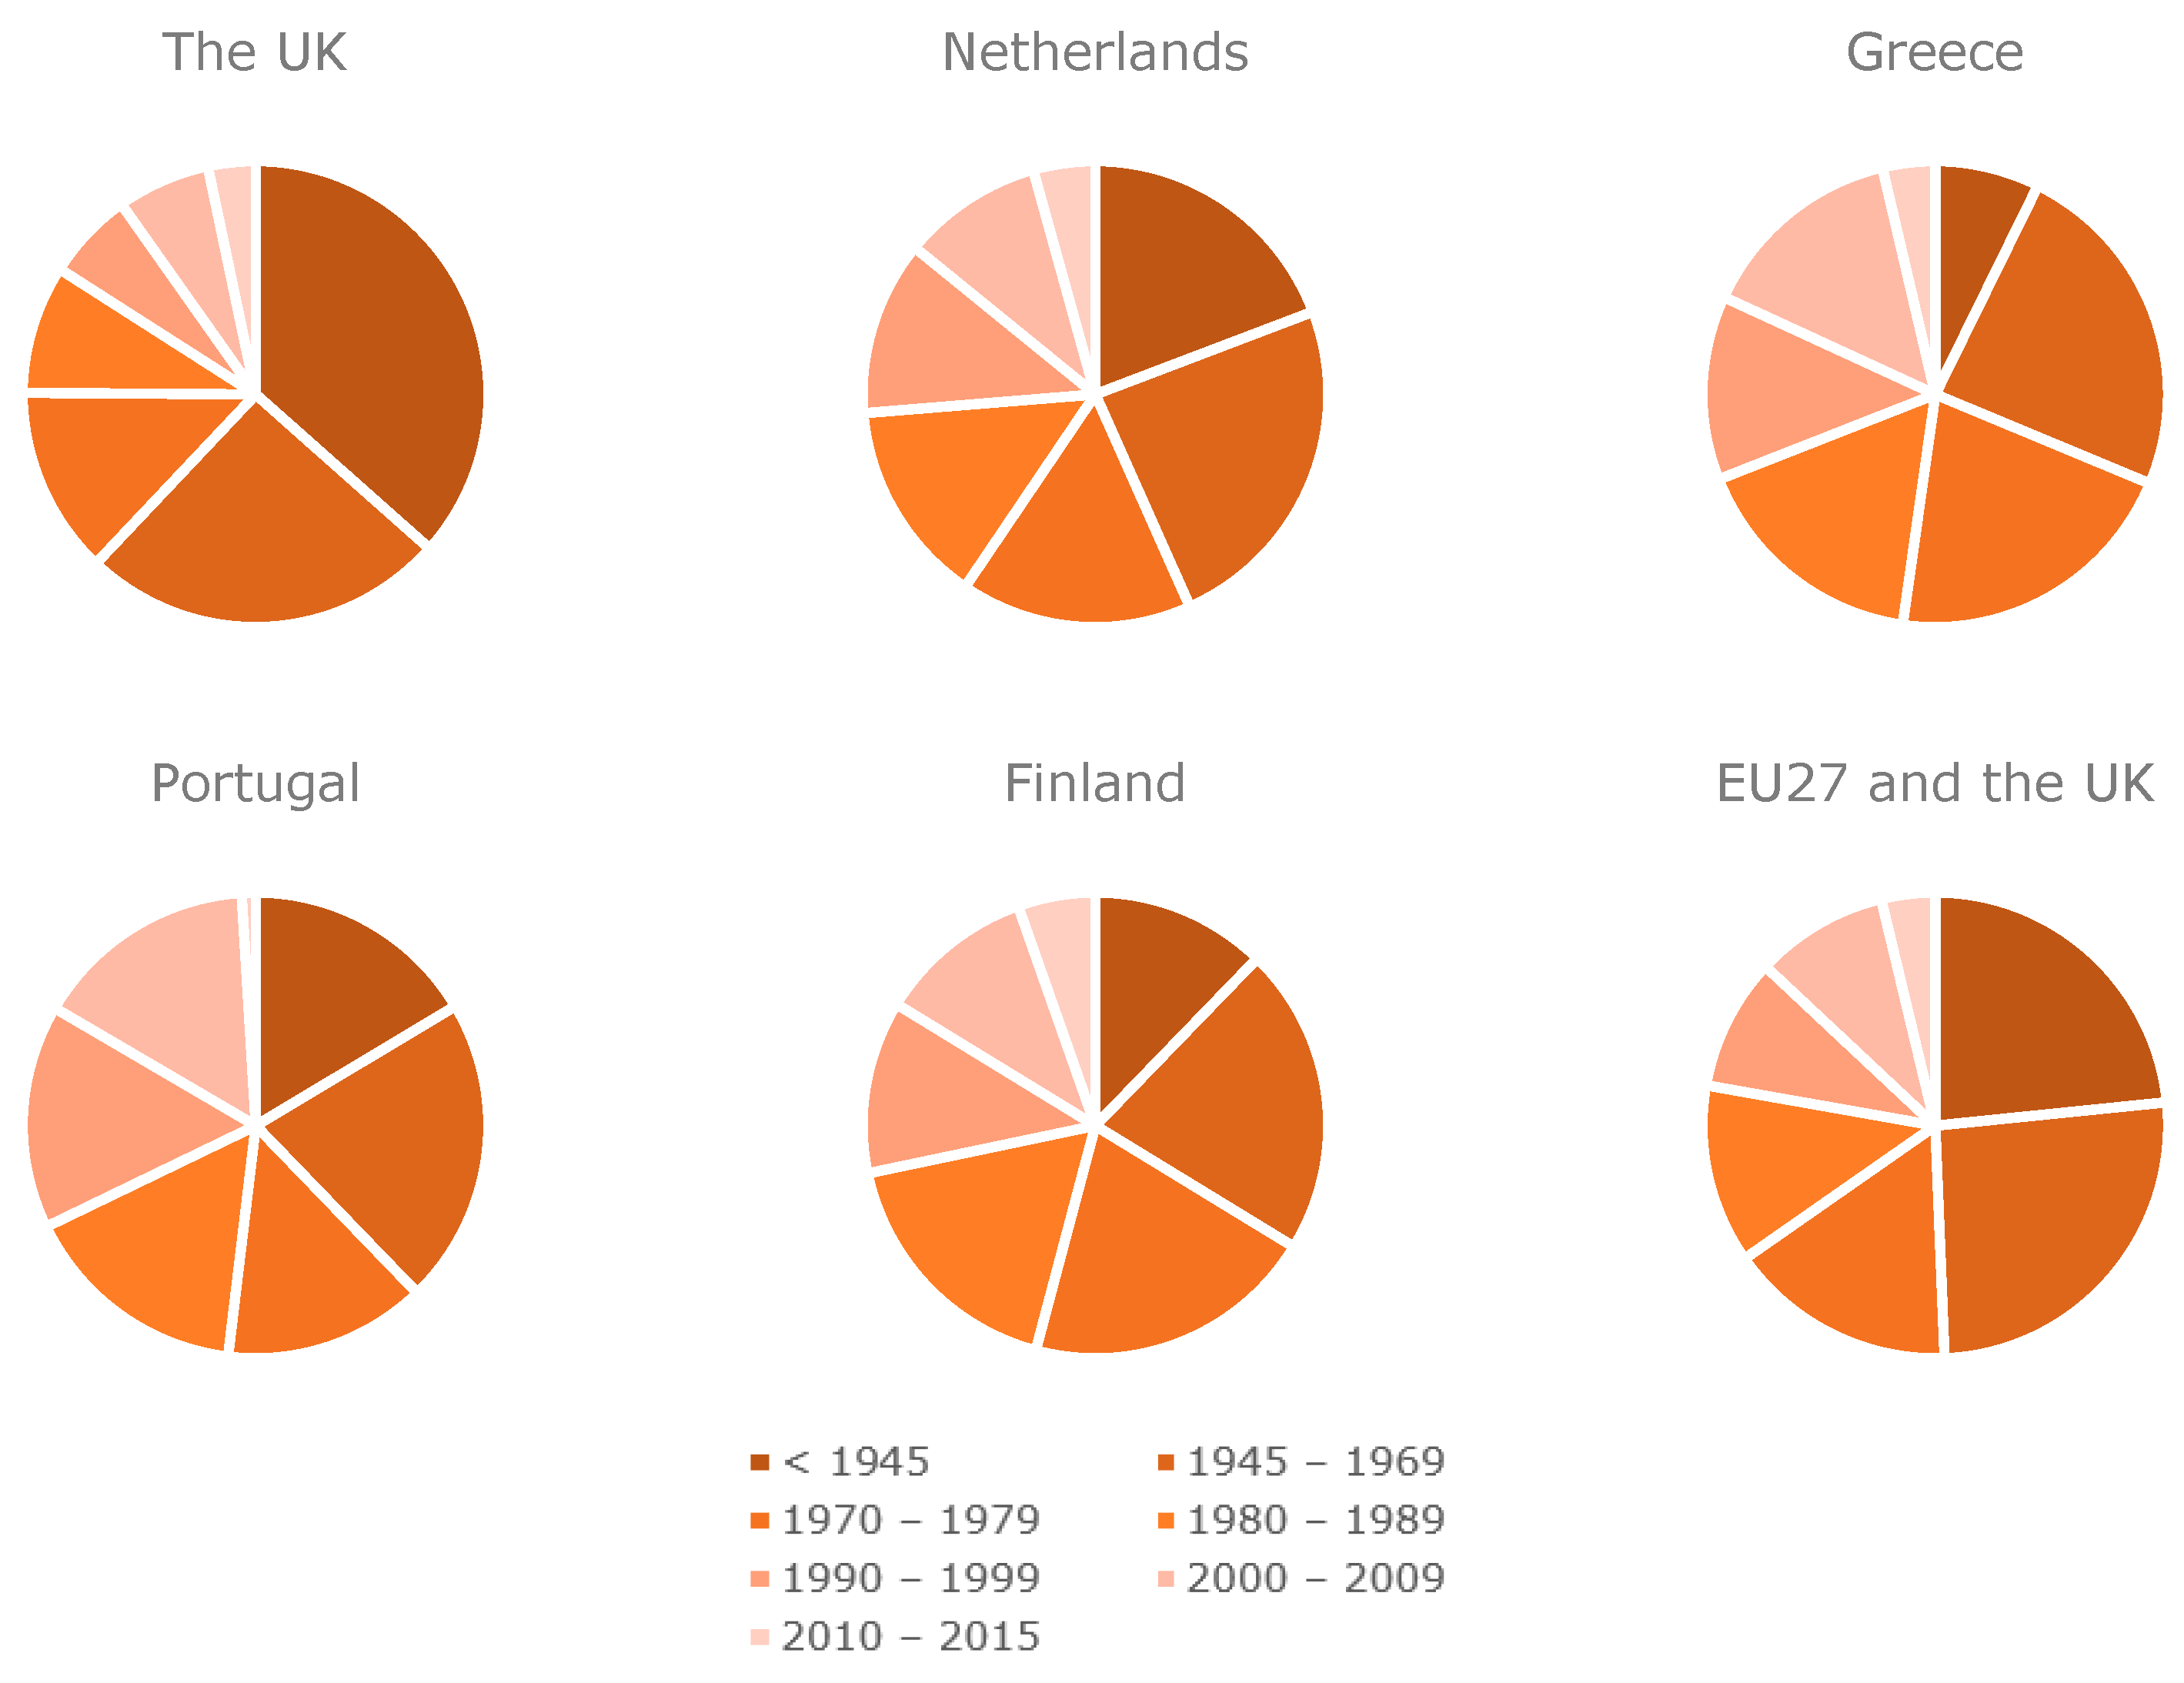
At the country level, visualizations of energy savings from retrofitting in all scenarios (Figure 8) reveal a concentration of retrofitting efforts in Western and Eastern Europe. This suggests that dwelling renovation is the most cost-effective in this region. In the partial collaboration scenarios, the countries selected for retrofitting are primarily chosen due to the prevalence of relatively old dwellings with substantial space heating energy demands. As an example, Figure 16 illustrates the dwelling age ratio between the UK, the Netherlands, and Greece, in comparison to the overall European average. The UK has a higher proportion of older dwellings compared to the Netherlands and Greece, which leads to correspondingly higher energy savings (after retrofitting) in the UK. In the full collaboration scenarios, the cost-effectiveness of a renovation plays a key role in determining where the renovation takes place. This results in a distribution across Europe that emphasizes several countries, such as the UK and Croatia. The concentration of renovation efforts in Western and Eastern Europe corresponds to a higher cost burden in these regions, as illustrated in Figure 9. Moreover, sharing the dwelling renovation target not only induces a larger number of retrofitted dwellings in priority countries but also triggers a lower deployment of retrofitting in countries, like Finland and Portugal, where retrofitting is less cost-effective due to the relatively large share of newer dwellings (see Figure 16). This underscores the importance of tailoring retrofitting strategies to the specific housing stock characteristics of each country in order to maximize cost-effectiveness and overall impact on energy savings.
The prevalence of specific space heating technologies in each country (Figure 10, Figure 11, Figure 12, Figure 13 and Figure 14) depends on two key factors: (1) the exogenous average European commodity price (for coal, oil, gas, and biomass) that applies uniformly to all member states and (2) the endogenous electricity price that is unique to each country. In the ambitious climate control scenarios, fossil fuel consumption will be reduced to zero in all countries by 2040. In the My Action scenario, the trajectory for reducing fossil fuel usage dictates that the phase out occurs equally for all EU member states. In contrast, the Our Action scenario, which involves target sharing, allows a few countries to reduce fossil fuel consumption less than other EU member states or even increase it slightly before completing the phase out by 2040. In the non-climate-compliant climate target scenarios, several countries continue to use fossil fuels for space heating beyond 2040, as a result of the absence of residential policies to achieve the official overall climate targets, which highlights the critical role of targeted policy interventions in driving sustainable energy transitions. We find that in the My Delay scenario, the use of fossil fuels is concentrated in the UK and Italy, while in the Our Delay scenario, it is mainly present in the UK. The overall reduction in emission intensity from residential space heating follows a similar pattern as that for the phase out of fossil fuels, as shown in Figure 15.

5. Conclusions and Outlook

Through our analysis, we highlight the urgency of implementing the official EU policies with regard to space heating in order to meet the ambitious Green Deal and EU Climate Law targets for the European residential sector. We project energy savings that surpass those associated with recent renovation trends by more than a factor of two. Our results show that older dwellings are being renovated first; in other words, a prioritization materializes in renovation efforts toward older and relatively energy-inefficient dwellings until 2030, primarily focusing on houses dating from prior to, or directly after, 1945. Yet, considering the historical significance of many of these older dwellings in Europe, achieving a balance between preserving cultural heritage and implementing renovation is essential, as also emphasized by the EU itself [47].
The significance of collaborative measures in achieving the EU climate targets cannot be overstated; for instance, considering electrification in Our Action scenarios where countries share the burden of reaching 60% renewable electricity generation, which yields up to 68% electricity-based residential space heating. In contrast, in My Action, each country is obliged to reach 60% renewable electricity generation on its own, which triggers approximately 58% electricity-based technologies being used to supply space heating demand. Moreover, a comprehensive collaborative effort allows for strategic optimal resource allocation, concentrating renovation in those countries in which energy savings have the most significant impact under the least costs. Our research has developed three standardized renovation packages with regional applicability. While this standardized approach offers advantages for general use, it may potentially diminish the appeal of renovation in countries with already well-insulated dwellings in comparison to the EU average, such as those in the Scandinavian region.
Our findings on the distribution of renovation costs per person highlight the burden borne by each country. However, energy justice principles should be taken into account when formulating climate policies in order to ensure a fair transition in the European residential sector—along with the other economic sectors—as highlighted by several analysts (see [48,49]). For instance, the potential occurrence of energy poverty needs to be considered, as identified in recent studies, such as by van Hove et al. [50]. Including aspects of energy, poverty is crucial for addressing the broader socio-economic dimensions of energy use, ensuring fair and equitable access to resources and technologies and recognizing the politics and power dynamics of the energy transition in the EU.
The necessity to transition away from fossil fuels drives the widespread electrification of the European residential sector, primarily accomplished through the deployment of heat pumps and electric boilers. This reinforces the importance of pursuing electrification strategies in the European residential sector. We limited heat pump installations to dwellings with an equivalent energy label of C or better. However, dwellings with slightly higher space heating capacity requirements than those specified by energy label C could still accommodate heat pumps, provided that renovation measures are implemented to enhance their insulation performance first. In addition to electricity, our assessment of space heating supply highlights the potential for other promising forms of energy supply, such as the use of direct heat and biomass, to substitute for fossil fuels in the residential sector. However, this critically hinges on individual country-specific prices of commodities and their availability, factors that were not considered in our present study. Addressing these aspects will be the focus of our future studies, along with our intention to enhance the technology options in the TIMES-Europe residential module, including e-fuels.
The present study does not explicitly take into account the EU effort-sharing regulation on emission reduction targets, as recently updated by the EU [51]. This regulation was established to reduce greenhouse gas emissions from domestic transport (excluding aviation), agriculture, small industry, and the waste and building sectors. Further investigations are needed to incorporate this facet of EU regulation, which could provide insight into the interactions between the building sector and other GHG-emitting sectors. We intend to perform this in follow-up analyses. In addition, European policies for the building sector also encompass structures with non-residential functionalities, such as the service sector, which is not yet included in this research framework. Given that numerous policy targets apply to all types of buildings, incorporating both residential and non-residential domains would shed light on the synergies and challenges posed by aligning policies for these distinct yet interconnected sectors. Furthermore, a national-level model is potentially necessary to incorporate details overlooked in our model assumptions; for instance, the differences in climate regions within each country and the effects of human behavior.
Our study addresses the question of how to navigate the space heating transition in the European residential sector and reveals the complex interdependencies between climate policies, technologies, and collaboration levels. The insights gained from the present research offer guidance for policymakers, researchers, and stakeholders as they navigate the path toward a sustainable and resilient energy future. Simultaneously, our analysis highlights the need for further research, focusing on several key areas. First, we recommend delving deeper into the emission reduction potential of the European dwelling stock, particularly in the context of the dwelling renovation potential and the importance of adopting a holistic approach to address potential conflicts between different policies, such as those involving heritage buildings. Furthermore, we recommend providing a comprehensive overview of renovation options that account for the distinct physical characteristics of dwellings in each member state. In addition, incorporating country-specific fuel prices and renovation measures would enhance the clarification of resource availabilities in each EU member state.
Second, we recommend undertaking in-depth research on the direct effect of climate change on energy demand in the residential sector. In the present study, we assume that energy consumption in European households is primarily driven by space heating requirements. However, this assumption is currently under re-evaluation. As highlighted by [52], changing climatic conditions are triggering a shift in the predominant energy needs of various countries. This transition entails a shift from a focus on space heating demand to either space cooling demand or a more balanced demand encompassing both space cooling and heating. This change plays a significant role in shaping member state-specific energy transition pathways in the European residential sector. An inquiry into this subject matter with a greater temporal resolution is also considered important to capture the projected evolving patterns of household energy demand more precisely. Expanding energy transition research in this direction will not only allow us to better capture the spatial variations within the residential sector, as addressed in this study, but will also improve our understanding of the temporal fluctuations that affect the energy needs in the European residential sector.

Author Contributions

S.S.S.: conceptualization, methodology, data curation, formal analysis, visualization, and writing–original draft. S.L.L.: conceptualization and methodology. F.D.L.: conceptualization, methodology, visualization, and writing—review and editing. B.v.d.Z.: conceptualization, writing—review and editing, and supervision. All authors have read and agreed to the published version of the manuscript.

Funding

This research received no external funding.

Data Availability Statement

The original contributions presented in the study are included in the article, further inquiries can be directed to the corresponding authors.

Acknowledgments

S.S.S., S.L.L., F.D.L., and B.v.d.Z. thank the Ministry of Economic Affairs and Climate Policy of the Netherlands for its financial support for research on the international dimensions of the energy transition. The views expressed in this paper are exclusively those of the authors.

Conflicts of Interest

The authors declare no conflict of interest.

Appendix A. Renovation Cost

The renovation cost per dwelling is determined by multiplying the renovation cost per square meter of building elements (Table A1) by the average dwelling size per country (Table A2). The investment cost associated with building elements is drawn from the databases cited in [21,37], and these costs are subsequently normalized using the Eurostat construction cost indices [53]. Table A3 and Table A4 display the renovation costs for each of the renovation packages, as detailed in the Section 2.
Table A1. Investment cost of building element isolation improvement.
Ceiling—Insulation Wall—Exterior InsulationWindows
Euro/m2 RoofEuro/m2 WallEuro/m2 of Window
30 cm20 cm15 cm20 cm15 cm10 cmTriple GlassDouble GlassSingle Glass
AT254856131712799337270183
BE243815830412295376305212
BG3751259046918814617111760
CH254856131712799272209134
CY230775528811590243155117
CZ288966935914411217415893
DE2638863328131102332266181
DK231775528911690385313217
EE260876232413010121315389
ES243815830312194273211137
FI226755428311388341273185
FR243815830312194350283195
EL213715126610683238177107
HR23077552871158921415488
HU3081037438515412020214378
IE243815830412295324257174
IS255856131912799274210135
IT230775528711589311246164
LT283946835414211019113371
LU243815830412295344278193
LV294987036814711519113372
MT2869568357143111226166100
NL243815830412295342275189
NO255856131912799274210135
PL263886332813110220414581
PT25184603141269822816799
RO283946835414211018813068
SE255856131912799401327229
SI2688964336134104239178109
SK25485613171279920414683
UK243815830412295280217140
AL211705026310582226174112
BA211705026310582226174112
ME2879669359144112308237152
MK2979971371148115318245157
RS37512590469188146402309199
KS37512590469188146402309199
Table A2. Average dwelling size per country [37].
Average Size of Dwelling by Type
Apartment
[m2]
Detached
[m2]
Semi-Detached
[m2]
Albania73.096.877.4
Austria71.6123.999.1
Bosnia63.670.456.3
Belgium73.2129.0103.2
Bulgaria64.567.253.8
Switzerland71.6131.8105.5
Cyprus73.099.879.9
Czech Rep.61.0105.484.4
Germany62.7118.294.5
Denmark78.4140.1112.1
Estonia47.888.370.6
Greece73.096.877.4
Spain86.4128.4102.7
Finland56.0104.283.4
France65.9121.397.1
Croatia63.670.456.3
Hungary46.795.076.0
Ireland66.5134.2107.3
Iceland56.0105.784.6
Italy90.8124.899.9
Kosovo63.670.456.3
Lithuania51.6100.380.2
Luxembourg85.897.177.7
Latvia51.598.278.6
Montenegro73.096.877.4
Macedonia63.672.758.2
Malta85.0120.896.6
Netherlands75.8137.3109.9
Norway66.8132.4105.9
Poland52.598.678.8
Portugal96.7125.7100.5
Romania48.073.258.6
Serbia63.671.156.9
Sweden66.8130.1104.1
Slovenia51.697.377.8
Slovakia61.397.377.8
United Kingdom48.496.277.0
Table A3. Renovation package investment cost for pre-1990 dwellings.
Renovation Package Investment Cost for Pre-1990 Dwellings
(Euro/Dwelling)
DetachedSemi-DetachedApartment
DeepMediumShallowDeepMediumShallowDeepMediumShallow
AT25,81513,598810016,81170382430990928511944
BE26,86214,647915017,1247352274510,02230882196
BG17,7317923351012,5984752105313,50741031685
CH25,11812,119626917,18367831881947024121505
CY17,6238676465011,927476913957522979558
CZ21,83910,047474015,30358691422883520151138
DE25,47713,410798016,59969452394914227381915
DK27,64315,055939017,6357565281711,78447393380
EE17,5068598459011,86247361377654617221102
ES23,89011,780633016,155646618999118972506
FI21,49112,318819013,2555917245711,42664984914
FR25,08113,639849019,44710,293382111,89156744075
EL16,92889165310948630771062835523111274
HR13,744745246208793375913866419736444
HU20,7879410429014,67955781287734717491030
IE26,12913,426771017,2667104231316,94310,6427402
IS21,49711,018630214,22758431891777822261512
IT23,55012,398738015,341642022148815704443
LT23,92310,176399014,1975362119712,2432243958
LU21,67612,479834011,3393981166811,17030462002
LV20,2949050399014,4335438119776131716958
MT24,44911,022498017,2996558149411,86324111195
NL27,10714,102825021,47311,069371310,08029031980
NO25,33612,209630217,34368411891898623641512
PL18,9438879435013,15251011305795825991566
PT22,80210,532501015,9476131150311,85524161202
RO15,5977530390010,6664212117011,74664623744
SE28,51315,614981018,12778082943982832062354
SI20,0719912534013,56154331602735719741282
SK18,2928698438012,60849321314786918281051
UK19,71810,609651012,6755388195312,18075976250
AL16,7008773520710,892455115626484505312
BA13,57278035207835337381562713019201250
ME22,77111,963710014,8526206213010,90527521704
MK19,49911,111733612,0755364220110,04527041761
RS24,31113,939927114,9916693278112,69634182225
KS29,61615,585927114,8746656278110,19331332225
Table A4. Renovation package investment cost for post1990 dwellings.
Renovation Packages Investment Cost for Post-1990 Dwellings
(Euro/Dwelling)
DetachedSemi-DetachedApartment
DeepMediumShallowDeepMediumShallowDeepMediumShallow
AT65,87226,60310,11048,27116,856303327,83551492426
BE67,03427,77111,28048,61517,205338427,67153822707
BG49,89318,370513037,85412,635153939,94697172462
CH67,49725,713816450,58417,157244927,36746821959
CY48,12719,369729035,31712,310218723,1682137875
CZ59,04321,140522045,23114,908156625,80738841253
DE65,03826,251996047,67116,641298825,44248602390
DK69,00728,54411,55050,07817,708346530,87882344158
EE47,04618,415639034,90011,995191718,90033941534
ES63,46524,539819047,30016,159245728,2342052655
FI52,09922,61410,23037,03613,448306926,73010,8906138
FR62,72425,94710,50053,56624,144472529,82198365040
EL43,71117,957714028,0757472142824,25148221714
HR35,14014,915642025,2259045192619,7591493616
HU57,98821,419606043,94614,690181821,60736141454
IE67,69926,869972049,95217,288291639,30419,0529331
IS56,03922,354820741,26614,319246221,95641111970
IT60,22924,385933044,09215,416279927,4151342560
LT68,47624,289573042,61114,214171937,37452321375
LU52,30022,73710,32032,6529002206431,72256102477
LV57,05220,910573043,35514,441171922,60536501375
MT68,06424,906678051,75217,226203435,65752731627
NL69,61727,81610,26060,12826,688461728,29952312462
NO68,12125,928820751,06817,314246225,81045241970
PL52,05419,706612039,10113,223183622,52853042203
PT62,84623,405684047,48815,935205235,62352821642
RO42,45916,530564031,56210,819169230,55313,5675414
SE70,90429,44312,03051,37218,203360926,72854422887
SI53,54020,885717039,76913,645215121,10137971721
SK49,91219,073612037,36312,691183623,21537991469
UK49,97520,697840036,24812,826252026,83812,1058064
AL42,95817,481678131,38311,002203420,203983407
BA33,11314,569678123,3978562203420,38536371627
ME58,57523,836924642,79315,002277431,57153642219
MK47,84120,878955333,92812,357286628,72051242293
RS59,41626,07612,07442,03015,358362236,29864762898
KS76,11531,01512,07448,27116,856303328,31656212898

Appendix B. Proportion of Renovated Dwellings by Age
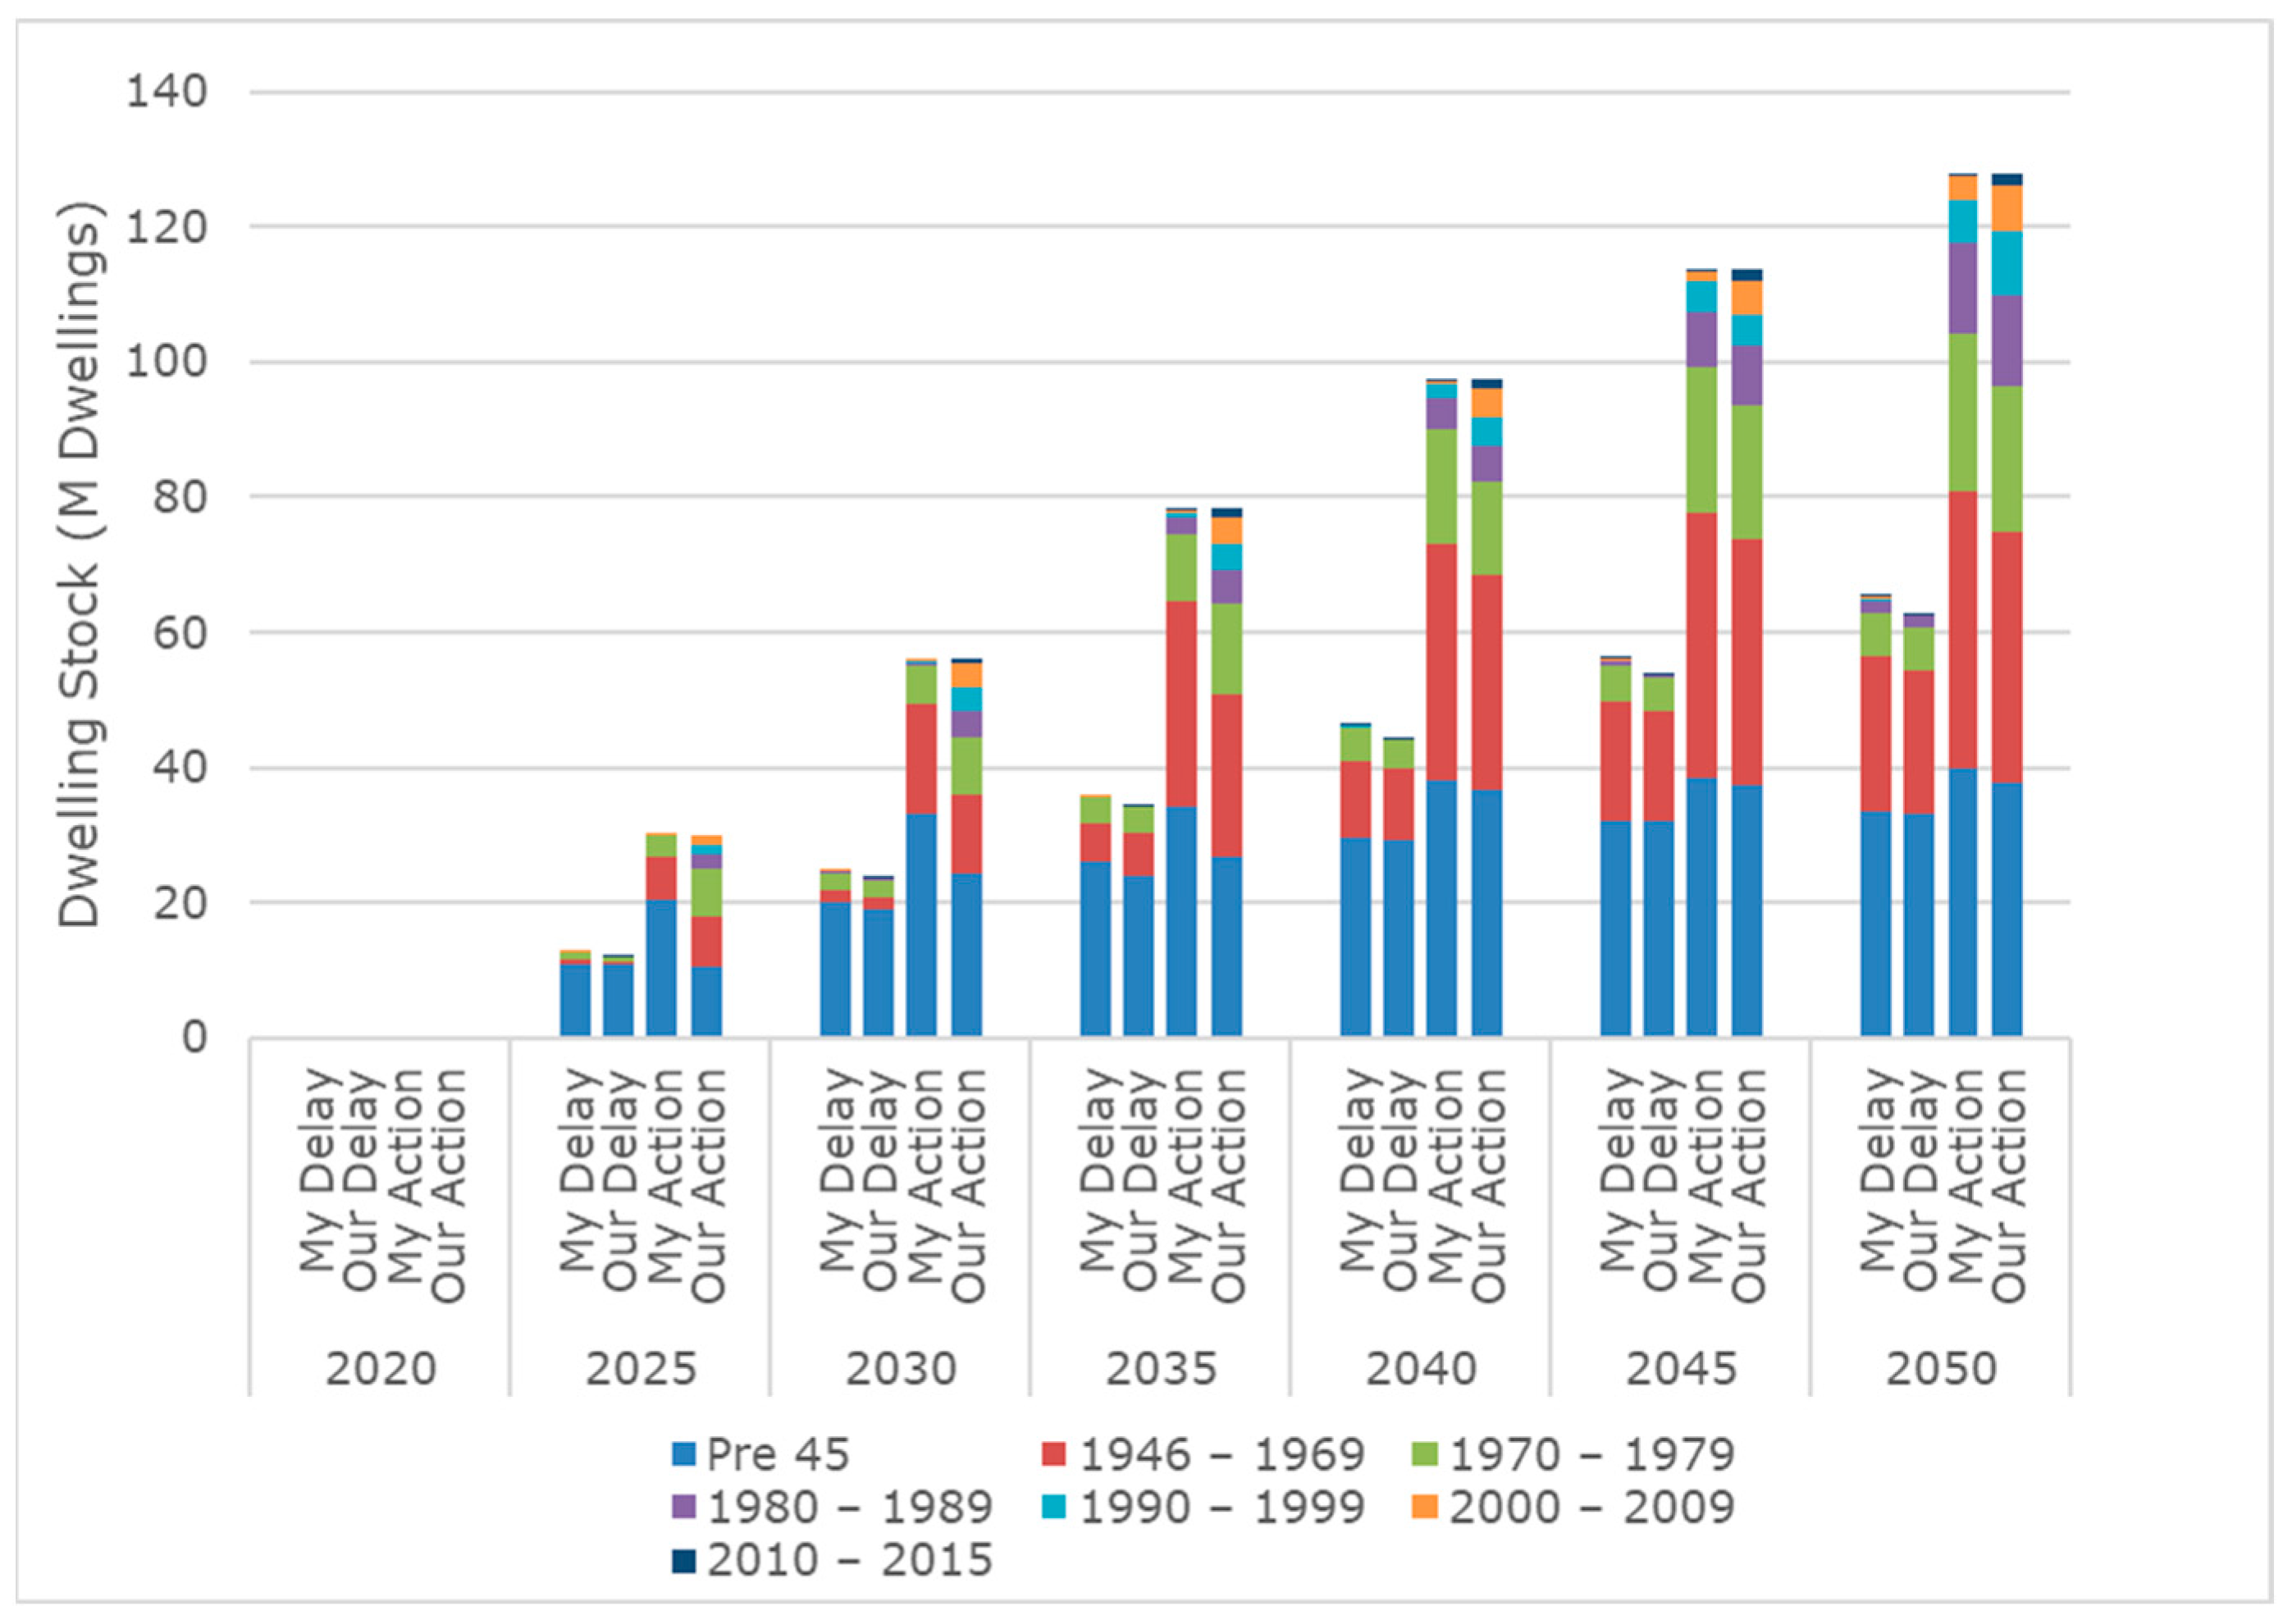
Figure A1. Age distribution of renovated dwellings.
Energies 17 02363 g0a1

Appendix C. Europe Residential Space Heating Technology Mix
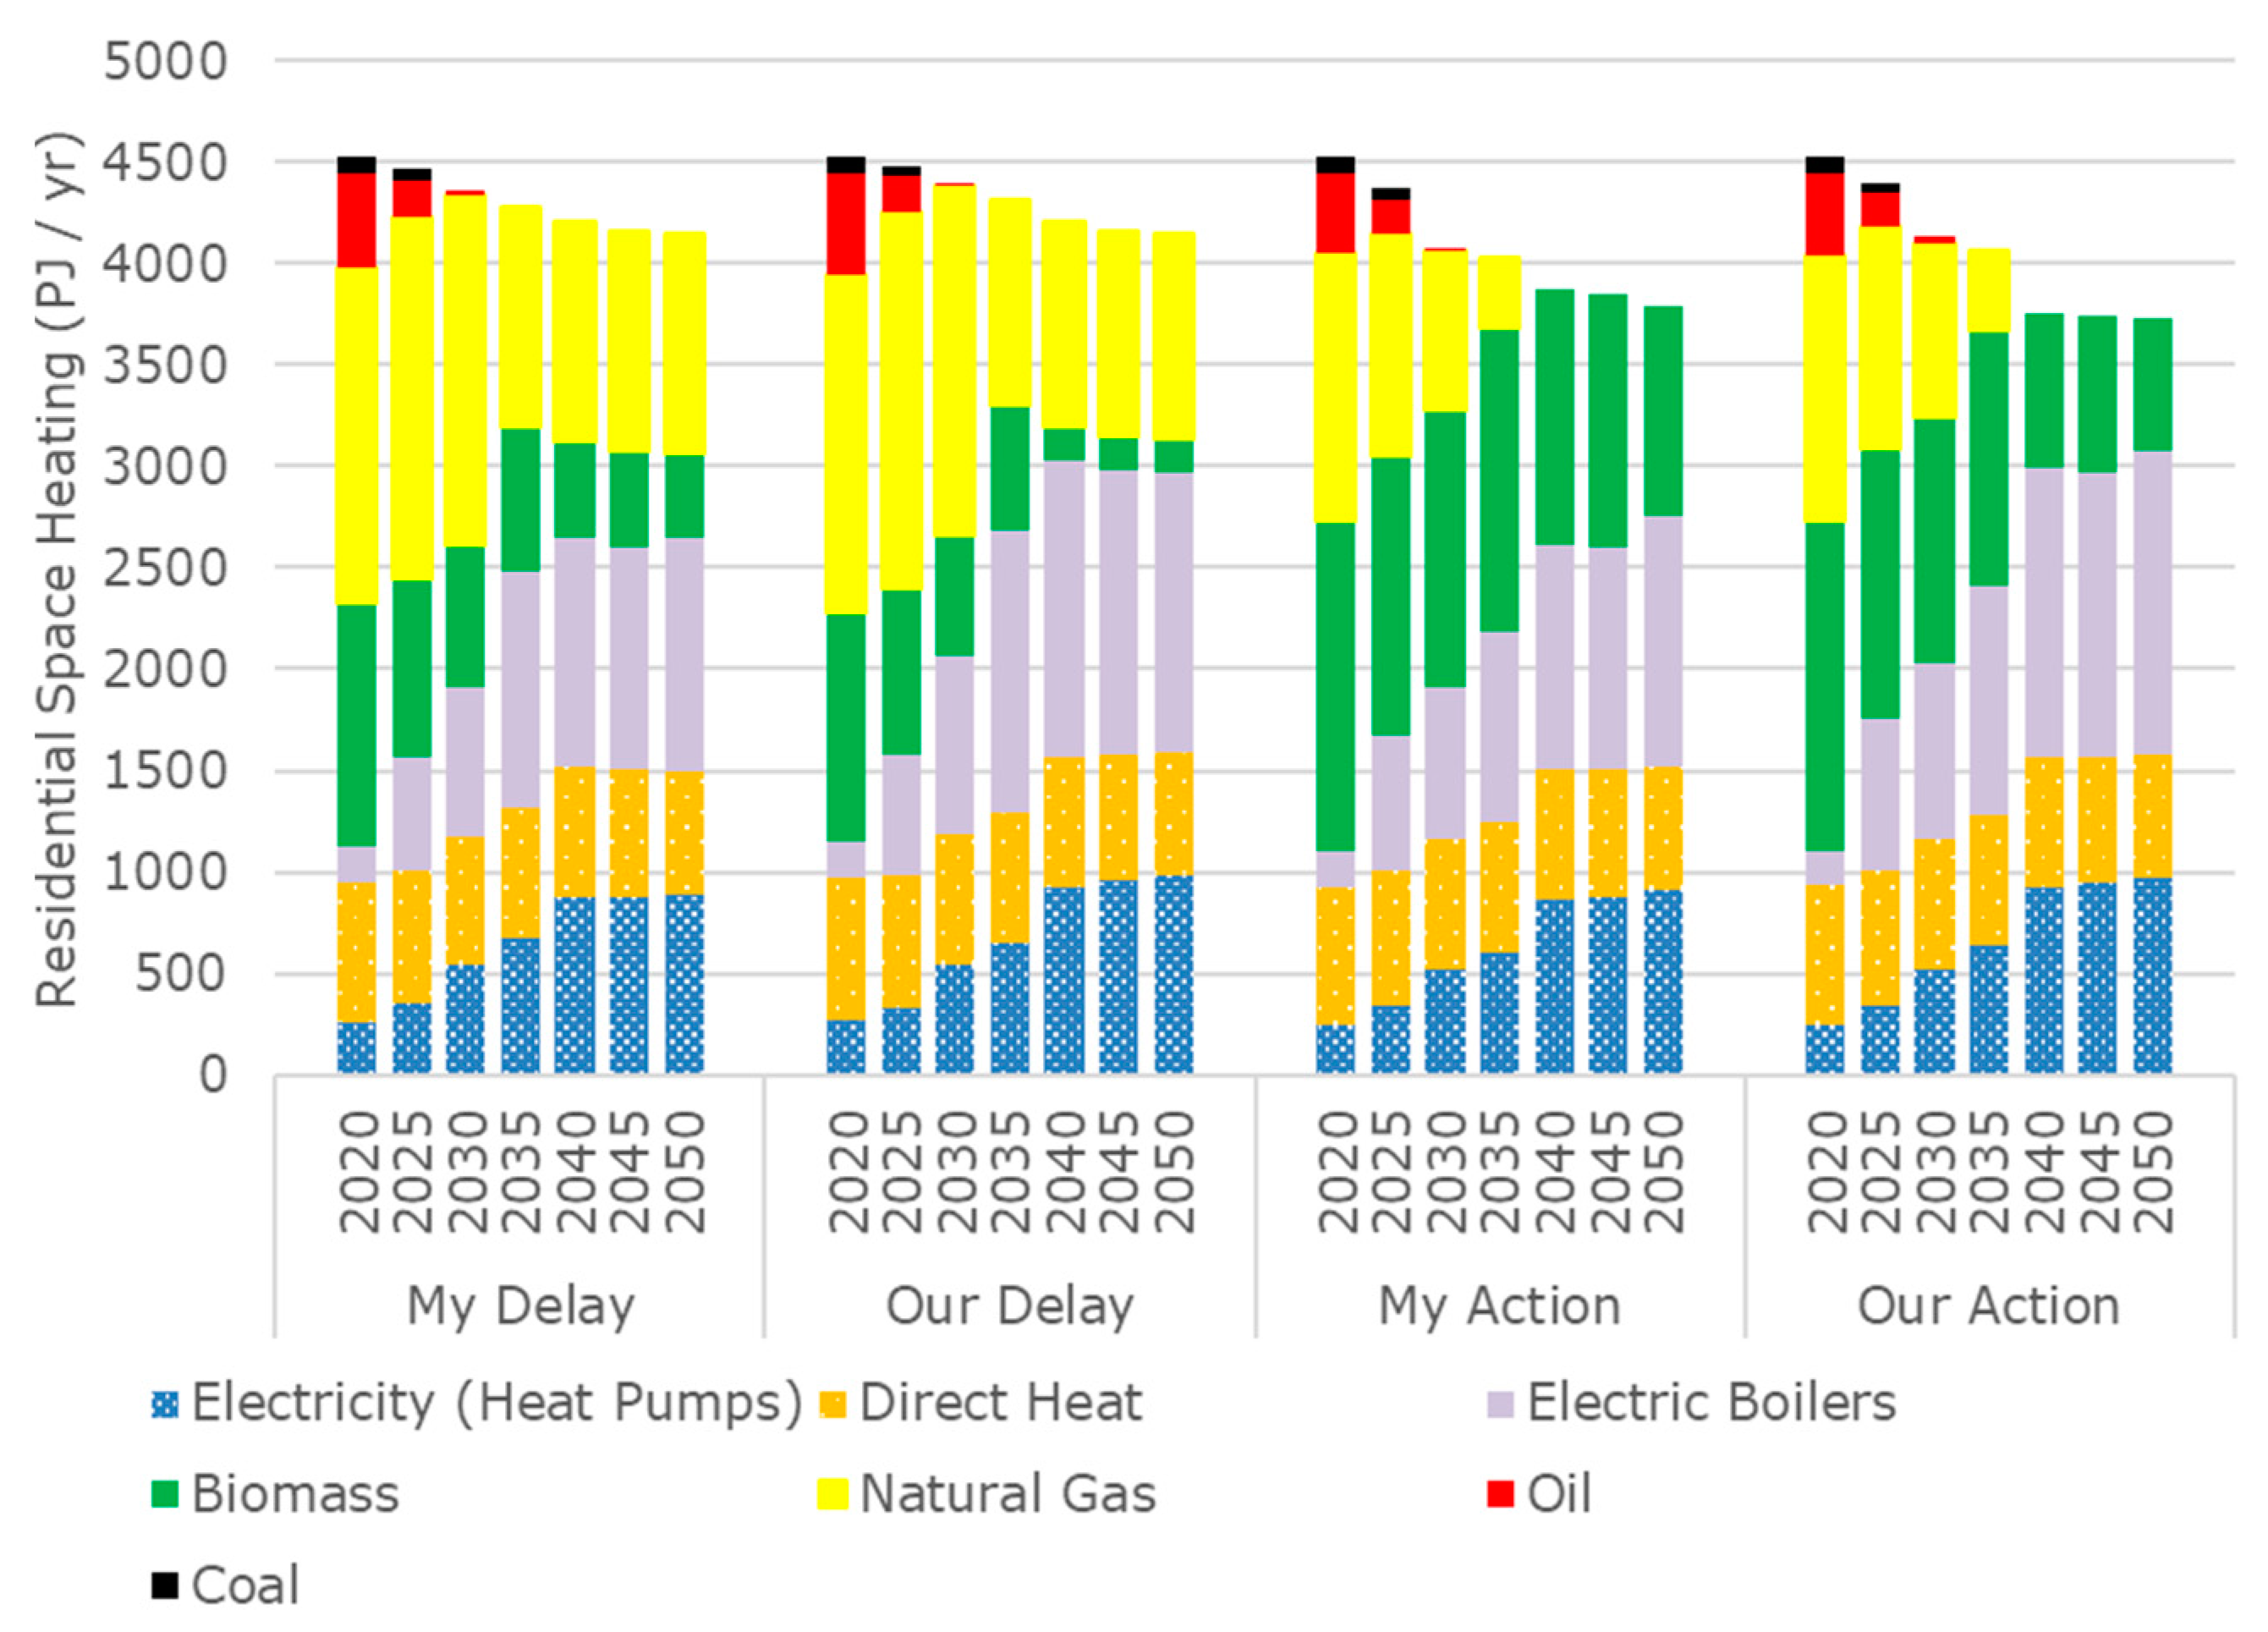
Figure A2. Residential space heating mix trajectory by scenario.
Energies 17 02363 g0a2

References

  1. IPCC. Climate Change 2021: The Physical Science Basis. Contribution of Working Group I to the Sixth Assessment Report of the Intergovernmental Panel on Climate Change; Cambridge University Press: Cambridge, UK; New York, NY, USA, 2021. [Google Scholar]
  2. UNFCCC. United Nations Climate Change Annual Report 2021; UNFCCC: Rio de Janeiro, Brazil; New York, NY, USA, 2022. [Google Scholar]
  3. Lu, J.; Nemet, G.F. Evidence map: Topics, trends, and policy in the energy transitions literature. Environ. Res. Lett. 2020, 15, 123003. [Google Scholar] [CrossRef]
  4. Eurostat. Disaggregated Final Energy Consumption in Households; Eurostat: Luxembourg, 2023. [Google Scholar]
  5. Mantzos, L.; Matei, N.A.; Mulholland, E.; Rózsai, M.; Tamba, M.; Wiesenthal, T. JRC-IDEES 2015; European Commission, Joint Research Centre (JRC): Brussels, Belgium, 2018. [Google Scholar]
  6. Eurostat. Air Emissions Accounts by NACE Rev.2 Activity; Eurostat: Luxembourg, 2022. [Google Scholar]
  7. Streimikiene, D.; Kyriakopoulos, G.L.; Stankuniene, G. Review of Energy and Climate Plans of Baltic States: The Contribution of Renewables for Energy Production in Households. Energies 2022, 15, 7728. [Google Scholar] [CrossRef]
  8. Stamatellos, G.; Zogou, O.; Stamatelos, A. Energy Performance Optimization of a House with Grid-Connected Rooftop PV Installation and Air Source Heat Pump. Energies 2021, 14, 740. [Google Scholar] [CrossRef]
  9. Ogunrin, O.S.; Vorushylo, I.; Okpako, O.; Hewitt, N. Domestic Energy Efficiency Scenarios for Northern Ireland. Energies 2022, 15, 2985. [Google Scholar] [CrossRef]
  10. Gródek-Szostak, Z.; Malinowski, M.; Suder, M.; Kwiecień, K.; Bodziacki, S.; Vaverková, M.D.; Maxianová, A.; Krakowiak-Bal, A.; Ziemiańczyk, U.; Uskij, H.; et al. Energy Conservation Behaviors and Awareness of Polish, Czech and Ukrainian Students: A Case Study. Energies 2021, 14, 5599. [Google Scholar] [CrossRef]
  11. Fotiou, T.; de Vita, A.; Capros, P. Economic-Engineering Modelling of the Buildings Sector to Study the Transition towards Deep Decarbonisation in the EU. Energies 2019, 12, 2745. [Google Scholar] [CrossRef]
  12. Fotiou, T.; Capros, P.; Fragkos, P. Policy Modelling for Ambitious Energy Efficiency Investment in the EU Residential Buildings. Energies 2022, 15, 2233. [Google Scholar] [CrossRef]
  13. Rogulj, I.; Peretto, M.; Oikonomou, V.; Ebrahimigharehbaghi, S.; Tourkolias, C. Decarbonisation Policies in the Residential Sector and Energy Poverty: Mitigation Strategies and Impacts in Central and Southern Eastern Europe. Energies 2023, 16, 5443. [Google Scholar] [CrossRef]
  14. Broad, O.; Hawker, G.; Dodds, P.E. Decarbonising the UK residential sector: The dependence of national abatement on flexible and local views of the future. Energy Policy 2020, 140, 111321. [Google Scholar] [CrossRef]
  15. Dennehy, E.R.; Dineen, D.; Rogan, F.; Ó’Gallachóir, B.P. Recession or retrofit: An ex-post evaluation of Irish residential space heating trends. Energy Build. 2019, 205, 109474. [Google Scholar] [CrossRef]
  16. Rayner, T.; Jordan, A. The European Union: The polycentric climate policy leader? WIREs Clim. Chang. 2013, 4, 75–90. [Google Scholar] [CrossRef]
  17. EU. Fit for 55. Available online: https://www.consilium.europa.eu/en/policies/green-deal/fit-for-55-the-eu-plan-for-a-green-transition/ (accessed on 18 September 2023).
  18. EU. European Green Deal. Available online: https://www.consilium.europa.eu/en/policies/green-deal/ (accessed on 20 October 2023).
  19. Andresen, I.; Healey Trulsrud, T.; Finocchiaro, L.; Nocente, A.; Tamm, M.; Ortiz, J.; Salom, J.; Magyari, A.; Hoes-van Oeffelen, L.; Borsboom, W.; et al. Design and performance predictions of plus energy neighbourhoods–Case studies of demonstration projects in four different European climates. Energy Build. 2022, 274, 112447. [Google Scholar] [CrossRef]
  20. Olasolo-Alonso, P.; López-Ochoa, L.M.; Las-Heras-Casas, J.; López-González, L.M. Energy Performance of Buildings Directive implementation in Southern European countries: A review. Energy Build. 2023, 281, 112751. [Google Scholar] [CrossRef]
  21. Ipsos. Comprehensive Study of Building Energy Renovation Activities and the Uptake of Nearly Zero-Energy Buildings in the EU; Ipsos: Brussel, Belgium, 2019. [Google Scholar]
  22. Bertoldi, P. Policies for energy conservation and sufficiency: Review of existing policies and recommendations for new and effective policies in OECD countries. Energy Build. 2022, 264, 112075. [Google Scholar] [CrossRef]
  23. EU. Energy Performance of Buildings Directive; EU: Brussel, Belgium, 2022. [Google Scholar]
  24. EU. Directive 2010/31/EU of the European Parliament and of the Council of 19 May 2010 on the Energy Performance of Buildings; EU: Brussel, Belgium, 2010. [Google Scholar]
  25. EU. REPowerEU Plan. Available online: https://eur-lex.europa.eu/legal-content/EN/TXT/?uri=COM:2022:230:FIN (accessed on 17 August 2023).
  26. EU. A Renovation Wave for Europe-Greening Our Buildings, Creating Jobs, Improving Lives; EU: Brussel, Belgium, 2020. [Google Scholar]
  27. Luxembourg, S.L.; Salim, S.S.; Smekens, K.; Dalla Longa, F.; van der Zwaan, B. TIMES-Europe: An Integrated Energy System Model for Analyzing Europe’s Energy and Climate Challenges. Environ. Model. Assess. 2022; accepted for publication. [Google Scholar] [CrossRef]
  28. Loulou, R.; Remme, U.; Kanudia, A.; Lehtila, A.; Goldstein, G. Documentation for the TIMES Model; IEA-ETSAP: Paris, France, 2016. [Google Scholar]
  29. Dalla Longa, F.; Nogueira, L.P.; Limberger, J.; van Wees, J.-D.; van der Zwaan, B. Scenarios for geothermal energy deployment in Europe. Energy 2020, 206, 118060. [Google Scholar] [CrossRef]
  30. van der Zwaan, B.; Lamboo, S.; Dalla Longa, F. Timmermans’ dream: An electricity and hydrogen partnership between Europe and North Africa. Energy Policy 2021, 159, 112613. [Google Scholar] [CrossRef]
  31. Dalla Longa, F.; Detz, R.; van der Zwaan, B. Integrated assessment projections for the impact of innovation on CCS deployment in Europe. Int. J. Greenh. Gas Control 2020, 103, 103133. [Google Scholar] [CrossRef]
  32. Pavičević, M.; Mangipinto, A.; Nijs, W.; Lombardi, F.; Kavvadias, K.; Jiménez Navarro, J.P.; Colombo, E.; Quoilin, S. The potential of sector coupling in future European energy systems: Soft linking between the Dispa-SET and JRC-EU-TIMES models. Appl. Energy 2020, 267, 115100. [Google Scholar] [CrossRef]
  33. Seljom, P.; Kvalbein, L.; Hellemo, L.; Kaut, M.; Ortiz, M.M. Stochastic modelling of variable renewables in long-term energy models: Dataset, scenario generation & quality of results. Energy 2021, 236, 121415. [Google Scholar] [CrossRef]
  34. Aryanpur, V.; Balyk, O.; Daly, H.; Ó’Gallachóir, B.; Glynn, J. Decarbonisation of passenger light-duty vehicles using spatially resolved TIMES-Ireland Model. Appl. Energy 2022, 316, 119078. [Google Scholar] [CrossRef]
  35. Eurostat. Population and Population Change Statistics; Eurostat: Luxembourg, 2023. [Google Scholar]
  36. Nijs, W.; Ruiz, P. 02_JRC-EU-TIMES Building Stock Module; European Commission Joint Research Centre (JRC): Brussels, Belgium, 2019. [Google Scholar]
  37. Boneta, M.F. Cost of Energy Efficiency Measures in Buildings Refurbishment: A Summary Report on Target Countries; Enerdata: Grenoble, France, 2013. [Google Scholar]
  38. Eurostat. Heating and Cooling Degree Days-Statistics; Eurostat: Luxembourg, 2023. [Google Scholar]
  39. TNO. Platform for Integrated Knowledge about the Energy Transition; TNO Energy Transition Studies: Amsterdam, The Netherlands, 2023. [Google Scholar]
  40. EU. Directive (EU) 2023/2413 of the European Parliament and of the Council of 18 October 2023 amending Directive (EU) 2018/2001, Regulation (EU) 2018/1999 and Directive 98/70/EC as Regards the Promotion of Energy from Renewable Sources, and Repealing Council Directive (EU) 2015/652. Available online: http://data.europa.eu/eli/dir/2023/2413/oj (accessed on 3 November 2023).
  41. IEA. World Energy Outlook 2021; IEA: Paris, France, 2021. [Google Scholar]
  42. Duić, N.; Štefanić, N.; Lulić, Z.; Krajačić, G.; Pukšec, T.; Novosel, T. 2050 Heat Roadmap Europe—A Low-Carbon Heating and Cooling Strategy; Deliverable 6.1: Future Fuel Price Review; University of Zagreb, Faculty of Mechanical Engineering and Naval Architecture: Zagreb, Croatia, 2017. [Google Scholar]
  43. Philibert, C. International Energy Technology Collaboration and Climate Change Mitigation; OECD and IEA: Paris, France, 2004. [Google Scholar]
  44. Méndez, M. Climate Change from the Streets: How Conflict and Collaboration Strengthen the Environmental Justice Movement; Yale University Press: New Haven, CT, USA, 2020. [Google Scholar]
  45. Leck, H.; Simon, D. Fostering multiscalar collaboration and co-operation for effective governance of climate change adaptation. Urban Stud. 2013, 50, 1221–1238. [Google Scholar] [CrossRef]
  46. EU. Commission Recommendation (EU) 2019/786 of 8 May 2019 on Building Renovation; EU: Brussel, Belgium, 2019; pp. 34–79. [Google Scholar]
  47. EU. OVERVIEW|Energy Efficiency in Historic Buildings: A State of the Art. Available online: https://build-up.ec.europa.eu/en/resources-and-tools/articles/overview-energy-efficiency-historic-buildings-state-art (accessed on 12 August 2022).
  48. Jensen, C.L.; Goggins, G.; Røpke, I.; Fahy, F. Achieving sustainability transitions in residential energy use across Europe: The importance of problem framings. Energy Policy 2019, 133, 110927. [Google Scholar] [CrossRef]
  49. Healy, N.; Barry, J. Politicizing energy justice and energy system transitions: Fossil fuel divestment and a “just transition”. Energy Policy 2017, 108, 451–459. [Google Scholar] [CrossRef]
  50. van Hove, W.; Dalla Longa, F.; van der Zwaan, B. Identifying predictors for energy poverty in Europe using machine learning. Energy Build. 2022, 264, 112064. [Google Scholar] [CrossRef]
  51. EU. Commission Implementing Decision (EU) 2023/1319 of 28 June 2023 Amending Implementing Decision (EU) 2020/2126 to Revise Member States’ Annual Emission Allocations for the Period from 2023 to 2030 (Text with EEA Relevance). Available online: https://eur-lex.europa.eu/legal-content/EN/TXT/PDF/?uri=CELEX:32023D1319 (accessed on 3 November 2023).
  52. Kitous, A.; Després, J. Assessment of the Impact of Climate Scenarios on Residential Energy Demand for Heating and Cooling; Publications Office of the European Union: Luxembourg, 2018. [Google Scholar] [CrossRef]
  53. Eurostat. Construction Producer Price and Construction Cost Indices Overview. Available online: https://ec.europa.eu/eurostat/statistics-explained/index.php?title=Construction_producer_price_and_construction_cost_indices_overview#Construction_costs_-_development_since_2005 (accessed on 5 March 2023).
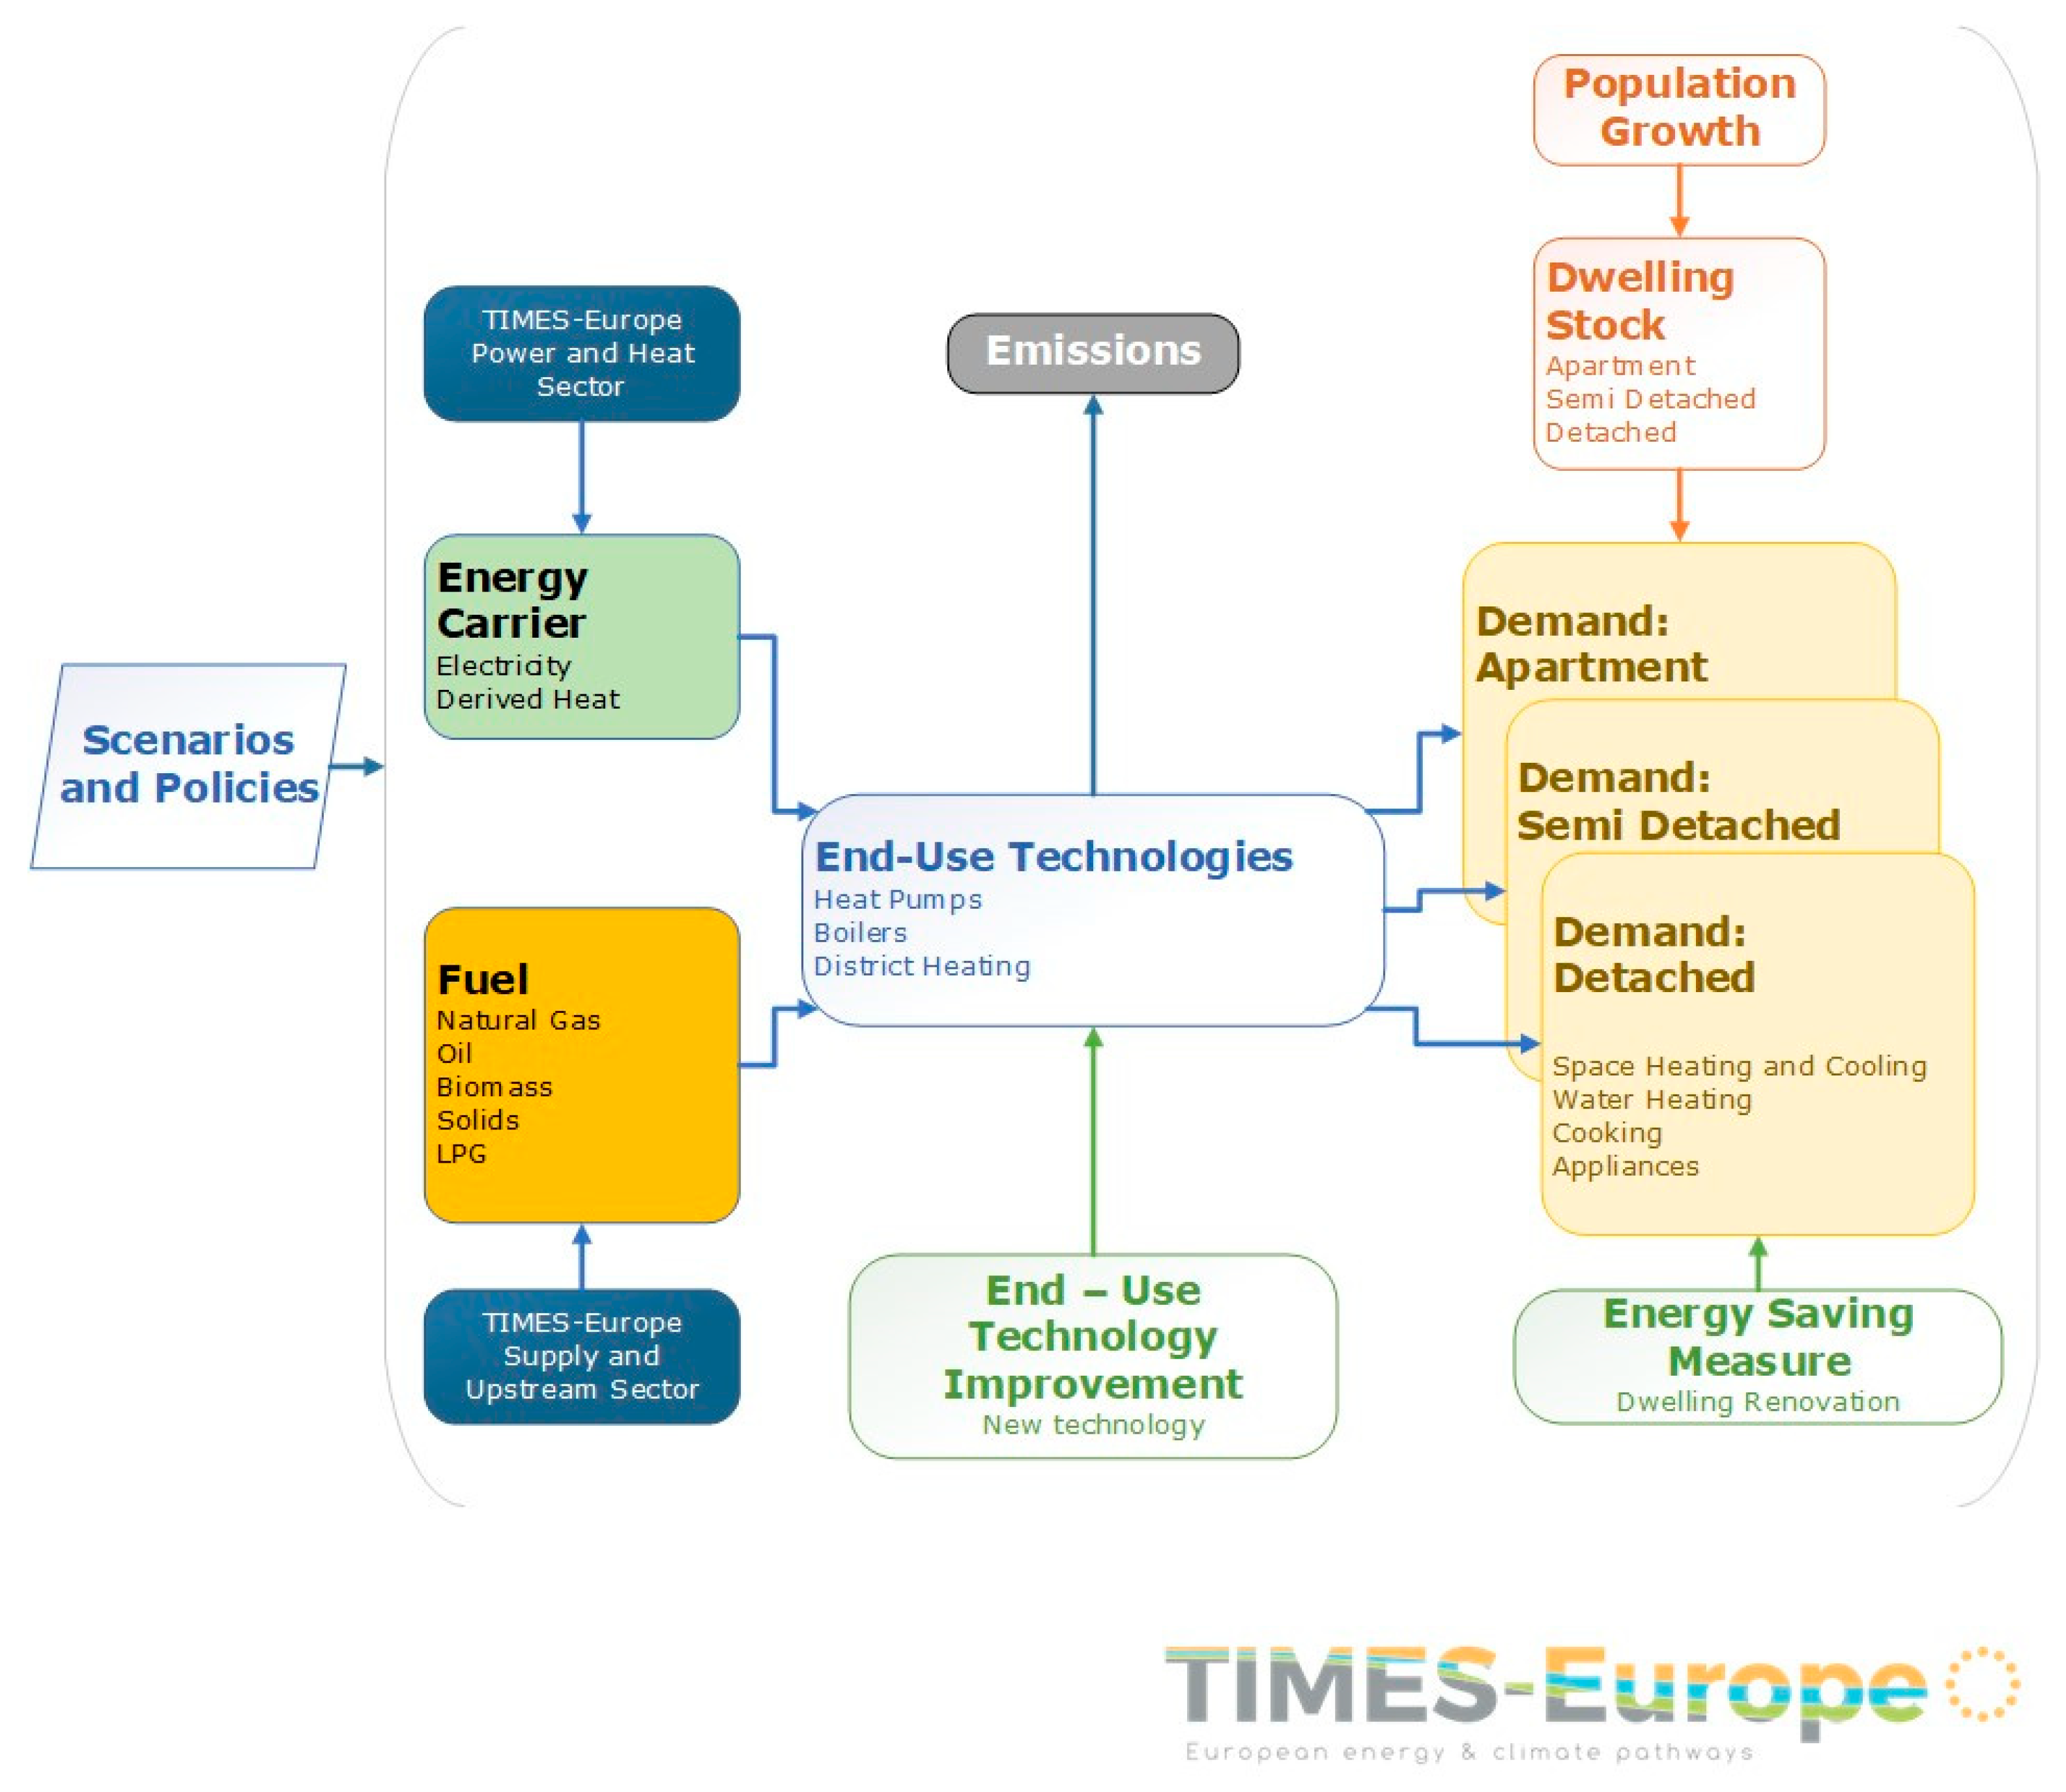
Figure 1. Schematic representation of the TIMES-Europe residential sector [27].
Energies 17 02363 g001
Figure 2. Definition of scenarios.
Energies 17 02363 g002
Figure 3. Decoupling space heating consumption and dwelling stock growth in Europe.
Energies 17 02363 g003
Figure 4. Dwellings undergoing renovation category in comparison to the total dwelling stock: a breakdown by age group.
Energies 17 02363 g004
Figure 5. Annual expenditures for retrofitting of the dwelling stock in Europe.
Energies 17 02363 g005
Figure 6. Projections of the technology mix for residential space heating in Europe.
Energies 17 02363 g006
Figure 7. Greenhouse gas emissions from residential space heating in Europe.
Energies 17 02363 g007
Figure 8. Relative level of energy savings from retrofitting (in %).
Energies 17 02363 g008
Figure 9. Cumulative renovation expenditure per person (Euro2015/Person).
Energies 17 02363 g009
Figure 10. Share of space heating supplied by heat pumps (%).
Energies 17 02363 g010
Figure 11. Share of space heating supplied by direct heat (%).
Energies 17 02363 g011
Figure 12. Share of space heating supplied by electric boilers (%).
Energies 17 02363 g012
Figure 13. Share of space heating supplied by biomass boilers (%).
Energies 17 02363 g013
Figure 14. Share of fossil fuel supply in residential space heating (%).
Energies 17 02363 g014aEnergies 17 02363 g014b
Figure 15. Residential space heating emission intensity (ktCO2/PJ).
Energies 17 02363 g015aEnergies 17 02363 g015b
Figure 16. Examples of dwelling stock by construction period in selected member states in comparison to the average across the EU27 + UK.
Energies 17 02363 g016
Table 1. Overview of retrofitting packages in the TIMES-Europe residential module.
PackageDwelling Construction PeriodDwelling ElementRenovation MeasureAverage Existing U-ValueU-Value Post-Renovation
Shallow retrofittingPre-1990WindowDouble Glaze3.071.4
Post-1990WindowTriple Glaze1.881.3
Medium retrofittingPre-1990WindowDouble Glaze3.071.4
WallExterior Insulation—10 cm1.220.3
Post-1990WindowTriple Glaze1.881.3
WallExterior Insulation—20 cm0.450.17
Deep retrofittingPre-1990WindowDouble Glaze3.071.4
WallExterior Insulation—10 cm1.220.3
Roof20 cm Insulation1.10.18
Post-1990WindowTriple Glaze1.881.3
WallExterior Insulation—20 cm0.450.17
Roof30 cm Insulation 0.390.12
Table 2. Fuel price projections (in Euro2015/GJ) [41,42].
Commodity20152020202520302035204020452050
Coal2.31.63.03.33.43.43.57.1
Gas5.93.37.48.28.38.48.48.5
Oil8.66.113.015.216.116.917.818.6
Biomass8.08.18.38.48.79.19.49.7
Table 3. Key parameters across our four scenarios.
ScenarioSpace Heating
Fossil Fuel Supply
Dwelling Retrofitting RateRenewable Electricity
Generation Target
Heat Pump Stock
Target
My DelayNo fossil fuel growth at the member state level1% dwelling stock retrofitting per year per member stateMinimum 60% renewable electricity generation per member state by 20307 million additional heat pumps by 2030 within EU27 + UK
Our DelayNo fossil fuel growth at EU27 + UK as a whole1% dwelling stock retrofitting per year aggregated within EU27 + UKMinimum 60% renewable electricity generation in EU27 + UK by 2030
My ActionNo fossil fuel growth and
fossil fuel phase out by 2040 at the member states level
3% dwelling stock retrofitting per year per member stateMinimum 60% renewable electricity generation per member state by 203030 million additional heat pumps by 2030 within EU27 + UK
Our ActionNo fossil fuel growth and
fossil fuel phase out by 2040 at EU27 + UK as a whole
3% dwelling stock retrofitting per year aggregated within EU27 + UKMinimum 60% renewable electricity generation in EU27 + UK by 2030
Disclaimer/Publisher’s Note: The statements, opinions and data contained in all publications are solely those of the individual author(s) and contributor(s) and not of MDPI and/or the editor(s). MDPI and/or the editor(s) disclaim responsibility for any injury to people or property resulting from any ideas, methods, instructions or products referred to in the content.