Article

Extracting Accurate Parameters from a Proton Exchange Membrane Fuel Cell Model Using the Differential Evolution Ameliorated Meta-Heuristics Algorithm

by
Badreddine Kanouni
1 and
Abdelbaset Laib
2,*
1
Electrical Engineering Department, University of Setif 1, Sétif 19000, Algeria
2
Department of Automatic, Faculty of Electrical Engineering, University of Science and Technology Houari Boumediene, Algiers 16111, Algeria
*
Author to whom correspondence should be addressed.
Energies 2024, 17(10), 2333; https://doi.org/10.3390/en17102333
Submission received: 31 March 2024 / Revised: 2 May 2024 / Accepted: 10 May 2024 / Published: 12 May 2024

Abstract

:
The electrochemical proton exchange membrane fuel cell (PEMFC) is an electrical generator that utilizes a chemical reaction mechanism to produce electricity, serving as a sustainable and environmentally friendly energy source. To thoroughly analyze and develop the features and performance of a PEMFC, it is essential to use a precise model that incorporates exact parameters to effectively suit the polarization curve. In addition, parameter extraction plays a crucial role in the simulation analysis, evaluation, optimum control, and fault detection of the proton exchange membrane fuel cell (PEMFC) system. Despite the development of many algorithms for parameter extraction in PEMFC, obtaining accurate and trustworthy results rapidly remains a challenge. This study presents a hybridized algorithm, namely differential evolution ameliorated (DEA) for reliably estimating PEMFC model parameters. To evaluate the proposed DEA-based parameter identification, a comparison analysis with previously published methods is conducted using MATLAB/SimulinkTM (R2016b, MathWorks, Natick, MA, USA) in terms of system correctness and convergence process. The proposed DEA algorithm is tested to extract the parameters of two PEMFC models: SR-12 500 W and 250 W. The sum of the squared errors (SSE) between the experimental and the obtained voltage data is defined as an objective function. The simulation results prove that the suggested DEA algorithm is capable of identifying the optimal PEMFC parameters rapidly and accurately in comparison with other optimization algorithms.

1. Introduction

Both small-scale power consumption and large-scale industrial operations require renewable energy sources due to the quick depletion of fossil fuels and the rising power demand [1]. The utilization of alternative sources of energy, such as solar and wind, is commonly employed. However, the generation of electric power using these sources is unstable and intermittent because environmental factors influence it. Solar irradiation and temperature significantly impact photovoltaic arrays, while wind speed affects the generated power from wind energy plants. To overcome this issue, employing large-scale energy storage and conversion systems may greatly increase the utilization rate of renewable energy [2]. Fuel cells are one of these energy storage and conversion systems, and they are affected by temperature, hydrogen, oxygen pressures, and membrane water content.
Consequently, fuel cells (FCs) have been developed to complement and enhance the existing green energy sources [3]. In addition, FCs have been a growing focus on this technology as a means of generating electricity that is both efficient and environmentally friendly [4]. Typically, the voltage produced by each individual fuel cell falls in the range of 0.5–0.9 volts. Multiple FCs are linked in a series configuration to achieve a substantial voltage and power output, as well as to be compatible with high-power generation systems [5]. The proton exchange membrane fuel cell (PEMFC) is a type of fuel cell that has demonstrated significant promise and strong competitiveness in automotive, portable, and distributed applications [6]. This is due to its lower operating temperature, excellent transient responses, solid-state electrolyte, high power density, high energy efficiency, compactness, scalability, low noise, and zero emissions to the environment [7]. Despite substantial advancements in PEMFC technology in recent years, ongoing research is focused on optimizing the design and control of the PEMFC stack.
Electrochemical modeling is essential for optimizing the performance of PEMFC and is crucial for designing controllers and detecting faults in the PEMFC stack [8,9]. Throughout recent decades, numerous electrochemical models have been constructed to elucidate the characteristics of PEMFC. These models exhibit varying degrees of complexity and can be broadly categorized into two distinct groups: mechanical modeling and semi-empirical modeling [10]. The mechanical modeling utilizes sophisticated electrochemical, thermodynamic, and fluidic transport equations [11,12]. The second category is semi-empirical modeling, which integrates mechanistic validity with empirical simplicity to anticipate the performance accurately and optimize control parameters of PEMFC in real time based on non-linear polarization curves [13]. Amphlett has proposed a viable mathematical model for representing PEMFC among different semi-empirical models in [14]. This approach has garnered widespread acceptance among numerous scientific experts. The PEMFC model is considered a multi-variable, non-linear, and intricate model. Thus, conventional methodologies are inadequate for accurately representing the actual output features of PEMFC models [7,15].
The process of estimating model parameter values is typically intricate, crucial, and requires careful attention. Therefore, the simplification methods for obtaining PEMFC model parameters have been addressed as optimization problems in meta-heuristic approaches because the conventional optimization approaches are not practical [16]. Generally, meta-heuristics (Mh) are used to optimize the precise parameters of a PEMFC model. Many optimization approaches in engineering have utilized the no-free-lunch theorem based on these concepts to solve a wide range of optimization issues [17,18]. Furthermore, Mh can be classified into four primary categories: swarm-based, nature-based, physics-based, and evolutionary-based. These categories have been thoroughly examined by researchers in the literature to identify the most effective values for the unidentified parameters of PEMFC models [19]. From the categories mentioned above, the genetic algorithm (GA) was utilized to address the optimization challenge of modeling PEMFCs [20]. The constraints of GA are limited efficiency, reliance on the initial states of variables, and providing poor solutions. To enhance the performance provided by GA, particle swarm optimization (PSO) has been employed in addition to other optimization algorithms, such as vortex search algorithm (VSA) [21,22], differential evolution (DE) [23], grey wolf optimizer (GWO) [24], flower pollination algorithm (FPA) [25], and equilibrium optimizer (EO) [26]. Recently, the algorithms mentioned above have been considered conventional Mh algorithms. These algorithms still have certain shortcomings that require enhancement in terms of precision, stability, and resilience. To achieve advancements in enhancing the capabilities and efficiency of Mhs algorithms, modern optimization techniques have been developed [27]. The Improved Fluid Search Optimization Algorithm proposed by Qin et al. can achieve superior performance while minimizing computing complexity and is an enhanced search optimizer for assessing the parameters of PEMFCs [27]. In order to evaluate the precision of metaheuristic algorithms, many forms of errors may be used, including mean squared error (MSE), coefficient of determination (R2), cross-validation factor (Q2), residual sum of squares (RSS), and sum squared error (SSE) [28]. The sum of squared errors (SSE) between the experimental and estimated data was used as the objective to be achieved. A Bayesian-regularized neural network was utilized to determine the optimal parameters for PEMFC [29]. In [30], Yuan et al. propose a sunflower optimizer to estimate the unknown parameters for PEMFCs. All of the above optimization techniques have been implemented to enhance the precision of PEMFC parameters. However, the majority of them failed to meet the necessary criteria for precise precision. Hence, it is necessary to explore more contemporary techniques in order to accurately determine the parameters of the PEMFC model with rapid convergence. For this reason, the development of hybridized algorithms that combine many methods is an inevitability for addressing the limitations of a single methodology and improving the effectiveness of exploration and exploitation characteristics to precisely identify the parameters. Isa et al. have combined the antlion and dragonfly optimizers to estimate the unknown parameters for PEMFCs [31]. This work presents an upgraded version of the differential evolution (DE) by combining it with the Firefly algorithm to enhance the optimization performance of parameter extraction for PEMFC. The main contributions of this study are as follows:
  • The parameters of the PEMFC model are tuned to their optimal values using the suggested DE ameliorate (DEA) technique;
  • The estimated outcomes of two PEMFC models, SR-12 500 W and 250 W, are compared comprehensively, using various algorithms;
  • The performance characteristics of the PEMFC polarization curve are extracted and the SSE of the evaluated methods is verified.
The subsequent sections of this work are delineated as follows: Section 2 provides an exposition of the mathematical model used to explain the functioning of PEMFC stacks. The formulation of the goal function is outlined in Section 3. Section 4 details the proposed DEA algorithm. Section 5 presents the simulation findings of the two types of PEMFC models: SR-12 500 W and 250 W. Section 6 highlights the main conclusions.

2. Mathematical Model of PEM Fuel Cell

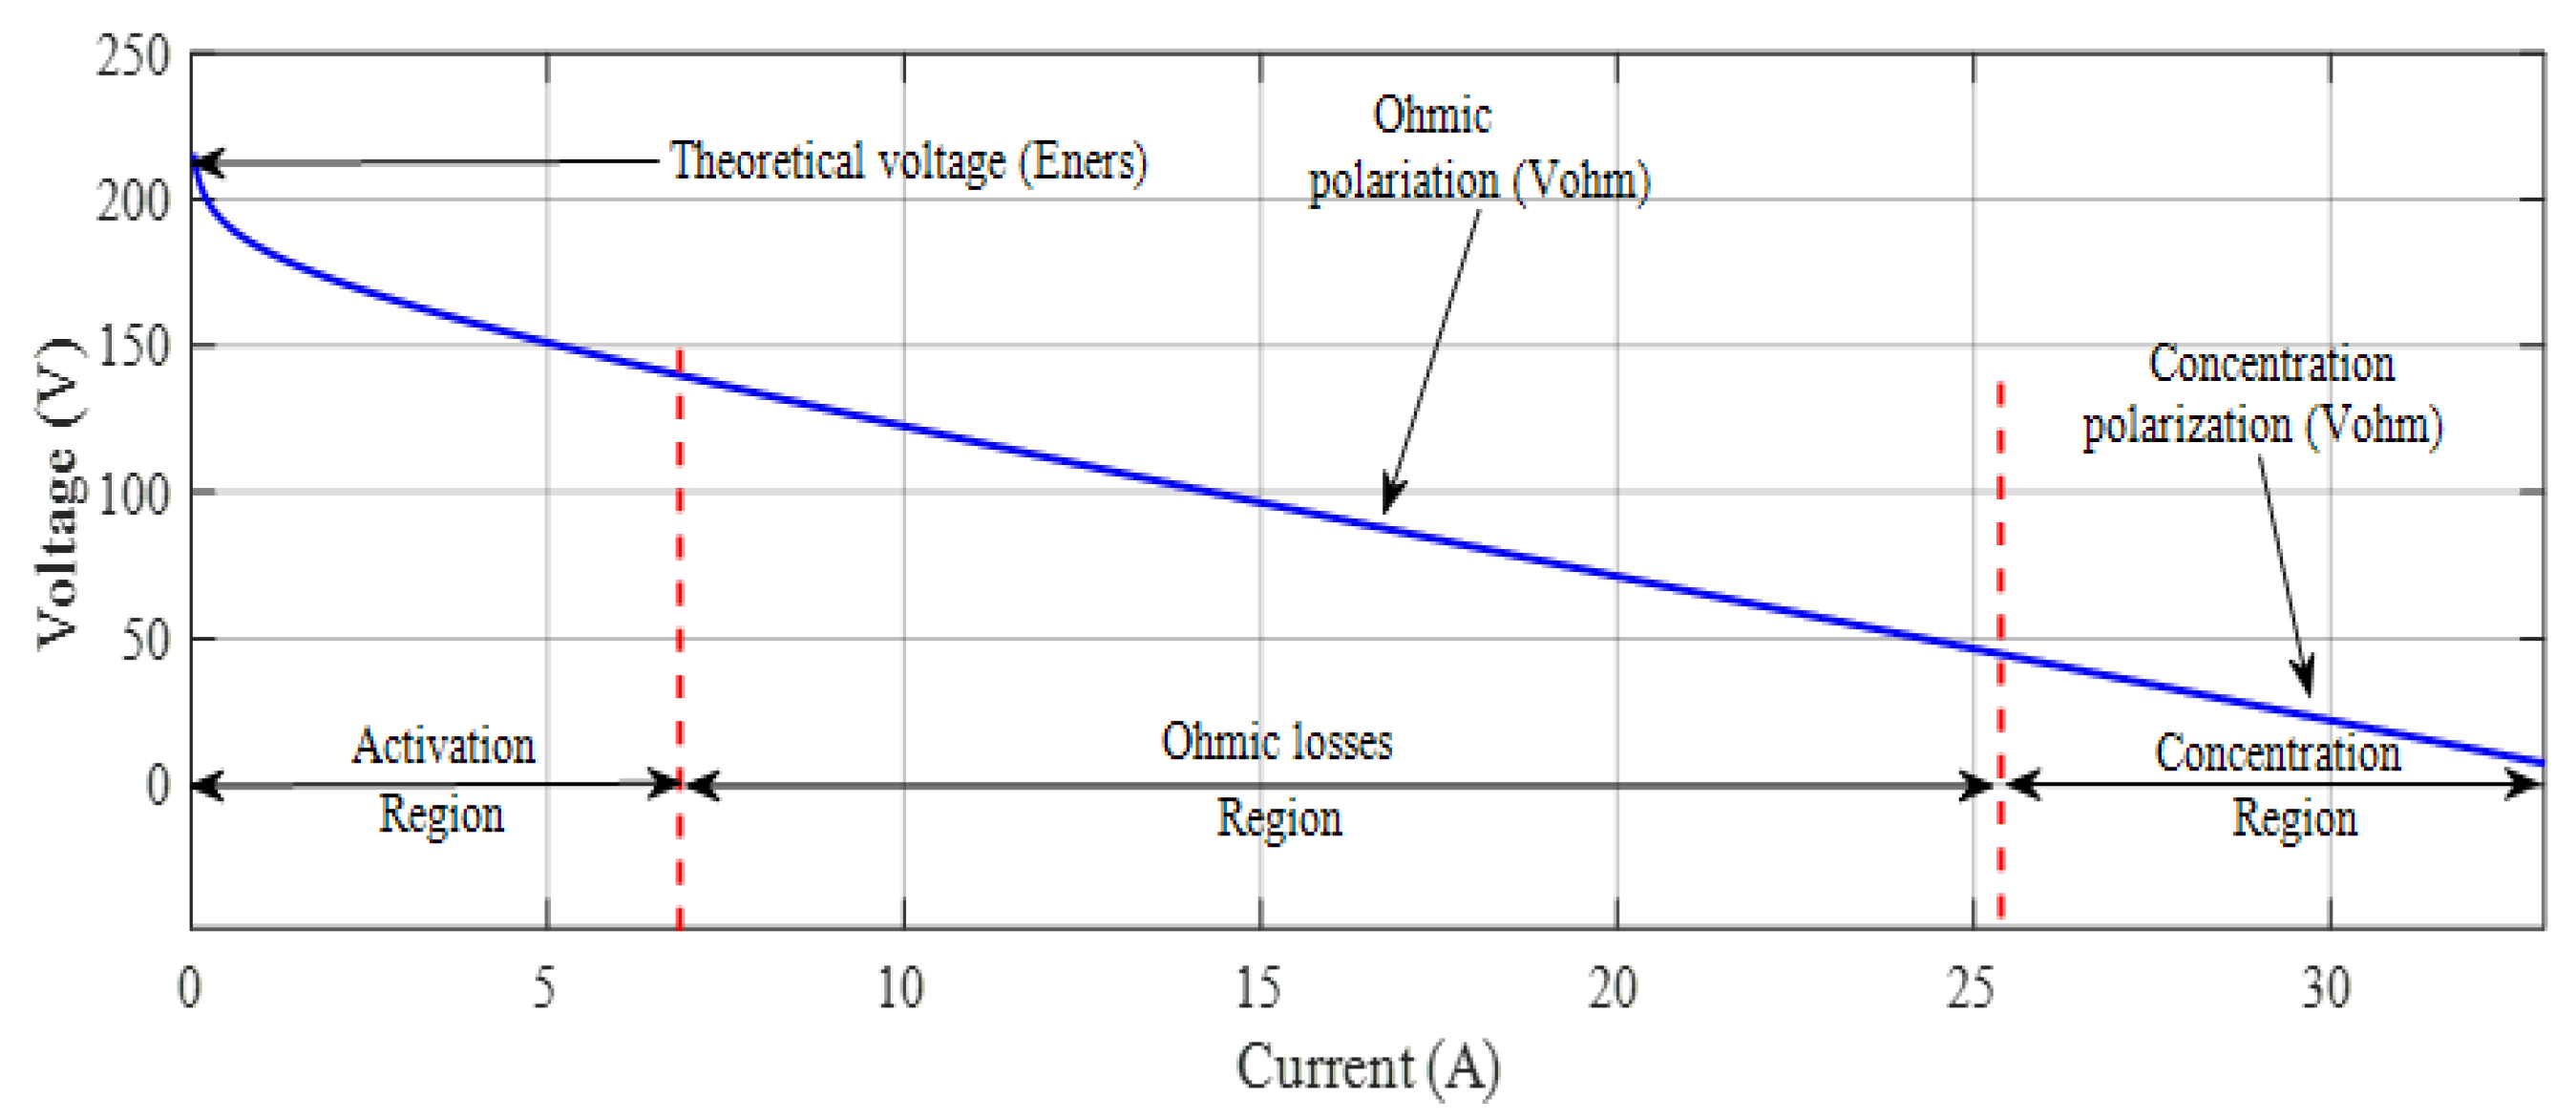
Figure 1 displays the polarization curve of a proton exchange membrane fuel cell (PEMFC). The graphic illustrates three distinct parts of the characteristic curve that correspond to various types of losses observed in the fuel cell: activation region, ohmic losses region, and concentration region.
For practical purposes, multiple individual PEMFCs are combined into a stack to generate the necessary power output. The output voltage V of a PEMFC stack linked in series with Ncell can be expressed using Equation (1). The terminal voltage Vcell of a single PEMFC can be computed using the semi-empirical Equation (2) proposed by the Amphlett model [14]:
V = N c e l l V c e l l
V c e l l = E N e r n s t V a c t V o h m V c o n
The ENernst value corresponds to the reversible voltage obtained in thermodynamic equilibrium when there is no current flowing. It can be calculated using a modified version of the Nernst Equation (3). To consider the variations in pressure and temperature compared to the typical conditions of 298.15 K and 1 bar [19], we use the following:
E N e r n s t = 1.229 ( 0.85 × 10 3 ) × T F C 298.15 ) + ( 4.31 × 10 5 × T F C × ln ( p O 2 ) × 0.5 × ln ( p O 2 ) )
Thus, 1.229 represents the reference potential for electricity at the standard state. TFC represents the cell temperature, while PH2 and PO2 represent the effective partial pressure of hydrogen and oxygen, respectively. The reactants are PH2 and PO2 and the partial pressures can be determined using Equations (4) and (5), respectively.
P H 2 = 0.5 × R H A × P H 2 O R H A × P H 2 O P A × e 1.635 I F C / A T F C   1.1334 1 1
P O 2 = R H C × P H 2 O R H C × P H 2 O P C × e 4.912 I F C / A T F C   1.1334 1 1
The variables PA and PC represent the inlet pressure of the anode and cathode, while RHA and RHC indicate the relative humidity of vapor in the anode and cathode. IFC represents the cell operating current, and A represents the active area of the membrane. PH2O represents the saturation pressure of the water vapor, which can be expressed as a function of the cell temperature TFC in Kelvin using Equation (6):
log 10 ( P   H 2 O ) = 2.95 × 10 2 ( T F C 273.15 ) 9.18 × 10 5 ( T F C 273.15 ) 2 + 1.4 × 10 7 ( T F C 273.15 ) 3 2.18
Vact refers to the voltage drop that occurs due to the slowdown of the reactions occurring on the active surfaces of the anode and cathode. This drop can be calculated using a semi-empirical Equation (7):
V a c t = ξ 1 + ξ 2 T F C + ξ 3 T   F C ln ( C   O 2 ) + ξ 4 T F C ln ( I   F C )
The activation voltage Equation includes semi-empirical constants ξ1,2,3,4, which have well-defined physical significance in terms of kinetics, thermodynamics, and electrochemistry. The concentration of dissolved oxygen on the catalytic interface of the cathode CO2 can be determined using Henry’s Law, represented by Equation (8):
C O   2 = P O 2 5.08 × 10   6 e 498 / T   F C
The voltage drop due to resistance Vohm is determined by three factors: the equivalent membrane resistance RM, the contact resistance RC of proton conduction, and the stack current IFC. The computation process is outlined in Equations (9)–(11). The value of RM is determined by the resistivity of the exchange membrane (m), the thickness of the membrane (l), and the membrane area (A). In Equation (11), λ represents the water content of the membrane, which is one of the unidentified variables that need to be determined. λ influenced by the membrane on the polarization curve. Since the proton conductivity of the membrane increases with increasing water content, the ohmic losses in the membrane decrease with increasing water content. Thus, better performance can be achieved with higher water content [19]:
V o h m = I F C ( R M + R C )
R M = ( ρ m × 0.0128 ) / A
ρ m = 1.81.6 0.062 T F C 303 2 I F C A 2.5 + 0.03 I F C A + 1 λ 0.634 3 I F C A × e 4.18 × ( T F C 303 ) / T F C
The concentration voltage drop is determined using the following formula:
V c o n = β ln 1 j j max
The parameter β represents the parametric coefficient, which is dependent on the cell and its operational state [32]. j denotes the current density (A/cm2), whereas jmax represents the maximum current density (A/cm2).

3. Formulation of PEMFC Parameters Extraction Problem

The operation parameters TFC, Pa, Pc, RHA, RHC, PH2, and PO2 in Equations (1)–(12) can be measured and are possibly influenced by the operating conditions. On the other hand, the physical parameters ξ1, ξ2, ξ3, ξ4, λ, RC, and β are not known, the ranges of which are provided in the preceding literature [33], as illustrated in Table 1.
Given that the unknown parameter X = [ξ1, ξ2, ξ3, ξ4, λ, RC, β] has a substantial impact on the model findings, it is crucial to extract them with precision in order to closely replicate the actual voltage–current (V-I) characteristic of PEMFC.
The proposed approach is employed to extract the seven unidentified parameters and compare them with the existing literature. The objective of this article is to identify a set of ideal parameter values that will minimize the sum of squared errors (SSE) [34] between the experimental voltage (Vexp) and the model-estimated voltage (Vmod) calculated using Equation (1) [35]:
O B F = min S S E ( X ) = min i = 1 N V e x p V m o d 2
The variable N represents the number of data points that have been measured.

4. Differential Evolution Ameliorated Algorithm

4.1. Differential Evolution Algorithm

The DE algorithm, introduced by Storn and Price in [36], is a variant of the evolutionary algorithm employed for solving continuous optimization issues. It possesses notable advantages over other evolutionary approaches and swarm-based techniques in terms of robustness, ease of implementation, and convergence speed. The DE algorithm consists of three main steps: mutation, crossover, and selection. During these steps, each potential solution is assessed by comparing it to a target set. The mutation is employed to achieve the desired outcome, while a crossover is guaranteed between the possible solution and the collected target. Equation (14) represents the mutation, whereas Sa represents a potential solution, and SaT denotes the goal vector for Sa derived from Sb, Sc, and Sd [36,37].
S a T = S b + f ( S   c S d ) , f 0 , 2
In this context, the variable f represents the scaling vector that controls the amplification of changes. The crossover is implemented using the operator illustrated in Equation (15), which utilizes SaT and Sa.
S   a T . I + S   a T . I i f   r a n d   < C r S   a T . I e l s e C r 0 , 1
The rate of crossing is represented by the symbol Cr. The selection process is performed with the operator specified in Equation (16).
S   a . n e x t = S a U i f   f ( S a U ) f ( S a ) S a e l s e

4.2. Proposed Ameliorated DE

The DE can still be used to solve many complex problems in the real world. However, it needs to be simplified and become more robust to track the optimal solutions for engineering problems. Since the standard Firefly is a powerful algorithm and has a major advantage, the characteristic distance is added to an optimization problem. For this reason, common methods can be modified by adding the Firefly to straightforwardly define the attractiveness coefficient.
This study introduces a novel hybrid algorithm called DEA, which is based on the Firefly algorithm (FA) and differential evolution (DE).
FA is founded upon three key concepts [38]:
  • First, all the fireflies are viewed as having no gender distinction and we attempt to approach the fireflies that emit more light until the entire population is evaluated.
  • The allure of fireflies is linked to the intensity of their luminous messages. In the scenario where there is a choice between two fireflies, the one that emits a stronger light is favored. It is important to observe that the brightness diminishes as the distance rises.
  • The luminosity of a firefly is determined by the fitness function’s optimization problem value.
The FA can be formally expressed using the following equations:
w ( r ) = w 0 exp k r m , m 1
r i j = k = 1 d x i , k x j , k 2
x i = x i + w 0 exp ( k r   i j 2 ) ( x j x i ) + α ( r a n d n 1 / 2 )
The part mentioned above was added to DE to enhance the convergence speed, performance, and robustness.
Equation (18) defines the length between any two populations. Also, the movement of the ith firefly attracted to a brighter firefly is represented in Equation (19). The best solution for sorting fireflies is employed to evaluate the new mutated vector in Equation (14). Next, we apply the crossover using the operator illustrated in Equation (15). If the cost obtained is better than the one chosen by the firefly population, it will be kept. In the opposite case, the proposed algorithm kept the best solution given by Firefly for the next generation. The flowchart of the proposed DEA is presented in Figure 2.

5. Test Types and Simulations Result

In this part, the effectiveness of the proposed differential evolution ameliorated (DEA) algorithm is demonstrated by two test cases: 250 W PEMFC and SR-12 modular. The characteristics of PEMFC types are presented in Table 2. Table 3 represents the initialization parameters of the studied algorithms.
The proposed algorithm aims to determine the ideal parameters of PEMFC stacks by minimizing the difference between measured and estimated data.
The proposed DEA algorithm outcomes are contrasted with several techniques presented in previously published works. The parameters of DEA consist of a population of 30, a maximum number of iterations is set to 300, and the implementation is repeated 30 times for all algorithms.
To validate the proposed DEA validation, the computed stack voltages are compared with the stack voltages measured via experimentation. The discrepancy between the estimated and measured stack voltages is evaluated using the integral of absolute error (IAE), as shown in Equation (20).
I A E = V exp V m o d
The stability, accuracy, and effectiveness of the proposed DEA in determining the precise values of unknown parameters in PEMFC are tested. Furthermore, a comprehensive examination of sensitivity and statistical data is conducted for all the PEMFC stacks under investigation. The statistical results of the DEA algorithm are compared with conventional algorithms, including BBO, FFA, DE, GOA, RSA, and PDO. The comparison is performed based on many metrics, mostly focusing on the best and worst values of the objective function, the mean value of the objective function, RMSE, and MAE. These metrics can be mathematically represented as given in Equations (21) and (22):
R M S E = i = 1 30 ( S E E i S S E min ) 2 30
M A E = i = 1 30 ( S E E i S S E min ) 2 30
Where Pcr, gamma, beta, alpha, K, n, and Kr represent mutation coefficient light, absorption coefficient, attraction coefficient base value, crossover probability, number of sections, number of solutions in each section, and Kr the keep rate, respectively. The common parameter between the DEA and DE is Pcr, which has the same value.

5.1. Type 1: Modular SR-12

This research study aims to optimize the model parameters of the SR-12PEM 500 W. The findings and data of this model can be found in Table 4, Table 5 and Table 6.
The first objective of this study is to enhance the model parameters of the SR-12 PEM. The relevant information and results are detailed in Table 4 and Table 5.
The results demonstrate that the suggested DEA achieves the lowest SSE (1.05374), outperforming other algorithms. The statistical comparison between numerous conventional algorithms and the proposed DEA is shown in Table 4. It is clear that the DEA algorithm outperforms BBO, FFA, DE, GOA, RSA, and PDO regarding standard deviation (STD), root mean squared error (RMSE), and mean absolute error (MAE).
Table 5 presents the identified seven parameters of PEMFC from the DEA, BBO, FFA, DE, GOA, RSA, and PDO results. When the minimal value of the goal function is selected using the studied algorithms, we found that the best result delivered by DEA is 1.05374; on the other hand, the best results obtained using the BBO, FFA, and DE algorithms are 1.0593, 1.0538, 1.0539, and 1.0566 for GOA, RSA, and PDO, respectively.
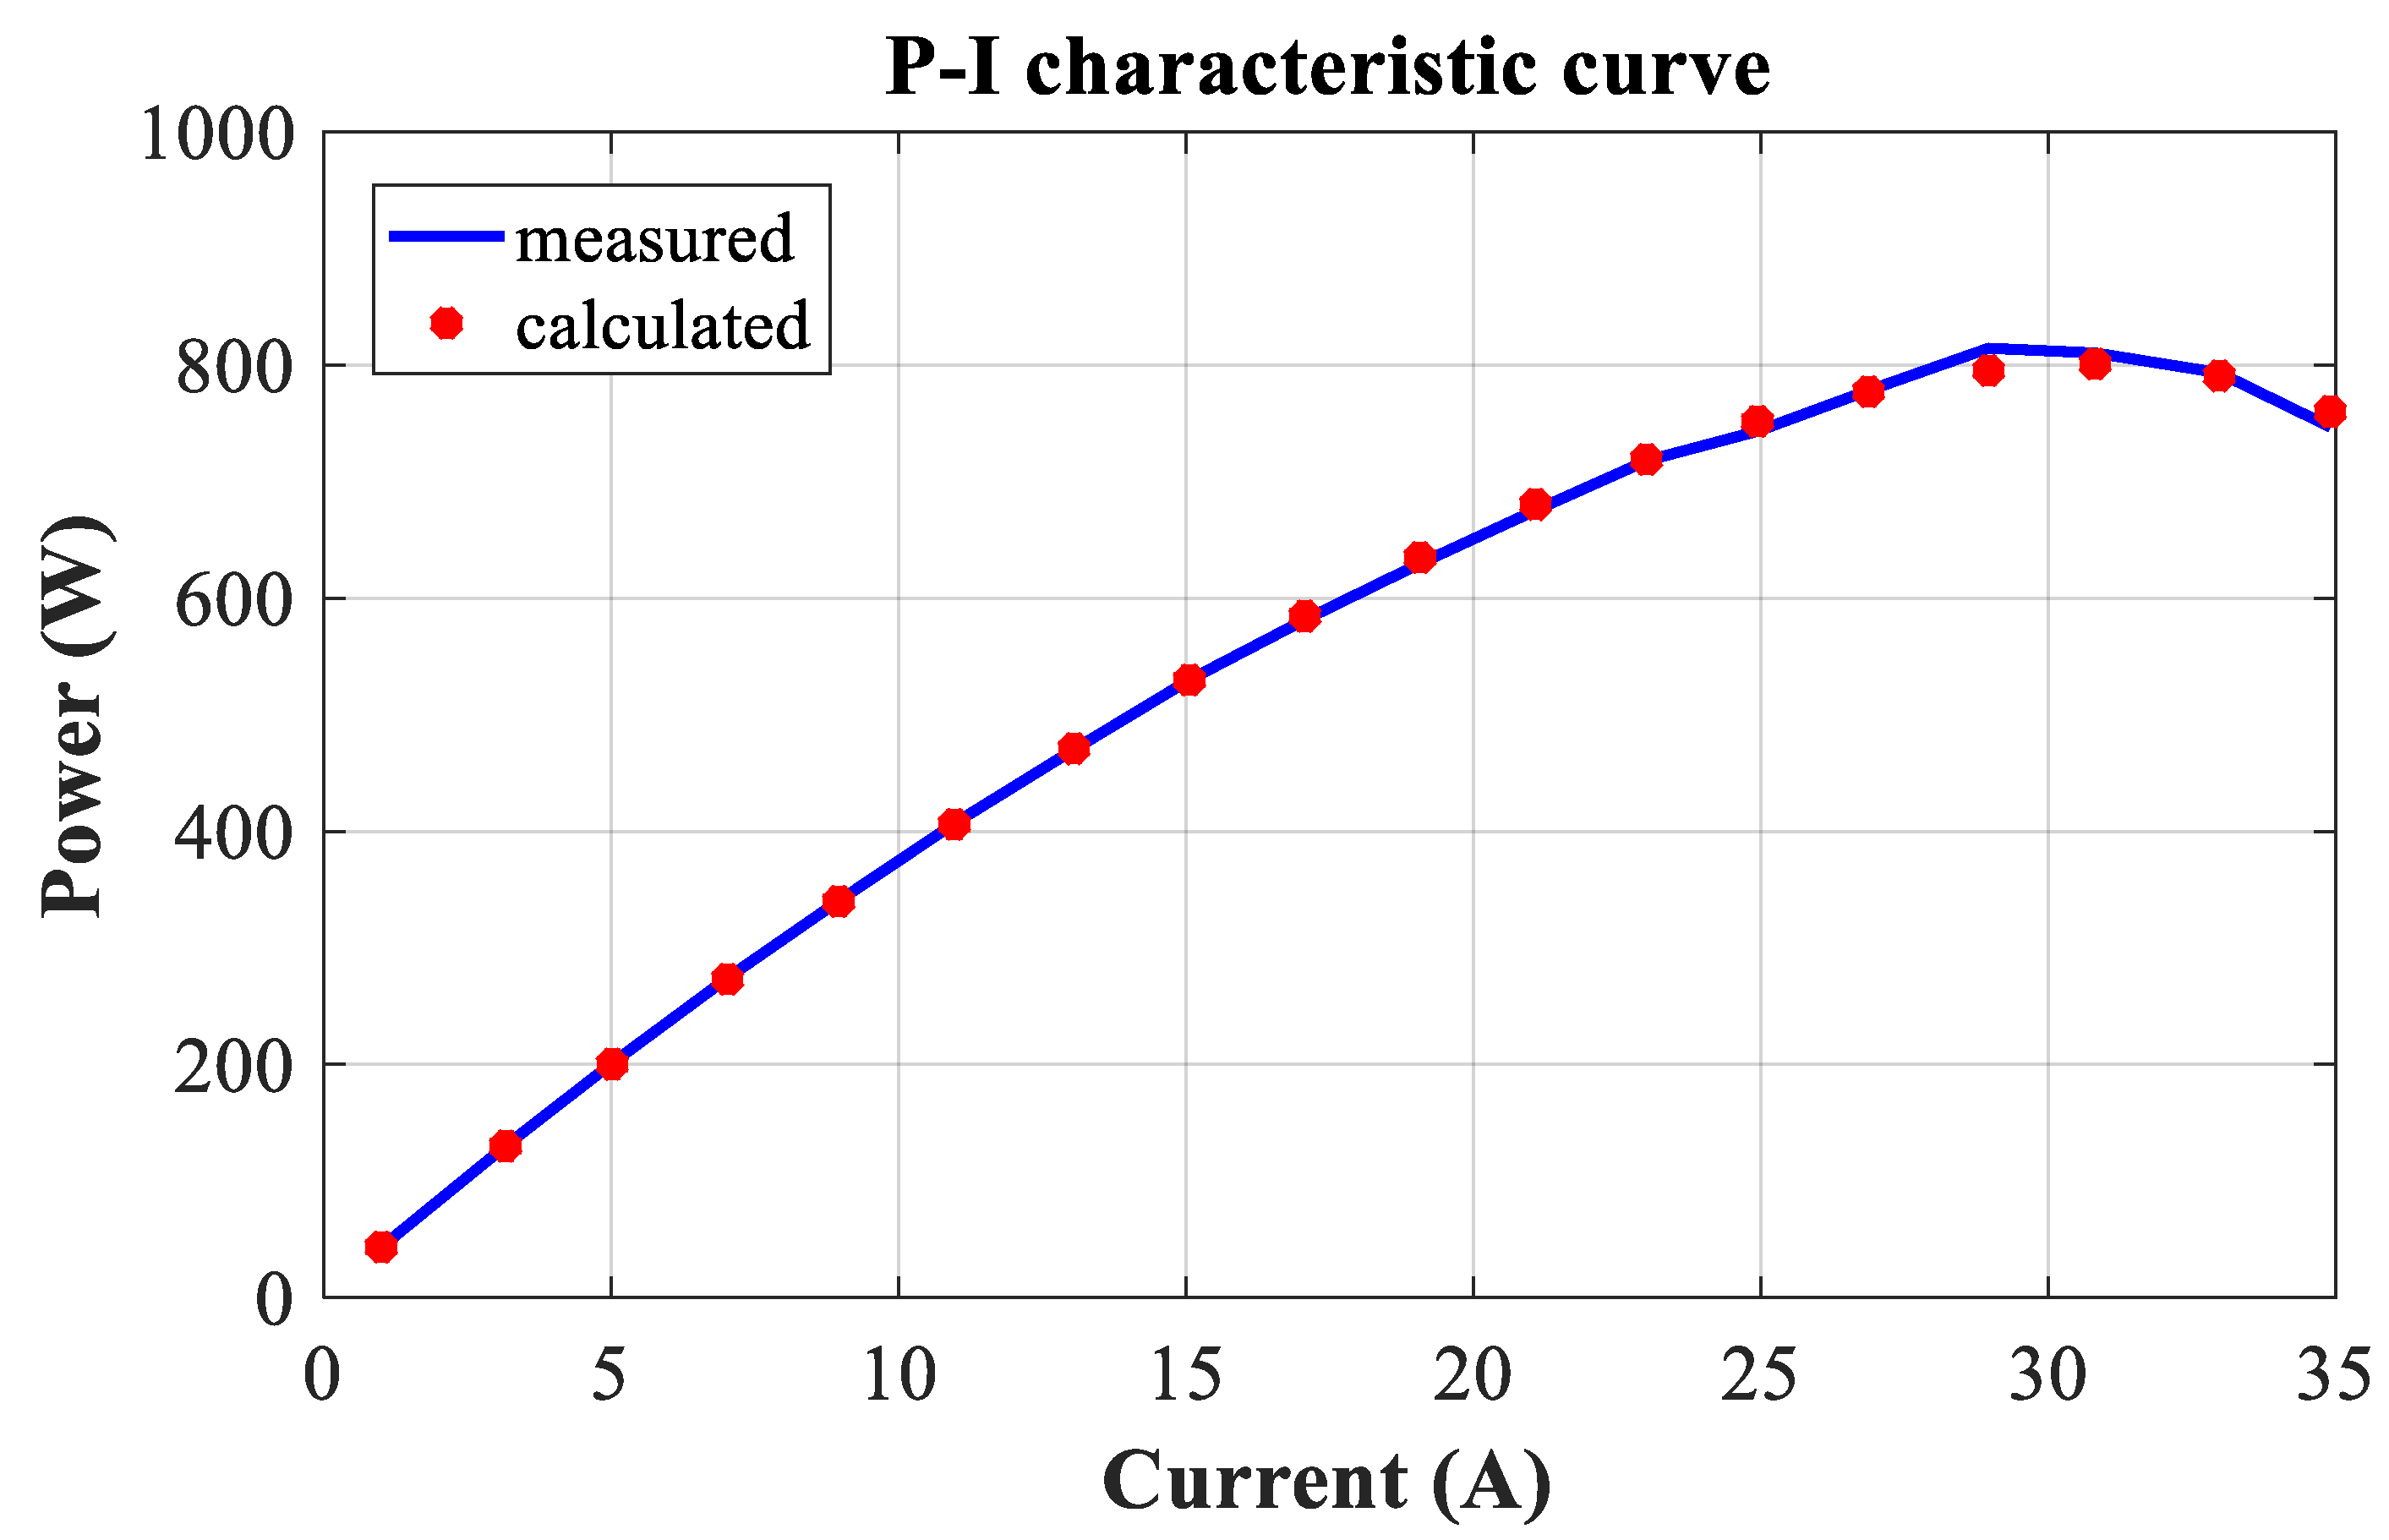
Figure 3 and Figure 4 show the V-I and P-I curves of SR-12 PEM, which were drawn using experimental measurements and estimated data generated by the DEA method. Therefore, Figure 3 and Figure 4 demonstrate the highest degree of similarity between the DEA V-I and P-I curves and the relevant experimental curves.
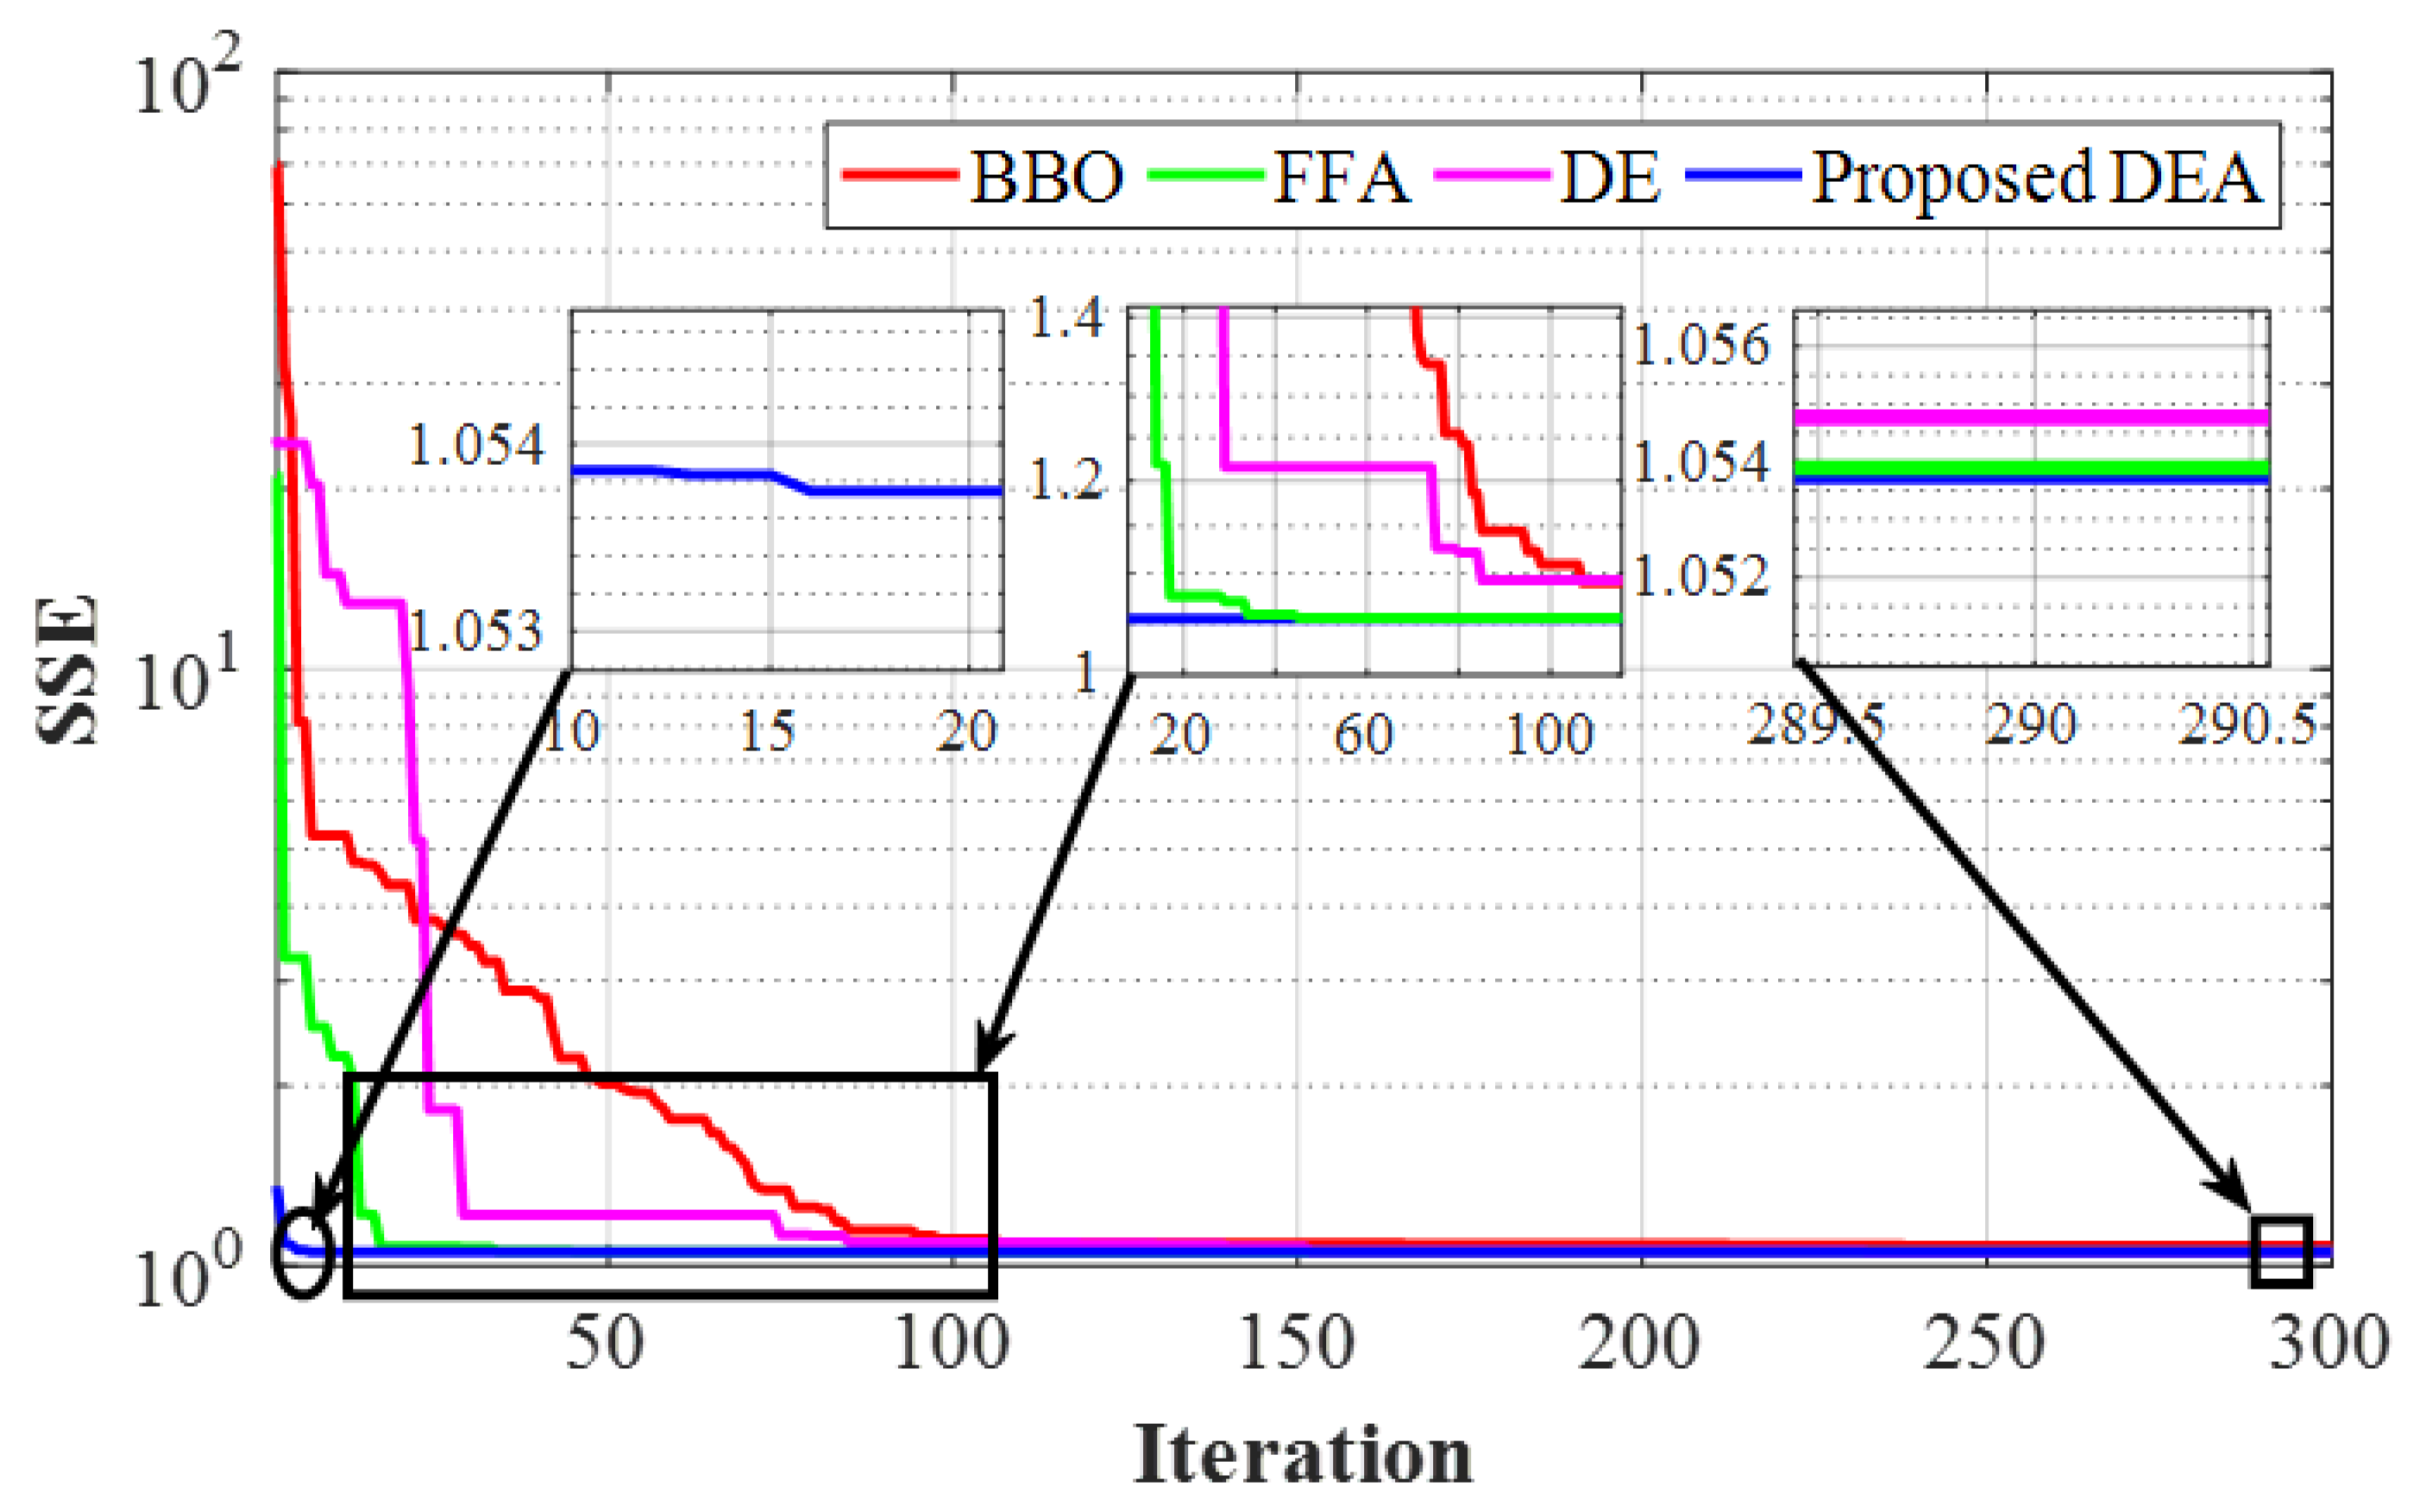
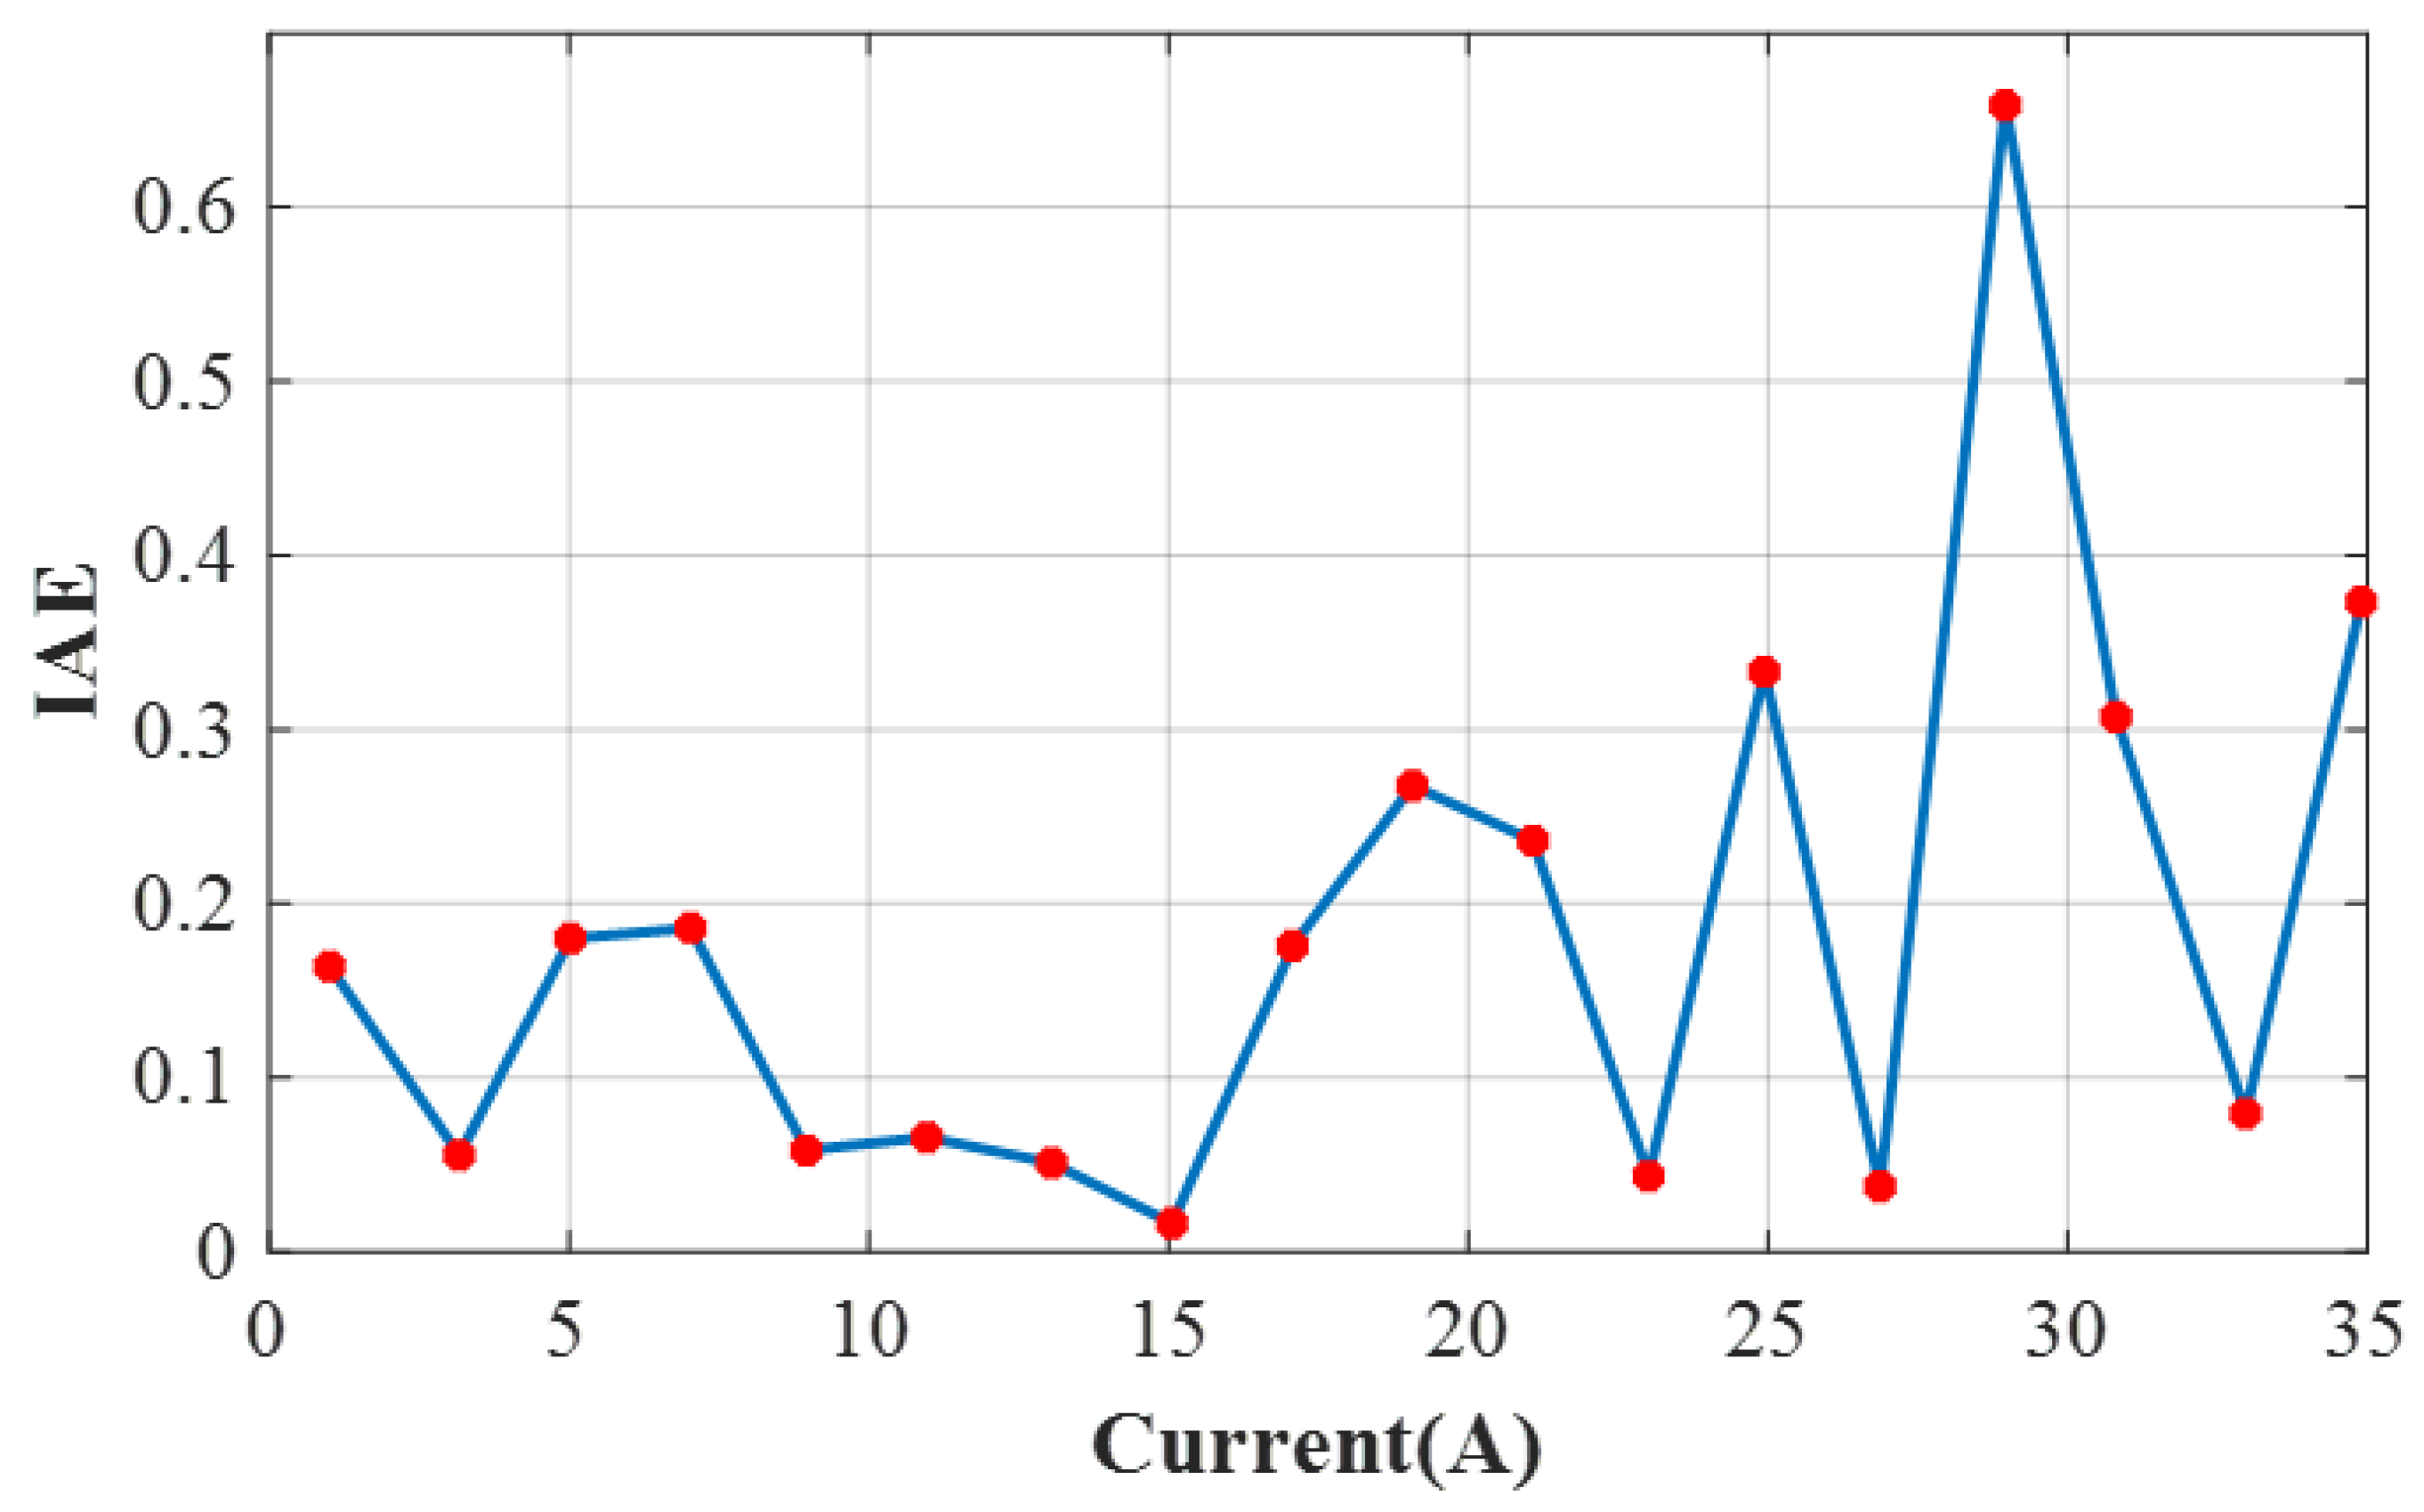
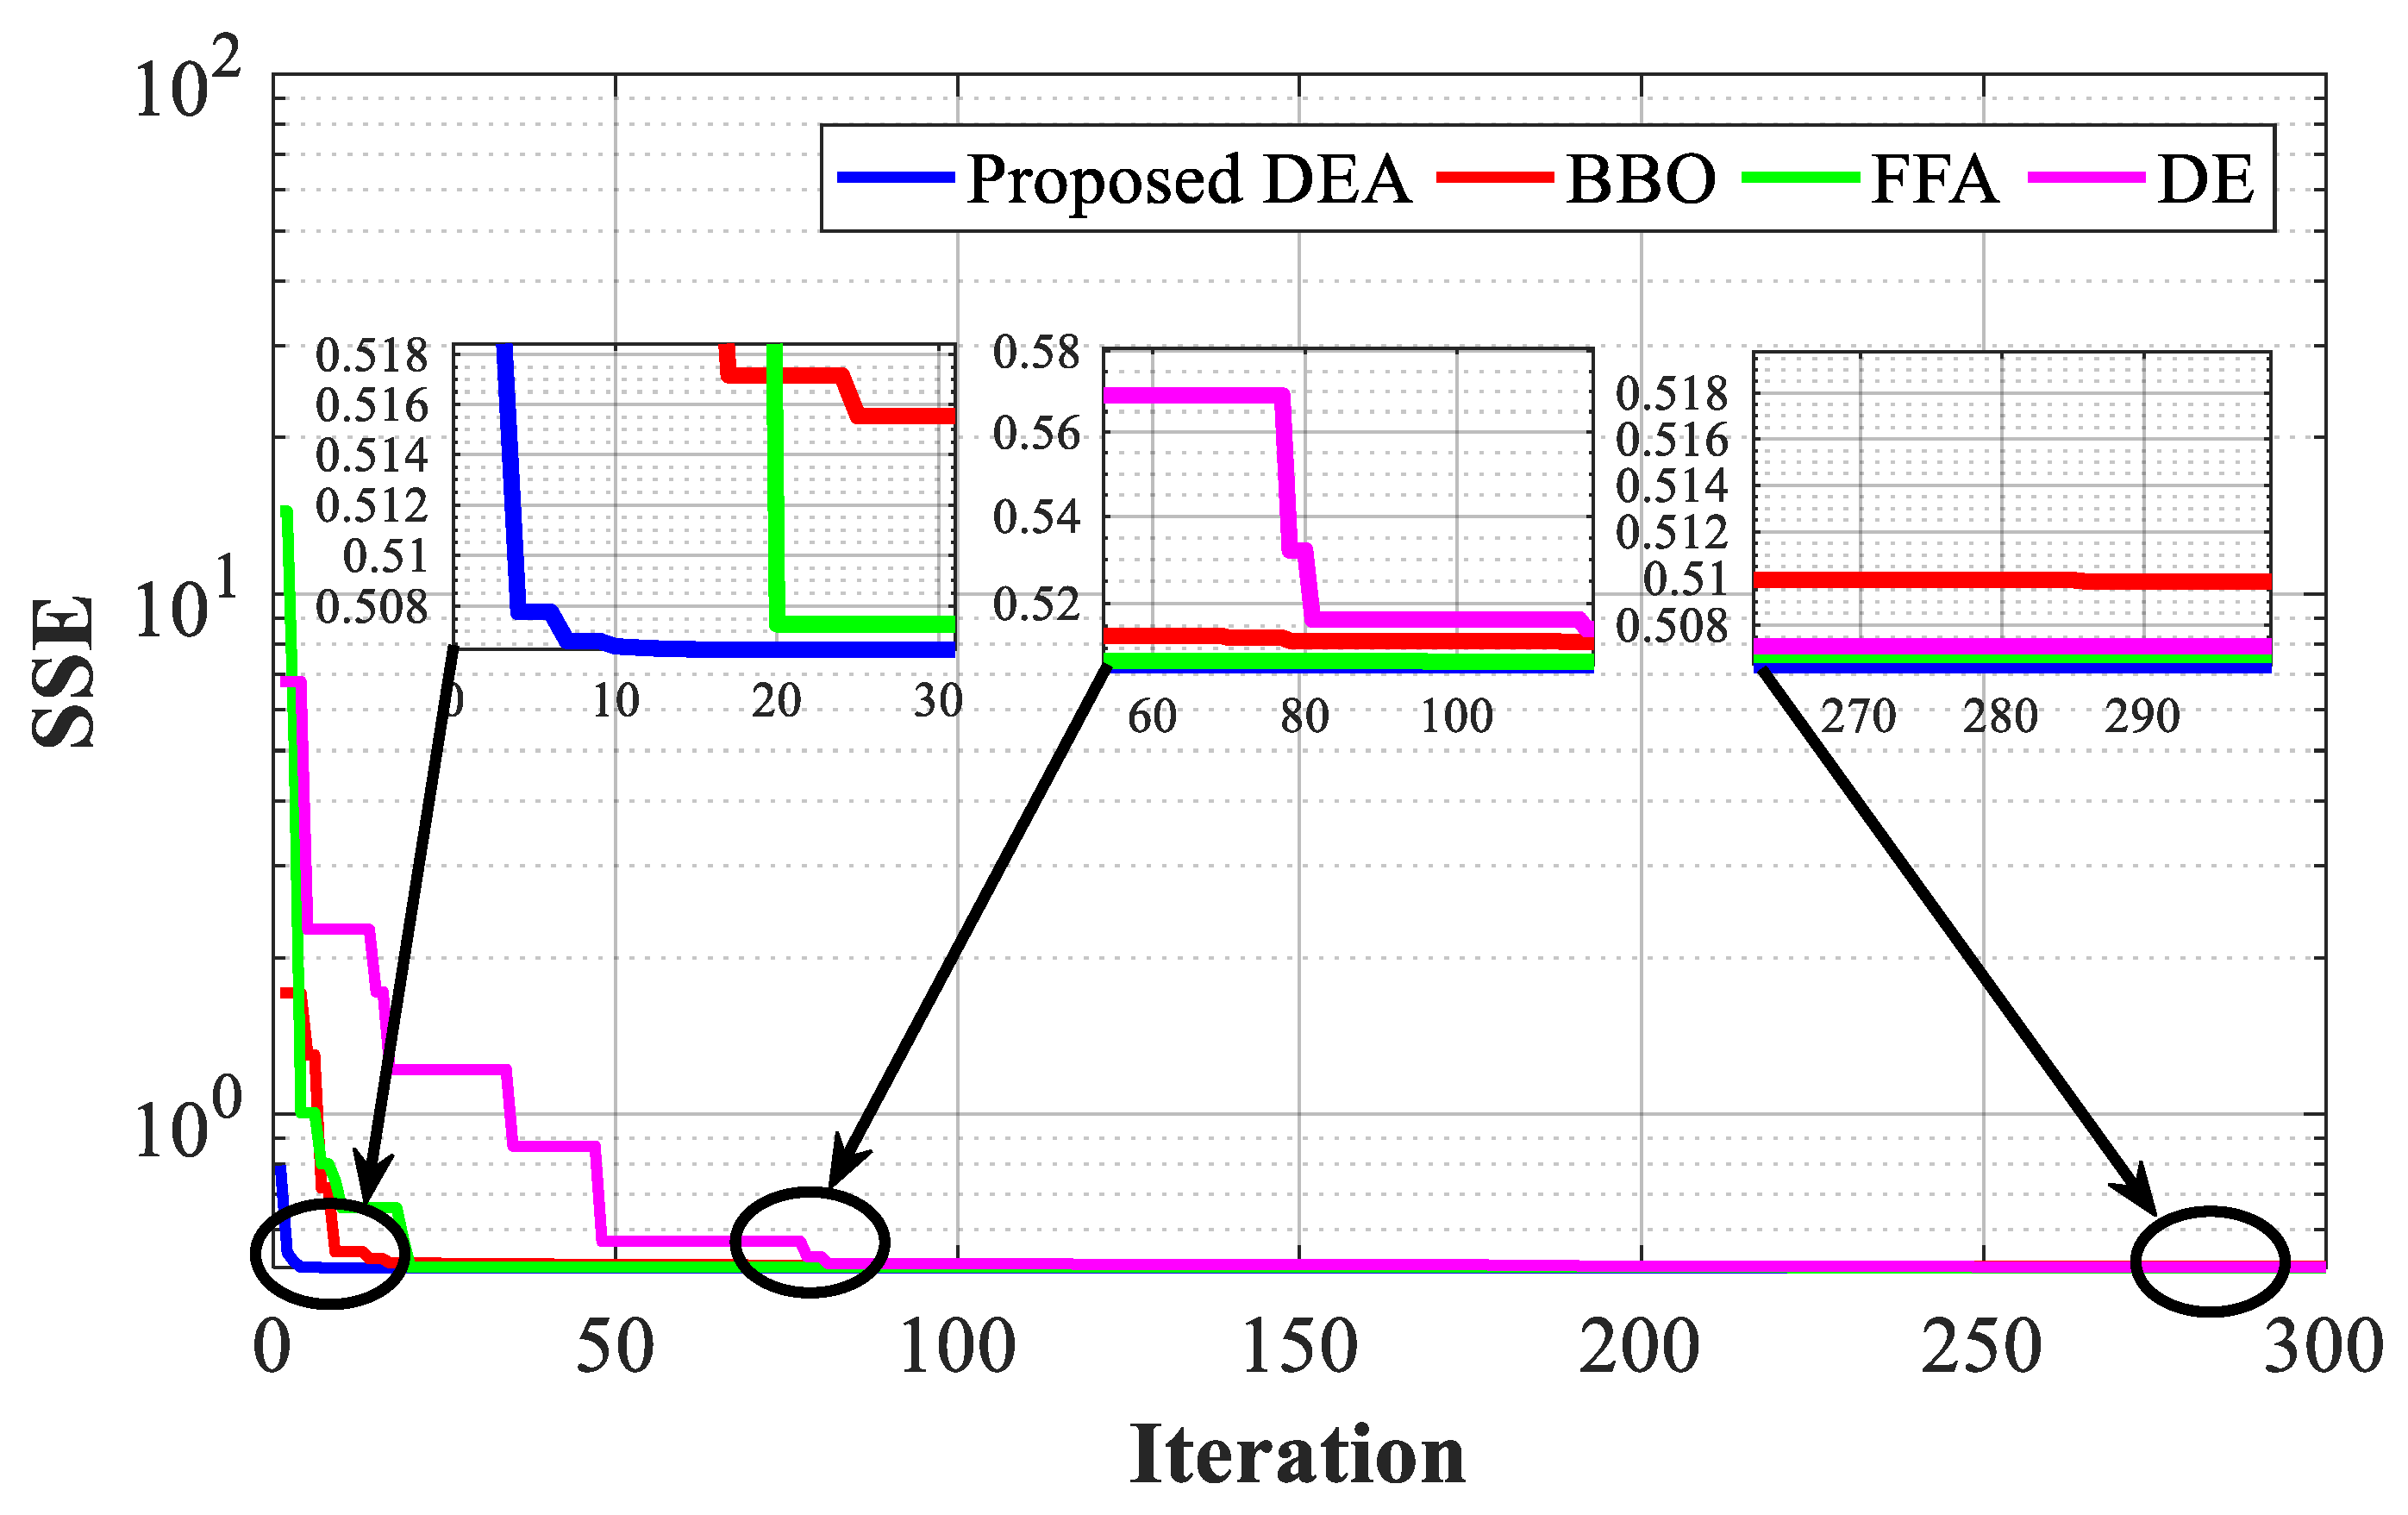
Figure 5 displays the convergence characteristics of all the methods specified in Table 5. The proposed DEA method demonstrates the most optimal convergence curve. Furthermore, Figure 6 displays the IAE values, with only one point exceeding 0.4. Figure 5 displays the convergence characteristics of all the methods specified in Table 5. The proposed DEA method demonstrates the most optimal convergence curve. Furthermore, Figure 6 displays the IAE values, with only one point exceeding 0.4 despite the non-linearity of the I/V curve and the lack of sufficient data points. The IEA for each data point is calculated and presented in Table 6.
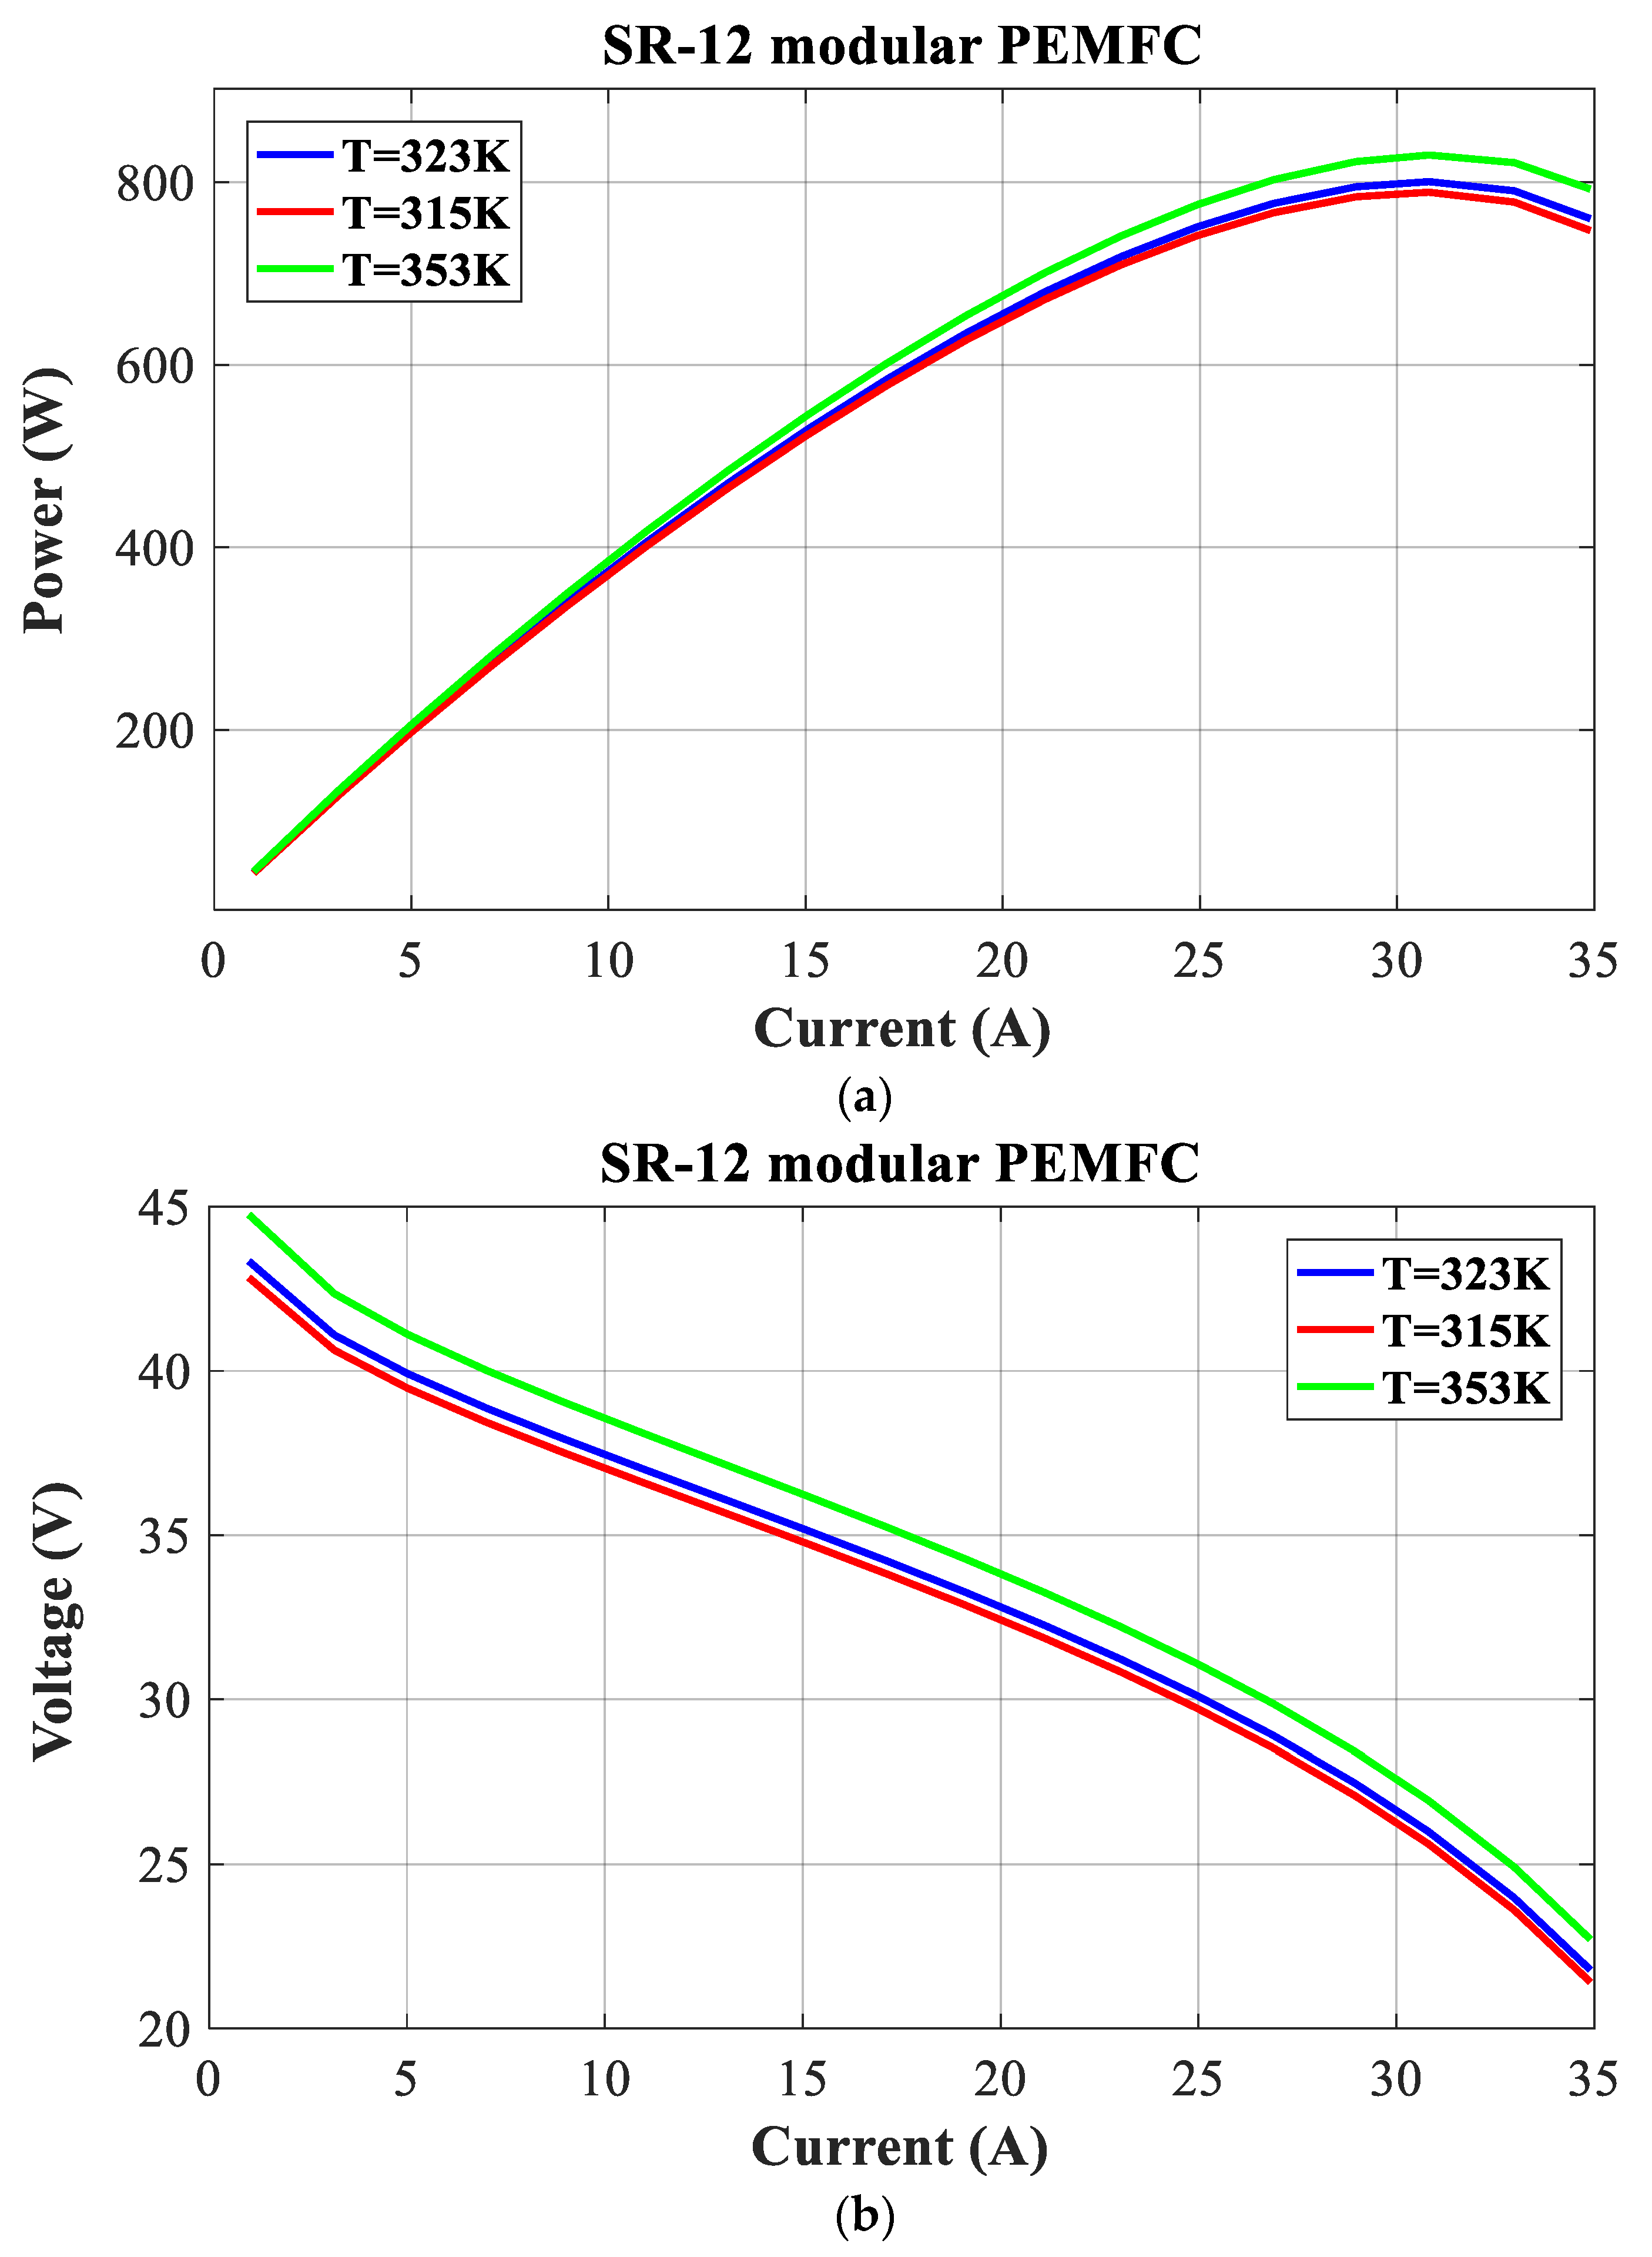
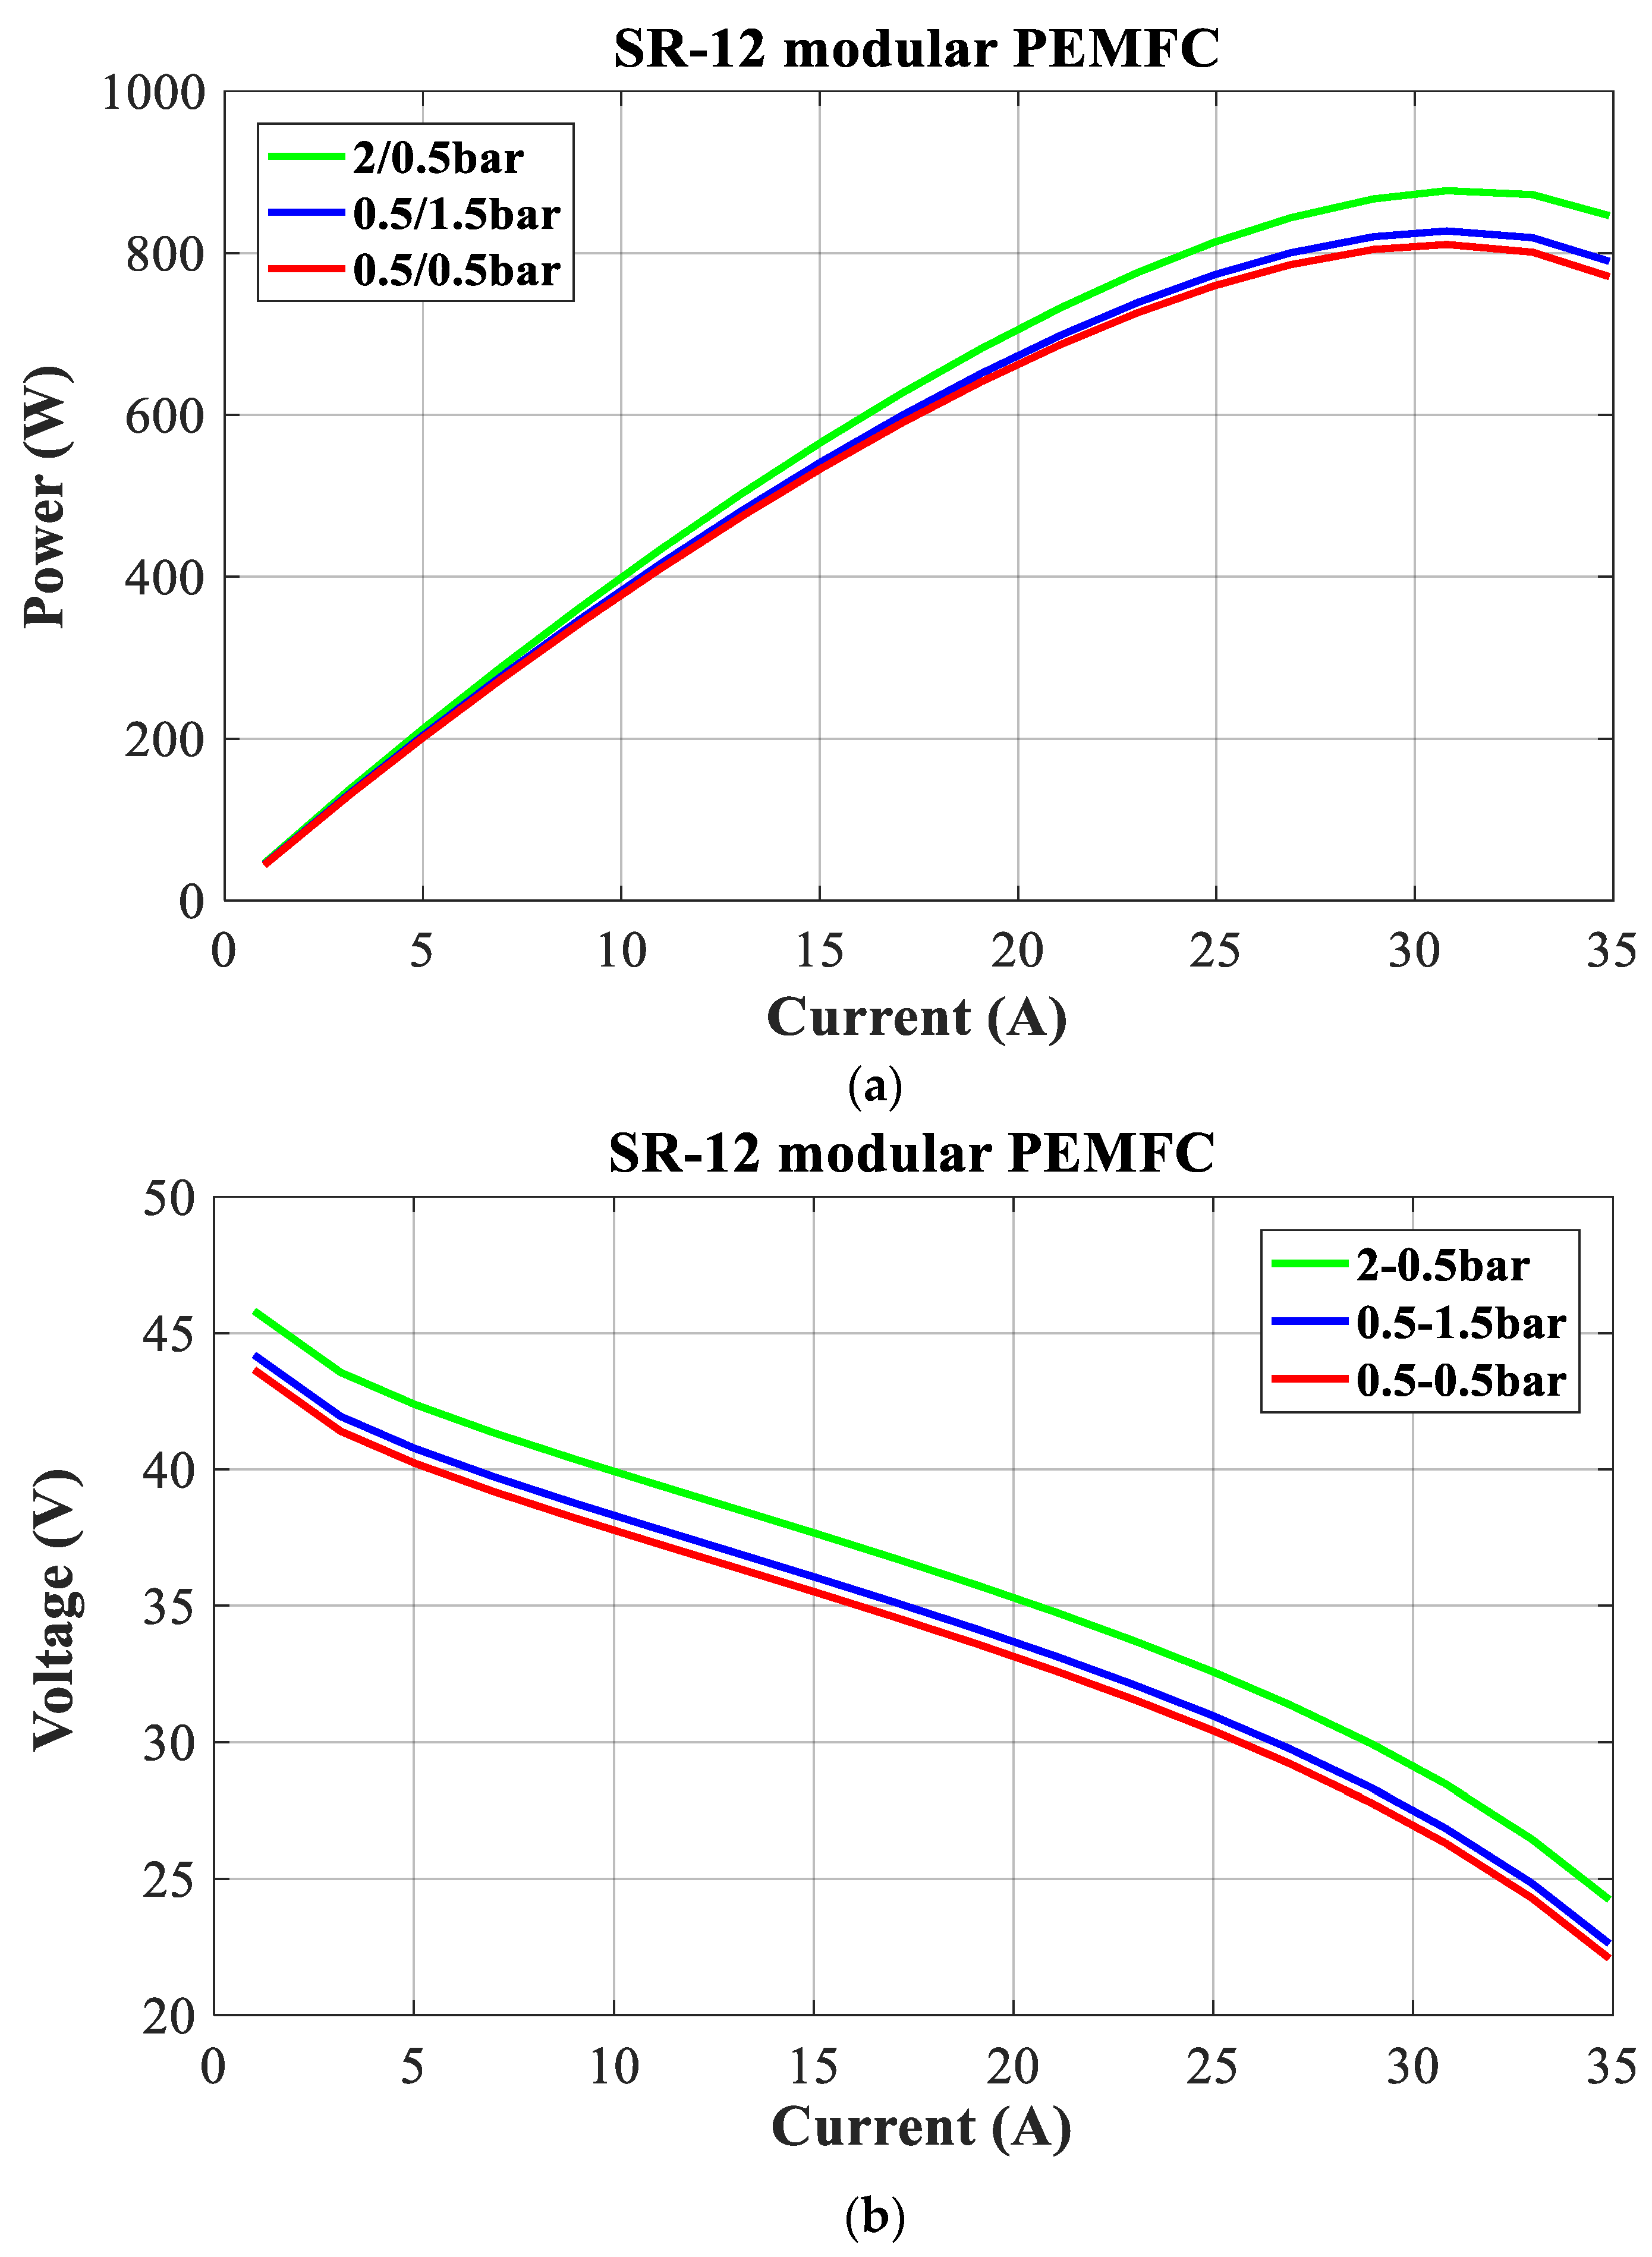
The stability and accuracy of the suggested optimization technique are assessed by examining the impact of altering the cell temperature and reactant pressures. The polarization curves of SR-12 at various cell temperatures and the effects of H2 and O2 pressure changes are presented in Figure 7 and Figure 8, based on the optimum parameters delivered by DEA.
The polarization curves (P-I and V-I) of the SR-12 PEMFC stack at temperatures of 323 K, 315 K, and 353 K are shown in Figure 7. In this case, the pressures are maintained at the levels specified in the manufacturer’s datasheet. Furthermore, Figure 8 shows the polarization curves of the SR-12 PEMFC stack, which are measured at several pressures: 2/0.5 bar, 0.5/1.5 bar, 0.5/0.5 bar, and the constant temperature value specified in the manufacturer’s datasheet.
It is evident that the power and voltage of the SR-12 PEMFC increase as the reactant pressures and cell temperature rise.

5.2. Type 2: 250 W Stack

The objective of this section is to enhance the model parameters of the 250 W PEMFC based on the proposed DEA. The results and data obtained from this model are available in Table 7, Table 8 and Table 9.
The results detailed that the proposed DEA provides the lowest SSE (0.5063), surpassing the performance of other methods. Table 7 depicts a detailed statistical comparison of the proposed DEA with many conventional algorithms. Regarding standard STD, MAE, and RMSE, it is evident that the DEA algorithm is highly accurate compared to BBO, FFA, DE, GOA, RSA, and PDO. The optimized parameter values for several algorithms are listed in Table 8. It can be observed that the optimal result of the DEA algorithm is 1.05374, while the BBO, FFA, DE, GOA, RSA, and PDO algorithms yield the following optimal results: 1.0593, 1.0538, 1.0539, 1.05662, 1.0566, and 1.0566, respectively.
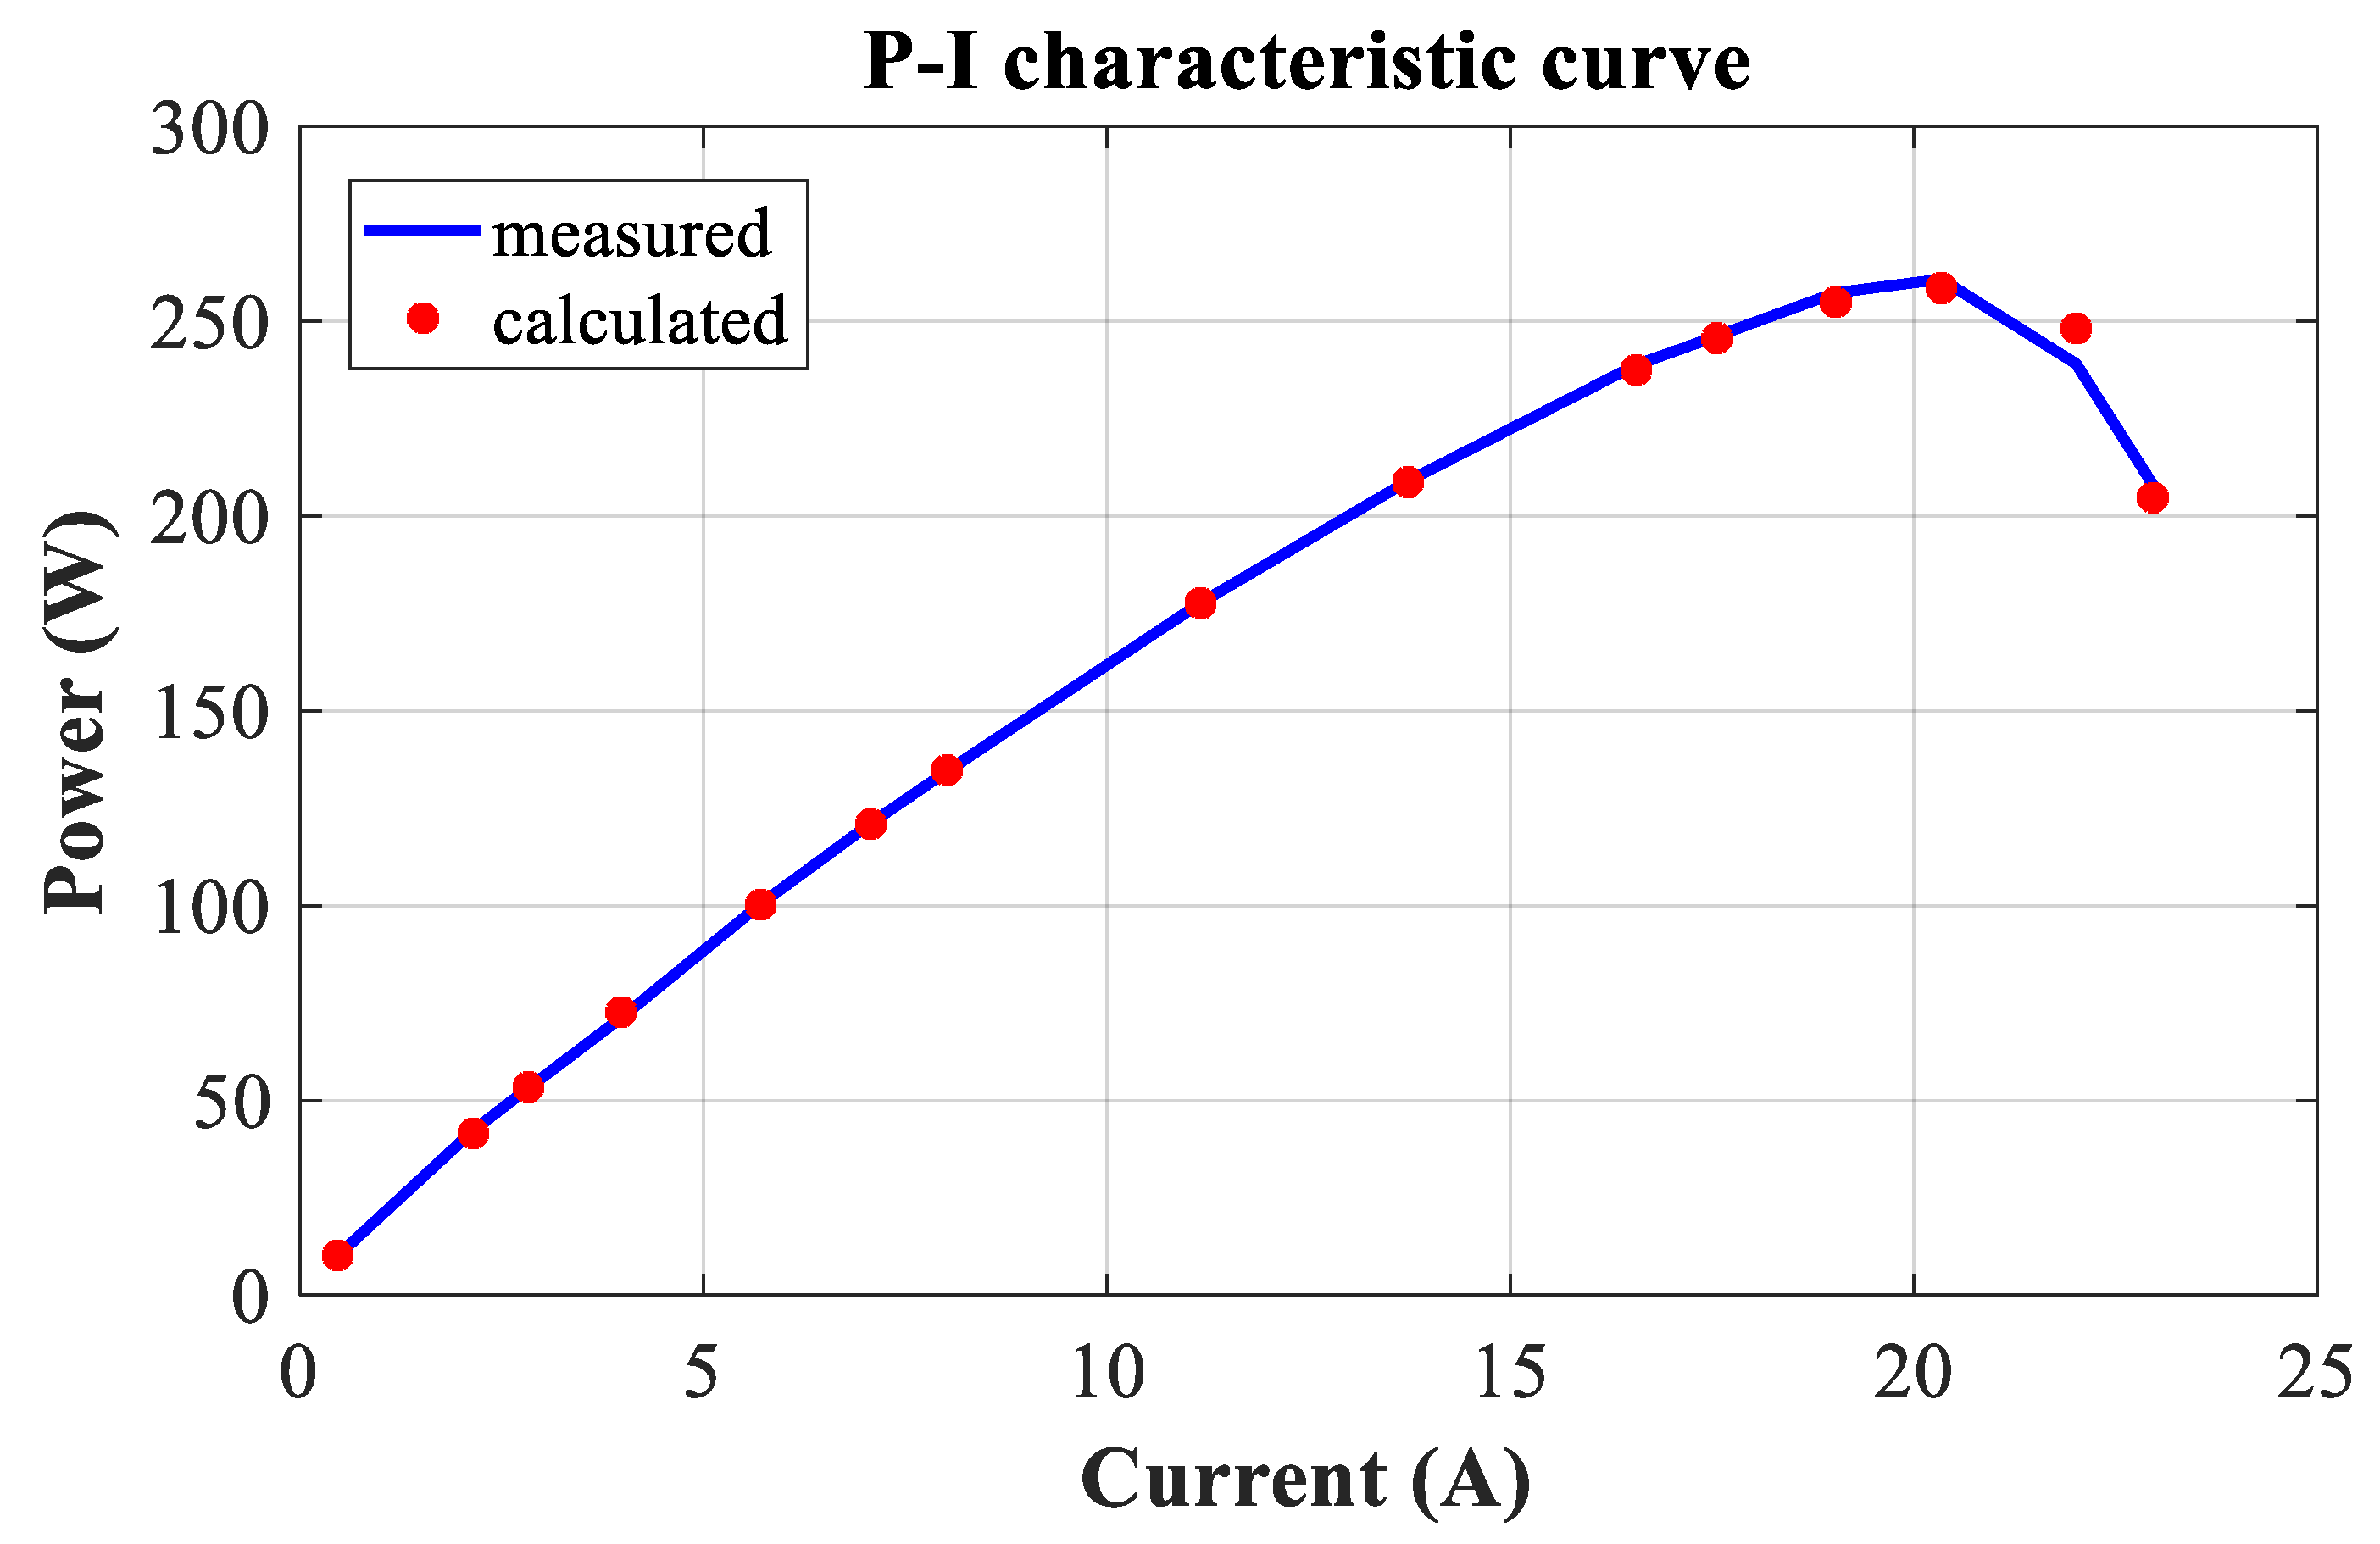
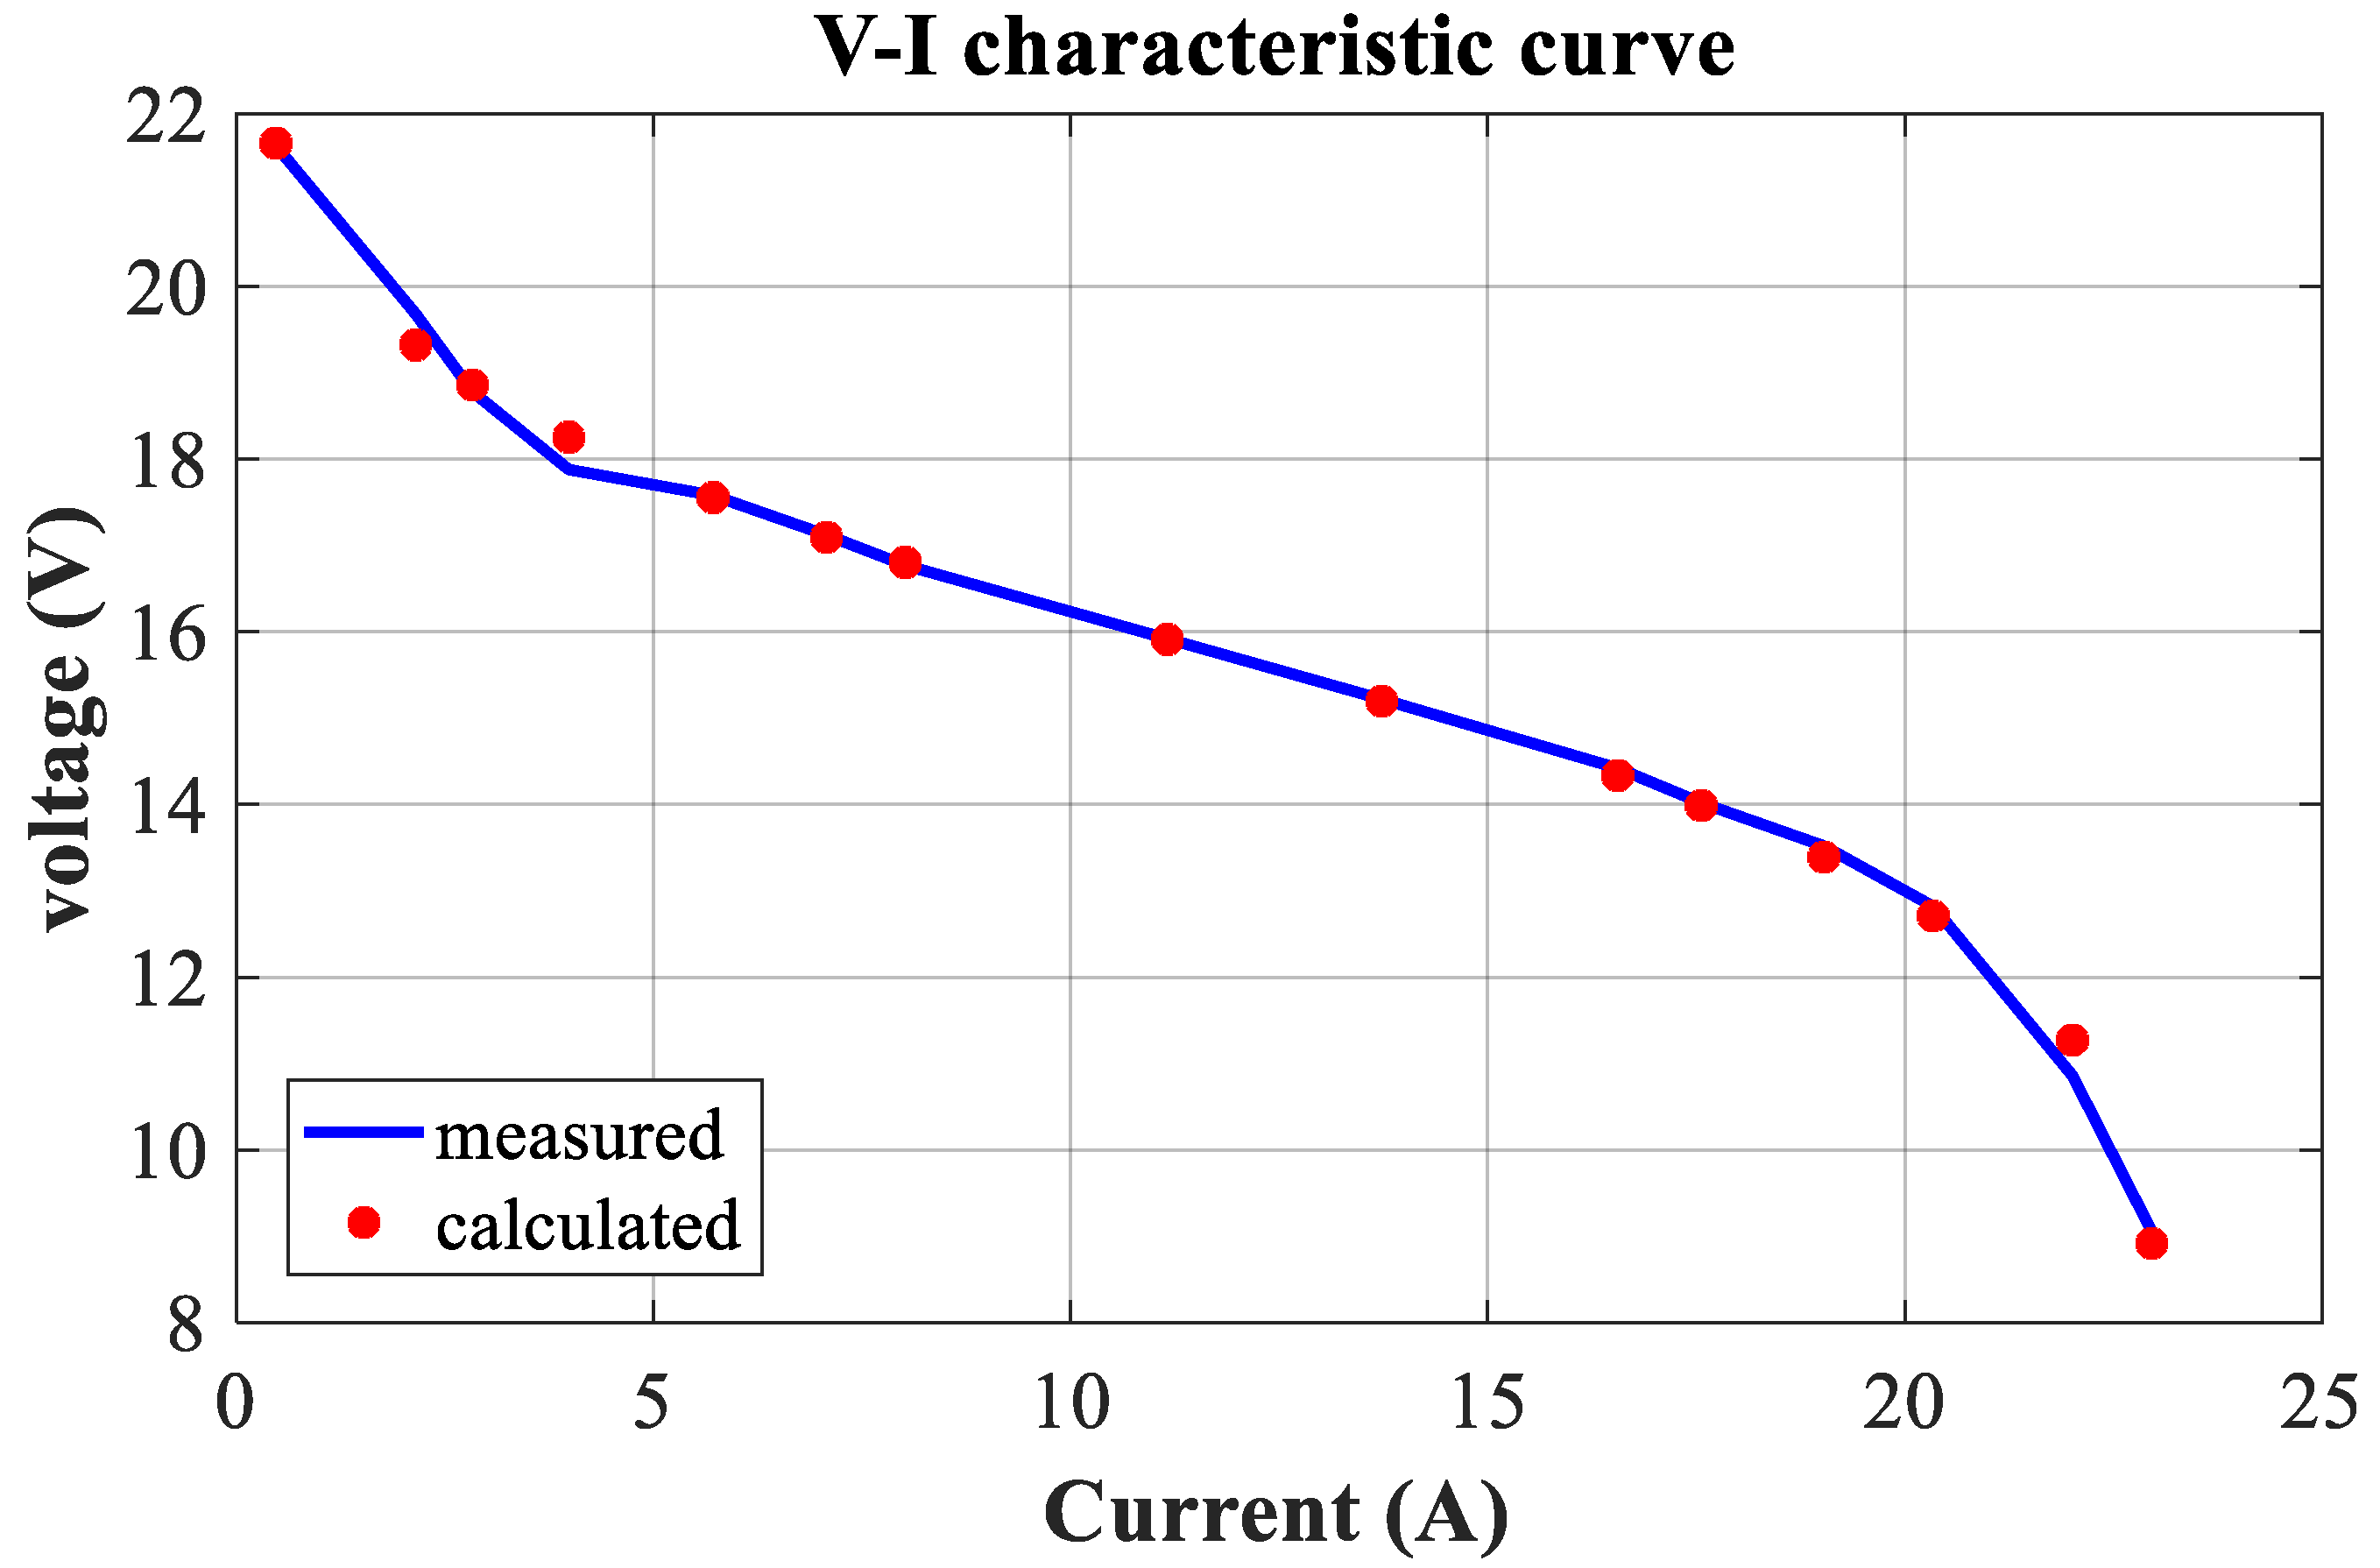
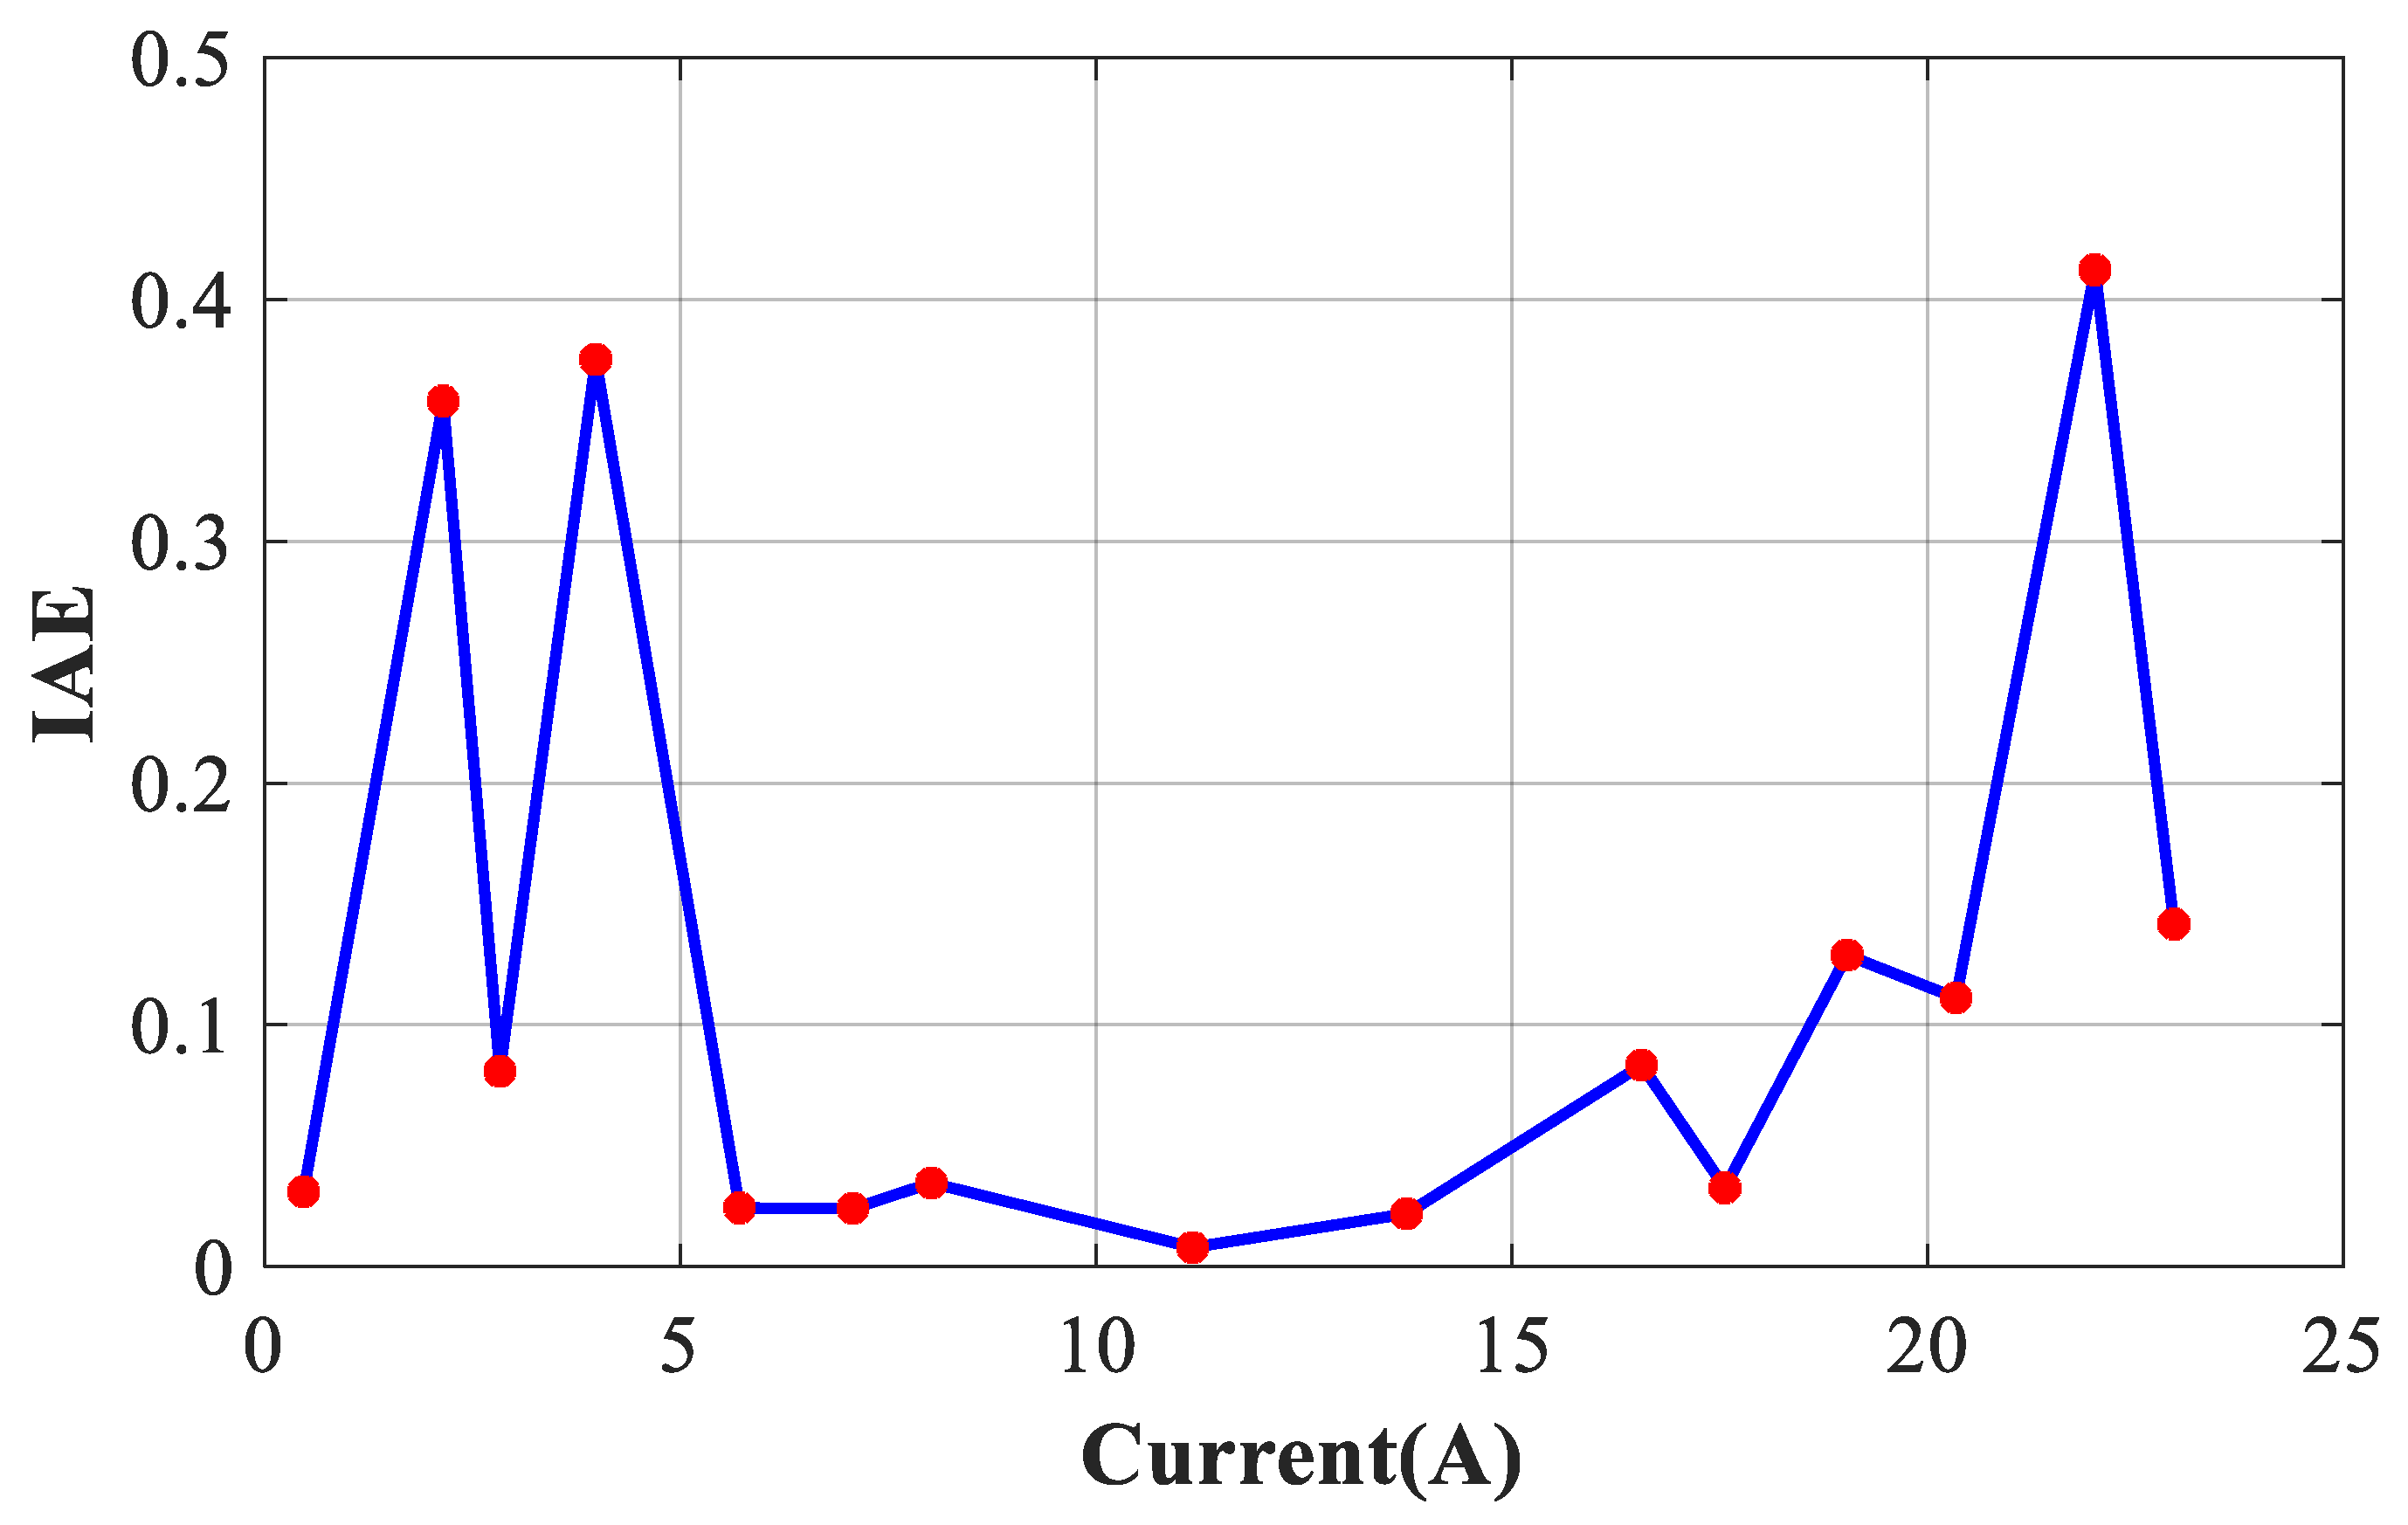
The V-I and P-I curves of the 250 W PEMFC are depicted in Figure 9 and Figure 10, respectively. These curves are drawn using experimental and measurement data generated by the DEA algorithm. Thus, the DEA V-I and P-I curves exhibit a high similarity to the relevant experimental curves. Figure 11 displays the convergence curves of DEA, BBO, and FFA algorithms in terms of iterations. The comparison graphs demonstrate that the proposed DEA outperforms other approaches in terms of convergence speed. Moreover, only one point exceeds 0.4 from the IAE values, despite the non-linearity of the I/V curve and the lack of sufficient data points, as presented in Figure 12. The IAE for each data point is computed and displayed in Table 6.
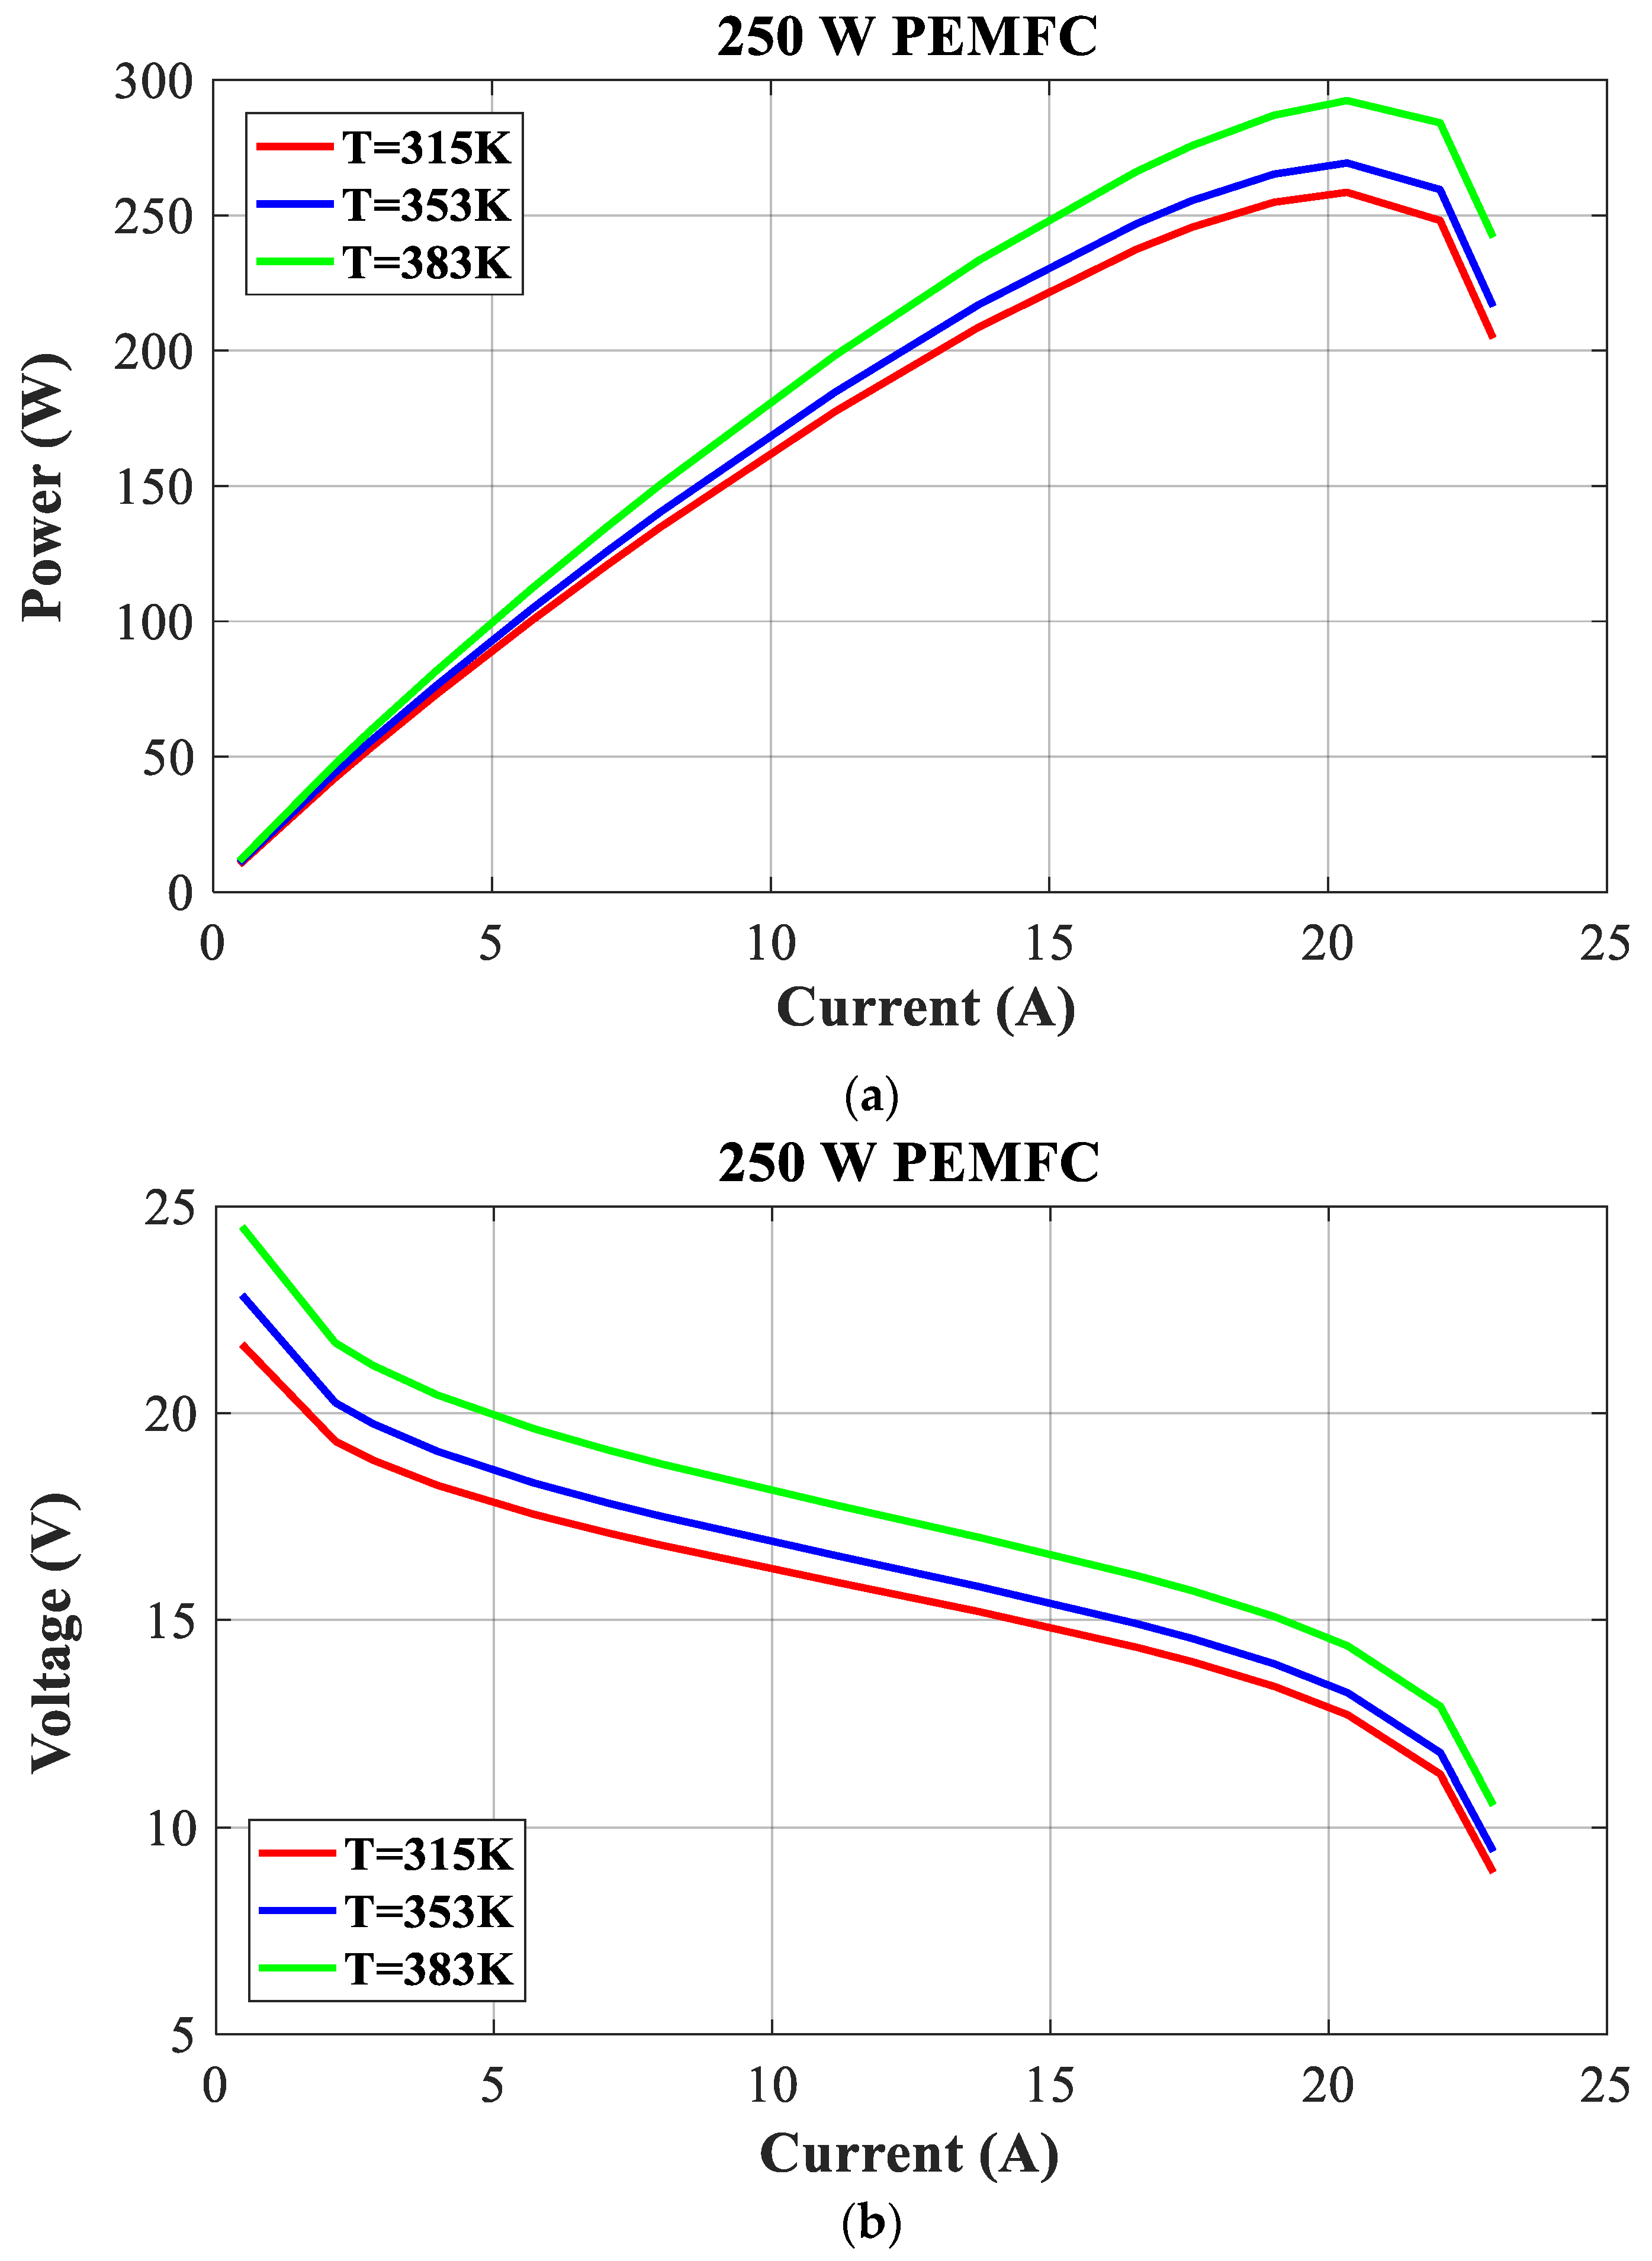
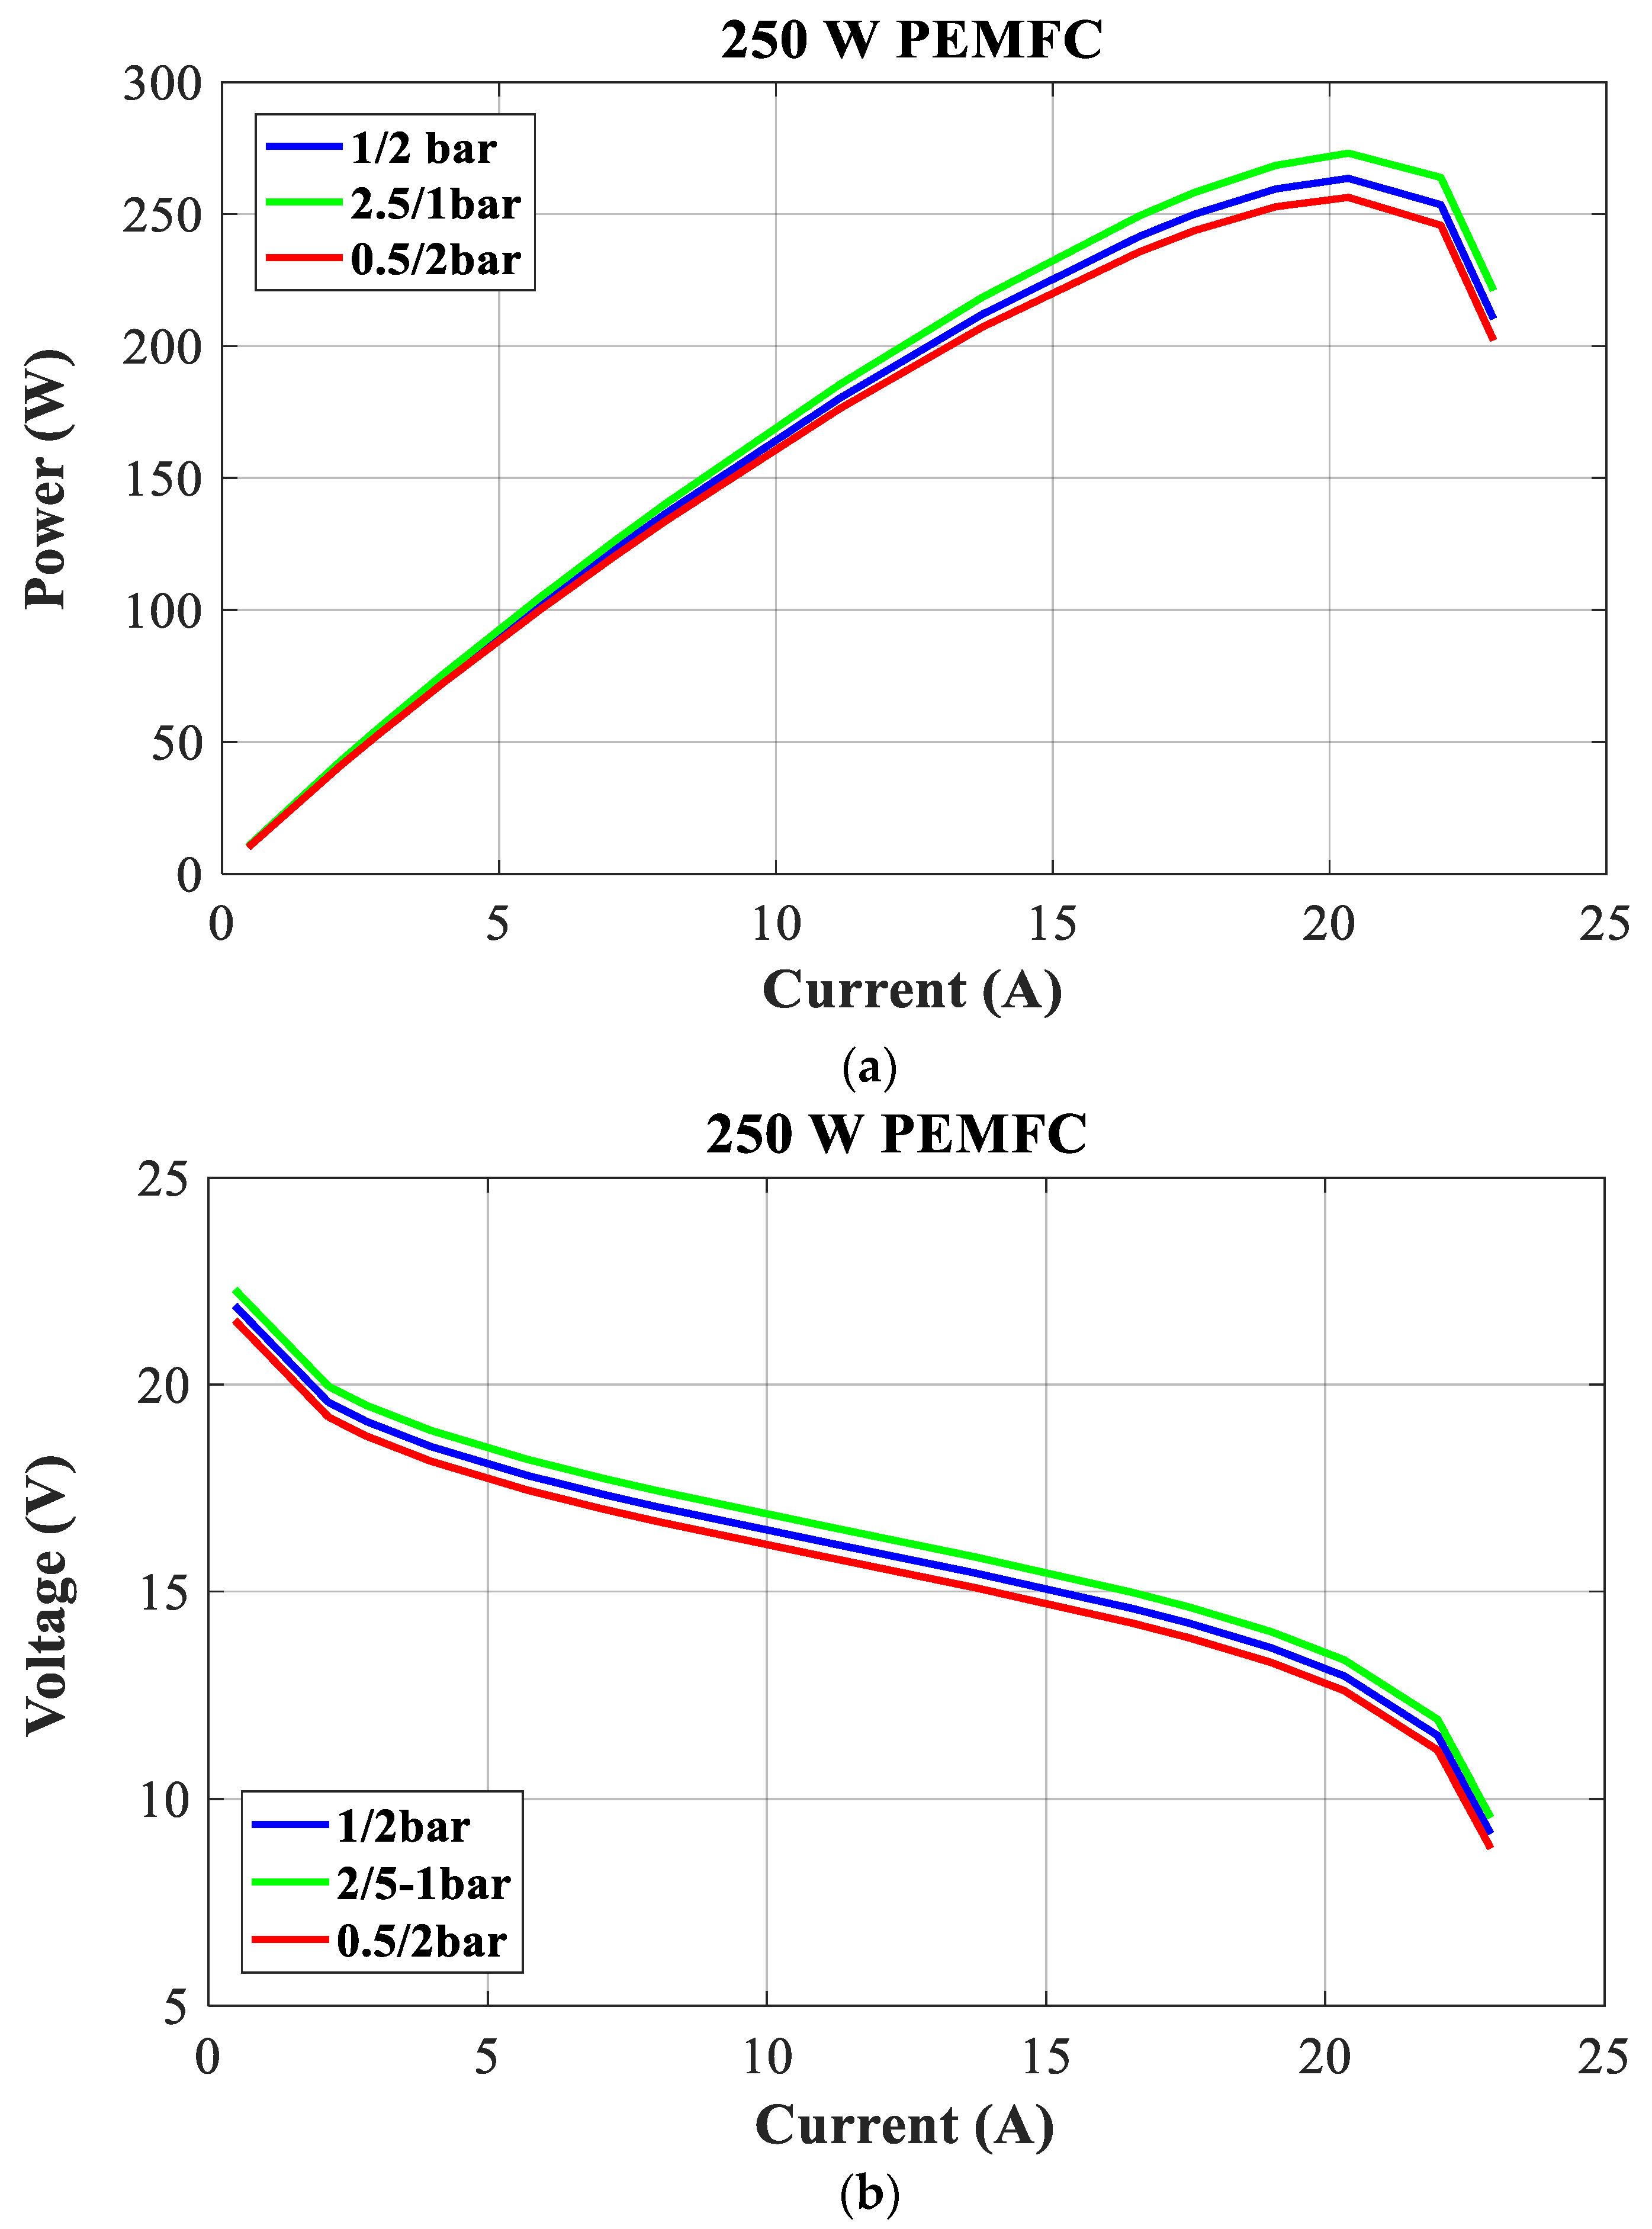
The stability and accuracy of the proposed optimization technique are evaluated by analyzing the effects of changing the cell temperature and reactant pressures. Figure 13 and Figure 14 show the polarization curves of a 250 W PEMFC at different cell temperatures and the effects of changes in H2 and O2 pressure. Figure 13 displays the polarization curves (P-I and V-I) of the 250 W PEMFC stack at various temperature values (315 K, 335 K, and 383 K) and constant pressures at the levels specified in the manufacturer’s datasheet. The pressures are maintained at the levels specified in the datasheet. Furthermore, the polarization curves of the 250 W PEMFC stack are drawn in Figure 14 at several pressure values (1/2 bar, 2.5/1 bar, and 0.5/2 bar) and constant temperature at a value specified in the datasheet.
The 250 W PEMFC’s power and voltage increase with reactant pressures and cell temperature.

6. Conclusions

A proton exchange membrane fuel cell (PEMFC) is a kind of electrochemical device that generates electrical energy. The mathematical model of PEMFC is non-linear, consists of seven parameters, and is used to fit the V-I and P-I characteristic curves under various operating situations. These parameters characterize the performance and operation of the model equations. A novel hybrid meta-heuristics technique, namely differential evolution ameliorated (DEA).
The unknown seven parameters of a PEMFC with accurate values were introduced in this study. The proposed DEA is a combination of differential evolution (DE) and Firefly (FA) algorithms. A detailed comparison analysis with previously published methods such as BBO, FFA, DE, GOA, RSA, and PDO was performed using MATLAB/SimulinkTM (R2016b, MathWorks, Natick, MA, USA) regarding system correctness and the convergence process to verify the proposed DEA-based parameter identification.
To determine the precise values of unknown model parameters for addressing the optimization issue, the fitness function is defined as the sum of squared errors (SSE) between the real models and the optimizing models. The suggested approach demonstrated a strong connection between the calculated and measured data under various operating situations, indicating excellent performance for all the PEMFC stacks investigated. The suggested DEA has achieved the best solution and is more efficient than previous algorithms discussed in the literature for all test types.
The findings indicate that the BBO, FFA, and DE algorithms exhibit low accuracy parameter values and slower convergence speeds. Hence, it is advisable to use the DEA method for resolving intricate and extensively interconnected optimization issues.
Author Contributions

Conceptualization, B.K. and A.L.; methodology B.K. and A.L.; visualization, B.K. and A.L.; software and validation, B.K. and A.L.; formal analysis, B.K. and A.L.; investigation, B.K. and A.L.; resources, B.K. and A.L.; data curation, B.K. and A.L.; writing—original draft preparation, B.K. and A.L.; writing—review and editing, B.K. and A.L.; All authors have read and agreed to the published version of the manuscript.

Funding

This research received no external funding.

Data Availability Statement

The original contributions presented in the study are included in the article, further inquiries can be directed to the corresponding author.

Conflicts of Interest

The authors declare no conflict of interest.

References

  1. Ali, M.N.; Mahmoud, K.; Lehtonen, M.; Darwish, M.M.F. Promising MPPT methods combining metaheuristic, fuzzy-logic and ANN techniques for grid-connected photovoltaic. Sensors 2021, 21, 1244. [Google Scholar] [CrossRef]
  2. Sun, C.; Zhang, H. Review of the Development of First-Generation Redox Flow Batteries: Iron-Chromium System. ChemSusChem 2022, 15, e202101798. [Google Scholar] [CrossRef]
  3. Rezk, H.; Wilberforce, T.; Olabi, A.G.; Ghoniem, R.M.; Sayed, E.T.; Abdelkareem, M.A. Optimal Parameter Identification of a PEM Fuel Cell Using Recent Optimization Algorithms. Energies 2023, 16, 5246. [Google Scholar] [CrossRef]
  4. Larminie, J. Fuel Cell Systems Explained; John Wiley & Sons. Ltd.: Hoboken, NJ, USA, 2003; Volume 2, pp. 1324–1332. [Google Scholar]
  5. Menesy, A.S.; Sultan, H.M.; Korashy, A.; Banakhr, F.A.; Ashmawy, M.G.; Kamel, S. Effective Parameter Extraction of Different Polymer Electrolyte Membrane Fuel Cell Stack Models Using a Modified Artificial Ecosystem Optimization Algorithm. IEEE Access 2020, 8, 31892–31909. [Google Scholar] [CrossRef]
  6. Shang, Z.; Hossain, M.M.; Wycisk, R.; Pintauro, P.N. Poly(phenylene sulfonic acid)-expanded polytetrafluoroethylene composite membrane for low relative humidity operation in hydrogen fuel cells. J. Power Sources 2022, 535, 231375. [Google Scholar] [CrossRef]
  7. Li, J.; Gao, X.; Cui, Y.; Hu, J.; Xu, G.; Zhang, Z. Accurate, efficient and reliable parameter extraction of PEM fuel cells using shuffled multi-simplexes search algorithm. Energy Convers. Manag. 2020, 206, 112501. [Google Scholar] [CrossRef]
  8. Bankupalli, P.T.; Ghosh, S.; Kumar, L.; Samanta, S.; Dixit, T.V. A non-iterative approach for maximum power extraction from PEM fuel cell using resistance estimation. Energy Convers. Manag. 2019, 187, 565–577. [Google Scholar] [CrossRef]
  9. Stepančič, M.; Juričić, Ð.; Boškoski, P. Fault detection of fuel cell systems based on statistical assessment of impedance data. Energy Convers. Manag. 2019, 195, 76–85. [Google Scholar] [CrossRef]
  10. Yang, S.; Chellali, R.; Lu, X.; Li, L.; Bo, C. Modeling and optimization for proton exchange membrane fuel cell stack using aging and challenging P systems based optimization algorithm. Energy 2016, 109, 569–577. [Google Scholar] [CrossRef]
  11. Moreira, M.V.; da Silva, G.E. A practical model for evaluating the performance of proton exchange membrane fuel cells. Renew. Energy 2009, 34, 1734–1741. [Google Scholar] [CrossRef]
  12. Mann, R.F.; Amphlett, J.C.; Hooper, M.A.I.; Jensen, H.M.; Peppley, B.A.; Roberge, P.R. Development and application of a generalised steady-state electrochemical model for a PEM fuel cell. J. Power Sources 2000, 86, 173–180. [Google Scholar] [CrossRef]
  13. Ettihir, K.; Boulon, L.; Becherif, M.; Agbossou, K.; Ramadan, H.S. Online identification of semi-empirical model parameters for PEMFCs. Int. J. Hydrogen Energy 2014, 39, 21165–21176. [Google Scholar] [CrossRef]
  14. Amphlett, J.C.; Baumert, R.M.; Mann, R.F.; Peppley, B.A.; Roberge, P.R.; Harris, T.J. Performance Modeling of the Ballard Mark IV Solid Polymer Electrolyte Fuel Cell: II. Empirical Model Development. J. Electrochem. Soc. 1995, 142, 9–15. [Google Scholar] [CrossRef]
  15. Kandidayeni, M.; Macias, A.; Khalatbarisoltani, A.; Boulon, L.; Kelouwani, S. Benchmark of proton exchange membrane fuel cell parameters extraction with metaheuristic optimization algorithms. Energy 2019, 183, 912–925. [Google Scholar] [CrossRef]
  16. Sohani, A.; Naderi, S.; Torabi, F. Comprehensive comparative evaluation of different possible optimization scenarios for a polymer electrolyte membrane fuel cell. Energy Convers. Manag. 2019, 191, 247–260. [Google Scholar] [CrossRef]
  17. Ariza, H.E.; Correcher, A.; Sánchez, C.; Pérez-Navarro, Á.; García, E. Thermal and electrical parameter identification of a proton exchange membrane fuel cell using genetic algorithm. Energies 2018, 11, 2099. [Google Scholar] [CrossRef]
  18. Diab, A.A.Z.; Ali, H.; Abdul-Ghaffar, H.I.; Abdelsalam, H.A.; El Sattar, M.A. Accurate parameters extraction of PEMFC model based on metaheuristics algorithms. Energy Rep. 2021, 7, 6854–6867. [Google Scholar] [CrossRef]
  19. Korkmaz, S.A.; Çetinkaya, S.A.; Yuksel, O.; Konur, O.; Erginer, K.E.; Colpan, C.O. Comparison of various metaheuristic algorithms to extract the optimal PEMFC modeling parameters. Int. J. Hydrogen Energy 2024, 51, 1402–1420. [Google Scholar] [CrossRef]
  20. Zhang, L.; Wang, N. Application of coRNA-GA based RBF-NN to model proton exchange membrane fuel cells. Int. J. Hydrogen Energy 2018, 43, 329–340. [Google Scholar] [CrossRef]
  21. Ye, M.; Wang, X.; Xu, Y. Parameter identification for proton exchange membrane fuel cell model using particle swarm optimization. Int. J. Hydrogen Energy 2009, 34, 981–989. [Google Scholar] [CrossRef]
  22. Fathy, A.; Elaziz, M.A.; Alharbi, A.G. A novel approach based on hybrid vortex search algorithm and differential evolution for identifying the optimal parameters of PEM fuel cell. Renew. Energy 2020, 146, 1833–1845. [Google Scholar] [CrossRef]
  23. Chakraborty, U.K.; Abbott, T.E.; Das, S.K. PEM fuel cell modeling using differential evolution. Energy 2012, 40, 387–399. [Google Scholar] [CrossRef]
  24. Yang, B.; Zhang, X.; Yu, T.; Shu, H.; Fang, Z. Grouped grey wolf optimizer for maximum power point tracking of doubly-fed induction generator based wind turbine. Energy Convers. Manag. 2017, 133, 427–443. [Google Scholar] [CrossRef]
  25. Priya, K.; Rajasekar, N. Application of flower pollination algorithm for enhanced proton exchange membrane fuel cell modelling. Int. J. Hydrogen Energy 2019, 44, 18438–18449. [Google Scholar] [CrossRef]
  26. Seleem, S.I.; Hasanien, H.M.; El-Fergany, A.A. Equilibrium optimizer for parameter extraction of a fuel cell dynamic model. Renew. Energy 2021, 169, 117–128. [Google Scholar] [CrossRef]
  27. Qin, F.; Liu, P.; Niu, H.; Song, H.; Yousefi, N. Parameter estimation of PEMFC based on Improved Fluid Search Optimization Algorithm. Energy Rep. 2020, 6, 1224–1232. [Google Scholar] [CrossRef]
  28. Kheirandish, A.; Shafiabady, N.; Dahari, M.; Kazemi, M.S.; Isa, D. Modeling of commercial proton exchange membrane fuel cell using support vector machine. Int. J. Hydrogen Energy 2016, 41, 11351–11358. [Google Scholar] [CrossRef]
  29. Yang, B.; Li, D.; Zeng, C.; Chen, Y.; Guo, Z.; Wang, J.; Shu, H.; Yu, T.; Zhu, J. Parameter extraction of PEMFC via Bayesian regularization neural network based meta-heuristic algorithms. Energy 2021, 228, 120592. [Google Scholar] [CrossRef]
  30. Yuan, Z.; Wang, W.; Wang, H.; Razmjooy, N. A new technique for optimal estimation of the circuit-based PEMFCs using developed Sunflower Optimization Algorithm. Energy Rep. 2020, 6, 662–671. [Google Scholar] [CrossRef]
  31. Isa, Z.M.; Nayan, N.M.; Arshad, M.H.; Kajaan, N.A.M. Optimizing PEMFC model parameters using ant lion optimizer and dragonfly algorithm: A comparative study. Int. J. Electr. Comput. Eng. 2019, 9, 5312–5320. [Google Scholar] [CrossRef]
  32. Priya, K.; Babu, T.S.; Balasubramanian, K.; Kumar, K.S.; Rajasekar, N. A novel approach for fuel cell parameter estimation using simple Genetic Algorithm. Sustain. Energy Technol. Assess. 2015, 12, 46–52. [Google Scholar] [CrossRef]
  33. Yakout, A.H.; Hasanien, H.M.; Kotb, H. Proton Exchange Membrane Fuel Cell Steady State Modeling Using Marine Predator Algorithm Optimizer. Ain Shams Eng. J. 2021, 12, 3765–3774. [Google Scholar] [CrossRef]
  34. Han, I.S.; Chung, C.B. Performance prediction and analysis of a PEM fuel cell operating on pure oxygen using data-driven models: A comparison of artificial neural network and support vector machine. Int. J. Hydrogen Energy 2016, 41, 10202–10211. [Google Scholar] [CrossRef]
  35. Wilberforce, T.; Rezk, H.; Olabi, A.G.; Epelle, E.I.; Abdelkareem, M.A. Comparative analysis on parametric estimation of a PEM fuel cell using metaheuristics algorithms. Energy 2023, 262, 125530. [Google Scholar] [CrossRef]
  36. Storn, R.; Price, K. Differential evolution–a simple and efficient heuristic for global optimization over continuous spaces. J. Glob. Optim. 1997, 11, 341–359. [Google Scholar] [CrossRef]
  37. Karci, A. Differential evolution algorithm and its variants. Comput. Sci. 2017, 2, 10–14. [Google Scholar]
  38. Yang, X.-S. Chapter 8—Firefly Algorithms; Elsevier: Oxford, UK, 2014; pp. 111–127. [Google Scholar]
  39. Sultan, H.M.; Menesy, A.S.; Alqahtani, M.; Khalid, M.; Diab, A.A.Z. Accurate parameter identification of proton exchange membrane fuel cell models using different metaheuristic optimization algorithms. Energy Rep. 2023, 10, 4824–4848. [Google Scholar] [CrossRef]
Figure 1. V-I polarization curve.
Energies 17 02333 g001
Figure 2. Flowchart of the proposed DEA algorithm.
Energies 17 02333 g002
Figure 3. Characteristics of the SR-12 modular PEMFC stack: P-I polarization curve.
Energies 17 02333 g003
Figure 4. Characteristics of the SR-12 modular PEMFC stack: V-I polarization curve.
Energies 17 02333 g004
Figure 5. Convergence curve of DEA, BBO, FFA, and DE for SR-12 modular.
Energies 17 02333 g005
Figure 6. Individual absolute error of the SR-12 modular.
Energies 17 02333 g006
Figure 7. Temperature variation: (a) P-I curves for SR-modular PEMFC, (b) V-I curves for SR-modular PEMFC.
Energies 17 02333 g007
Figure 8. Variation of hydrogen and oxygen pressures: (a) P-I curves for SR-modular PEMFC; (b) V-I curves for SR-modular PEMFC.
Energies 17 02333 g008
Figure 9. Characteristics of the 250 W PEMFC stack: P-I polarization curve.
Energies 17 02333 g009
Figure 10. Characteristics of the 250 W PEMFC stack: V-I polarization curve.
Energies 17 02333 g010
Figure 11. Convergence curves of DEA, BBO, FFA, and DE for 250 W PEMFC.
Energies 17 02333 g011
Figure 12. Individual absolute error of the 250 W PEMFC.
Energies 17 02333 g012
Figure 13. Temperature variation: (a) P-T curves for 250 W PEMFC; (b) V-I curves for 250 W PEMFC.
Energies 17 02333 g013
Figure 14. Variation of hydrogen and oxygen pressures: (a) P-I curves for 250 W PEMFC; (b) V-I curves for 250 W PEMFC.
Energies 17 02333 g014
Table 1. Range of unknown seven parameters.
Ranges
ParametersMinMax
ζ1−1.1997−0.08532
ζ2 × 10−30.86.00
ζ3 × 10−53.609.80
ζ4 × 10⁻⁴−2.60−0.954
A10.0024.00
β0.01360.5
RC × 10−41.008.00
Table 2. Specifications of the commercial PEMFC stacks.
Datasheet Parameters
Types of PEMFCSR-12 Modular250 W Stack
Ncell4824
A (cm2)62.527
L (µm)25127
jmax (A/cm2)0.6720.680
PH2 (atm)1.476281
PO2 (atm)0.20951
T (K)323343.15
Table 3. Initialization parameter.
Algorithms Values
Proposed DEAPcr = 0.6
gamma = 1.2
beta0 = 2
alpha = 0.095
DEPcr = 0.6
FFAK = 2
n = 30
BBOKeep Rate = 0.2
Table 4. Statistical results of the first case study for SR 12 PEMFC.
Algorithms
Proposed DEABBOFFADEGOA [39]RSA [39]PDO [39]
SSE min1.05371.05931.05381.05391.05661.05661.0566
SSE mean1.05371.07491.06611.05591.05661.05661.0586
SSE max1.05371.09551.09361.06201.05661.05661.0719
STD2.6113 × 10−120.00910.01110.00191.8709 × 10−131.7200 × 10−061.733 × 10⁻⁶
RMSE3.9545 × 10−111.4659 × 10−021.7029 × 10−025.4665 × 10−034.7296 × 10−154.7296 × 10−155.5914 × 10⁻³
MEA1.5638 × 10−212.1491 × 10−042.8999 × 10−042.9883 × 10−054.3594 × 10−154.3594 × 10−152.0417 × 10⁻³
Table 5. Comparative analysis of several algorithms for SR-12 PEMFC.
Algorithmsζ1ζ2 × 10⁻³ ζ3 × 10⁻⁵ ζ4 × 10−5 λRC × 10−4 βSSE
Proposed DEA−1.10213.76878.2004−9.5400248.0000.17691.05374
BBO−1.09493.40005.7105−1.002215.51844.08340.18251.0593
FFA−0.96233.56559.6835−9.545317.43648.00000.17691.0538
DE−1.03413.13655.4776−9.540014.54758.00000.17671.0539
GOA [39]−0.92983.59329.7999−9.540023.00006.72310.17531.0566
RSA [39]−0.92893.59329.7999−9.540023.00006.72310.17531.0566
PDO [39]−0.85322.75716.2497−9.540023.00006.72370.17531.0566
Table 6. The absolute errors for the SR-12 PEMFC stack, as well as the experimental and simulated stack voltages.
N0 Experimental Data Simulated Data
IexpVexpVmodIAE
11.004043.170043.33330.1638
23.166041.140041.08440.0555
35.019040.090039.91010.1798
47.027039.040038.85410.1858
58.958037.990037.93170.0582
610.970037.080037.01420.6577
713.050036.030036.08930.0509
815.060035.190035.17370.0162
917.070034.070034.24560.1756
1019.070033.020033.28760.2676
1121.080032.040032.27600.2360
1223.010031.200031.24350.0435
1324.940029.800030.13320.3332
1426.870028.960028.92240.0375
1528.960028.120027.46140.6585
1630.810026.300025.99280.3071
1732.970024.060032.98050.0794
1834.900021.400021.77330.3733
Table 7. Comparative analysis of several algorithms for 250 W PEMFC.
Algorithms
Proposed DEABBOFFADEGOA [39]RSA [39]PDO [39]
SSE min0.50630.50690.50630.50640.59400.59400.5940
SSE mean0.50630.51170.50920.50710.59400.59400.5940
SSE max0.50630.51850.54260.50790.59400.59400.5941
STD1.7256 × 10−112.3847 × 10−30.00724.0580 × 10−041.7473 × 10−147.4732 × 10−140.0036
RMSE7.8935 × 10−065.6538 × 10−32.8754 × 10−025.7100 × 10−022.1328 × 10−152.1328 × 10−154.1170 × 10−05
MEA6.2307 × 10−113.1966 × 10−058.2680 × 10−043.2604 × 10−032.0058 × 10−152.0058 × 10−152.0273 × 10−05
Table 8. A comparative analysis of several algorithms for 250W PEMFC.
Algorithmsζ1ζ2 × 10⁻³ ζ3 × 10⁻⁵ ζ4 × 10−4 λRC × 10−4 βSSE
Proposed DEA−1.10183.42538.4411−1.751510.00001.00000.06150.5062
BBO−1.00003.00007.5811−1.730211.70292.68320.06100.5069
FFA−0.93492.38184.4615−1.750611.40691.00000.06160.5063
DE−1.01293.05537.6413−1.757210.14581.00000.61290.5640
GOA [38]−1.0694 2.60633.6000−1.554324.00001.00000.05590.5940
RSA [38]−1.06942.60633.6000−1.554324.00001.00000.05590.5940
PDO [38]−0.91122.15833.6000−1.554324.00001.00000.05590.5940
Table 9. The absolute errors for the 250 W PEMFC stack, as well as the experimental and simulated stack voltages.
N0 Experimental Data Simulated Data
IexpVexpVmodIAE
10.471721.630021.66100.0310
22.149019.680019.32190.3580
32.830018.780018.86070.0807
43.983017.880018.25510.3751
55.713017.580017.55560.0243
67.075017.120017.09590.0240
78.018016.770016.80460.0346
811.160015.920015.91200.0079
913.730015.220015.19810.0218
1016.560014.400014.33660.0833
1117.560014.020013.98740.0325
1219.030013.520013.39110.1288
1320.340012.820012.70880.1111
1422.010010.860011.27220.4122
1522.96009.05808.916320.1416
Disclaimer/Publisher’s Note: The statements, opinions and data contained in all publications are solely those of the individual author(s) and contributor(s) and not of MDPI and/or the editor(s). MDPI and/or the editor(s) disclaim responsibility for any injury to people or property resulting from any ideas, methods, instructions or products referred to in the content.