Abstract
Moisture significantly affects the mechanical behavior of gas shale and further determines the hydraulic fracturing performance, as it is more attractive. Nevertheless, batch experiments have usually involved variable methodologies regarding the preparation of moisture-contained shale specimens in the sequence (and/or frequency) of drying and soaking treatments. Accordingly, this work investigates how the preparation methodology influences the test results of moisture-contained shale samples. This study compares three commonly used shale sample preparation strategies for acquiring different moisture contents, that is, “dry-wet”, “dry-wet-dry”, and “wet-dry-wet” strategies, followed by a Brazilian splitting test for the mechanical parameters. The results show that under the same saturation conditions, the longer the soaking time during sample preparation, the higher the degradation degree of shale tensile strength. Meanwhile, prolonged soaking can lead to a more discrete distribution of strength values, and the failure mode may deviate from the Brazilian splitting theory model. Under the combined influence of moisture content and soaking time, the tensile strength of shale decreases approximately linearly with increasing saturation, while the degradation degree increases nonlinearly with increasing saturation, and the degradation rate changes from slow to fast. According to the observation of the microstructure of hydrated shale, prolonged soaking can lead to an increase in the expansion of clay minerals in shale by hydration, resulting in looser and more fragmented internal structure, and further degradation in shale strength. In order to weaken the interference of hydration when studying the effect of moisture content on the tensile strength of shale, the soaking time should be minimized as much as possible during the preparation process.
1. Introduction
For a long time, coal has been the mainstay of China’s energy structure. With the increase in energy demand, the government actively promotes the optimization and transformation of the energy structure, which drives the development of unconventional geological energy suppliers, like shale gas, shale oil, and gas hydrate [,,]. At the beginning of the 21st century, the United States completed the shale gas revolution and realized the strategic goal of energy independence, which led the world to thoroughly consider the possibility of shale gas exploitation []. According to the assessment of the U.S. Energy Information Administration (E.I.A.), China has abundant shale gas resources with the technically recoverable amount of shale gas resources as high as 31.57 × 10¹² m3 which ranks first in the world []. Shale gas will become a new field for the development of green energy in China due to its considerable resource potential and cleanliness advantages [].
It is necessary to stimulate the reservoir through hydraulic fracturing technology to increase shale gas production because of the low porosity and permeability of shale, and the tensile strength of shale is also an important parameter in this process [,,,,]. However, substantial dispersions in the moisture content of shale reservoirs are evident across different regions []. Li et al. [] found that the moisture content can affect the tensile strength of shale, and the water will cause strength degradation. Zheng et al. [,] found that shale bedding has a significant impact on the hydraulic fracturing effect when studying the anisotropic characteristics of shale, and provided innovative ideas for solving the instability problem during the fracturing process by combining experimental results with logging data. Teng et al. [] considered the bedding properties of shale when discussing the effect of different water contents on the tensile strength of shale, and found that the damage of water to shale strength is mainly achieved through bedding.
The systematic study of the influence of moisture content on the tensile strength of shale is of great significance for the hydraulic fracturing effect. However, the preparation strategies for water-bearing rocks are diverse, there is no unified standard, and the differences in preparation strategies are mainly reflected in the order and frequency of soaking and drying treatments. Debanjan et al. [] dried shale and sandstone for 24 h, saturated them with distilled water, and tested their degradation at different saturation levels via Brazilian splitting. Debanjan et al. found that shale degraded quickly while sandstone degraded slower until 80% saturation. Babets et al. [] saturated samples first, then dried them, finding that the strength of siltstones and mudstones decreased 1.5–2.5 times in a water-saturated state compared to when air-dried. Hasbollah et al. [] dried and partially soaked shale and sandstone, observing that the tensile strength and anisotropy rose with water content, and more so in shale. Lin et al. [] obtained approximate saturation by estimating shale porosity and pore volume, conducting adsorption tests that showed gas adsorption capacity fell with increasing water saturation. Discrepancies in sample preparation strategies may influence the outcomes of experiments when exploring the influence of moisture content on the mechanical properties of rocks, thereby resulting in insufficient grounds for comparing and correlating different research findings [].
Presently, discussions on the deterioration of shale strength due to moisture content encounter challenges such as varying sampling positions and the absence of standardized sample preparation strategies, and there is a lack of research on the influence of moisture content on the strength of the same rock under different preparation strategies. Furthermore, the disparate laws and extents of shale tensile strength deterioration elucidated by different research outcomes indicate a lack of comparative studies on different sample preparation protocols under identical geological conditions. Therefore, this paper devises three distinct shale sample preparation protocols for Longmaxi shale, conducts Brazilian splitting tests under different saturation conditions, compares the impacts of sample preparation protocols on the dispersion of shale tensile strength under saturated conditions and their failure modes, and analyzes the mechanism of this influence from a microstructural perspective. Finally, the test results of the three sample preparation protocols are scrutinized to offer insights for selecting sample preparation protocols for different moisture contents.
2. Materials and Methods
2.1. Preparation Strategies of Samples with Different Saturation
We designed different sample preparation strategies based on the sequence and frequency of drying/wetting treatments and named them accordingly. The specific strategies are as follows:
For the convenience of comparing the test results of different preparation strategies, saturation is considered a reasonable characterization parameter which is obtained by the weighing method. According to the ISRM recommended method [], the saturation calculation formula is:
where s is the saturation; is the mass of the sample to be tested (g); is the mass of the sample when it is completely dry (g); and is the mass when it is completely saturated (g).
The samples were immersed in water at room temperature until fully saturated (the mass was recorded every two hours, and when the mass remained constant for three consecutive measurements, it was considered saturated, a process that took approximately 24 h). This process was considered a complete “wet treatment”. Since this paper focuses on analyzing the effects of water on sample preparation, a lower temperature was used to dry the samples to avoid thermal damage and changes in pore distribution caused by high temperature in the sample and then affect the mechanical properties and microstructure of rocks [,,,]. The samples were dried at 55 °C until completely dry (the mass remained unchanged for three consecutive measurements after approximately 24 h of drying), considered a complete “dry treatment”.
Based on the sequence and frequency differences between a “dry treatment” and “wet treatment,” three sample preparation strategies were designed. The schematic diagrams of each preparation process are shown in Figure 1.

Figure 1.
Schematic diagram of the three sample preparation strategies.
In the “dry-wet-dry” preparation strategy, the samples were placed in a drying oven at 55 °C for 24 h to achieve complete drying, obtaining the sample mass (). Subsequently, the samples were soaked in water for 24 h to achieve complete saturation, obtaining the sample mass (). Finally, the samples were subjected to further drying at 55 °C until the sample mass approached the theoretical mass corresponding to target saturations of 0%, 20%, 40%, 60%, 80%, and 100% (according to Equation (1)).
In the “wet-dry-wet” preparation strategy, the samples were soaked in water for 24 h to achieve complete saturation, obtaining the sample mass (). Then, the samples were placed in a drying oven at 55 °C for 24 h to achieve complete drying, obtaining the sample mass (). Finally, the samples were subjected to further soaking until the sample mass approached the theoretical mass corresponding to target saturations of 100%, 80%, 60%, 40%, 20%, and 0% (according to Equation (1)).
In the “dry-wet” preparation strategy, the samples were placed in a drying oven at 55 °C for 24 h to achieve complete drying, obtaining the sample mass (). Then, the samples were soaked in water for 2.5 h, 6 h, 12 h, and 24 h to obtain samples with target saturations of 0%, 40%, 60%, 80%, and 100%, and the soaking time corresponding to the saturation is obtained by referring to the pre-immersion test. Due to the inability to ensure each sample reach complete saturation under this strategy, it is not possible to accurately obtain the corresponding mass of the sample when reaching the target saturation through calculation like the previous two strategies. Therefore, only an approximate saturation can be obtained by controlling the soaking time.
The number of prepared samples and completed loading tests is summarized in Table 1. The samples fail before loading during the soaking time because of the hydration cracks, which cause a decrease in the availability of test results for some sample groups.

Table 1.
Summary of number of prepared samples.
2.2. Test Methods
The sample material was collected from the Longmaxi Formation shale outcrop in Lu Jiao Town, Pengshui Miao, and Tujia Autonomous County, Chongqing City. The main minerals are quartz, sodium feldspar, and muscovite, with relative contents of 46%, 31%, and 23%, respectively []. The shale collected is gray-black, with distinct bedding structures that are easily discernible.
Irregular body outcrops were cut into rectangular prisms with bedding, and rock cores with a diameter of 50 mm were drilled using a dry drilling strategy. The rock cores were then cut into circular disc samples with dimensions of Φ50 mm × H25 mm, and their surfaces were polished. The parallelism of the upper and lower surfaces of the disc samples was controlled within 0.5 mm, and the surface roughness was controlled within 0.1 mm.
The processed samples were treated with different sample preparation strategies to obtain different levels of saturation. Brazilian splitting tests were conducted on samples with different saturations using a rock mechanic testing machine (maximum load 10 kN, measuring accuracy 1 N). The test design included two loading modes: parallel bedding and perpendicular bedding. The loading process used axial displacement as the control index and loaded the sample at a stable rate of 0.05 mm/min until failure. The preparation and loading of the sample are shown in Figure 2.

Figure 2.
Sample processing, preparation, and loading.
The formula for calculating the tensile strength of samples using the Brazilian splitting test is as follows []:
where is the tensile strength of the sample (MPa); is the load when the sample is destroyed (N); is the diameter of the sample (mm); and is the thickness of the sample (mm).
3. Results
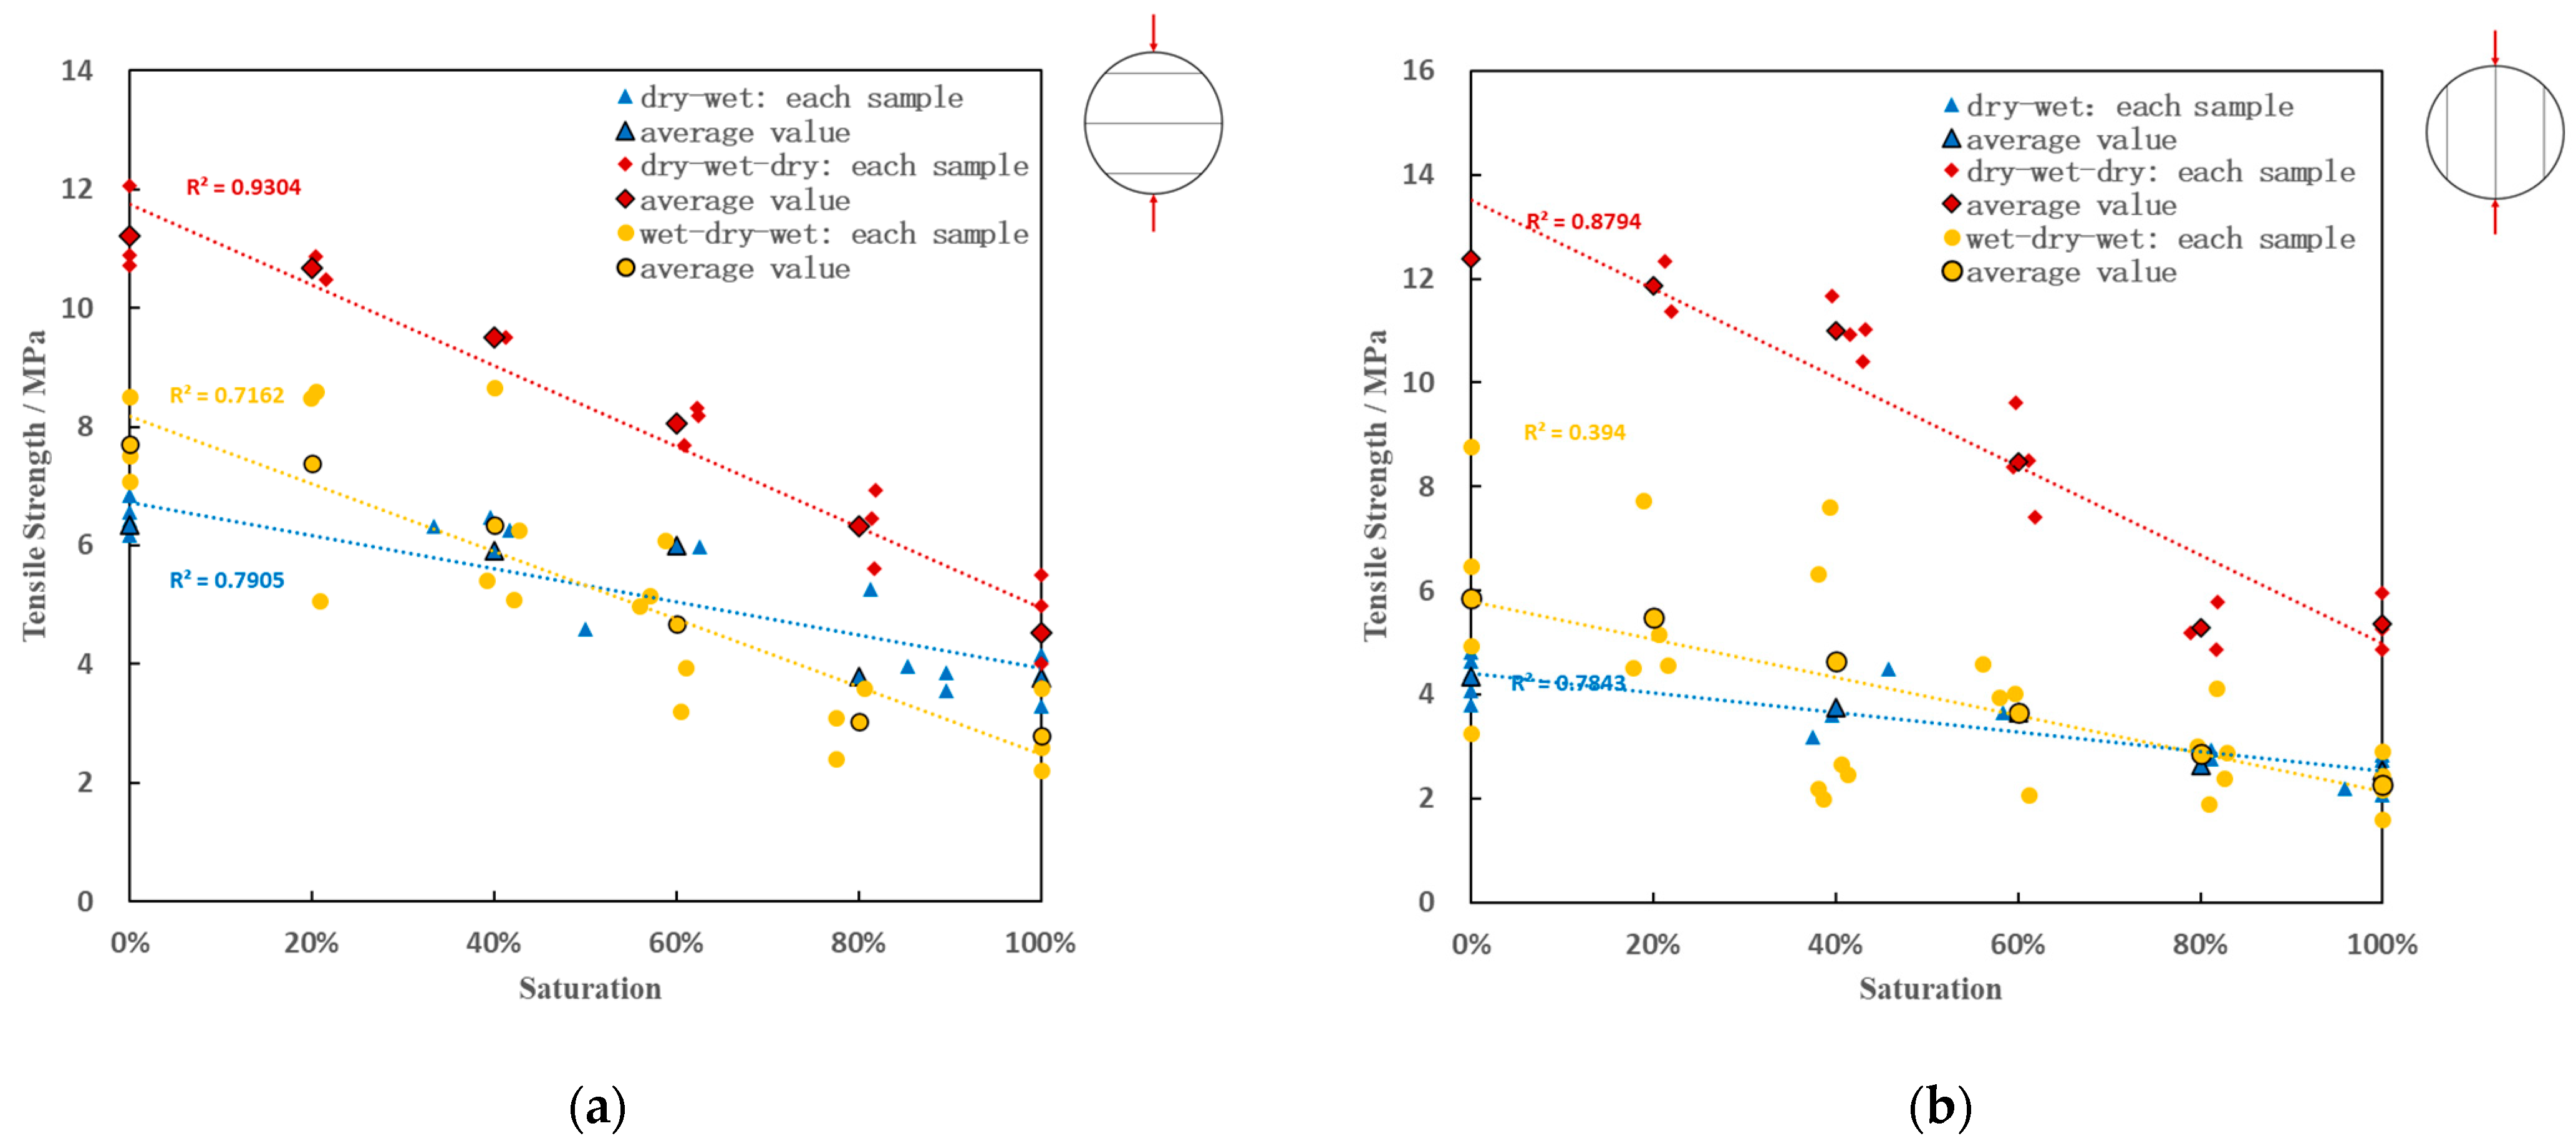
3.1. Relationship between Shale Tensile Strength and Saturation
The tensile strength–saturation curves of the samples prepared using three different strategies under parallel and perpendicular bedding loading modes are shown in Figure 3.

Figure 3.
Tensile strength–saturation: (a) perpendicular bedding loading; (b) parallel bedding loading.
From Figure 3, it can be observed that the tensile strength of shale decreases significantly with increasing saturation, showing an approximate linear change trend, which is independent of the selection of sample preparation strategies and loading directions. In the “dry-wet” preparation group, the tensile strength of shale is 3.81–6.84 MPa in the completely dry state and 2.06–4.16 MPa in the completely saturated state, with strength differences of 2.72 MPa and 1.81 MPa under perpendicular and parallel bedding loading, respectively. In the “dry-wet-dry” preparation group, the tensile strength of shale is 10.71–12.40 MPa in the completely dry state and 3.61–5.95 MPa in the completely saturated state, with strength differences of 6.69 MPa and 7.04 MPa under perpendicular and parallel bedding loading, respectively. In the “wet-dry-wet” preparation group, the tensile strength of shale is 3.26–8.52 MPa in the completely dry state and 1.60–3.60 MPa in the completely saturated state, with strength differences of 4.90 MPa and 3.58 MPa under perpendicular and parallel bedding loading, respectively.
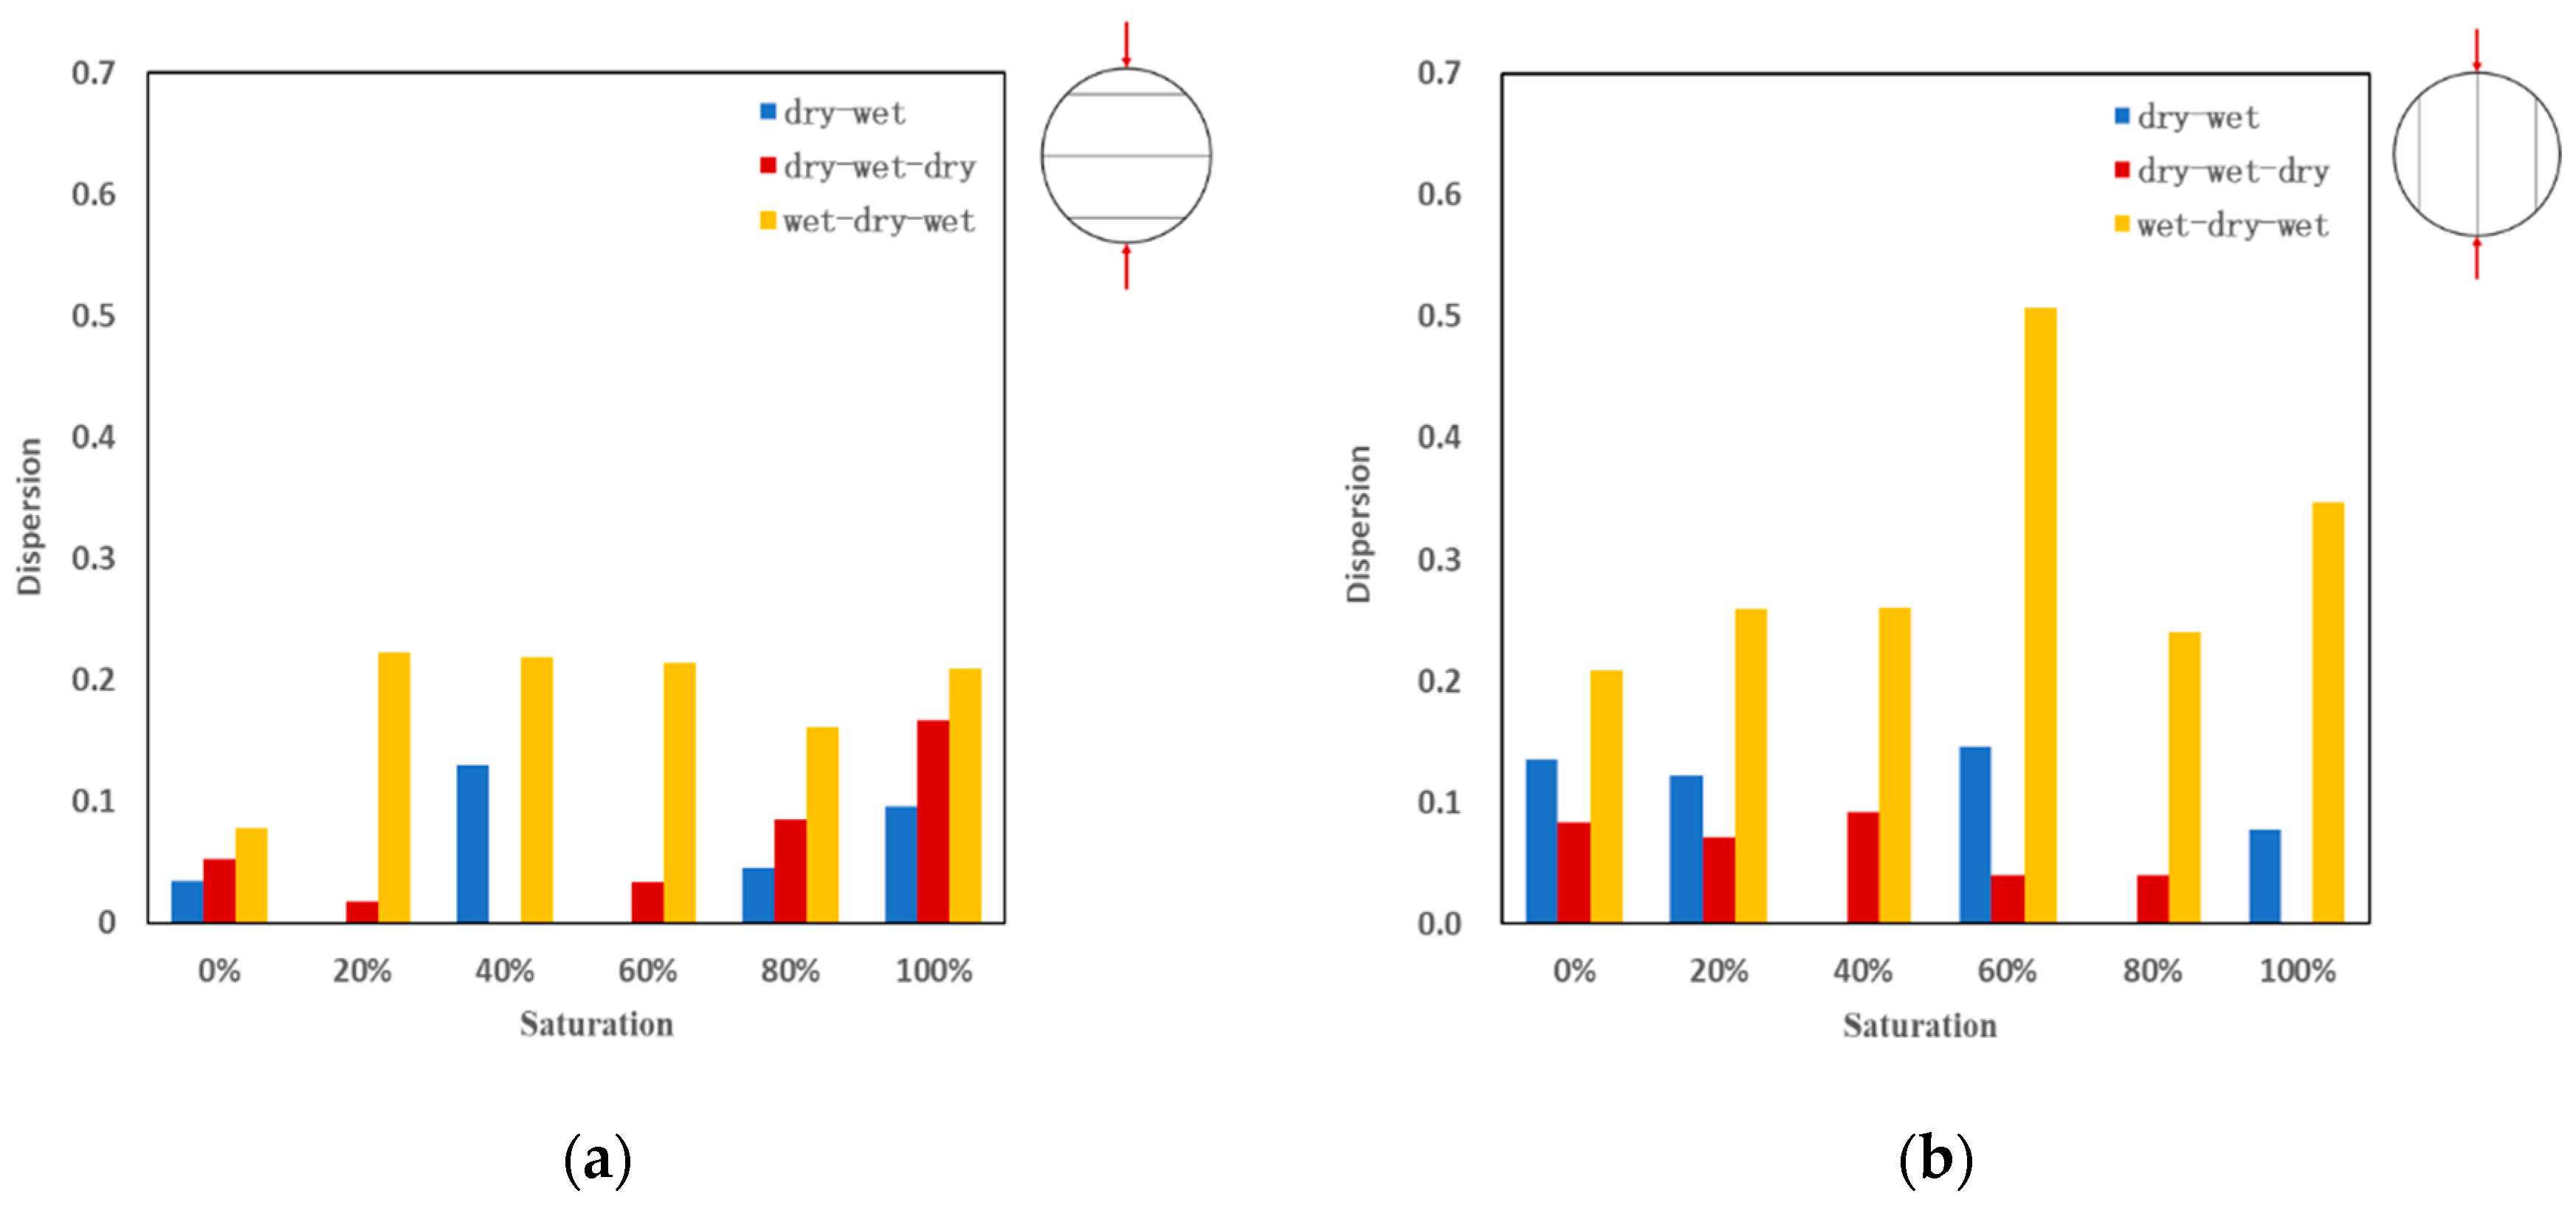
3.2. Tensile Strength Dispersion
To analyze the influence of different sample preparation strategies on the tensile strength dispersion of saturated shale, the formula of the coefficient of dispersion is as follows []:
where is the coefficient of dispersion; is the standard deviation of shale tensile strength (MPa); and is the average value of shale tensile strength (MPa).
The tensile strength dispersion of shale samples under different saturation for three sample preparation strategies is shown in Figure 4. The coefficient of dispersion of shale tensile strength in the “dry-wet” preparation group ranges from 0 to 0.1460, in the “dry-wet-dry” preparation group it ranges from 0 to 0.1668, and in the “wet-dry-wet” preparation group it ranges from 0.0784 to 0.5068, with most values exceeding 0.2. When the coefficient of dispersion is 0, the number of samples is 1.0 and is not discussed. Under the same saturation conditions, the coefficient of dispersion of tensile strength is relatively small for the “dry-wet” preparation group and “dry-wet-dry” preparation group, while it is consistently higher for the “wet-dry-wet” preparation group, indicating that the differences in sample preparation strategies affect the tensile strength dispersion of saturated shale.

Figure 4.
Dispersion–saturation: (a) perpendicular bedding loading; (b) parallel bedding loading.
3.3. Relationship between Tensile Strength Degradation and Saturation
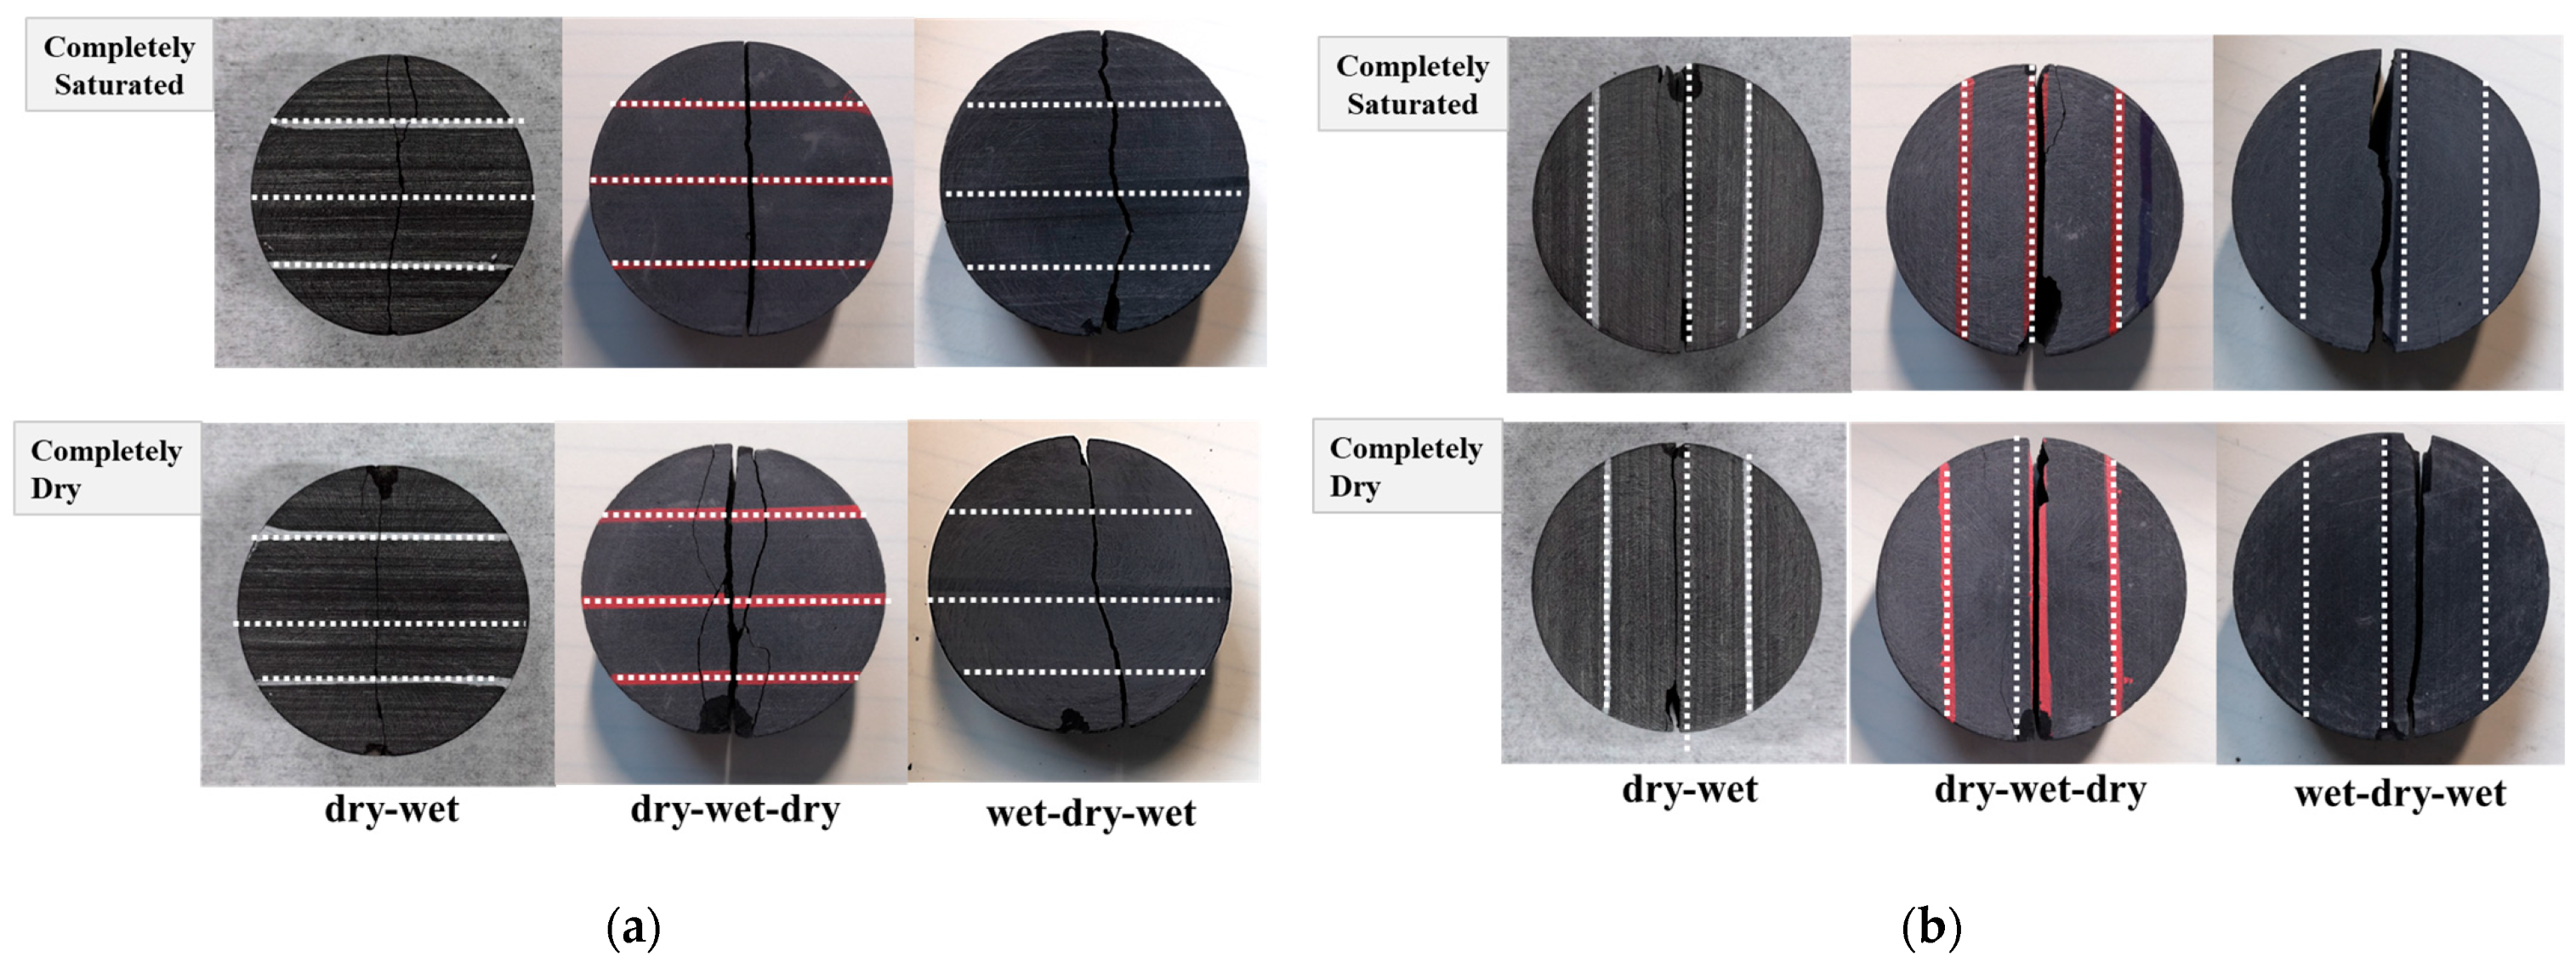
In the process of studying the impact of fluids on rock strength, it is found that various types of rocks exhibit a law of strength degradation due to their moisture content, and the degree of degradation is quantified using the degradation degree, and the formula is the following []:
where is the degree of Brazilian tensile strength degradation; is the tensile strength of the sample at any saturation (MPa); and is the tensile strength of the sample when completely dry (MPa).
The relationship between the degree of degradation and the saturation of shale samples prepared using three sample preparation strategies is shown in Figure 5. With increasing saturation, the degree of degradation of the sample also increases, and the degree of the degradation–saturation curve exhibits an upward concave shape, indicating that the strength degradation of samples becomes more severe with increasing saturation, particularly at high saturation. Although changes in sample preparation strategies and loading directions do not affect the law of degradation degree dispersion with saturation, the choice of sample preparation strategies leads to differences in the degree of degradation of samples under different moisture contents.

Figure 5.
Degradation degree–saturation: (a) perpendicular bedding loading; (b) parallel bedding loading.
When the sample saturation is low, the degradation degrees of the samples under the “dry-wet-dry” and “wet-dry-wet” strategies are similar, while the degradation degree of the sample under the “dry-wet” strategy is significantly smaller, and the difference between the strategies is more obvious with the gradual increase in saturation. During the test, when the saturation was 0%, the “dry-wet-dry” and “wet-dry-wet” samples had undergone 24 h wet treatment, so the degradation degree was similar, while the “dry-wet” samples had not been wet treated, but the degradation degree was lower than the other two. With the increase in saturation, the contact time of samples with different strategies with water increases.
Comparing the degradation degree of shale samples prepared using three sample preparation strategies at different saturations, the results are shown in Table 2. With increasing saturation, the degradation degree of shale samples prepared using the “dry-wet” preparation strategy ultimately increases to about 40%, while those prepared using the “wet-dry-wet” and “dry-wet-dry” preparation strategies increase to about 60%. It is worth noting that in the “wet-dry-wet” preparation process, the sample fails before loading when fully saturated, indicating that the strength of the sample is still deteriorating, and the actual degradation may be higher than the test results. Overall, the deteriorative degree of samples prepared using the “wet-dry-wet” strategy is relatively higher among the three. In contrast, the deteriorative degree of samples prepared using the “dry-wet” strategy is relatively lower, and the deteriorative degree of samples prepared using the “dry-wet-dry” strategy is between the two.

Table 2.
Results of degradation degree.
3.4. Failure Mode
Yang et al. [] categorized the Brazilian splitting failure modes of shale into crescent, arc, and straight-line types based on the angle between the bedding and loading direction. The shale samples exhibit a straight-line failure mode when the loading direction is perpendicular or parallel to the bedding.
The failure modes of samples prepared using the three different sample preparation strategies in completely dry and completely saturated states are shown in Figure 6. The results indicate that the choice of sample preparation strategy affects the Brazilian splitting failure mode of water-bearing shale.

Figure 6.
Destruction mode: (a) perpendicular bedding loading; (b) parallel bedding loading.
The bedding structure of shale is symmetric about the loading direction in both parallel and perpendicular bedding loading modes, resulting in a symmetrical stress field about the loading surface, leading to straight-line cracks through the center of the sample during shale failure. When the “dry-wet” and “dry-wet-dry” preparation strategies are chosen, the main crack in the shale splits along the sample’s central axis under completely dry and completely saturated conditions, forming relatively smooth straight lines. When the “wet-dry-wet” preparation strategy is chosen, the shale sample still exhibits a straight-line failure mode when completely dry. However, under completely saturated conditions, the crack path of the sample deviates from the center position, and the crack morphology is no longer smooth but shows multiple inflection points, presenting a non-linear failure pattern. These results indicate that the internal structure of shale changes significantly under this preparation condition, affecting the symmetry of the stress field distribution, and the complex stress distribution leads to the manifestation of shear failure characteristics in shale. The requirement for a more extended sample soaking time in the “wet-dry-wet” preparation process to achieve complete saturation and mechanical testing is a significant reason for the non-linear failure mode of the sample. The characteristics of the two types of failure modes are shown in Figure 7.

Figure 7.
Two characteristic failure modes.
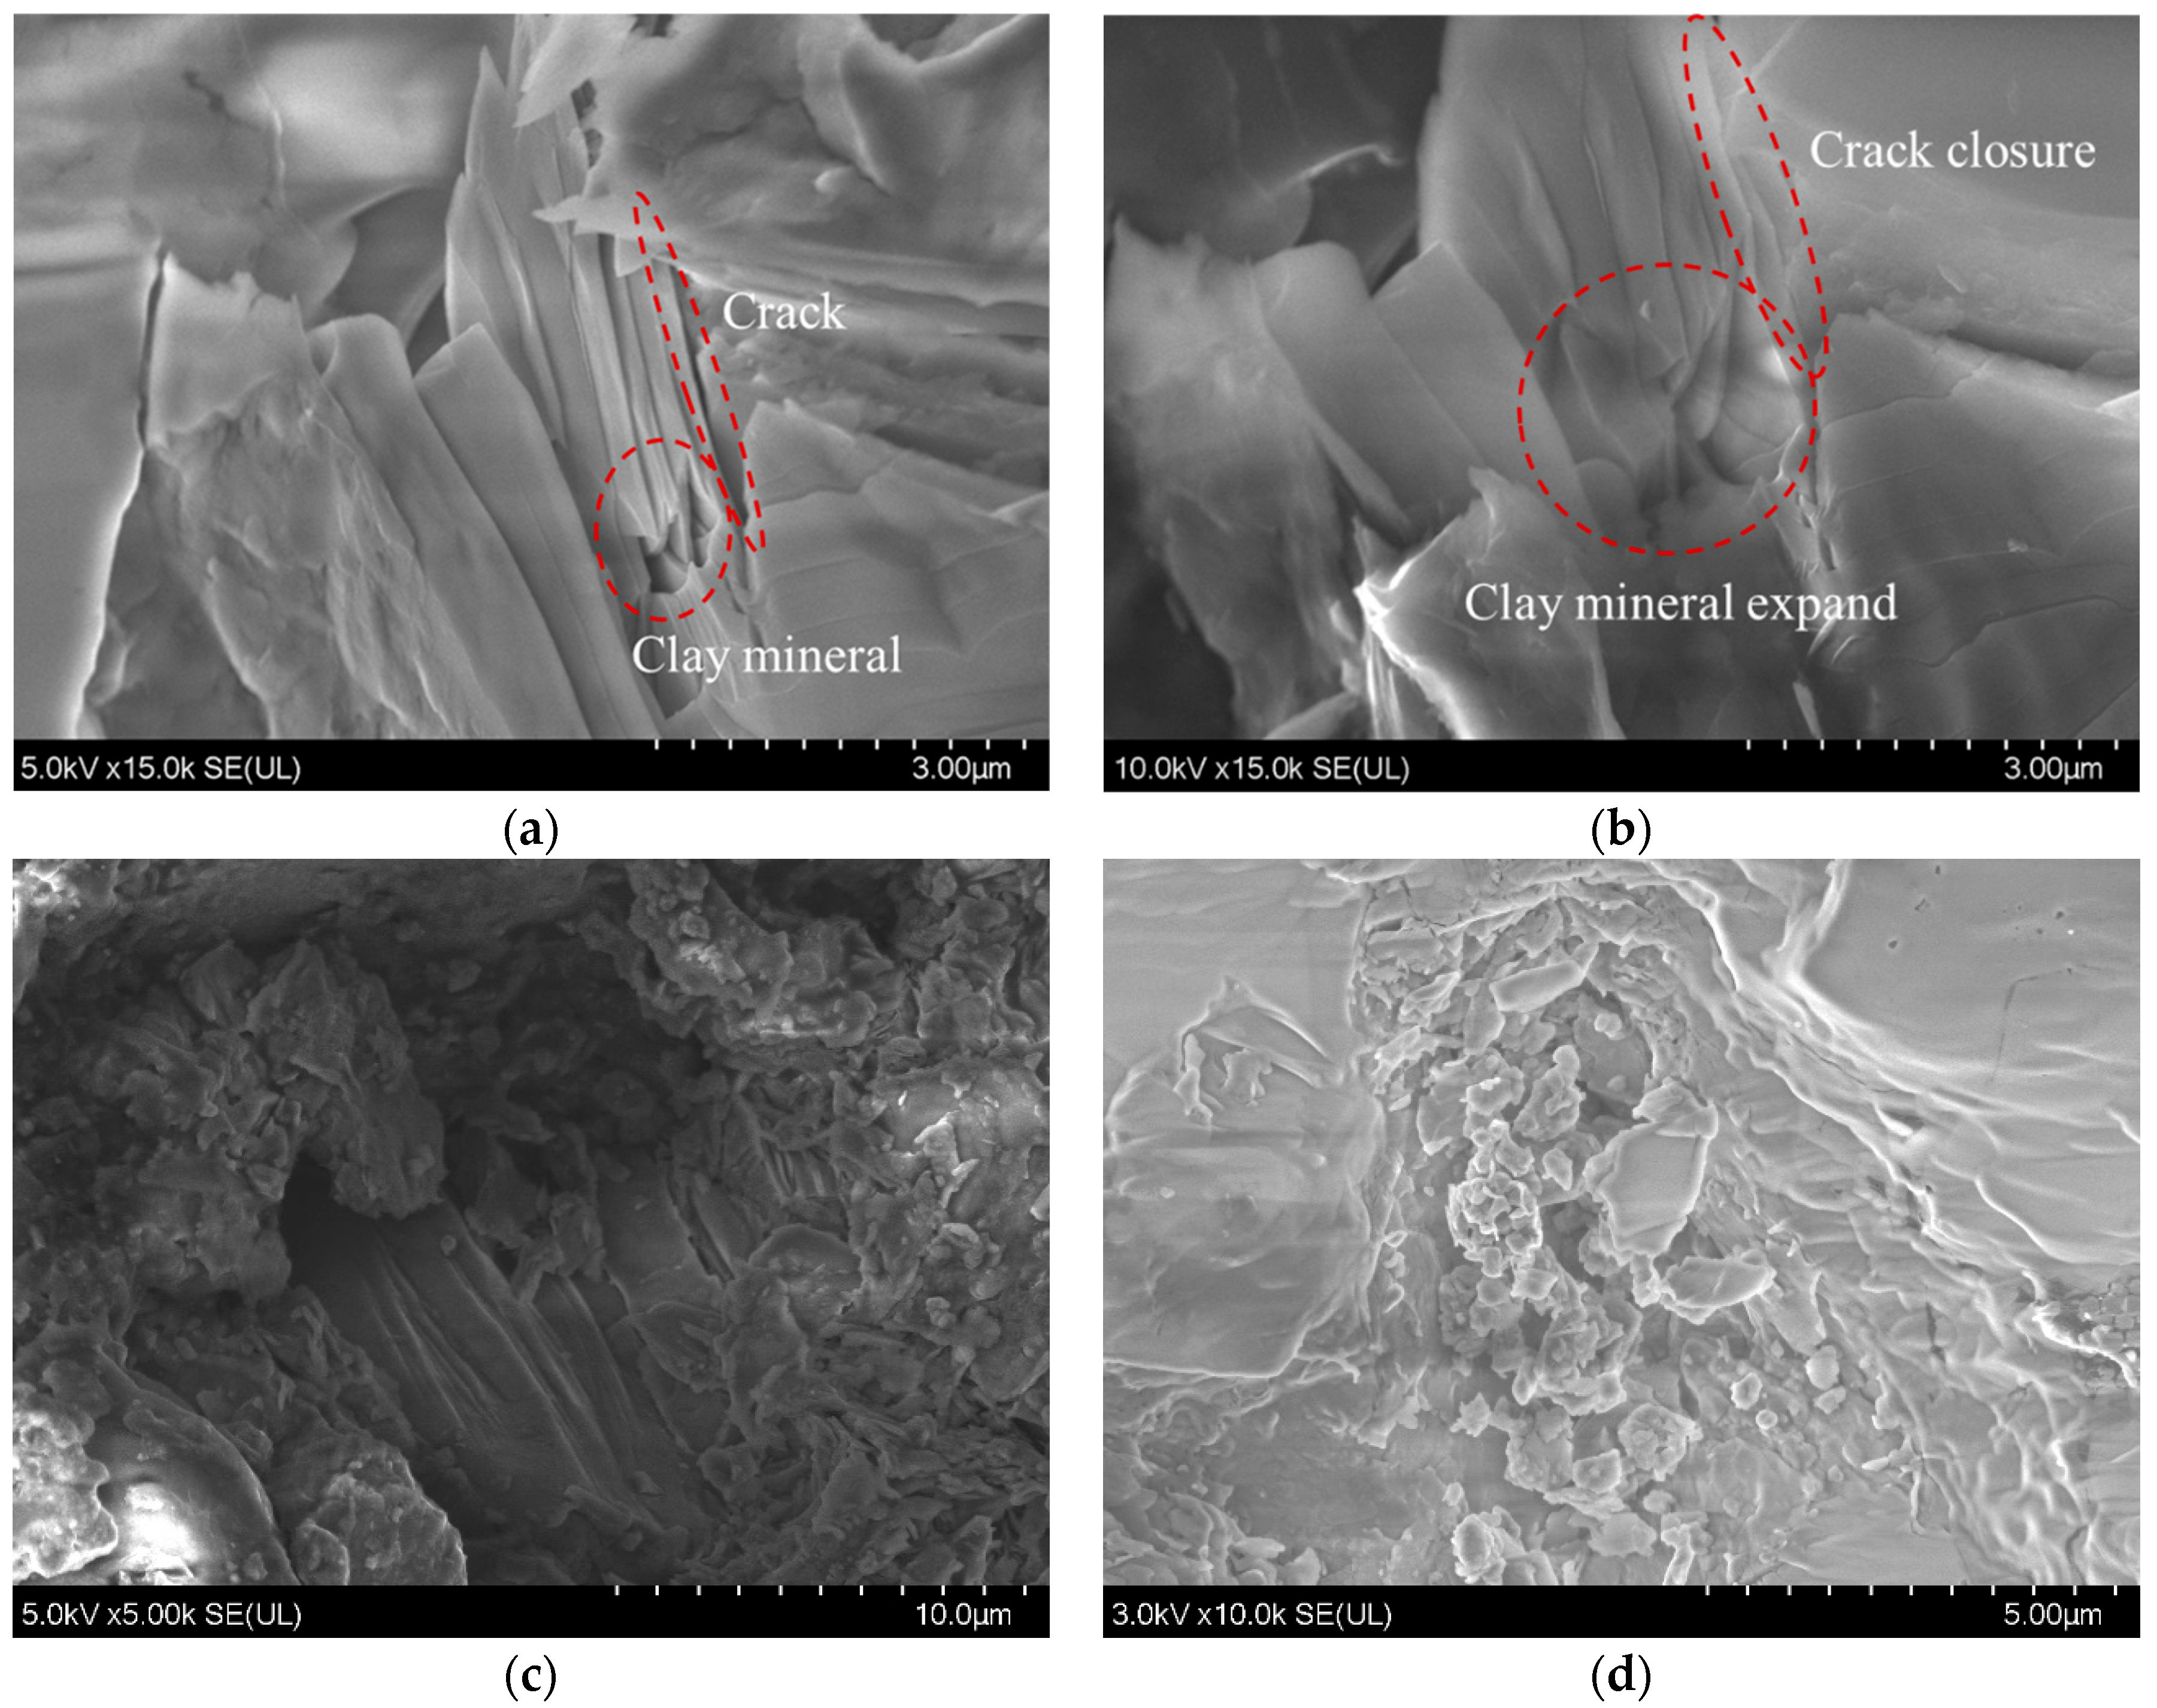
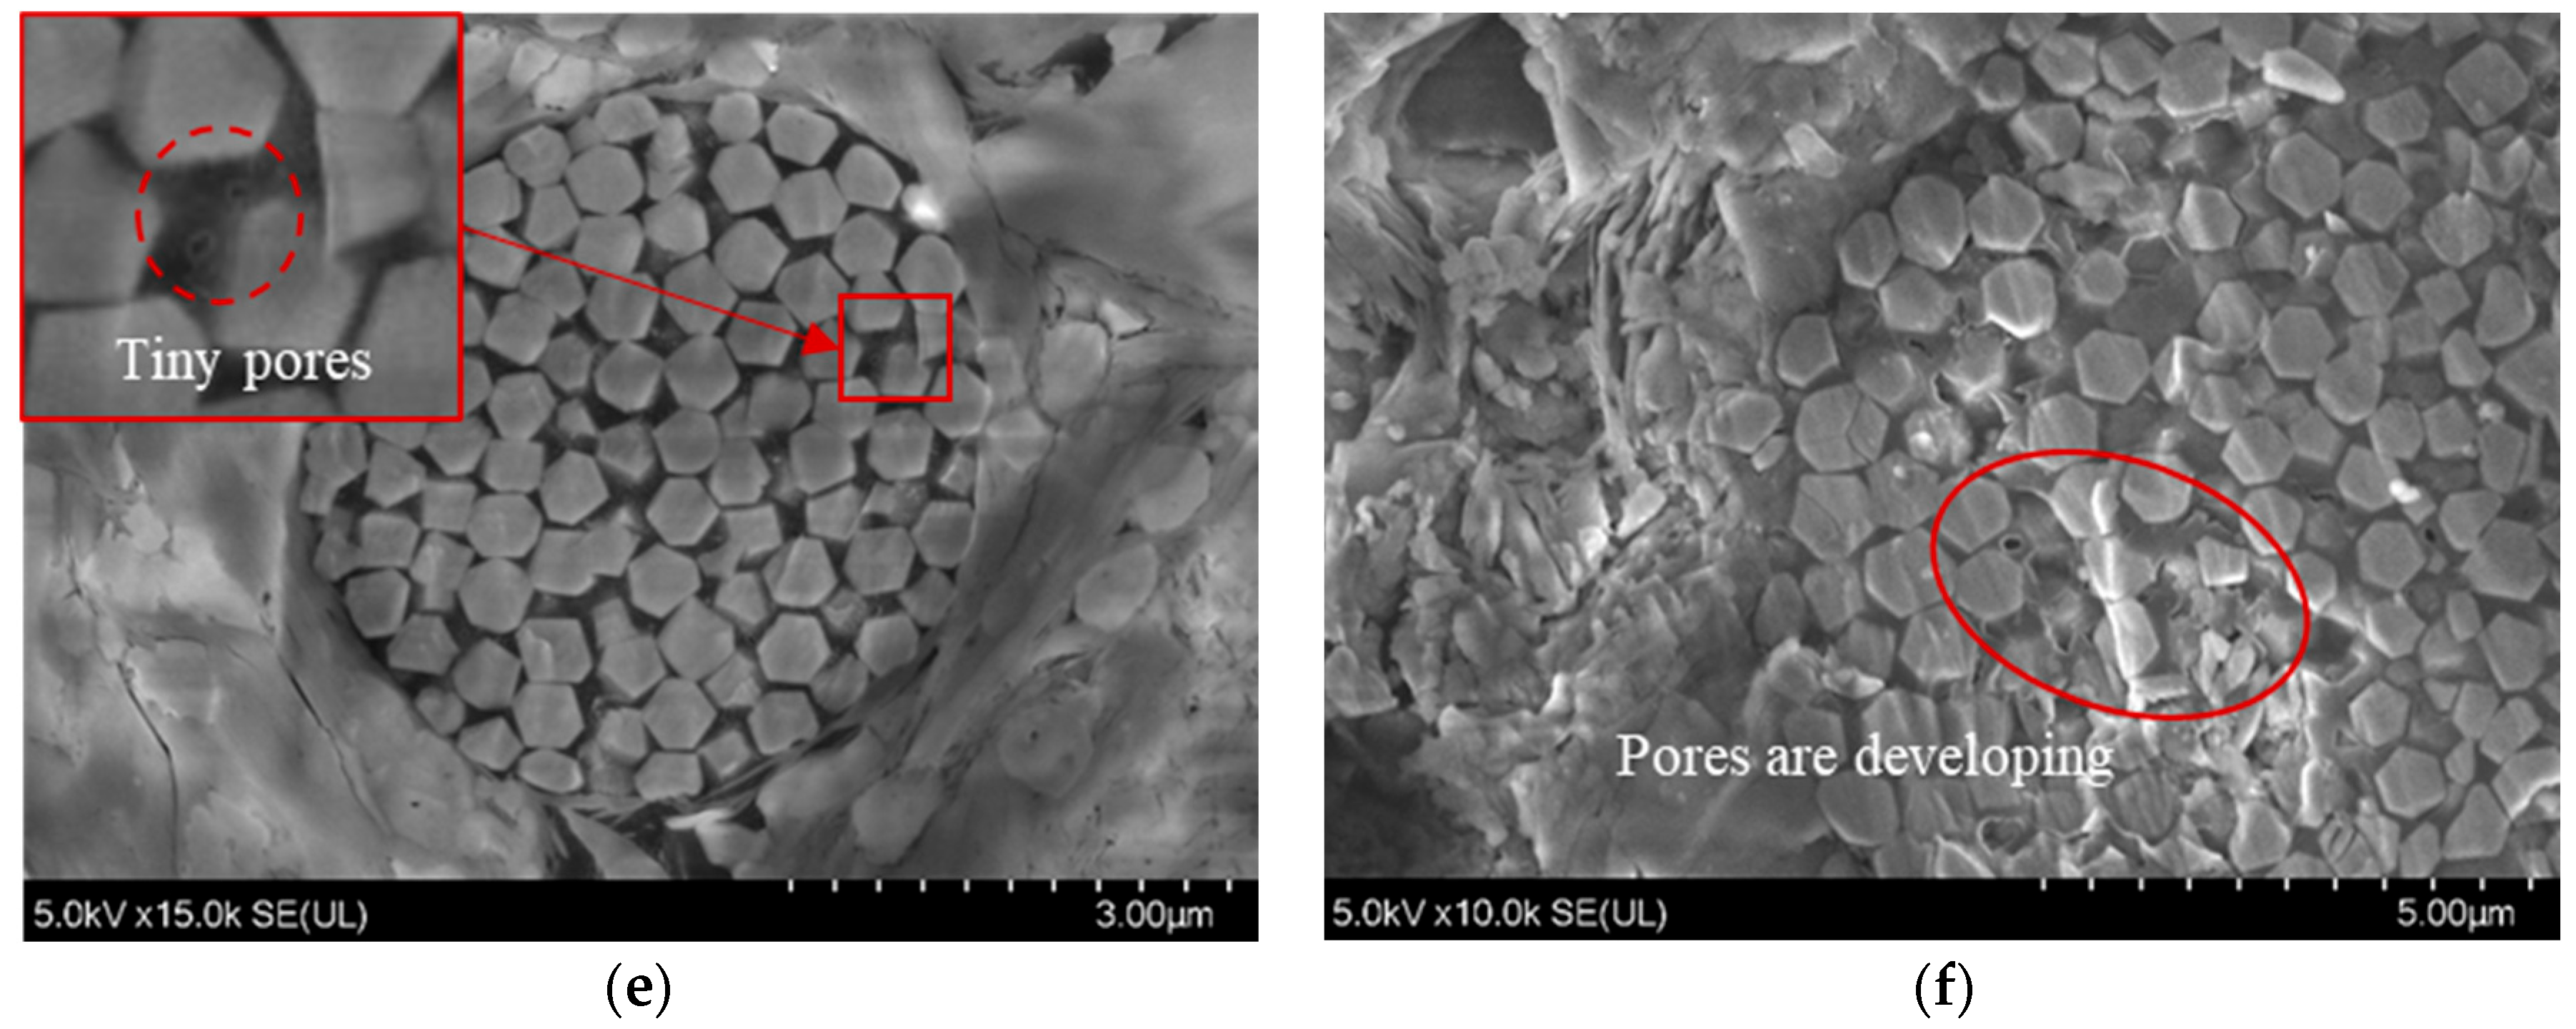
3.5. Mechanism Analysis
Shale is primarily composed of clay minerals such as illite, montmorillonite, kaolinite, and chlorite, as well as quartz, muscovite, pyrite, and other minerals. The hydration expansion characteristics of clay minerals significantly impact the mechanical properties of shale when exposed to water []. The capillary effect, as a crucial prerequisite for shale hydration, promotes water penetration into the rock’s interior and contact with clay minerals, initiating hydration reactions during the sample soaking process []. Clay mineral hydration reactions mainly involve two stages: surface hydration and osmotic hydration. Surface hydration occurs as water molecules form several molecular layers on the clay mineral surface through adsorption, causing mineral lattice expansion. Osmotic hydration manifests as a concentration gradient between the high-charge cations of small radius in the interlayer of mineral layers and the cations in the soaking water, leading to water penetration between the layers and increasing the interlayer spacing. The changes in lattice structure and interlayer spacing expansion result in the volumetric expansion of clay mineral particles. Observations of hydrated shale microstructures using techniques such as CT imaging and electron microscopy reveal that clay mineral expansion leads to loosening of the internal structure, fragmentation, and an increase in micropores and microcracks [,,]. These changes deepen the influence of capillary forces on the internal shale cracks and, combined with the hydration stress generated by clay mineral expansion, contribute to crack propagation []. The structural changes in shale induced by capillary forces and clay mineral hydration are irreversible and tend to become looser and more fragmented over time due to hydration effects, ultimately leading to a further reduction in shale strength. Hydration in shale begins during water absorption, with noticeable hydration cracks observed within 24 h of immersion [,].
Moreover, the expansion degree of clay mineral hydration increases with soaking time, indicating a significant temporal dependency in the deterioration in hydrated shale strength []. However, the low-temperature drying of shale at 55 °C does not have a significant impact, and it is also insufficient to completely remove the adsorbed water and interlayer water on clay mineral particle surfaces (the temperature needs to reach 110 °C) []. Therefore, dry treatment does not affect the interaction between clay particles and water in shale but only influences the presence of free water in shale. During the preparation of hydrated shale specimens, capillary effects and clay mineral hydration expansion cause internal structure loosening, fracturing, crack development, and consequently, a decrease in shale strength, with the degree of influence depending on the soaking time in different preparation strategies.
In the “wet-dry-wet” sample preparation strategy, SEM scanning was performed when the specimens reached complete saturation after the first and second wet treatments, producing images as shown in Figure 8. Figure 8a shows that even when the specimen reaches complete saturation after the first wet treatment, tiny gaps still exist between the minerals inside the shale, and the mineral surfaces exhibit granular materials. Figure 8b reveals that after complete drying and subsequent re-saturation during the second wet treatment, clay minerals exhibit significant expansion. It can be seen from Figure 8c that the minerals are exfoliated after the shale is soaked in water, and the small broken particles are distributed on the surface of the sample. After the second wet treatment, the number of these broken particles increases, as shown in Figure 8d. However, it can be seen in Figure 8e that after the first wet treatment, there are a small number of tiny pores between minerals (pyrite in the figure). After secondary immersion, these micropores tend to increase, as shown in Figure 8f. This indicates that with increased wet treatment time, the internal structure of shale, even under complete saturation, becomes looser and more fragmented. Furthermore, shale hydration exhibits time-dependent characteristics, and prolonged immersion can deepen hydration, leading to further deterioration in shale tensile strength.


Figure 8.
SEM. images of shale during the “wet-dry-wet” sample preparation process: (a,c,e) the first wet treatment reaches saturation; (b,d,f) the second wet treatment reaches saturation.
The differences in the three sample preparation strategies mainly stem from the number of wet treatment times and their durations. The wet treatment time required to achieve complete saturation of the sample is approximately 24 h, while the wet treatment time for preparing samples with different saturation ranges from 0 to 24 h. Thus, both the “dry-wet” and “dry-wet-dry” sample preparation strategies involve one wet treatment, with wet treatment times of 0–24 h and 24 h, respectively, while the “wet-dry-wet” strategy involves two wet treatments with wet treatment times of 24–48 h. During sample preparation, the wet treatment processes lead to shale hydration, and longer wet treatment times result in increased shale hydration, leading to further deterioration in shale strength, increased dispersion in test results, and deviation from theoretical models in sample failure modes. In summary, the increase in wet treatment time and frequency during sample preparation strengthens the changes in shale internal structure induced by capillary forces and clay mineral hydration expansion, resulting in increased degradation and dispersion in shale tensile strength, and influencing the failure mode of the shale specimens.
4. Discussion
Since shale water absorption saturation and hydration reactions occur simultaneously during sample preparation [], under this experimental condition, the deterioration in shale strength represents the combined result of wet treatment time and moisture content, making it difficult to isolate the individual effects of saturation or moisture content on shale tensile strength using conventional sample preparation strategies. Moreover, moisture content alone cannot reflect the degree of hydration, and explaining the mechanism of shale strength degradation caused by moisture content from a hydration perspective lacks sufficient evidence. Therefore, only approximate conclusions can be drawn regarding the effects of wet treatment time on shale strength deterioration.
Wet treatment time is a crucial factor affecting the shale hydration reaction, and during the preparation of samples with different moisture contents, the wet treatment time is influenced by the selection of sample preparation strategies. Even when samples with the same saturation or moisture content are prepared using different methods, the degree of degradation in shale strength varies. Strategies with longer wet treatment times intensify shale hydration, which causes further deterioration in shale strength, dispersion in the test results, and deviation from theoretical models in sample failure modes. The problem of increased tensile strength dispersion caused by shale hydration also hampers the determination of the relationship between tensile strength and saturation. When the sample exhibits a non-linear failure pattern, the stress characteristics deviate from the theoretical model of the Brazilian splitting test, making it more challenging to characterize the actual strength of the sample using the theoretical model.
From the perspective of tensile strength dispersion, both the “dry-wet” and “dry-wet-dry” sample preparation strategies yield results below 0.17, while the “wet-dry-wet” strategy yields results mostly exceeding 0.2, indicating significantly greater dispersion. Analyzing the degree of tensile strength degradation, the maximum degradation in the “dry-wet” strategy reaches 40%. In contrast, in the “dry-wet-dry” and “wet-dry-wet” strategies, the maximum degradation can be 60%, with the “wet-dry-wet” shale exhibiting immediate degradation before loading, suggesting potentially more significant degradation. Thus, the “dry-wet” sample preparation strategy effectively reduces the degradation in sample tensile strength. Regarding failure modes, both the “dry-wet” and “dry-wet-dry” strategies exhibit linear failure patterns during the transition from complete drying to complete saturation, consistent with the theoretical model of Brazilian splitting. However, after “wet-dry-wet” sample preparation, samples under complete saturation exhibit a non-linear failure pattern, indicative of shear failure characteristics, deviating from the theoretical model.
To better discuss the influence of moisture content on shale tensile strength and minimize unfavorable factors in the test results’ analysis, efforts should be made to mitigate the degradation in shale strength caused by clay mineral hydration. In selecting sample preparation strategies, this goal can be achieved by reducing the wet treatment time as much as possible. The “dry-wet” sample preparation strategy effectively shortens the wet treatment time, allowing test results to reflect the impact of moisture content on shale tensile strength with increased accuracy and facilitating a systematic summary of the results.
Additionally, other strategies can be employed to mitigate the influence of shale hydration reactions on research results. For instance, solutions that inhibit shale hydration can be used as soaking liquids []. Furthermore, wet treatment strategies and equipment improvements can further shorten the wet treatment times []. However, these strategies only reduce the impact of shale hydration and cannot eliminate it. Therefore, when studying the effects of different moisture contents on shale tensile strength deterioration, the influence of shale hydration will always be present, and test results can only approximate the relationship between moisture content and shale tensile strength.
5. Conclusions
This study investigated the influence of sample preparation strategies on the variation in shale tensile strength with moisture content, employing three different saturation sample preparation strategies in Brazilian splitting tests. The following conclusions were drawn:
- (1)
- The soaking time when preparing the sample will affect the degradation effect of shale strength, that is, the longer the soaking time is, the higher is the strength degradation degree of the sample with the same moisture content. Therefore, in the process of studying the effect of different moisture contents on the tensile strength of shale, the effect of soaking time cannot be ignored.
- (2)
- Under the joint influence of moisture content and soaking time, the tensile strength of shale decreases approximately linearly with the increase in saturation. The degree of deterioration increases nonlinearly with the increase in saturation, and the growth rate increases from slow to fast.
- (3)
- In the process of sample preparation, the increase in soaking time will lead to the increase in dispersion of shale tensile strength, and may lead to the failure mode of the sample deviating from the Brazilian splitting theory model.
- (4)
- In order to reduce the strength deterioration caused by hydration when studying the effect of moisture content on shale strength, the soaking time should be reduced as much as possible when preparing the samples.
Author Contributions
Conceptualization, L.X.; formal analysis, L.S.; funding acquisition, L.X.; investigation, L.X., B.H., Y.Z. and L.S.; methodology, L.X., B.H., Y.Z. and L.S.; project administration, L.X.; resources, L.X., B.H. and Y.Z.; supervision, L.X.; writing—original draft preparation, L.S.; writing—review and editing, L.X., B.H., Y.Z. and L.S.; data curation, B.H. and L.S.; validation, L.S.; visualization, L.S. All authors have read and agreed to the published version of the manuscript.
Funding
This research was funded by the “National Natural Science Foundation (No. U23B6004)” and the “Creative Project of Engineering Research Center of Alternative Energy Materials & Devices, Ministry of Education, Sichuan University (No. AEMD 202206)”.
Data Availability Statement
The data that support the findings of this study are available from the corresponding author.
Conflicts of Interest
The authors declare no conflicts of interest.
References
- Shen, D. China’s Energy Problem and Alternative Solutions. J. Contemp. China 2001, 10, 717–722. [Google Scholar] [CrossRef]
- Zou, C.; Pan, S.; Hao, Q. On the connotation, challenge and significance of China’s “energy independence” strategy. Pet. Explor. Dev. 2020, 47, 449–462. [Google Scholar] [CrossRef]
- Li, Y.; Zhou, D.H.; Wang, W.H.; Jiang, T.X.; Xue, Z.J. Development of unconventional gas and technologies adopted in China. Energy Geosci. 2020, 1, 55–68. [Google Scholar] [CrossRef]
- Geologists, P.O.A.A.; Division, M.E. Unconventional Energy Resources: 2015 Review. Nat. Resour. Res. 2015, 24, 443–508. [Google Scholar]
- Sieminski, A.; EIA Administrator. International Energy Outlook; U.S. Energy Information Administration: Washington, DC, USA, 2016.
- Wang, J.S.; Ryan, D.; Anthony, E.J. Reducing the greenhouse gas footprint of shale gas. Energy Policy 2011, 39, 8196–8199. [Google Scholar] [CrossRef]
- Mayerhofer, M.J.; Lolon, E.P.; Warpinski, N.R.; Cipolla, C.L.; Walser, D.; Rightmire, C.M. What Is Stimulated Reservoir Volume? SPE Prod. Oper. 2010, 25, 89–98. [Google Scholar] [CrossRef]
- Wang, D.B.; Taleghani, A.D.; Yu, B. Height Effect on Interactions between the Hydraulic Fracture and Natural Fractures. Geofluids 2022, 2022, 4642326. [Google Scholar] [CrossRef]
- Hubbert, M.K.; Willis, D.G. Mechanics of Hydraulic Fracturing. Trans. Am. Inst. Min. Metall. Eng. 1957, 210, 153–168. [Google Scholar] [CrossRef]
- Haimson, B.; Fairhurst, C. Initiation and Extension of Hydraulic Fractures in Rocks. Soc. Pet. Eng. J. 1967, 7, 310–318. [Google Scholar] [CrossRef]
- Ito, T.; Hayashi, K. Physical background to the breakdown pressure in hydraulic fracturing tectonic stress measurements. Int. J. Rock Mech. Min. Sci. Geomech. Abstr. 1991, 28, 285–293. [Google Scholar] [CrossRef]
- Zhao, W.Z.; Hu, S.Y.; Hou, L.H. Connotation and strategic role of in-situ conversion processing of shale oil underground in the onshore China. Pet. Explor. Dev. 2018, 45, 563–572. [Google Scholar] [CrossRef]
- Li, H.; Lai, B.; Liu, H.H.; Zhang, J.L.; Georgi, D. Experimental Investigation on Brazilian Tensile Strength of Organic-Rich Gas Shale. SPE J. 2016, 22, 148–161. [Google Scholar] [CrossRef]
- Zheng, D.; Miska, S.; Ziaja, M.; Zhang, J. Study of anisotropic strength properties of shale. AGH Drill. Oil Gas 2019, 36, 93–112. [Google Scholar] [CrossRef]
- Zheng, D.; Ozbayoglu, E.; Miska, S.; Zhang, J. Experimental Study of Anisotropic Strength Properties of Shale. In Proceedings of the 57th US Rock Mechanics/Geomechanics Symposium, Atlanta, GA, USA, 25–28 June 2023. [Google Scholar]
- Teng, J.Y.; Tang, J.X.; Zhang, C. Experimental study on tensile strength of layered water-bearing shale. Rock Soil Mech. 2018, 39, 1317–1326. [Google Scholar]
- Roy, D.G.; Singh, T.N.; Kodikara, J.; Ratan, D. Effect of Water Saturation on the Fracture and Mechanical Properties of Sedimentary Rocks. Rock Mech. Rock Eng. 2017, 50, 2585–2600. [Google Scholar]
- Babets, D.V.; Kovrov, O.S.; Moldabayev, S.K.; Tereschuk, R.M. Impact of water saturation effect on sedimentary rocks strength properties. Nauk. Visnyk Natsionalnoho Hirnychoho Universytetu 2020, 2020, 76–81. [Google Scholar] [CrossRef]
- Hasbollah, A.Z.D.; Mohamad, T.E.; Hezmi, A.M.; Abdullah, R.A.; Yunus, N.Z.M.; Mustaffar, M.; Jusoh, S.N.; Azmi, M.; Ramli, M.H.; Taib, A.M. Comparison study on the strength index of tropical shale and sandstone influenced by moisture content. In Proceedings of the IOP Conference Series: Materials Science and Engineering, Kuala Lumpur, Malaysia, 27–28 February 2019. [Google Scholar]
- Lin, Y.F.; Guan, F.J.; Hu, H.Y. Adsorption Characteristics of Water-bearing Shale in Longmaxi Formation, Eastern Sichuang. J. Xi’an Shiyou Univ. (Nat. Sci. Ed.) 2019, 34, 21–25. [Google Scholar]
- Li, W.T.; Pour-Ghaz, M.; Castro, J.; Weiss, J. Water absorption and critical degree of saturation relating to freeze-thaw damage in concrete pavement joints. J. Mater. Civ. Eng. 2012, 24, 299–307. [Google Scholar] [CrossRef]
- Hatheway, W.A. The Complete ISRM Suggested Methods for Rock Characterization, Testing and Monitoring: 1974–2006. Environ. Eng. Geosci. 2009, 15, 47–48. [Google Scholar] [CrossRef]
- Xue, H.Q.; Zhou, S.W.; Jiang, Y.L.; Zhang, F.D.; Dong, Z.; Guo, W. Effects of hydration on the microstructure and physical properties of shale. Pet. Explor. Dev. Online 2018, 45, 1146–1153. [Google Scholar] [CrossRef]
- Wang, Q.; Lyu, C.; Cole, R.D. Effects of hydration on fractures and shale permeability under different confining pressures: An experimental study. J. Pet. Sci. Eng. 2019, 176, 745–753. [Google Scholar] [CrossRef]
- Liu, J.; Bai, X.; Derek, E. Evolution of pore systems in low-maturity oil shales during thermal upgrading—Quantified by dynamic SEM and machine learning. Pet. Sci. 2024, in press. [CrossRef]
- Liu, J.; Yao, Y.B.; Elsworth, D. Morphological complexity and azimuthal disorder of evolving pore space in low-maturity oil shale during in-situ thermal upgrading and impacts on permeability. Pet. Sci. 2024, in press. [CrossRef]
- Huang, Z.; Zhang, Y.; Xie, L.Z.; Zhao, P.; He, B.; Ren, L. Comparative study of porosity test methods for shale. Arab. J. Geosci. 2020, 13, 94. [Google Scholar] [CrossRef]
- Li, D.; Wong, L.N.Y. The Brazilian Disc Test for Rock Mechanics Applications: Review and New Insights. Rock Mech. Rock Eng. 2012, 46, 269–287. [Google Scholar] [CrossRef]
- Dodge, Y. The Concise Encyclopedia of Statistics; Springer Science & Business Media: New York, NY, USA, 2008; pp. 95–267. [Google Scholar]
- Yang, Z.P.; He, B.; Xie, L.Z.; Li, C.B.; Wang, J. Strength and failure modes of shale based on Brazilian test. Rock Soil Mech. 2015, 36, 3447–3455. [Google Scholar]
- Van, E.E.M. The mechanisms of strength reduction due to moisture in coal mine shales. Int. J. Rock Mech. Min. Sci. Geomech. Abstr. 1976, 13, 61–67. [Google Scholar]
- Chalmers, G.R.L.; Bustin, R.M.; Power, I.M. Characterization of gas shale pore systems by porosimetry, pycnometry, surface area, and field emission scanning electron microscopy/transmission electron microscopy image analyses: Examples from the Barnett, Woodford, Haynesville, Marcellus, and Doig units. AAPG Bull. 2012, 96, 1099–1119. [Google Scholar]
- Zhou, T.; Zhang, S.C.; Yang, L.; Ma, X.F.; Zou, Y.S.; Lin, H. Experimental investigation on fracture surface strength softening induced by fracturing fluid imbibition and its impacts on flow conductivity in shale reservoirs. J. Nat. Gas Sci. Eng. 2016, 36, 893–905. [Google Scholar] [CrossRef]
- Liu, X.J.; Zeng, W.; Liang, L.X.; Xiong, J. Experimental study on hydration damage mechanism of shale from the Longmaxi formation in southern Sichuan basin, China. Petroleum 2016, 2, 54–60. [Google Scholar] [CrossRef]
- Liang, L.; Xiong, J.; Liu, X. Experimental study on crack propagation in shale formations considering hydration and wettability. J. Nat. Gas Sci. Eng. 2015, 23, 492–499. [Google Scholar] [CrossRef]
- Yu, H.T.; Ding, Y.; Liu, Y.M.; Peng, M.; Liang, L.X.; Yu, X.L. A dynamical spontaneous imbibition model for shale considering hydration damage. Pet. Drill. Tech. 2023, 51, 139–148. [Google Scholar]
- Qian, B.; Zhu, J.H.; Yang, H.; Liang, X.; Yin, C.B.; Shi, X.Z.; Li, D.Q.; Li, J.L.; Fang, H. Experiments on shale reservoirs plugs hydration. Pet. Explor. Dev. 2017, 44, 615–621. [Google Scholar] [CrossRef]
- She, H.C.; Liu, S.Q.; Zhang, D.C.; Luo, K.; Hu, Z.Q. Research on Shale Hydration Disturbance Damage Test and Statistical Damage Model. Chin. J. Undergr. Space Eng. 2023, 19, 602–609. [Google Scholar]
- Li, J.P.; Lian, M.J. Mining Rock Mechanics, 2nd ed.; Metallurgical Industry Press: Beijing, China, 2011; p. 57. [Google Scholar]
- Shadizadeh, R.S.; Moslemizadeh, A.; Dezaki, S.A. A novel nonionic surfactant for inhibiting shale hydration. Appl. Clay Sci. 2015, 118, 74–86. [Google Scholar] [CrossRef]
- Chao, Z.M.; Wang, H.L.; Xu, W.Y.; Jia, C.J.; Zhao, K. A rapid method for preparing rock samples with different water saturation levels. Rock Soil Mech. 2018, 39, 1109–1114. [Google Scholar]
Disclaimer/Publisher’s Note: The statements, opinions and data contained in all publications are solely those of the individual author(s) and contributor(s) and not of MDPI and/or the editor(s). MDPI and/or the editor(s) disclaim responsibility for any injury to people or property resulting from any ideas, methods, instructions or products referred to in the content. |
© 2024 by the authors. Licensee MDPI, Basel, Switzerland. This article is an open access article distributed under the terms and conditions of the Creative Commons Attribution (CC BY) license (https://creativecommons.org/licenses/by/4.0/).