Solvent Exsolution and Liberation from Different Heavy Oil–Solvent Systems in Bulk Phases and Porous Media: A Comparison Study
Abstract
1. Introduction
2. Experimental
2.1. Materials
2.2. Experimental Setup and Procedures for the CCE Tests
- (1)
- The CO2/CH4/C3H8-saturated heavy oil was prepared by mixing a solvent (CO2/CH4/C3H8) and the dead Colony heavy oil in two high-pressure transfer cylinders. The mixture in the two high-pressure transfer cylinders was pumped back and forth for about 15–20 days until the target GOR of the live oil was achieved. The solvent concentrations (Cs) in the prepared heavy oil–CO2 system, heavy oil–CH4 system and heavy oil–C3H8 system were measured and are listed in Table 3.
- (2)
- The PVT cell was cleaned with kerosene and ethanol and then air-dried for 24 h. A leakage test was conducted by injecting CO2 into the PVT cell at a constant pressure of 3.5 MPa. The PVT cell was considered leakage-free if the pressure reduction was less than 5 psi after 24 h. Then, the CO2 in the cell was released to an exhaust ventilation hose. Afterwards, a vacuum pump was used to vacuum the PVT cell.
- (3)
- The piston in the PVT cell was pushed to the bottom of the PVT cell. The PVT cell pressure and its overburden pressure were raised to a pressure higher than the bubble-point pressure of the live oil by using the ISCO pump, which was connected to the PVT cell and its overburden chamber. Then, a pre-specified volume of the live oil (Voi) was injected into the PVT cell by using another syringe pump. The volumes of the injected three live oils in the three CCE tests (Tests #1, #3 and #5) are given in Table 3.
- (4)
- The PVT cell pressure was reduced stepwise by using a pre-specified pressure step (∆P) given in Table 3. The height (H) of the test fluid column in the PVT cell and the volume of the syringe pump connected to the PVT cell were monitored and recorded every 10 min.
- (5)
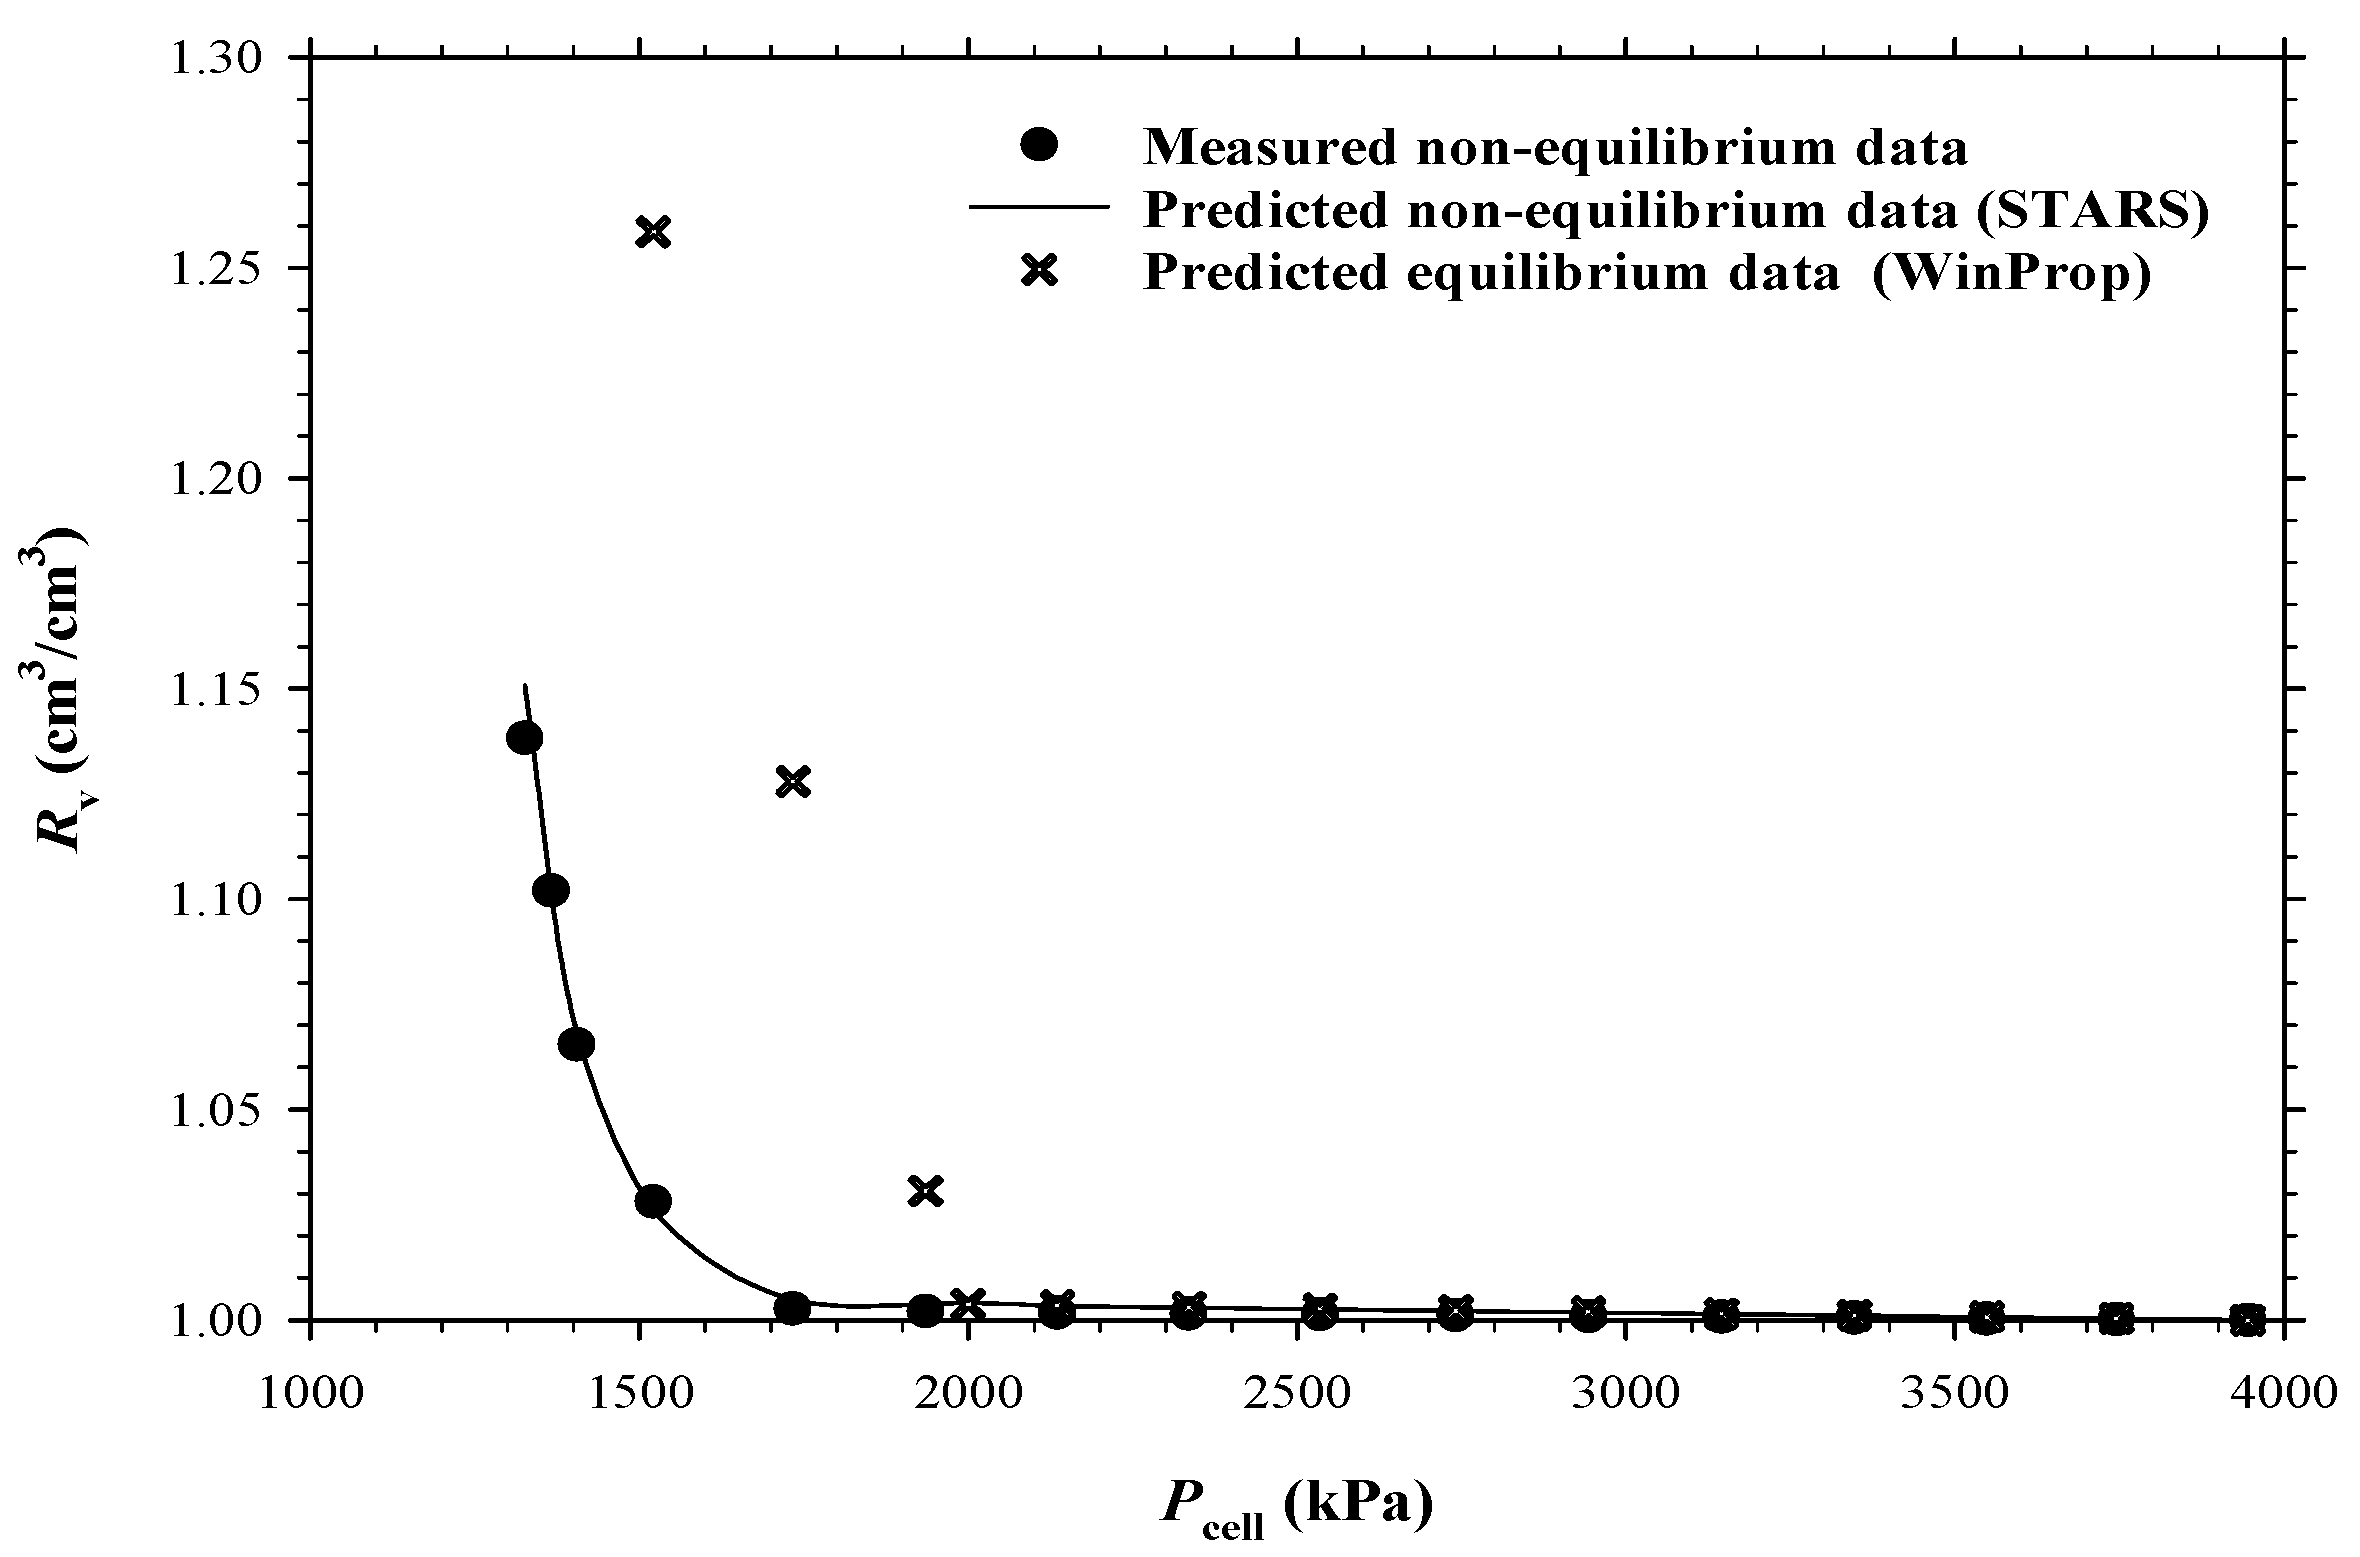
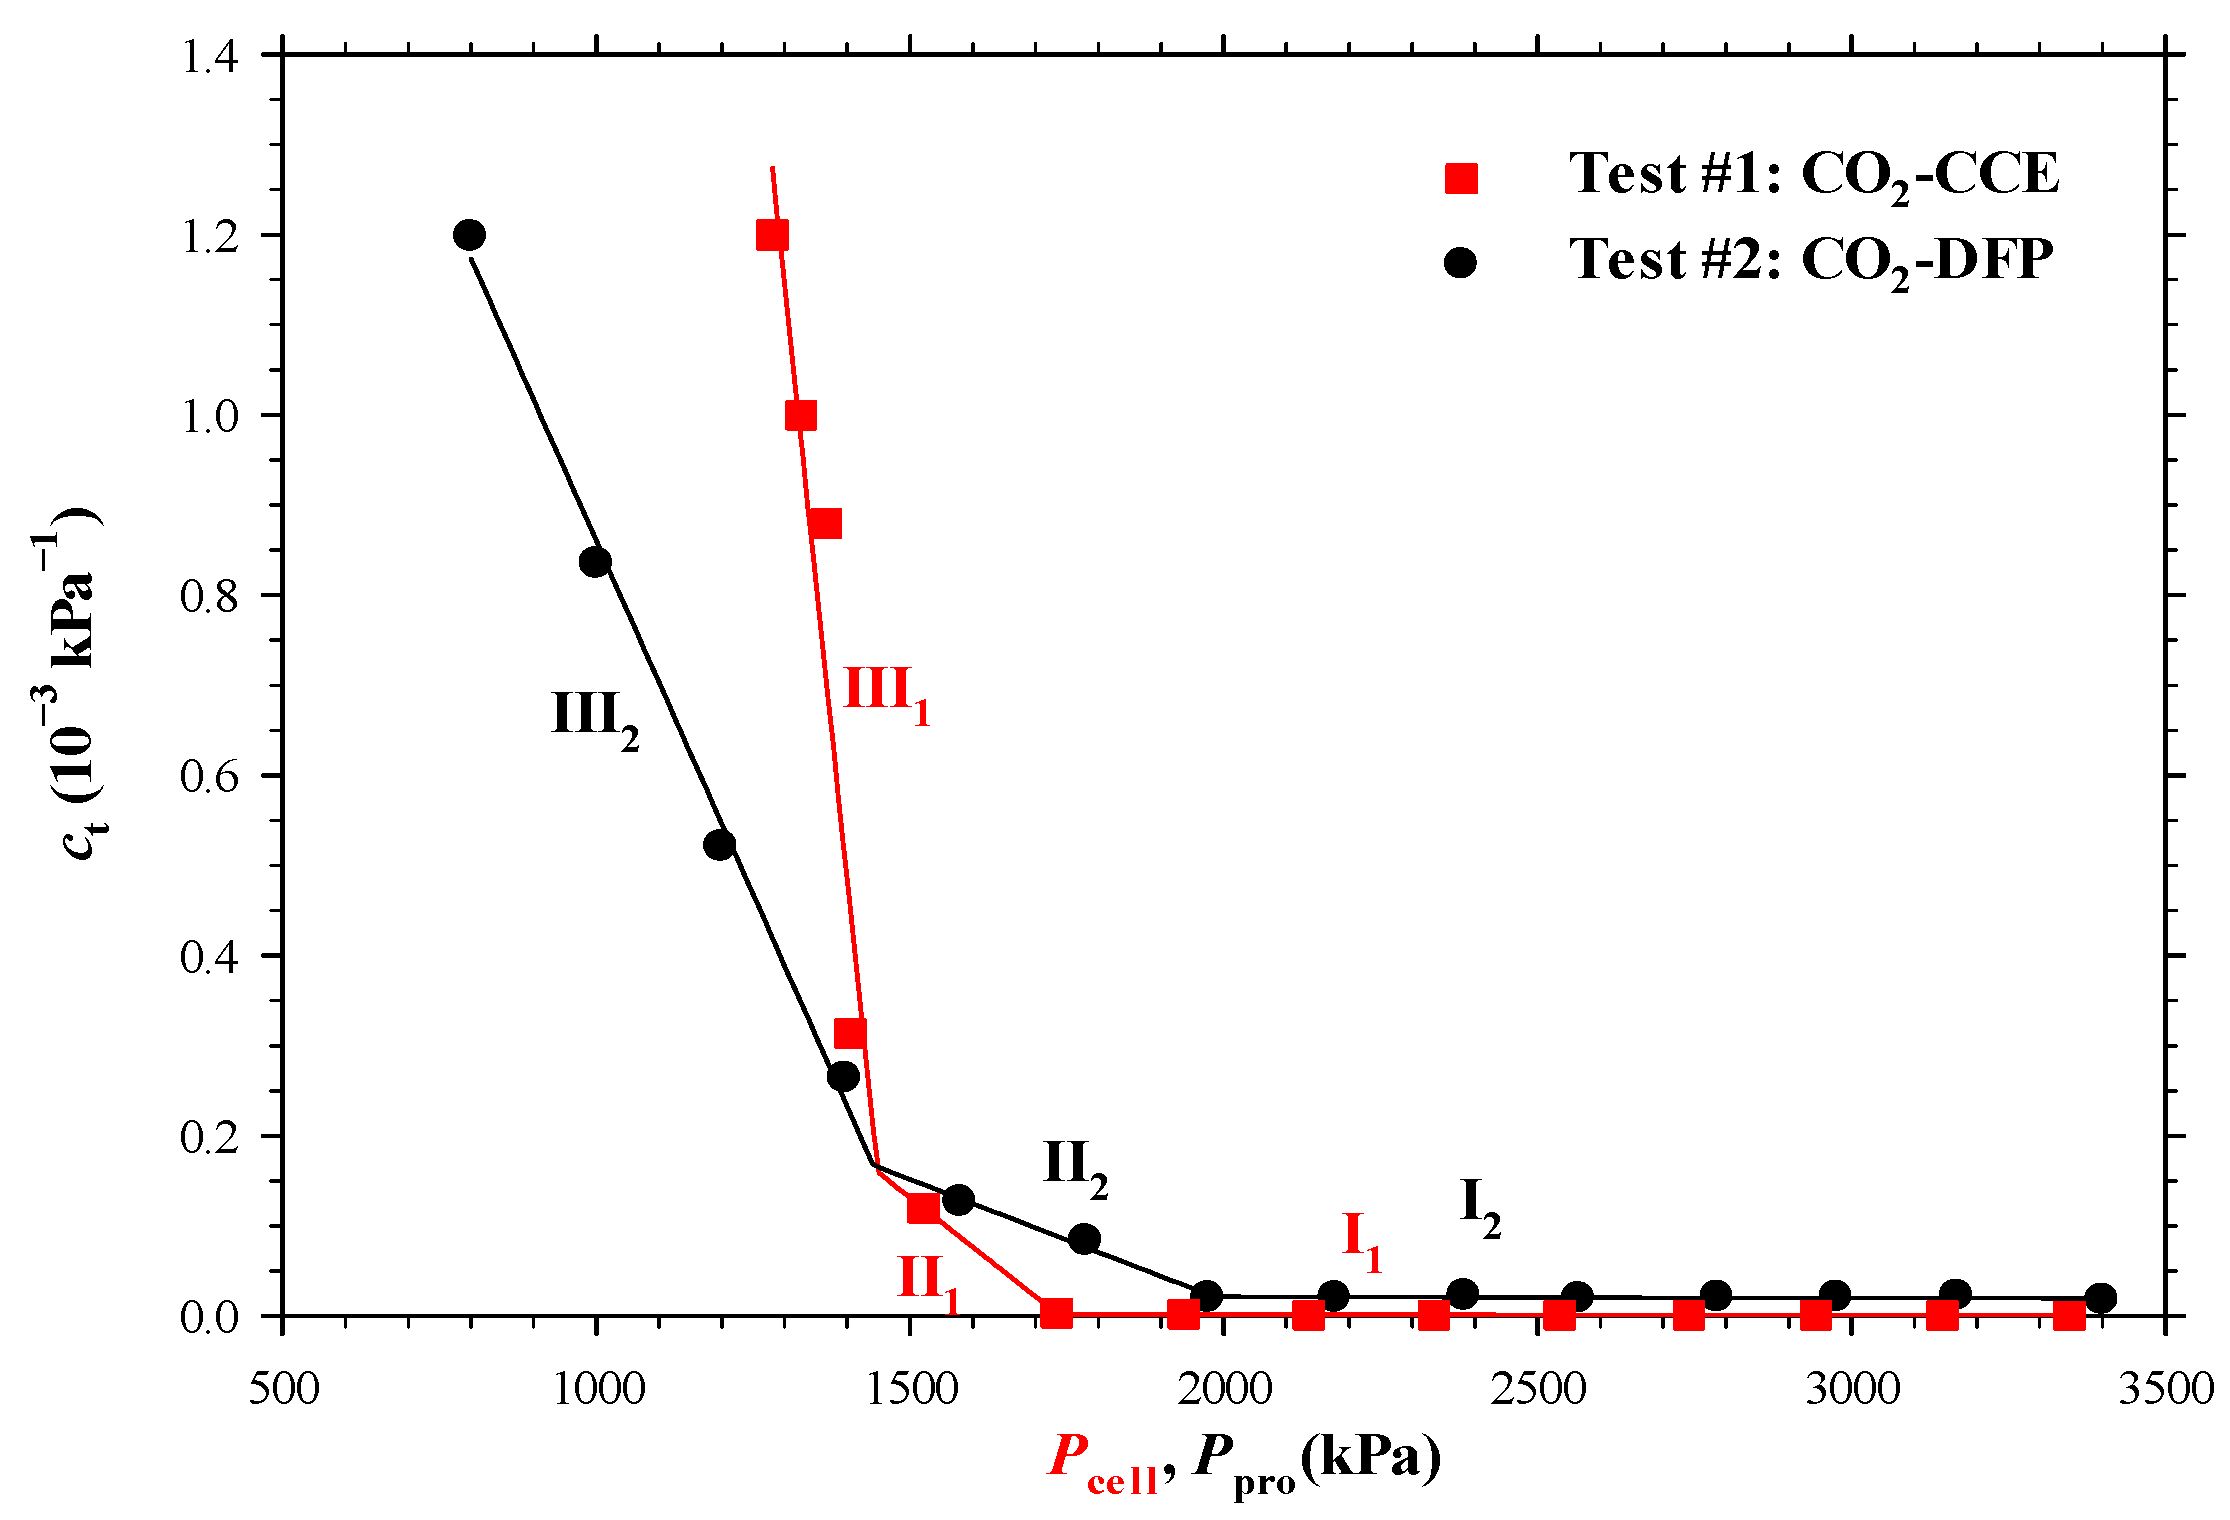
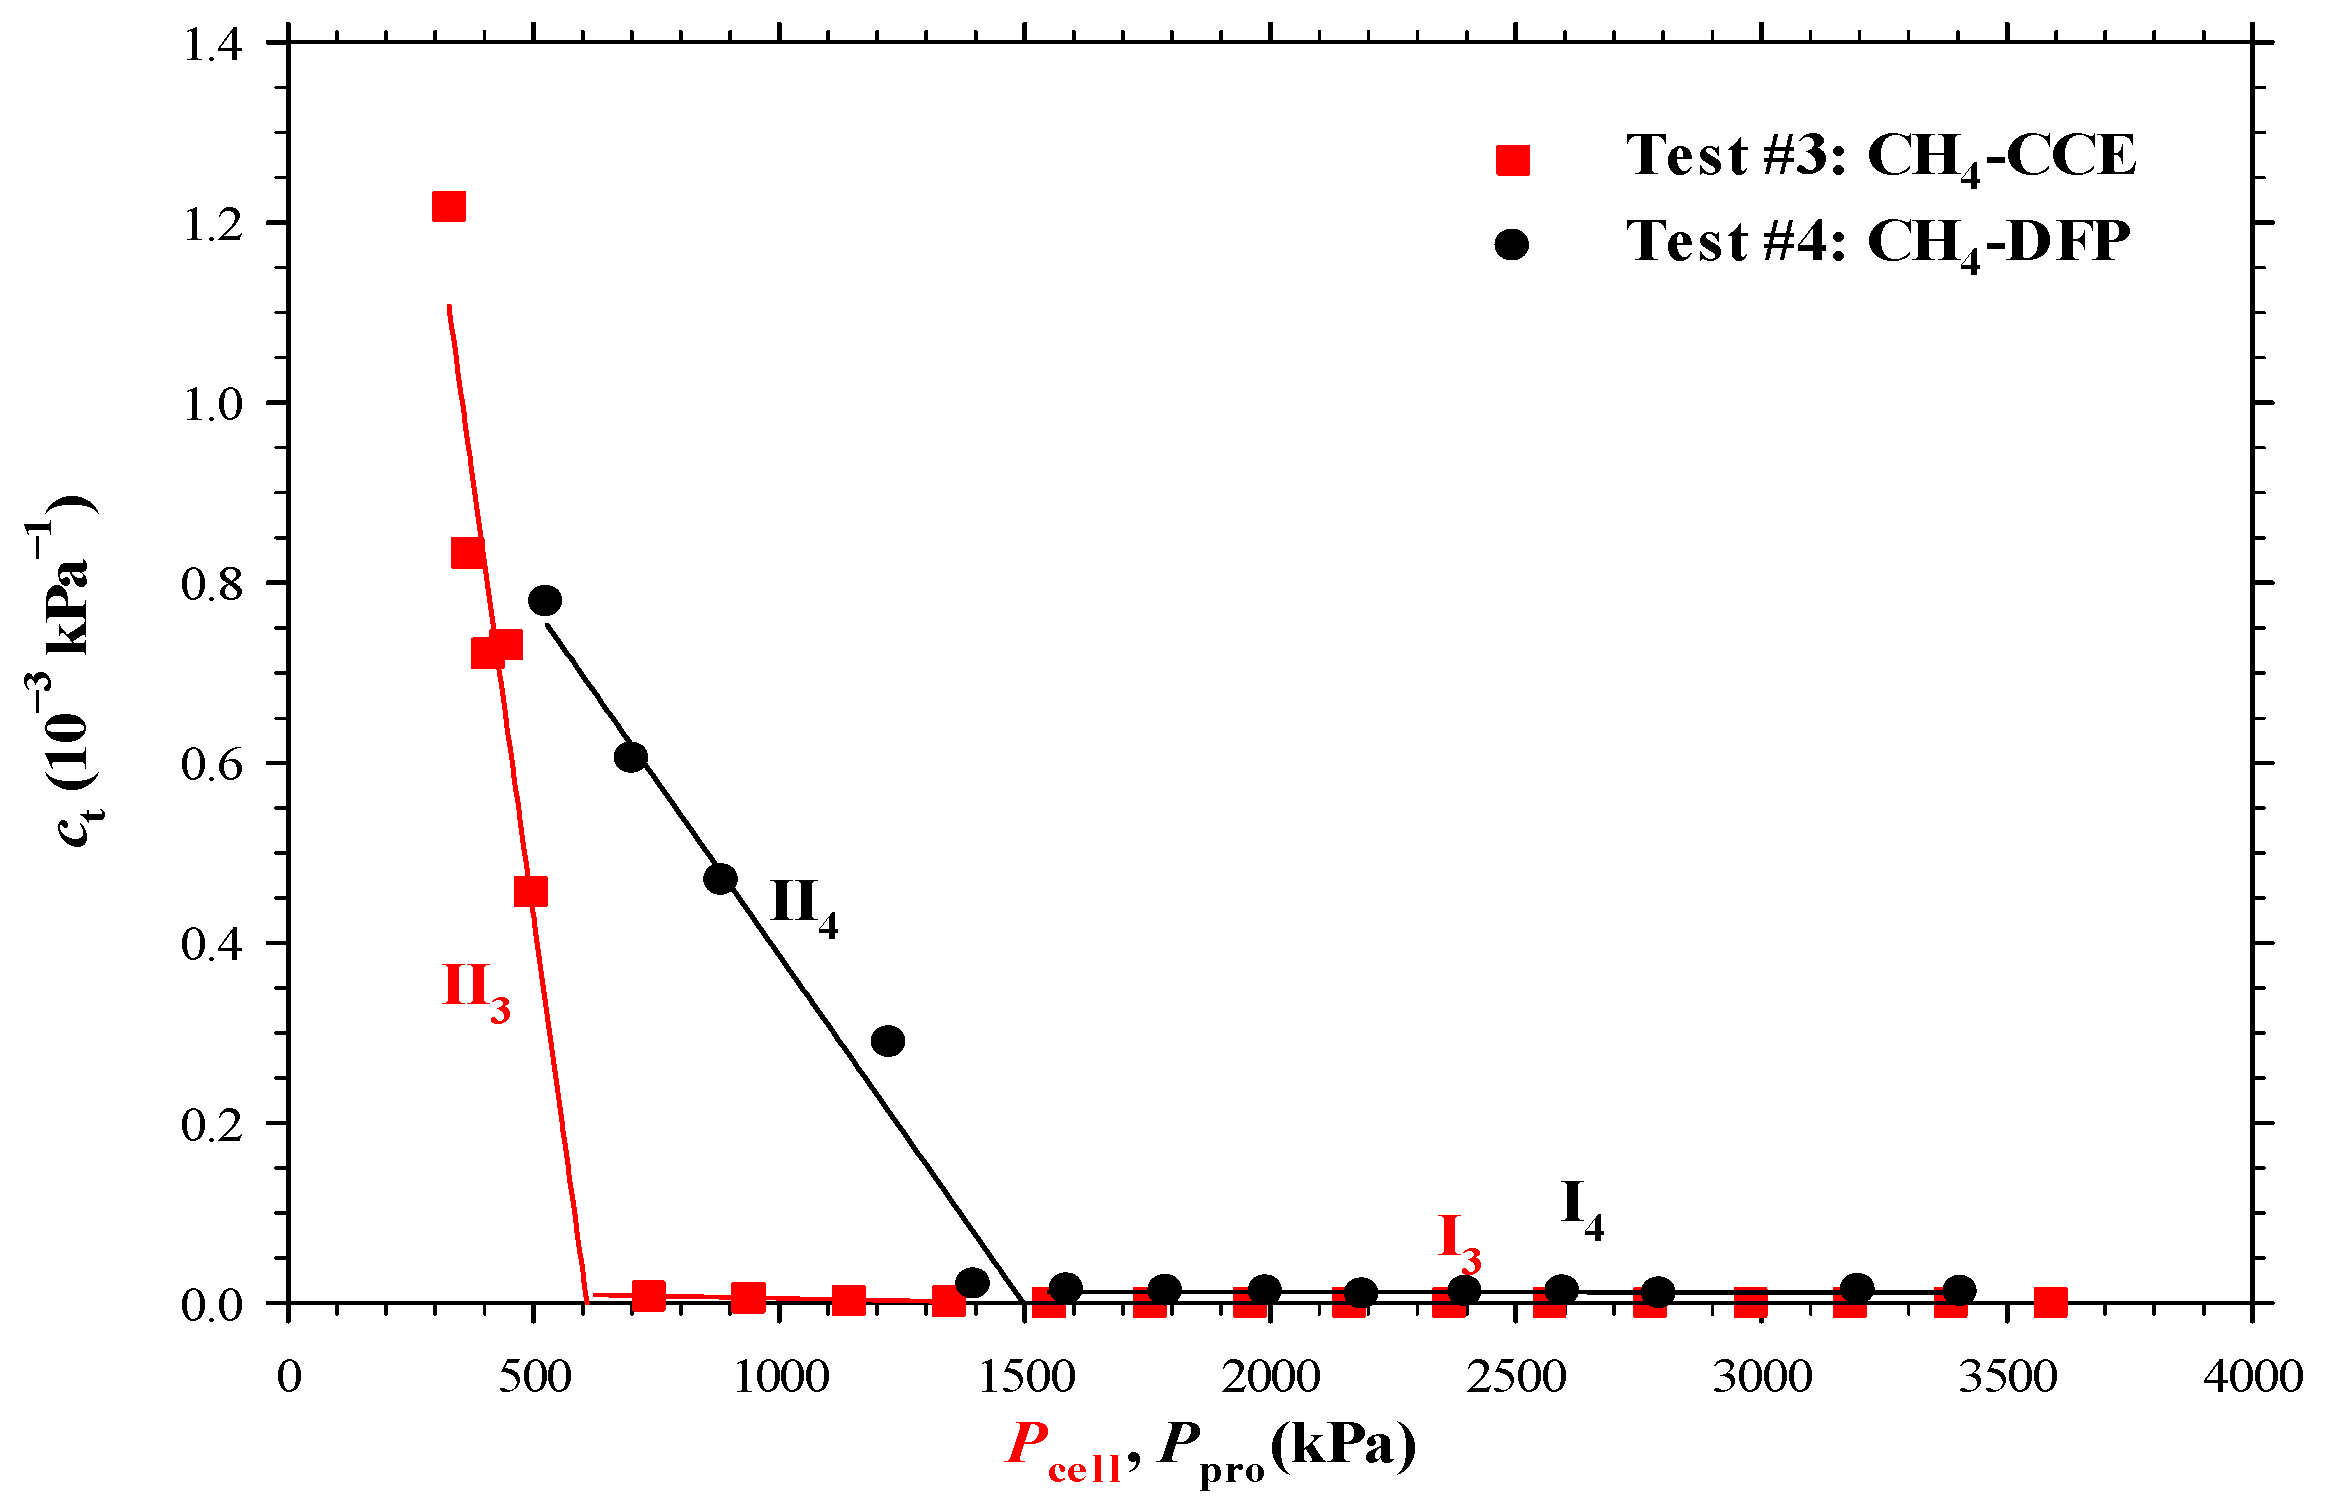
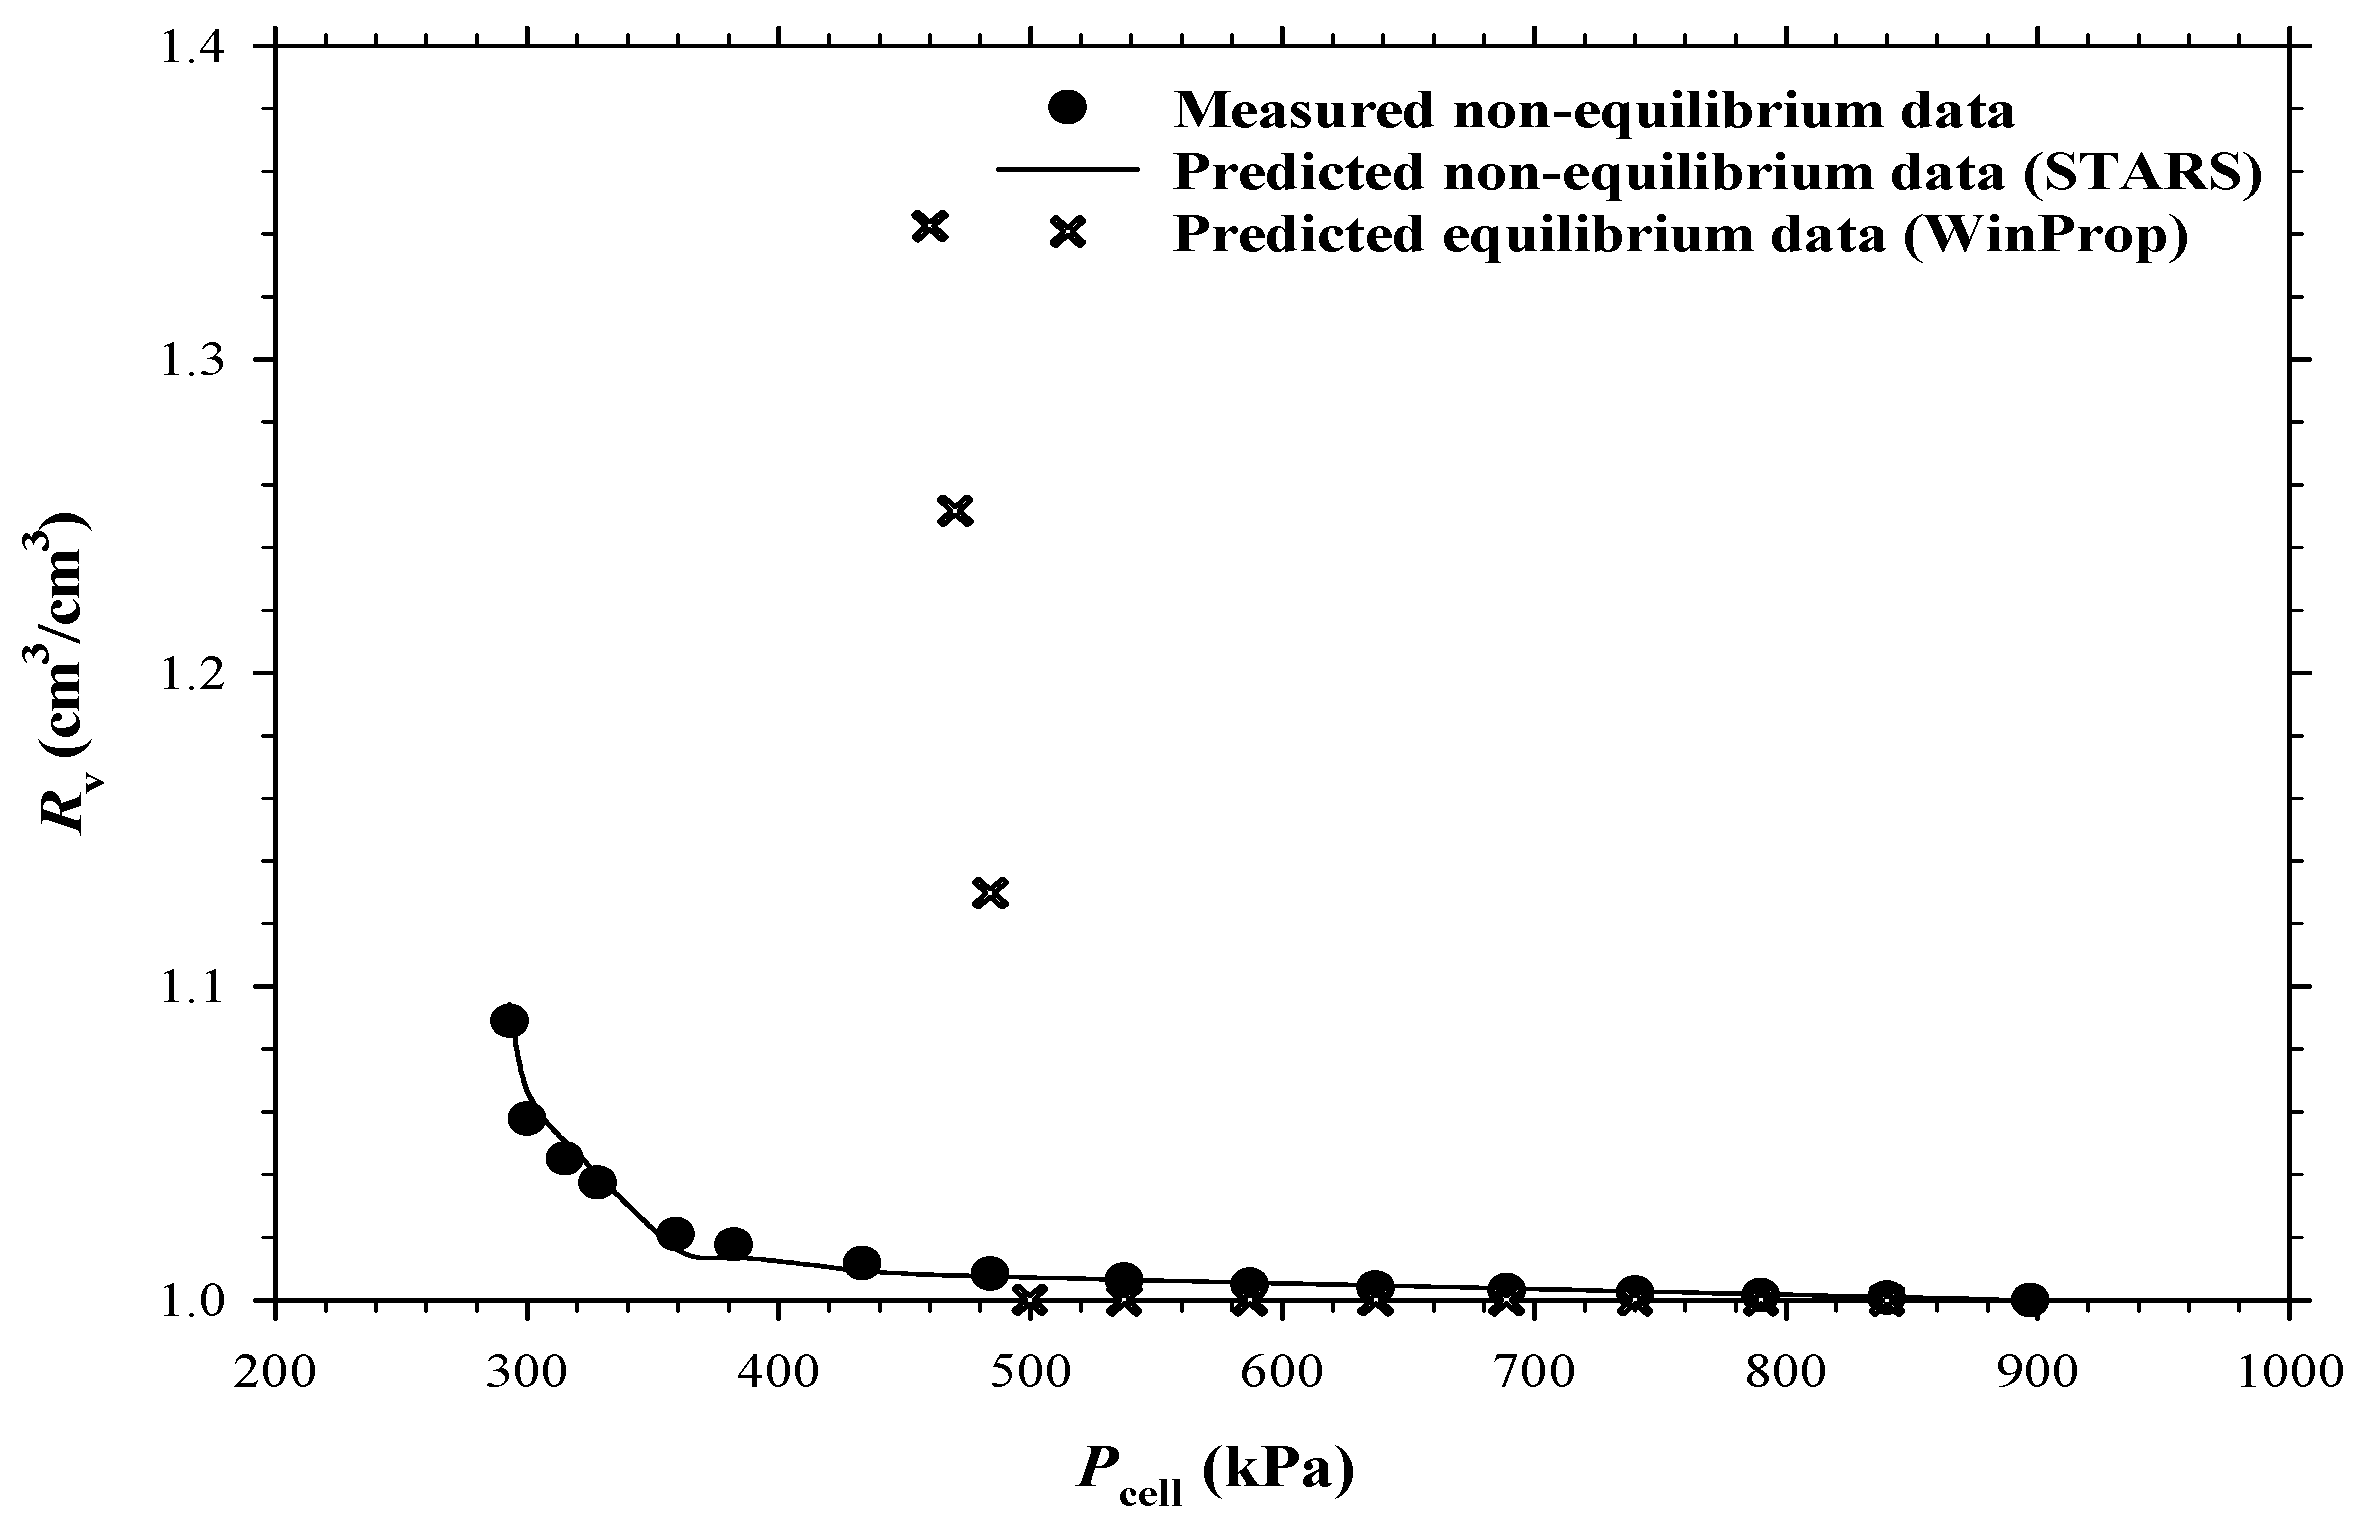
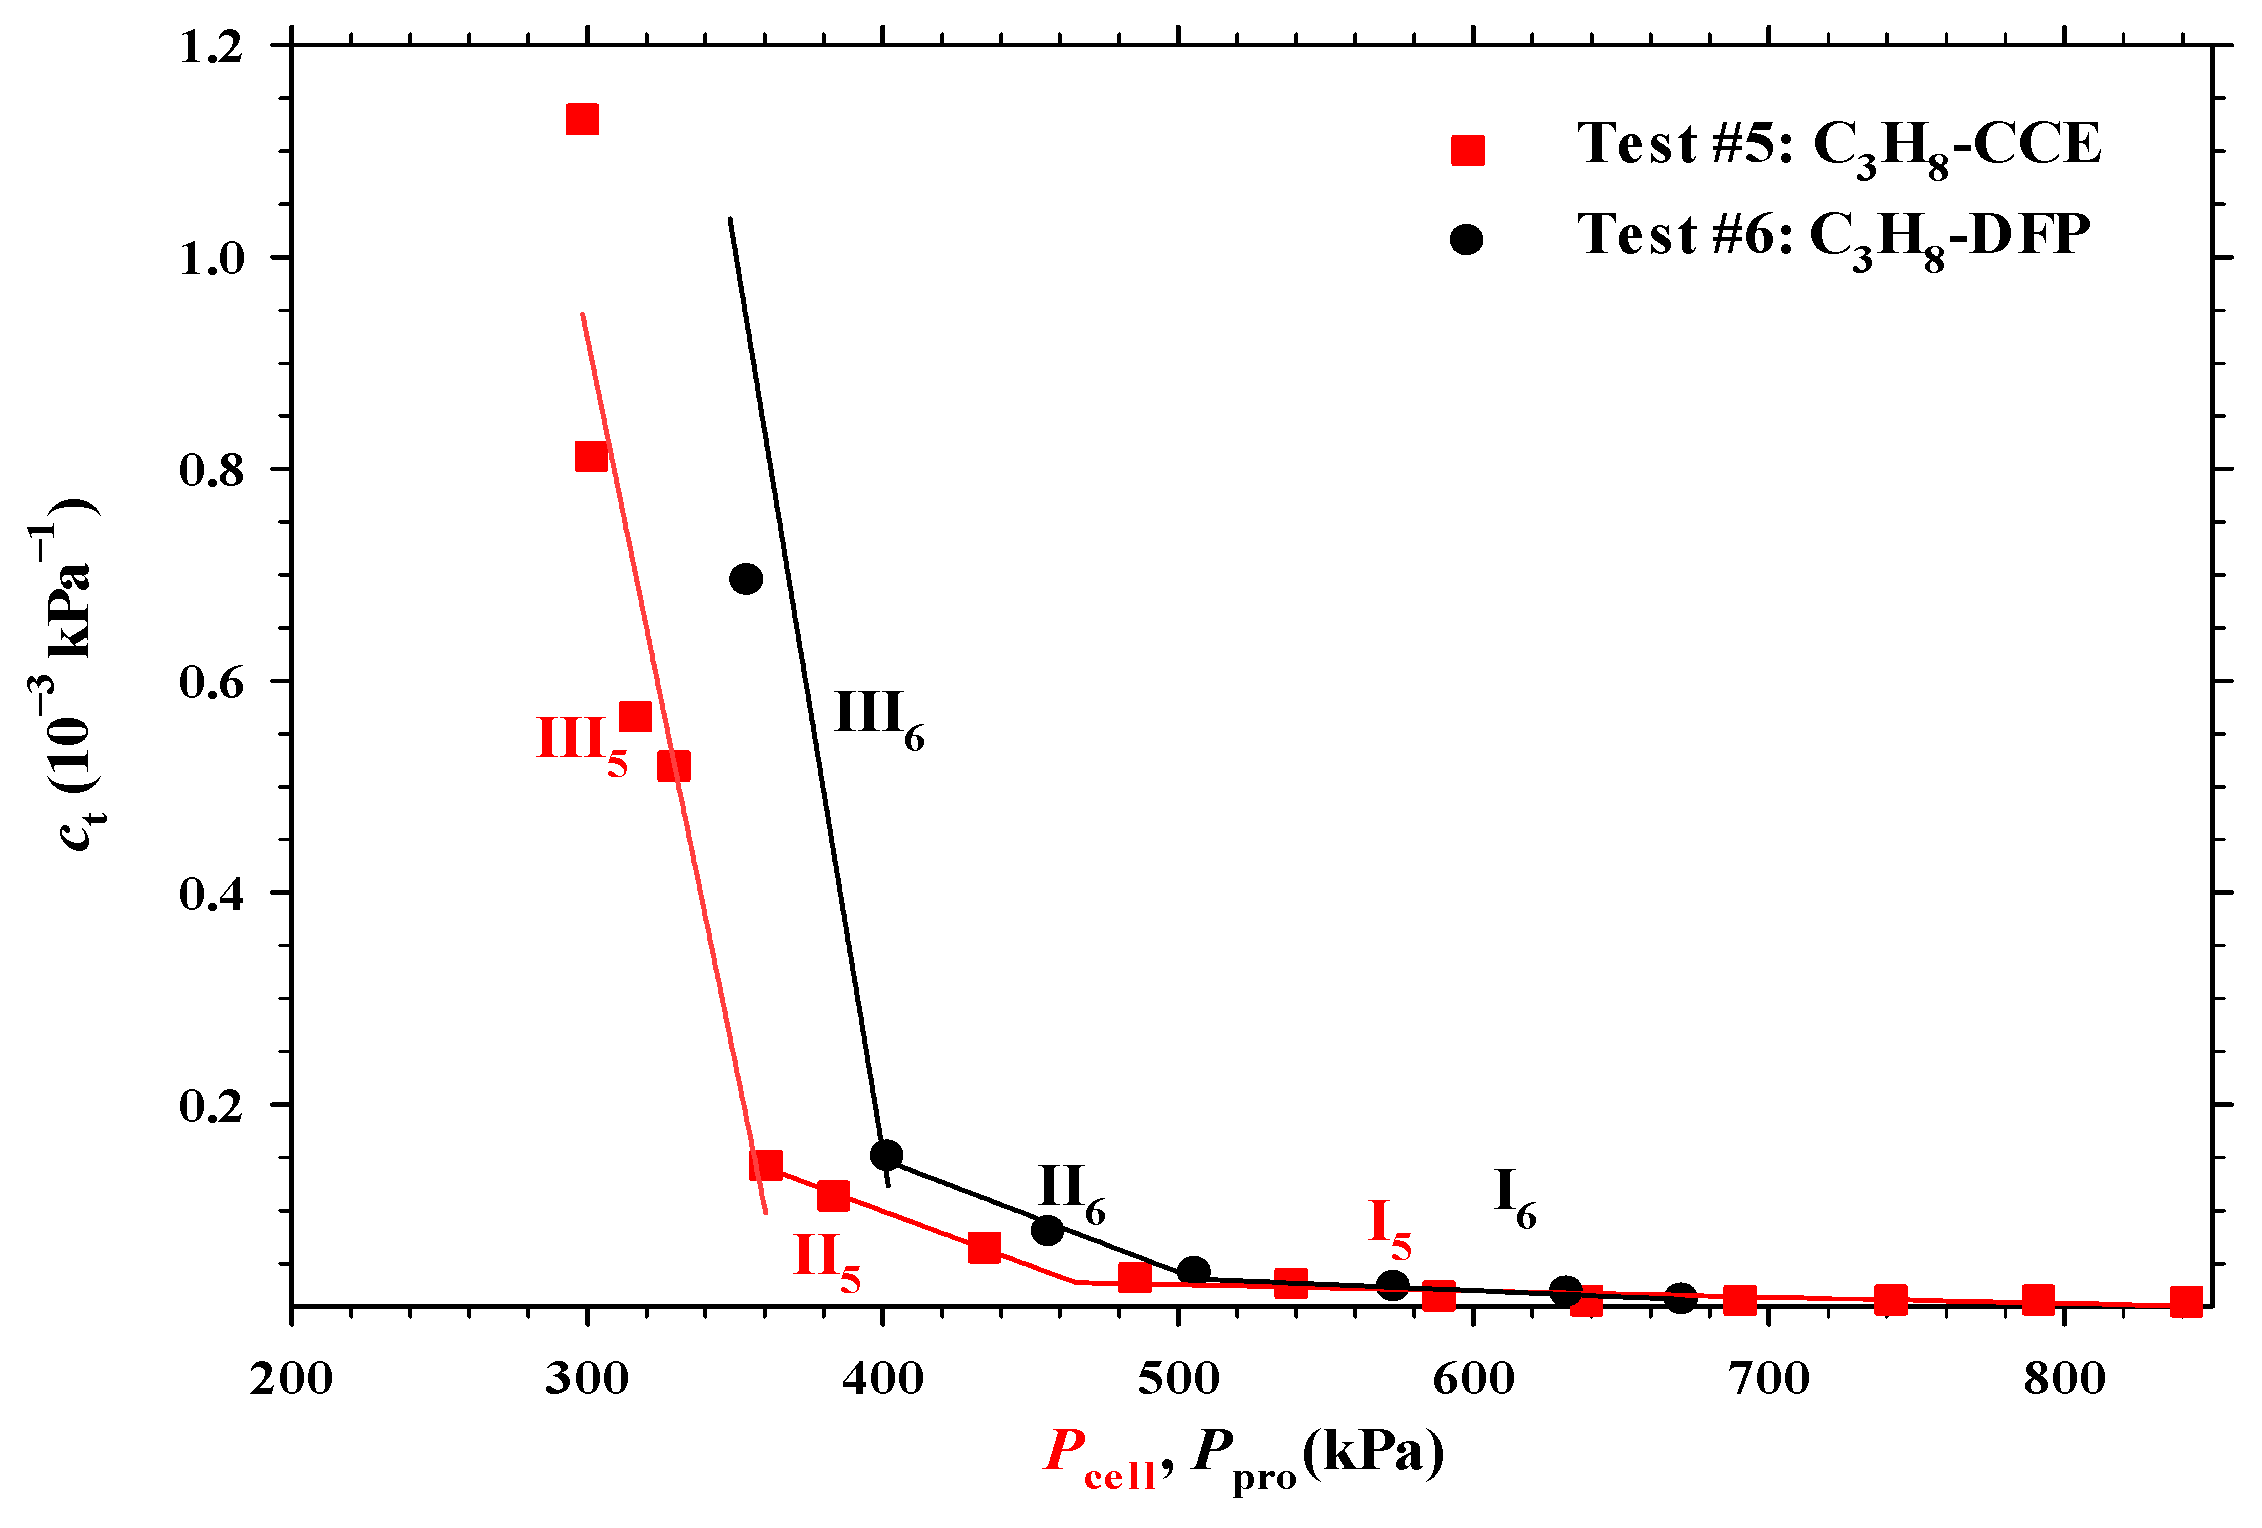
- The total test-fluid volume (Vt) in the PVT cell, total isothermal compressibility (ct) and relative volume (Rv) were measured when the volume change of the syringe pump was less than 0.12 cc within 10 min. Here, Vt, ct and Rv are defined as
- (6)
- Steps 4 and 5 were repeated until the PVT cell pressure reached a pre-specified test termination pressure.
| Test No. | Test | Cs (mol.%) | Voi (cm3) | ϕ (%) | k (D) | Soi (%) | ∆P (MPa) | Pb (MPa) | Pn (MPa) | rffe (min−1) | rffl (min−1) |
|---|---|---|---|---|---|---|---|---|---|---|---|
| 1 | CO2-CCE | 27.66 | 39.78 | - | - | - | 0.20 | 2.00 | 1.73 | 0.00052 | - |
| 2 | CO2-DFP | - | 40 | 2.6 | 98 | 1.97 | 0.00075 | 0.009 | |||
| 3 | CH4-CCE | 11.32 | 38.51 | - | - | - | 0.20 | 1.70 | 0.60 | 0.00009 | - |
| 4 | CH4-DFP | - | 39 | 2.7 | 97 | 1.50 | 0.013 | 0.00019 | |||
| 5 | C3H8-CCE | 27.31 | 40.54 | - | - | - | 0.05 | 0.50 | 0.48 | 0.0001, 0.000065 | - |
| 6 | C3H8-DFP | - | 39 | 1.9 | 97 | 0.50 | 0.00025 | 0.0045 |
2.3. Experimental Setup for the DFP Tests
- (1)
- The sieved sand grains (Bell & Mackenzie, Toronto, ON, Canada) with sizes of 60–80 mesh were added into the physical model through one of its ports. The sandpacked model was hammered continuously by using a rubber hammer until no void space existed in the model.
- (2)
- The leakage test was conducted by injecting CO2 into the sandpacked model at 3 MPa for each DFP test. The sandpacked model was considered leakage-free if its pressure reduction was less than 0.2 MPa within 24 h.
- (3)
- The porosity (ϕ) and permeability (k) measurements were performed by using the imbibition method and the Darcy’s law, respectively. The measured permeabilities and porosities of the three DFP tests (Tests #2, #4, #6) are listed in Table 3.
- (4)
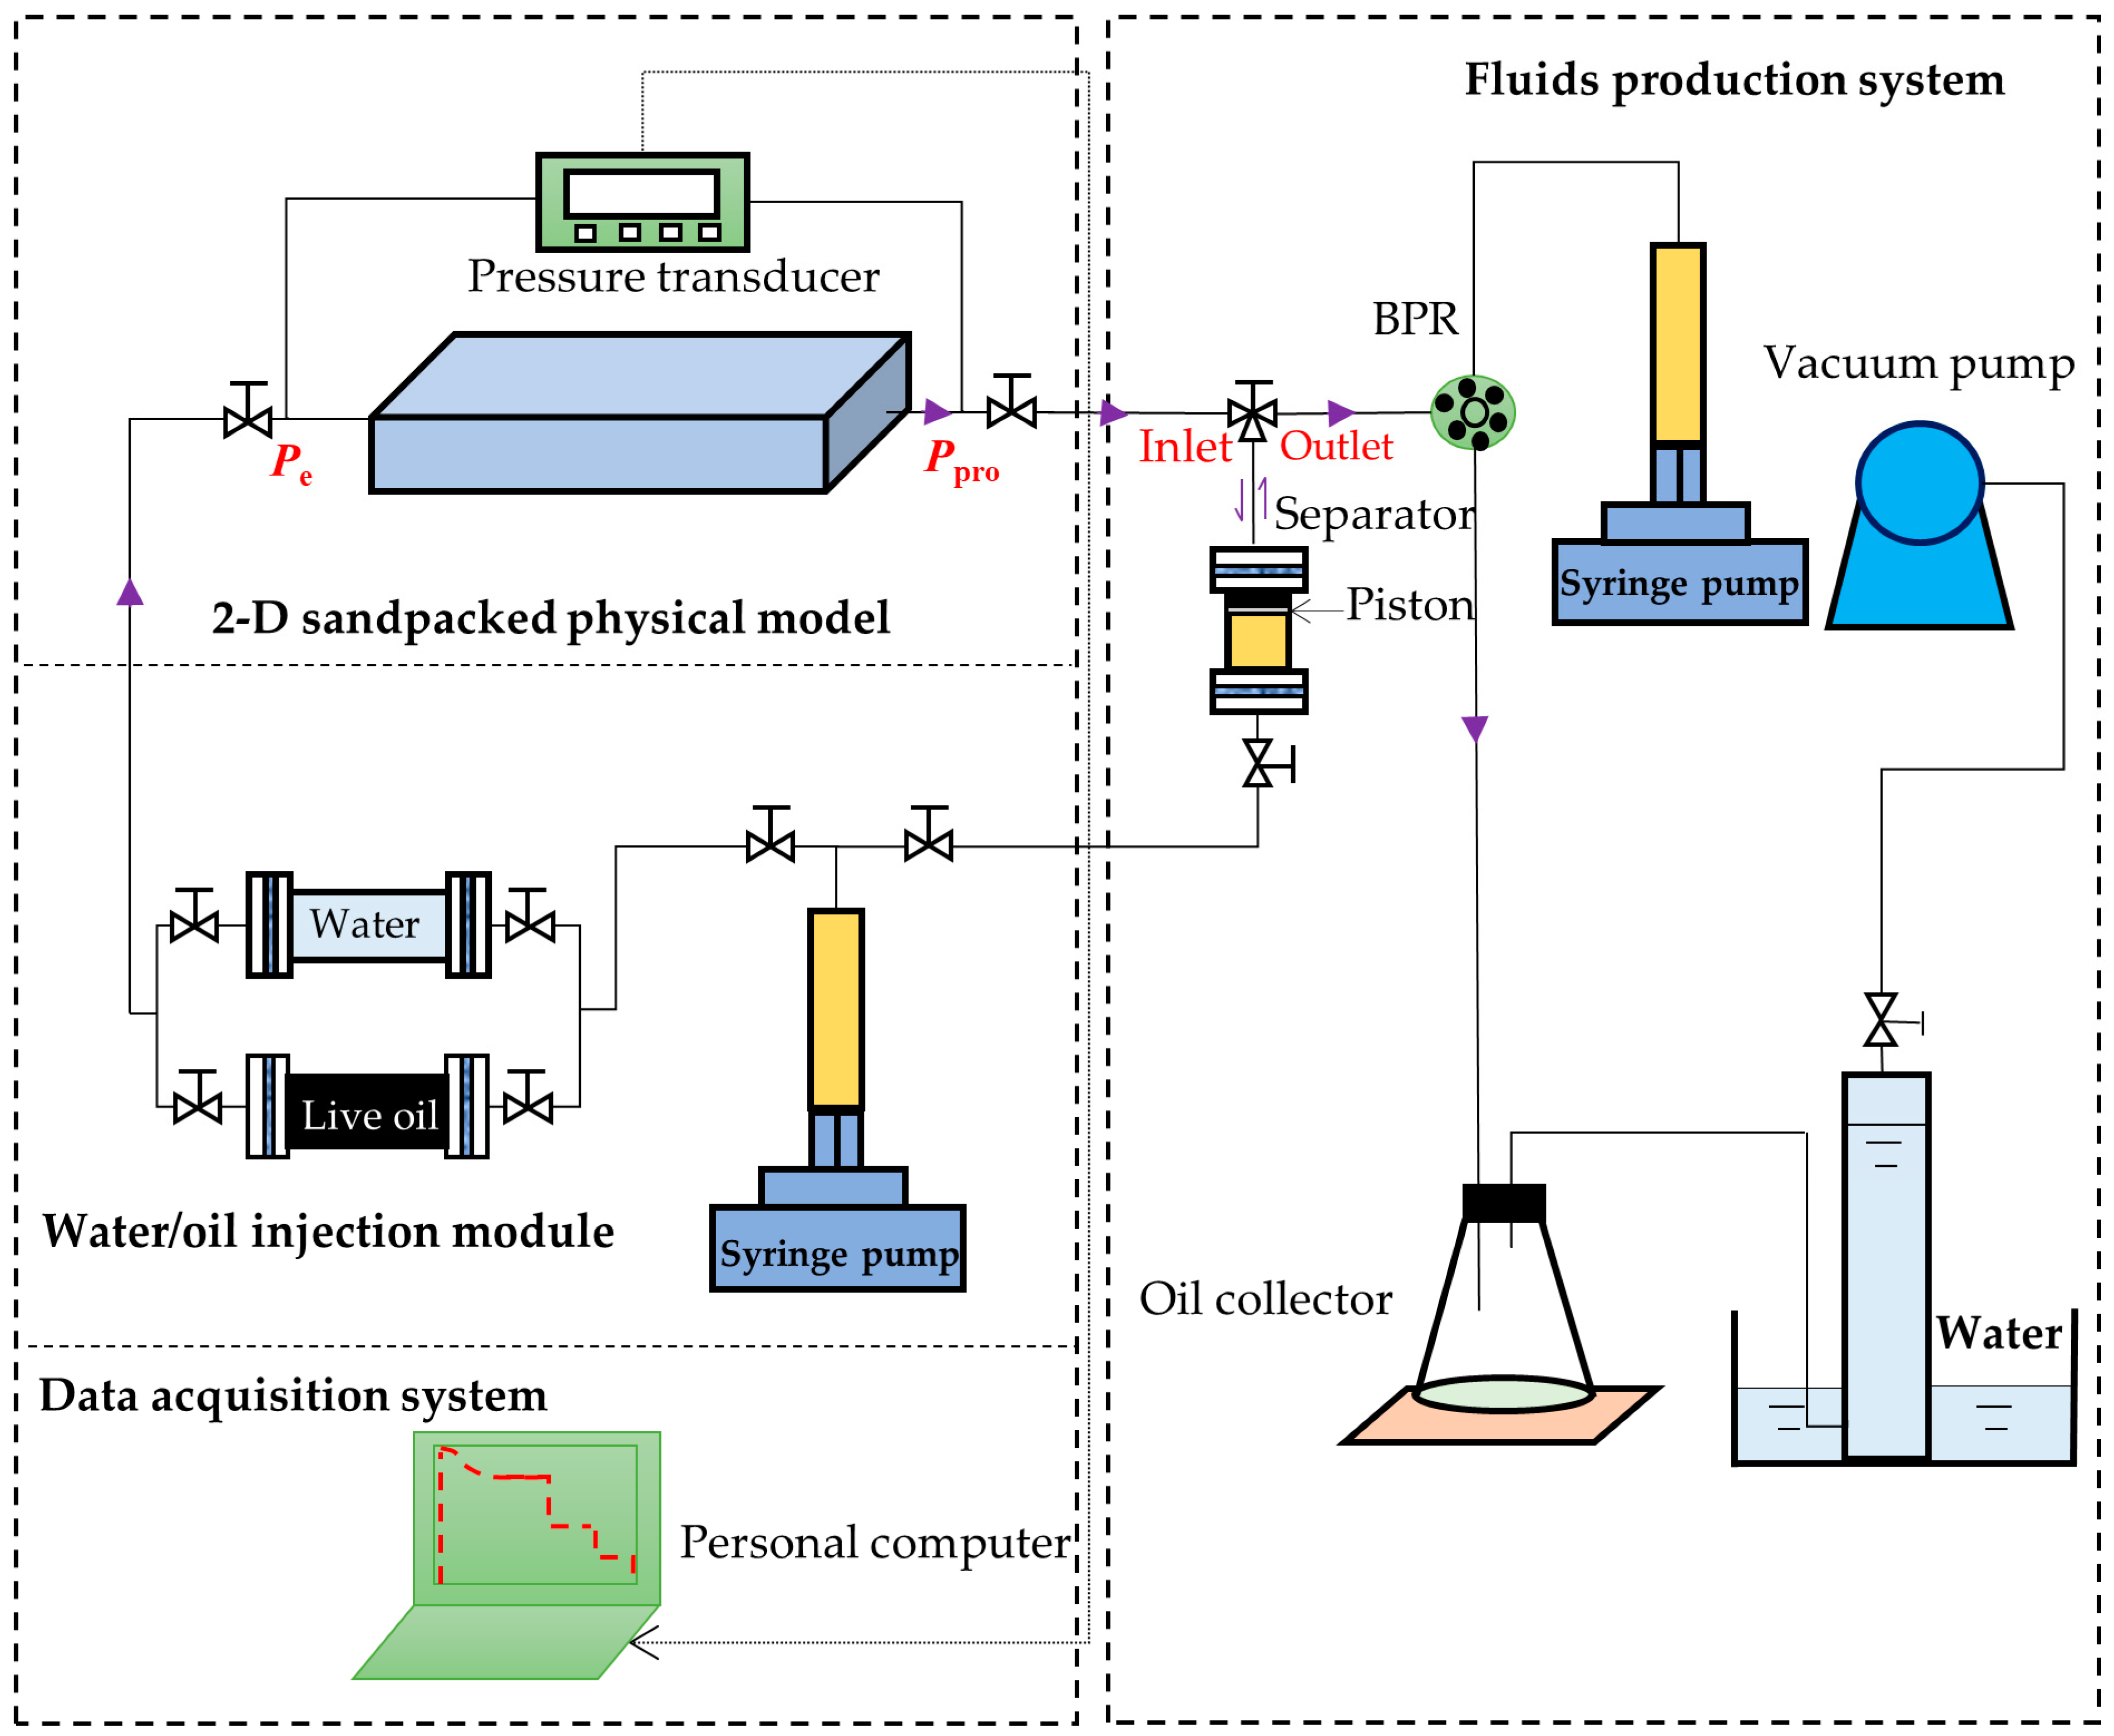
- Water was injected into the 2-D physical model first to raise the reservoir pressure higher than the bubble-point pressure of the live heavy oil. Then the solvent-saturated live oil was injected to displace the water until no more water was produced from the 2-D physical model and the measured solution GOR reached the initial solution GOR. The initial oil saturations (Soi) were determined by using the material balance equation and are given in Table 3.
- (5)
- The separator (i.e., a high-pressure cylinder) was connected to the 2-D physical model after its pressure was increased to the reservoir pressure. A period of 24 h was allowed for the 2-D physical model and separator to reach an equilibrium state.
- (6)
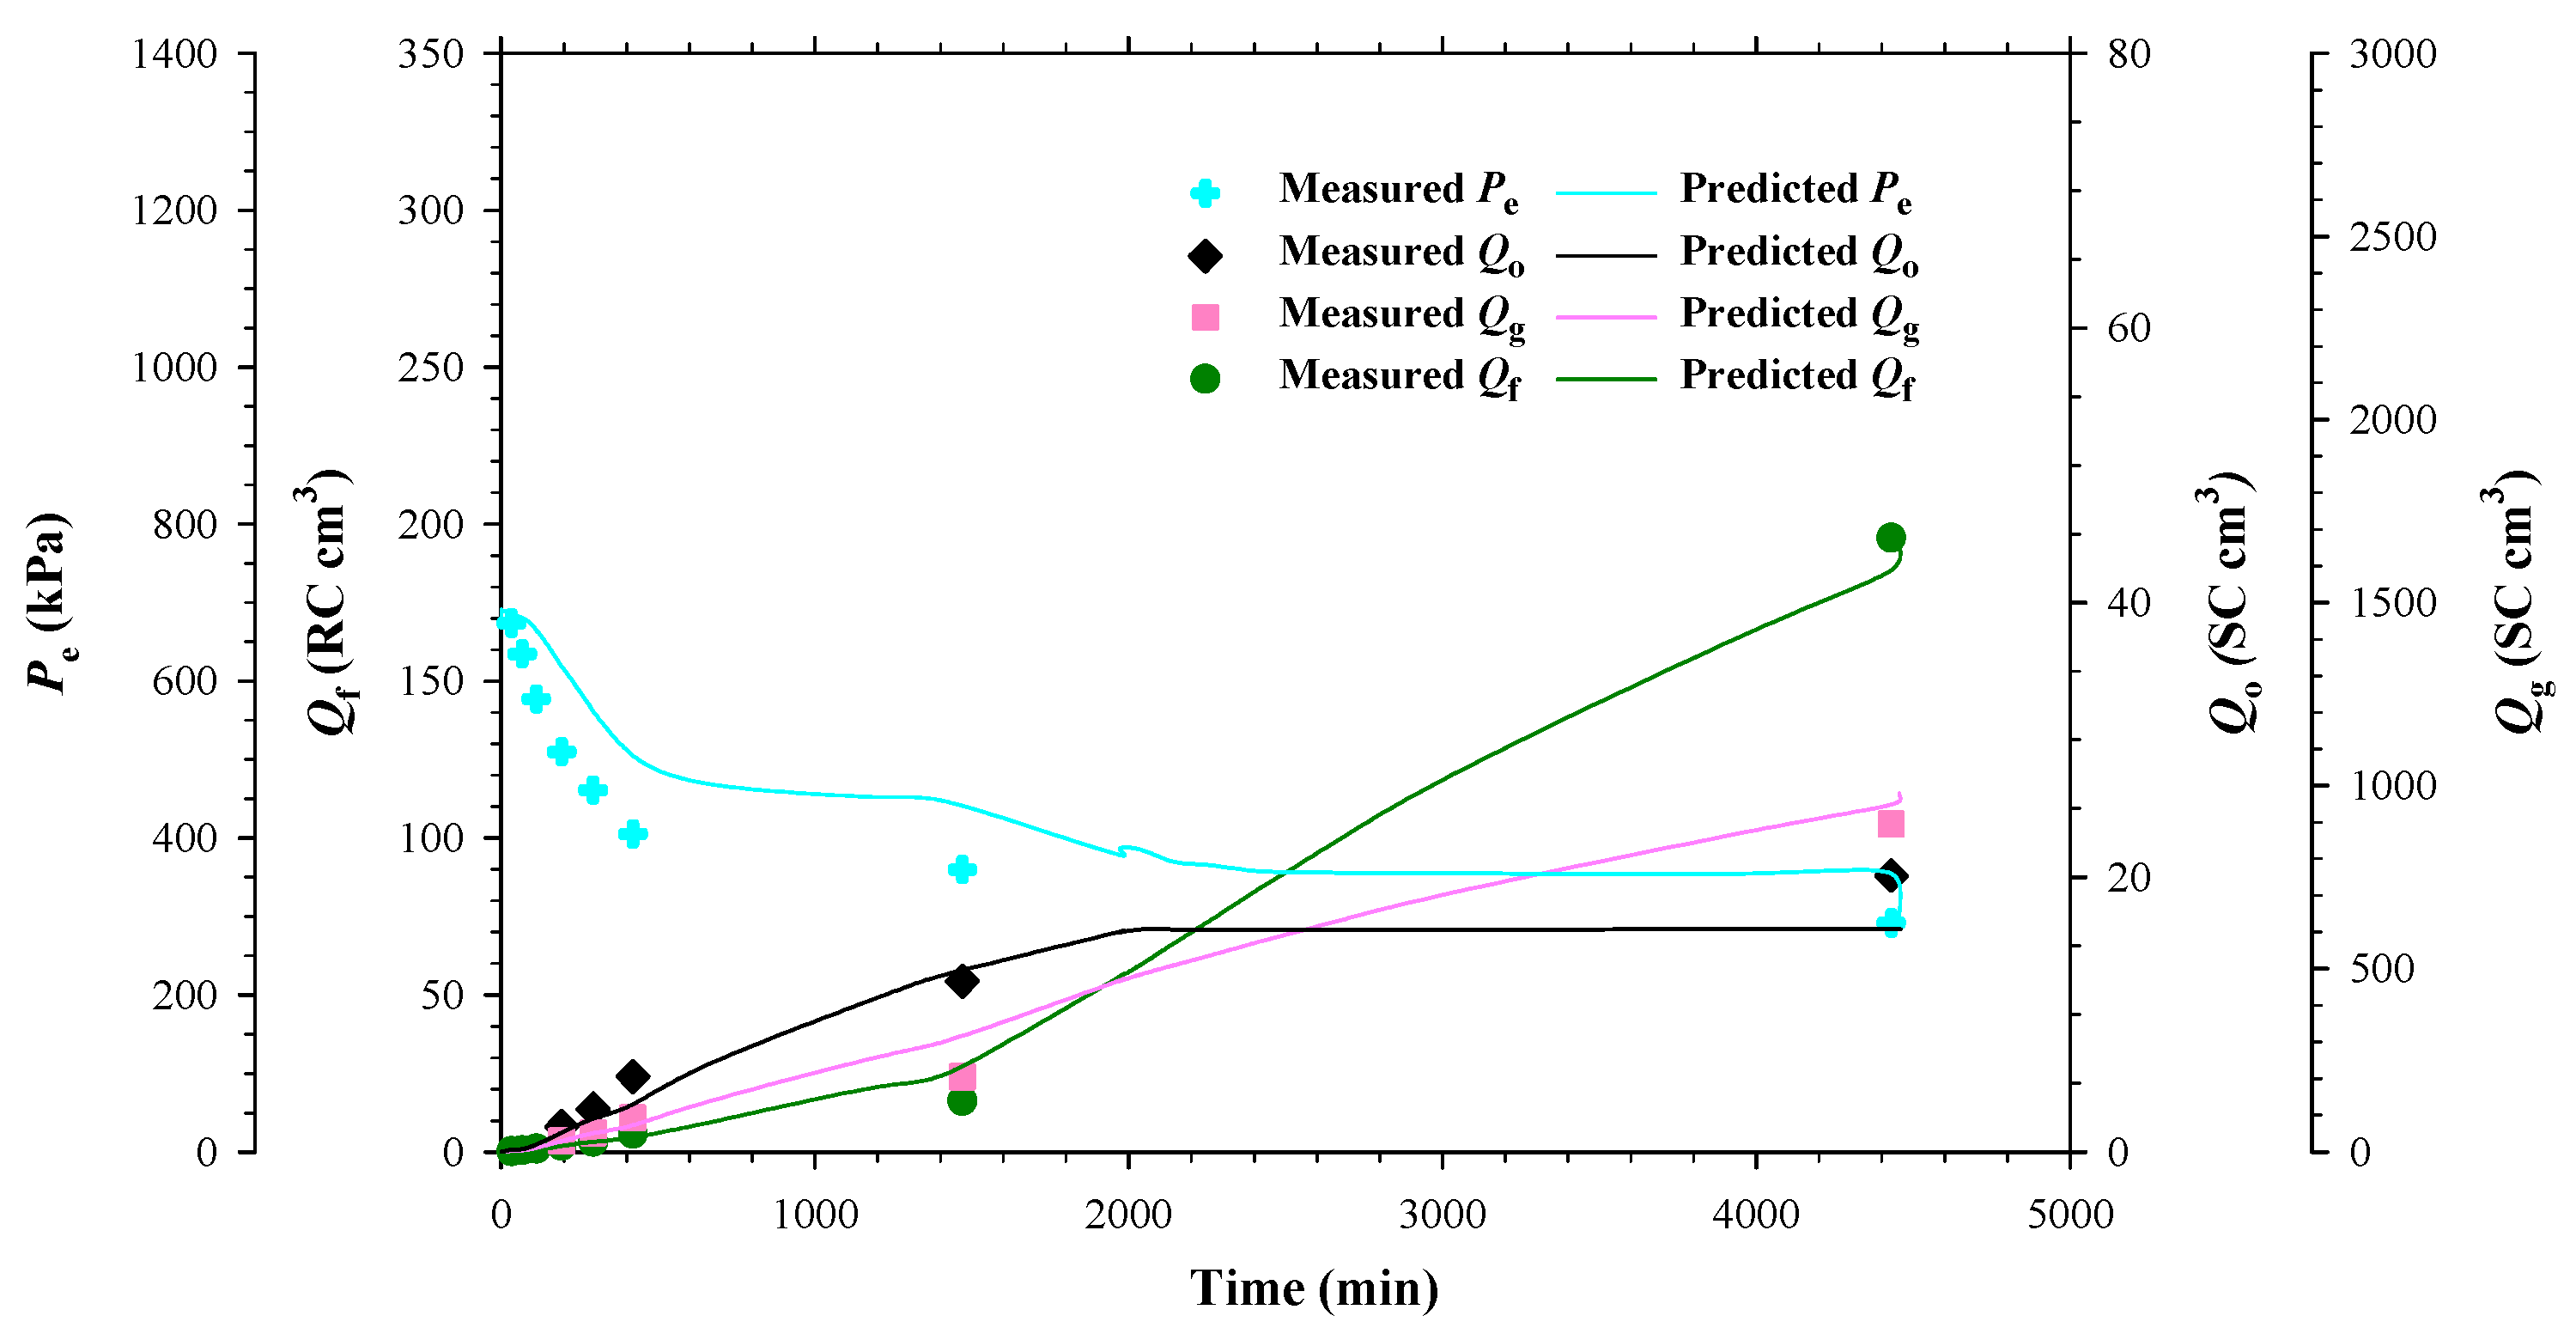
- The separator and reservoir pressures were reduced simultaneously by applying a pre-specified pressure depletion stepsize (ΔP). The produced fluids (heavy oil and/or gas) were collected in the separator and their total volume (Vf) at the separator pressure was monitored and recorded by using a syringe pump. The pressures at the two ends of the sandpacked physical model (Ppro and Pe) were monitored and recorded.
- (7)
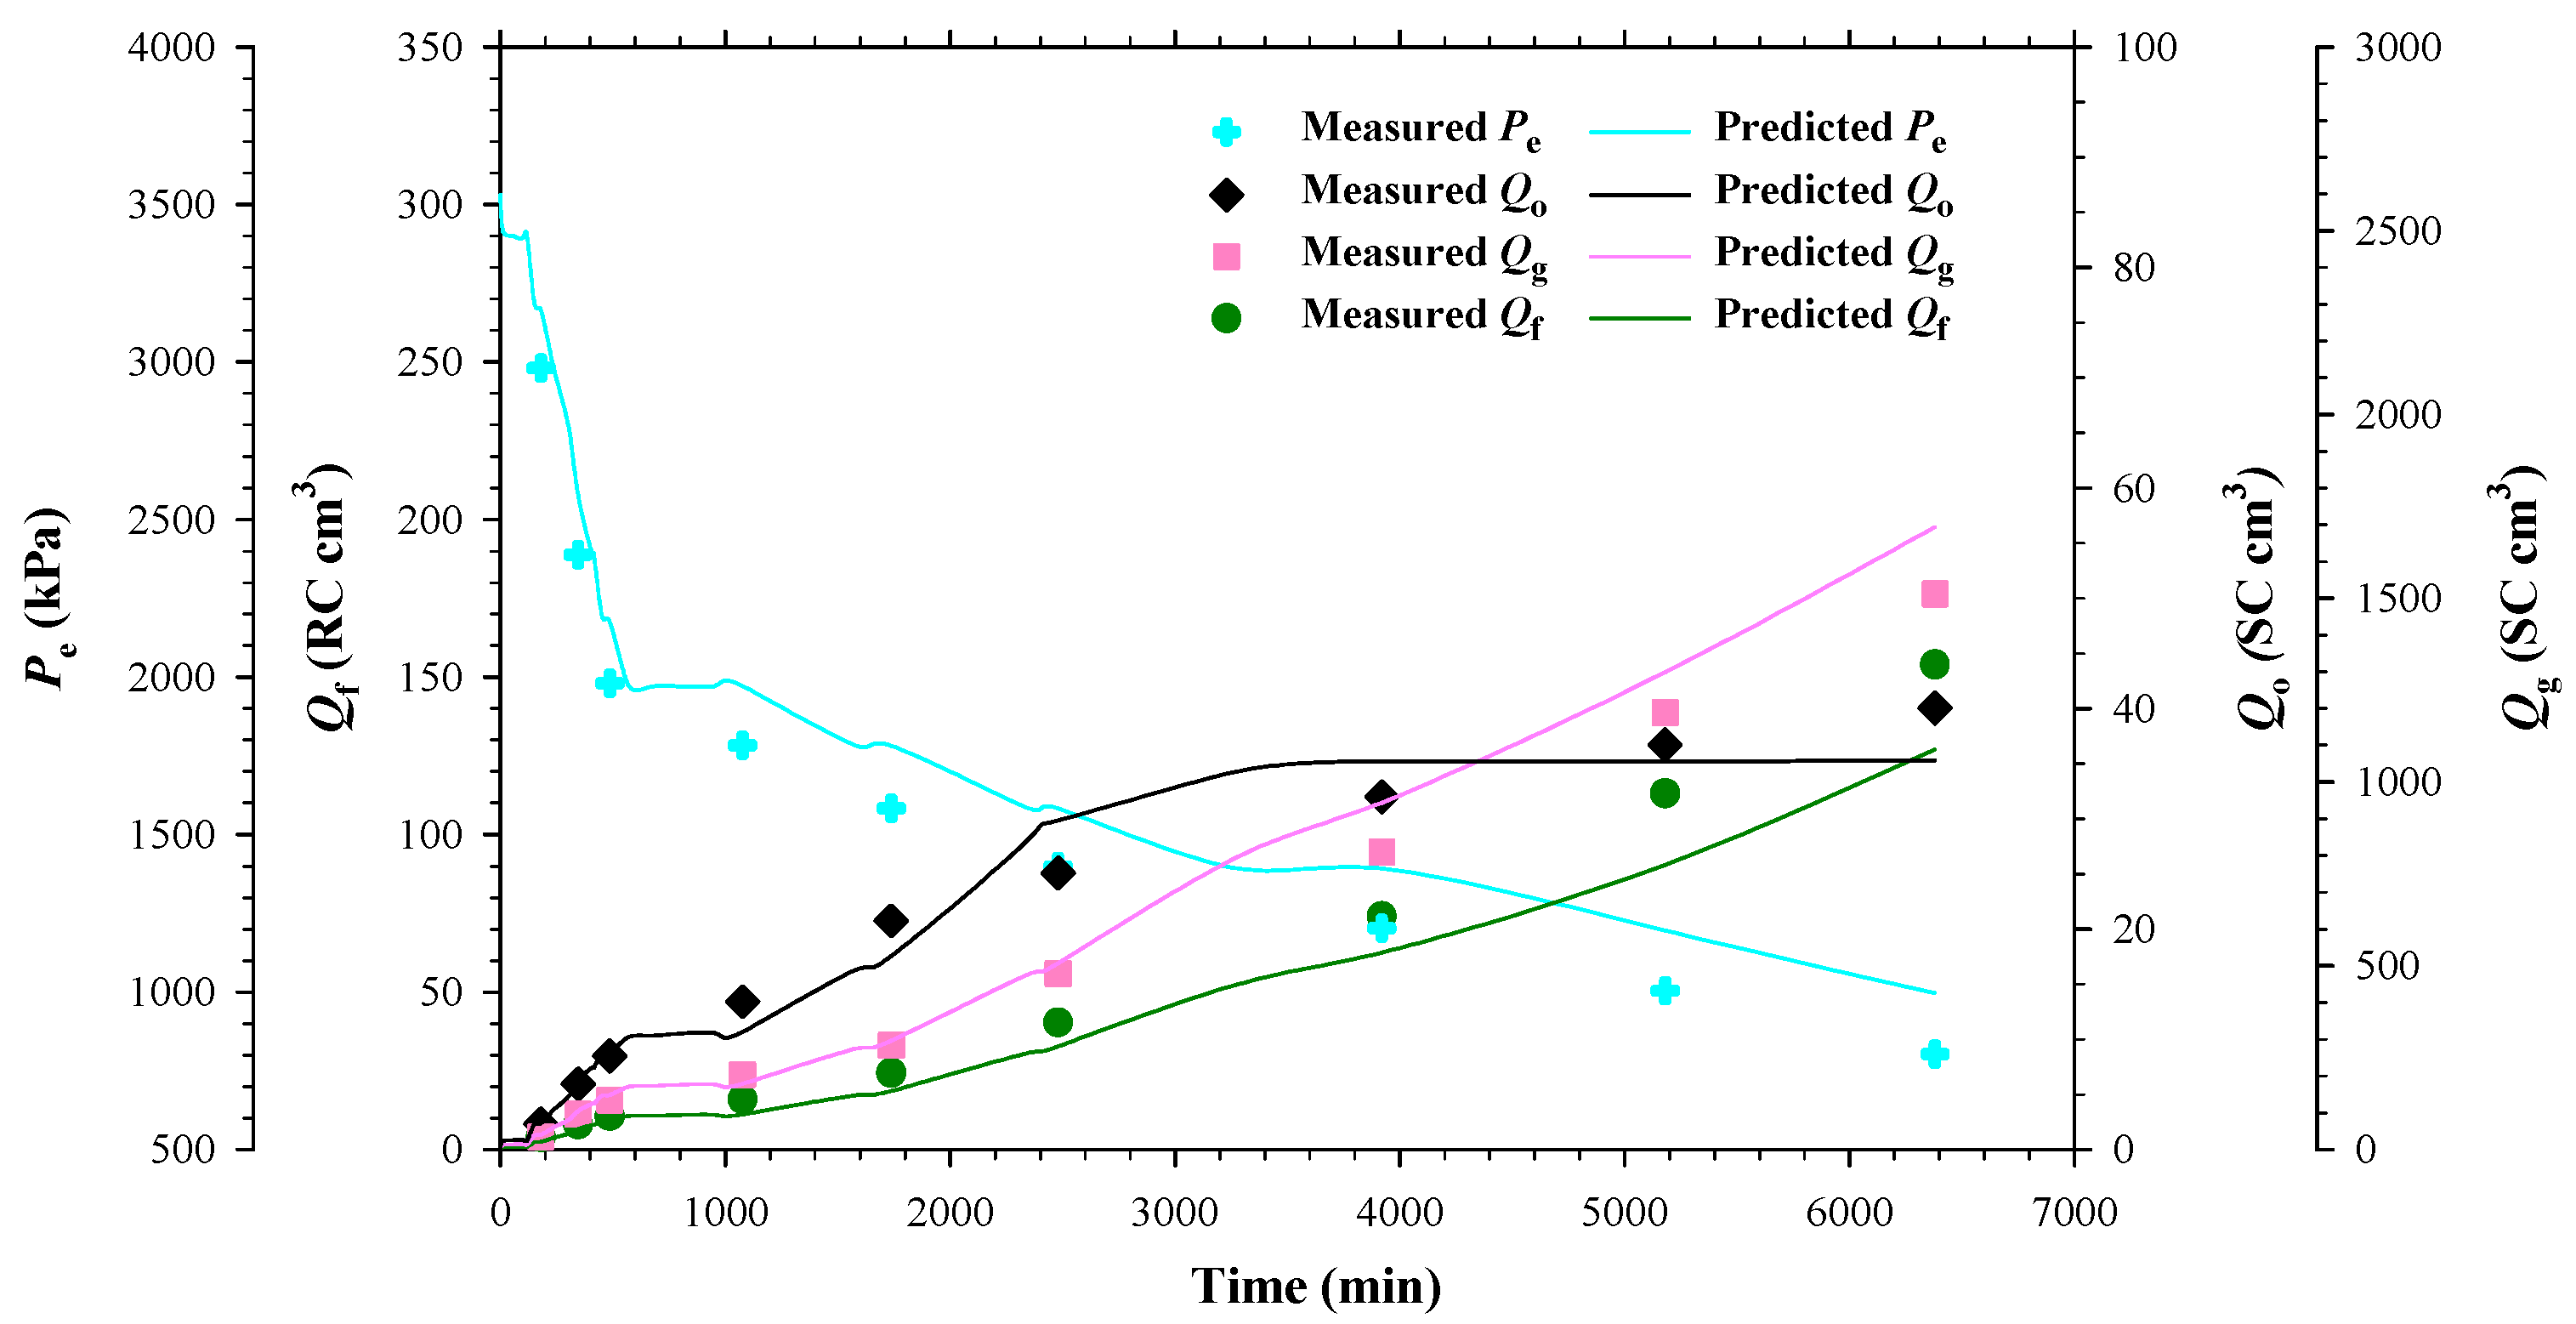
- The production data, including Ppro and Pe, were measured when the pump volume change was less than 0.12 cc within 10 min. First, the three-way valve was switched to disconnect the separator from the physical model and the produced fluids in the separator were displaced to measure the dead-oil and gas volumes (Vdo and Vg) at the atmospheric pressure. Second, the volumes of the cumulative produced fluids at the reservoir conditions (Qf), cumulative produced dead oil and gas (Qo and Qg) at the atmospheric conditions, as well as the total isothermal compressibility (ct), were measured with the following equations:
- (8)
- Each DFP test was continued by repeating Steps 6 and 7 until the production pressure reached a pre-specified ending production pressure, e.g., Ppro =0.8, 0.3, and 0.3 MPa in the heavy oil–CO2 system, heavy oil–CH4 system, and heavy oil–C3H8 system, respectively.
3. Numerical Modeling
3.1. Fluid Models
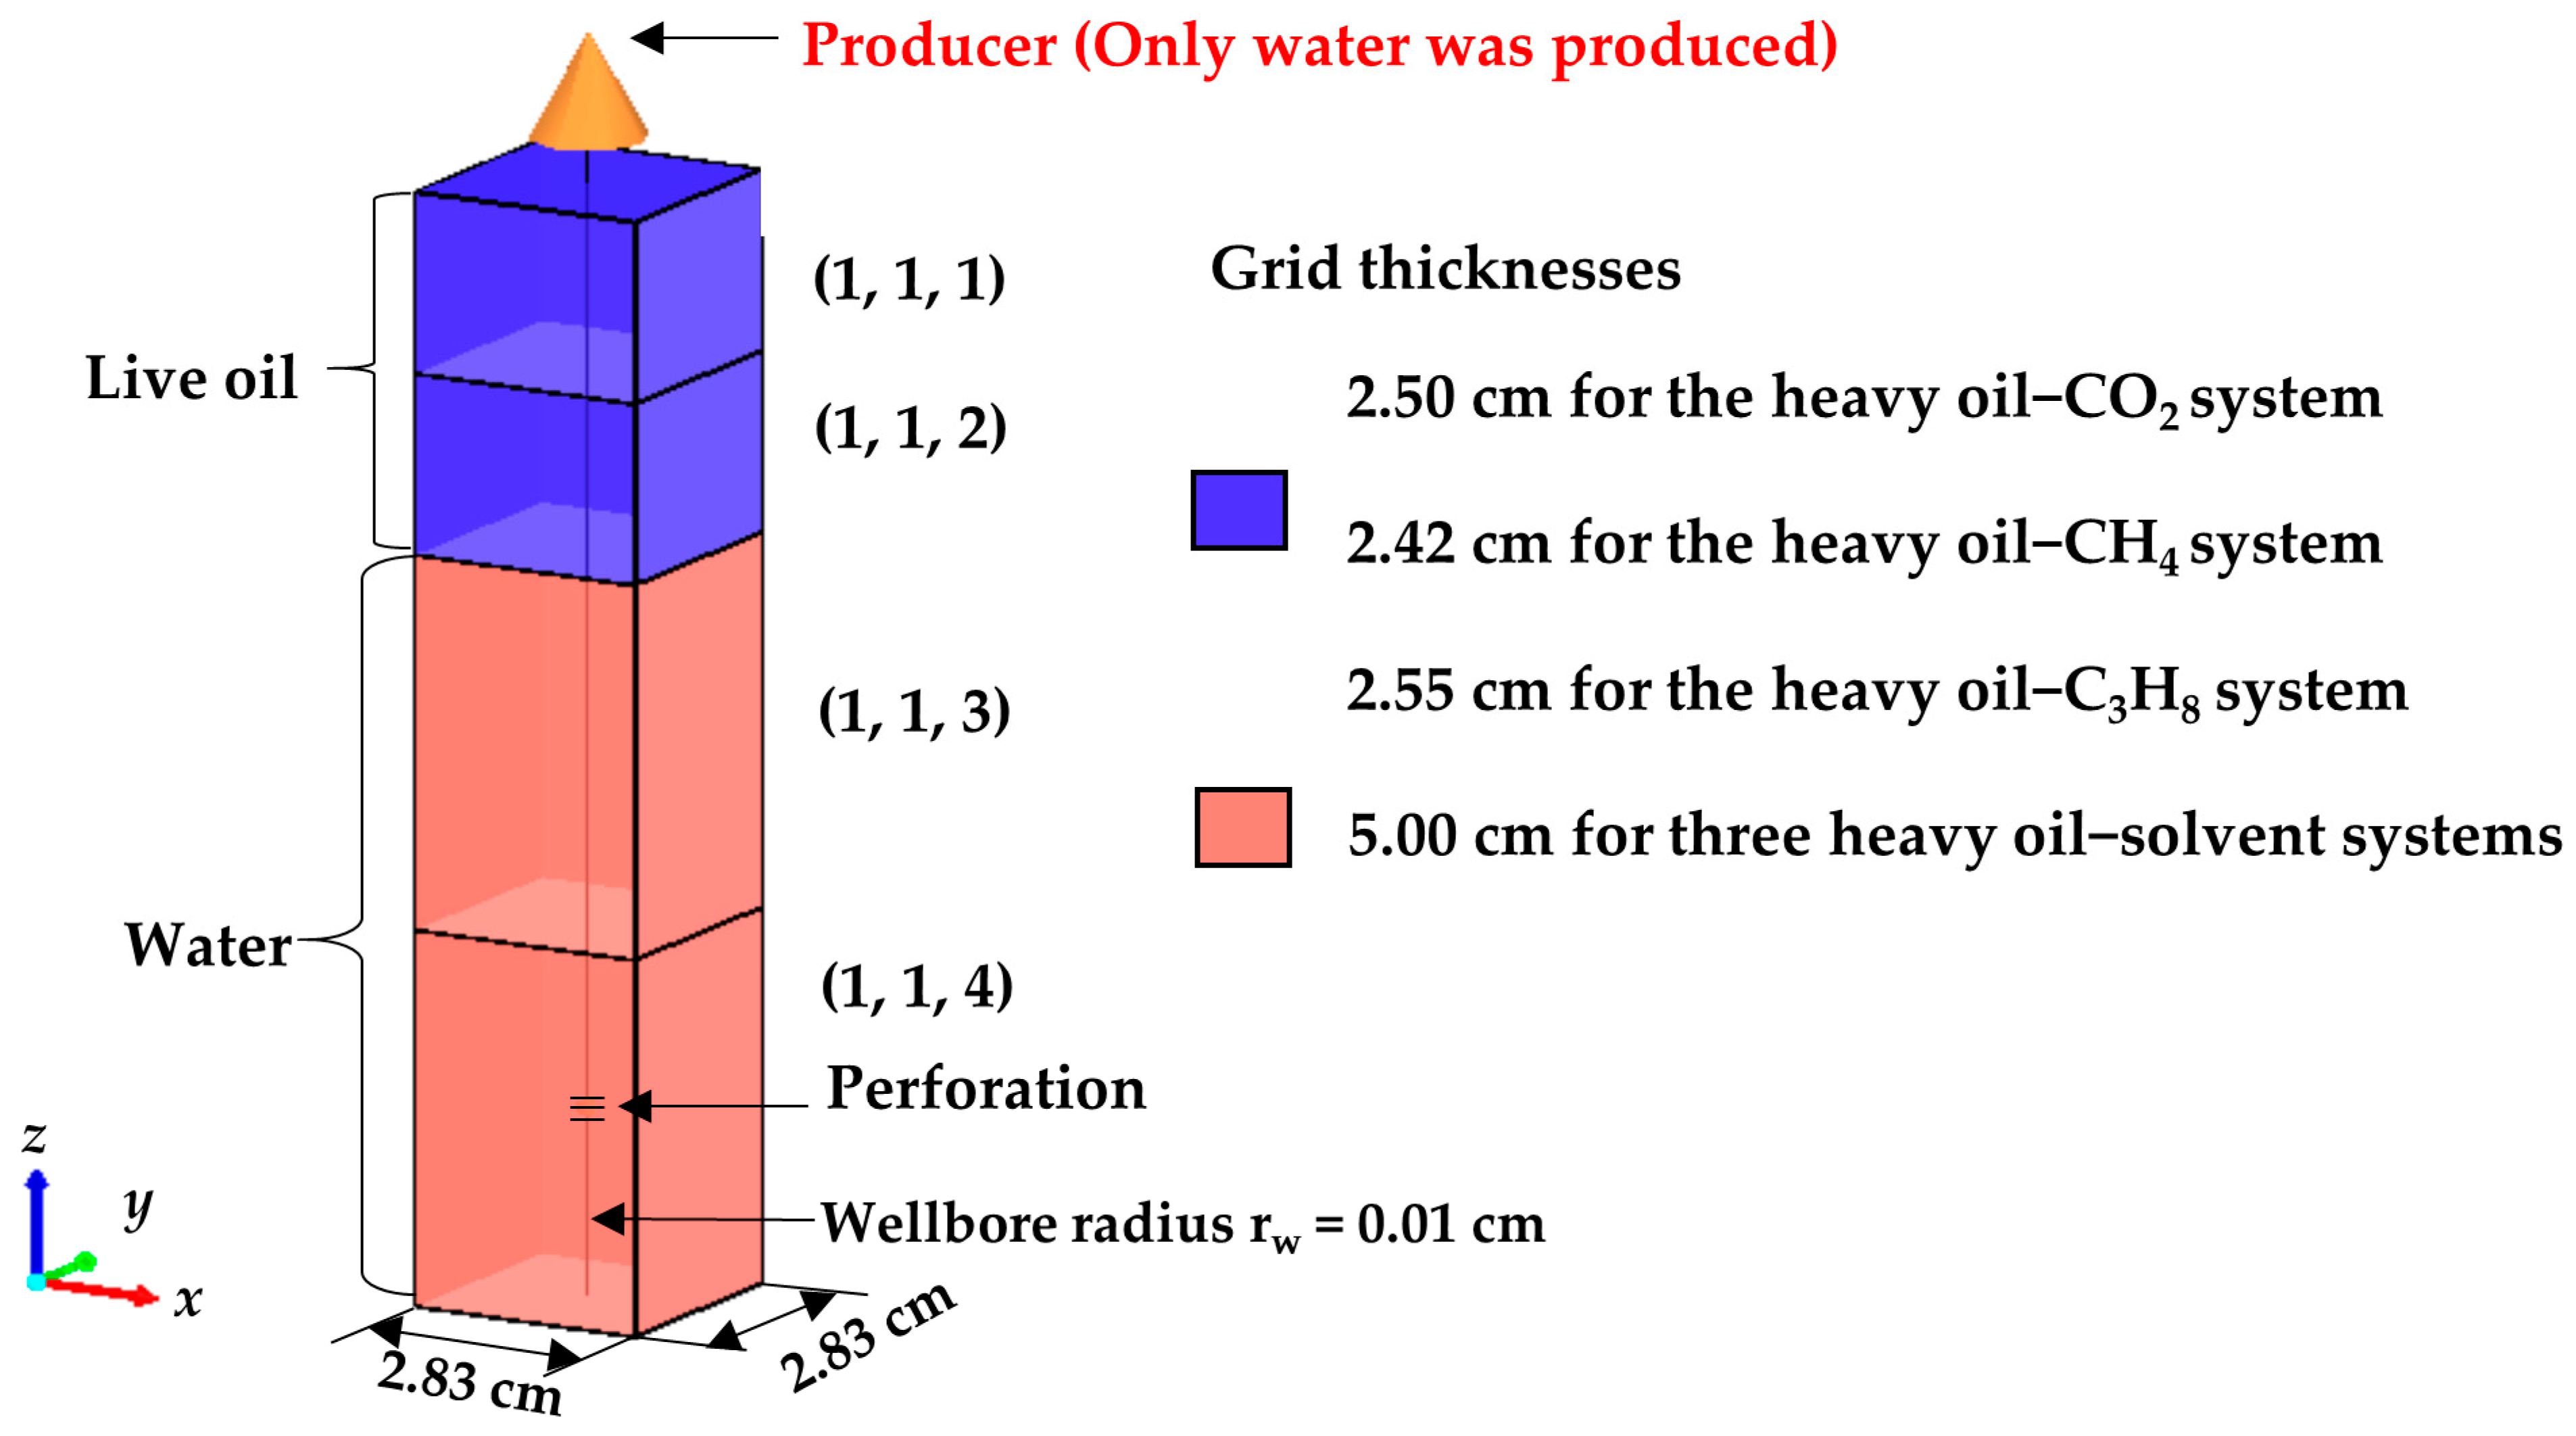
3.2. Numerical Simulations of the CCE and DFP Tests
3.3. Foamy-Oil Kinetic Reaction Model
4. Results and Discussion
4.1. Heavy Oil–CO2 System
4.2. Heavy Oil–CH4 System
4.3. Heavy Oil–C3H8 System
5. Conclusions
- The measured bubble-nucleation pressures (Pn) for the heavy oil–CO2 system, heavy oil–CH4 system and heavy oil–C3H8 system in the porous media were 0.24 MPa, 0.90 MPa and 0.02 MPa higher, respectively, than those in the bulk phases. This was because a lower supersaturation was needed for the bubble nucleation to occur in the porous media than that in the bulk phases.
- The measured total isothermal compressibility (ct) vs. test pressure (P) data in the heavy oil–CH4 system showed that the nucleation of CH4 bubbles was found to be more instantaneous than that of CO2 or C3H8 bubbles.
- Numerically, the obtained reaction frequency factors (rffe) for the gas exsolution were all higher in the tests with the porous media than those with the bulk phases for the three heavy oil–solvent systems. The higher rffe indicated that the dissolved gas was more readily to be exsolved from the heavy oil.
- The reaction frequency factors (rffl) for the gas liberation in the heavy oil–C3H8 system with the porous media was found to be lower than that for the heavy oil–CO2 system, suggesting that the former system had more stable foamy oil than that in the latter system.
- The high rffe but low rffl in the heavy oil–CH4 system with the porous media showed that CH4 was an excellent solvent for inducing and maintaining foamy oil in the porous media.
Author Contributions
Funding
Data Availability Statement
Acknowledgments
Conflicts of Interest
References
- Maini, B.B. Foamy oil flow in heavy oil production. J. Can. Pet. Technol. 1996, 35, 21–24. [Google Scholar] [CrossRef]
- Sheng, J.; Maini, B.; Hayes, R.; Tortike, W. Experimental study of foamy oil stability. J. Can. Pet. Technol. 1997, 36, 31–37. [Google Scholar] [CrossRef]
- Wang, J.; Yuan, Y.; Zhang, L.; Wang, R. The influence of viscosity on stability of foamy oil in the process of heavy oil solution gas drive. J. Pet. Sci. Eng. 2009, 66, 69–74. [Google Scholar] [CrossRef]
- Sheng, J.J.; Hayes, R.E.; Maini, B.B.; Tortike, W.S. Modelling foamy oil flow in porous media. Transp. Porous Media 1999, 35, 227–258. [Google Scholar] [CrossRef]
- Wu, M.; Lu, X.; Yang, J.; Lin, Z.; Zeng, F. Experimental analysis of optimal viscosity for optimizing foamy oil behavior in the porous media. Fuel 2020, 262, 116602. [Google Scholar] [CrossRef]
- Li, S.; Hu, Z.; Lu, C.; Wu, M.; Zhang, K.; Zheng, W. Microscopic visualization of greenhouse-gases induced foamy emulsions in re-covering unconventional petroleum fluids with viscosity additives. J. Chem. Eng. 2021, 411, 128411. [Google Scholar] [CrossRef]
- Shi, W.; Ma, Y.; Tao, L.; Zhang, N.; Ma, C.; Bai, J.; Xu, Z.; Zhu, Q.; Zhong, Y. Study of the enhanced oil recovery mechanism and remaining oil state of heavy oil after viscosity-reducer-assisted CO2 Foam flooding: 2D microvisualization experimental case. Energy Fuels 2023, 32, 18620–18631. [Google Scholar] [CrossRef]
- Sun, X.; Cai, L.; Zhang, Y.; Li, T.; Song, Z.; Teng, Z. Comprehensive investigation of non-equilibrium properties of foamy oil induced by different types of gases. Fuel 2022, 316, 123296. [Google Scholar] [CrossRef]
- Zhou, X.; Zeng, F.; Zhang, L.; Wang, H. Foamy oil flow in heavy oil–solvent systems tested by pressure depletion in a sandpack. Fuel 2016, 171, 210–223. [Google Scholar] [CrossRef]
- Li, S.; Li, Z.; Wang, Z. Experimental study on the performance of foamy oil flow under different solution gas–oil ratios. RSC Adv. 2015, 5, 66797–66806. [Google Scholar] [CrossRef]
- Zhou, X.; Yuan, Q.; Zeng, F.; Zhang, L.; Jiang, S. Experimental study on foamy oil behavior using a heavy oil–methane system in the bulk phase. J. Pet. Sci. Eng. 2017, 158, 309–321. [Google Scholar] [CrossRef]
- Tang, G.-Q.; Firoozabadi, A. Gas- and liquid-phase relative permeabilities for cold production from heavy-oil reservoirs. SPE Reserv. Evaluation Eng. 2003, 6, 70–80. [Google Scholar] [CrossRef]
- Modaresghazani, J.; Moore, R.; Mehta, S.; Anderson, M.; Badamchi-Zadeh, A. A novel method (CCE&C) to study transient phase behaviour in heavy oil and ethane. Fuel 2019, 257, 115946. [Google Scholar] [CrossRef]
- Yao, J.; Zou, W.; Gu, Y. Solvent effects on the measured bubble-point pressures and pseudo bubble-point pressures of different heavy crude oil–solvent systems. Petroleum 2022, 8, 577–586. [Google Scholar] [CrossRef]
- Dong, X.; Xi, Z.; Zadeh, A.B.; Jia, N.; Gates, I.D. A Novel Experimental Method CCEC and Modelling of Methane Dissolution and Exsolution in Heavy Oil. In Proceedings of the SPE 199942, Presented at the Canada Heavy Oil Conference, Calgary, AB, Canada, 29 September–2 October 2020. [Google Scholar]
- Shi, Y.; Zhao, W.; Li, S.; Yang, D. Quantification of gas exsolution and preferential diffusion for alkane solvent(s)–CO2–heavy oil systems under nonequilibrium conditions. J. Pet. Sci. Eng. 2021, 208, 109283. [Google Scholar] [CrossRef]
- Bauget, F.; Egermann, P.; Lenormand, R. A New model to obtain representative field relative permeability for reservoirs produced under solution-gas drive. SPE Reserv. Evaluation Eng. 2005, 8, 348–356. [Google Scholar] [CrossRef]
- Uddin, M. Numerical studies of gas exsolution in a live heavy oil reservoir. In Proceedings of the SPE 97739, Presented at the International Thermal Operations and Heavy Oil Symposium, Calgary, AB, Canada, 1–3 November 2005. [Google Scholar]
- Ivory, J.; Chang, J.; Coates, R.; Forshner, K. Investigation of cyclic solvent injection process for heavy oil recovery. J. Can. Pet. Technol. 2010, 49, 22–33. [Google Scholar] [CrossRef]
- Zhou, X.; Zeng, F.; Zhang, L.; Jiang, Q.; Yuan, Q.; Wang, J.; Zhu, G.; Huang, X. Experimental and mathematical modeling studies on foamy oil stability using a heavy oil–CO2 system under reservoir conditions. Fuel 2020, 264, 116771. [Google Scholar] [CrossRef]
- Shahvali, M.; Pooladi-Darvish, M. Dynamic modelling of solution-gas drive in heavy oils. J. Can. Pet. Technol. 2009, 48, 39–46. [Google Scholar] [CrossRef]
- Sun, X.; Zhang, Y.; Wang, S.; Song, Z.; Li, P.; Wang, C. Experimental study and new three-dimensional kinetic modeling of foamy solution-gas drive processes. Sci. Rep. 2018, 8, 4369. [Google Scholar] [CrossRef]
- Arora, P.; Kovscek, A.R. A mechanistic modeling and experimental study of solution gas drive. Transp. Porous Media 2003, 51, 237–265. [Google Scholar] [CrossRef]
- Ma, H.; Yu, G.; She, Y.; Gu, Y. A new hybrid production optimization algorithm for the combined CO2-cyclic solvent injection (CO2-CSI) and water/gas flooding in the post-CHOPS reservoirs. J. Pet. Sci. Eng. 2018, 170, 267–279. [Google Scholar] [CrossRef]
- Li, Q.; Wang, Y.; Owusu, A.B. A modified Ester-branched thickener for rheology and wettability during CO2 fracturing for im-proved fracturing property. Environ. Sci. Pollut. Res. 2019, 26, 20787–20797. [Google Scholar] [CrossRef] [PubMed]
- Li, Q.; Liu, J.; Wang, S.; Guo, Y.; Han, X.; Li, Q.; Cheng, Y.; Dong, Z.; Li, X.; Zhang, X. Numerical insights into factors affecting collapse behavior of horizontal wellbore in clayey silt hydrate-bearing sediments and the accompanying control strategy. Ocean Eng. 2024, 297, 117029. [Google Scholar] [CrossRef]
- Coombe, D.; Maini, B. Modeling Foamy Oil Flow. In Workshop on Foamy Oil Flow; Petroleum Recovery Institute: Calgary, AB, Canada, 1994. [Google Scholar]
- Bayon, Y.M.; Cordelier, P.R.; Nectoux, A. A new methodology to match heavy-oil long-core primary depletion experiments. In Proceedings of the SPE 75133, Presented at the Improved Oil Recovery Conference, Tulsa, OK, USA, 13–17 April 2002. [Google Scholar]
- Ma, H.; Huang, D.; Yu, G.; She, Y.; Gu, Y. Combined cyclic solvent injection and waterflooding in the post-cold heavy oil production with sand reservoirs. Energy Fuels 2017, 31, 418–428. [Google Scholar] [CrossRef]
- Yao, J.; Zou, W.; Gu, Y. Experimental and theoretical studies of solvent bubble nucleation and liberation processes in different heavy crude oil–solvent systems. J. Pet. Sci. Eng. 2022, 217, 110949. [Google Scholar] [CrossRef]
- Oskouei, S.J.P.; Zadeh, A.B.; Gates, I.D. A new kinetic model for non-equilibrium dissolved gas ex-solution from static heavy oil. Fuel 2017, 204, 12–22. [Google Scholar] [CrossRef]
- Brooks, R.H.; Corey, A.T. Hydraulic properties of porous media and their relation to drainage design. T ASAE 1964, 7, 26–28. [Google Scholar]
- Computer Modelling Group (CMG) Ltd. STARS Users’ Guide; Computer Modelling Group (CMG) Ltd.: Calgary, AB, Canada, 2016. [Google Scholar]
- Chen, T.; Leung, J.Y.; Bryan, J.L.; Kantzas, A. Analysis of non-equilibrium foamy oil flow in cyclic solvent injection processes. J. Pet. Sci. Eng. 2020, 195, 107857. [Google Scholar] [CrossRef]
- Wang, H.; Torabi, F.; Zeng, F. Investigation of non-equilibrium solvent exsolution dynamics and bubble formation and growth of a CO2/C3H8/heavy-oil system by micro-optical visualizations: Experimental and continuum-scale numerical studies. Fuel 2023, 332, 126188. [Google Scholar] [CrossRef]
- Albartamani, N.S.; Ali, S.F.; Lepski, B. Investigation of foamy oil phenomena in heavy oil reservoirs. In Proceedings of the SPE 54084, Presented at the International Thermal Operations and Heavy Oil Symposium, Bakersfield, CA, USA, 17–19 March 1999. [Google Scholar]
- Sahni, A.; Gadelle, F.; Kumar, M.; Tomutsa, L.; Kovscek, A.R. Experiments and Analysis of Heavy-Oil Solution-Gas Drive. SPE Reserv. Eval. Eng. 2004, 7, 217–229. [Google Scholar] [CrossRef]
- Wang, H.; Zeng, F.; Torabi, F.; Xiao, H. Experimental and numerical studies of non-equilibrium solvent exsolution behavior and foamy oil stability under quiescent and convective conditions in a visualized porous media. Fuel 2021, 291, 120146. [Google Scholar] [CrossRef]
- Bryan, J.; Butron, J.; Nickel, E.; Kantzas, A. Measurement of Non-Equilibrium Solvent Release from Heavy Oil during Pressure Depletion. In Proceedings of the SPE Canada Heavy Oil Conference, Calgary, AB, Canada, 13–14 March 2018. [Google Scholar]
- Alshmakhy, A.; Maini, B.B. Foamy-oil-viscosity measurement. J. Can. Pet. Technol. 2012, 51, 60–65. [Google Scholar] [CrossRef]
- Yang, C.; Gu, Y. Diffusion coefficients and oil swelling factors of carbon dioxide, methane, ethane, propane, and their mixtures in heavy oil. Fluid Phase Equilibria 2006, 243, 64–73. [Google Scholar] [CrossRef]



| Carbon no. | mol.% | wt.% | Carbon no. | mol.% | wt.% |
|---|---|---|---|---|---|
| C1 | 0.00 | 0.00 | C32 | 1.46 | 1.61 |
| C2 | 0.00 | 0.00 | C33 | 1.32 | 1.50 |
| C3 | 0.00 | 0.00 | C34 | 1.28 | 1.50 |
| C4 | 0.00 | 0.00 | C35 | 1.15 | 1.39 |
| C5 | 0.00 | 0.00 | C36 | 1.05 | 1.30 |
| C6 | 0.00 | 0.00 | C37 | 1.16 | 1.48 |
| C7 | 0.00 | 0.00 | C38 | 1.00 | 1.31 |
| C8 | 0.00 | 0.00 | C39 | 0.99 | 1.33 |
| C9 | 0.79 | 0.25 | C40 | 1.05 | 1.45 |
| C10 | 2.61 | 0.91 | C41 | 0.93 | 1.32 |
| C11 | 2.21 | 0.85 | C42 | 0.98 | 1.42 |
| C12 | 3.80 | 1.59 | C43 | 1.06 | 1.57 |
| C13 | 4.20 | 1.90 | C44 | 0.96 | 1.45 |
| C14 | 4.51 | 2.19 | C45 | 0.89 | 1.39 |
| C15 | 4.49 | 2.34 | C46 | 0.83 | 1.32 |
| C16 | 4.67 | 2.59 | C47 | 0.77 | 1.25 |
| C17 | 4.43 | 2.61 | C48 | 0.67 | 1.11 |
| C18 | 4.18 | 2.61 | C49 | 0.55 | 0.93 |
| C19 | 3.87 | 2.55 | C50 | 0.64 | 1.11 |
| C20 | 3.52 | 2.44 | C51 | 0.63 | 1.11 |
| C21 | 3.16 | 2.30 | C52 | 0.51 | 0.92 |
| C22 | 2.99 | 2.28 | C53 | 0.40 | 0.74 |
| C23 | 2.54 | 2.02 | C54 | 0.53 | 0.99 |
| C24 | 2.47 | 2.05 | C55 | 0.47 | 0.89 |
| C25 | 2.21 | 1.91 | C56 | 0.53 | 1.03 |
| C26 | 2.22 | 2.00 | C57 | 0.40 | 0.78 |
| C27 | 2.24 | 2.09 | C58 | 0.44 | 0.88 |
| C28 | 1.89 | 1.83 | C59 | 0.39 | 0.79 |
| C29 | 1.97 | 1.98 | C60 | 0.35 | 0.72 |
| C30 | 1.68 | 1.74 | C61+ | 8.53 | 20.85 |
| C31 | 1.43 | 1.53 | Total | 100.00 | 100.00 |
| T (°C) | ρo (g/cm3) | µo (cP) |
|---|---|---|
| 21 | 0.9920 | 33,876 |
| 30 | 0.9864 | 10,539 |
| 40 | 0.9804 | 3,980 |
| 50 | 0.9743 | 1,679 |
| 60 | 0.9681 | 795.9 |
| Properties and BIPs | Two Pseudo-Components | |
|---|---|---|
| C9–12 | C13+ | |
| Critical pressure Pc (MPa) | 2.33 | 0.69 |
| Critical temperature Tc (K) | 642.86 | 938.31 |
| Pitzer acentric factor | 0.4789 | 0.9805 |
| Molecular weight MW (g/mol) | 146.9 | 596.7 |
| BIP with CO2 | 0.12 | 0.14 |
| BIP with CH4 | 0.045 | 0.085 |
| BIP with C3H8 | 0.036 | 0.106 |
| Grid Block | Liquid Saturation and Relative Permeability | ||
|---|---|---|---|
| (1, 1, 1) and (1, 1, 2) | Sw a | krw b | krow c |
| 0 | 0 | 1 | |
| 1.0 × 10⁻⁵ | 0 | 1 | |
| 0.97999 | 0 | 1 | |
| 1 | 1 | 0 | |
| Sl d | krg e | krog f | |
| 0 | 1 | 0 | |
| 1.0 × 10⁻⁵ | 1 | 1 | |
| 0.9999 | 1 | 1 | |
| 1 | 0 | 1 | |
| (1, 1, 3) | Sw | krw | krow |
| 0 | 0 | 1 | |
| 1 | 1 | 0 | |
| Sl | krg | krog | |
| 0 | 1 | 0 | |
| 1.0 × 10⁻⁵ | 1 | 1 | |
| 0.9999 | 1 | 1 | |
| 1 | 0 | 1 | |
| (1, 1, 4) | Sw | krw | krow |
| 0 | 0 | 1.0 × 10⁻⁹ | |
| 0.1 | 1 | 0 | |
| 1 | 1 | 0 | |
| Sl | krg | krog | |
| 0 | 1.0 × 10⁻⁹ | 0 | |
| 1 | 0 | 1.0 × 10⁻⁹ | |
Disclaimer/Publisher’s Note: The statements, opinions and data contained in all publications are solely those of the individual author(s) and contributor(s) and not of MDPI and/or the editor(s). MDPI and/or the editor(s) disclaim responsibility for any injury to people or property resulting from any ideas, methods, instructions or products referred to in the content. |
© 2024 by the authors. Licensee MDPI, Basel, Switzerland. This article is an open access article distributed under the terms and conditions of the Creative Commons Attribution (CC BY) license (https://creativecommons.org/licenses/by/4.0/).
Share and Cite
Zou, W.; Gu, Y. Solvent Exsolution and Liberation from Different Heavy Oil–Solvent Systems in Bulk Phases and Porous Media: A Comparison Study. Energies 2024, 17, 2287. https://doi.org/10.3390/en17102287
Zou W, Gu Y. Solvent Exsolution and Liberation from Different Heavy Oil–Solvent Systems in Bulk Phases and Porous Media: A Comparison Study. Energies. 2024; 17(10):2287. https://doi.org/10.3390/en17102287
Chicago/Turabian StyleZou, Wei, and Yongan Gu. 2024. "Solvent Exsolution and Liberation from Different Heavy Oil–Solvent Systems in Bulk Phases and Porous Media: A Comparison Study" Energies 17, no. 10: 2287. https://doi.org/10.3390/en17102287
APA StyleZou, W., & Gu, Y. (2024). Solvent Exsolution and Liberation from Different Heavy Oil–Solvent Systems in Bulk Phases and Porous Media: A Comparison Study. Energies, 17(10), 2287. https://doi.org/10.3390/en17102287


