Article

Monte Carlo Simulation of the CO2 Flooding Efficiency at a Core Scale for Different Oil Compositions

by
Anna Andreeva
*,† and
Andrey Afanasyev
Institute of Mechanics, Lomonosov Moscow State University, 1 Michurinskiy Prospekt, 119192 Moscow, Russia
*
Author to whom correspondence should be addressed.
These authors contributed equally to this work.
Energies 2024, 17(10), 2259; https://doi.org/10.3390/en17102259
Submission received: 10 April 2024 / Revised: 24 April 2024 / Accepted: 6 May 2024 / Published: 8 May 2024
(This article belongs to the Section H1: Petroleum Engineering)

Abstract

:
The evaluation of water-alternating-gas (WAG) efficiency and profitability is complicated by a large number of reservoir, operating, and economic parameters and constraints. This study aims at understanding the influence of the oil composition on different WAG injections. By employing compositional reservoir modeling and the Monte Carlo method to characterize the diversity of oils occurring in nature, we simulate the microscopic displacement efficiency of CO2 flooding when it is applied to both light- and heavy-oil reservoirs. We find that the economic performance of WAG in both miscible and immiscible scenarios is mainly characterized by the dimensionless injection rate and the oil density at surface conditions. Neither the bubble point pressure nor the minimum miscibility pressure can be used for the quantification of the optimal WAG parameters. We present our estimates of the best strategies for the miscible and immiscible injections and verify some of our previous results for randomly sampled oils. In particular, we demonstrate that CO2 flooding is better to apply at higher-dimensionless injection rates. We show that the injection of CO2 organized at a light-oil reservoir results in a higher profitability of WAG, although this comes at the cost of lower carbon storage efficiency.

1. Introduction

The Carbon Capture, Utilization, and Storage (CCUS) in depleted petroleum reservoirs is often regarded as a robust method for mitigating climate change [1,2,3]. It involves the injection of greenhouse gases, especially anthropogenic CO2, into the subsurface for the purpose of sequestration and the emission reductions. Millions of tons of CO2 can therefore be stored in specific reservoirs, which is of great importance to large economies aiming at carbon neutrality [4,5]. Besides solving the environmental problem, the injection of CO2 can be also utilized with additional benefits of enhanced oil recovery (EOR). It can be applied at the late stages of a field development to increase production from depleted reservoirs [6,7,8,9,10]. If oil recovery is considered a primary goal, then the economic evaluation of the involved processes is also relevant given that the cost of the CO2 injection is several times larger than that of water. The economic model of the CO2 flooding is necessary to maximize its profitability and optimize the field operations [11,12].
CO2 flooding can be a robust method that results in a substantial increase in oil recovery because CO2 is a good solvent [13,14]. A large volume of CO2 can be dissolved in residual oil, causing its swelling, a viscosity reduction, and wettability alteration. The injection of CO2 thus improves oil recovery by miscibility. Therefore, oil composition can play a substantial role in CO2–EOR performance because it greatly influences the miscibility and exchange of components between the gas and oil phases [6,15,16,17]. Certainly, miscibility is just a relevant phenomenon among others influencing CO2-EOR efficiency that, for instance, can further be improved by the foaming agents [18].
There are several distinct methods of CO2 flooding. The huff and puff process [19,20], the CO2 foam injection [21,22], and the water-alternating-gas (WAG) injection [16,23,24,25] method are among the most well known. The latter approach is based on alternating periods of continuous water and gas injection through one group of wells and the oil extraction through another group of wells. The performance of WAG depends on many factors, and the noted role of the oil composition is just one of them. The CO2 injection can be compromised by a poor sweep efficiency E s that is often estimated by
E s = E d E v E a ,
where E d , E v , and E a are the microscopic displacement efficiency, the volumetric sweep efficiency, and the areal sweep efficiencies, respectively [26,27]. The efficiency of WAG can be compromised by low E v and E a due to the gravity override and channeling that causes an early breakthrough of injected gas to the producing wells [6,15,22,28,29]. Thus, E v and E a are mainly controlled by the reservoir heterogeneity and the wells spacing [25,30,31]. The influence of the oil composition and the miscibility effects, on the contrary, are mostly controlled by the quantity E d . The minimum miscibility pressure (MMP) is widely acknowledged as a relevant parameter influencing E d [32]. It is generally desirable to implement miscible CO2 flooding, i.e., at a reservoir pressure larger than MMP, rather than immiscible flooding. The compositional modeling is widely employed to estimate E d , E v , and E a [16,28,29,33,34], whereas E d can also be evaluated in the slim-tube experiments [35,36,37,38,39,40].
In this study, we want to revisit the problem of CO2–EOR performance by presenting our results on the role of the oil composition. Previously, we have proposed a concept of the dimensionless injection rate Ω characterizing both the physical rate of the fluid injection and some economic parameters [34]. This quantity allows for an easy scaling of the estimated performance of WAG from the laboratory up to the reservoir scale. The concept was validated against a fixed oil composition consisting of just three components CH4, C6, and C16 [34]. As such, its applicability to more realistic light and heavy oils in both miscible and immiscible injections remains questionable. We now aim at presenting a more general result showing that the concept, albeit with some corrections, is also working for various light, medium, and heavy oils. In particular, we want to demonstrate that the performance of any WAG injection strategy in terms of E d is characterized by Ω and the density of oil at surface conditions, whereas other parameters, e.g., the bubble point pressure or the presence of various hydrocarbon groups, are much less relevant.
This article is organized as follows. In Section 2, we present the 1-D problem, which is similar to a slim-tube experiment for estimating E d . In Section 3, we give an overview of the governing equations employed in the compositional modeling of WAG and the economic estimates of its profitability. In Section 4, we discuss our method of analysis based on the Monte Carlo sampling of E d for random oil compositions. In Section 5, we present the results of our reservoir simulations for various injection rates Ω and oil compositions. We end the article with a discussion and conclusions. In Appendix A, we show that the results of our 1-D study are useful in estimating the WAG efficiency in a more complicated 3-D scenario.
Within the context of the field applications, we show that implementing CO2–EOR at a reservoir of more light oil can generally increase the oil recovery efficiency but at a cost of larger volumes of CO2 being extracted back to the surface with the produced oil.

2. Problem Statement

2.1. Overview

We consider a 1-D study of the three-phase, oil–water–gas flow similar to that in a slim-tube experiment [18,36,37,38,40,41]. The domain x [ 0 , L ] is filled with a uniform porous medium of a given porosity ϕ and permeability k (Figure 1). At the initial moment of time, t = 0 , it is saturated with oil at the connate water saturation. The reservoir temperature T is assumed fixed at 60 °C. Either water or CO2 is injected into the reservoir through its boundary x = 0 . The periods and volumes of the injected fluids are discussed below. The opposite boundary of the domain, x = L , is opened so that the fluid can be drained out of the plug as the result of injection. The initial reservoir pressure, P 0 = 250 bar, is kept constant at that boundary. The injection through the boundary, x = 0 , causes the fluid flow to evolve in the direction of axis x. The oil is displaced to the boundary x = L by the injected water and gas. At some point in time, water and gas breakthrough to x = L and are withdrawn out of the reservoir. We generally are interested in finding the best injection strategy that, in some sense, can maximize the profit of the oil recovery. As such, we aim at maximizing the economic performance of WAG.

2.2. Oil Composition

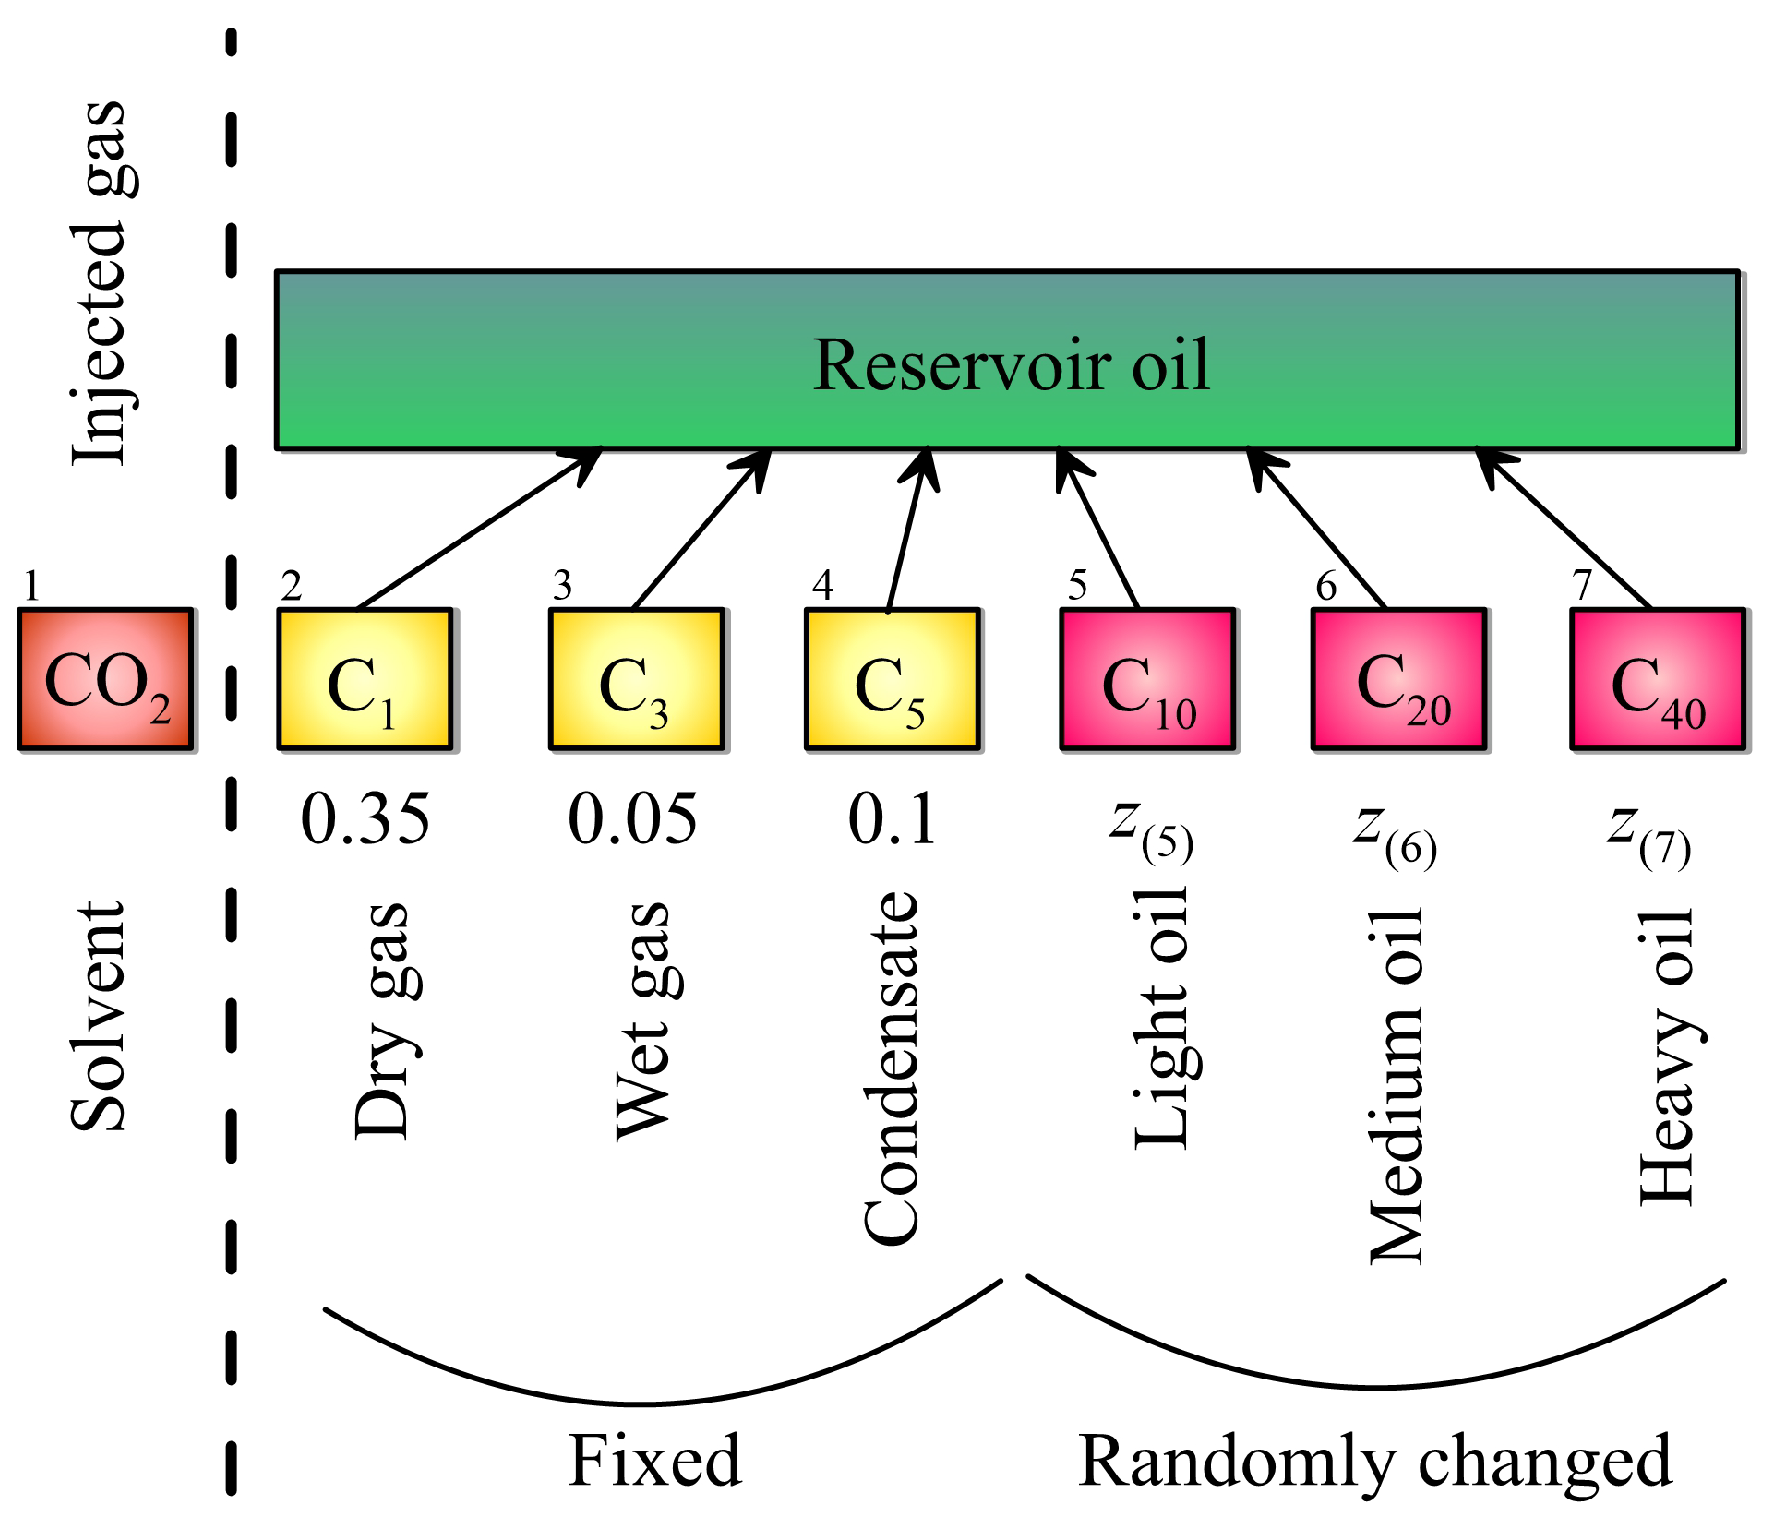
We simulated the original reservoir oil as a fluid composed of six groups of hydrocarbons named C1, C3, C5, C10, C20, and C40 (Figure 2). The C1 and C3 components are methane (CH4) and propane (C3H8). They correspond to the dry and wet gas components dissolved in oil, respectively. They are gases at the standard conditions. Group C5 corresponds to the gas condensate, which, at boiling temperature at the atmospheric pressure P atm , is low but just above the standard temperature (≈310 K) [42]. If the temperature increases above that value, then the C5 component evaporates at P = P atm . The other three components C10, C20, and C40 model the groups of light, medium, and heavy liquid hydrocarbons, of which the boiling temperatures are near 439 K, 611 K, and 795 K, respectively. The fluid is simulated using the corrected Peng-Robinson equation of state with the volume shift [43,44], and the noted groups Ci were assumed to be the normal alkanes CiH2i+2. Certainly, using other alkanes of similar molecular weight as a substitute for C10, C20, and C40 will not influence further conclusions.
The injection of CO2 causes the gas to mix with the original reservoir oil (Figure 2). Therefore, we employed the seven-component compositional simulations of WAG, where the first fluid component was CO2 and the other six components were the listed hydrocarbon groups [45]. They are numbered from the second to the seventh components of the fluid. We assumed that CO2 was absent in the original reservoir oil. Its bulk molar concentration, thus, was zero at t = 0 , i.e., z ( 1 ) = 0 .
Unless otherwise stated, we fixed the bulk molar concentrations of the C1, C3, and C5 components in the original oil at z ( 2 ) = 0.35 , z ( 3 ) = 0.05 , and z ( 4 ) = 0.1 , respectively. Thus, the bulk concentrations of the three remaining components must sum up to 0.5, i.e.,
z ( 5 ) + z ( 6 ) + z ( 7 ) = 0.5 .
We considered different reservoir oils by varying z ( 5 ) , z ( 6 ) , and z ( 7 ) in a way that Equation (2) was satisfied. If we specify a larger z ( 5 ) , and so, a lower z ( 7 ) , then we can obtain an oil of lower density. On the contrary, if we specify a larger concentration of C40 (i.e., z ( 7 ) is larger), then we obtain a heavier oil.
We further employed the concept of random sampling and the Monte Carlo method to evaluate the influence of the oil composition on the efficiency of CO2 flooding. We took three random quantities, ξ ( 5 ) , ξ ( 6 ) , and ξ ( 7 ) , with the uniform distribution in the range from zero to one ( 0 ξ ( i ) 1 , i = 5 , 6 , 7 ). Then, for every set of random numbers ξ ( i ) , we calculated z ( i ) using the relation
z ( i ) = 0.5 ξ ( i ) ξ ( 5 ) + ξ ( 6 ) + ξ ( 7 ) , i = 5 , 6 , 7 .
According to the definition in Equation (3), the relation in Equation (2) holds. Thus, we can obtain various reservoir fluids, including light and heavy oils, by randomly changing ξ ( i ) .

2.3. Injection Strategies

We aimed at considering and comparing different injection strategies characterized by different periods of CO2 and water injection. We assumed, in this study, that the volume injection rate Q was constant, and it was measured under the initial reservoir pressure P 0 . With increasing time, every injection period k = 1 , 2 , 3 , in the sequence was thus characterized by its duration Δ t k or the volume of the fluid injection during that period V k = Q Δ t k . This is equivalent to specifying the injected pore volume for every such period
PVI = V V h c , PVI k = V k V h c ,
where V = Q t is the cumulative volume of water and CO2 injected up to the time t, V h c is the initial hydrocarbon pore volume, and the dimensionless quantity PVI is the number of injected pore volumes.
We generally concentrated on just five injection strategies (Table 1). Strategy W corresponds to the waterflooding. It consists of a single period of water injection. Strategy G corresponds to continuous gas injection. It consists of a single period of CO2 injection. In fact, we did not need to specify PVI1 for Strategies W and G because they assume a continuous injection of either water or CO2 at 0 t < (Figure 1).
Strategy WG corresponds to the tertiary method of oil recovery. Here, the initial period of waterflooding is followed by the period of gas injection (Figure 1). It is similar to the application of the CO2–EOR method at a late stage of waterflooding. Strategy WG is characterized by the volume of the initial water slug, i.e., by PVI1. Strategy GW corresponds to the opposite sequence. It begins with the period of CO2 injection that, again, is characterized by PVI1. This initial CO2 slug is then followed by waterflooding. Strategy GW is thus based on gas injection as a primary recovery method.
Strategy 2(WG)W contains two identical WAG cycles. Equal volumes of water and equal volumes of CO2 are injected in each such cycle, i.e., PVI 1 = PVI 3 and PVI 2 = PVI 4 . Such a strategy is thus characterized by just two parameters, i.e., the sizes of the water and CO2 slugs in the cycling.

3. The Governing Equations

3.1. Balance Equations

For modeling oil displacement, we implemented the standard compositional model based on a cubic equation of state for predicting the fluid phase equilibria in the hydrocarbon mixture [45].Water was assumed an immiscible with other components. It forms a separate liquid phase.
We formulated the mass conservation equation for each fluid component [45,46,47] as follows:
t ϕ i = g , o ρ i c i ( j ) s i + x i = g , o ρ i c i ( j ) u i = 0 , j = 1 n ,
t ϕ ρ w s w + x ρ w u w = 0 ,
where ϕ is the porosity, ρ is the density, c i ( j ) is the jth component mass fraction in the ith phase, s is the saturation, u is the Darcy velocity, and the subscripts g, o, and w denote the parameters of gas, oil, and water, respectively. Equation (5) is the mass balance equations for the jth component, where j = 1 n and n = 7 are the number of the fluid components modeled by the Peng-Robinson equation of state (Figure 2). Equation (6) is the mass balance equation for water.
We employed Darcy’s law to relate the velocity of each phase with the pressure gradient
u i = k k r i μ i P x , i = g , o , w ,
where k is the absolute permeability, k r i is the relative permeability of the ith phase, μ is the dynamic viscosity, and P is the pressure. According to Equation (7), we neglect the capillary pressure by assuming equal pressure in all phases.
The pressure difference Δ P between the opposite ends of the core plug ( x = 0 and x = L in Figure 1) can be estimated as
Δ P = Q μ L k ,
where μ is the average fluid viscosity. According to Equation (8), Δ P is inversely proportional to k. In what follows, we intentionally chose a large k such that Δ P did not exceed 0.1 bar. Therefore, the pressure changes did not significantly influence the phase equilibria that can be considered at P 0 = 250 bar (although the influence is still accounted for in the numerical modeling). This assumption is similar to that applied in the method of characteristics [13,23].
We used the following Corey curves for the water–oil and gas–oil relative permeability [48]:
k r w ( s w ) = s w s w c 1 s w c 2.25 , k r o w ( s w ) = 0.8 1 s w s o r 1 s w c s o r 2.75 ,
k r g ( s g ) = 0.74 s g 1 s w c 1.8 , k rog ( s g ) = 0.8 1 s g s w c s o r 1 s w c s o r 2.75 ,
where s w c = 0.16 is the connate water saturation and s o r = 0.24 is the residual saturation of oil. The coefficients in Equations (9) and (10) were chosen to match the saturation functions employed in the third SPE comparative study [49]. We applied a volume-averaged approximation for the three-phase relative permeability of the oil:
k r o = ( s w s w c ) k row ( s w ) + s g k rog ( s g ) s w s w c + s g .

3.2. Equations of State

We employed the standard compositional model and assumed that the water phase was incompressible ( ρ w = const ) and had a constant viscosity ( μ w = 0.45 cP). The water evaporation into the gas phase, as well as the hydrocarbon component dissolution in the water phase, were neglected. Thus, water forms a separate phase that is immiscible with the other phases.
For modeling the phase equilibria in the hydrocarbon fluid, we implemented the Peng-Robinson equation of state with the volume shifts [43,44]. We used a standard library of the EoS and binary interaction coefficient [42]. Using the equation of state, we can calculate all fluid parameters entering Equations (5)–(7), including ρ i , c i ( j ) , and s i . For predicting the viscosity of oil and gas, we used the Lorentz–Bray–Clark correlation [50].
The rock matrix was assumed to be incompressible, so that ϕ = const and k = const .

3.3. Economic Model

To compare the profitability of the injection strategies discussed in Section 2.3, we calculated the net present value. We defined the cash flow as [46]
R = r o q o r w i q w i r w p q w p r g i q g i r g p q g p ,
where r o q o is the revenue term associated with the oil sales and all other terms correspond to the operating expenses. Here, q o is the volumetric oil production rate at the surface conditions after the single-stage separation to the standard pressure and temperature, q w i and q w p are the water injection and production rates, respectively, and q g i and q g p are the injection and production rates of gas, respectively. The quantity r o is the net revenue for selling a unit volume of oil after operating deductions, taxes, and royalties. The other quantities r in the negative terms in Equation (12) are the operating costs. The parameters r w i and r w p are the injection and production costs for water, and r g i and r g p are those for CO2. The parameters r are summarized in Table 2. Here, we use a fixed r o . The sensitivity of our estimates to the changes in oil price were evaluated in [34].
Using Equation (12), we define the net present value by
J = 0 t R ( t ) ( 1 + D ) t t d s d t ,
where D = 0.1 is the discount rate, t d s = 1 yr is the discount period, and the prime denotes the variable of integration.
When optimizing CO2 flooding, we searched for the maximum of J among all the injection strategies and over all production times, i.e.,
J ( t ) max at 0 t < .
The strategy that allowed us to reach the maximum of the net present value at the yet unknown production time t was considered the most efficient, i.e., the most profitable.

3.4. Dimensionless Variables

The formulated problem involves two characteristic time scales. The first scale t h c is required to inject one pore volume V h c . If the injection rate Q is constant, then t h c can be expressed as
t h c = V h c Q .
The other time scale t d s is the discount period. Certainly, the case of a smaller t h c when compared to t d s is more preferable because the cash flow is then less reduced by the discounting. Thus, we can expect that using a larger injection rate generally causes the net present value to be higher. In our previous study [46], we showed that the relative role of these time scales was characterized by just one similarity criterion
Ω = Q t d s V h c log ( 1 + D ) .
The quantity Ω can be regarded as the dimensionless injection rate. According to Equation (16), parameter Ω is indeed proportional to Q.
Using the definition in Equation (16), it is convenient to introduce the dimensionless time τ by the relation
PVI = Ω τ .
It is natural that, according to Equation (17), the cumulative injection volume equals the injection rate Ω times the dimensionless time τ .
Also, we introduce the dimensionless net present value [46]
NPV = J G ,
where G is the theoretical maximum of the total revenue that can be reached by selling all oil-in-place at t = 0 without any expenses for the injection and production operations.
Further, we will formulate the results of our study in the dimensionless variables NPV, PVI, Ω , and τ , which ease their scaling from the considered microscopic plug scale up to the reservoir scale.

4. Methods

As noted, we optimize the WAG injection into the reservoirs saturated with the fluids of various compositions. By using the random Monte Carlo sampling [53], we aimed at understanding the statistical properties of the optimal WAG injections.
Let us, in detail, discuss the implemented sampling method. At every step of the Monte Carlo method, we first generated a new oil composition. This was conducted by the random quantities ξ ( i ) , i = 5 , 6 , 7 and Equation (3). Then, we specified the injection rate Ω and chose the injection strategy X, which is one of W, G, WG, GW, or 2(WG)W (Table 1). We specified the initial guess for PVIk for every slug in the chosen strategy. For the specified parameters, we then ran the compositional simulation of the oil recovery from the core plug and found the moment of time PVI* (or τ * ) corresponding to the maximum of NPV for the particular values of PVIk. Certainly, this maximum depends on the size PVIk of the CO2 and water slugs. To determine the absolute maximum of NPV, we ran an optimization algorithm that finds the optimal values of PVIk corresponding to the absolute maximum of NPV. This is an iterative algorithm based on stochastic and gradient methods of optimization [54]. It requires several tens of the compositional simulations. Hence, the algorithm results in the optimized strategy X for a given oil composition and injection rate Ω . We wanted to emphasize that optimizing Strategies W and G does not require any iterative optimization algorithm because they concern a continuous injection of either water or CO2. They are characterized by a single slug of fluid, of which the duration can be found in the course of just one compositional simulation by calculating the current value of NPV at the end of each time step and choosing the moment of time PVI* when NPV reaches the maximum.
If we aim at finding the optimal strategy among all the considered injection strategies listed in Table 1, then the described procedure must be repeated several times for every such strategy of interest (of which there are five in total). The optimal strategy for a given oil composition is then characterized with the maximum of NPV over all strategies. In the Monte Carlo method, the described optimization procedure is repeated many times for every sampled oil composition. Hence, we estimated NPV for an ensemble of oils, i.e., the statistic average of the maximum of NPV.
The reservoir simulations of WAG were conducted with our MUFITS reservoir simulator [46,55]. For the discussed 1-D study, the grid resolution was 250 blocks for the whole core plug 0 x L . We set up the software to use the fully implicit method with the upwind approximation of the fluxes. Monte Carlo modeling and the optimization were performed in an automated fashion by using a simulation control program that changes the fluid composition and other injection parameters, as well as processes the simulation output.

5. Results

5.1. Simulated Oil Properties

We first discuss the parameters of the oils obtained by the random changing of the quantities ξ ( i ) in Equation (3). The density of oil after the one-stage separation to the standard conditions ρ o s c varied in the range from 760 to 920 kg/m3 (Figure 3). The light oils generally correspond to a low concentration z ( 7 ) and a higher concentration of z ( 5 ) in the reservoir fluid. The heavy oils are characterized by a significant concentration of the C40 component.
It is worth noticing that, for the following presentation, the bubble point pressure, P bub , does not exhibit any pronounced dependence on the oil density ρ o s c (Figure 3a). Indeed, the general trend was that the bubble point pressure decreases with ρ o s c [56]. However, the simulated values of P bub were significantly scattered for any fixed ρ o s c . Thus, there was no one-to-one correspondence between P bub and ρ o s c .
As shown in Figure 3b, we plotted the simulated minimum miscibility pressure (MMP) against ρ o s c . We employed the concept of dynamic MMP that is useful for describing the miscibility behavior for the considered oils. To evaluate the dynamic MMP, we plotted the phase diagram of the oil mixed in various proportions with the injected gas. Consider the case when we take ν moles of the original reservoir oil ( 0 ν 1 ) and 1 ν moles of the injected CO2. We then place these fluids in contact, e.g., in a PVT cell, and wait until the fluid phase equilibrium is reached. We assume that the cell is kept under the reservoir temperature and a given pressure P that can differ from the initial reservoir pressure P 0 . The parameters of the equilibrium can simply be calculated by the standard flash calculation that is based on the assumption of thermodynamic equilibrium.
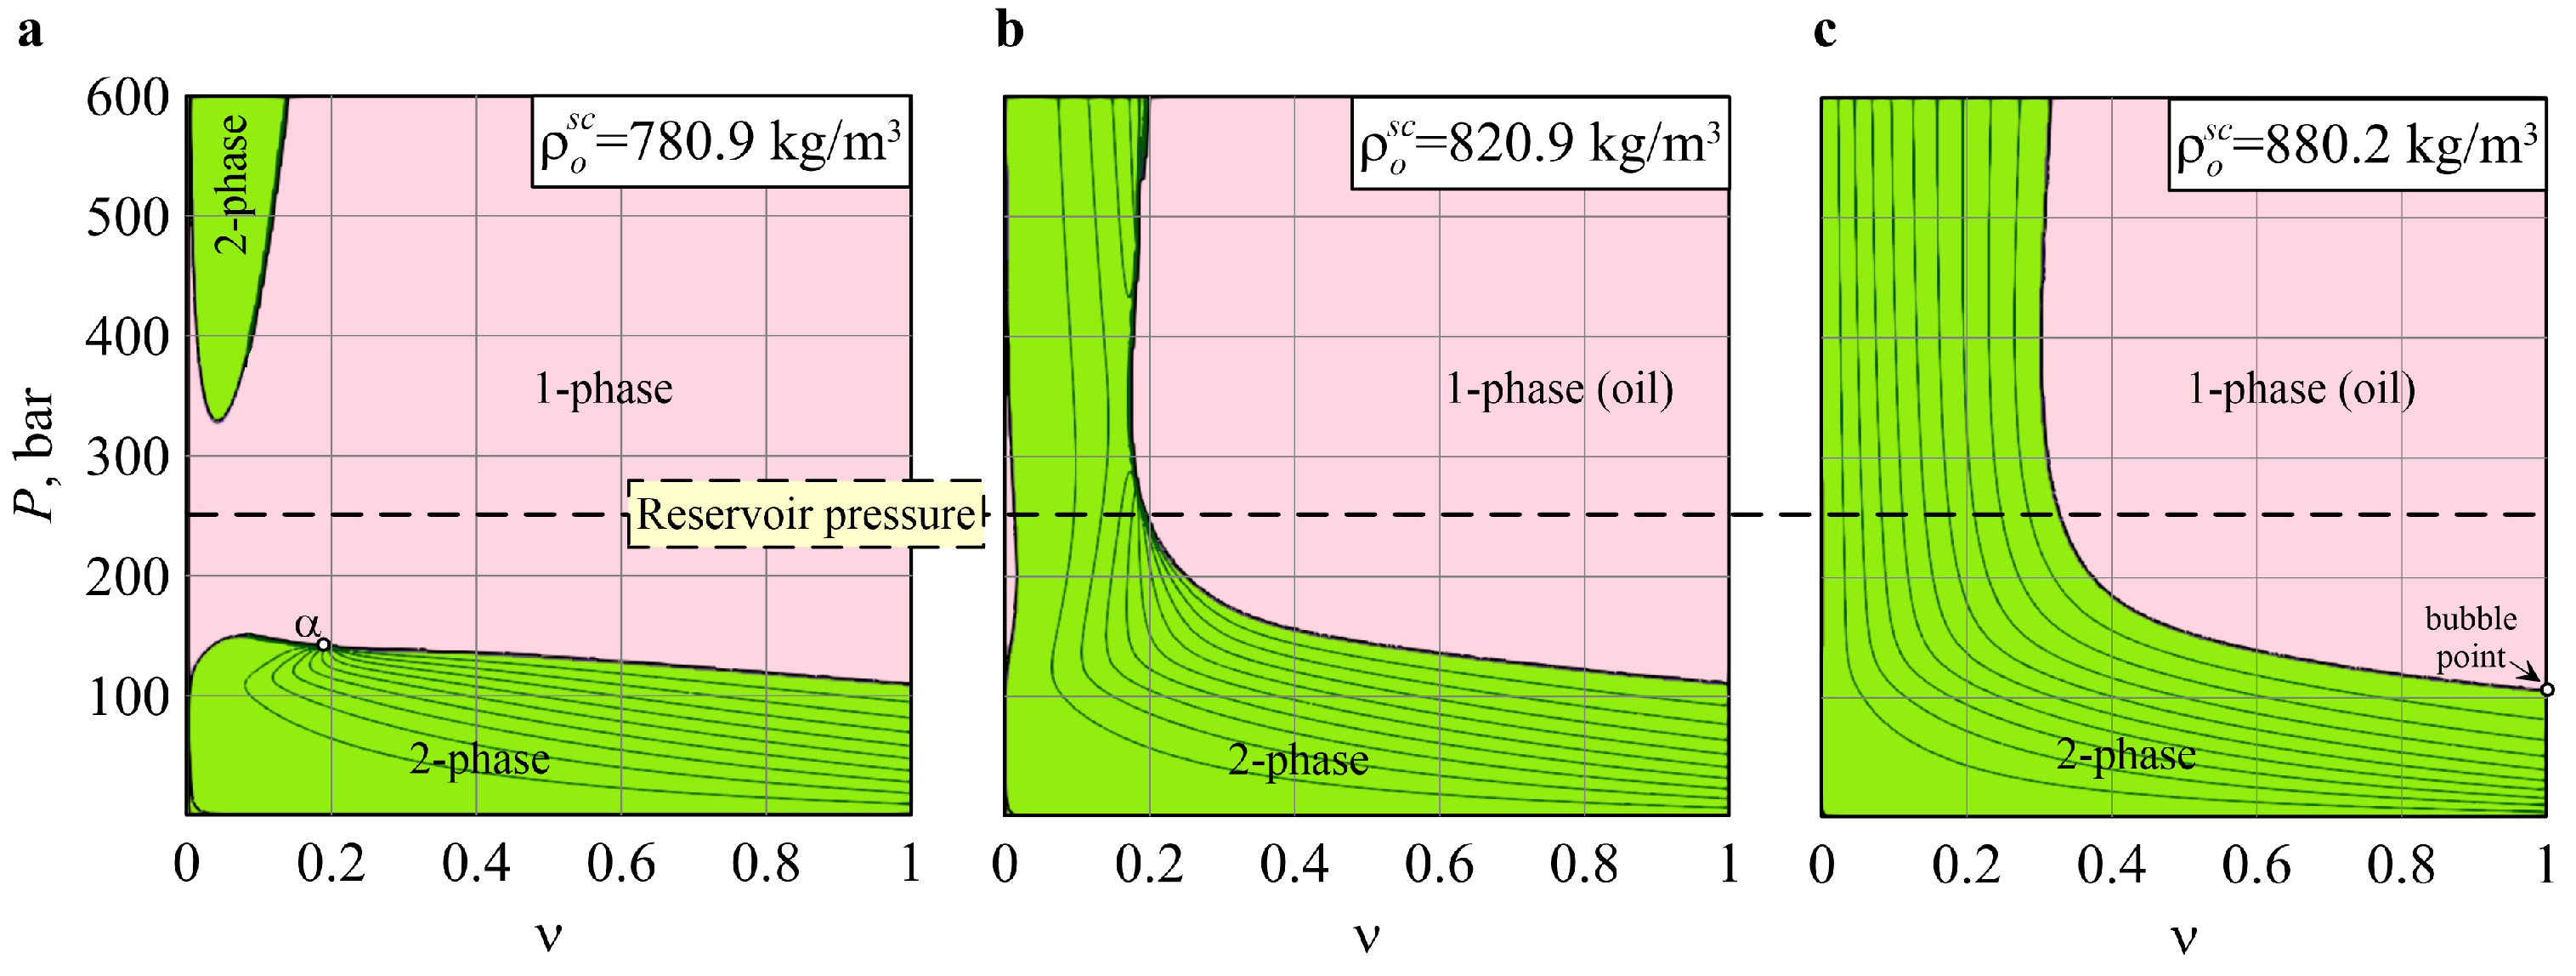
Depending on the values of P and ν , the fluid can exhibit different phase states. In Figure 4, we present such phase diagrams for the three oil compositions summarized in Table 3. In the case of heavy oil (sample h; Figure 4c), the region of the two-phase states corresponding to incomplete miscibility between gas and oil is not constrained from above at high pressures. The two-phase state is possible for some ν 0.2 at any reasonably large pressure ( P 600 bar). Here, the green region corresponds to the two-phase states and the solid curves are the contour lines s g = const with step 0.1. The fluid is in the single-phase state of oil to the right of that region at large ν , i.e., all the 1 ν fraction of CO2 is completely dissolved in oil in such a case. The fluid is in the single-phase state of gas to the left of the two-phase region at ν 1 . Here, a tiny amount of oil is completely evaporated into gas. Thus, according to the Peng-Robinson equation of state, the conditions of complete miscibility, i.e., the case of homogeneous fluid for any ν , are not reached at P 600 bar. Consequently, the true MMP is larger than 600 bar.
The width of the two-phase region, as shown in Figure 4c, decreased with P at P < 300 bar, but it was almost constant at P 300 bar. Thus, the efficiency of the miscible flooding did not significantly change if P varied within the region [ 300 , 600 ] bar. We defined the dynamic MMP as the minimum pressure at which a substantial change in the phase compositions and, thus, the width of the two-phase zone occur is observed in the ( ν , P ) plane. To be more rigorous, we searched for the minimal pressure such that
s g P < ε for   any 0 ν 1 ,
where ε = 10 3 bar−1 is a threshold value. Certainly, the dynamic MMP depends on ε and that threshold value should be carefully chosen for every particular study. However, if ε is sufficiently small, then the calculated dynamic MMP is very close to the true MMP for any simple fluid exhibiting the bell-shaped region of the two-phase states.
To be more specific, let us consider how the two-phase region and the dynamic MMP change with the oil density ρ o s c . If ρ o s c decreases from 880.2 kg/m3 (Figure 4c) to 820.9 kg/m3 (Figure 4b), then the two-phase region at P 300 bar becomes narrower. Herewith, according to Equation (19), the dynamic MMP slightly increased with decreasing ρ o s c (Figure 3b). If ρ o s c decreases further to 780.9 kg/m3 (Figure 4a), then the two-phase region splits in two zones. The lower zone at P 148.8 bar is the standard bell-shaped two-phase region with the critical point α where all curves s g = const begin. For such light oil, the dynamic MMP is very close to the true MMP, which is the maximum pressure on the bell-shaped curve. The narrowing of the two-phase region and its splitting into two zones caused the MMP to decrease with the decreasing ρ o s c at ρ o s c 840 kg/m3 (Figure 3b). These densities correspond to the miscible flooding at P 0 = 250 bar. The larger densities ρ o s c > 840 kg/m3 at which the dynamic MMP decreased with ρ o s c were regarded as the cases of immiscible flooding at P 0 = 250 bar. Certainly, the threshold value of 840 kg/m3 depended on the reservoir temperature.

5.2. Base Study at Ω = 1

We begin the results presentation with a moderate injection rate of Ω = 1 . As discussed in Section 4, the ensemble of the points in Figure 4 was obtained by the Monte Carlo method. Every point in that figure corresponds to a randomly chosen composition of oil and an optimized injection strategy.
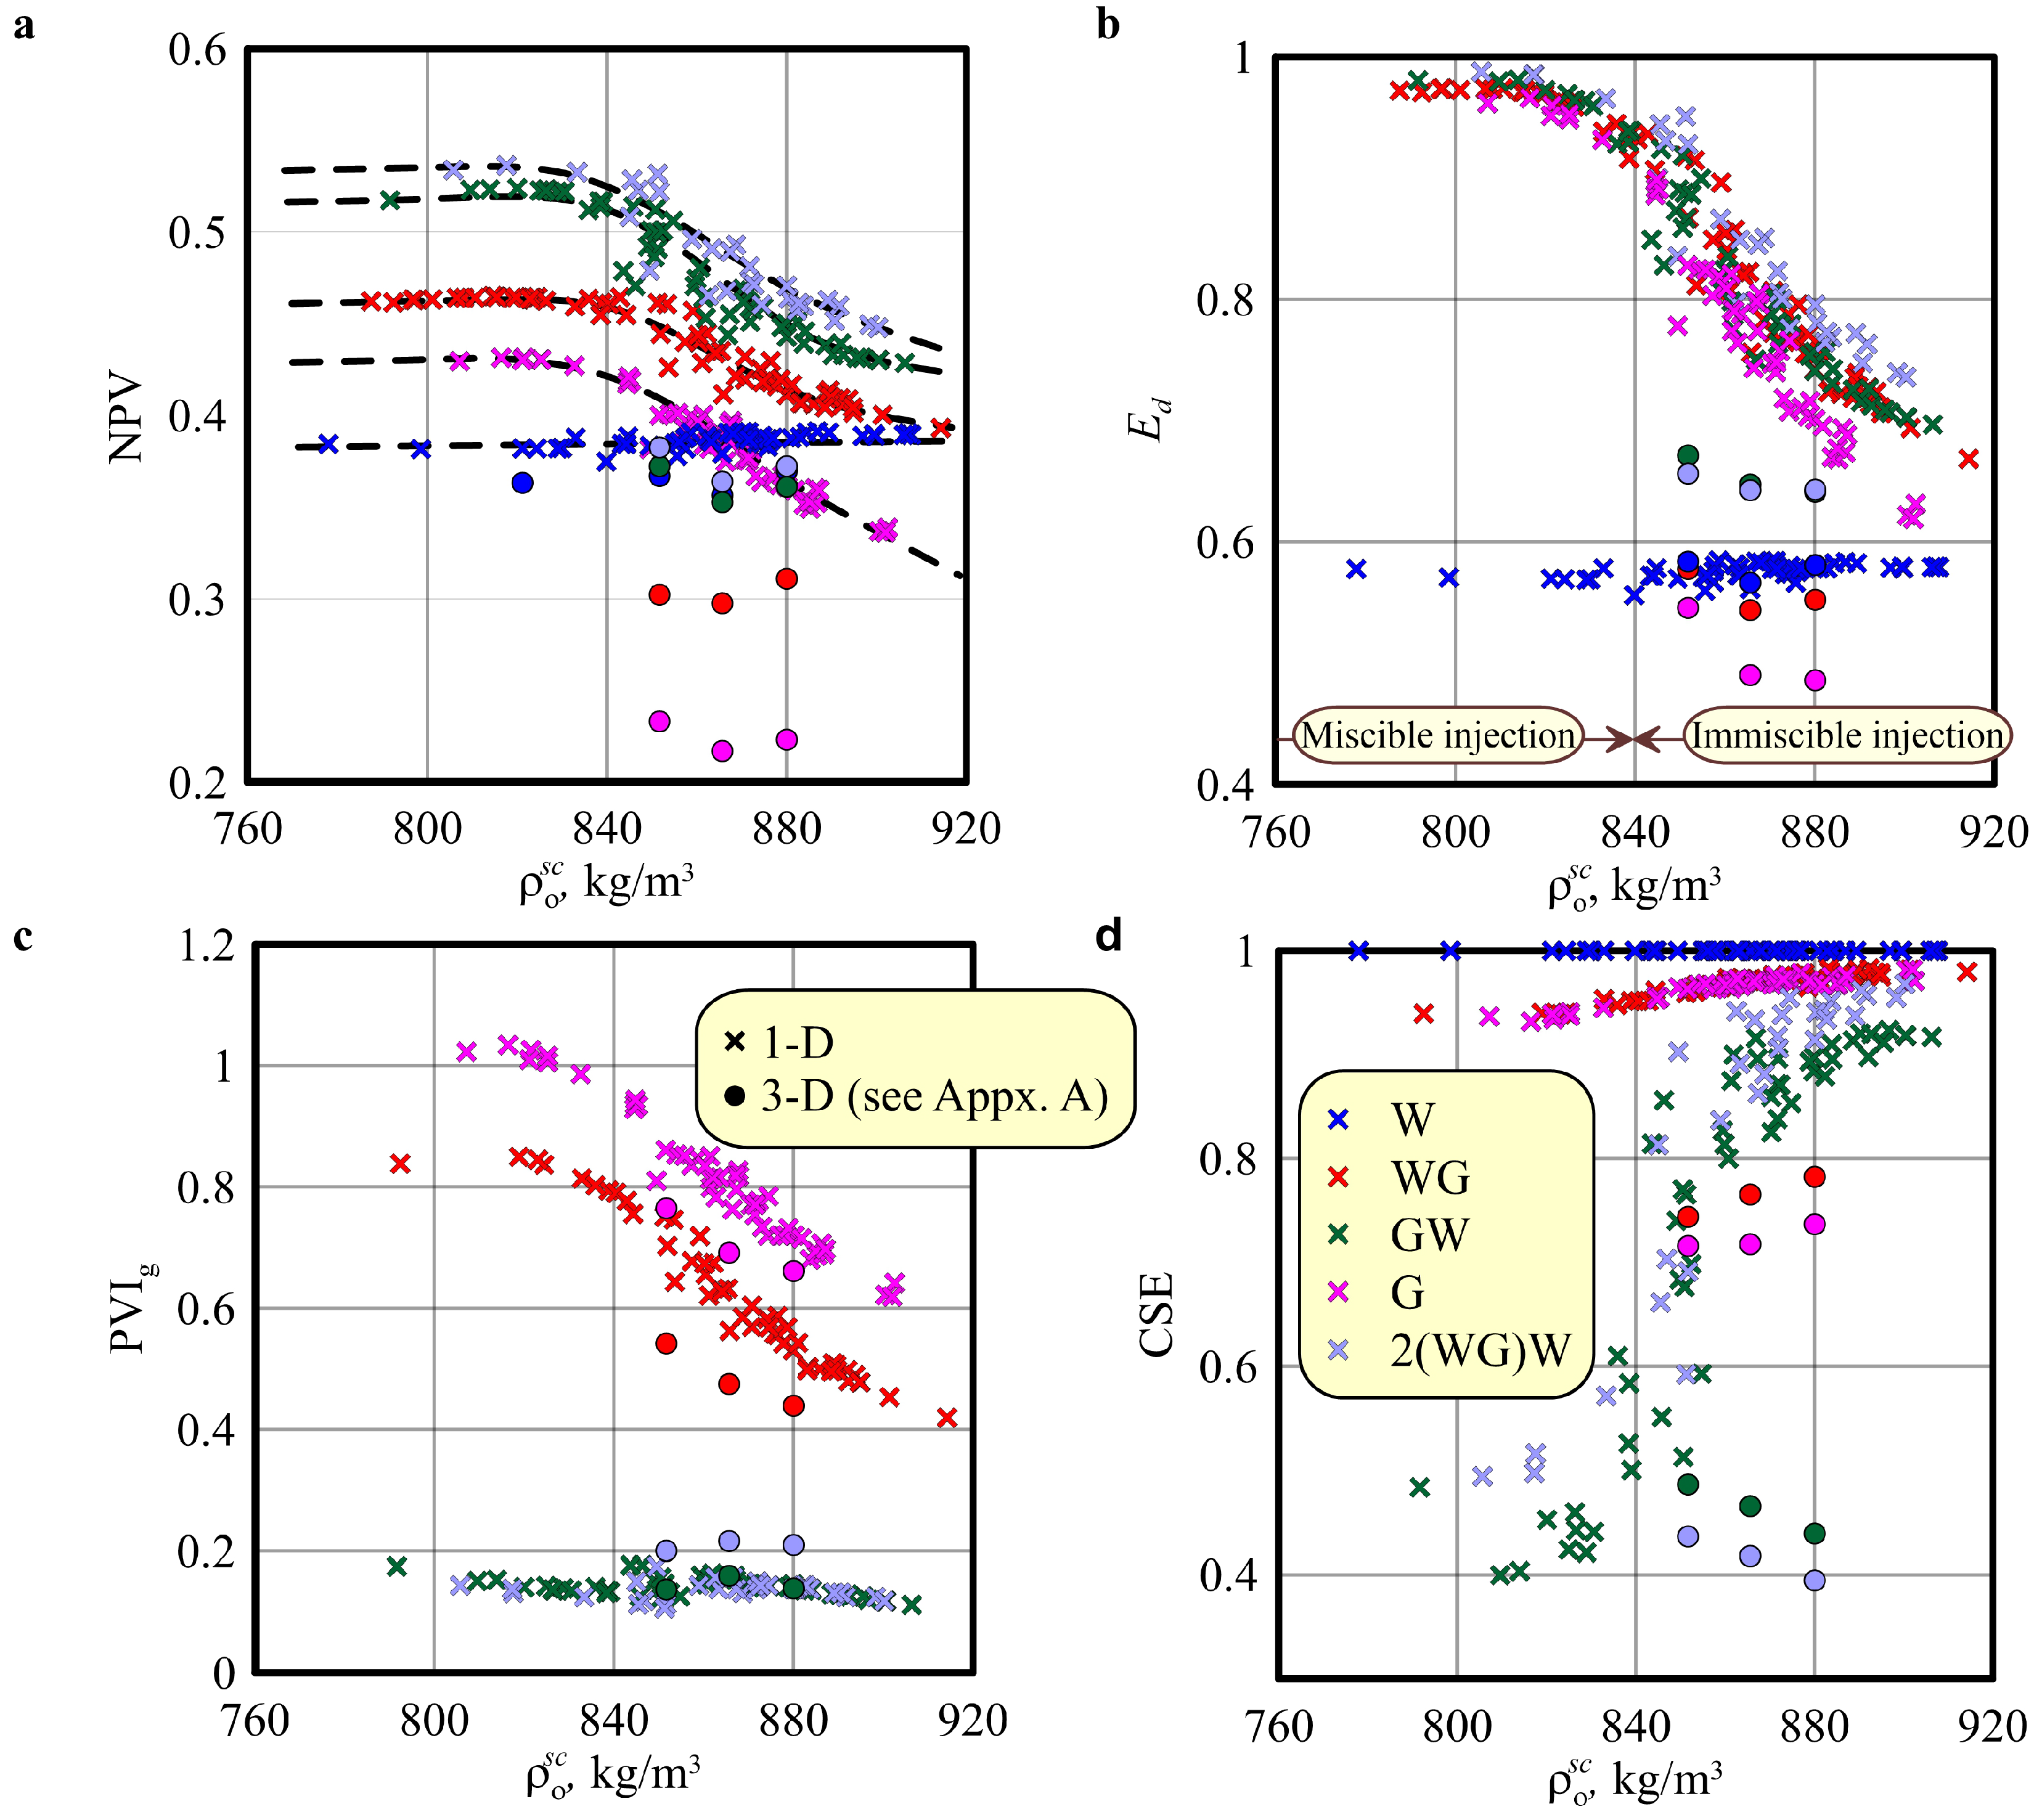
First, the results in Figure 4 indicate that the oil density at the standard conditions serves as a very good parameter characterizing the efficiency of both miscible and immiscible flooding. The points corresponding to every injection strategy cluster were found to be near a well-defined curve (shown in Figure 5 by the dashed curves for each strategy). We can thus conclude that the particular values of z ( 5 ) , z ( 6 ) , and z ( 7 ) are not very relevant for characterizing the efficiency of the gas flooding. The knowledge of the oil density ρ o s c is sufficient to estimate NPV, the microscopic displacement efficiency E d , and the other parameters of the flooding for a given Ω and injection strategy. In other words, the efficiency and profitability of every strategy is characterized by ρ o s c and, as discussed in Section 5.3, by Ω . According to Figure 3, neither P bub nor MMP can be used in such a characterization. These parameters exhibit an ambiguous dependence on ρ o s c , i.e., a given ρ o s c corresponds to several values of P bub and MMP. Thus, plotting the results of the Monte Carlo sampling against P bub or MMP does not result in the points grouping near a single curve. Therefore, P bub and MMP do not characterize the efficiency of WAG.
The dimensionless NPV for all strategies except W show a pronounced decreasing trend with increasing ρ o s c (Figure 4a). All points for a fixed strategy are almost at the same level at ρ o s c 840 kg/m3. NPV decreases with ρ o s c at ρ o s c > 840 kg/m3. Thus, a substantially larger NPV can be reached in reservoirs of light rather than medium or heavy oil. This is explained by the complete miscibility reached for light oils (Figure 4a).
According to Figure 3b, the complete miscibility at the considered reservoir pressure P 0 = 250 bar was reached for oils of a density less than ≈840 kg/m3, i.e., exactly at the same value at which the NPV levels off. This was also supported by the behavior of the recovery efficiency E d , which equaled 1 at ρ o s c 840 kg/m3 (Figure 5b). If ρ o s c > 840 kg/m3, then the complete miscibility is not reached even though the dynamic MMP can be lower than P 0 ; thus, E d and NPV decrease with ρ o s c . Hence, we regard the case of ρ o s c > 840 kg/m3 as the case of immiscible gas flooding.
Strategy W exhibits a completely different trend when compared to the strategies with the injection of CO2. Its economic efficiency NPV and the recovery factor E d do not depend on the oil density (Figure 5a,b). This is explained by the fixed, i.e., not altered by the mixing with CO2, parameters of the oil. Before water breaks through to the boundary x = L , the cumulative volume of produced oil is approximately equal to the cumulative water injection. The optimized parameters of W therefore show a very weak dependence on ρ o s c . Since the economic efficiency of the strategies with the injection of CO2 decreases with ρ o s c , we can conclude that the WAG injection is better to deploy in the light-oil reservoirs.
Generally, the strategies ending with the gas slug, i.e., G and WG, require substantially larger volumes of gas to reach the maximum of NPV (Figure 5c). The strategies ending with water injection, i.e., GW and 2(WG)W, require a three times smaller volume of gas PVIg. An interesting observation is that PVIg substantially decreases with ρ o s c . We thus conclude that a CO2–EOR operation at a light-oil reservoir requires larger volumes of gas than in the reservoirs containing medium or heavy oil.
Keeping in mind that CO2–EOR has advantages for solving environmental problems, we also calculated the CO2 storage efficiency (CSE) for every optimized injection strategy. The storage efficiency is given by
CSE = M i p M i n j ,
where M i p is the mass of CO2-in-place and M i n j is the mass of injected CO2 through the boundary x = 0 . The quantity CSE cannot exceed one and, generally, it is less than one because some of the injected CO2 is drained out of the core plug through its boundary x = L . According to Figure 5d, the carbon storage efficiency increases with ρ o s c . Thus, the miscible flooding implemented at reservoirs characterized by a large oil density is a better option for the subsurface disposal of CO2 in the case when NPV is maximized.

5.3. Influence of the Injection Rate Ω

We conducted three separate parametric studies for Ω = 0.5 , 1, and 2. Their results for Strategies W, WG, and GW are presented in Figure 6. A larger Ω was found to be more preferable for reaching a larger NPV. Indeed, the role of the discounting reduces with Ω . It is more profitable to recover oil earlier when the discounting does not reduce the cash flow. This trend can be clearly observed in Figure 6, where, for a fixed strategy and ρ o s c , the value of NPV decreases when the injection rate decreases from Ω = 2 (Figure 6a) to Ω = 1 (Figure 6b) and then to Ω = 0.5 (Figure 6c). The results shown in Figure 6 also confirm that the maximum of NPV is indeed mainly characterized by ρ o s c . This is valid for different values of Ω .
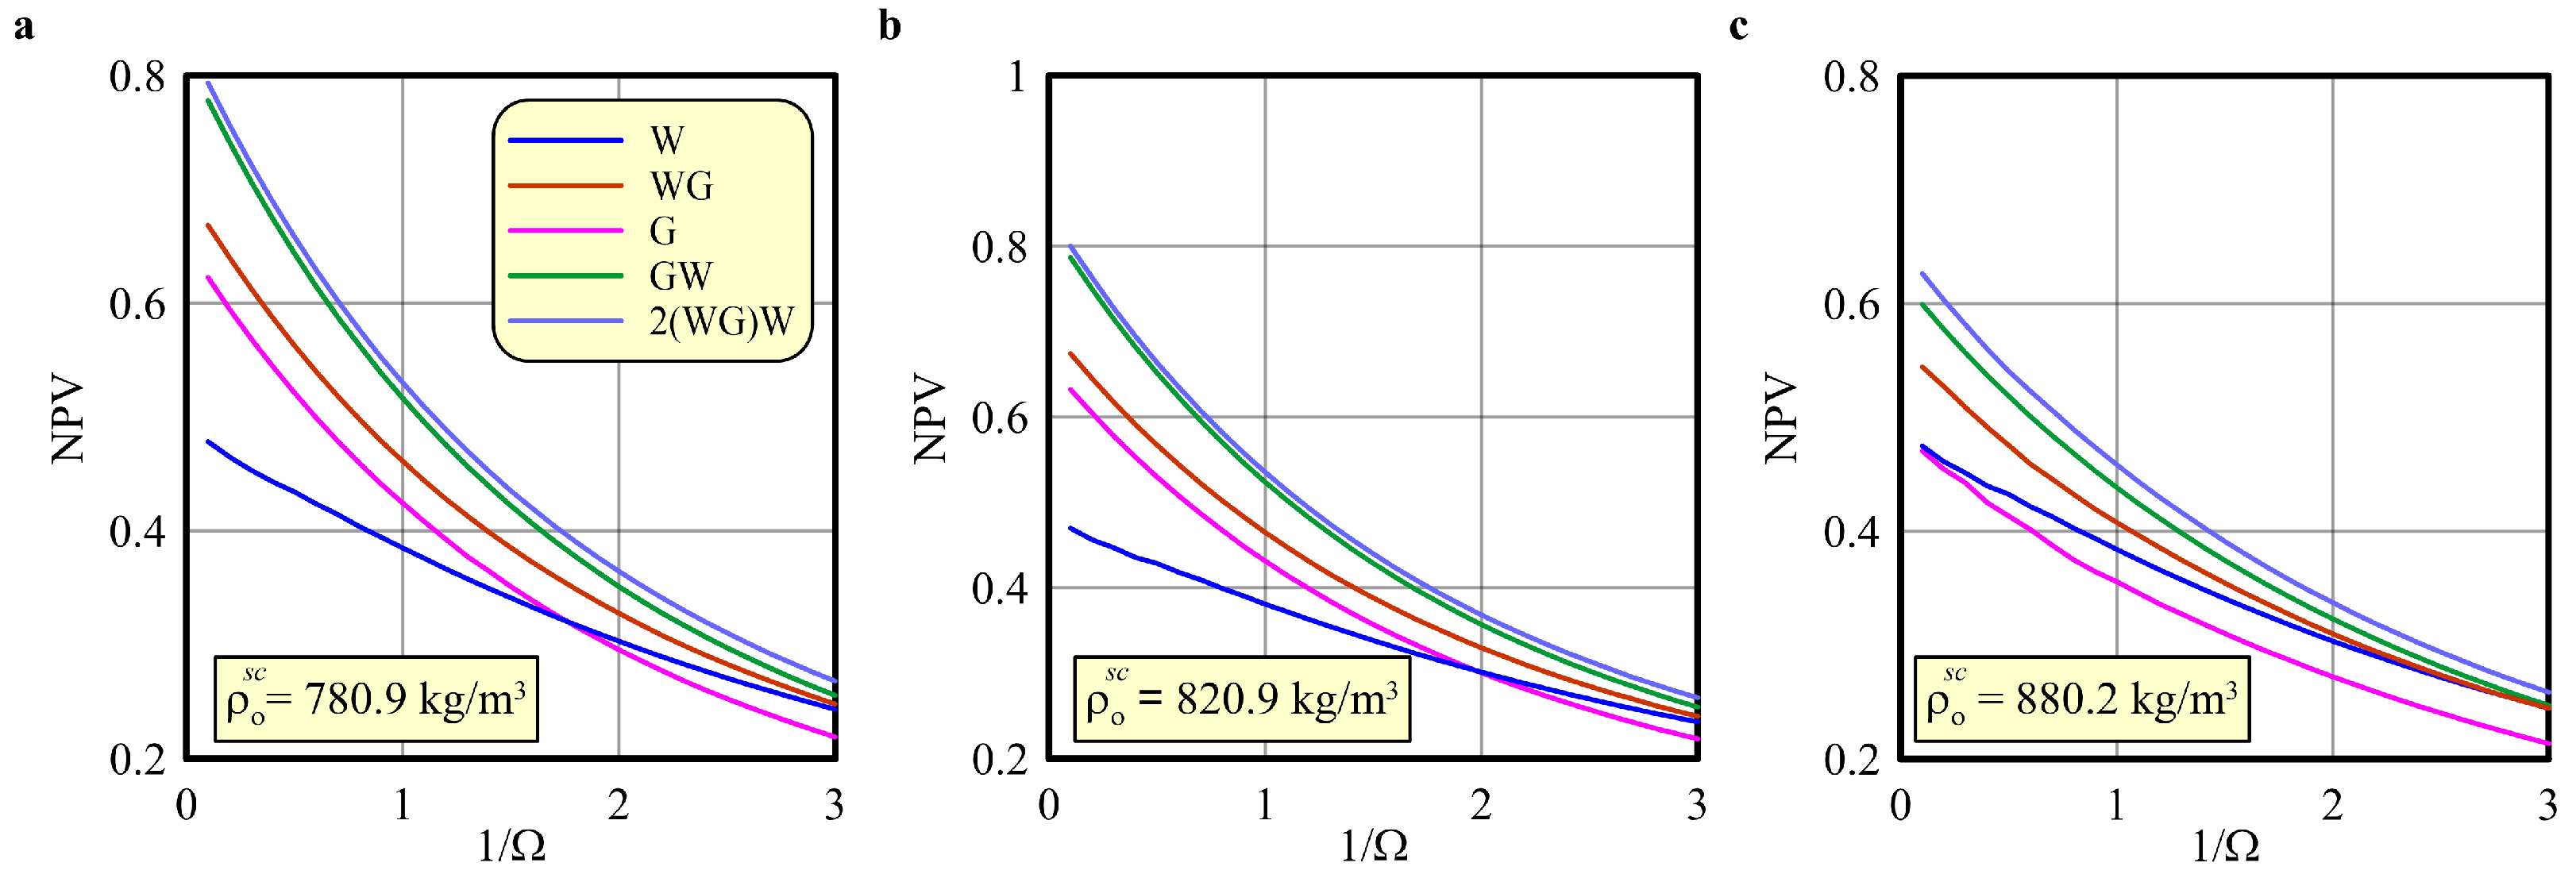
Consider the changes in NPV with Ω for the three compositions given in Table 3. The maximized values of NPV for these oil samples and considered strategies are shown in Figure 7. The NPV for each strategy exhibits a prominent decreasing trend. As already discussed, it is caused by the discounting that generally results in a smaller NPV at a smaller injection rate Ω . The calculated curves for the light and heavy oils shown in Figure 7a,b, respectively, are almost identical because the density of both these oils is lower than the determined threshold value of 840 kg/m3 corresponding to the complete miscibility. The curves for Strategies G, GW, WG, and 2(WG)W are generally lower in the case of the heavier oil (Sample h) corresponding to the immiscible gas injection (Figure 7c). The curves for the waterflooding W are identical for all oil samples because the oil composition is irrelevant in continuous water injection.
The results shown in Figure 7 are qualitatively (and, to some degree of accuracy, even quantitatively) similar to those curves previously obtained for a simpler proxy oil [34]. This again supports the conclusion that the dimensionless rate Ω is indeed useful for characterizing the efficiency of WAG. The faster injections at a large Ω results in a larger economic efficiency of strategies with CO2 injection when compared to waterflooding. In the case of low oil density and a large Ω (Figure 7a,b), even continuous gas injection can be more profitable than waterflooding. However, the alternating injection of gas and water is even more efficient, and Strategy 2(WG)W was found to be the most efficient at large injection rates of Ω . We thus can expect that the case of the flooding that begins with CO2 injection or WAG cycles and ends with water injection is the best option.

5.4. Influence of the Light Hydrocarbon Components

The reservoir oil can contain a substantial amount of dissolved light hydrocarbon components. Their concentrations z ( i ) , i = 2 , 3 , 4 were assumed constant in the previous sections. However, these concentrations can substantially and, rather arbitrarily, vary from one reservoir to another, although the concentration of methane ( z ( 2 ) ) is the largest. The light components can influence the conditions of the oil miscibility with CO2 and, thus, the WAG efficiency. Moreover, these components, especially Component C5, can change the oil density at the surface conditions because, at P = P atm , oil can dissolve considerable amounts of oil fractions when the boiling temperature is larger than the standard temperature of 15.6 °C. In this section, we aim at understanding how these components influence the WAG efficiency. In particular, we want to validate that the efficiency is still characterized by Ω and ρ o s c , even at different z ( i ) , i = 2 , 3 , 4 .
We considered the light- and heavy-oil samples (see the l and h compositions in Table 3) and fixed the concentrations z ( 5 ) , z ( 6 ) , and z ( 7 ) . Then, we applied the Monte Carlo method by randomly varying the concentrations z ( 2 ) , z ( 3 ) , and z ( 4 ) in a way that their sum equals 0.5 ( z ( 2 ) + z ( 3 ) + z ( 4 ) = 0.5 ) and so all the bulk concentrations summed to one. Similarly to Section 2.2, we introduced the random quantities ξ ( i ) , i = 2 , 3 , 4 with the uniform distribution in the range 0 ξ ( i ) 1 , and we used them to calculate z ( i ) as follows:
z ( i ) = 0.5 ξ ( i ) ξ ( 2 ) + ξ ( 3 ) + ξ ( 4 ) , i = 2 , 3 , 4 .
Using Equation (20), we can generate different light- and heavy-oil compositions by taking z ( 5 ) , z ( 6 ) , and z ( 7 ) to be equal to those in the l and h oil samples (Table 3). For every such oil composition, we optimize the injection strategies and plot their parameters in Figure 8.
According to Figure 8, the oil density ρ o s c at the surface conditions quite significantly varied as a result of the different concentration of C5 in the separated oil. For example, it changed from ≈780 to 830 kg/m3 in the case of Oil l. But, all the simulated points shown in Figure 8 clustered near the clearly defined curves even if we simultaneously look at the points for the light and heavy oils. This clustering validates our conclusion that the parameters of the optimized injections depend mainly on Ω and ρ o s c .

6. Discussion and Conclusions

The present theoretical study concerns optimizing WAG for the case of oil displacement in a core plug. We thus accounted only for the microscopic displacement efficiency E d , where E v = 1 and E a = 1 . Certainly, a 3-D displacement in a heterogeneous reservoir results in a substantially smaller E v and E a due to the gravity override, capillary effect, and channeling (see Appendix A). Thus, the optimal parameters of the strategies will change. However, evaluating the optimal CO2 flooding strategy in a such 3-D case would be a very specific study because every reservoir is unique, i.e., it is characterized by a quite specific heterogeneity.
Nevertheless, our estimates still appear to be relevant because we aim at estimating the role of oil composition. It is natural to expect that oil composition has a major influence on E d and a much smaller influence on E v and E a because it controls the phase behavior and, thus, the miscibility behavior. Therefore, our modeling accounts for the major factor influencing the dependence of the sweep efficiency on the oil composition.
The obtained simulation results built upon our previous work [34] on the case of a more complicated modeling of the reservoir fluid. In the previous study, we used a much simpler fluid consisting of just C1, C6, and C16 at constant bulk molar concentrations. We now used twice the components in the compositional simulations to characterize the fluid and vary their concentration in a wide range to simulate both light and heavy oils. We showed that the conclusions obtained in our previous study [34] are still valid in the case of both miscible and immiscible displacement. The concept of the dimensionless injection rate Ω works. Within the noted limitations, the economic efficiency of a CO2 flood and the injection strategies that were ranked by the maximized NPV to a large extent are characterized by Ω . For instance, the results testify that CO2 flooding is more efficient at a higher Ω , and, generally, gas injection should be applied as a primary recovery method followed by waterflooding rather than as a tertiary method of recovery. These trends in Figure 7 are explained by a smaller influence of the discount rate at higher injection rate [34].
An interesting observation is that the details of oil composition (i.e., the concentrations of different hydrocarbon groups) are, in fact, not so relevant. The conducted simulations testify that the oil density at standard conditions is what matters for characterizing the parameters of the optimized strategies. If two oils have identical densities, ρ o s c , but different compositions, then the parameters of the optimized strategies are also the same. Therefore, they depend mainly on Ω and ρ o s c , whereas the role of other parameters including the oil composition is less relevant. This is valid for both miscible and immiscible displacement.
An interesting conclusion is that neither the bubble point pressure nor the minimum miscibility pressure, nor the difference between the reservoir pressure and these quantities, characterize the efficiency. Certainly, the true MMP is very high in the considered immiscible cases. But the conclusion is valid even if the concept of the dynamic MMP is employed. This conclusion can be extended to 3-D displacement in a heterogeneous reservoir at E v < 1 and E a < 1 because if P bub and MMP do not characterize E d , then we can barely expect that they characterize E s in a real application.
Based on the insight from the microscopic displacement efficiency, we can draw the following conclusions regarding the statistical properties of the optimal WAG strategies:
  • We validated that the conclusions of our previous study [34] are still valid for reservoirs saturated with various light and heavy oils. The concept of the dimensionless injection rate Ω is working for oils of different compositions and in the cases of both miscible and immiscible injections.
  • The parameters of optimized WAG injection strategies and their efficiency depend mainly on the injection rate Ω and the oil density at surface conditions ρ o s c . Neither bubble point pressure nor MMP can be used in the characterization of the optimal WAG parameters.
  • The CO2–EOR method applied to a reservoir characterized by a less dense oil results in a higher microscopic displacement efficiency and NPV, but it also causes the CO2 storage potential to be lower. Thus, implementing the CO2–EOR method at a reservoir that has more light oil can generally increase the oil recovery efficiency but at the cost of larger volumes of CO2 being extracted back to the surface with the produced oil.

Author Contributions

Conceptualization, methodology, and writing—original draft preparation and funding acquisition, A.A. (Andrey Afanasyev); software, investigation, visualization, writing—original draft preparation, and formal analysis, A.A. (Anna Andreeva). All authors have read and agreed to the published version of the manuscript.

Funding

We acknowledge the financial support of the Russian Science Foundation (grant no. 19-71-10051, https://rscf.ru/project/19-71-10051/, accessed on 5 May 2024).

Data Availability Statement

No data were used for the research described in the article.

Conflicts of Interest

The authors declare no conflicts of interest.

Abbreviations

The following abbreviations are used in this manuscript:
CSECarbon storage efficiency
EOREnhanced oil recovery
EoSEquation of state
MMPMinimum miscibility pressure
NPVNet present value
PVIPore volumes injected
WAGWater-alternating-gas

Appendix A. 3-D Scenario

Our theoretical investigation in the main part of the article concerns a rather simplified 1-D study corresponding to a slim-tube experiment. We now want to demonstrate that our results remain unchanged in a more complicated 3-D case of a heterogeneous reservoir.
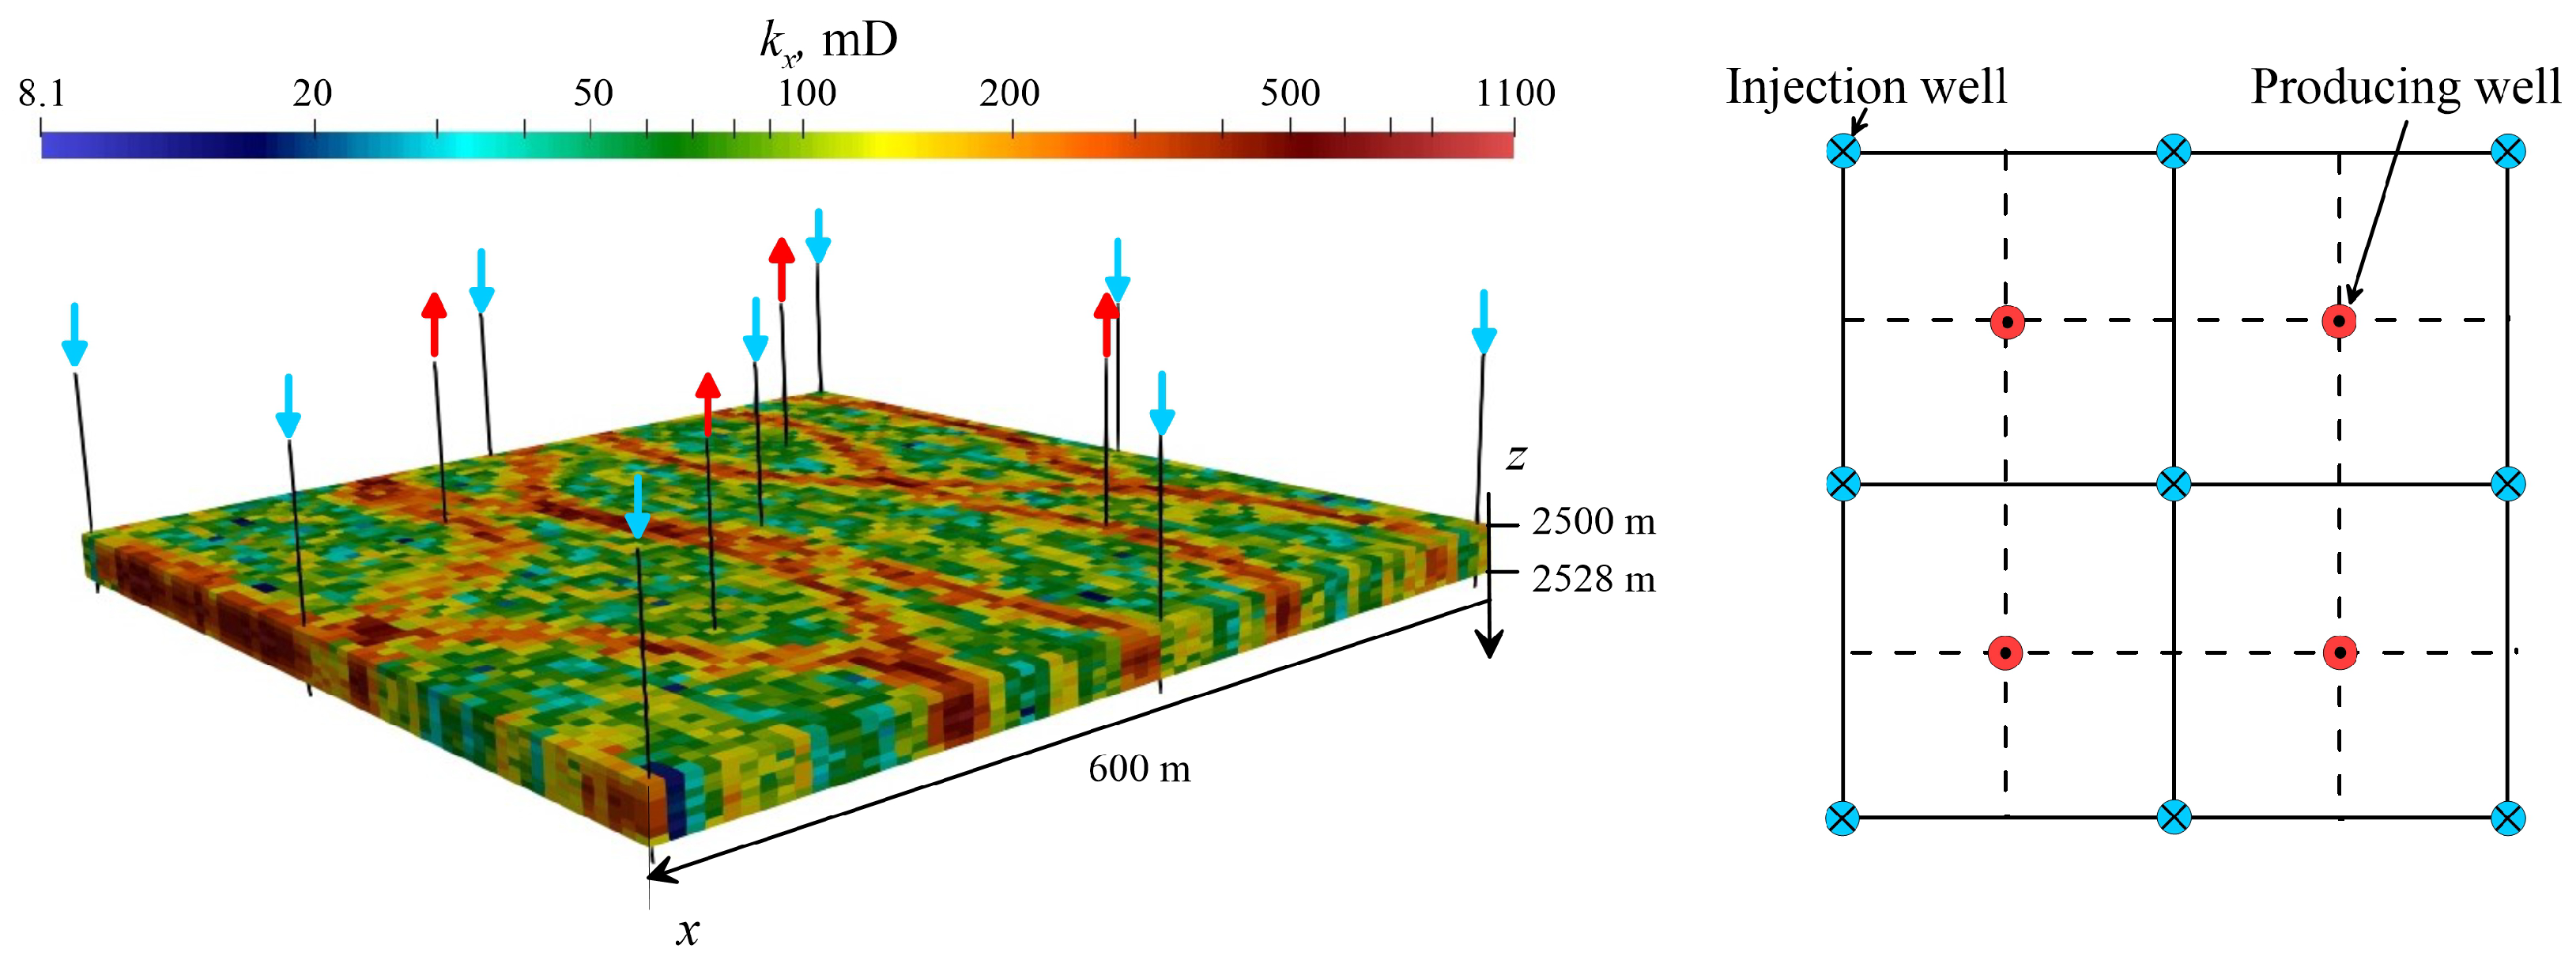
We simulated the development of an oil reservoir characterized by a fluvial depositional environment. The lateral extensions of the considered sector were 600 × 600 m. The reservoir was buried at a depth of 2500 m, and its thickness was constant at 28 m (Figure A1). We assumed a constant porosity of 0.2 and a highly heterogeneous distribution of permeability varying from 8.1 to 1100 mD [57]. The permeability ratio was 0.2. The reservoir exhibited several high-permeability channels serving as preferable pathways for fluid flow. The net-to-gross thickness was one, and so the sector was characterized by a rather good fluid communication in both horizontal and vertical directions. Thus, the buoyancy can considerably reduce WAG efficiency.
Figure A1. Sketch of the 3-D study and the map of the well pattern. The color shows the distribution of horizontal permeability k x .
Energies 17 02259 g0a1
We considered an areal study with wells placed in the five-spot pattern. The alternating injection of gas and water was organized through nine injection wells surrounding four producing wells. Well spacing was not adopted due to the distribution of permeability. Any well could thus be arbitrary located either in a high-permeability channel or in a lower-permeability region between the channels. All wells were completed throughout the whole reservoir thickness.
At t = 0 , the reservoir was saturated with oil at a connate water saturation of 0.16. It was at hydrostatic equilibrium. The pressure at the top of the reservoir was 250 bar. The temperature was assumed constant at 60 °C. All other parameters were identical to those in our investigation of the slim-tube experiments. All boundaries of the sector were assumed impermeable.
The producing wells were operated at the constant bottom-hole pressure of 250 bar, which equaled the initial reservoir pressure. The injection wells were operated at a constant volumetric injection rate at the reservoir conditions, and the value chosen was adopted to meet the target field dimensionless injection rate of Ω = 1 . Due to the assumed symmetry in the five-spot pattern, the center wells injected four times more fluid than the wells located in the corners of the sector and twice more than the wells located at the lateral boundaries (but not in the corners). According to the injection strategies, all of the injection wells were simultaneously switching to either gas or water injection.
To estimate the validity of our results for the 1-D study, we simulated different CO2–EOR strategies (see Table 1) for the three sample oil compositions, which are summarized in Table 3. The water and gas slugs, PVIw and PVIg, were taken to be identical to those in the optimized 1-D scenarios. The calculated NPV and efficiencies are shown by dots in Figure 5, where, in Panel b, we show the field oil efficiency for the 3-D cases.
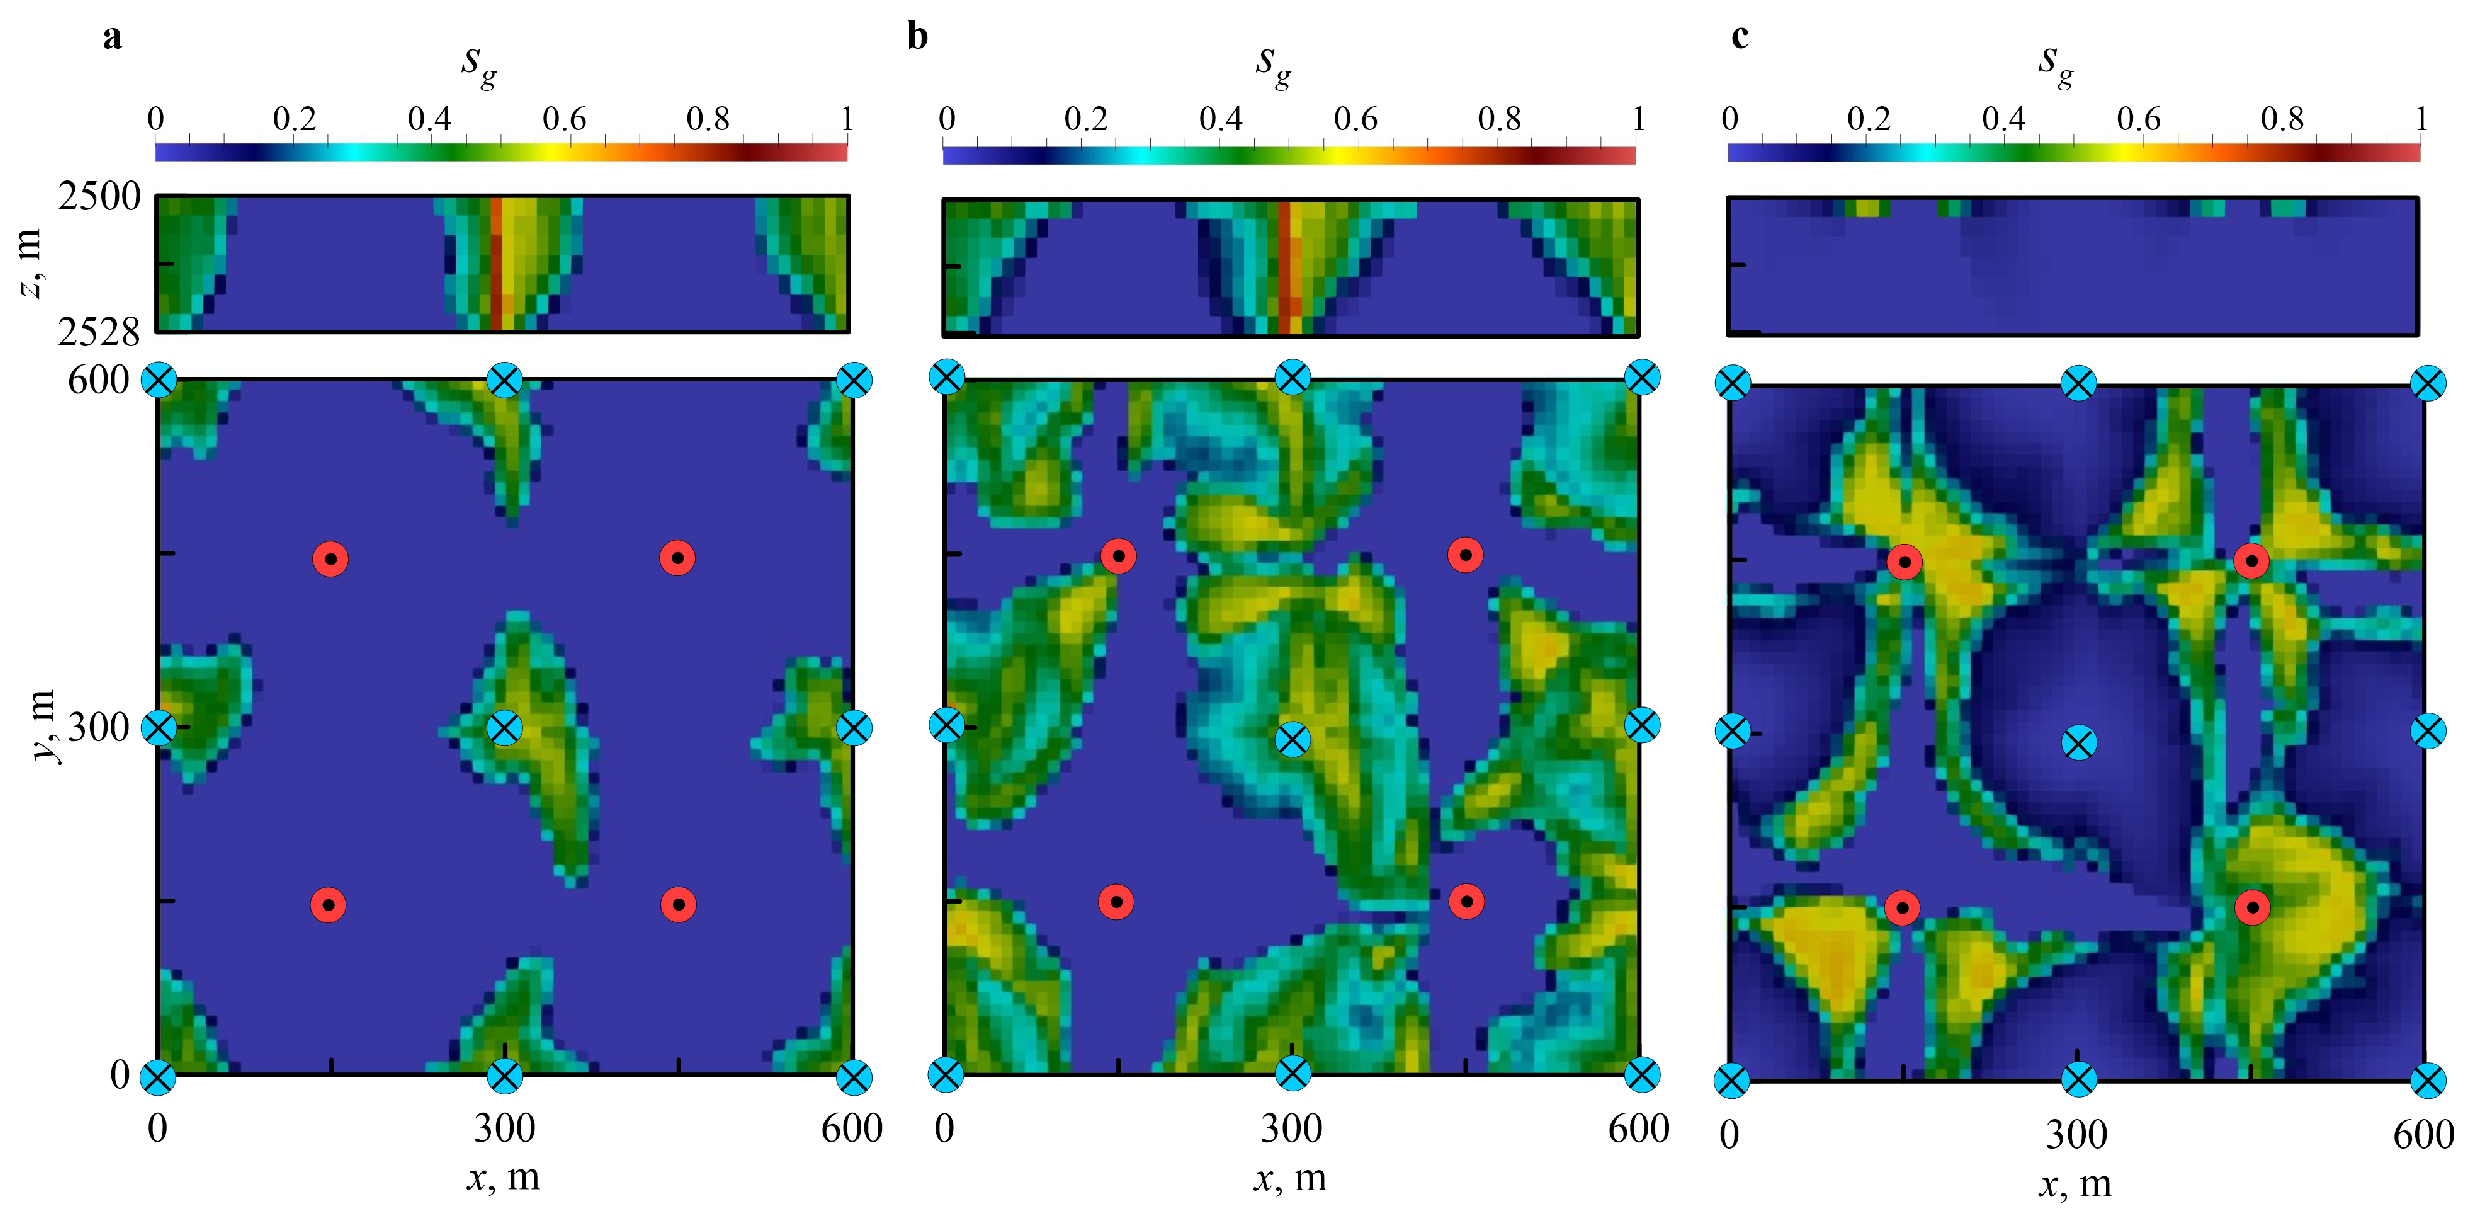
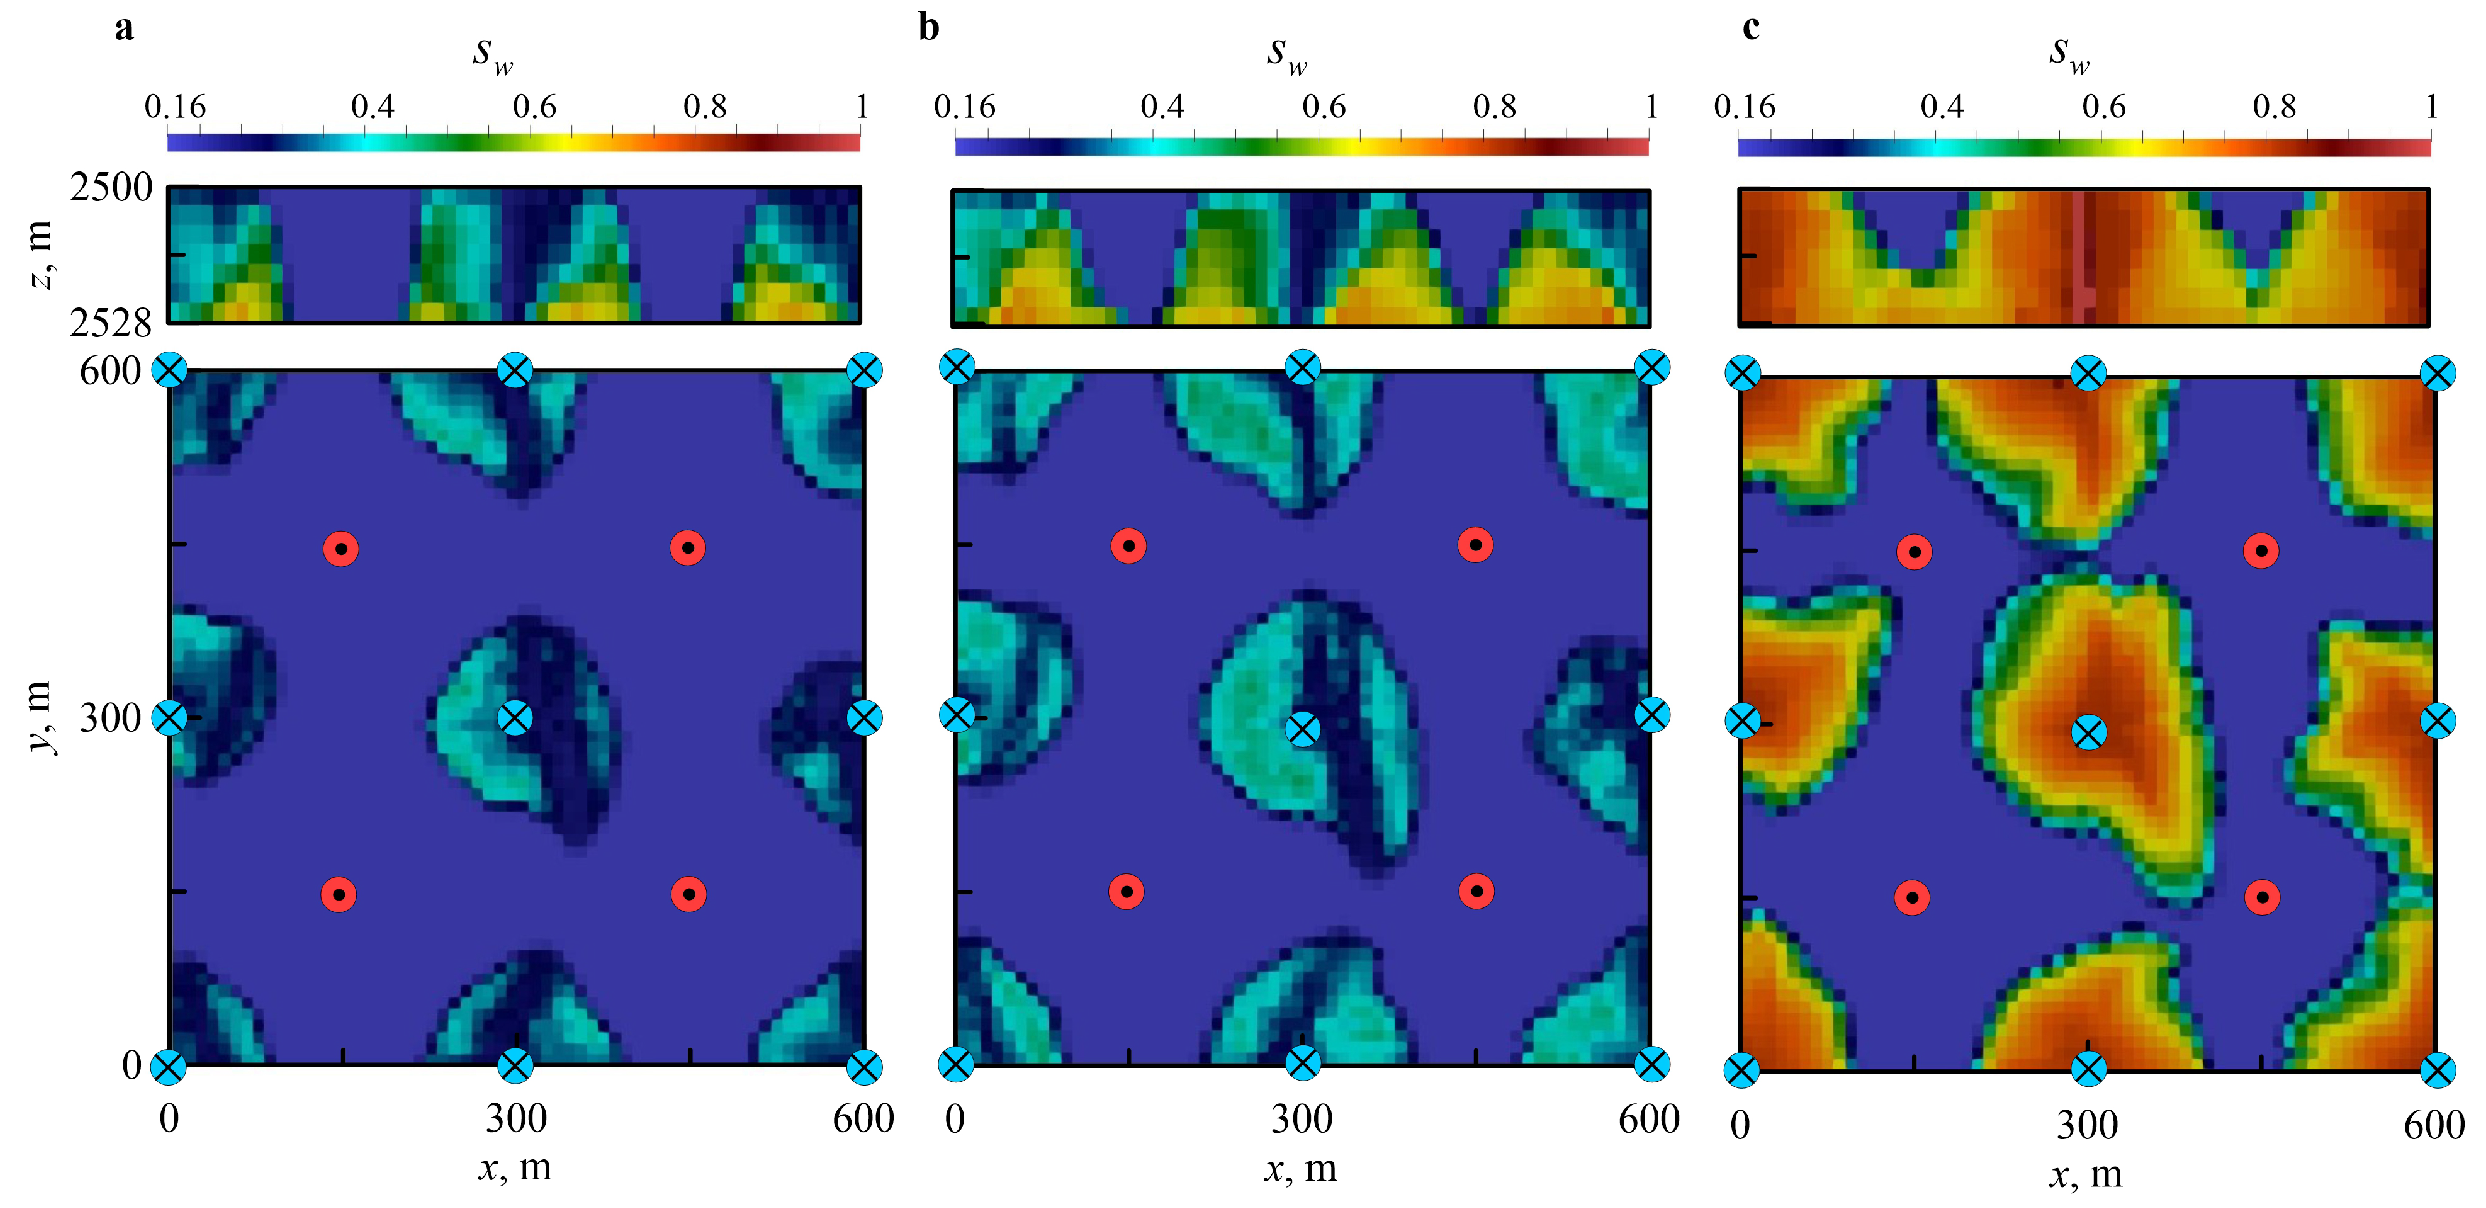
For Scenario 2(WG)W, we show the distribution of gas and water saturation in Figure A2 and Figure A3, respectively. The first and second moments of time, PVI = 0.21 and 0.42, correspond to the end of the periods of the first and second gas slugs injection, respectively. The third PVI = 0.65 corresponds to a moment of time during the closing waterflooding stage. According to Figure A2 and Figure A3, the flow pattern was found to be strongly influenced by the heterogeneous permeability distribution. Both gas and water tended to flow along axis y, i.e., along the the direction of the high-permeability channels. The buoyancy also played a notable role because gas tends to accumulate near the roof of the reservoir. As shown in the cross-section y = 300 m (Figure A2), a gas plume formed near each injection well. Consequently, the reservoir was swept by gas mostly near its roof. Similarly, the water, as a denser fluid in comparison to gas and oil, sank to the reservoir base, thus causing a better sweep by the water at z = 2528 m. Therefore, both effects of the buoyancy and reservoir heterogeneity resulted in a rather complicated distribution of the three phases in the simulated sector.
Figure A2. Distribution of the gas saturation for Strategy 2(WG)W for the Oil Sample h at Ω = 1 and PVI = 0.21, 0.42, and 0.65 (panels (ac), respectively). We show s g in the cross-section y = 300 m and at z = 2500 m.
Energies 17 02259 g0a2
Figure A3. Distribution of the water saturation for Strategy 2(WG)W for the Oil Sample h at Ω = 1 and PVI = 0.21, 0.42, and 0.65 (panels (ac), respectively). We show s w in the cross-section y = 300 m and at z = 2500 m.
Energies 17 02259 g0a3
Due to the gravity override, the simulated values of NPV for all strategies except W were found to be generally much lower than those for the slim-tube experiment (Figure 5b). The reservoir was not completely swept by gas, and the oil recovery and NPV went lower. However, a relevant observation was that the strategy order, in terms of NPV, the oil recovery ( E d ), the required amount of gas (PVIg), and CSE, remained unchanged when compared to the 1-D study. In both the 1-D and 3-D scenarios with a CO2 injection, the best option was 2(WG)W and the worst option was G (continuous gas injection). Certainly, all the values of NPV were shifted down by about 0.125. However, if we estimate from the 1-D study that 2(WG)W is the optimal strategy, then it will also be the best option in the 3-D reservoir. A rather fine point is that the efficiency of waterflooding needs to be evaluated separately since its NPV is just slightly lower in the 3-D case when compared to that in the 1-D case. Strategy W was not influenced by the compositional effects, and it was not compromised by the gravity override of the gas phase. Its efficiency was certainly reduced by the gravity override of the water phase, but this effect was weaker because the density contrast between the oil and water was smaller than that between oil and gas. However, this behavior can change for a different reservoir pressure, temperature, and different oil composition.
To conclude, the 3-D example demonstrated that the optimization of the 1-D scenarios can help in evaluating the optimal injection strategies in 3-D scenarios, even though the latter are compromised by the reduced volumetric and areal sweep efficiencies E v and E a .

References

  1. Jessen, K.; Kovscek, A.R.; Orr, F.M. Increasing CO2 storage in oil recovery. Energy Convers. Manag. 2005, 46, 293–311. [Google Scholar] [CrossRef]
  2. Kovscek, A.; Cakici, M. Geologic storage of carbon dioxide and enhanced oil recovery. II. Cooptimization of storage and recovery. Energy Convers. Manag. 2005, 46, 1941–1956. [Google Scholar] [CrossRef]
  3. Holt, T.; Lindeberg, E.; Wessel-Berg, D. EOR and CO2 disposal—Economic and capacity potential in the North Sea. Energy Procedia 2009, 1, 4159–4166. [Google Scholar] [CrossRef]
  4. Mon, M.T.; Tansuchat, R.; Yamaka, W. CCUS Technology and Carbon Emissions: Evidence from the United States. Energies 2024, 17, 1748. [Google Scholar] [CrossRef]
  5. Cao, J.; Gao, M.; Liu, Z.; Yu, H.; Liu, W.; Yin, H. Research and Application of Carbon Capture, Utilization, and Storage–Enhanced Oil Recovery Reservoir Screening Criteria and Method for Continental Reservoirs in China. Energies 2024, 17, 1143. [Google Scholar] [CrossRef]
  6. Lake, L.W. Enhanced Oil Recovery; Prentice Hall: Hoboken, NJ, USA, 1989. [Google Scholar]
  7. Christensen, J.; Stenby, E.; Skauge, A. Review of WAG Field Experience. SPE Reserv. Eval. Eng. 2001, 4, 97–106. [Google Scholar] [CrossRef]
  8. Thomas, S. Enhanced Oil Recovery—An Overview. Oil Gas Sci. Technol. -Rev. L’IFP 2008, 63, 9–19. [Google Scholar] [CrossRef]
  9. Alvarado, V.; Manrique, E. Enhanced Oil Recovery: An Update Review. Energies 2010, 3, 1529–1575. [Google Scholar] [CrossRef]
  10. Yao, J.; Yuan, W.; Peng, X.; Chen, Z.; Gu, Y. A Novel Multi-Phase Strategy for Optimizing CO2 Utilization and Storage in an Oil Reservoir. Energies 2023, 16, 5289. [Google Scholar] [CrossRef]
  11. Ettehadtavakkol, A.; Lake, L.W.; Bryant, S.L. CO2-EOR and storage design optimization. Int. J. Greenh. Gas Control 2014, 25, 79–92. [Google Scholar] [CrossRef]
  12. Rodrigues, H.; Mackay, E.; Arnold, D. Impact of WAG Design on Calcite Scaling Risk in Coupled CO2-EOR and Storage Projects in Carbonate Reservoirs. In Proceedings of the SPE Reservoir Simulation Conference, Galveston, TX, USA, 10–11 April 2019. [Google Scholar] [CrossRef]
  13. Orr, F.M.; Dindoruk, B.; Johns, R.T. Theory of Multicomponent Gas/Oil Displacements. Ind. Eng. Chem. Res. 1995, 34, 2661–2669. [Google Scholar] [CrossRef]
  14. Orr, F.M. Theory of Gas Injection Processes; Tie-Line Publications: Holte, Denmark, 2007. [Google Scholar]
  15. Pritchard, D.; Nieman, R. Improving Oil Recovery Through WAG Cycle Optimization in a Gravity-Overide-Dominated Miscible Flood. In Proceedings of the SPE/DOE Enhanced Oil Recovery Symposium. Society of Petroleum Engineers, Tulsa, OK, USA, 22–24 April 1992. [Google Scholar] [CrossRef]
  16. Johns, R.; Leonardo, B.; Harshad, P. WAG Optimization for Gas Floods above the MME. In Proceedings of the SPE Annual Technical Conference and Exhibition, Denver, CO, USA, 5–8 October 2003; Society of Petroleum Engineers: Kuala Lumpur, Malaysia, 2003. [Google Scholar] [CrossRef]
  17. Johns, R.T.; Dindoruk, B. Gas Flooding. In Enhanced Oil Recovery Field Case Studies; Elsevier: Amsterdam, The Netherlands, 2013; pp. 1–22. [Google Scholar] [CrossRef]
  18. Li, D.; Saraji, S.; Jiao, Z.; Zhang, Y. An experimental study of CO2 injection strategies for enhanced oil recovery and geological sequestration in a fractured tight sandstone reservoir. Geoenergy Sci. Eng. 2023, 230, 212166. [Google Scholar] [CrossRef]
  19. Huang, X.; Li, X.; Zhang, Y.; Li, T.; Zhang, R. Microscopic production characteristics of crude oil in nano-pores of shale oil reservoirs during CO2 huff and puff. Pet. Explor. Dev. 2022, 49, 636–643. [Google Scholar] [CrossRef]
  20. Tang, W.; Peng, Z.; Sheng, J.J. Evaluation of CO2 utilization and storage potential in the Jimsar shale play from an optimization study. Geoenergy Sci. Eng. 2023, 224, 211607. [Google Scholar] [CrossRef]
  21. Massarweh, O.; Abushaikha, A.S. A review of recent developments in CO2 mobility control in enhanced oil recovery. Petroleum 2022, 8, 291–317. [Google Scholar] [CrossRef]
  22. Hassanzadeh, A.; Katiyar, A.; Kalaei, H.; Pecore, D.; Schofield, E.; Nguyen, Q.P. A novel foam process with CO2 dissolved surfactant for improved sweep efficiency in EVGSAU field. Geoenergy Sci. Eng. 2023, 231, 212310. [Google Scholar] [CrossRef]
  23. LaForce, T.; Jessen, K. Analytical and numerical investigation of multicomponent multiphase WAG displacements. Comput. Geosci. 2010, 14, 745–754. [Google Scholar] [CrossRef]
  24. Ghaderi, S.M.; Clarkson, C.R.; Chen, S. Optimization of WAG Process for Coupled CO2 EOR-Storage in Tight Oil Formations: An Experimental Design Approach. In Proceedings of the SPE Canadian Unconventional Resources Conference, Calgary, AB, Canada, 30 October–1 November 2012. [Google Scholar] [CrossRef]
  25. Mirzaei-Paiaman, A.; Santos, S.M.; Schiozer, D.J. Optimization of design variables and control rules in field development under uncertainty: A case of intelligent wells and CO2 water alternating gas injection. Geoenergy Sci. Eng. 2023, 227, 211854. [Google Scholar] [CrossRef]
  26. Ghedan, S.G. Global Laboratory Experience of CO2-EOR Flooding. In Proceedings of the SPE/EAGE Reservoir Characterization and Simulation Conference, Abu Dhabi, United Arab Emirates, 19–21 October 2009; Society of Petroleum Engineers: Kuala Lumpur, Malaysia, 2009. [Google Scholar] [CrossRef]
  27. Verma, M.K. Fundamentals of Carbon Dioxide-Enhanced Oil Recovery (CO2-EOR): A Supporting Document of the Assessment Methodology for Hydrocarbon Recovery Using CO2-EOR Associated with Carbon Sequestration; Technical Report; U.S. Geological Survey: Reston, VA, USA, 2015. [Google Scholar] [CrossRef]
  28. Bermudez, L.; Johns, R.T.; Parakh, H. Parametric Investigation of WAG Floods Above the MME. SPE J. 2007, 12, 224–234. [Google Scholar] [CrossRef]
  29. Namani, M.; Kleppe, J. Investigation of the Effect Of Some Parameters In Miscible WAG Process Using Black-Oil And Compositional Simulators. In Proceedings of the SPE Enhanced Oil Recovery Conference, Kuala Lumpur, Malaysia, 19–20 July 2011; Society of Petroleum Engineers: Kuala Lumpur, Malaysia, 2011. [Google Scholar] [CrossRef]
  30. Asante, J.; Ampomah, W.; Tu, J.; Cather, M. Data-driven modeling for forecasting oil recovery: A timeseries neural network approach for tertiary CO2 WAG EOR. Geoenergy Sci. Eng. 2024, 233, 212555. [Google Scholar] [CrossRef]
  31. Al-Khdheeawi, E.A. Optimizing CO2-Water Injection Ratio in Heterogeneous Reservoirs: Implications for CO2 Geo-Storage. Energies 2024, 17, 678. [Google Scholar] [CrossRef]
  32. Fathinasab, M.; Shahbazi, K. A new correlation for estimation of minimum miscibility pressure (MMP) during hydrocarbon gas injection. J. Pet. Explor. Prod. Technol. 2020, 10, 2349–2356. [Google Scholar] [CrossRef]
  33. Chen, B.; Pawar, R. Capacity assessment of CO2 storage and enhanced oil recovery in residual oil zones. In Proceedings of the SPE Annual Technical Conference and Exhibition, Dallas, TX, USA, 24–26 September 2018. [Google Scholar] [CrossRef]
  34. Afanasyev, A.; Andreeva, A.; Chernova, A. Influence of oil field production life on optimal CO2 flooding strategies: Insight from the microscopic displacement efficiency. J. Pet. Sci. Eng. 2021, 205, 108803. [Google Scholar] [CrossRef]
  35. Kulkarni, M.; Rao, D. Experimental Investigation of Miscible Secondary Gas Injection. In Proceedings of the SPE Annual Technical Conference and Exhibition, Dallas, TX, USA, 9–12 October 2005; Society of Petroleum Engineers: Kuala Lumpur, Malaysia, 2005. [Google Scholar] [CrossRef]
  36. Fatemi, S.M.; Sohrabi, M.; Jamiolahmady, M.; Ireland, S.; Robertson, G. Experimental Investigation of Near-Miscible Water-Alternating-Gas WAG Injection Performance in Water-wet and Mixed-wet Systems. In Proceedings of the SPE Offshore Europe Oil and Gas Conference and Exhibition, Aberdeen, UK, 6–8 September 2011. [Google Scholar] [CrossRef]
  37. Alkhazmi, B.; Sohrabi, M.; Farzaneh, S.A. An Experimental Investigation of the Effect of Gas and Water Slug Size and Injection Order on the Performance of Immiscible WAG Injection in a Mixed-Wet System. In Proceedings of the SPE Kuwait Oil & Gas Show and Conference, Kuwait City, Kuwait, 15–18 October 2017. [Google Scholar] [CrossRef]
  38. Sun, L.; Hao, X.; Dou, H.; Daniel Adenutsi, C.; Li, Z.; Zhang, Y. Co-optimization of oil recovery and CO2 storage for cyclic CO2 flooding in ultralow permeability reservoirs. Oil Gas Sci. Technol. Rev. D’IFP Energies Nouv. 2018, 73, 42. [Google Scholar] [CrossRef]
  39. Li, G.; Yao, J. Snap-Off during Imbibition in Porous Media: Mechanisms, Influencing Factors, and Impacts. Eng 2023, 4, 2896–2925. [Google Scholar] [CrossRef]
  40. Wang, T.; Wang, L.; Meng, X.; Chen, Y.; Song, W.; Yuan, C. Key parameters and dominant EOR mechanism of CO2 miscible flooding applied in low-permeability oil reservoirs. Geoenergy Sci. Eng. 2023, 225, 211724. [Google Scholar] [CrossRef]
  41. Kulkarni, M.; Rao, D. Experimental Investigation of Various Methods of Tertiary Gas Injection. In Proceedings of the SPE Annual Technical Conference and Exhibition, Houston, TX, USA, 26–29 September 2004; Society of Petroleum Engineers: Kuala Lumpur, Malaysia, 2004. [Google Scholar] [CrossRef]
  42. Poling, B.E.; Prausnitz, J.M.; O’Connell, J.P. Properties of Gases and Liquids, 5th ed.; McGraw-Hill Education: New York, NY, USA, 2001. [Google Scholar]
  43. Peng, D.Y.; Robinson, D.B. A New Two-Constant Equation of State. Ind. Eng. Chem. Fundam. 1976, 15, 59–64. [Google Scholar] [CrossRef]
  44. Péneloux, A.; Rauzy, E.; Fréze, R. A consistent correction for Redlich-Kwong-Soave volumes. Fluid Phase Equilibria 1982, 8, 7–23. [Google Scholar] [CrossRef]
  45. Coats, K.H. An Equation of State Compositional Model. Soc. Pet. Eng. J. 1980, 20, 363–376. [Google Scholar] [CrossRef]
  46. Afanasyev, A.; Andreeva, A.; Chernova, A. Numerical optimisation of CO2 flooding using a hierarchy of reservoir models. Adv. Geosci. 2021, 56, 19–31. [Google Scholar] [CrossRef]
  47. Galindo, M.E.; Lacerda, I.V.; Galindez-Ramirez, G.; Lyra, P.R.; Carvalho, D.K. A very high order Flux Reconstruction (FR) method for the numerical simulation of 1-D compositional fluid flow model in petroleum reservoirs. Geoenergy Sci. Eng. 2023, 229, 212056. [Google Scholar] [CrossRef]
  48. Brock, W.; Bryan, L. Summary Results of CO2 EOR Field Tests, 1972–1987. In Proceedings of the Low Permeability Reservoirs Symposium, Denver, CO, USA, 6–8 March 1989; Society of Petroleum Engineers: Kuala Lumpur, Malaysia, 1989. [Google Scholar] [CrossRef]
  49. Kenyon, D.; Behie, A. Third SPE Comparative Solution Project: Gas Cycling of Retrograde Condensate Reservoirs. J. Pet. Technol. 1987, 39, 981–997. [Google Scholar] [CrossRef]
  50. Lohrenz, J.; Bray, B.G.; Clark, C.R. Calculating Viscosities of Reservoir Fluids From Their Compositions. J. Pet. Technol. 1964, 16, 1171–1176. [Google Scholar] [CrossRef]
  51. Tzimas, E.; Georgakaki, A.; Garcia Cortes, C.; Peteves, S.D. Enhanced Oil Recovery Using Carbon Dioxide in the European Energy System; Technical Report; European Commission: Brussels, Belgium, 2005. [Google Scholar]
  52. Salem, S.; Moawad, T. Economic Study of Miscible CO2 Flooding in a Mature Waterflooded Oil Reservoir. In Proceedings of the SPE Saudi Arabia Section Technical Symposium and Exhibition, Al-Khobar, Saudi Arabia, 19–22 May 2013. [Google Scholar] [CrossRef]
  53. Metropolis, N.; Rosenbluth, A.W.; Rosenbluth, M.N.; Teller, A.H.; Teller, E. Equation of State Calculations by Fast Computing Machines. J. Chem. Phys. 1953, 21, 1087–1092. [Google Scholar] [CrossRef]
  54. Afanasyev, A.; Vedeneeva, E. Compositional modeling of multicomponent gas injection into saline aquifers with the MUFITS simulator. J. Nat. Gas Sci. Eng. 2021, 94, 103988. [Google Scholar] [CrossRef]
  55. Afanasyev, A. Hydrodynamic Modelling of Petroleum Reservoirs using Simulator MUFITS. Energy Procedia 2015, 76, 427–435. [Google Scholar] [CrossRef]
  56. Liu, X.; Qin, J.; Han, H.; Li, S.; Ji, Z. Multiphase boundary of C16+ heavy n-alkanes and CO2 systems. Pet. Explor. Dev. 2017, 44, 105–110. [Google Scholar] [CrossRef]
  57. Jansen, J.D.; Fonseca, R.M.; Kahrobaei, S.; Siraj, M.M.; Van Essen, G.M.; Van den Hof, P.M.J. The egg model—A geological ensemble for reservoir simulation. Geosci. Data J. 2014, 1, 192–195. [Google Scholar] [CrossRef]
Figure 1. Sketch of the 1-D study. The injection strategies of interest are shown on the left. The periods of water and CO2 injection are denoted by W and G, respectively. The abbreviations of the injection strategies correspond to the sequence of these periods.
Energies 17 02259 g001
Figure 2. Compositional model of the reservoir fluid. The components are numbered from left to right.
Energies 17 02259 g002
Figure 3. The bubble point pressure (a) and the dynamic minimum miscibility pressure (b) against the oil density at surface conditions for the sampled fluids. The color shows the bulk concentration of C40 in the reservoir oil.
Energies 17 02259 g003
Figure 4. The phase diagrams for the three oil samples of the compositions given in Table 3. The panels (ac) correspond to the oil density of 780.9, 820.9 and 880.2 kg/m3. The reddish and greenish regions correspond to the single-phase and two-phase states of the fluid, respectively. The green curves are the contours s g = k / 10 , k = 1 9 .
Energies 17 02259 g004
Figure 5. The sampled net present values (a), the microscopic displacement efficiencies (b), the cumulative gas injection (c), and the carbon storage efficiencies (d) against the oil density ρ o s c at Ω = 1 . All parameters are shown for the optimized injection strategies at the time when the maximum of NPV was reached.
Energies 17 02259 g005
Figure 6. The simulated NPV for Ω = 2 , 1, and 0.5 ((a), (b), and (c), respectively).
Energies 17 02259 g006
Figure 7. The maximized NPV at different Ω and the three fixed oil compositions given in Table 3. The panels (ac) correspond to the oil density of 780.9, 820.9 and 880.2 kg/m3.
Energies 17 02259 g007
Figure 8. The sampled net present values (a), the microscopic displacement efficiencies (b), the cumulative gas injection (c), and the carbon storage efficiencies (d) against the oil density ρ o s c at Ω = 1 . All parameters are shown for the optimized injection strategies at the time when the maximum of NPV was reached. Parameters of the optimized strategies against ρ o s c for the randomly chosen z ( 2 ) , z ( 3 ) , and z ( 4 ) and the two fixed sets of z ( 5 ) , z ( 6 ) , and z ( 7 ) corresponding to the light (l) and heavy (h) oil samples in Table 3.
Energies 17 02259 g008
Table 1. The injection strategies.
AbbreviationDescription
WWaterflooding
GContinuous gas injection
WGGas injection after waterflooding
GWCO2 slug followed by continuous water injection
2(WG)WTwo identical WAG cycles followed by continuous water injection
Table 2. Parameters of the economic model in different units [12,51,52].
r o 20.27 USD/bbl150 USD/ton
r w i 2 USD/bbl12.5 USD/ton
r w p 1.5 USD/bbl9.5 USD/ton
r g i 2.55 USD/Mscf45 USD/ton
r g p 1.33 USD/Mscf23.5 USD/ton
Table 3. Parameters of the three selected samples of light (l), medium (m), and heavy (h) oil.
Sample z ( 5 ) z ( 6 ) z ( 7 ) ρ o sc P bub , barMMP, bar
l0.4560.0320.012780.9108.9148.8
m0.2790.1940.027820.9110.7337.4
h0.0310.2860.183880.2105.2268
Disclaimer/Publisher’s Note: The statements, opinions and data contained in all publications are solely those of the individual author(s) and contributor(s) and not of MDPI and/or the editor(s). MDPI and/or the editor(s) disclaim responsibility for any injury to people or property resulting from any ideas, methods, instructions or products referred to in the content.