Article

Analysis of the Influence of the 6-Pulse Thyristor-Bridge Input Reactor Size on the Shunt Active Power Filter Work Efficiency: A Case Study

by
Chamberlin Stéphane Azebaze Mboving
* and
Zbigniew Hanzelka
*
Department of Power Electronics and Energy Control Systems, Faculty of Electrical Engineering, Automatics, Computer Science and Biomedical Engineering, AGH University of Krakow, 30-059 Krakow, Poland
*
Authors to whom correspondence should be addressed.
Energies 2024, 17(1), 80; https://doi.org/10.3390/en17010080
Submission received: 30 October 2023 / Revised: 13 December 2023 / Accepted: 20 December 2023 / Published: 22 December 2023
(This article belongs to the Special Issue Whole-Energy System Modeling)

Abstract

:
This paper presents a case study in which the influence of the 6-pulse thyristor-bridge input reactor size on the shunt active power filter (SAPF)’s work performance is investigated. The purpose of using an SAPF in the power system is in most cases for fundamental harmonic reactive power compensation, harmonics and asymmetry mitigation. The work efficiency of such a filter depends not only on the designed control system, interface filter and dc-link capacitor parameters, but also on the parameters of the electrical system in which it is connected. Therefore, it is necessary to study and know the power system (supplier and consumer sides) before its installation. For instance, in the electrical system with diode or thyristor-bridge as loads, the SAPF performance efficiency may not be satisfied due to the high rate of current change (di/dt) at the points of commutation notches. In this paper, the performed simulation and laboratory experiments show that for a better operating efficiency of the SAPF, the input reactor parameters should be selected based not only on the effective reduction in the inverter switching ripple or the control system demand, but also on the parameters of the load, such as the parameters of the diode or thyristor-bridge input reactor. Apart from the experimental demonstrations on how the input reactor size influences the SAPF work efficiency, the novelties in this paper are: the formulated recommendations on how to choose the SAPF input reactor parameters (the SAPF is more efficient in terms of harmonics, asymmetry and reactive power mitigation when the inductance of its input reactor (L-filter) is smaller than the one of the diode or thyristor-bridge input reactor); the proposed SAPF control system; the proposed expressions to compute the SAPF input reactor inductance, DC voltage and capacitor.

1. Introduction

In recent years, the increase in nonlinear devices has become a serious problem for the electrical system because they consume reactive power and are the source of disturbances such as harmonics, asymmetry, flickers, voltage dips and swells, transients etc. These disturbances can be the cause of poor power quality and provoke many problems in the electrical system [1,2]. For instance, the reactive power if not compensated can cause system instability, voltage and current increases, power losses, etc. [3,4,5]. The harmonics, if not mitigated in the power system, can cause an increase in the voltage and current true RMS, the overloading, overheating, and even damage of electrical system elements (e.g., transformers, generators, cables, electric motors, capacitors, etc.) and other connected devices, the reduction in devices’ lifetime, the perturbation of the devices normal operation and increase in the operating costs, the inaccurate measurements of energy and power, the decrease in the power factor (PF), etc. [6,7,8,9,10]. The voltage or current unbalance can cause on the equipment (e.g., cables, induction motor, power electronics converters, transformers, etc.) additional power losses in terms of temperature, increasing their operating cost and reducing their lifetime [11,12,13,14,15,16,17,18]. It can be also the source of non-characteristic harmonics, as indicated in [19].
To maintain the grid power quality in compliance with the standard (e.g., IEC61000-2-4 standard [20]), many solutions are proposed, including passive harmonic filters (PHF), hybrid passive harmonic filters (HPHF), active power filters (APF), and hybrid active power filters (HAPF) [21,22,23,24,25,26,27].
The PHFs are commonly used in practice because they are low cost, simple in structure, easy to maintain, very efficient in terms of individual harmonic reduction, and easily applicable in low voltage (LV), medium voltage (MV), and high voltage (HV) systems [28,29,30,31]. But in comparison to the shunt active power filter (SAPF) and HAPF, they are less efficient in terms of power quality improvement and their work efficiency in terms of harmonics mitigation depends (in certain cases) on the grid impedance [32,33].
The HAPF solutions are also used in practice [34,35,36,37]. They are the combination of APF and PHF. The main objective of their application is the improvement in power quality at low exploitation cost. In combination with the PHF, the APF demands less power rate than when it is operating alone [38,39,40,41,42]. In [43], an example of an HAPF with small power rate (inverter DC voltage around 70 V) was investigated.
The APFs are organized in several categories and the most common ones are series APF (SAPF) and shunt APF [44]. The series APF is applied to improve the supply voltage, protecting the sensitive loads from disturbances such as voltage harmonics, fluctuation (e.g., voltage stabilizer), unbalance, dip, swell (e.g., dynamic voltage restorer (DVR)) etc. [45,46].
The shunt active power filters (SAPF) exist in different topologies (e.g., the three and four wires) and despite their disadvantages (high cost [47], complex control system, difficulties in large scale implementation [48,49], etc.), they are still used in industries as well as in low and medium voltage installation system [50,51]. They are applied in most cases for the fundamental harmonic reactive power compensation, current unbalance and current harmonics mitigation [52,53,54,55,56]. Their work principle is to extract the load current disturbances (e.g., current harmonics, unbalance) through the control system algorithm and to inject them in opposite sign at the PCC (point of common coupling) so that they will be cancelled with the disturbances coming from the load side, therefore ensuring good power quality at the grid side.
The performance of the SAPF is based on its capability to improve the power quality at the grid side by considerably mitigating disturbances coming from the load side. The SAPF is constituted of three important parts: the control system, dc-link capacitor and the interface filter at its input. To improve the SAPF performance efficiency, many studies in the literature have focused on the improvement in those three parts and proposing new solutions. Concerning the SAPF control system, many new strategies have been proposed [57,58,59,60,61]. In [57], for instance, a new strategy of reference current generation is proposed in the frame of d-q theory (synchronous reference frame theory). In the goal of improving the dc-link voltage controller and reducing the dc-link capacitance, many strategies have also been proposed [62,63].
The interface filter at the SAPF input plays a very important role in the SAPF performance because it filters the switching ripple harmonics contained in the inverter output voltage and current and ensures a dynamic response of the inverter current (rapid current tracking response) [64]. It exists in several structures (L, LC, LCL, LCL-LC, LLCL, etc.), but those with a capacitor have a common problem of resonance which can compromise the power system stability [65,66].
In the case of the L-filter, it is more preferable (in certain cases) than the filters with a capacitor because it does not present the resonance problem despite its lower efficiency (when compared to filters with a capacitor) in terms of switching ripple mitigation and dynamic response [67,68,69]. Moreover, it is bulky and requires a large-size reactor for an efficient performance in terms of switching ripple reduction. The disadvantages of a large size L-filter are the power losses, exploitation costs increase, negative effects on the SAPF dynamic characteristics and compensation performances [70]. In the literature, the switching ripple reduction and the improvement of the SAPF dynamic respond in terms of rapid inverter current tracking are two of the principal criteria that are proposed to be taken into account while designing the L-filter. However, in this paper, an additional new criterion is proposed: the size of the load input reactor (case of diode or thyristor-bridge with interface line reactor) which also plays an important role on the inverter current dynamic respond.
The SAPF performance efficiency should not only depend on the inverter parameters (e.g., switching frequency, interface filter (L, LC, LCL, LCL-LC, etc.)) or designed control system, but also on the parameters of the power system to which it is connected. For instance, in the electrical system with a diode or thyristor-bridge as a load, the accepted performance efficiency of the SAPF (with L-filter) may not be met due to the high rate of load current change (di/dt) at the commutation notches. Therefore, it is necessary to study the power system in terms of equivalent parameters (grid and load sides) before its installation. That problem is also investigated in [71].
In this paper, the SAPF with an input reactor L _ i n v (see Figure 1) is investigated. It is proved that to obtain a better SAPF work efficiency, its input reactor parameters should be selected based not only on the effective reduction in the inverter switching ripple or the control system demand (e.g., rapid dynamic response), but also on the load parameters, such as the parameters of the diode or thyristor-bridge input line reactor (see L T in Figure 1). For clarification, two case studies are considered in this paper: in the first one, the influence of the SAPF input reactor size (load input reactor parameters are constant) on its work efficiency is presented. In the second one, the influence of the load input reactor on the SAPF work efficiency is presented (SAPF input reactor parameters are constant). The paper is organized into three parts: the first one is based on the simulation studies (MATLAB/SIMULINK, version R2015a and R2021b [72]) and presents the proposed expressions used to compute the SAPF parameters; it also includes the investigation of the influence of the inverter input reactor size on the SAPF work efficiency, as well as the investigation of the influence of the thyristor-bridge input reactor size on the SAPF work efficiency. The second part presents the laboratory experiments and the third part presents the conclusions.

2. Simulation Study

2.1. Presentation of the Simulated Power System

The equivalent circuit of the simulated power system is presented in Figure 1. It is constituted of three parts: the electrical grid, the load and the SAPF. The electrical grid equivalent parameters in Figure 1 are computed from the real electrical grid feeding the laboratory set-up (see Figure 2). In Figure 2, it can be seen that the parameters of the electrical grid are calculated from the medium- to the low-voltage side. The load is a three-phase thyristor-bridge with a resistance (RDC) at its DC side and a reactor (LT) at its AC side. The resistance (Rasym) is connected between phases to ensure the current unbalance condition. The load parameters are from the laboratory set-up apart from Rasym. The SAPF with the control system (Figure 1) is applied for harmonics, reactive power and asymmetry compensation. It is a three-leg three-wire inverter with a reactor (L_inv) at its AC side and capacitor (C_inv) at its AC side.

2.1.1. Description of the Proposed Control System

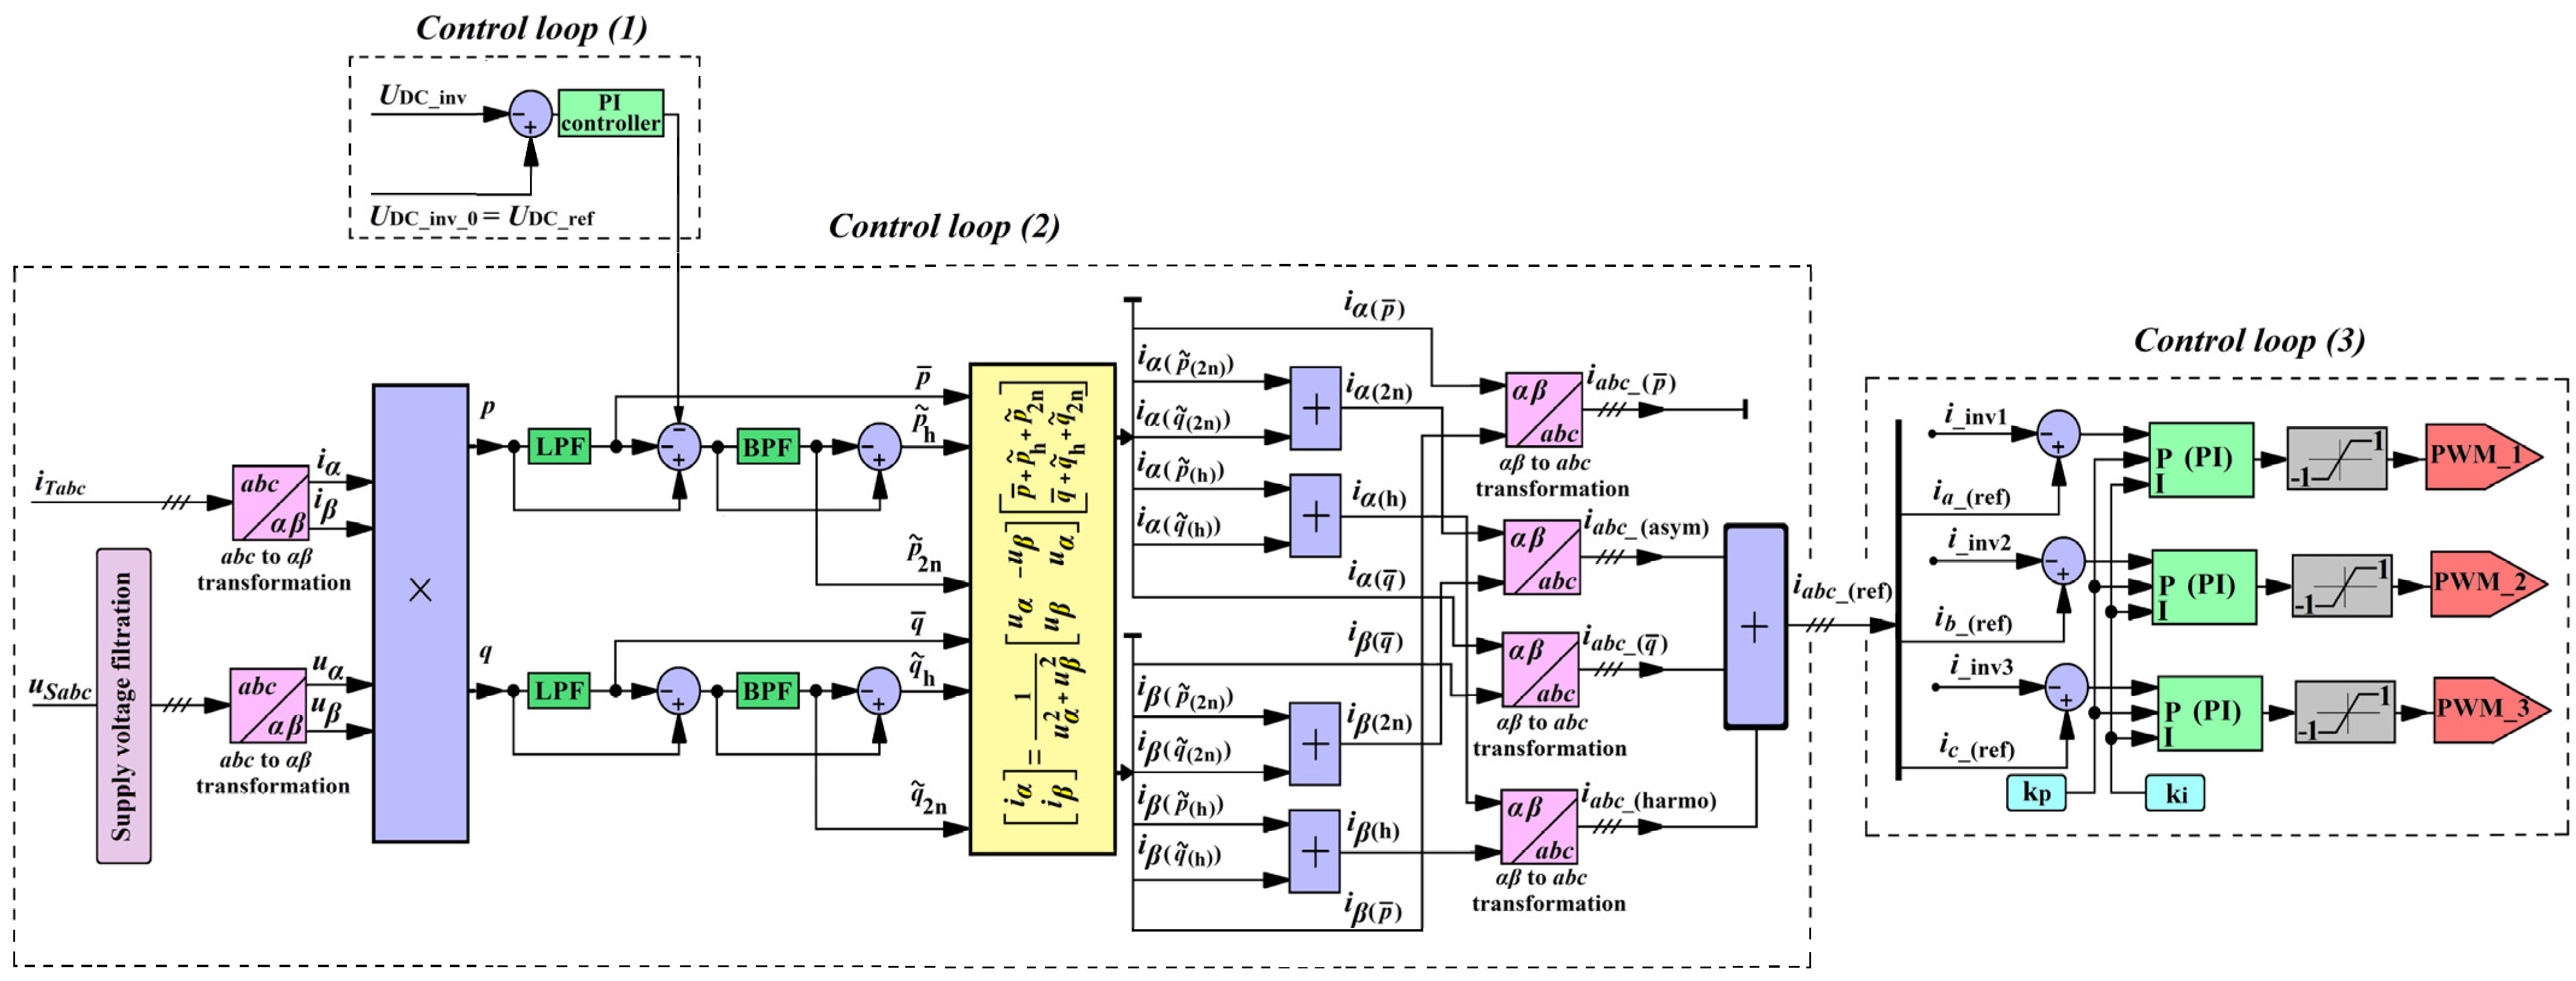
The proposed control system of the SAPF is presented in Figure 3. Its algorithm is based on the time domain instantaneous p-q theory [73,74,75]. It is organized in three important control loops (control loops (1), (2) and (3)).
The role of control loop (1) (see Figure 3) is to maintain the SAPF DC voltage (UDC_inv) at a constant and at the level provided by the reference voltage (UDC_ref) [43,76]. The reached maximum voltage during the transient state (e.g., capacitor charging) and its duration depend upon the value of the capacitor capacitance and the PI controller parameters (see Figure 3).
In control loop (2) the e p-q algorithm is applied. Its role is to split the distorted instantaneous load current ( i T a b c ) into four different components (see Figure 3): active ( i a b c _ ( p ¯ ) ), reactive ( i a b c _ ( q ¯ ) ), related to asymmetry ( i a b c _ ( a s y m ) ), and harmonic distortion ( i a b c _ ( h a r m o ) ). The output signal of control loop (2) is therefore the instantaneous reference current ( i a b c _ ( r e f ) ) which is constituted of three components (reactive, asymmetry and harmonic currents) as shown in Figure 3 (the active component ( i a b c _ ( p ¯ ) ) is not considered).
Observing the control loop (2) algorithm, it can be seen that splitting of the instantaneous load current ( i T a b c ) into different components starts from the its measurement as well as the measurement of the instantaneous PCC voltage ( u S a b c ). The supply voltage is filtered (“supply voltage filtration”) to avoid its distortions being located in the reference current. The instantaneous real (p) and imaginary (q) powers are obtained after transforming the instantaneous PCC voltage and current from the a-b-c coordinates to the α-β rectangular coordinates. The low-pass filter (LPF) and band-pass filter (BPF) are used to filter the instantaneous real (p) and imaginary (q) powers so that their components (( p - , q - )—constant components related to the fundamental harmonic (positive sequence), ( p ~ h , q ~ h )—components related to the current harmonic and ( p ~ 2 n , q ~ 2 n )—components related to the current asymmetry (negative sequence of the fundamental harmonic)) can be used in the matrix system (see Figure 3) to compute the instantaneous reference currents ( i α , i β ) in α-β axes. After the matrix computation, different current components are obtained: ( i α ( p - ) , i β ( p - ) ) —instantaneous real current (fundamental harmonic) in the α and β axis, respectively; (( i α ( p ~ 2 n ) , i α ( q ~ 2 n ) ),( i β ( p ~ 2 n ) , i β ( q ~ 2 n ) ))—instantaneous asymmetry current in the α and β axis, respectively; (( i α ( p ~ h ) , i α ( q ~ h ) ),( i β ( p ~ h ) , i β ( q ~ h ) ))—instantaneous harmonic current in the α and β axis, respectively; ( i α ( q - ) , i β ( q - ) ) —instantaneous imaginary current (fundamental harmonic) in the α and β axis, respectively. The components such as i α ( 2 n ) and i β ( 2 n ) are the instantaneous asymmetry current in the α and β axis, respectively, and the components such as i α ( h ) and i β ( h ) are the instantaneous harmonics current in the α and β axis, respectively. The instantaneous load current components ( i abc _ ( asym ) , i abc _ ( q - ) , i abc _ ( harmo ) ) can be seen at the end of control loop (2) after the inverse transformation from α-β to a-b-c coordinates (see i abc _ ( ref ) in Figure 3).
In control loop (3), the instantaneous reference current ( i abc _ ( ref ) ) is compared to the feedback loop current coming from the inverter input ( i _ i n v 123 ). The blocks of the PI controller, saturation and pulse-width modulation (PWM) system can also be seen (Figure 3).

2.1.2. Proposed Expressions for the SAPF Parameters Computation

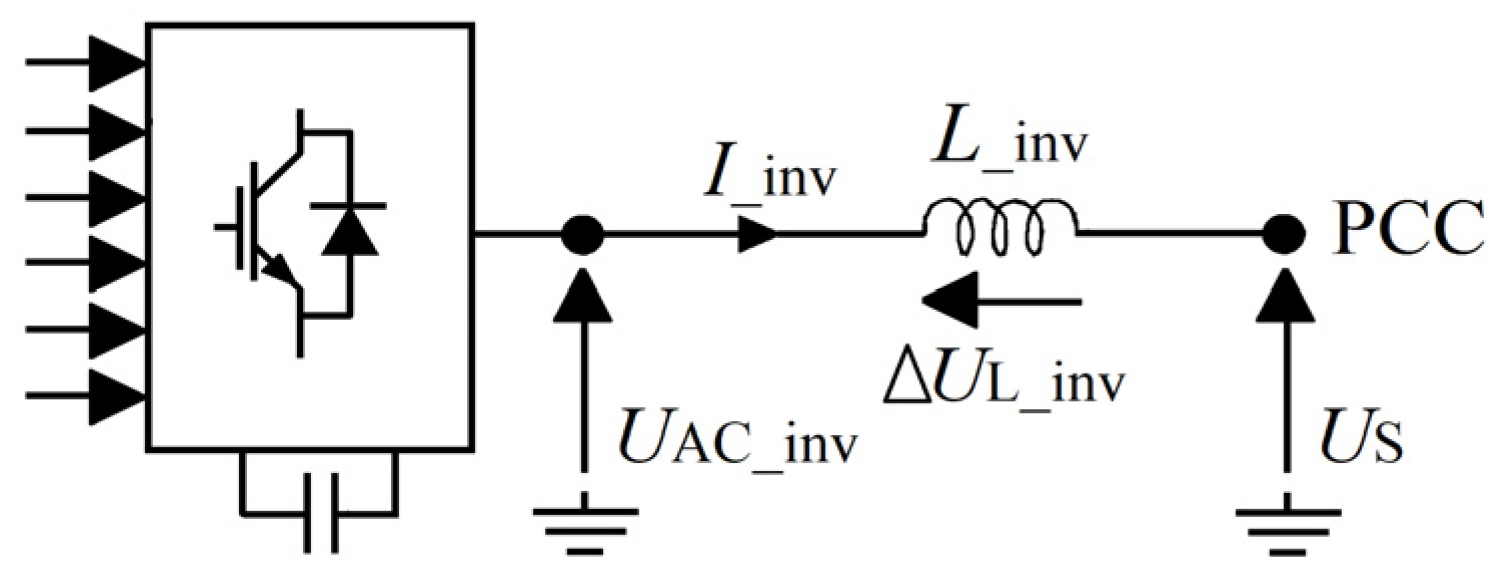
The voltage drop ( Δ U L _ inv ) of the SAPF input reactor ( L _ inv ) is expressed in (1). It is the difference between the RMS value (fundamental) of the input inverter voltage ( U AC _ inv ) and the PCC voltage ( U S ) (see Figure 4). The role of the SAPF is to produce the compensating current (e.g., i _ i n v 1 ) based on the reference current (e.g., i a _ ( ref ) ) and because of that I _ inv is assumed to be equal to I _ ( ref ) as presented in expression (2) (the number 3 means three-phase). The proposed expression to compute the SAPF input reactor inductance is presented in (3) ( I a _ ( ref ) , I b _ ( ref ) and I c _ ( ref ) are RMS values of the reference current in each phase):
Δ U L _ inv = U AC _ inv U S = L _ inv ω ( 1 ) I _ inv
I _ inv = I _ ( ref ) = I a _ ( ref ) + I b _ ( ref ) + I c _ ( ref ) 3
L _ inv = 3 Δ U L _ inv ω 1 ( I a _ ( ref ) + I b _ ( ref ) + I c _ ( ref ) )
The relationship between the SAPF reference DC voltage ( U DC _ inv _ 0 ) and the PCC phase to phase AC voltage ( U S _ p - p ) is proposed in (4). The DC capacitor reference voltage is proposed to be higher than the maximum phase to phase PCC voltage (see expression (4)).
The capacitor DC voltage ripple varies between the extremums ( U DC _ inv _ max and U DC _ inv _ min ), as presented in Figure 5. The capacitor DC voltage variation ( Δ U DC _ inv —see Figure 5) also corresponds to a capacitor energy variation ( Δ W DC _ inv ).
The SAPF DC capacitor reference energy ( W DC _ inv _ 0 ) is expressed by (5) and the maximum and minimum energy are expressed, respectively, in (6) and (7). The DC capacitor minimum voltage ( U DC _ inv _ min ) is expressed in (8). The DC capacitor energy variation ( Δ W DC _ inv ) between the max and the min is presented in (9) and (10). By using expression (11) in (10), the proposed expression of the SAPF DC capacitor is obtained in (12):
U DC _ inv _ 0 > k DC 2 U S _ p - p ,   k DC 1
W DC _ inv _ 0 = 1 2 C _ inv U D C _ i n v _ 0 2
W DC _ inv _ max = 1 2 C _ inv U D C _ i n v _ m a x 2
W DC _ inv _ min = 1 2 C _ inv U D C _ i n v _ m i n 2
U DC _ inv _ min = U DC _ inv _ max Δ U DC _ inv
W DC _ inv _ max W DC _ inv _ min = Δ W DC _ inv = 1 2 C _ inv ( U D C _ i n v _ m a x 2 U D C _ i n v _ m i n 2 )
Δ W DC _ inv = 1 2 C _ inv ( 2 U DC _ inv _ max Δ U DC _ inv Δ U D C _ i n v 2 )
U DC _ inv _ max = U DC _ inv _ 0 + Δ U DC _ inv 2
C _ inv = Δ W DC _ inv U DC _ inv _ 0   Δ U DC _ inv

2.2. Simulation Assumption

The electrical grid parameters in Figure 1 are computed from the laboratory parameters. The thyristor-bridge firing angle value is constant and its input reactor resistance is neglected. The asymmetry resistance ( R asym ) value is chosen based on the practical approach (Figure 1).
An example of SAPF parameter computation is presented in Table 1. The expressions (3), (4) and (12) were used to calculate the inverter input inductance ( L _ inv ), DC voltage ( U DC _ inv 0 ) and capacitance ( C _ inv ), respectively. The minimum value of the inverter input reactor inductance ( L _ inv _ min ) is obtained after assuming a minimum voltage drop on the inverter input reactor (e.g., Δ U L _ inv _ min = 3 V) and the maximum value ( L _ inv _ max ) is obtained after assuming a maximum voltage drop on the inverter input reactor (e.g., Δ U L _ inv _ max = 16 V). The reference current RMS values ( I a _ ( ref ) , I b _ ( ref ) , I c _ ( ref ) ) are obtained at the end of control loop (2)) before the SAPF connection to the PCC.
The PI controller parameters of control loop (1) and control loop (3) presented in Table 2 are selected on the basis of practical knowledge. Those parameters are constant during the simulation studies. The SAPF switching frequency is fixed to 20 kHz and the AC side input reactors and DC side capacitor resistances are neglected during the studies.
The expressions from (13) to (17) are used to compute the grid current negative sequence in percentage of positive sequence (kasym), the grid voltage and current total harmonic distortion (THD) and true total harmonic distortion ((TTHD) see (16) and (17)) [77,78].
k a s y m = I S ( 1 ) ( ) I S ( 1 ) ( + )
T H D U s = n = 2 50 U s ( n ) 2 U S ( 1 )
T H D I s = n = 2 50 I s n 2 I S 1
T T H D U s = U S _ t r u e _ R M S 2 U S ( 1 ) 2 U S ( 1 )
T T H D I s = I S _ t r u e _ R M S 2 I S ( 1 ) 2 I S ( 1 )

2.3. Simulation Results

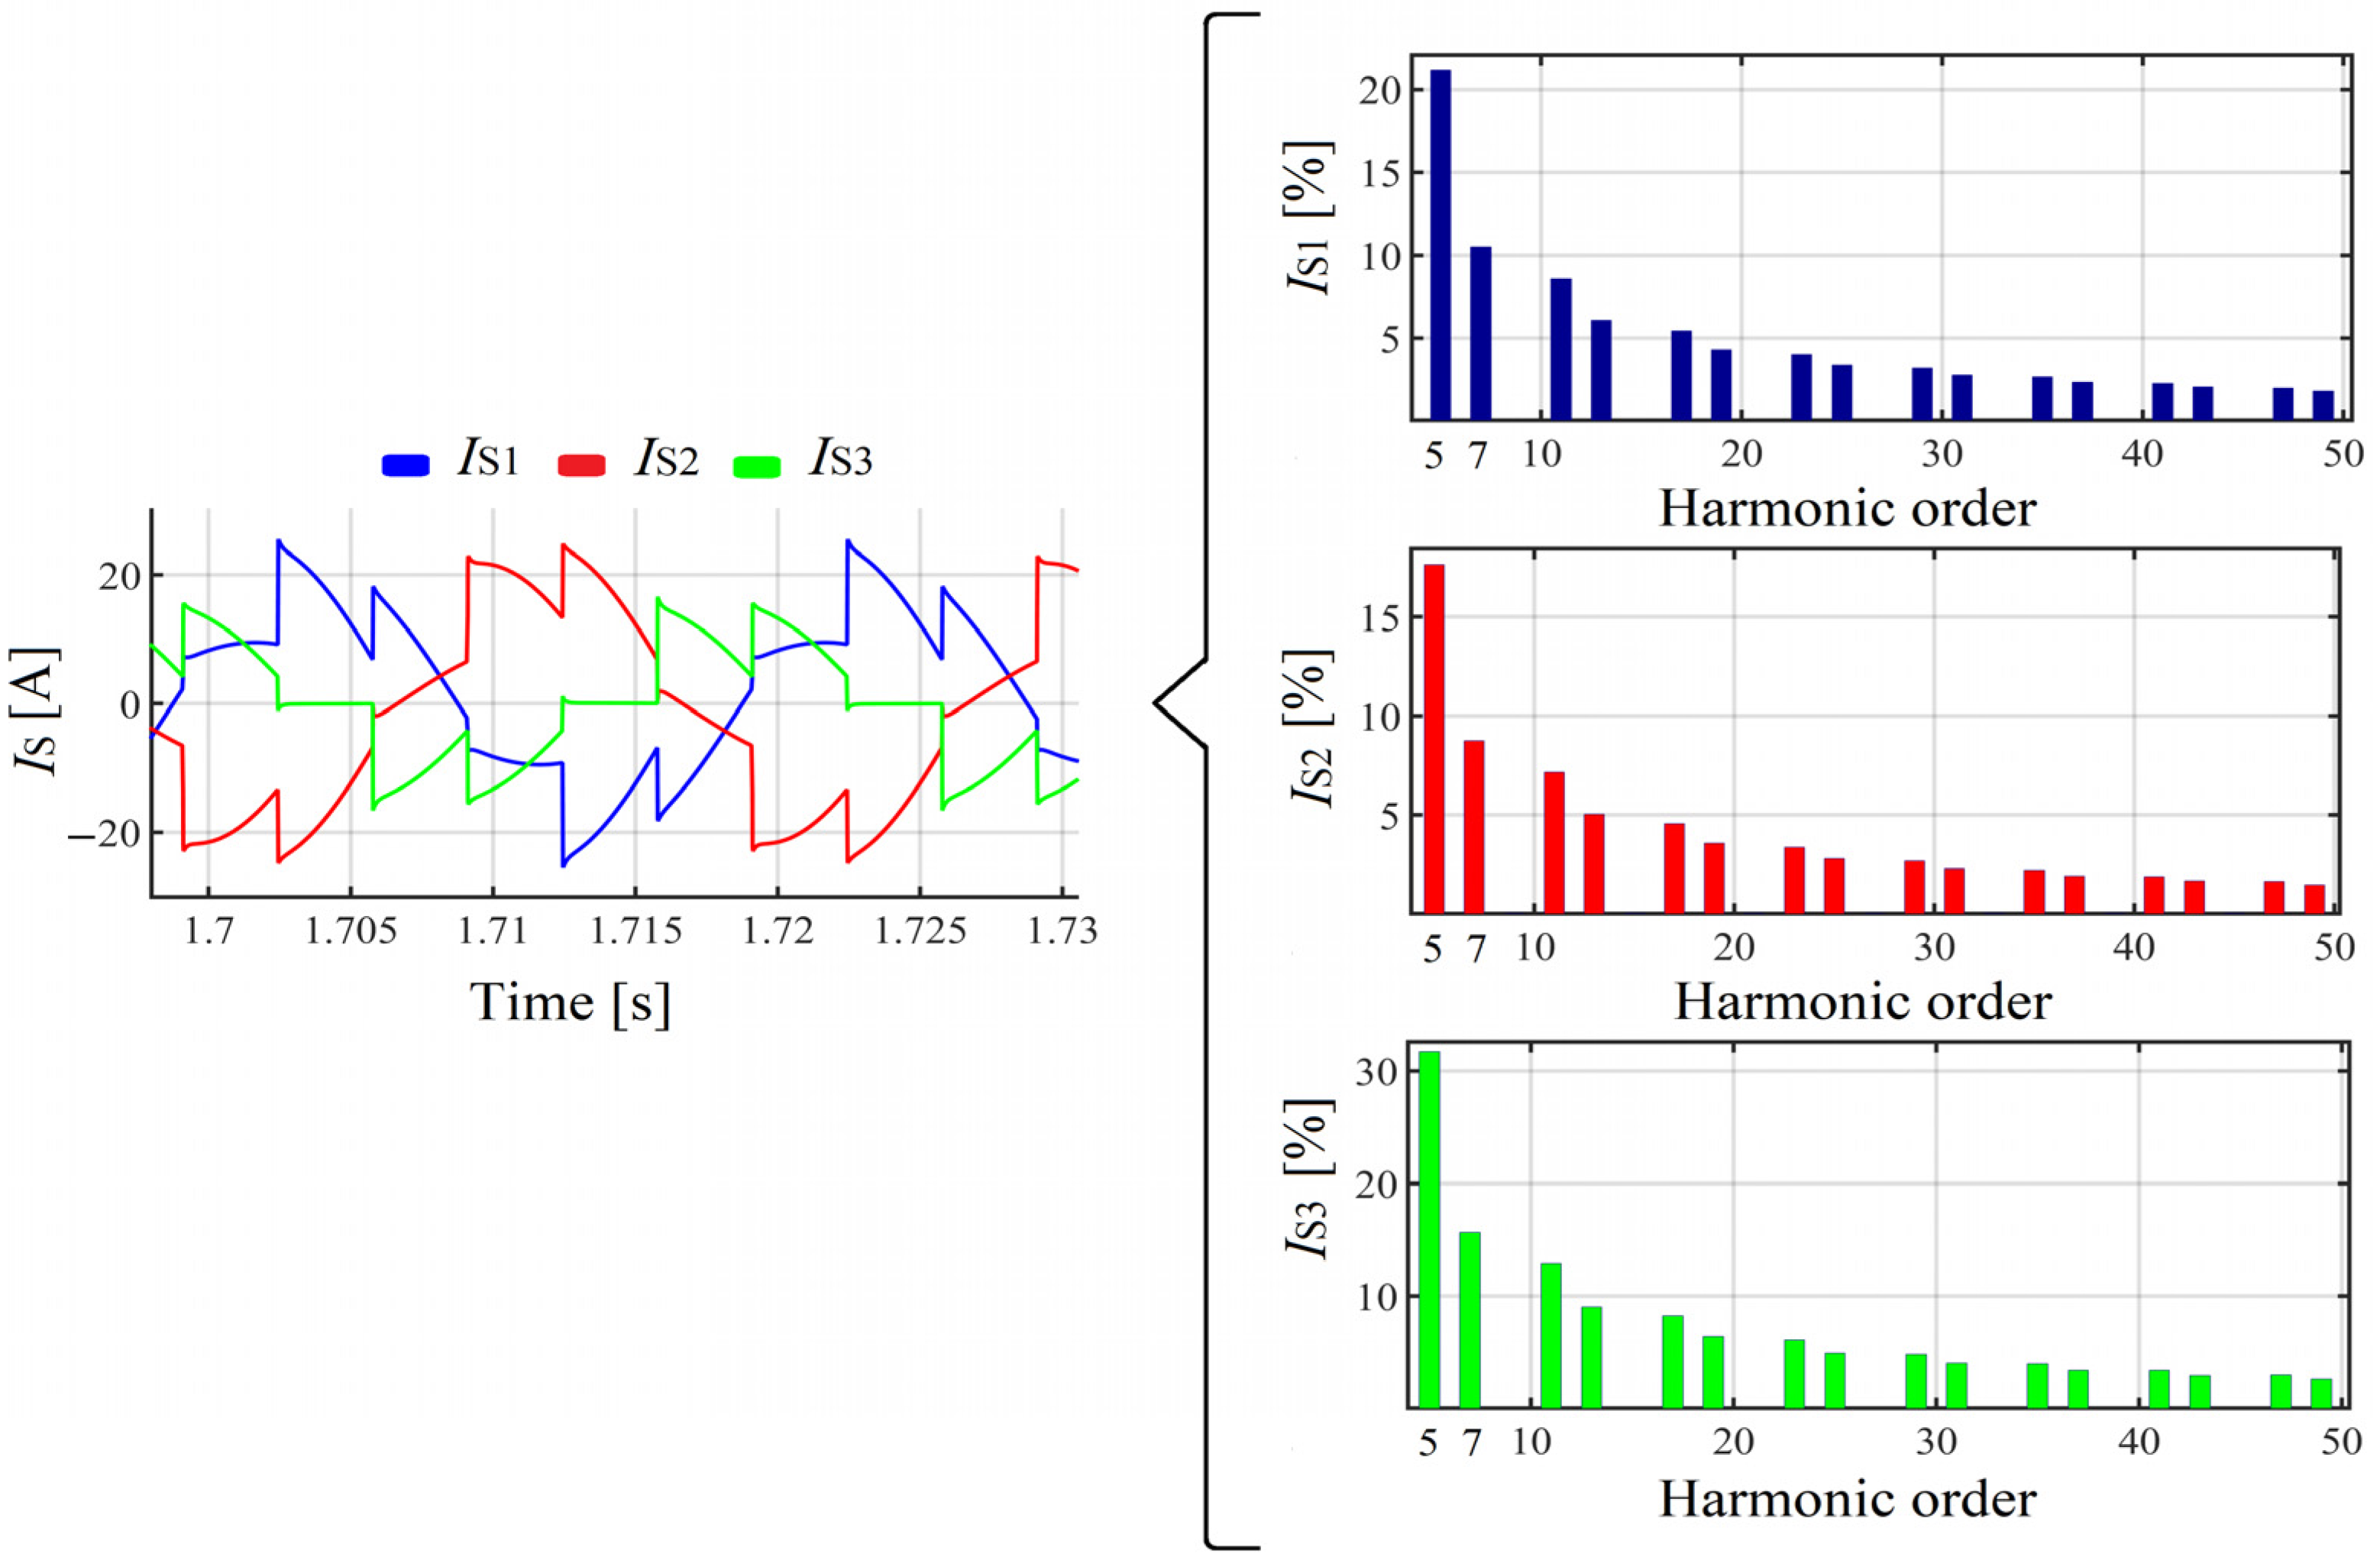
The grid voltage and current waveforms (with spectrums) before the SAPF connection are demonstrated in Figure 6 and Figure 7, respectively. In Figure 6, only one-phase of the grid voltage spectrum is presented. The phase unbalance can be observed on the grid current waveforms (which are not identical) and spectrums (Figure 7).
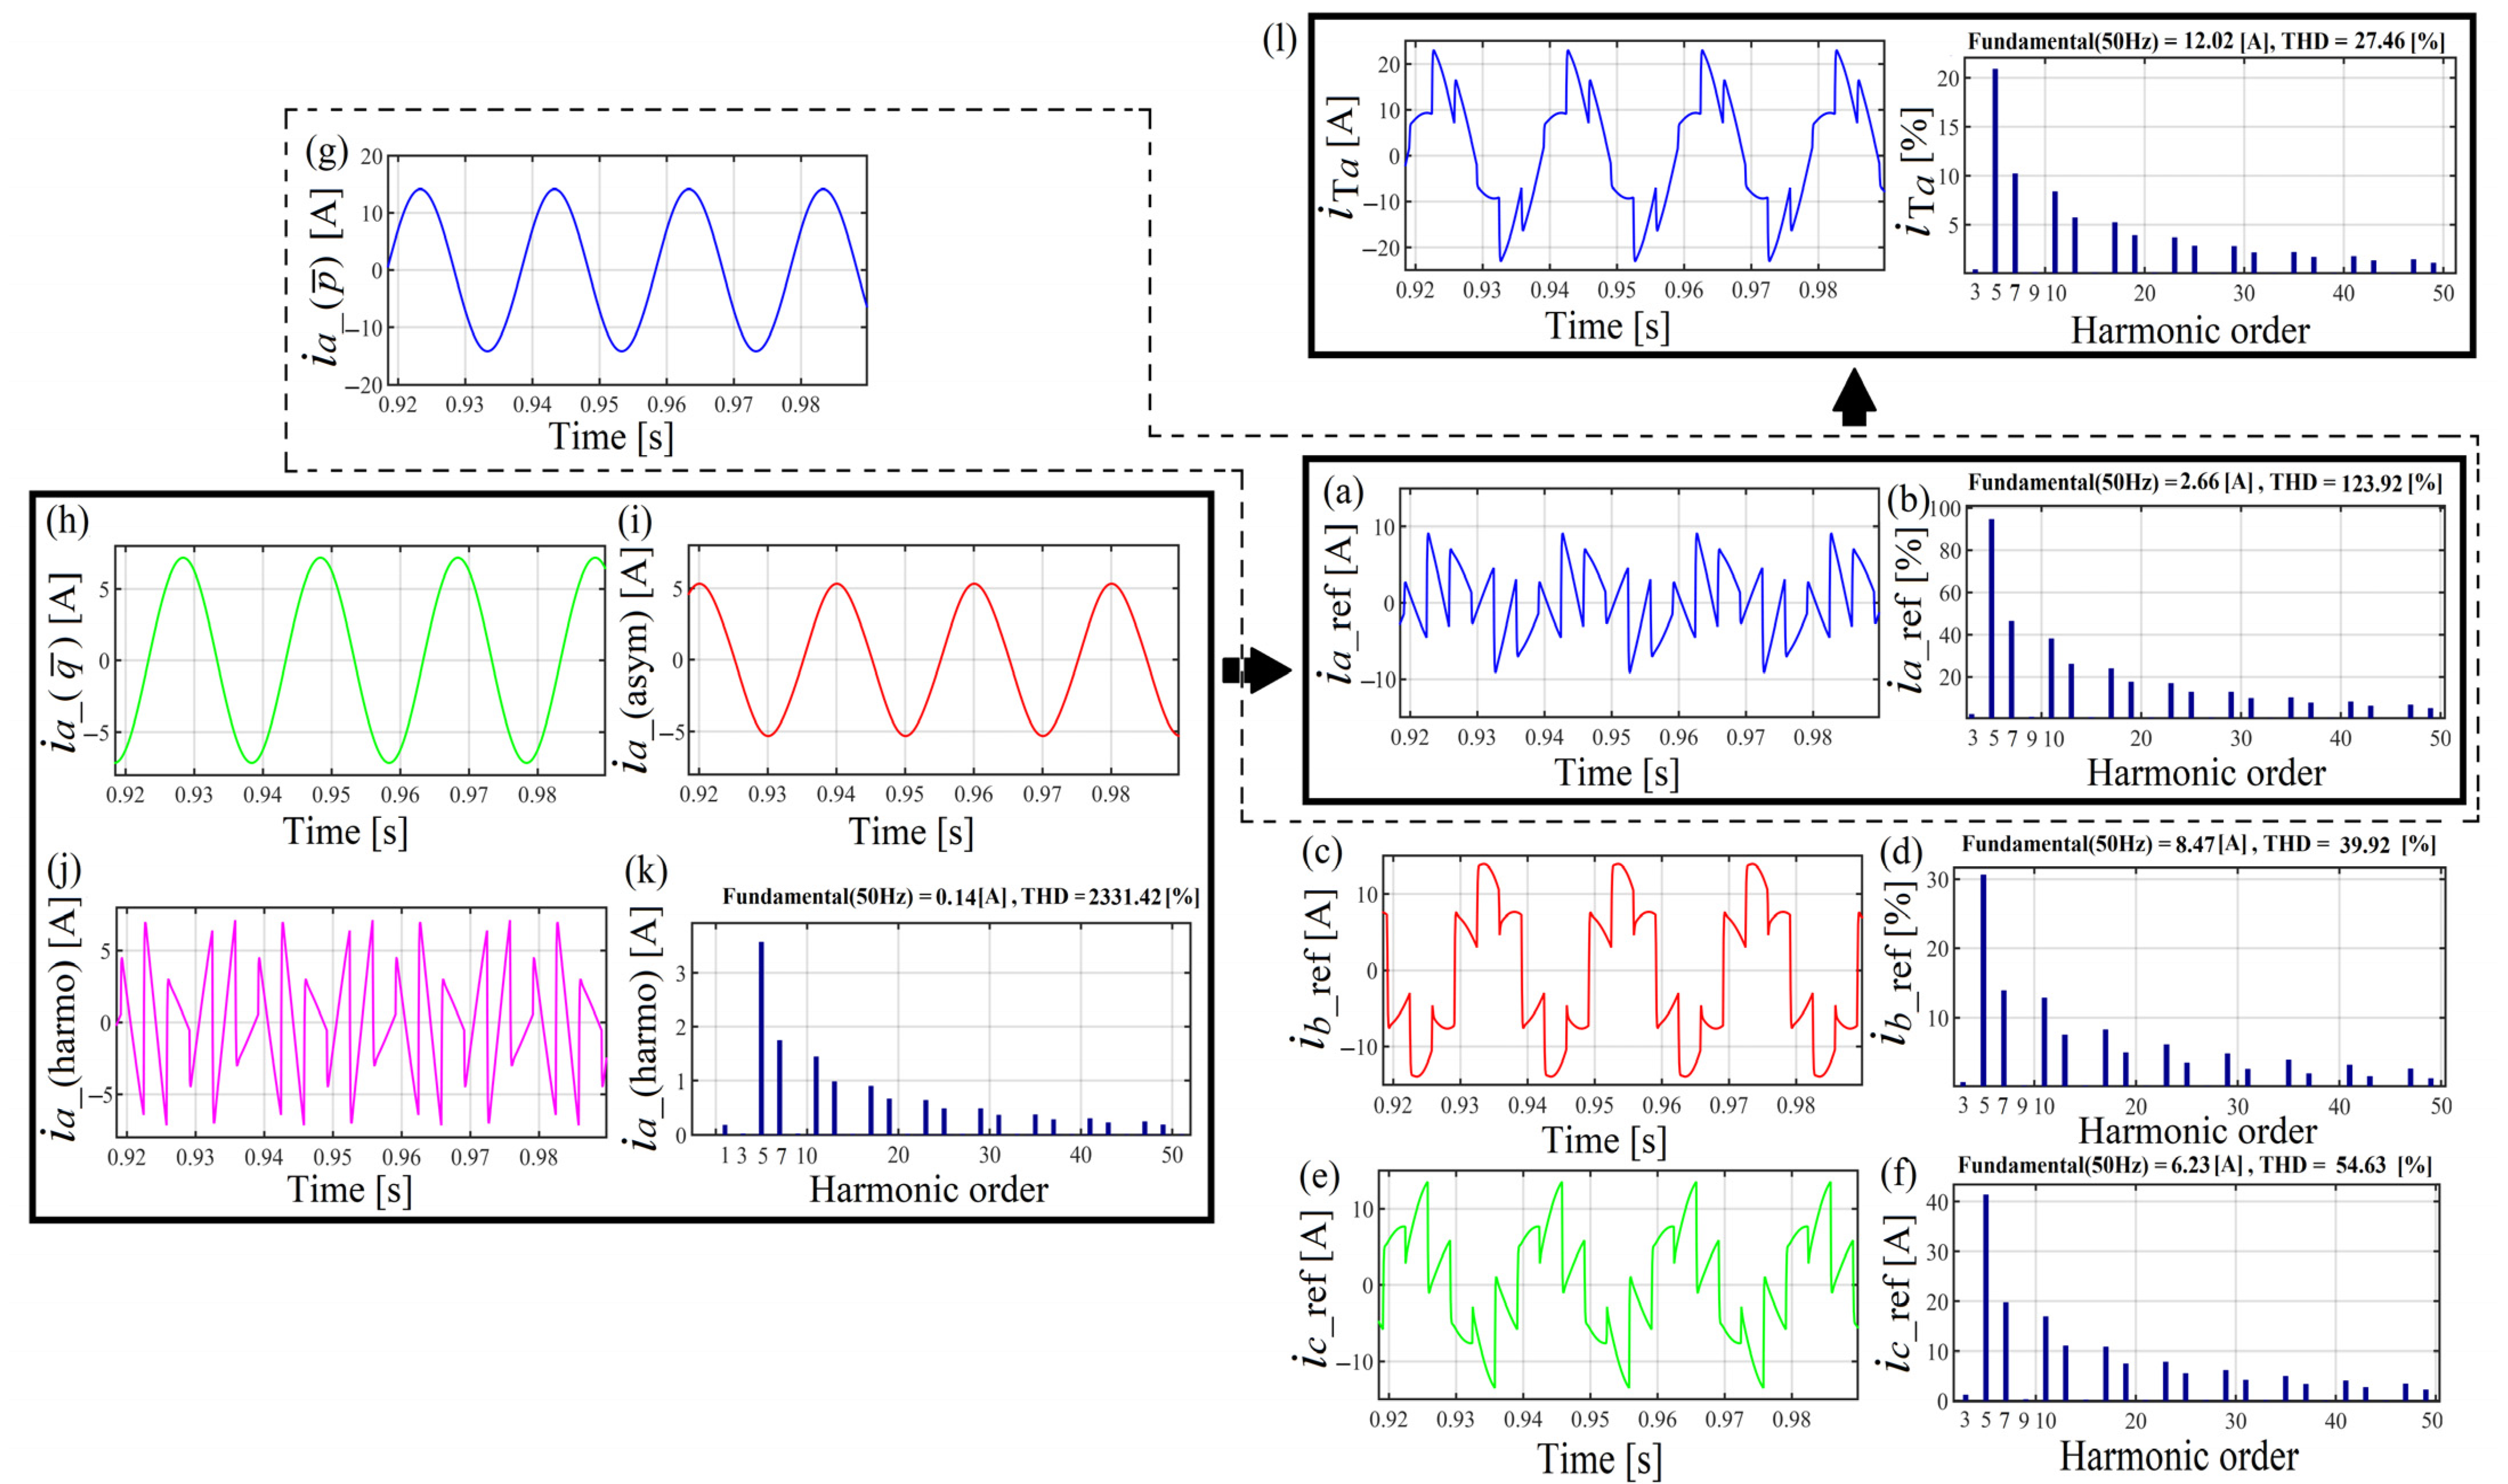
In Figure 8a–f, an example of reference current waveforms at the output of control loop (2) (see Figure 3) before the SAPF connection is presented together with the spectrums. Figure 8h–j present the current components (one-phase) contained in the reference current (e.g., i a _ ref ). The current waveforms in Figure 8l ( i T a ) are the sum of all current waveforms from Figure 8g to Figure 8j ( i T a is the same as the load current). In the reference current spectrums of Figure 8b,d,f), the appearance of the 3rd harmonic (triplen harmonics) is noted, which did not exist in the grid voltage and current spectrums (this is one of the disadvantages of the instantaneous p-q theory).

2.4. First Simulation Results

Influence of the Inverter Input Reactor Size on the SAPF Work Efficiency

The goal is to demonstrate how the size of the inverter input reactor influences the SAPF work efficiency. For that reason, two values of the SAPF input reactor inductance are considered: L _ inv _ min = 1.4 mH and L _ inv _ max = 7.2 mH. Those values were computed based on the chosen values of the input reactor voltage drop (see Δ U L _ inv in Table 1). The load input reactor ( L T ) is constant during the experiment and is equal to 0.25 mH.
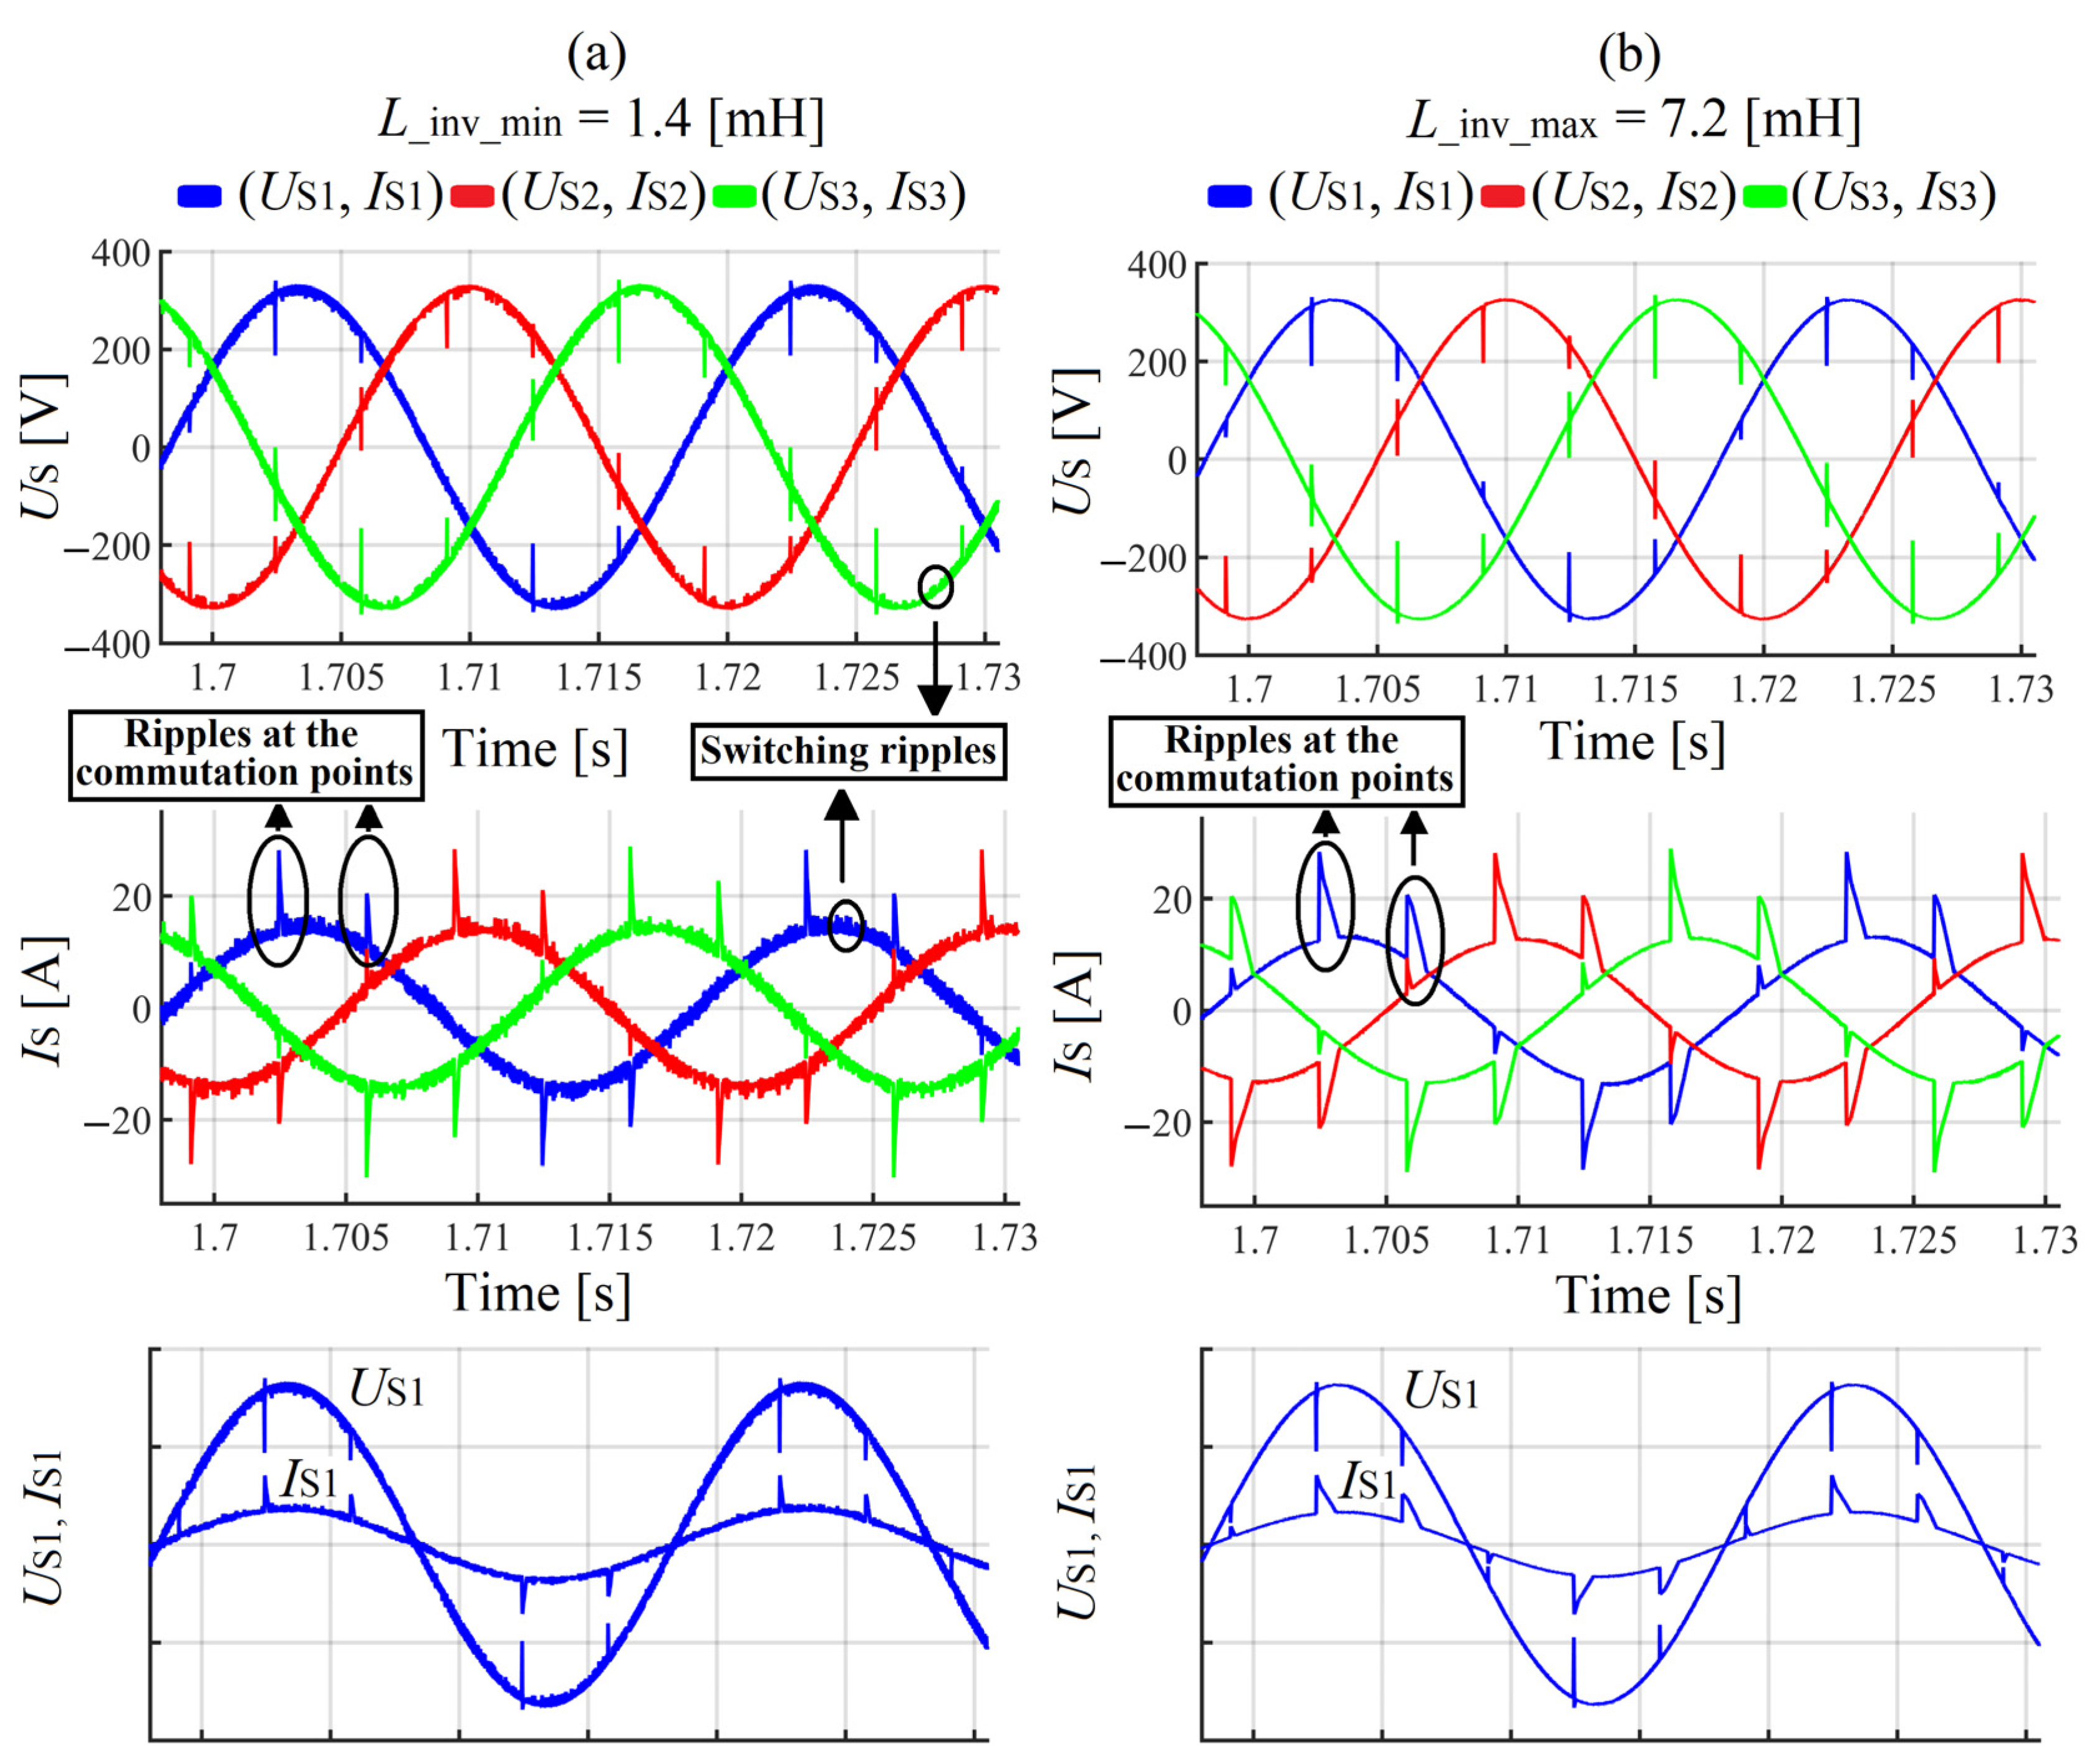
After the SAPF connection, the grid current and PCC voltage waveforms as well as the waveforms of the injected current are presented in Figure 9a,b and Figure 10a,b, respectively. On the one hand, the SAPF with minimum input reactor inductance L _ inv _ min (see Figure 9a and Figure 10a) presents higher switching components (switching ripples) than the SAPF with the maximum input reactor inductance L _ inv _ max (see Figure 9b and Figure 10b). On the other hand, it presents a better shape of the grid current waveforms at the commutation notches (comparing the grid current waveforms in Figure 9a to those in Figure 9b).
The values of the PCC voltage and grid current fundamental harmonic before and after the SAPF connection are presented in Table 3 and Table 4, respectively. The grid current and voltage THD in the case of the SAPF with L _ inv _ min is smaller than in the case of the SAPF with L _ inv _ max (Table 4) (the same interpretation concerns the grid current asymmetry coefficient (see Table 4)). In Table 5, it can be seen that in the case of the SAPF with the L _ inv _ max , grid voltage the TTHD is lower and the grid current TTHD is higher when compared to the case of the SAPF with L _ inv _ min .
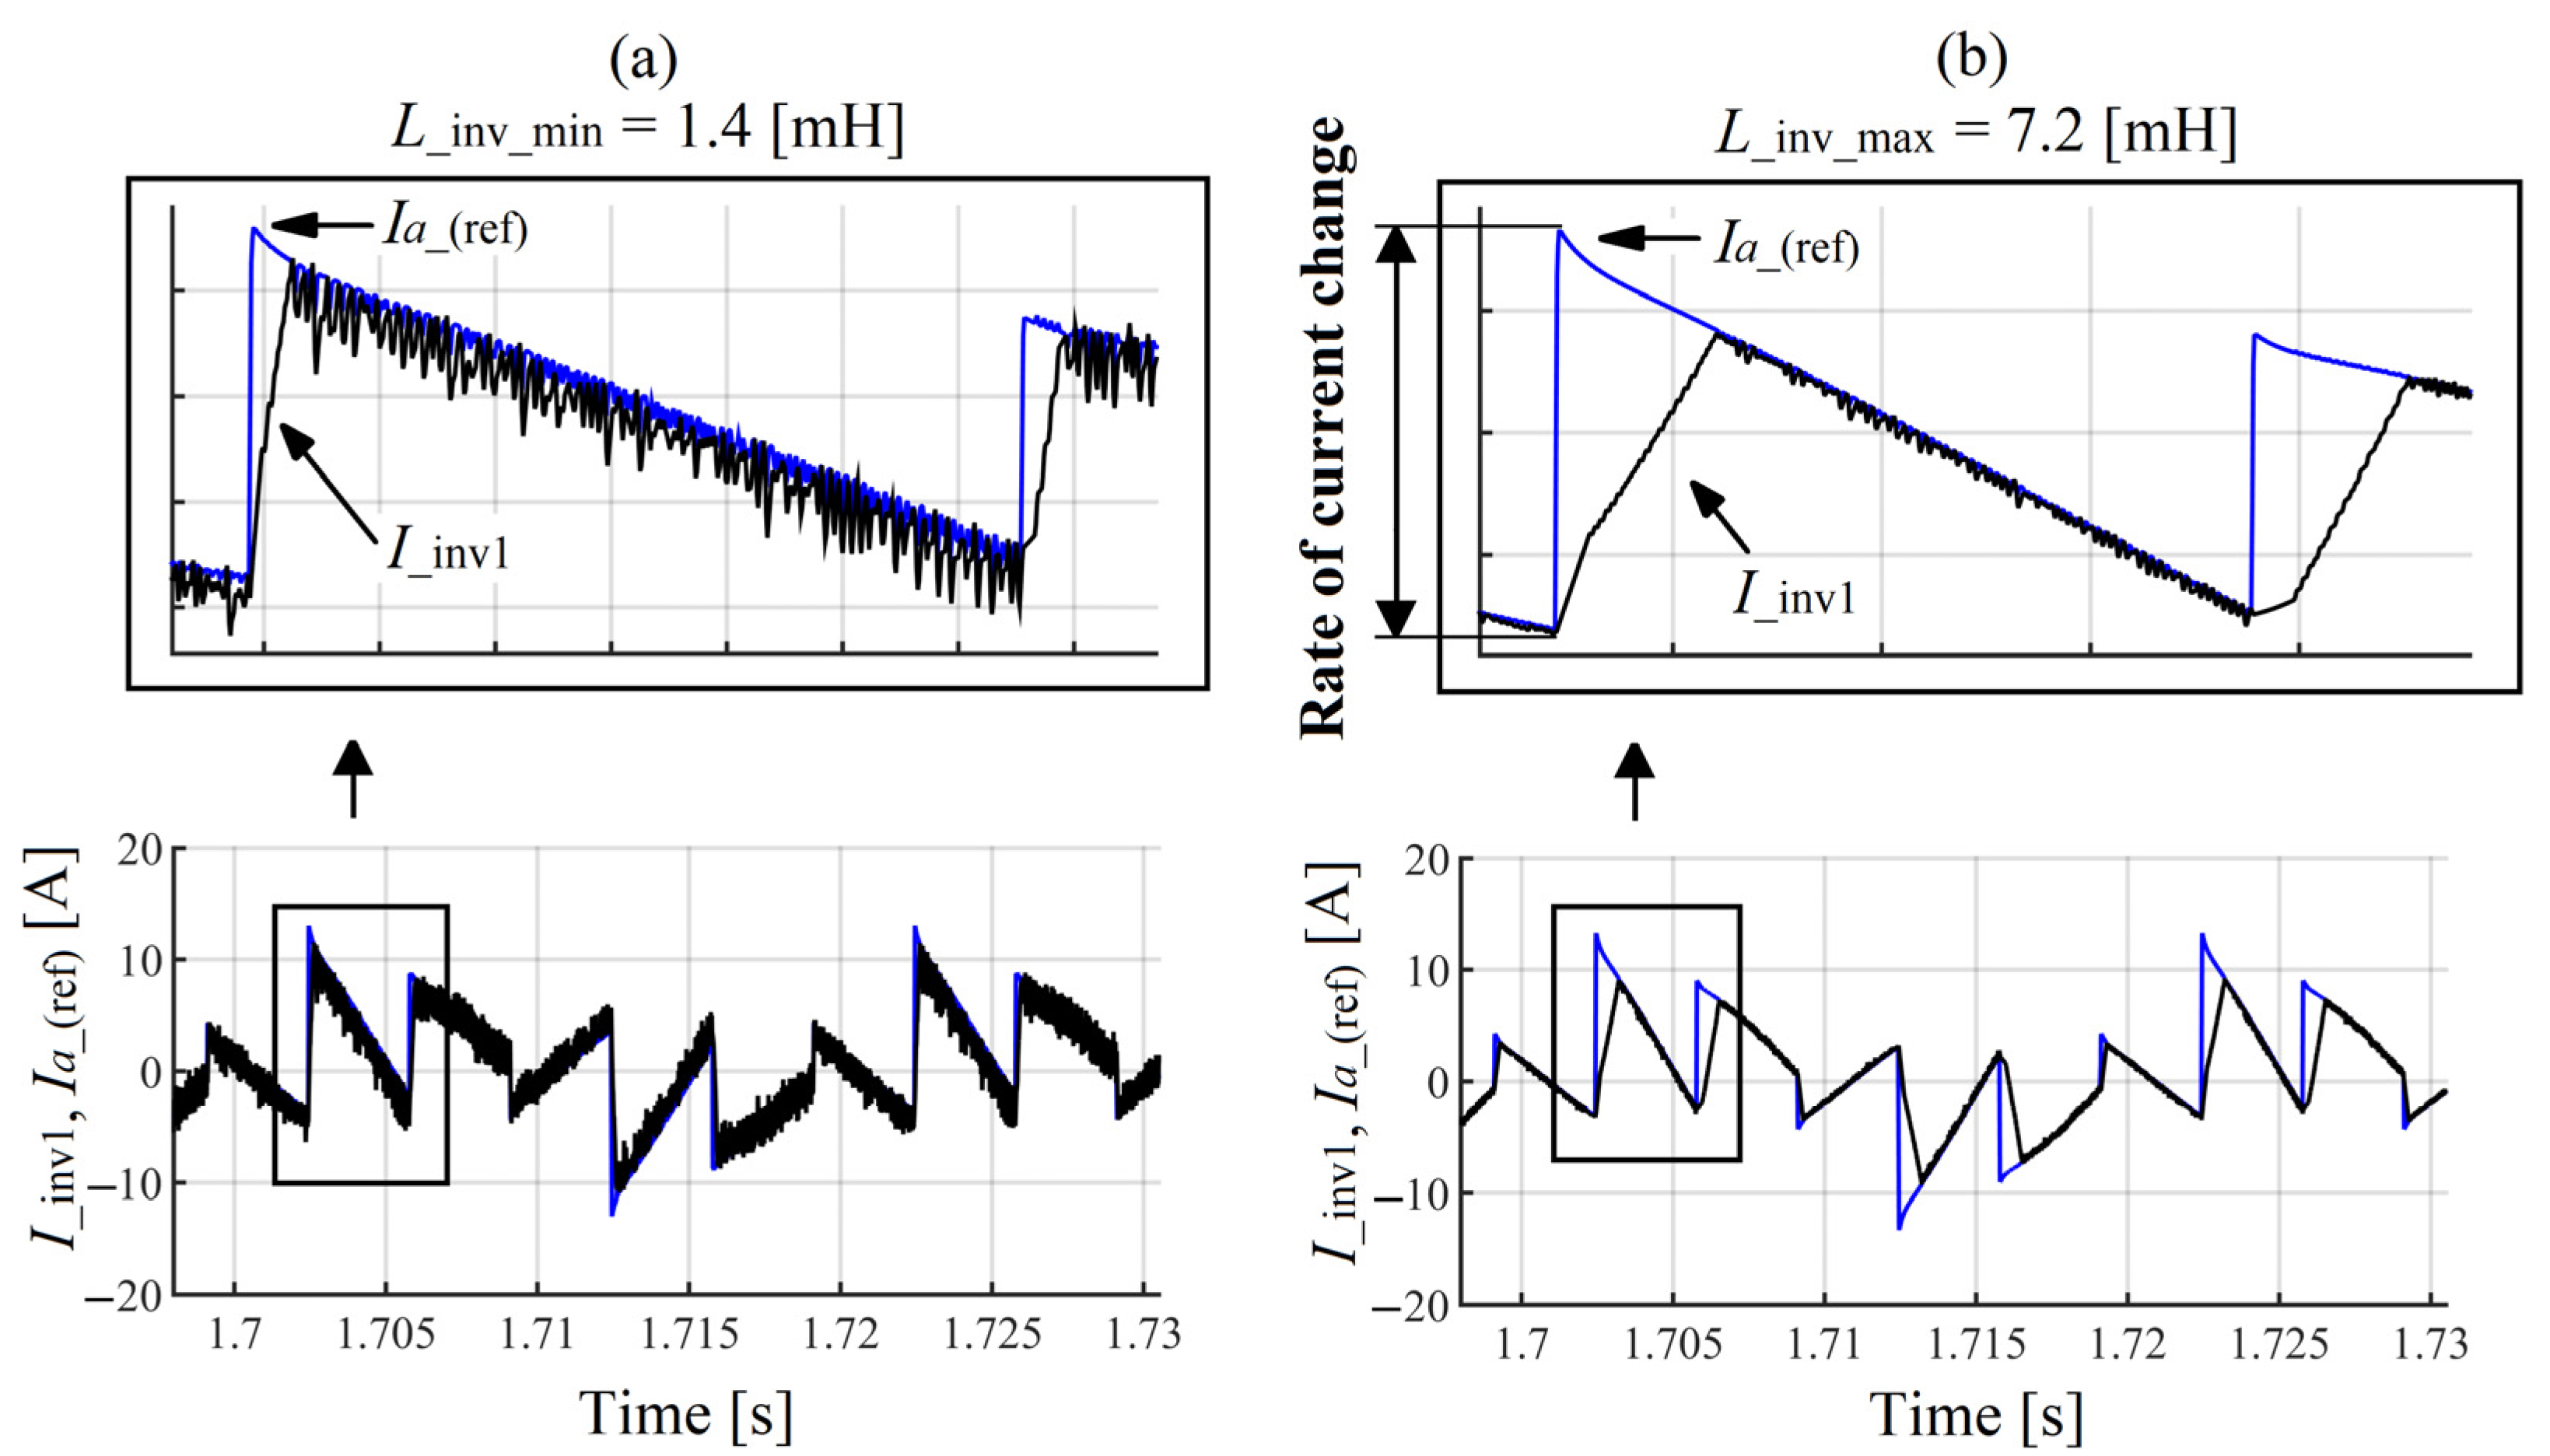
An example of comparison waveforms between the reference current ( I a _ ( ref ) ) and the compensating current ( I inv 1 ) is presented in Figure 11a,b. In the case of the SAPF with L _ inv _ min (Figure 11a) as well as in the case of the SAPF with L _ inv _ max (Figure 11b), the compensating current ( I inv 1 ) has difficulty in tracking the reference current ( I a _ ( ref ) ) at the commutation notches (due to the high rate of reference current change (di/dt) during the commutation). That difficulty is more accentuated in the case of the SAPF with L _ inv _ max (Figure 11b) than in the case of the SAPF with L _ inv _ min (Figure 11a).
The reference current (part of (%) input thyristor-bridge current) presents a high rate of change at the commutation notches because of the small value (size) of the thyristor-bridge input reactor inductance ( L T ).
In this case study, it can be noticed that the gap between the reference current and the compensating current observed in Figure 11a,b is one of the factors which determines the SAPF work efficiency, mostly in terms of current harmonics reduction (see grid current THD in Table 4). That gap is responsible for the high amplitude ripples observed on the grid current waveforms at the commutation notches (e.g., Figure 9b).
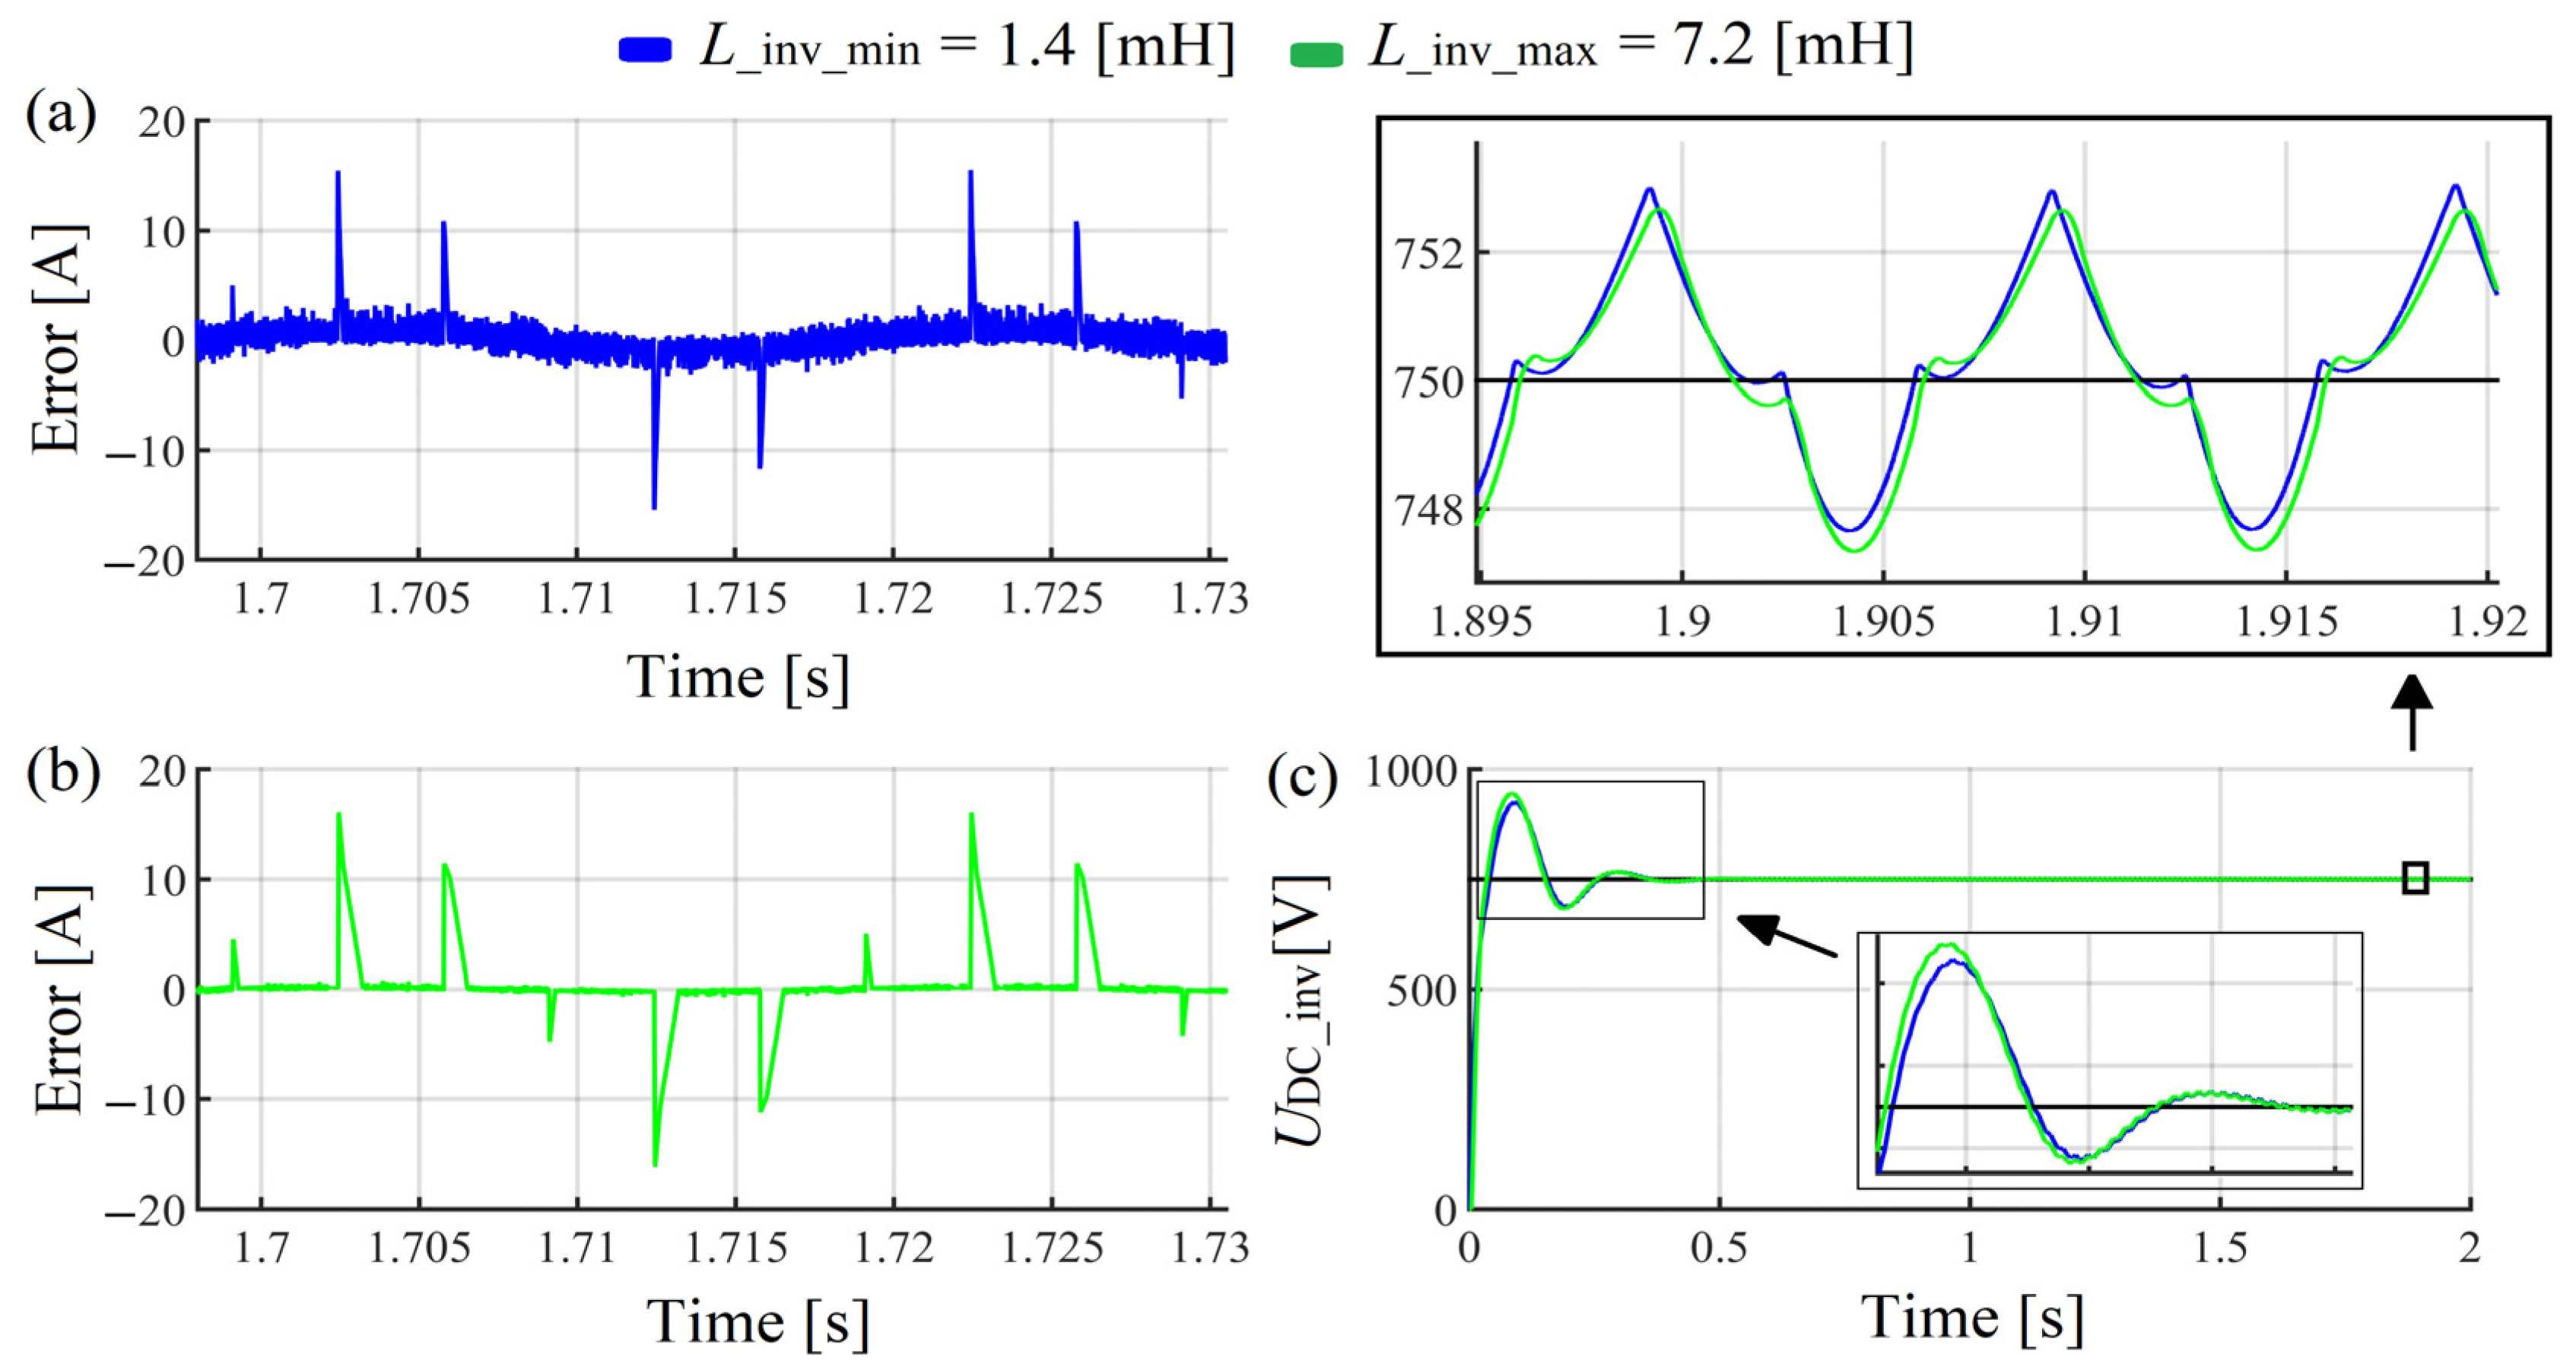
After subtracting the compensating current from the reference current in Figure 11a,b, the error waveforms at the PI controller input are presented in Figure 12a ( L _ inv _ min ) and 12b ( L _ inv _ max ), respectively. In the ideal case, the two signals should match each other and after comparison, the error should be close to zero.
The size of the SAPF input reactor has an influence on the DC capacitor transient state duration, as presented in Figure 12c.
The fundamental harmonic active, reactive and apparent powers at the gride side, load side and SAPF side for the SAPF with L _ inv _ min and L _ inv _ max are presented in Table 6. The powers are computed based on the voltage and current parameters presented in Table 4 and Table 6, respectively.
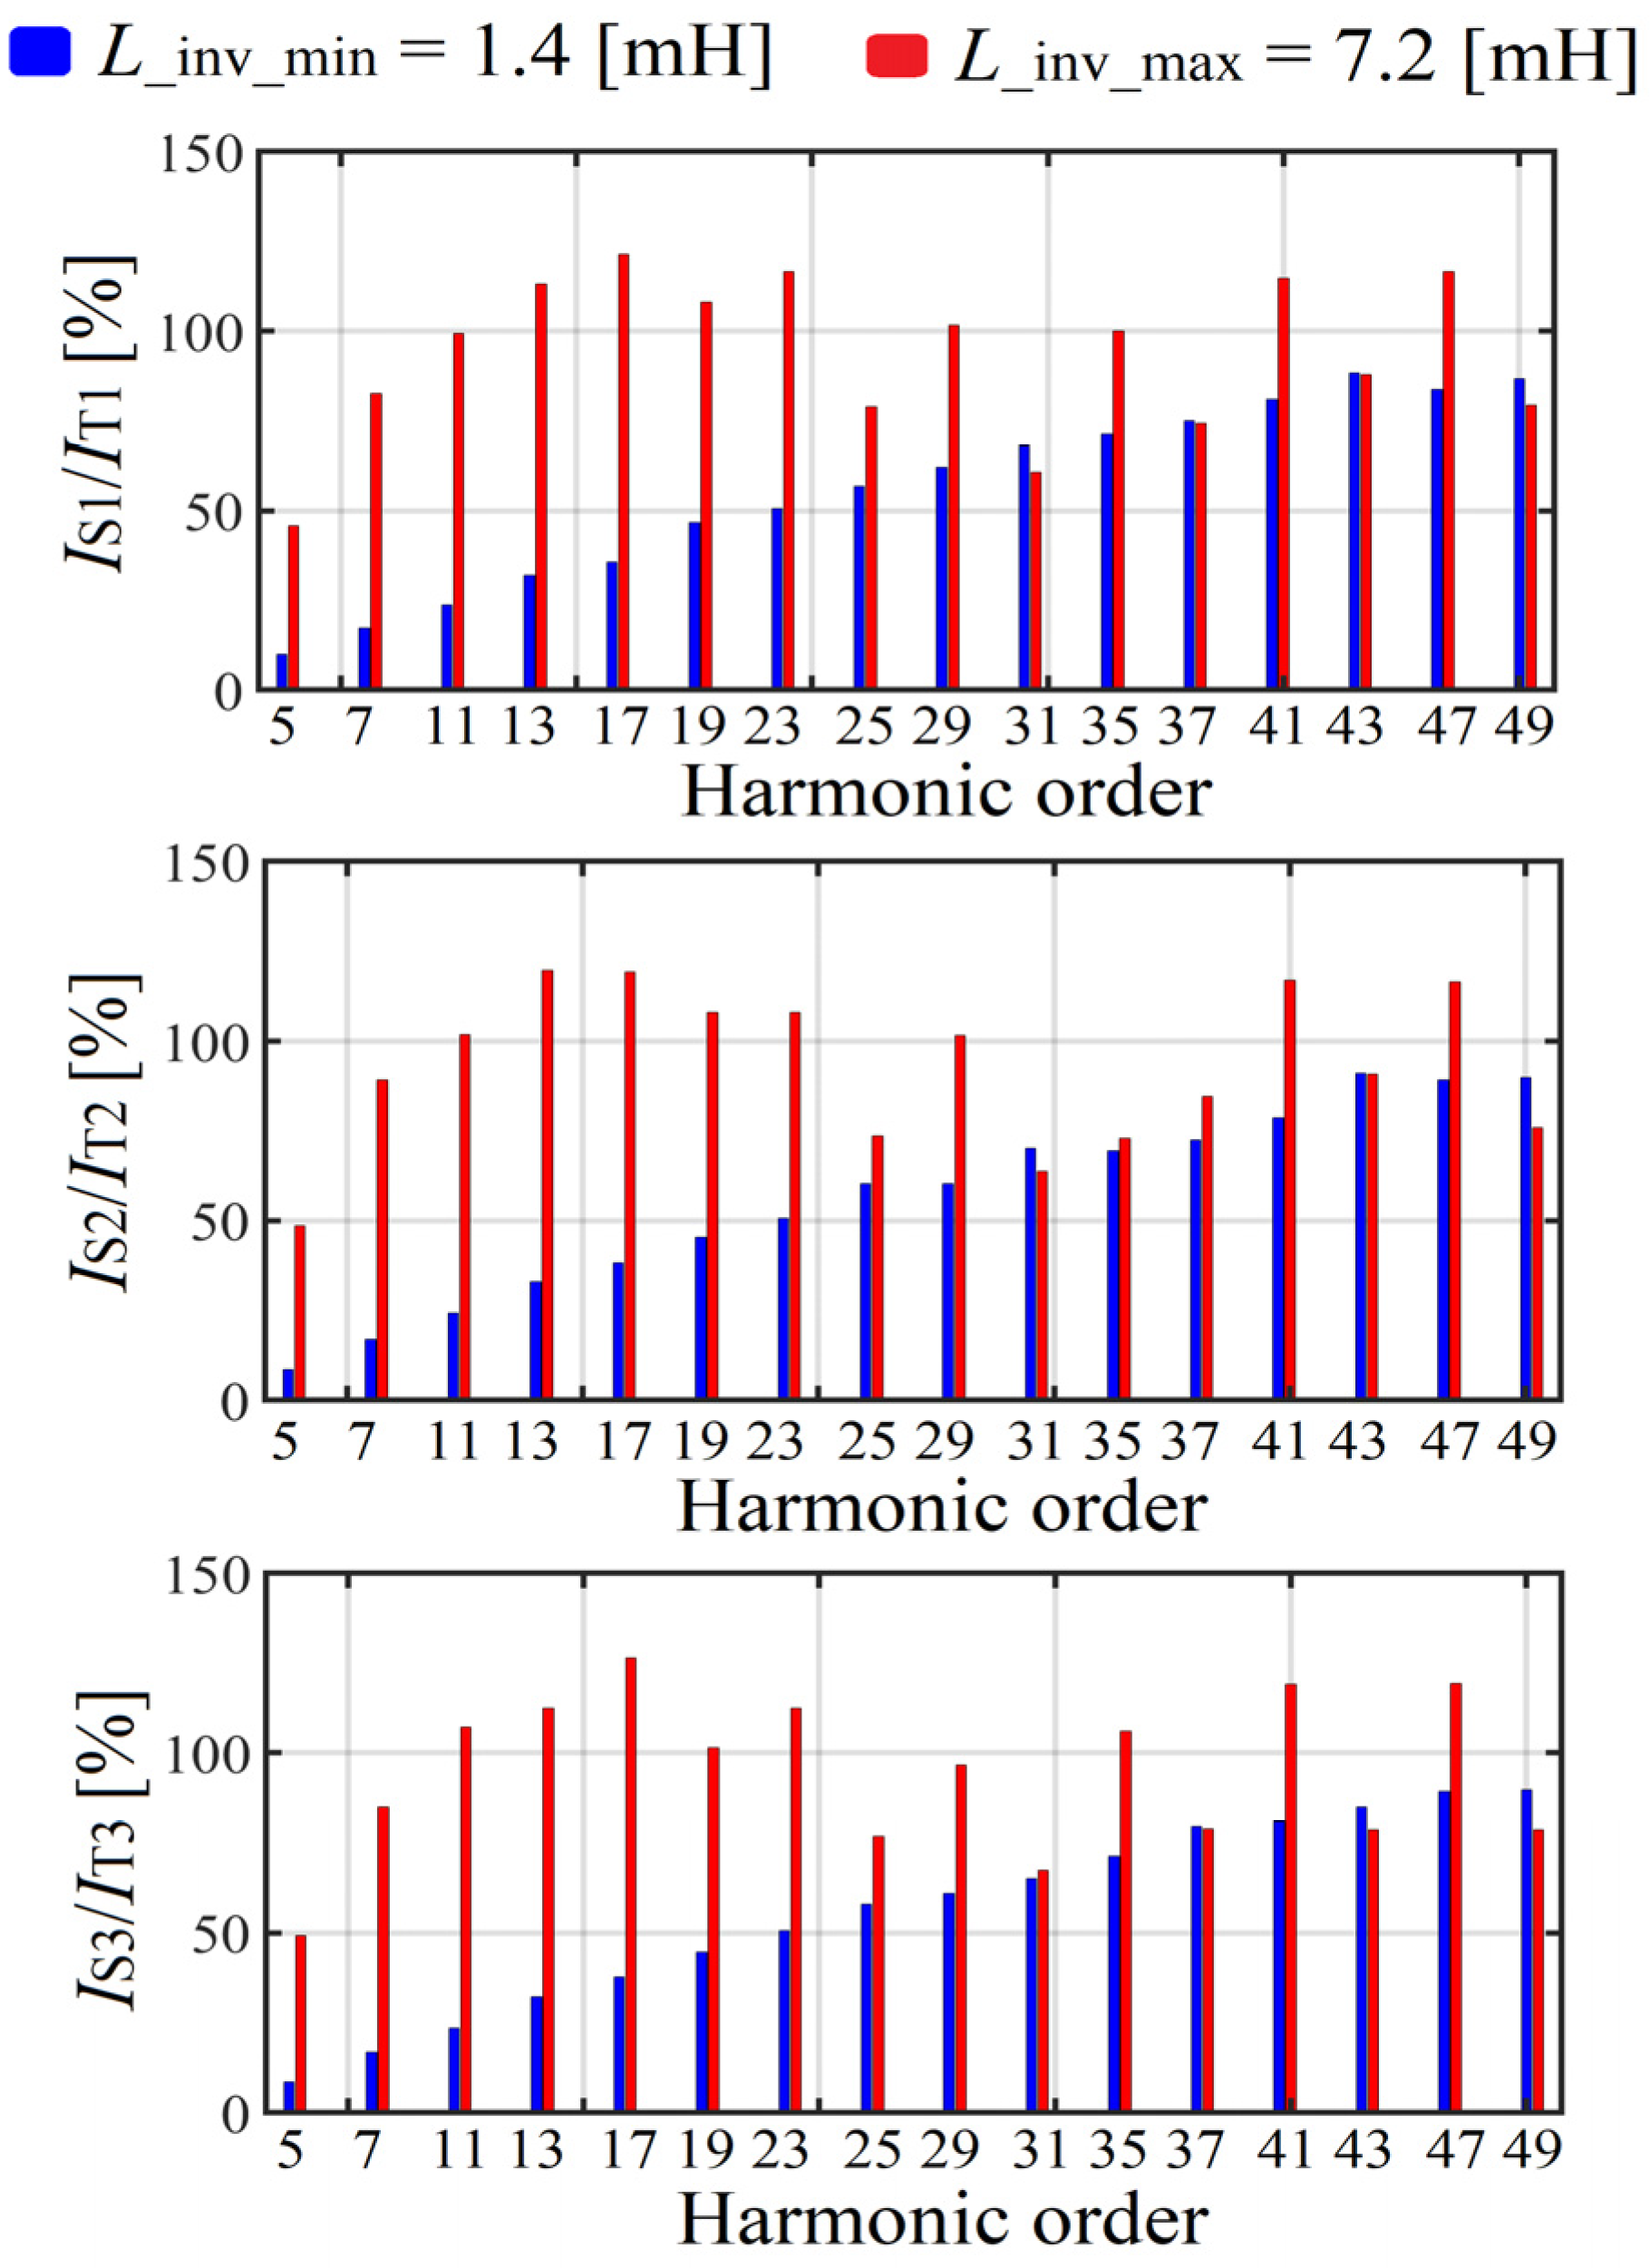
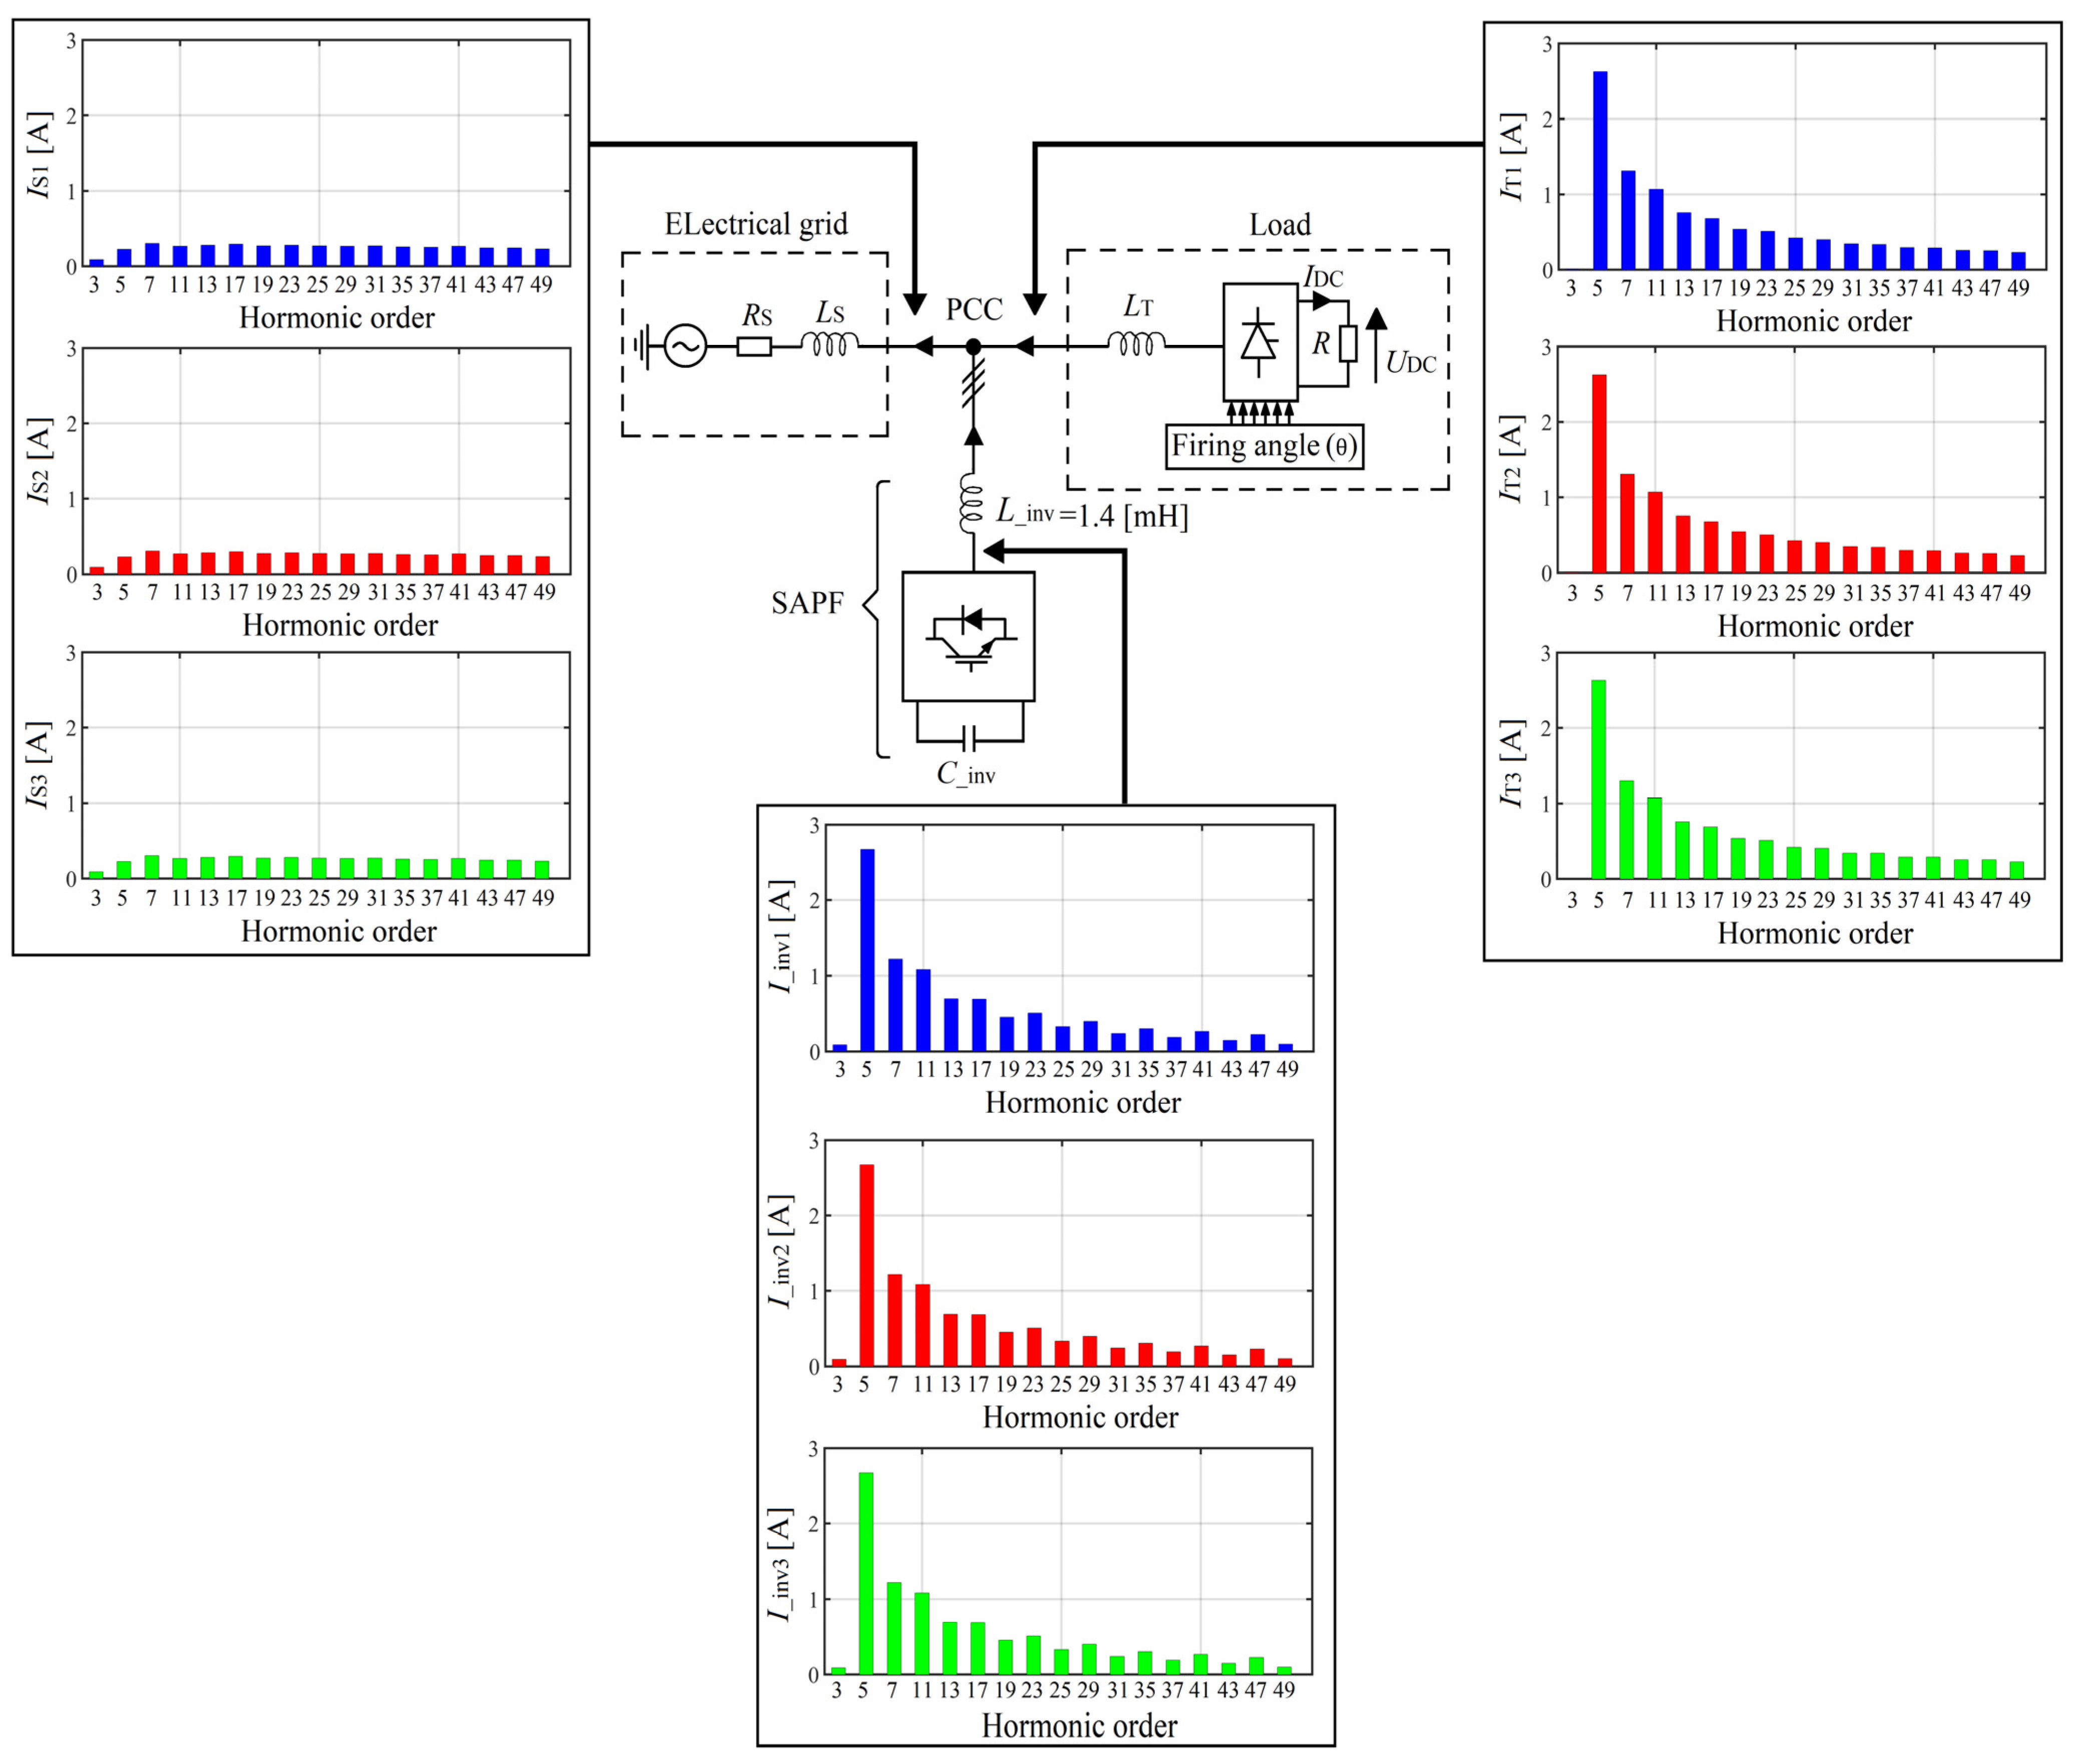
Figure 13 presents the SAPF work efficiency in terms of characteristic harmonics mitigation at the grid side. Observing that figure, it can be noticed that in the case of the SAPF with L _ inv _ max , some harmonics are amplified (harmonics above 100%) because of the large size of the input reactor. At the grid side, the characteristic harmonics are better reduced when the SAPF is connected with L _ inv _ min than when it is connected with L _ inv _ max .
An example of current harmonic spectrums at the load input, SAPF input and grid side is presented in Figure 14 (for L _ inv _ min ). It illustrates how the SAPF works in terms of harmonics mitigation.
The first simulation results have clearly demonstrated that the size of the SAPF input reactor affects its work efficiency. In this case study, two SAPF input reactors (small and large) were considered and their inductances were computed on the base of the chosen values of the reactor voltage drop. According to the proposed expression in (3), the small reactor inductance ( L _ inv _ min ) was computed assuming a low value of reactor voltage drop and the inductance of the large one ( L _ inv _ max ) was computed assuming a high value of reactor voltage drop (see Table 1). Both reactors were connected at the SAPF input and the results were compared. The SAPF with a large size of input reactor showed a better result in terms of inverter switching ripples reduction but a worse result in terms of reducing the ripples caused by the high rate of current change during the commutation. In contrary to the SAPF with a large size reactor, the SAPF with a small size of the input reactor showed a worse result in terms of inverter switching ripple reduction but a better result in terms of reducing the ripples caused by the high rate of current change during the commutation as well as a better grid current waveform shape. At the grid side, the SAPF with small inductance ( L _ inv _ min ) showed better results in terms of THD (TTHD current), asymmetry coefficient and reactive power compensation as well as in terms of characteristic harmonics mitigation. The SAPF with large reactor inductance ( L _ inv _ max ) showed better results in terms of TTHD of the PCC voltage.

2.5. Second Simulation Results

Influence of the Thyristor-Bridge Input Reactor Size on the SAPF Work Efficiency

Because of the problem of reducing the ripples caused by the high rate of current change observed in the load current waveforms during the commutation, the second investigation was performed.
The goal of the investigation is to present the influence of the thyristor-bridge input reactor size on the SAPF’s work efficiency and to demonstrate that the choice of the SAPF input reactor parameters should also depend on the size of the thyristor-bridge input reactor.
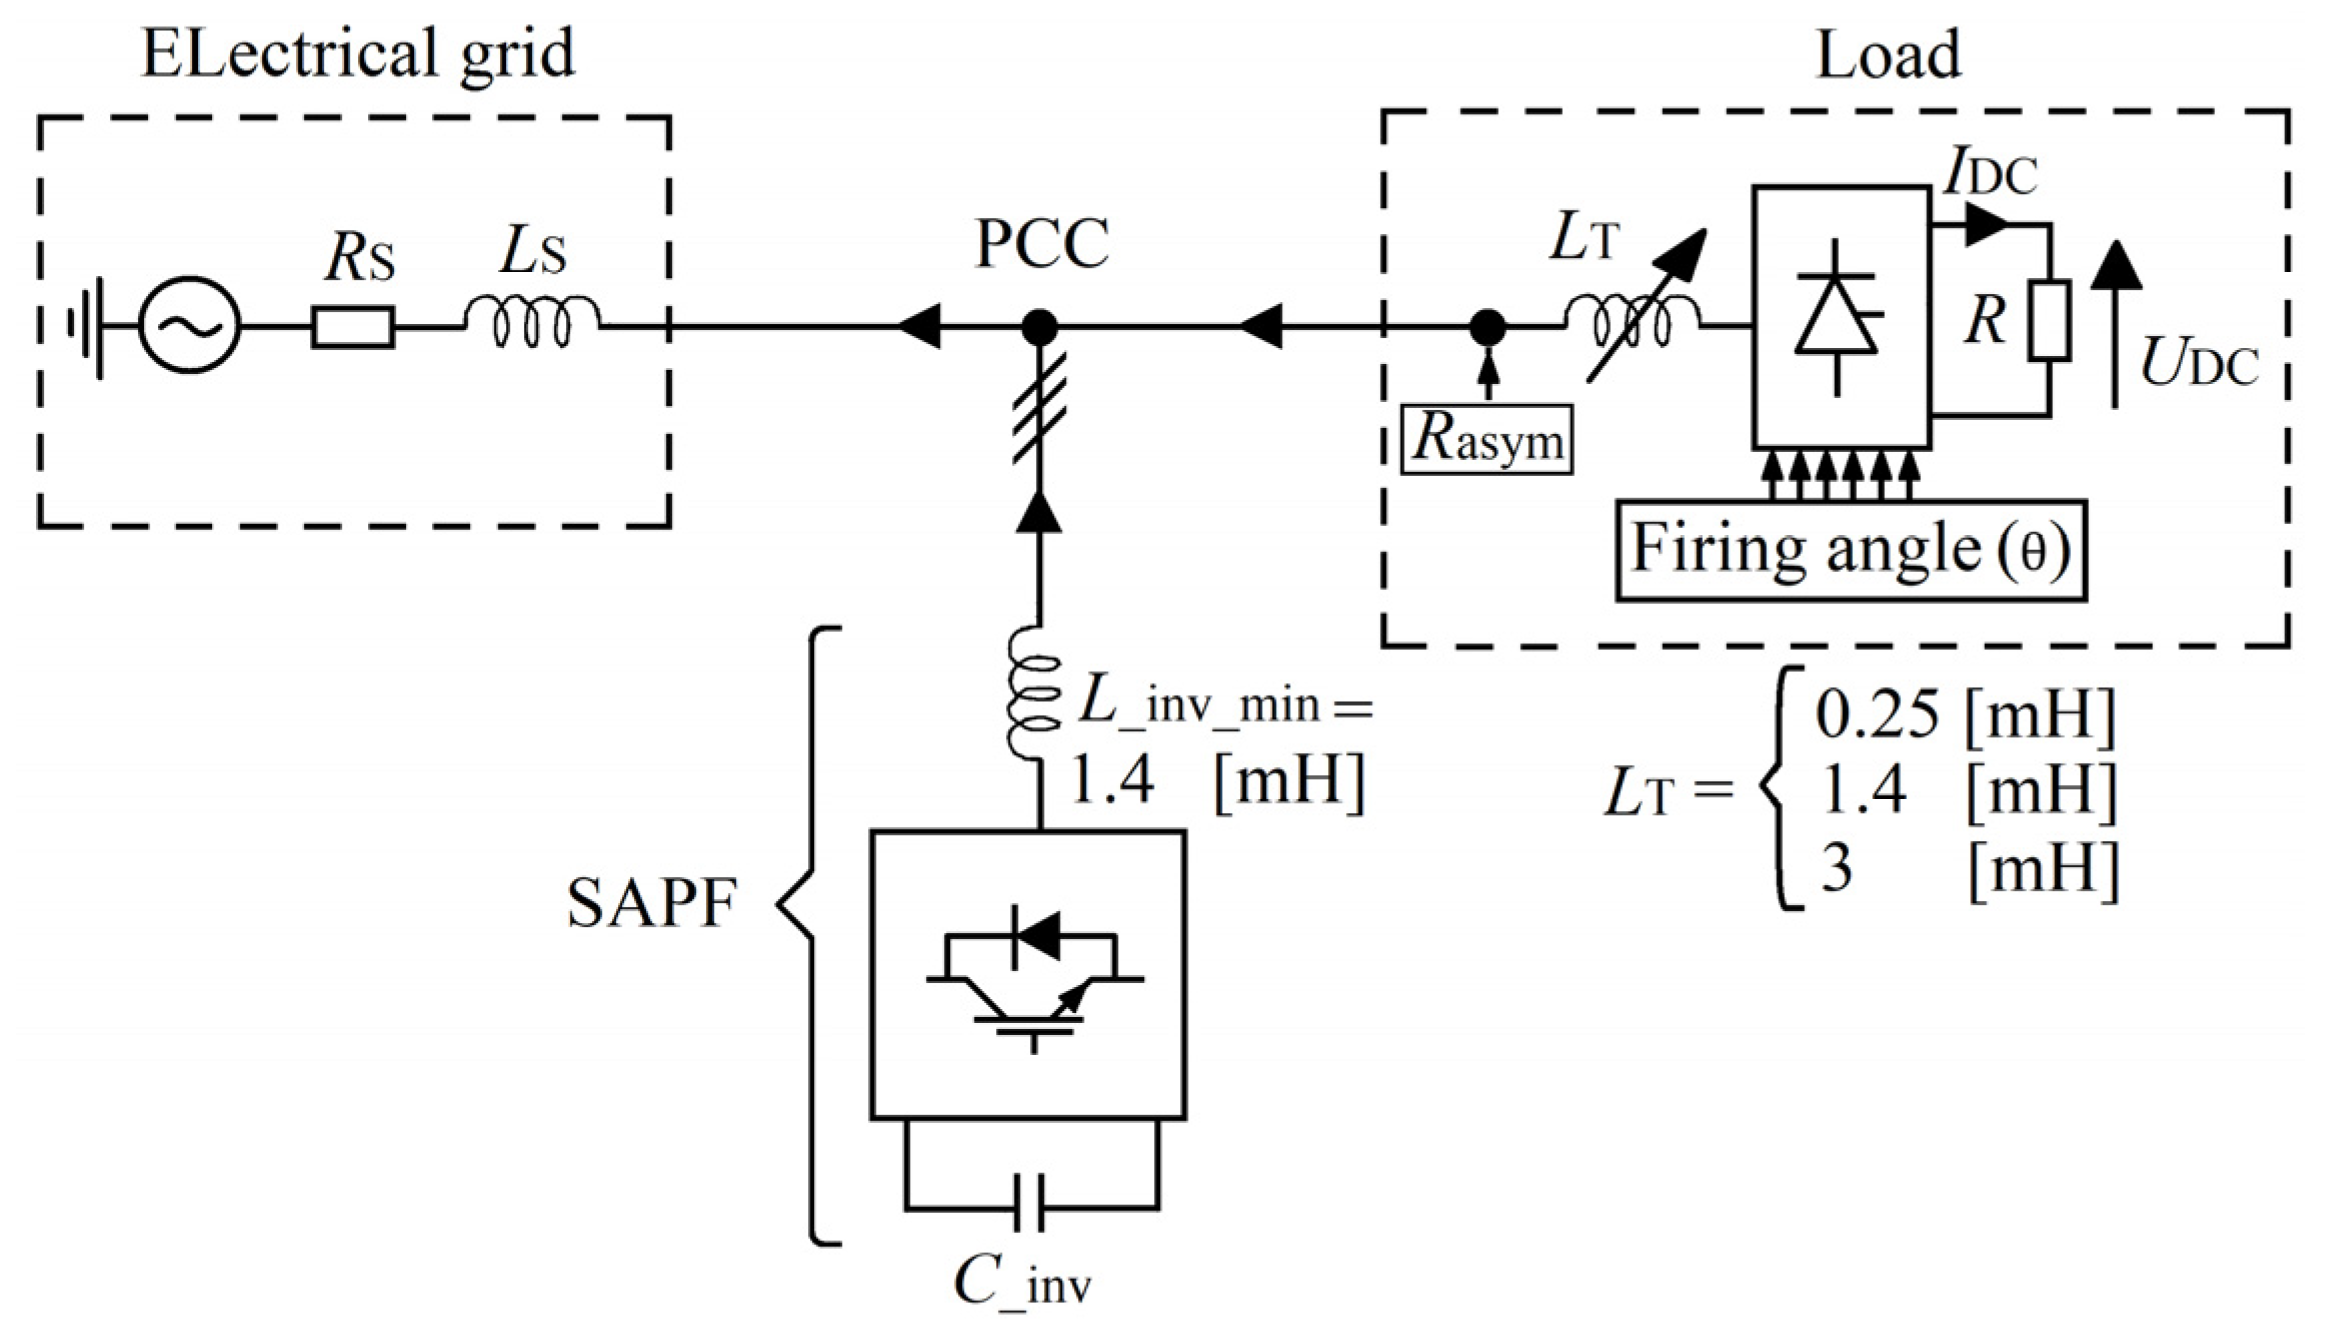
The equivalent circuit (with parameters) used to performed the investigation is presented in Figure 15. The value of the SAPF input reactor inductance ( L _ inv _ min = 1.4 mH) was chosen based on the previous experiment. Three cases of simulation results are compared: (a) where the SAPF input reactor inductance is higher than that of the thyristor-bridge input reactor ( L _ inv _ min > L T ); (b) where the SAPF input reactor inductance is equal to that of the thyristor-bridge input reactor ( L _ inv _ min = L T ) and (c) where the SAPF input reactor inductance is smaller than that of the thyristor-bridge input reactor ( L _ inv _ min < L T ).
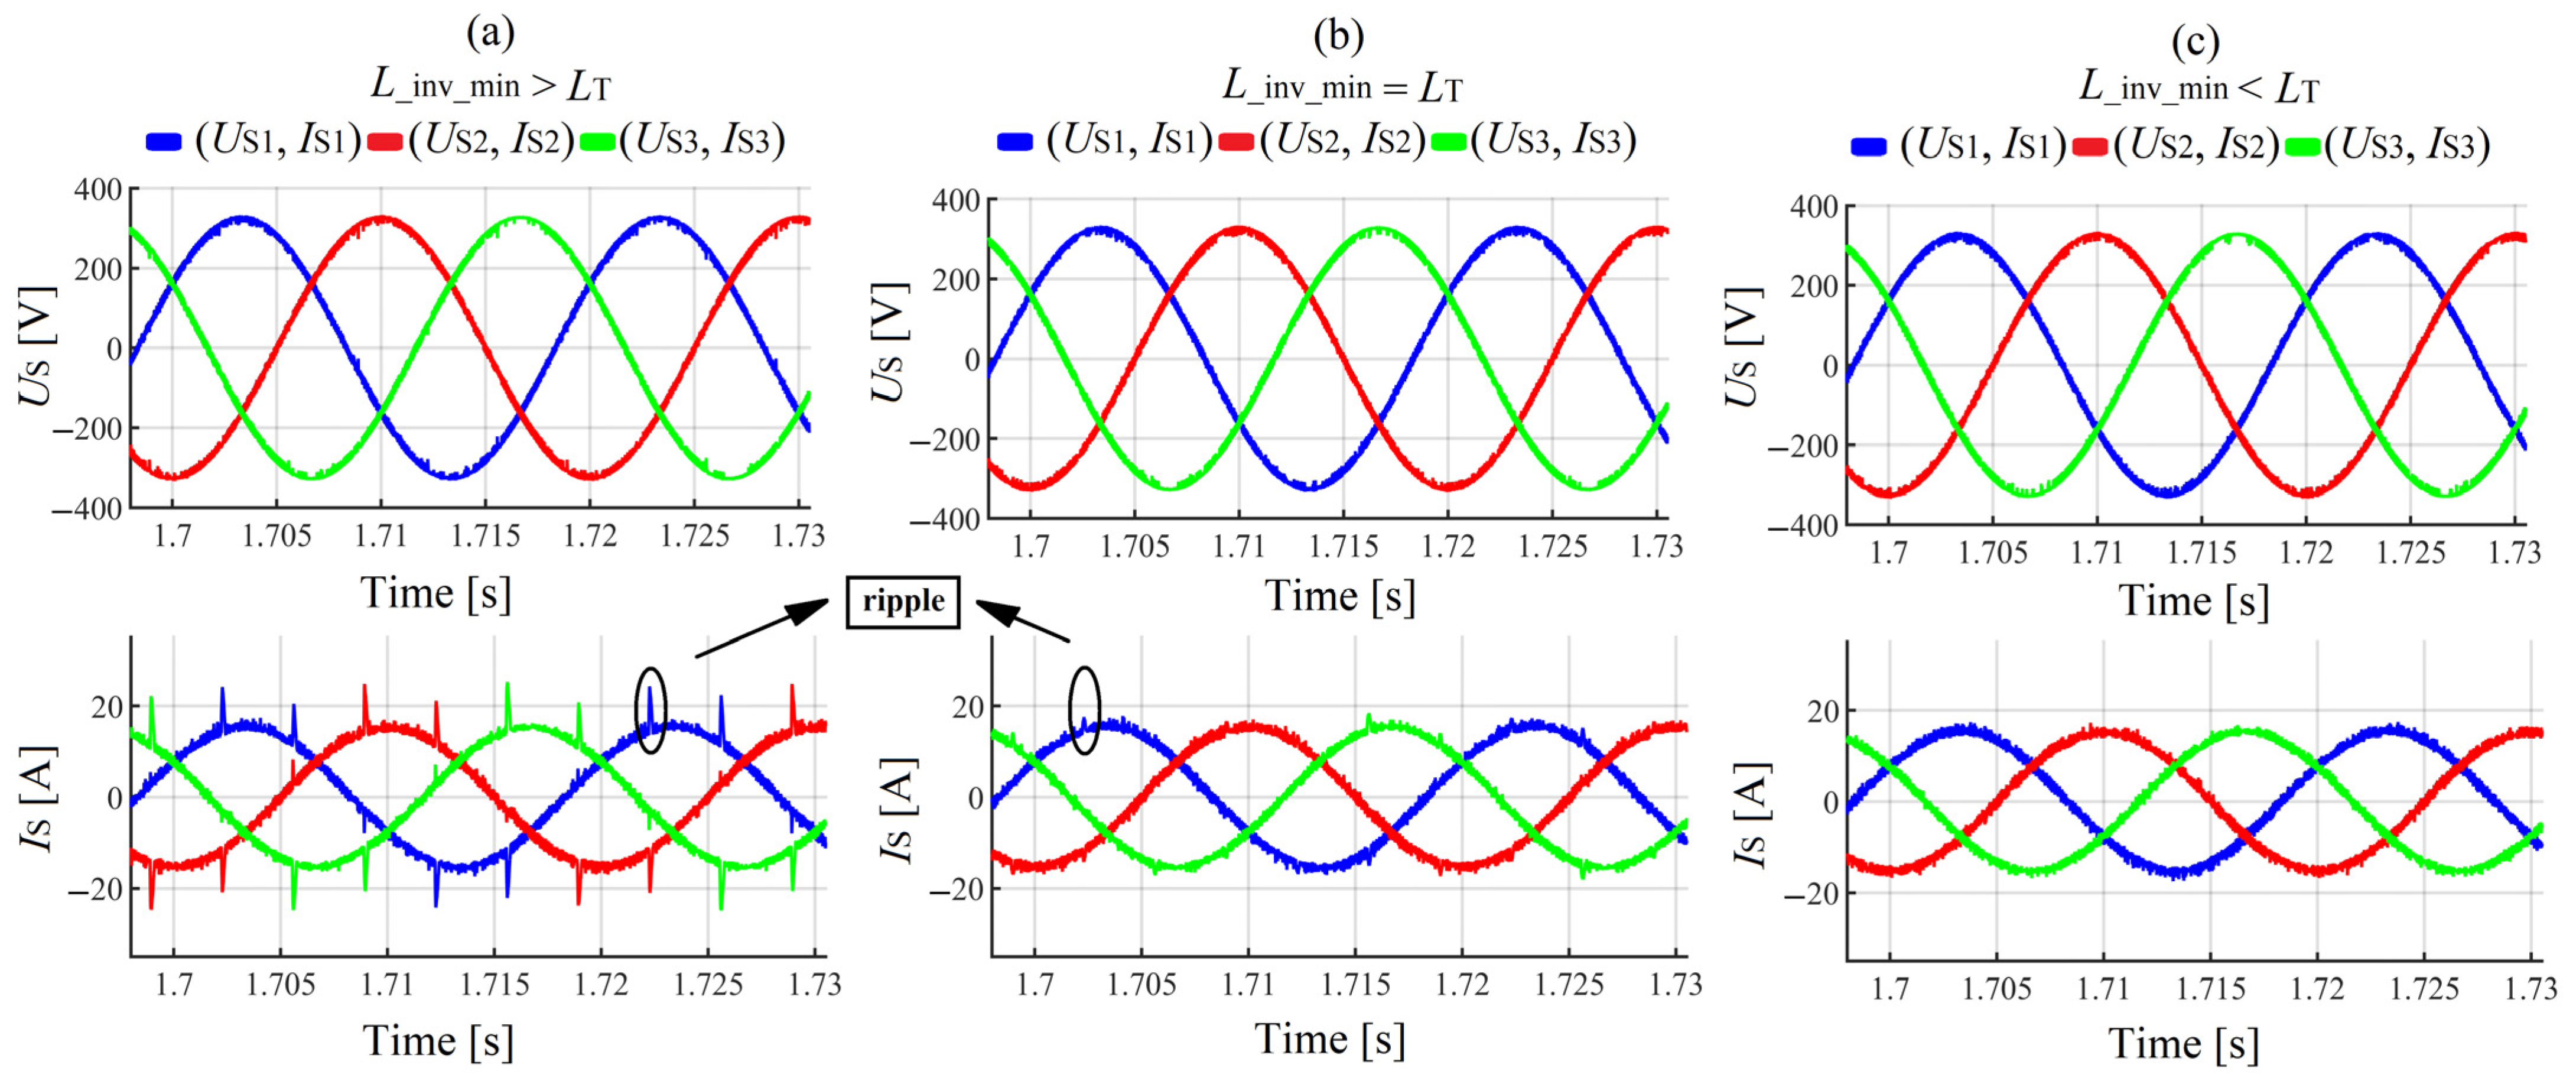
The grid voltage and current waveforms in Figure 16a–c show that in the cases of SAPF with the input reactor inductance equal or smaller than thyristor-bridge input reactor inductance, the ripples caused by the high rate of current change at the points of commutation notches are better reduced (see current waveforms in Figure 16b,c). The case in which L _ inv _ min < L T presents the best shape of grid current waveforms (Figure 16c).
Table 7 presents the values of the PCC voltage and grid current fundamental harmonic before and after the SAPF connection. The case with L _ inv _ min < L T (in comparison to other cases) presents the smallest value of the grid current fundamental harmonic.
In Table 8, it can be observed that the best results in terms of grid current and voltage THD and mitigation of the fundamental harmonic reactive power and asymmetry are when the L _ inv _ min is equal or smaller than L T .
The TTHD of the PCC voltage and grid current are presented in Table 9. The case with L _ inv _ min < L T presents the best results in terms of grid current TTHDIS and the worst results in terms of PCC voltage TTHDUS.
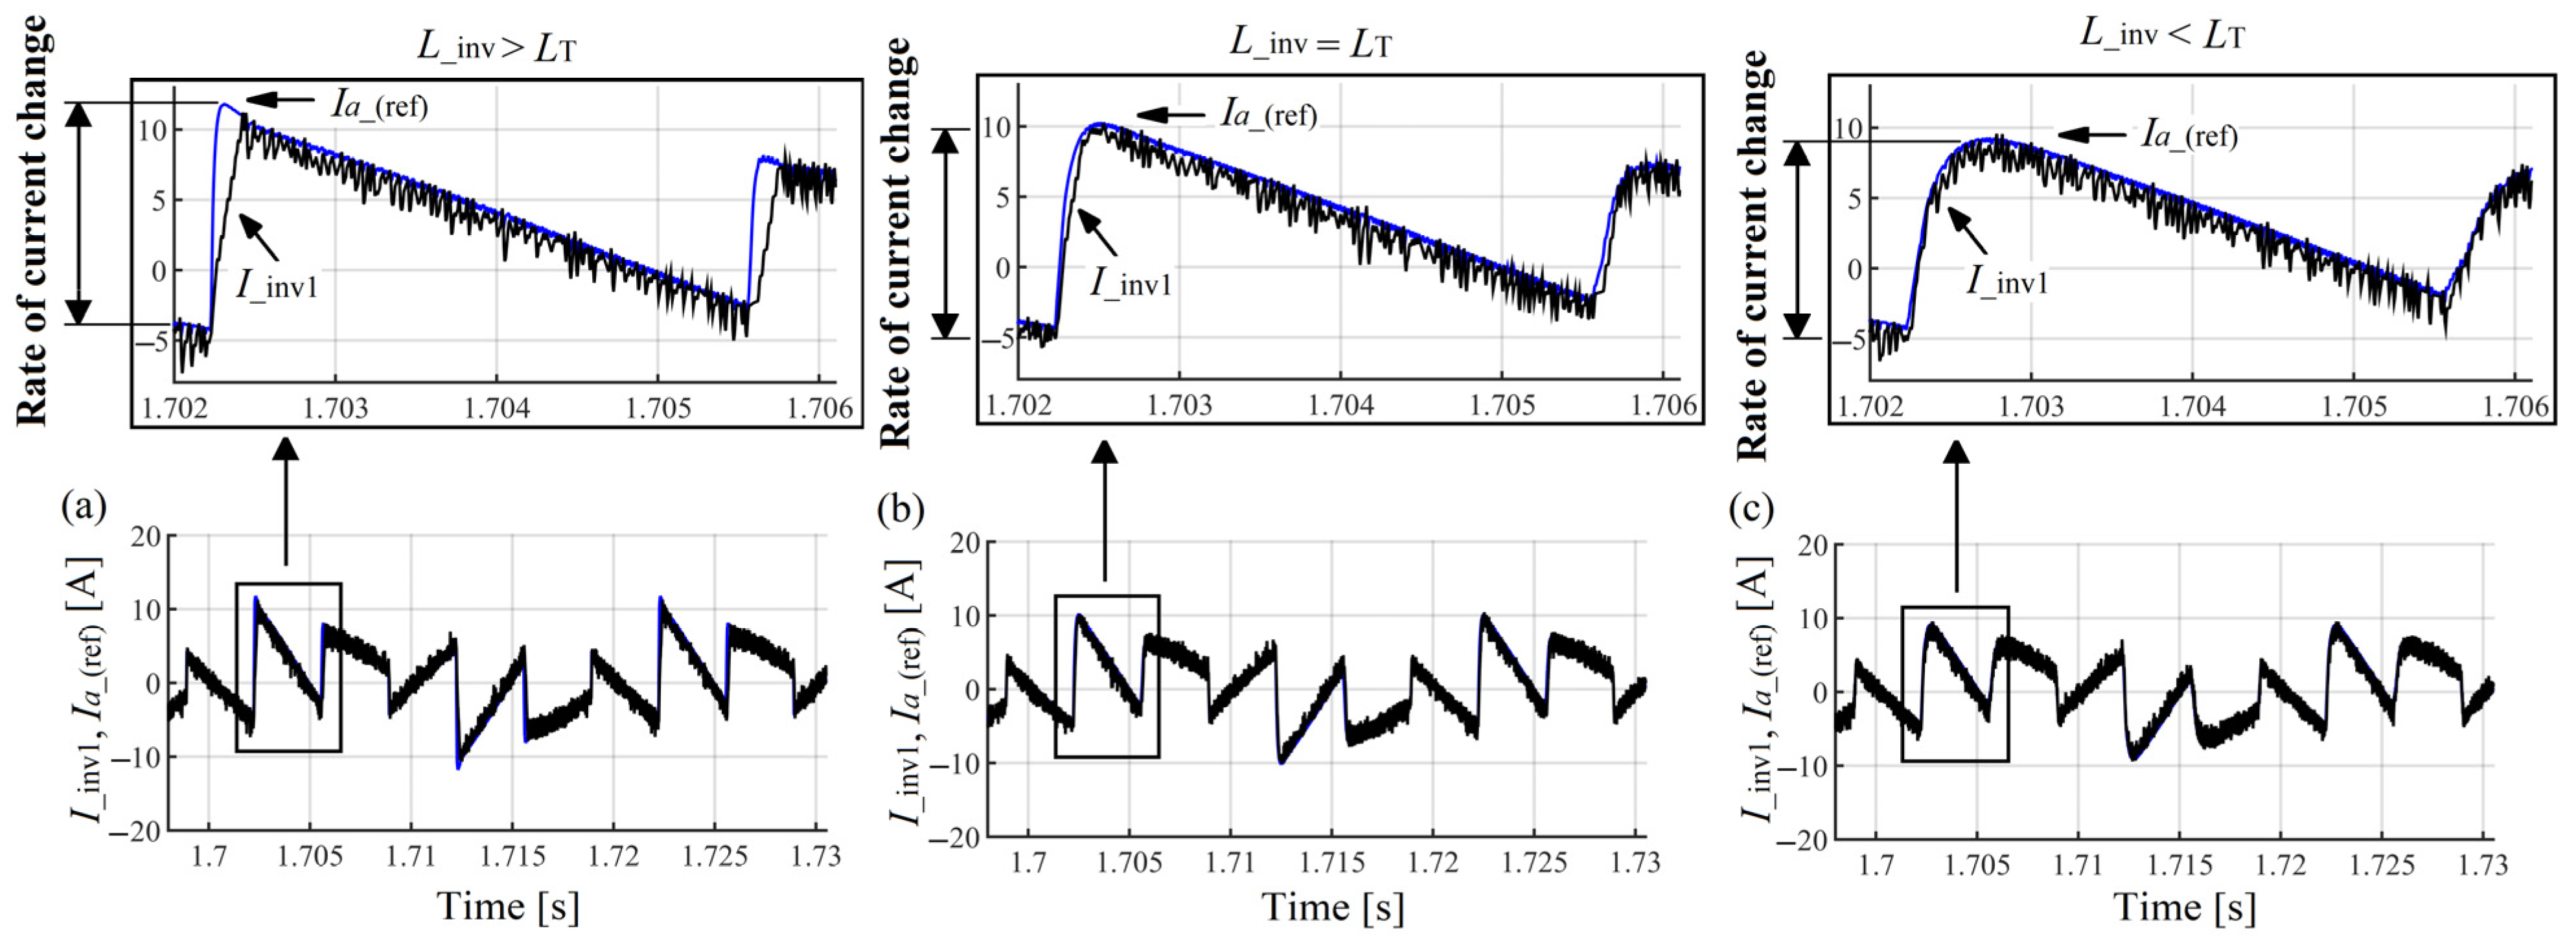
The waveforms of the reference current compared to that of the compensating current are presented in Figure 17a–c. It can be seen that in the case of L _ inv _ min < L T , the reference current and the compensating current match each other (Figure 17c). The increase in the thyristor-bridge input reactor inductance L T to a value equal or higher than the SAPF input reactor inductance ( L _ inv _ min ) has reduced the rate of current change at the commutation notches, making it possible to track the reference current by compensating current (Figure 17b,c).
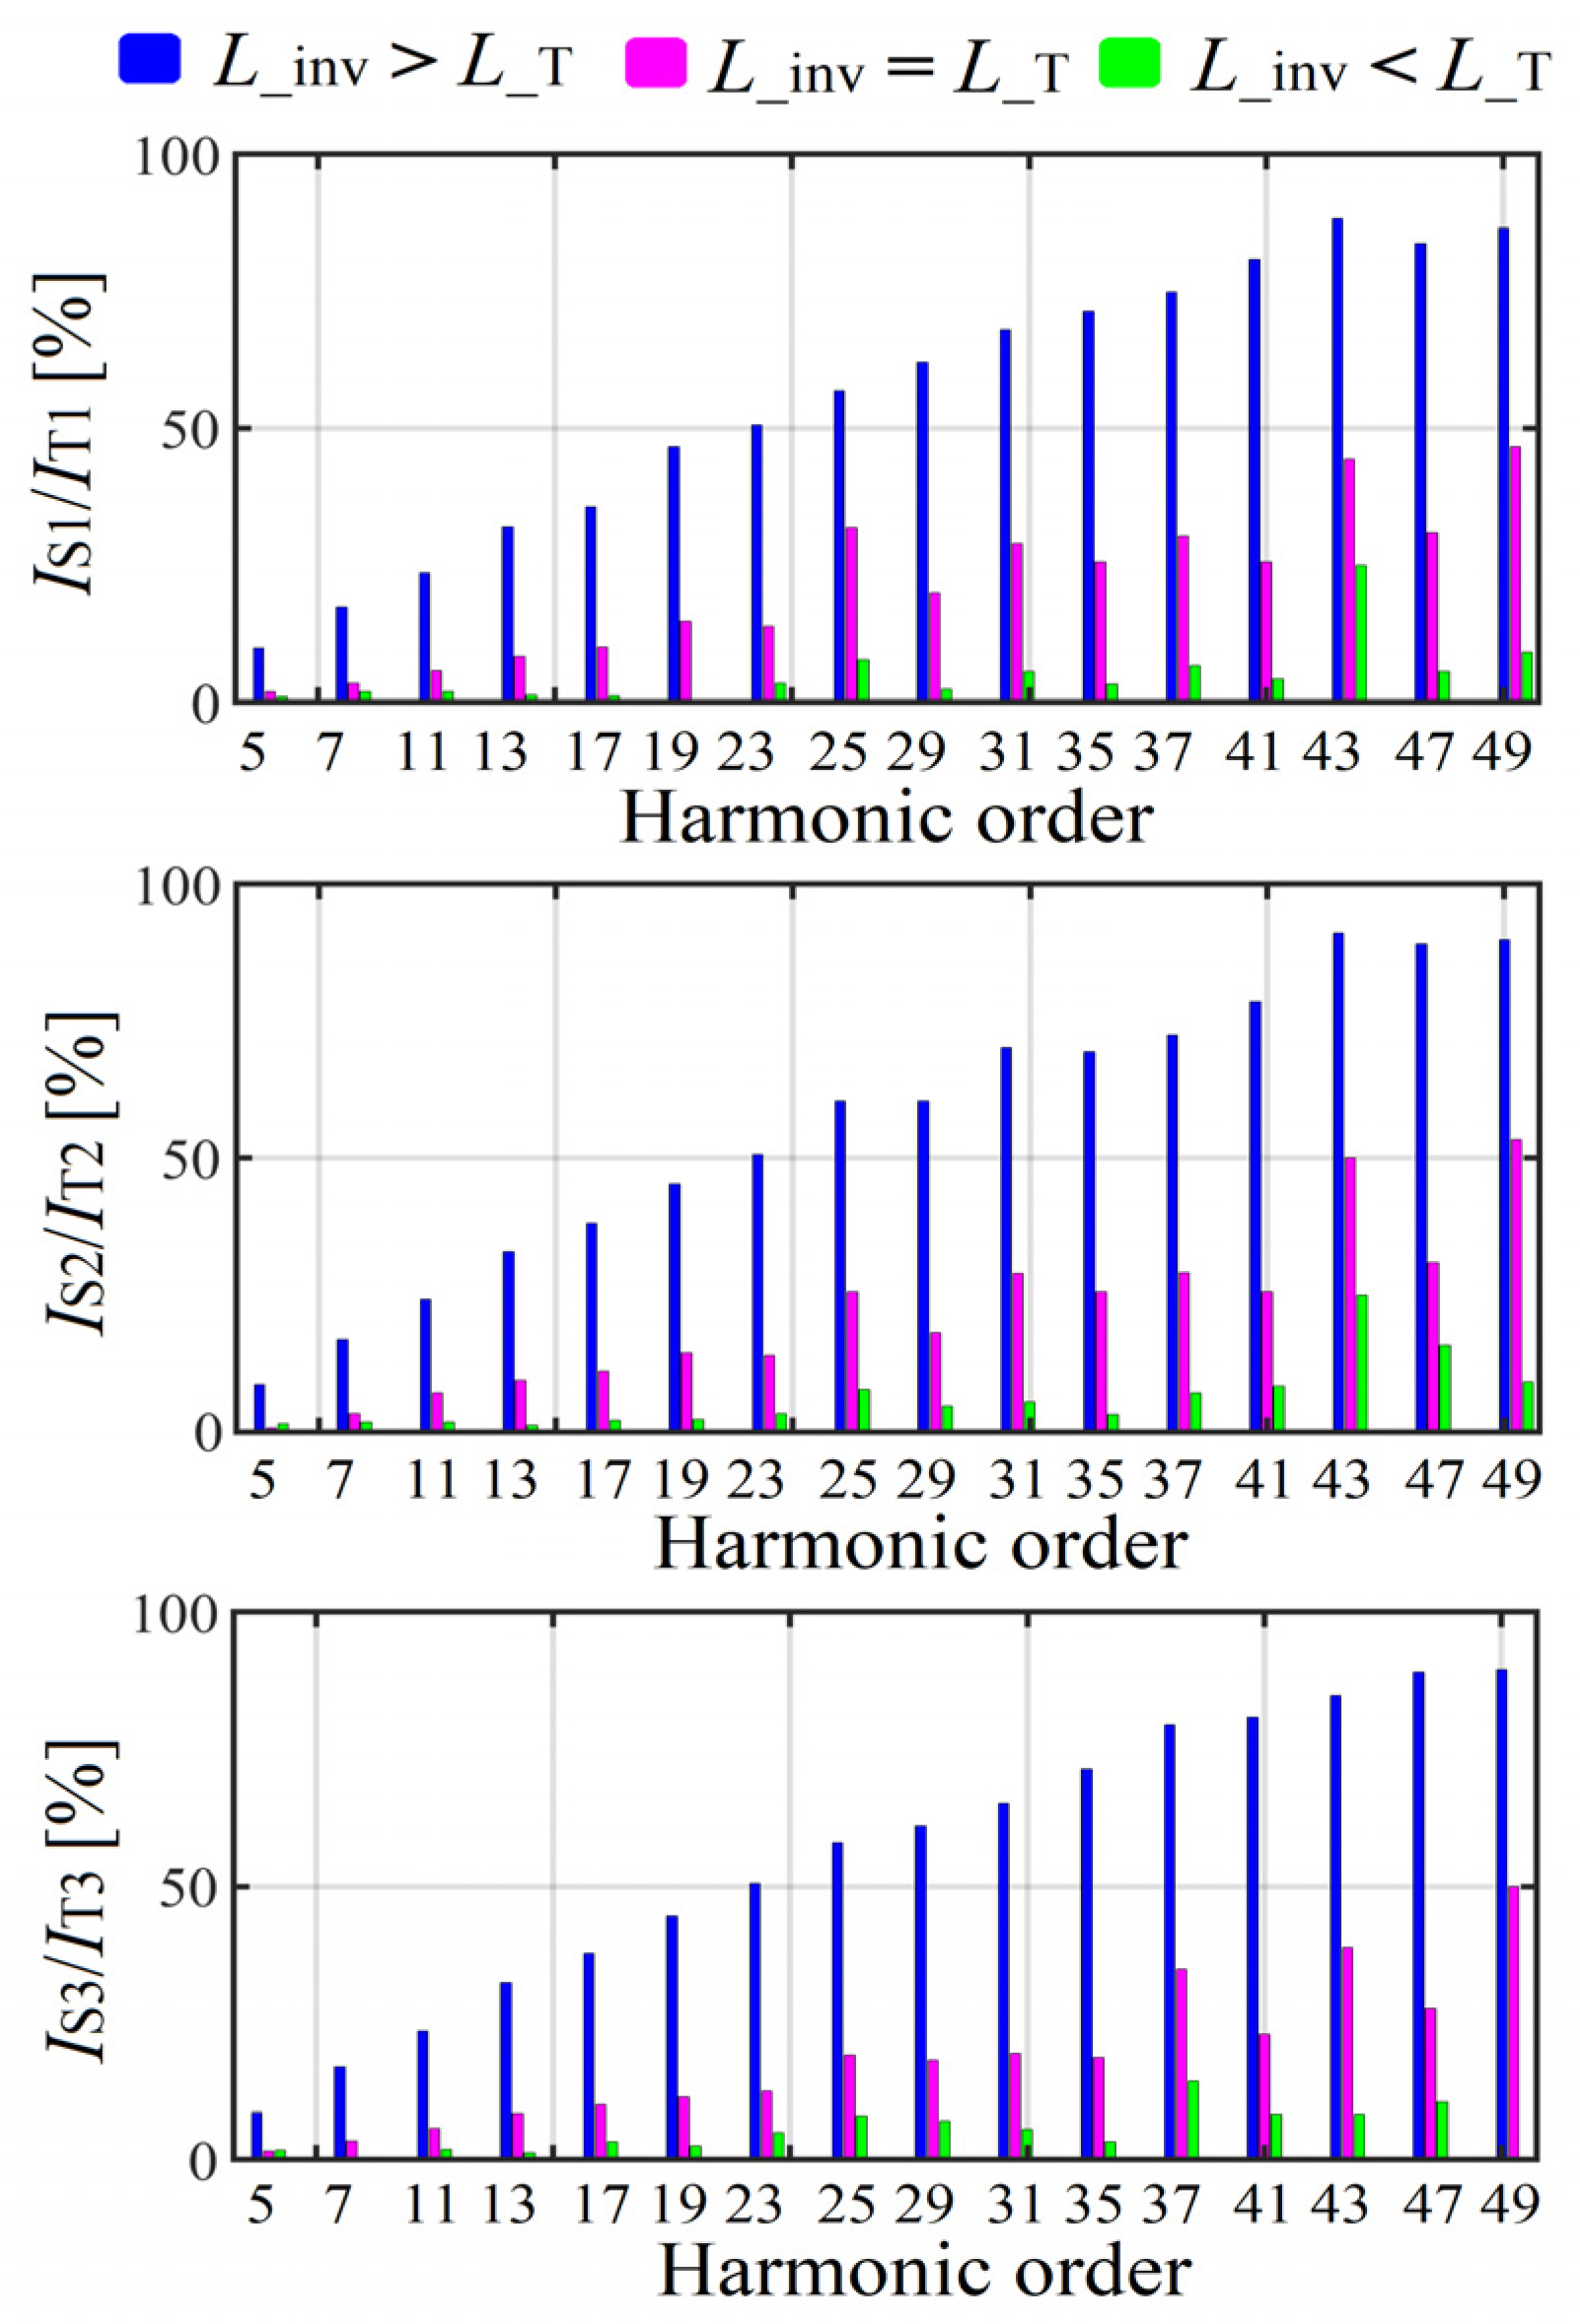
Figure 18 presents the SAPF work efficiency in terms of characteristic harmonics mitigation at the grid side. Observing that figure, it can be seen that no harmonic is amplified (harmonics are below 100%) at the grid side. The case where L _ inv _ min < L T presents (in comparison to other cases) better results in terms of characteristics harmonic mitigation at the grid side.
An example of the waveform errors at the PI controller input is presented in Figure 19a–c. The waveforms of the SAPF DC capacitor voltage are considered in Figure 19d.
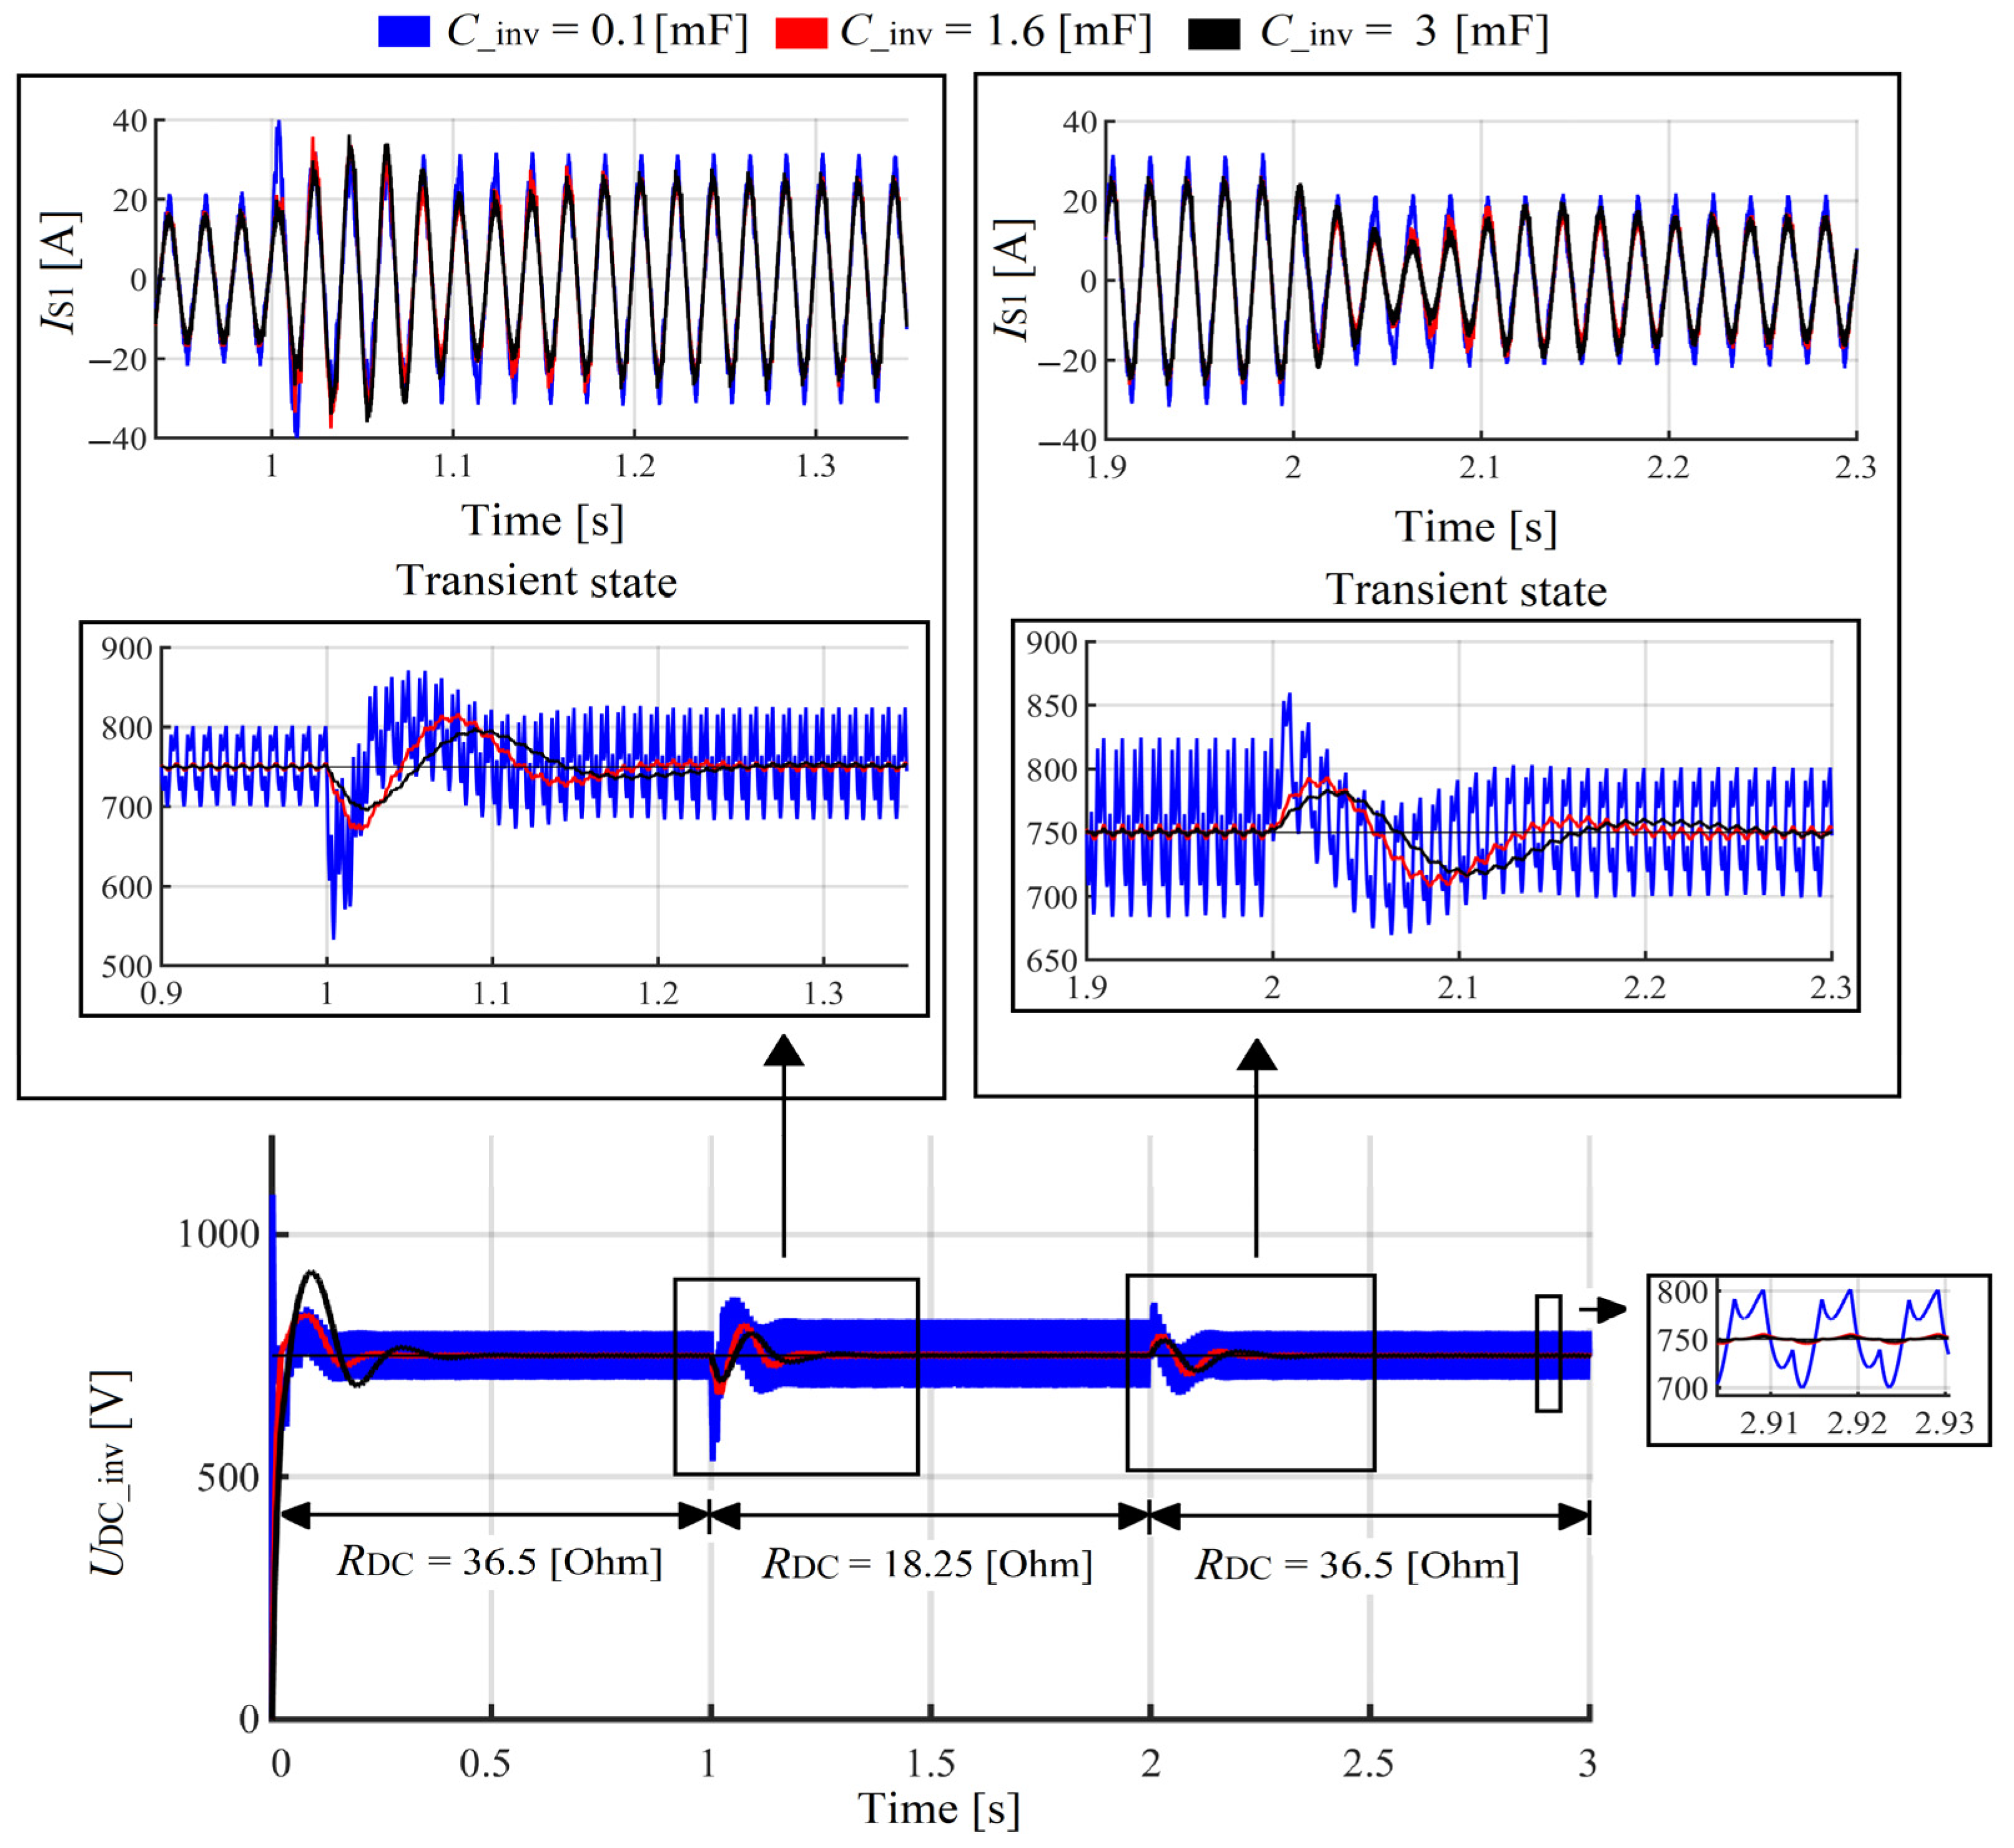
Figure 20 presents the SAPF DC capacitor voltage for different values of capacity. The dynamic response of the control system algorithm with the decrease and increase in the thyristor-bridge DC resistance (load change) can be also observed.
In this case study, the results of the second investigation have clearly shown that the size of the thyristor-bridge input reactor has an influence on the SAPF work efficiency. The SAPF with the input reactor inductance equal or smaller than the one at the thyristor-bridge input presents the best results in terms of grid voltage and current THD as well as in terms of reactive power and asymmetry mitigation. The SAPF is more efficient in terms of characteristic harmonics mitigation at the grid side when L _ inv < L T . The inductance of the SAPF input reactor should be computed (chosen) taking into account the size of the thyristor-bridge input reactor (see expression (18)). Δ U L _ inv should be chosen in such a way as to obtain L _ inv < L T :
L _ inv = 3 Δ U L _ inv ω 1 ( I a _ ( ref ) + I b _ ( ref ) + I c _ ( ref ) ) < L T

3. Laboratory Experiments

The studies of the influence of the thyristor-bridge input reactor ( L T ) on the SAPF performances were previously presented based on simulations. During the laboratory experiments, the same studies were performed.

3.1. Laboratory Model Description

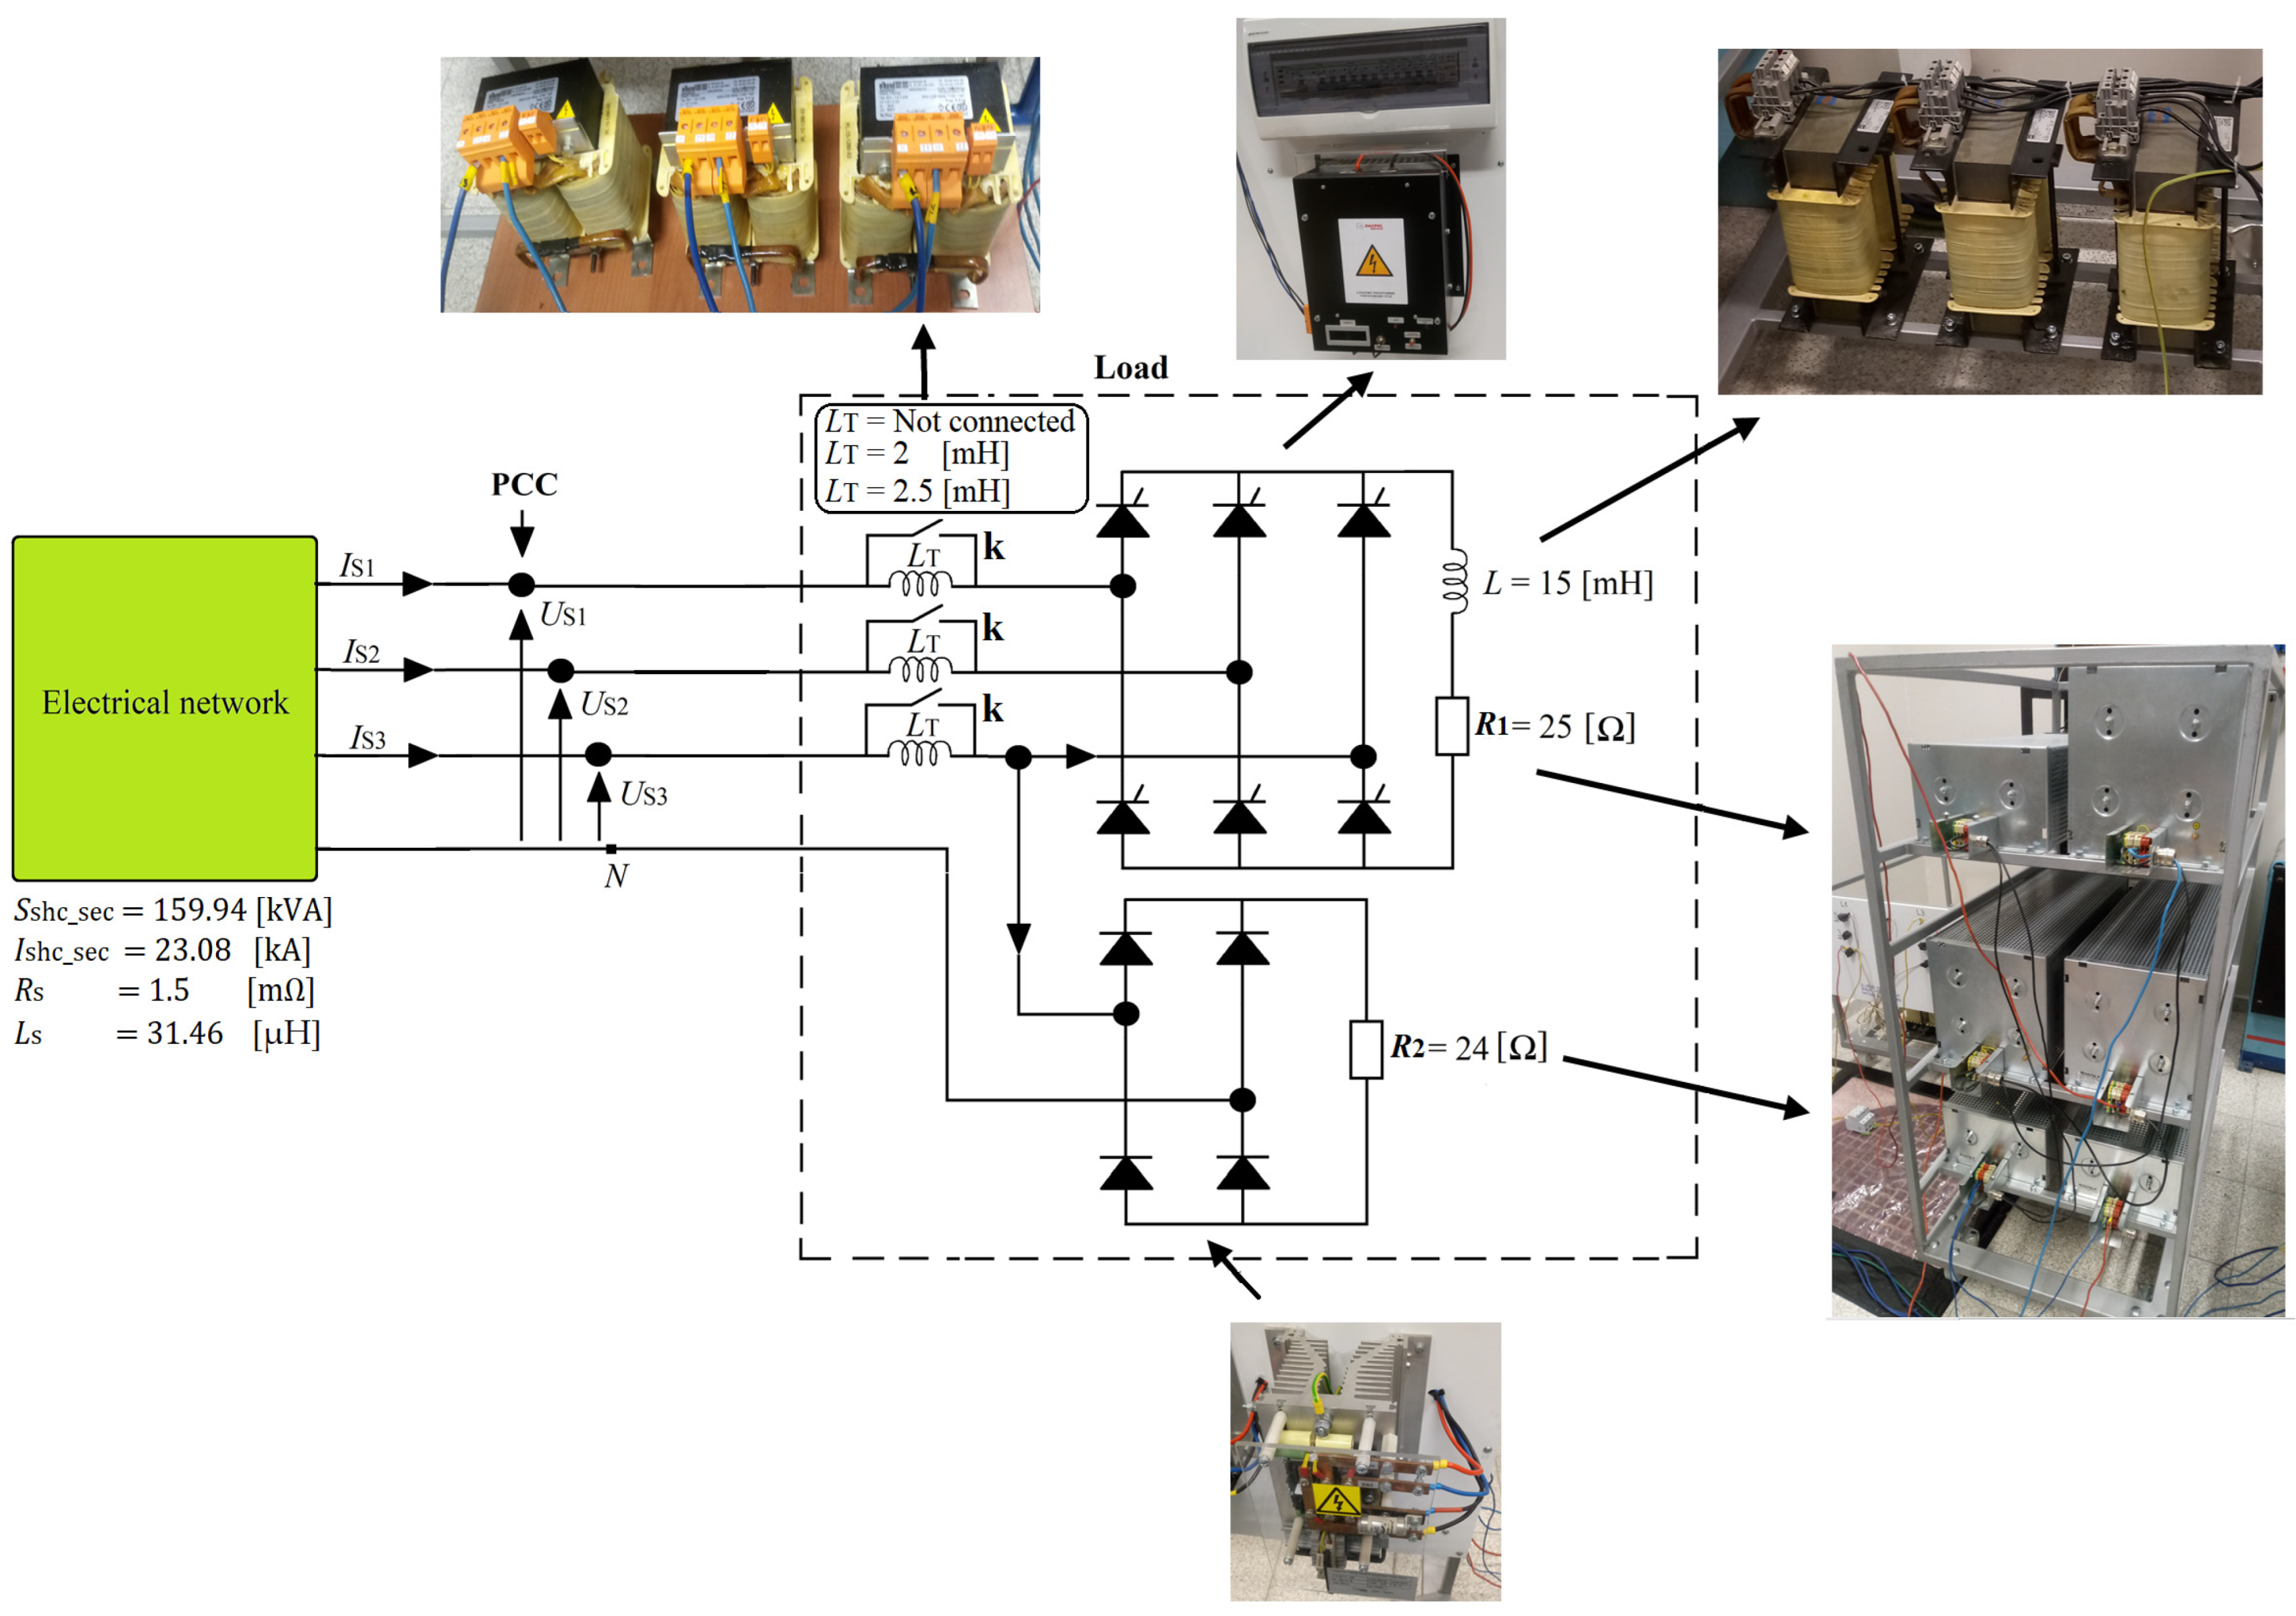
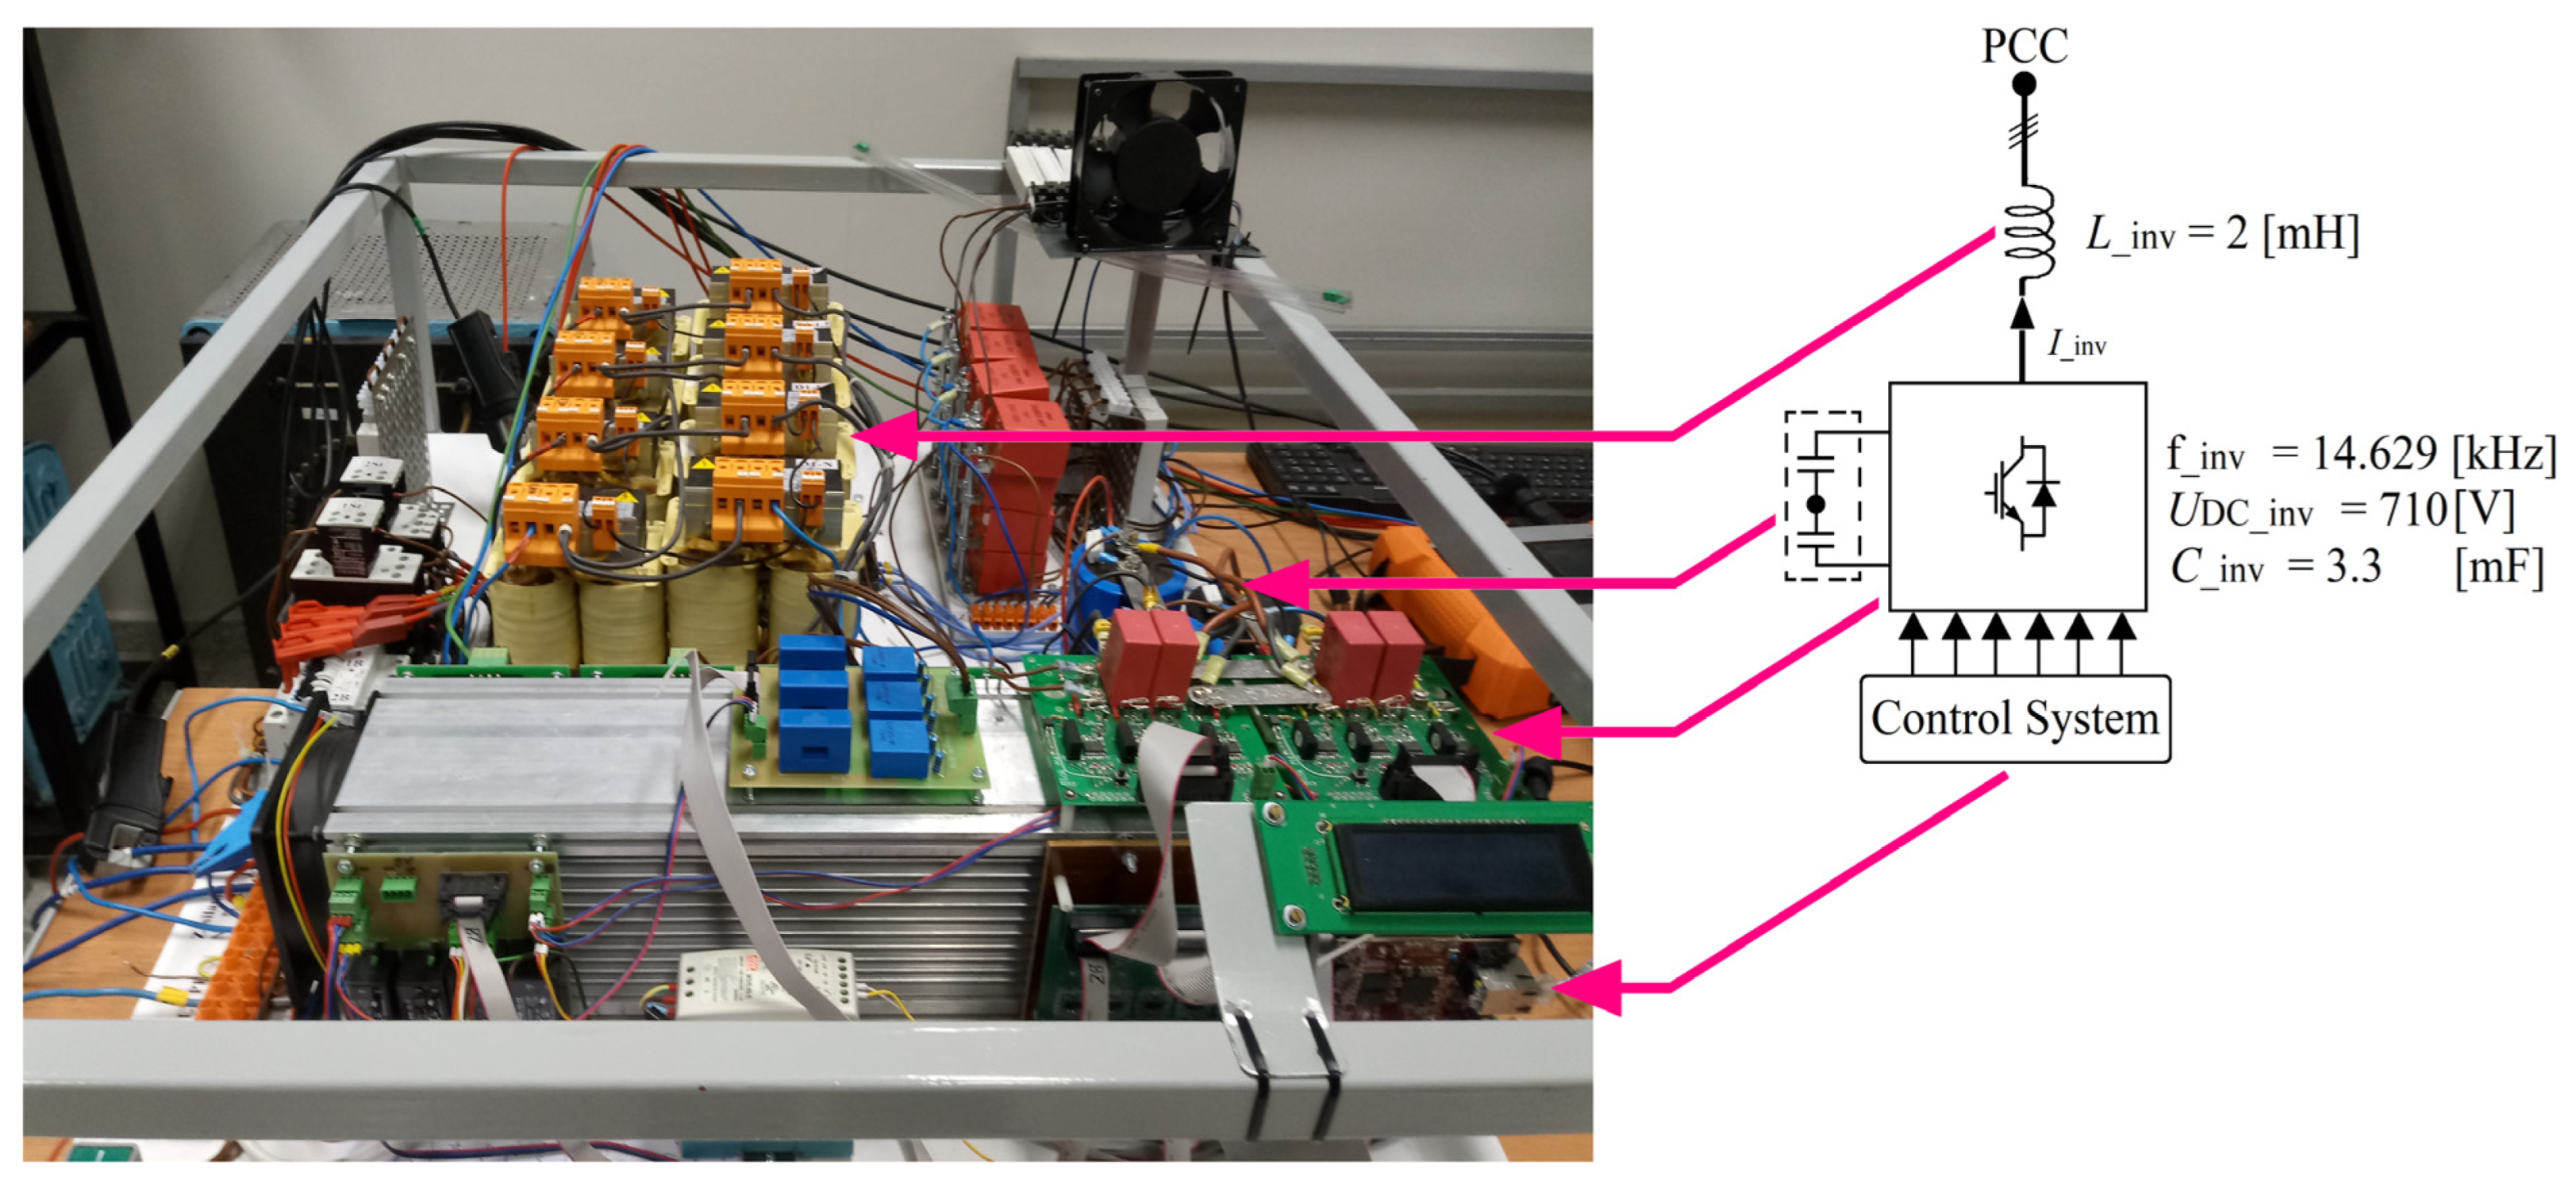
The laboratory set up is presented in Figure 21 and its equivalent circuit in Figure 22. The load was composed of a three-phase thyristor-bridge with the resistance R D C and the reactor L D C at its DC side as well as the commutation reactor L T at the AC side. The one-phase diode-bridge with 24 Ohm resistance at the DC side was used to obtain the current asymmetry condition. The laboratory data are measured through the PQ analyzer hardware “PQ-Box 200” (a-eberle, Nurmberg, Germany) [79].
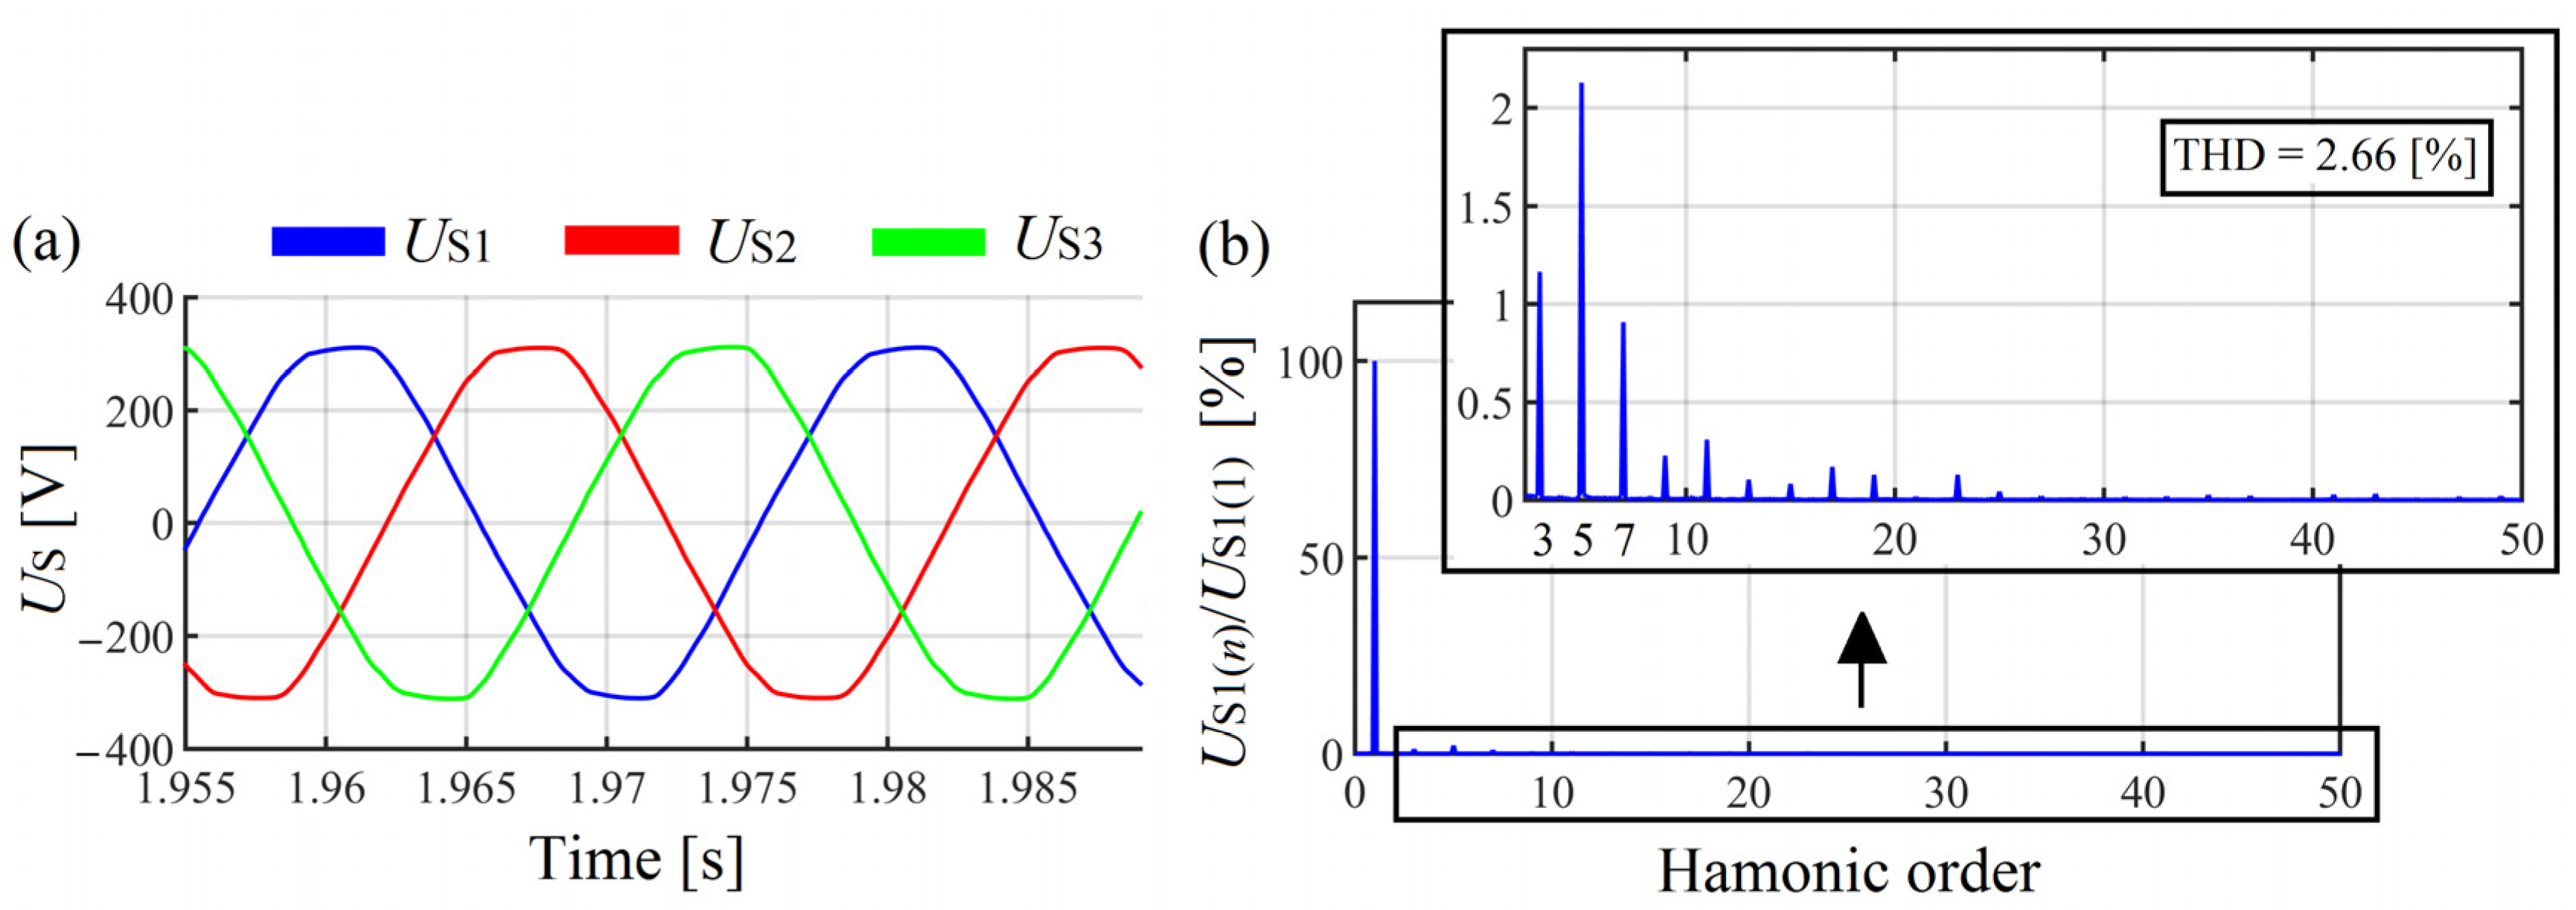
The electrical grid voltage supplying the laboratory set up is symmetrical (the negative sequence represents around 0.12% of the positive sequence) but slightly distorted (Figure 23a) because of other connected non-linear devices. Its spectrum in Figure 23b shows that the dominating harmonics are the 5th (around 2%), the 3rd (more than 1%), and the 7th (almost 1%). According to the IEC61000-2-4 standard [80], its THD and harmonics amplitude are acceptable (Figure 23b).
The SAPF used for the laboratory studies is a three-leg four-wire structure with reactor L _ inv at its input (Figure 24). The input reactor value ( L _ i n v = 2 mH) was chosen for a better switching ripple filtration and a better response of the feedback signal in the control system. The control system is based on the instantaneous p-q theory algorithm and PWM control method. In the control loop, where the compensating current I _ inv 123 is compared to the reference current i a b c _ ( r e f ) , the conventional PI controller is used. The SAPF switching frequency ( f _ i n v = 14.63 kHz) was chosen based on the transistor losses and control system hardware conditions.
The laboratory experiments were not focused on the design of the SAPF with its control system, but on the influence of the rectifier commutator reactor ( L T ) on the SAPF performances. The experiments were carried out via maintaining the parameters of the SAPF constant (with its control system), as well as the thyristor-bridge DC components.

3.2. Laboratory Results

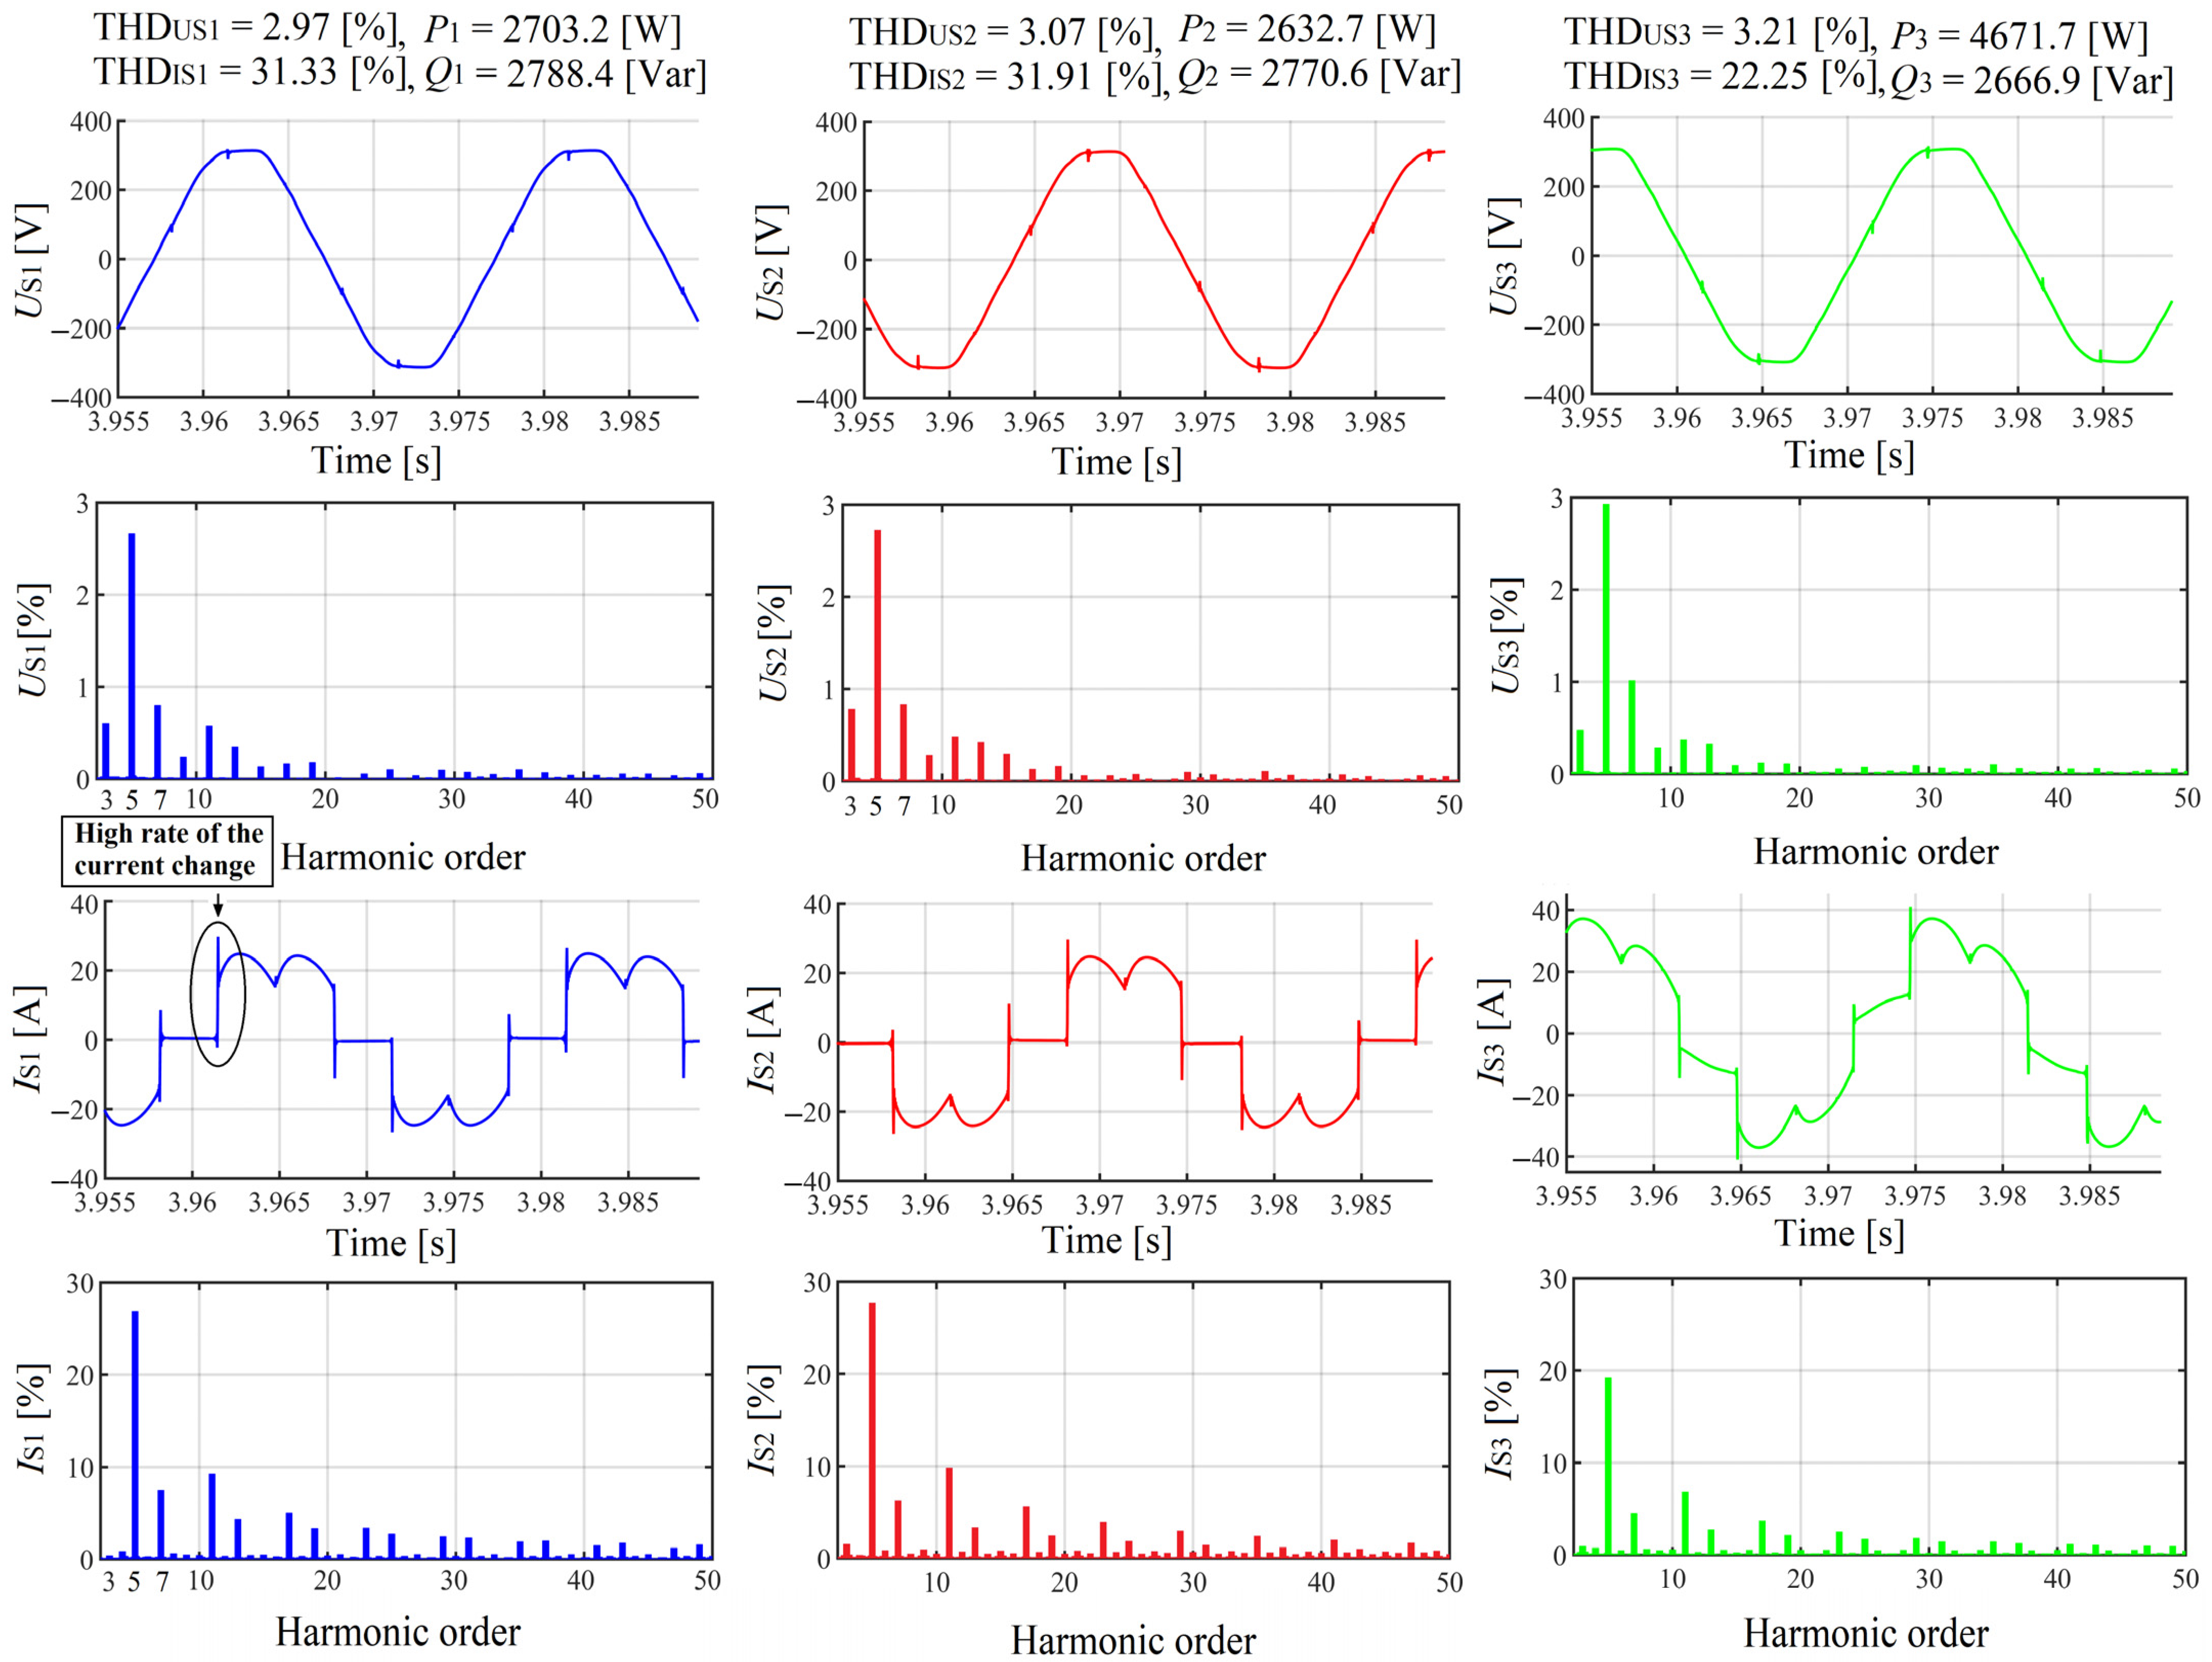
The measured PCC voltage and grid current waveforms and spectrums before the SAPF connection ( L T is not connected) are presented in Figure 25. The PCC voltage and current distortion (THDUS, THDIS), the current asymmetry, the fundamental harmonic reactive power as well as the high rate of current change at the points of commutation notches (see current waveforms in Figure 25) can be observed.
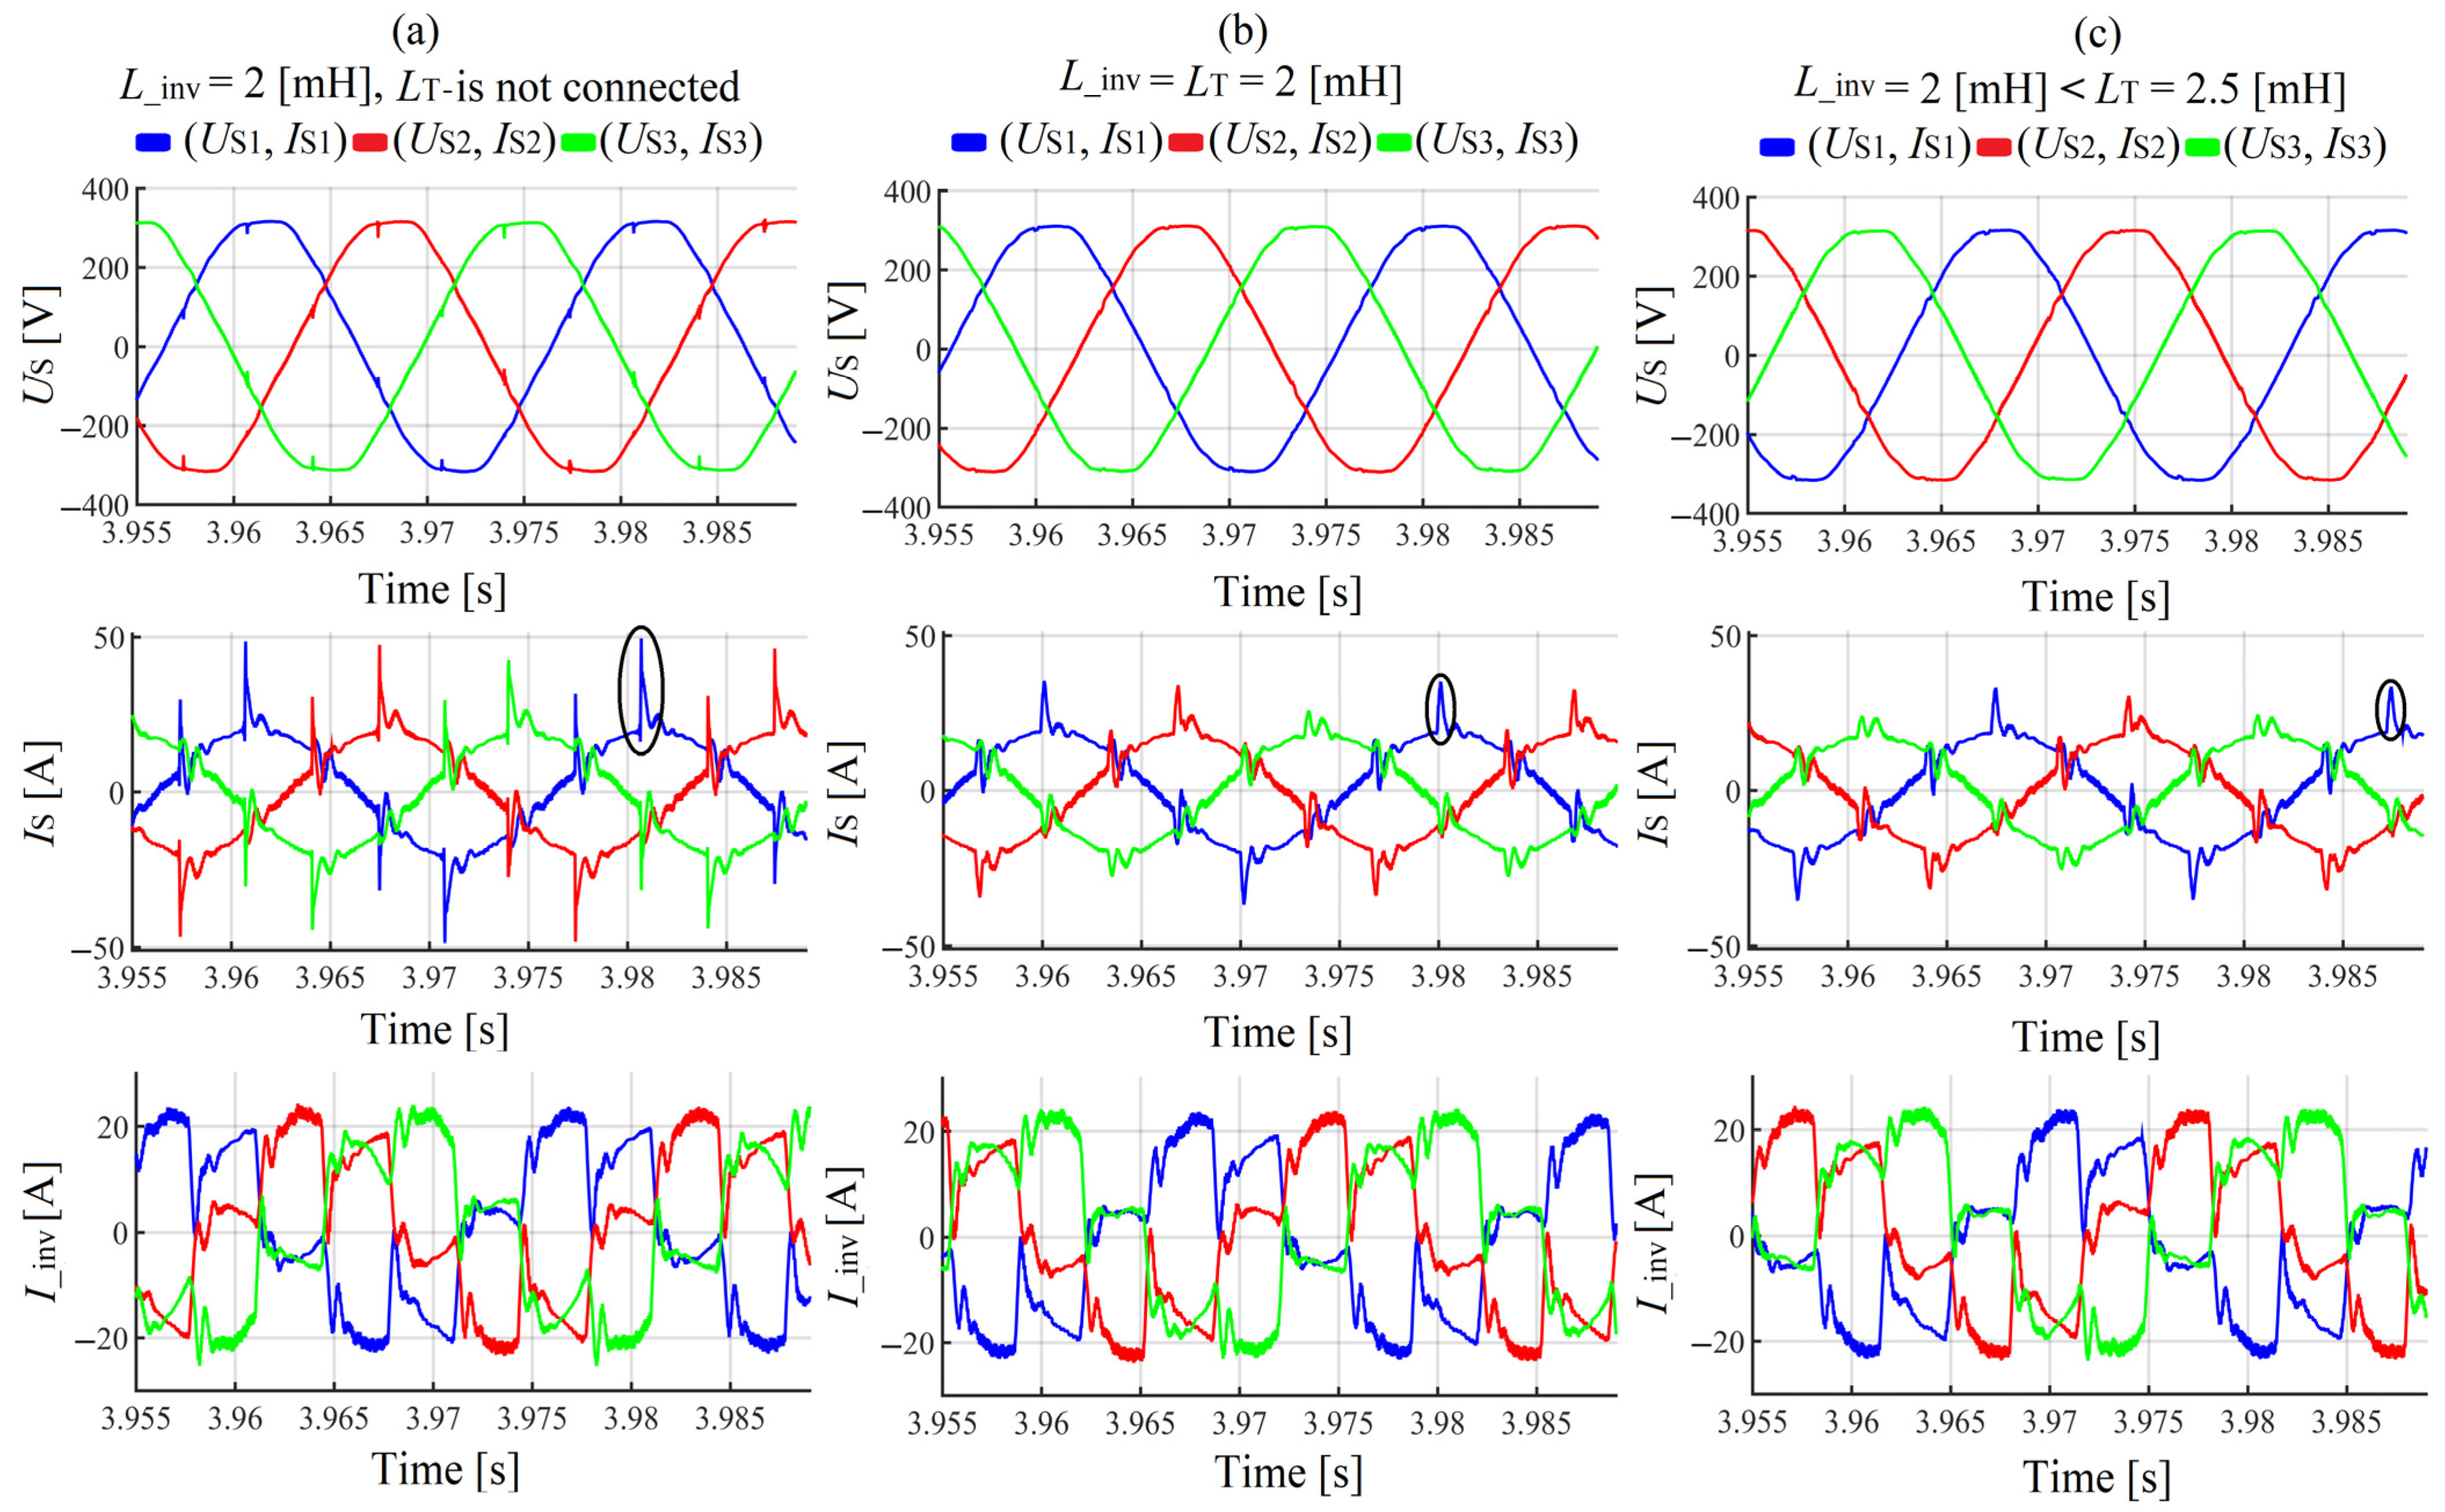
Three case studies based on the change in the thyristor-bridge input reactor inductance ( L T ) are considered after the SAPF connection: in the first one, L _ i n v > L T (switch k is closed, Figure 22), in the second one L T = L _ i n v = 2 mH (k is opened) and in the third one L _ i n v = 2 mH < L T = 2.5 mH (k is opened).
The experimental results shown in Figure 26c in comparison to the ones in Figure 26a,b show that when the SAPF input reactor inductance is smaller than the rectifier input reactor inductance, the PCC voltage and grid current waveforms ripples are better reduced by the SAPF at points of commutation notches.
Figure 26a in comparison to Figure 26b,c shows that when the SAPF input reactor inductance is equal or smaller than the one of the thyristor-bridge input line-reactor L T , the PCC voltage waveforms commutation notches are more effectively reduced.
In Figure 26b,c, it can be seen that with the inverter input reactor inductance equal or smaller than the rectifier input line-reactor inductance, the grid current waveform ripples (commutation ripples) at the high rate of current change (see also the current waveforms in Figure 25) are more effectively reduced by the SAPF.
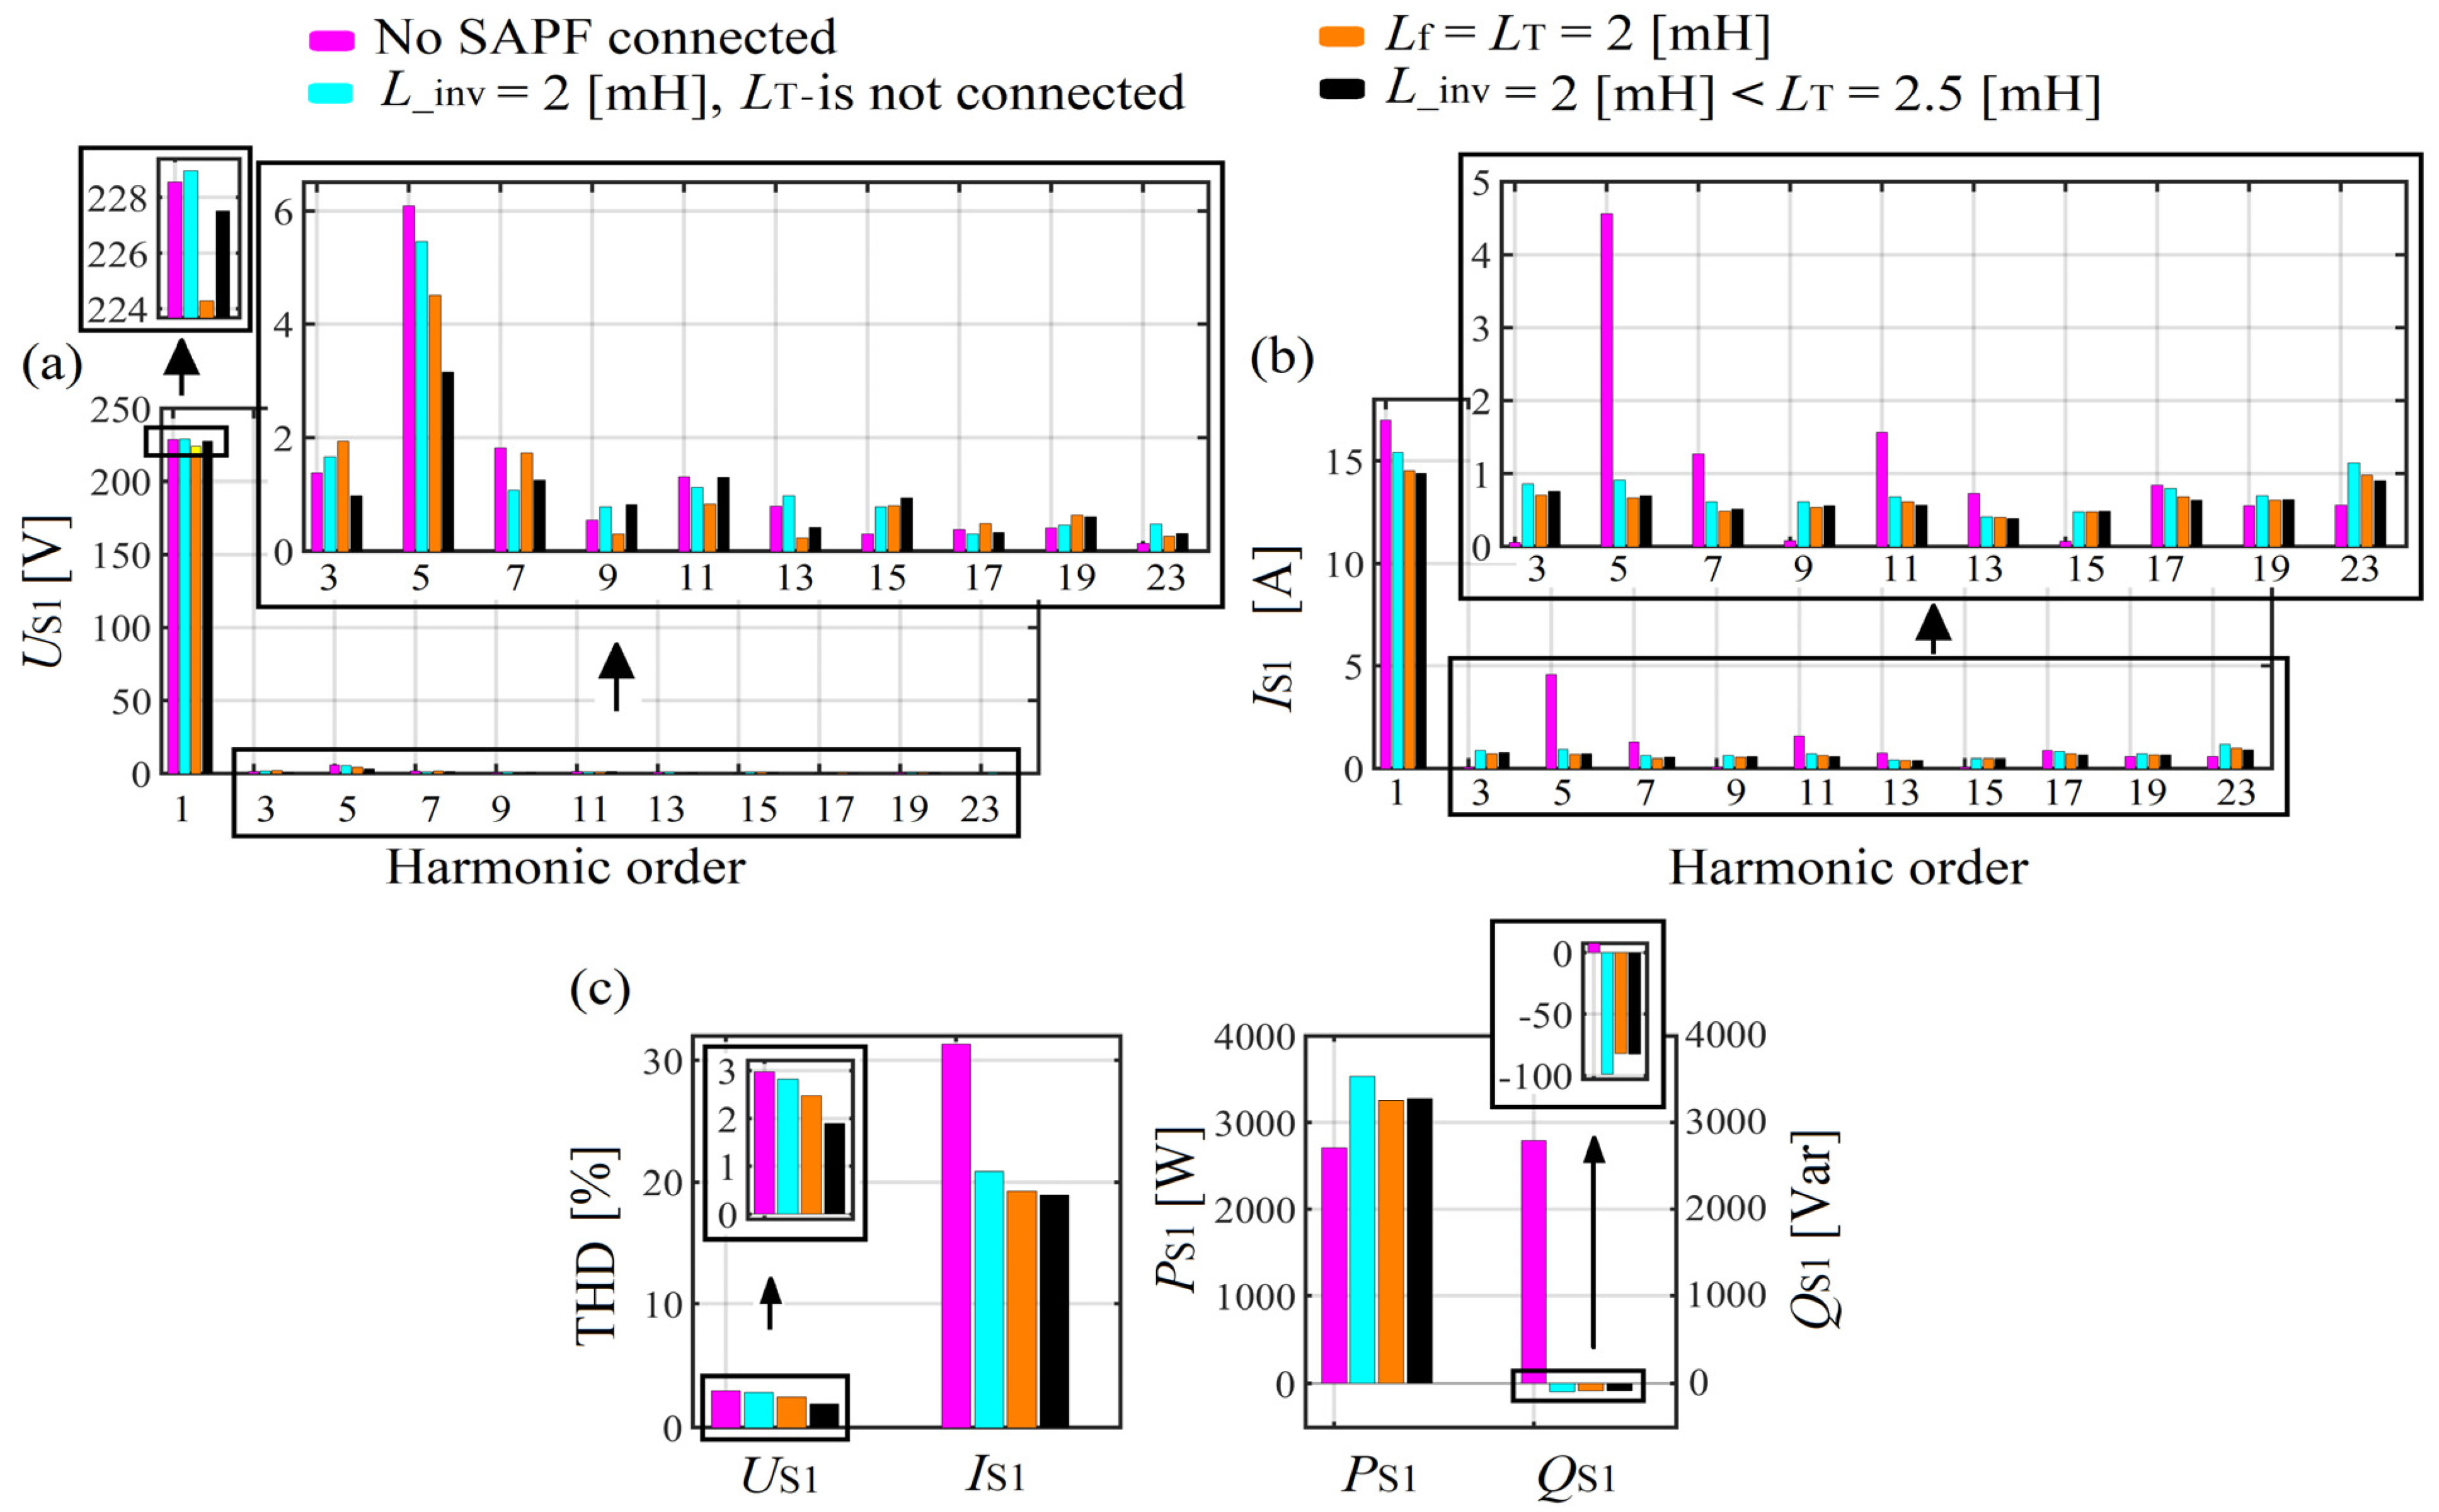
Figure 27 presents (for the three case studies) a comparison of PCC voltage and grid current spectrums and THD as well as grid fundamental harmonic active and reactive powers. Only one phase of each case is considered since the grid current is balanced after the SAPF connection. The cases with L _ i n v = L T and L _ i n v L T present more effective results (as in the case of simulation) in terms of THDUS, THDIS and grid reactive power mitigation (see Figure 27c).
Observing the PCC voltage and grid current spectrums in Figure 27a,b, it can be seen that after the SAPF connection and during the experiments, certain harmonics are reduced (e.g., 5th) and others are amplified (e.g., 19th, 23rd). This phenomenon is due to the fact that the harmonics coming from the grid (see the spectrum in Figure 23b) are added or subtracted from the remaining harmonics coming from the load after filtration. The supply voltage contains harmonics, which can affect the SAPF work efficiency in terms of harmonics mitigation.
The laboratory experiments have confirmed the simulation studies. Therefore, for a better reduction in grid voltage and current ripples at the points commutation notches of waveforms, the inductance of reactor (first-order filter) connected at the SAPF input for switching ripples mitigation, should be smaller than the inductance of the diode or thyristor input reactor so called commutation reactor.

4. Conclusions

An analysis of the influence of the 6-pulse thyristor-bridge input reactor size on the SAPF work efficiency was performed in this paper. Firstly, the simulation studies were presented and secondly, the laboratory experiments were performed to confirm the simulation studies. The case study presented in this paper clearly showed that the size of the line-reactor at the thyristor-bridge input has an influence on the SAPF work efficiency. In this paper, it was demonstrated that:
-
if the SAPF input reactor parameters are computed (chosen) based only on the criteria of a better reduction in the switching ripples (which means a large size of that reactor), the SAPF work efficiency in terms of reactive power, harmonics and reactive power mitigation may be reduced.
-
The SAPF with an input reactor inductance higher than the input reactor inductance of the thyristor-bridge is less efficient in terms of ripples mitigation at the points of commutation notches because at those points the compensating current has difficulties in tracking the reference current.
-
The SAPF with an input reactor inductance equal or smaller than the input reactor inductance of the thyristor-bridge is more efficient in terms of ripples mitigation at the points of commutation notches because at those points the compensating current can easily track the reference current.
-
The SAPF with an input reactor inductance equal or smaller than the input reactor inductance of the thyristor-bridge is more efficient in terms of reactive power, harmonics and asymmetry mitigation than the one with an input reactor inductance higher than the input reactor inductance of the thyristor-bridge.
The line reactor at the thyristor-bridge input is necessary in the electrical system; therefore, this should be taken into account while computing the parameters of the SAPF input reactor (L-filter). In this paper, the expressions to calculate the SAPF parameters (input reactor inductance, DC capacitor voltage and inductance) were proposed as well as the control system algorithm based on the instantaneous p-q theory.

Author Contributions

Conceptualization, C.S.A.M.; Validation, Z.H.; Investigation, C.S.A.M.; Writing—original draft, C.S.A.M.; Writing—review & editing, Z.H.; Visualization, Z.H. All authors have read and agreed to the published version of the manuscript.

Funding

This research received no external funding.

Data Availability Statement

Data are contained within the article.

Conflicts of Interest

The authors declare no conflict of interest.

References

  1. Bhattacharyya, S.; Myrzik, J.M.A.; Kling, W.L. Consequences of poor power quality—An overview. In Proceedings of the IEEE 42nd International Universities Power Engineering Conference, Brighton, UK, 4–6 September 2007. [Google Scholar]
  2. Bhattacharyya, S.; Lumig, M.V.; Cobben, S.; Myrzik, J.; Kling, W. Consequences of poor power quality for grid operators. In Proceedings of the IEEE 20th International Conference and Exhibition on Electricity Distribution—Part 2, Prague, Czech Republic, 8–11 June 2009. [Google Scholar]
  3. Tazky, M.; Regula, M.; Otcenasova, A. Impact of changes in a distribution network nature on the capacitive reactive power flow into the transmission network in Slovakia. Energies 2021, 14, 5321. [Google Scholar] [CrossRef]
  4. Shawon, M.H.; Hanzelka, Z.; Dziadecki, A. Voltage-current and harmonic characteristic analysis of different FC-TCR based SVC. In Proceedings of the IEEE Conference Eindhoven PowerTech, Eindhoven, The Netherlands, 29 June–2 July 2015. [Google Scholar]
  5. AbdElhafez, A.A.; Alruways, S.H.; Alsaif, Y.A.; Althobaiti, M.F.; Alotaibi, A.B.; Alotaibi, N.A. Reactive power problem and solutions: An overview. J. Power Energy Eng. 2017, 5, 40–54. [Google Scholar] [CrossRef]
  6. Kuldeep, K.S.; Saquib, S.; Nanand, V.P. Harmonics & its mitigation technique by passive shunt filter. Int. J. Soft Comput. Eng. (IJSCE) 2013, 3, 325–331. [Google Scholar]
  7. Singh, G.K. Power System Harmonic Research: A Survey. Eur. Trans. Electr. Power 2009, 19, 151–172. [Google Scholar] [CrossRef]
  8. Wagner, V.E. Effects of harmonics on equipment. IEEE Trans. Power Deliv. 1993, 8, 672–680. [Google Scholar] [CrossRef]
  9. Bennett, P.C.; Darley, V.; Abbott, S.M. The effects of harmonic distortion on equipments. In Proceedings of the IEEE Colloquium on Sources and Effects of Harmonic Distortion in Power Systems, London, UK, 5 March 1997. [Google Scholar]
  10. Buzdugan, M.I.; Balan, H. Power system harmonics issues in some end. In Proceedings of the 52nd IEEE International Universities Power Engineering Conference (UPEC), Heraklion, Greece, 28–31 August 2017. [Google Scholar]
  11. Plummer, I. Assymmetry in Distribution Systems: Causes, Harmful Effects and Remedies. LSU Master’s Thesis. Available online: https://digitalcommons.lsu.edu/cgi/viewcontent.cgi?referer=&httpsredir=1&article=2489&context=gradschool_theses (accessed on 1 March 2023).
  12. Jouanne, A.V.; Banerjee, B. Assessment of voltage unbalance. IEEE Trans. Power Deliv. 2001, 16, 782–790. [Google Scholar] [CrossRef]
  13. Lee, K.; Jahns, T.M.; Lipo, T.A.; Venkataramanan, G.; Berkopec, W.E. Impact of input sag and unbalance on DC-link inductor and capacitor stress in adjustable-speed drives. IEEE Trans. Ind. Appl. 2008, 44, 1825–1833. [Google Scholar] [CrossRef]
  14. Horia, G.B.; Sorin, G.P.; Iulian, M.T.B.; Anca, M.; Pompei, C.D.; Mohammed, S. Effects of voltage unbalance and harmonics on drive systems with induction motor. J. Taibah Univ. Sci. 2022, 16, 1. [Google Scholar] [CrossRef]
  15. Driesen, J.; Craenenbroeck, T.V. Voltage Disturbances Introduction to Unbalance. Power Quality Application Guide, Katholieke Universiteit Leuven, May 2002. Available online: https://studylib.net/doc/18037296/5.1.3-introduction-to-unbalance (accessed on 7 October 2023).
  16. Osahenvemwen, O.A.; Okhumeode, M.E.; Emakpor, S. The Effects of Unbalance Load in Power Distribution Sub—Station Network. Am. J. Sci. Eng. Res. 2020, 3, 1–11. Available online: https://www.researchgate.net/publication/344188516 (accessed on 13 March 2023).
  17. Arghavani, H.; Peyravi, M. Unbalanced current based tariff. In Proceedings of the CIRED 24th International Conference on Electricity Distribution, Glasgow, Scotland, 12–15 June 2017. [Google Scholar]
  18. Kahingala, T.D.; Perera, S.; Agalgaonkar, A.P.; Jayatunga, U. Statcom based network voltage unbalance mitigation for sub-transmission networks. In Proceedings of the IEEE Innovative Smart Grid Technologies—Asia (ISGT Asia), Chengdu, China, 21–24 May 2019. [Google Scholar]
  19. Singh, A.K.; Singh, G.K.; Mitra, R. Impact of source voltage unbalance on AC-DC rectifier performance. In Proceedings of the IEEE 2nd International Conference on Power Electronics Systems and Applications, Hong Kong, China, 12–14 November 2006. [Google Scholar]
  20. EIC 61000-2-4. Electromagnetic Compatibility (EMC) Part 2-4: Environment Levels in Industry Plants for Low-Frequency Conducted Disturbances.Second edition 2002-06. Available online: https://www.vde-verlag.de/iec-normen/preview-pdf/info_iec61000-2-4%7Bed2.0%7Db.pdf (accessed on 21 December 2020).
  21. Klempka, R. Design of C-type passive filter for arc furnaces. Metalurgia 2017, 56, 161–163. [Google Scholar]
  22. Azebaze, M.C.S.; Hanzelka, Z. Passive harmonic filters. In Power Quality in Future Electrical Power Systems, 1st ed.; Zobaa, A.F., Shady, H.E.A.A., Eds.; IET the Institution of Engineering and Technology: London, UK, 2017. [Google Scholar]
  23. Klempka, R. Optimal Double-Tuned Filter Efficiency analysis. IEEE Trans. Power Deliv. 2020, 36, 1079–1088. [Google Scholar] [CrossRef]
  24. Firlit, A.; Kołek, K.; Piątek, K. Heterogeneous active power filter controller. In Proceedings of the IEEE International Symposium ELMAR, Zadar, Croatia, 18–20 September 2017. [Google Scholar]
  25. Azebaze, M.C.S.; Hanzelka, Z. Different approaches for designing the passive power filters. Przegląd Elektrotechniczny 2015, 91, 102–108. [Google Scholar]
  26. Piątek, K. A new approach of DVR control with minimized energy injection. In Proceedings of the IEEE 12th International conference on Power Electronics and motion Control, Portoroz, Slovenia, 30 August–1 September 2006. [Google Scholar]
  27. Azebaze, M.C.S.; Hanzelka, Z. Hybrid passive harmonic filter: Group of two parallel connected single-tuned filters and the series passive filter. In Polish-Hybrydowy Filtr Pasywny: Grupa Dwóch Jednogałęziowych Filtrów Równoległych Połączonych z Filtrem Szeregowym; Grupa MEDIUM Sp. z o.o. Sp.k.-a: Cracow, Poland, 2022; pp. 64–70. [Google Scholar]
  28. Ehsan, P.; Masood, A.A. Efficient procedures to design and characterize passive harmonic filters in low power applications. In Proceedings of the IEEE International Symposium on Industrial Electronics (ISIE), Bari, Italy, 4–7 July 2010. [Google Scholar]
  29. Reynaldo, R.; Gregory, A.F. Optimal harmonic filter topology applied in HV and EHV networks using particle swarm optimization. In Proceedings of the IEEE Electrical Power and Energy Conference (EPEC), Ottawa, ON, Canada, 12–14 October 2016. [Google Scholar]
  30. Gumilar, L.; Afandi, A.N.; Aripriharta; Habibi, M.A.; Kusumawardana, A.; Baskoro, A. Performance of combination shunt passive harmonic filter and detuned reactor at high voltage level. In Proceedings of the IEEE 7th International Conference on Electrical, Electronics and Information Engineering (ICEEIE), Malang, Indonesia, 2 October 2021. [Google Scholar]
  31. Tupsa-ard, J.; Chamchoy, C.; Tayjasanant, T. High-voltage passive harmonic filter design. In Proceedings of the IEEE 8th International Conference on Electrical Engineering/Electronics, Computer, Telecommunications and Information Technology (ECTI) Association of Thailand, Khon Kaen, Thailand, 11 July 2011. [Google Scholar]
  32. Azebaze, M.C.S. Investigation on the work efficiency of the LC passive harmonic filter chosen topologies. Electronics 2021, 10, 896. [Google Scholar] [CrossRef]
  33. Azebaze, M.C.S.; Hanzelka, Z.; Firlit, A. Analysis of the factor having an influence on the LC passive harmonic filter work efficiency. Energies 2022, 15, 1894. [Google Scholar] [CrossRef]
  34. Fujita, H.; Yamasaki, T.; Akagi, H. A hybrid active filter for damping of harmonic resonance in industrial power systems. IEEE Trans. Power Electron. 2000, 15, 215–222. [Google Scholar] [CrossRef]
  35. Gonzatti, R.B.; Ferreira, S.C.; da Silva, C.H.; Pereira, R.R.; da Silva, L.E.B.; Lambert-Torres, G. Smart Impedance: A New Way to Look at Hybrid Filters. IEEE Trans. Smart Grid 2016, 7, 837–846. [Google Scholar] [CrossRef]
  36. Swain, S.D.; Ray, P.K.; Mohanty, K.B. Improvement of power quality using a robust hybrid series active power filter. IEEE Trans. Power Electron. 2017, 32, 3490–3498. [Google Scholar] [CrossRef]
  37. Lee, T.; Wang, Y.C.; Li, J.C.; Guerrero, J.M. Hybrid active filter with variable conductance for harmonic resonance suppression in industrial power systems. IEEE Trans. Ind. Electron. 2015, 62, 746–756. [Google Scholar] [CrossRef]
  38. Jalil, M.; Amiri, A. An effective structure of three-phase parallel hybrid active power filter to accurate harmonic elimination. In Proceedings of the IEEE 15th International Conference on Protection and Automation of power Systems (IPAPS), Shiraz, Iran, 30–31 December 2020. [Google Scholar]
  39. Cleary-Balderas, A.; Medina-Rios, A.; Cruz-Hernéndez, O. Hybrid active power filter based on the IRP theory for harmonic current mitigation. In Proceedings of the IEEE International Autumn Meeting on Power, Electronics and Computing (ROPEC), Ixtapa, Mexico, 26 January 2017. [Google Scholar]
  40. Daftary, D.; Shah, M.T. Design and analysis of the hybrid active power filter for current harmonics mitigation. In Proceedings of the IEEE 16th India Council International Conference (INDICON), Rajkot, India, 13–15 December 2019. [Google Scholar]
  41. Akagi, H.; Tamai, Y. Comparisons in Circuit Configuration and Filtering Performance between Hybrid and Pure Shunt Active Filters, In Proceedings of the IEEE 38th IAS Annual Meeting on Conference Record of the Industry Applications, Salt Lake City, UT, USA, 12–16 October 2003.
  42. Lee, H.; Shon, J. Sensorless AC capacitor voltage monitoring method for HAPF. IEEE Access 2023, 11, 15514–15524. [Google Scholar] [CrossRef]
  43. Azebaze, M.C.S.; Hanzelka, Z. Hybrid power active filter—Effectiveness of passive filter on the reduction of voltage and current distortion. In Proceedings of the IEEE International Conference on Electric Power Quality and Supply Reliability, Estonia, Tallinn, 29–31 August 2016. [Google Scholar]
  44. Singh, B.; Chandra, A.; Al-Haddad, K. Power Quality: Problems and Mitigation Techniques; John Wiley & Sons Ltd.: Chichester, UK, 2015. [Google Scholar]
  45. Firlit, A.; Kołek, K.; Piątek, K. Rapid controller development for a dynamic voltage restorer. In Proceedings of the IEEE International Symposium ELMAR, Zadar, Croatia, 18–20 September 2017. [Google Scholar]
  46. Jacek, K. Practical application of series active compensators. In Power Theories for Improved Power Quality; Grzegorz, B., Pasko, M., Eds.; Springer: London, UK, 2012; pp. 13–47. [Google Scholar]
  47. Kwak, S.; Toliyat, H.A. Design and rating comparison of PWM voltage source rectifiers and active power filters for AC drives with unity power factor. IEEE Trans. Power Electron. 2015, 20, 1133–1142. [Google Scholar] [CrossRef]
  48. Abdelmadjid, C.; Jean-Paul, G.; Fateh, K.; Laurent, R. On the design of shunt active filter for improving power quality. In Proceedings of the IEEE International Symposium on Industrial Electronics, Cambridge, UK, 30 June–2 July 2008. [Google Scholar]
  49. Chiang, S.J.; Chang, J.M. Design and implementation of the parallelable active power filter. In Proceedings of the 30th Annual IEEE Power Electronics Specialists Conference, Charleston, SC, USA, 1 July 1999. [Google Scholar]
  50. Juan, W.D.; Contardo, J.M.; Moran, L.A. A Fuzzy-controlled active front-end rectifier with current harmonic filtering characteristics and minimum sensing variables. IEEE Trans. Power Electron. 1999, 14, 724–729. [Google Scholar]
  51. Sut-Ian, H.; Chi-Seng, L.; Man-Chung, W. Comparison among PPF, APF, HAPF and a combined system of a shunt HAPF and a Shunt Thyristor controlled LC. In Proceedings of the IEEE Region 10 Conference TENCON, Macao, China, 1–4 November 2015. [Google Scholar]
  52. Bing, Y.; Jiang, D.; Liang, Y.; Jiang, C.; He, T.; Yang, L.; Hu, P. Modified modeling and system stabilization of shunt active power filter compensation loads with μF capacitance. Energies 2019, 12, 2084. [Google Scholar] [CrossRef]
  53. Yap, H.; Mohd, A.M.R.; Muhammad, A.A.M.Z.; Mohamad, A.M.Z. Shunt active power filter: A review on phase synchronization control techniques. Electronics 2019, 8, 791. [Google Scholar] [CrossRef]
  54. Helder, J.A.; José, M.F.; António, P.M.; Adriano, S.C. Direct Current Control of an Active Power Filter for Harmonic Elimination, Power Factor Correction and Load Unbalancing Compensation. Available online: https://core.ac.uk/reader/143395357 (accessed on 29 October 2023).
  55. António, M.; José, F.; Helder, A. Active power filters for harmonic elimination and power quality improvement. In Power Quality; Eberhard, A., Ed.; InTech: Rijeka, Croatia, 2011; pp. 161–182. [Google Scholar]
  56. Saifullah, K.; Bharti, D.; Mishra, V.M. Constant instantaneous power based controller for a shunt active power filter under balanced, unbalanced, and distorted supply conditions. In Proceedings of the IEEE International Conference on Computing, Communication and Automation (ICCCA2015), Greater Noida, India, 15–16 May 2015. [Google Scholar]
  57. Prasanta, K.B.; Gauri, S.; Pradeepta, K.S.; Rajvikram, M.E.; Sachin, K.; Federico, M.I.; Mohamad, A.H.; Ankit, K.S.; Vladimir, T. A novel negative feedback phase locked loop-based reference current generation technique for shunt active power filter. Electr. Power Energy Syst. 2023, 153, 109389. [Google Scholar] [CrossRef]
  58. Debendra, D.; Rabi, N.M.; Ramaprasad, P. Power quality enhancement by shunt active power filter employing different control strategies. In Proceedings of the IEEE International Conference on Circuits, Power and Intelligent Systems (CCPIS), Bhubaneswar, India, 1–3 September 2023. [Google Scholar]
  59. Sabir, O.; Heinrich, S.; Mohamed, B.; Frede, B. Robust DPC-SVM control strategy for shunt active power filter based on H∞ regulators. Electr. Power Energy Syst. 2020, 117, 105699. [Google Scholar] [CrossRef]
  60. Salem, S.; Rabeh, A.; Souad, C. Fuzzy logic controller for three-level shunt active filter compensating harmonics and reactive power. Int. J. Adapt. Control Signal Process. 2016, 30, 809–823. [Google Scholar] [CrossRef]
  61. Sabir, O.; Mohamed, M.; Frede, B.; Achour, B.; Heinrich, S. Direct power control of shunt active power filter using space vector modulation based on supertwisting sliding mode control. IEEE J. Emerg. Sel. Top. Power Electron. 2021, 9, 3243–3253. [Google Scholar]
  62. Mousavi, M.S.; Jalilian, A.; Asadi, M. A sliding mode control method of dc-link capacitor voltage used in active power filter. In Proceedings of the IEEE 2015 30th International Power Systems Conference (PSC), Tehran, Iran, 23–25 November 2015. [Google Scholar]
  63. Chi, J.; Yi, T.; Peng, W.; Xiong, L.; Dexuan, Z.; Frede, B. Reduction of Dc-Link capacitance for three-phase three-wire shunt active power filters. In Proceedings of the IEEE IECON 2013—39th Annual Conference of the IEEE Industrial Electronics Society, Vienna, Austria, 10 November 2013. [Google Scholar]
  64. Bitoleanu, A.; Popescu, M.; Matin, D.; Dobriceanu, M. LCL interface filter design for shunt active power filters. In Proceedings of the 3rd international Symposium on Electrical Engineering and Energy Converters, Suceava, Romania, 24–25 September 2009; Available online: https://www.academia.edu/45369198/LCL_Interface_Filter_Design_for_Shunt_Active_Power_Filters (accessed on 29 October 2023).
  65. Lorzadeh, I.; Savaghebi, M.; Askarian, A.; Guerrero, M.J. Active damping technique for LCL-filtered inverters-based microgrids. In Proceedings of the IEEE 10th international Symposium on Diagnostics for Electrical Machines, Power Electronics and Drives (SDEMPED), Guarda, Portugal, 1–4 September 2015. [Google Scholar]
  66. Yang, L.; Liu, D.; Zhang, Z.; Yang, M.; Zhao, L.; Chen, X.; Xu, L.; Fu, Y.; Ma, C. Improving the current control performance of LCL type shunt active power filters with high-pass inverter-side current feedback active damping. In Proceedings of the 2023 IEEE 6th International Electrical and Energy Conference (CIEEC), Hefei, China, 12–14 May 2023. [Google Scholar]
  67. Büyük, M.; Tan, A.; Çağatay, B.K.; Tümay, M. Analysis and comparison of passive damping methods for shunt active power filter with output LCL filter. In Proceedings of the IEEE 2015 Intl Aegean Conference on Electrical Machines & Power Electronics (ACEMP), 2015 Intl Conference on Optimization of Electrical & Electronic Equipment (OPTIM) & 2015 Intl Symposium on Advanced Electromechanical Motion Systems (ELECTROMOTION), Side, Turkey, 2–4 September 2015. [Google Scholar]
  68. Bitoleanu, A.; Popescu, M.; Linca, M. Limitation of LCL filter for three-phase shunt active power filters in active traction substations. In Proceedings of the IEEE 2016 International Symposium on Power Electronics, Electrical Drives, Automation and Motion (SPEEDAM), Capri, Italy, 22–24 June 2016. [Google Scholar]
  69. Yu, N.; Yang, J.; Chen, S.; Ye, M. Design of LCL-filter based three-level active power filters. Telkomnika Indones. J. Electr. Eng. 2014, 12, 48–56. Available online: https://ijeecs.iaescore.com/index.php/IJEECS/article/view/2976/987 (accessed on 29 October 2023). [CrossRef]
  70. Li, L.; Guo, Y.; Zhang, X. Analysis and application of passive damping LLCL filter in active filter. In Proceedings of the 5th Annual IEEE International Conference on Cyber Technology in Automation, Control and Intelligent Systems, Shenyang, China, 8–12 June 2015. [Google Scholar]
  71. Azebaze, M.C.S.; Firlit, A. Investigation of the line-reactor influence on the active power filter and hybrid active power filter efficiency: Practical approach. Przegląd Elektrotech. 2021, 97, 39–44. [Google Scholar]
  72. Abu-Rubu, H.; Iqbal, A.; Guzinski, J. High Performance Control of AC Drives with Matlab/Simulink Models; John Wiley & Sons: Chichester, UK, 2012. [Google Scholar] [CrossRef]
  73. Akagi, H.; Kanazawa, Y.; Nabea, A. Instantaneous reactive power compensators comprising switching devices without Energy storage components. IEEE Trans. Ind. Appl. 1984, IA-20, 625–630. [Google Scholar] [CrossRef]
  74. Akagi, H.; Kanazawa, Y.; Fujita, K.; Nabae, A. Generalized theory of instantaneous reactive power and its application. Electr. Eng. Jpn. 1983, 103, 483–490. [Google Scholar] [CrossRef]
  75. Akagi, H.; Watanabe, H.E.; Aredes, M. Instantaneous Power Theory and Application to Power Conditioning; John Wiley & Sons, Inc.: Hoboken, NJ, USA, 2007. [Google Scholar]
  76. Moran, L.M.; Dixon, J.W.; Wallace, R.R. A three-phase active power filter operating with fixed switching frequency for reactive power and current harmonic compensation. IEEE Trans. Ind. Electron. 1995, 42, 402–408. [Google Scholar] [CrossRef]
  77. Hanzelka, Z. High Harmonics of Voltage and Current (in Polish—Wyższe Harmoniczne Napięć i Prądów). Available online: http://www.twelvee.com.pl/42767005.php?c=%D0%B5 (accessed on 29 October 2023).
  78. Piróg, S. Power Electronics—Network communication and hard commutation systems. In Polish—Energoelektronika—Układ o Komunikacji Sieciowej i o Komutacji Twardej; AGH: Krakow, Poland, 2006. [Google Scholar]
  79. The Mobile Power Quality Meter for Experts PQ-Box 200. Available online: https://www.a-eberle.de/en/products/mobile-power-quality-analyzer-pq-box-200/ (accessed on 29 October 2023).
  80. Hanzelka, Z. Quality of the Electricity Supply-Disturbances of the Voltage RMS Value. In Polish–Jakość Dostawy Energii Elektrycznej—Zaburzenia Wartości Skutecznej Napięcia; AGH: Krakow, Poland, 2013. [Google Scholar]
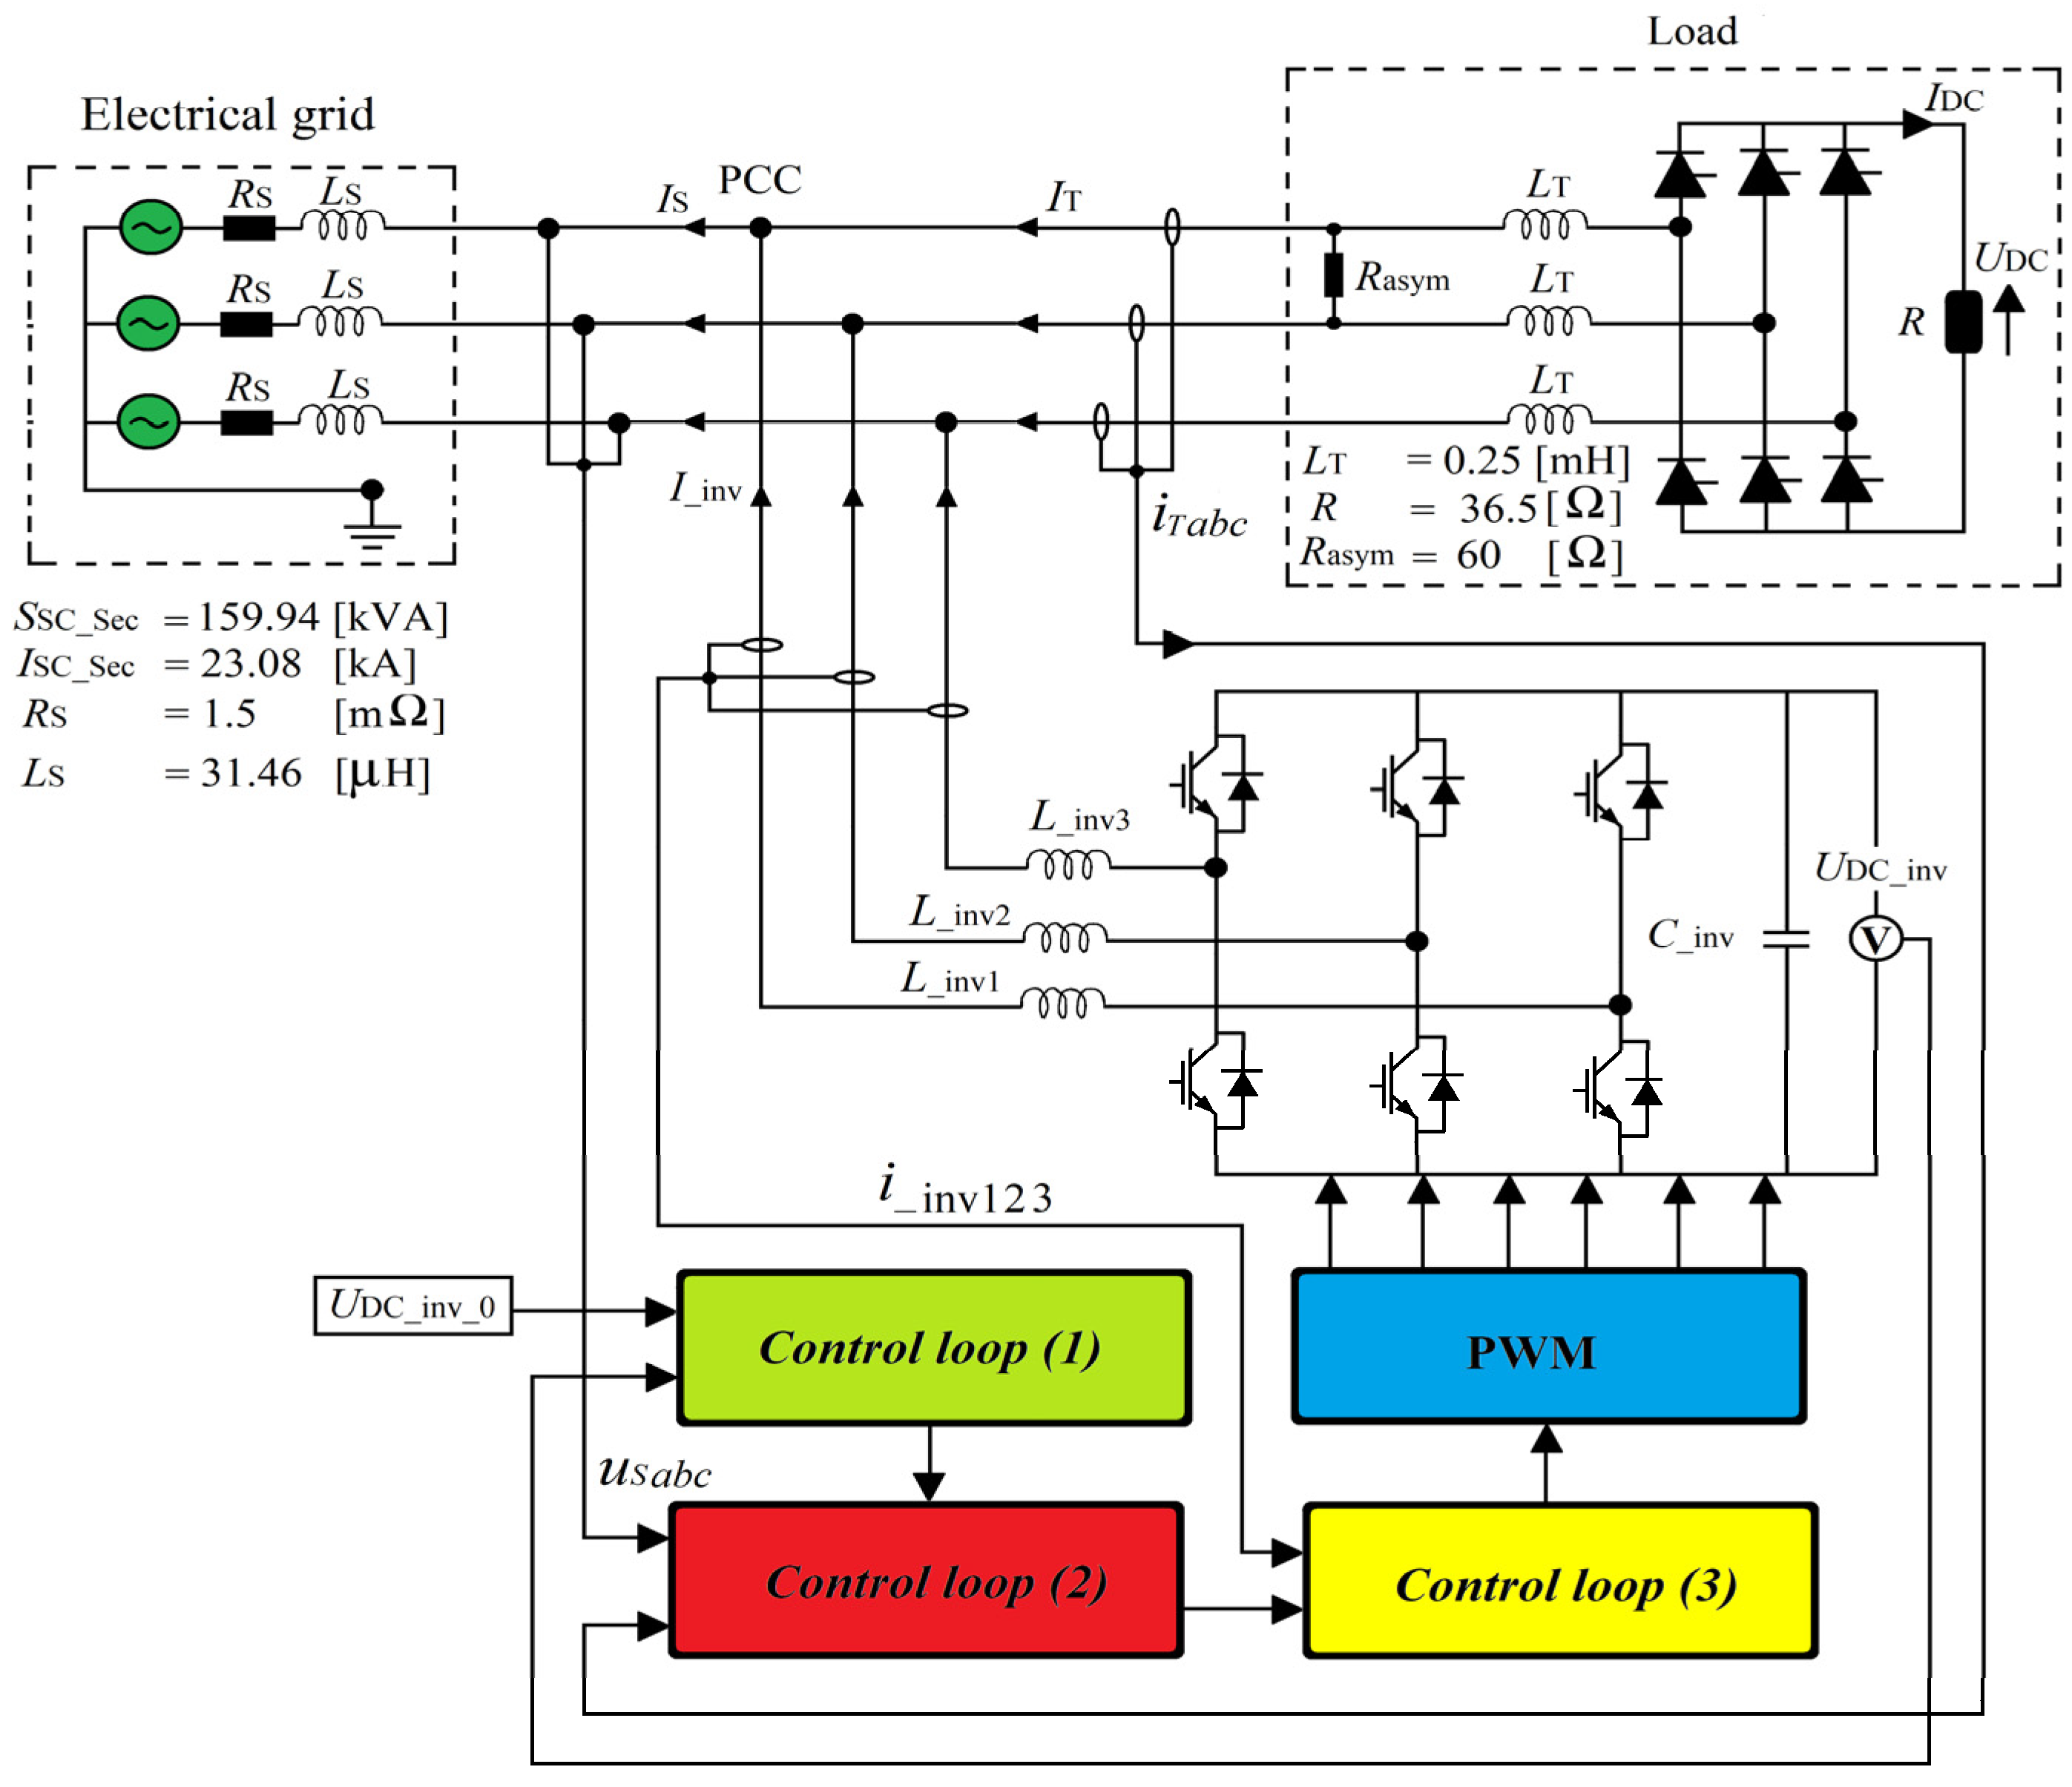
Figure 1. Equivalent circuit of the simulated electrical system. SSC_Sec—short-circuit power at the transformer secondary side; ISC_Sec—initial short-circuit current at the transformer secondary side; (RS, LS)—grid equivalent resistance and inductance, respectively.
Energies 17 00080 g001
Figure 2. (a) Parameters of the electrical grid supplying the laboratory set up; (b) electrical grid equivalent circuit. Sec—secondary; Pri—primary.
Energies 17 00080 g002
Figure 3. Bock diagram of the SAPF proposed control system.
Energies 17 00080 g003
Figure 4. Equivalent circuit of the SAPF with the representation of the voltages around the input reactor L _ inv .
Energies 17 00080 g004
Figure 5. Example of the inverter DC voltage waveforms.
Energies 17 00080 g005
Figure 6. Waveforms of PCC voltage and spectrum before the SAPF connection.
Energies 17 00080 g006
Figure 7. Waveforms of the grid current with their spectrums before the SAPF connection.
Energies 17 00080 g007
Figure 8. Reference currents at the output of control loop (2) before the SAPF connection: (a,c,e)—reference current waveforms (without the current component related to the real power ( i a _ ( p ¯ ) )) in a-b-c coordinates with their spectrums (b,d,f), respectively. One-phase representation of reference current components: (g)—current related to the real power, (h)—current related to the imaginary power, (i)—asymmetry current, (j)—harmonics current with (k)—its spectrum. (l)—current obtained after adding all the current waveform components (gj).
Energies 17 00080 g008
Figure 9. Waveforms of the PCC voltage and grid current after the SAPF connection: (a) for L _ inv _ min ; (b) for L _ inv _ max .
Energies 17 00080 g009
Figure 10. Waveforms of the SAPF current: (a) for L _ inv _ min ; (b) for L _ inv _ max .
Energies 17 00080 g010
Figure 11. Example of waveform comparison between the reference and compensating currents of control loop (3) (Figure 3): (a) for L _ inv _ min ; (b) for L _ inv _ max .
Energies 17 00080 g011
Figure 12. (a,b) example of the error waveforms at the input of PI controller (control loop (3)); (c) DC link voltage.
Energies 17 00080 g012
Figure 13. SAPF performance efficiency in terms of characteristic harmonics mitigation at the grid side (for L _ inv _ min and L _ inv _ max ).
Energies 17 00080 g013
Figure 14. Spectrum of the input rectifier current ( I T , inverter current ( I i n v ) and grid current ( I S ) for L _ i n v   equal to 1.4 mH.
Energies 17 00080 g014
Figure 15. Equivalent circuit of the simulated power system.
Energies 17 00080 g015
Figure 16. Waveforms of PCC voltage and current for different value of the thyristor-bridge input reactor inductance: (a) L _ inv _ min > L T , (b) L _ inv _ min = L T , (c) L _ inv _ min < L T .
Energies 17 00080 g016
Figure 17. Waveform comparisons between the reference and compensating current of control loop (3): (a) L _ inv _ min > L T , (b) L _ inv _ min = L T , (c) L _ inv _ min < L T .
Energies 17 00080 g017
Figure 18. SAPF performance efficiency in terms of characteristic harmonics mitigation at the grid side (for L _ inv _ min > L T , L _ inv _ min = L T , L _ inv _ min < L T ).
Energies 17 00080 g018
Figure 19. (ac) example of the error waveforms at the input of PI controller (control loop (3)), (d) inverter DC capacitor voltage.
Energies 17 00080 g019
Figure 20. Capacitor DC voltage waveforms for different capacitance: transient state observation after the thyristor-bridge DC resistance change (RDC).
Energies 17 00080 g020
Figure 21. Laboratory set-up.
Energies 17 00080 g021
Figure 22. Equivalent circuit of the laboratory set-up with components.
Energies 17 00080 g022
Figure 23. Measured PCC voltage before the load and SAPF connection: (a) waveforms; (b) spectrum.
Energies 17 00080 g023
Figure 24. Laboratory model of three-leg four-wire SAPF.
Energies 17 00080 g024
Figure 25. Measured grid voltage and current waveforms with spectrums before the SAPF connection ( L T is not connected).
Energies 17 00080 g025
Figure 26. Comparison of grid voltage ( U s ) and current ( I S ) and SAPF current ( L _ i n v ) waveforms: (a) L T is not connected, (b) L T = L _ i n v = 2 mH and (c) L _ i n v =2 mH < L T =2.5 mH. The circle on the grid current waveforms ( I S ) represents the ripples at the commutation notches.
Energies 17 00080 g026
Figure 27. Comparison of: (a) PCC voltage spectrums, (b) PCC current spectrums and (c) PCC voltage and current THD, active ( P 1 ) and reactive powers ( Q 1 ).
Energies 17 00080 g027
Table 1. Computed SAPF parameters.
Δ U L _ inv
[V]
I a _ ( ref )
[A]
I b _ ( ref )
[A]
I c _ ( ref )
[A]
L _ i n v _ m i n
[mH]
L _ i n v _ m a x
[mH]
k DC U S _ p - p
[V]
U DC _ inv _ 0
[V]
Δ W DC _ inv
[J]
Δ U DC _ inv
[V]
C _ inv
[F]
34.469.387.341.4-1.324007501153
164.469.387.34-7.2
Table 2. PI controller parameters.
kpki
Control loop (1)40,00043.75
Control loop (3)2500.0001
Table 3. Grid voltage and current parameters before the SAPF connection.
THDUS (%)THDIS (%)QS(1) (Var)PS(1) (W)SS(1) (VA)kasym
(%)
L10.2528.07414.082838.42868.533.25
L20.2523.411954.52833.13441.9
L30.2542.071181.81507.21915.2
Us1(1) = 230.8 ej30°Is1(1) = 12.43 ej21.7°
Us2(1) = 230.7 ej270°Is2(1) = 14.92 ej235.4°
Us3(1) = 230.7 ej150°Is3(1) = 8.29 ej111.90°
Table 4. Grid voltage and current parameters after the SAPF connection.
L_inv_min = 1.4 (mH)L_inv_max = 7.2 (mH)
THDUS (%)THDIS (%)kasym
(%)
THDUS (%)THDIs (%)kasym
(%)
L10.1810.340.590.2526.70.75
L20.1910.990.2527.92
L30.1810.930.2527.7
Us1(1) = 230.8 ej30°Is1(1) = 10.45 ej28.9°Us1(1) = 230.80 ej30°Is1(1) = 10.36 ej27.8°
Us2(1) = 230.8 ej270°Is2(1) = 10.99 ej268.7°Us2(1) = 230.80 ej270°Is2(1) = 10.48 ej267.7°
Us3(1) = 230.8 ej150°Is3(1) = 10.93 ej149.1°Us3(1) = 230.80 ej150°Is3(1) = 10.4 ej147.2°
Table 5. PCC voltage and grid current TTHD.
After the SAPF Connection
L_inv_min = 1.4 (mH)L_inv_max = 7.2 (mH)
TTHDUS (%)TTHDIS
(%)
TTHDUS (%)TTHDIS
(%)
L13.5716.311.7027.09
L22.9316.191.5027.59
L33.6016.202.1327.89
Table 6. Active, reactive and apparent powers at the PCC, load and SAPF for the minimum and maximum input inverter reactor inductance.
(L_inv_min = 1.4 (mH))(L_inv_max = 7.2 (mH))
PCCLoadSAPFPCCLoadSAPF
P(1) [W]L12411.42838.8427.402389.32838.8449.82
L22535.82837.9438.192416.82837.9421.33
L32522.31505.7−890.352397.51505.7−891.61
Q(1) [Var]L146.30414.13370.2291.78414.13323.23
L257.541950.4189897.071950.41854.5
L339.621180.61143.7117.251180.61062.6
S(1) [VA]L12411.92868.8565.462391.12868.8553.92
L22536.53443.519482418.83443.51.901.8
L32522.61913.31449.42400.31913.31387.1
IT1(1) = 12.43 ej21.7°I_inv1(1) = 2.45 ej−10.9°IT1(1) = 12.43 ej21.7°I_inv1(1) = 2.40 ej−5.7°
IT2(1) = 14.92 ej235.5°I_inv2(1) = 8.44 ej193.0°IT2(1) = 14.92 ej235.5°I_inv2(1) = 8.24 ej192.8°
IT3(1) = 8.29 ej111.9°I_inv3(1) = 6.28 ej22.1°IT3(1) = 8.29 ej111.9°I_inv3(1) = 6.01 ej20°
Table 7. Grid voltage and current fundamental harmonics before and after the SAPF connection.
Before the SAPF
Connection
LT = 1 nH
After the SAPF Connection
L_in_min > LTL_inv_min = LTL_inv_min < LT
US(1) (V)IS(1) (A)US(1) (V)IS(1) (A)US(1) (V)IS(1) (A)US(1) (V)IS(1) (A)
RMSPhaseRMSPhaseRMSPhaseRMSPhaseRMSPhaseRMSPhaseRMSPhaseRMSPhase
L1230.830°12.4321.7°230.830°10.4129.4°230.830°10.2929.4°230.8 30°10.14 29.5°
L2230.7270°14.92235.4°230.7270° 10.4269.2°230.7270° 10.3269.3°230.8270°10.14269.3°
L3230.7150°8.29111.90°230.7150°10.37149.3°230.7150° 10.28149.3°230.8150°10.11149.4°
Table 8. Grid voltage and current THD as well as reactive and active power before and after the SAPF connection.
Before the SAPF Connection After the SAPF Connection
LT = 1 nHL_inv_min > LT
THDUS (%)THDIS (%)QS(1) (Var)PS(1) (W)kasym (%) THDUS (%)THDIS (%)QS(1) (Var)PS(1) (W)kasym (%)
L10.2528.07414.082838.433.250.158.7725.152402.50.30
L20.2523.411954.52833.10.158.7533.512400.1
L30.2542.071181.81507.20.158.7729.242393.2
After the SAPF Connection
L_inv_min = LTL_inv_min < LT
THUS (%)THDIS (%)QS(1) (Var)PS(1) (W)kasym (%)THDUS (%)THDIS (%)QS(1) (Var)PS(1) (W)kasym (%)
L10.042.4724.862374.80.300.021.2220.422340.20.20
L20.052.9129.042377.10.021.4928.592340.1
L30.052.7928.982372.40.021.2224.432333.3
Table 9. PCC voltage and grid current TTHD for different value of thyristor-bridge input reactor inductance.
After the SAPF Connection
L_inv_min > LTL_inv_min = LTL_inv_min < LT
TTHDUS
(%)
TTHDIS
(%)
TTHDUS (%)TTHDIS
(%)
TTHDUS (%)TTHDIS
(%)
L13.1212.603.187.163.306.59
L22.7713.772.858.082.926.82
L33.1213.403.237.203.296.11
Disclaimer/Publisher’s Note: The statements, opinions and data contained in all publications are solely those of the individual author(s) and contributor(s) and not of MDPI and/or the editor(s). MDPI and/or the editor(s) disclaim responsibility for any injury to people or property resulting from any ideas, methods, instructions or products referred to in the content.