Abstract
The thermal interaction between cooling facilities and the ground is most often discussed in terms of the appropriate insulation of building partitions. Unfortunately, there is little information about the potential of using ground thermal accumulation to support the shaping of the microclimate in cooling facilities by embedding them in the ground. This problem is particularly important in the context of striving to reduce the energy demand of buildings. The article discusses a new scientific problem related to the effect of vegetable cold storage floors being recessed into the ground on the surrounding land’s impact range and on its energy management. Validation of the numerical model was performed based on actual year-round field surveys. These surveys were conducted in a free-standing vegetable cold storage facility located in southern Poland. The results of the study allowed us to determine the contribution of the land to the energy balance of the cold storage. A floor recessed into the ground doubled the ground’s contribution to the energy balance. The most important research results showed that the range of thermal impact on the surrounding ground also increased by 2.0 m more than that of a building with the floor located at ground level. An evaluation of the heat flow between the cold storage and the ground in the cases analyzed was also carried out. The analysis of the ground heat exchange balance on an annual basis showed high energy gains of 2055 kWh. The total energy demand for cooling was 1723 kWh, while it was 1204 kWh for heating. The results of the analysis of the heat exchange intensity between the indoor air and the ground showed that the ground contribution accounted for 16.6% of the total energy balance of the cold storage. The highest energy gains from the ground were found in October and amounted to 478 kWh. Due to the summer shutdown, there was an intense heat flow to the ground in July, which amounted to 588 kWh.
1. Introduction
Agricultural refrigeration is designed to extend the shelf life of products, preserve their quality and prevent microorganism growth, which is particularly important for perishable foods [1,2,3]. Refrigeration facilities are buildings equipped with a cooling system that maintains a low temperature, as recommended for the type of products that are stored in them. They can be used to store fruits, vegetables, meat, fish and other food products. Cold storages are often divided into different sections with different temperatures to accommodate specific types of products [4,5]. In some cases, farmers may use field cooling, such as refrigerated tents or portable coolers, to maintain an appropriate temperature at the site where produce is harvested or sold [6,7]. Refrigeration facilities are important in agriculture, because they help minimize food losses, maintain product quality and enable fresh produce to reach consumers for longer periods of time. They also enable farmers to manage inventory and better adapt to changing market conditions [8].
The ventilation of refrigerated vegetable stores plays a key role in maintaining proper storage conditions that preserve the freshness and quality of vegetables. Therefore, it is important that the ventilation system is properly designed and maintained to meet these requirements. Ventilation is important in terms of dissipating excess heat, removing moisture, distributing cold air inside the cold room, controlling CO2 and O2 concentrations and removing ethylene when storing certain fruits and vegetables [9,10,11]. In the case of agricultural cold stores without a controlled atmosphere, it is difficult to ensure adequate microclimate conditions in refrigeration chambers. In addition, refrigeration facilities operating on farms very often do not have sufficient thermal insulation of the partitions, which translates into increased energy intensity of this building type. From an energy point of view, recessing a cooling facility into the ground, or even its elevation above the ground surface, can have a significant impact on the land’s contribution to the total energy balance [12,13].
Current research in the field of building energy and heat transfer through the ground uses advanced numerical models [14,15,16]. Nevertheless, the installation of such devices significantly alters the course of heat flow in the ground [17,18]. Approximately 50% of the energy through external partitions occurs in buildings with active heating and cooling systems [19,20]. Computer simulations are currently very often used when conducting research in building physics. Building energy models are now indispensable both at the building design stage and during their operation. The results of computer simulations can be used, e.g., to specify information about a building’s energy performance, heat flow directions and indoor microclimate characteristics. Computer analyses are based on complex numerical models that can be used to optimize strategies for the use of facilities, according to specific objectives [21]. Striving to optimize the way a building is operated, as well as accurately recognizing its energy performance, is crucial not only from an economic perspective, but also from an environmental one. It should be noted here that the operation of buildings equipped with active heating and cooling systems accounts for 40% of CO2 emissions into the environment. Conducting research in this area is therefore justified, especially in light of the fight against climate change [22].
The paper attempted to answer the scientific problem concerning the effect of a vegetable cold storage floor being recessed into the ground on the surrounding land’s impact range and on its energy management. A detailed verification of the uncertainty indicators was carried out, based on which, the suitability of the model for further research and analysis was assessed. The novelty of our research is the determination of the impact of a recessed cooling facility on the thermal impact on the surrounding ground. In general, the phenomenon of heat exchange with the ground is a phenomenon discussed and popular in the international literature. In this context, there is currently no clear information about the range of thermal impact of objects of this type, in such specific floor location solutions, in relation to the ground level. The topic turned out to be particularly interesting for us after conducting an analysis in selected rural areas in Poland. During this analysis, it was found that approximately 70% of buildings used for storing crops on small farms are home-based, underground storage facilities.
2. Materials and Methods
2.1. Research Object
The study was conducted at a cold storage facility located in the southern part of Poland. The studied facility has a room layout with a sorting and packing room located at the head of a row of two cold storage chambers. The building has a steel frame structure, set on a 30 cm wide concrete foundation, founded at a depth of 1.0 m below ground level. The fact that the foundations are not thermally insulated is important in terms of ground heat exchange. The floors of the chambers are made of 10 cm thick cement screed and have 4 cm thick thermal insulation made of hardened polystyrene. The organoleptic examination of the soil showed that there is a 40 cm layer of humus in the surroundings of the cold storage, with clay loam deposited underneath, with a thickness of 1.5 m. The external walls and ceiling of the chambers are finished with sandwich panels, made of steel sheets, galvanized and painted on both sides, along with a 15 cm thick polystyrene core. Polyurethane foam was used to eliminate thermal bridges at the joints of the cladding panels. The tested building was uncovered (no shading). There were no other buildings located in its vicinity that could cause interference in the measurement results. As a result of the conducted research, no groundwater was found at a depth of 3.0 m below the ground surface.
2.2. Measuring Equipment
The study included a year-long survey of indoor and outdoor air temperatures, as well as floor and ground temperatures. Field measurements were taken in five vertical survey sections, directly below the floor and ground surface, and at depths of 0.50 m, 1.00 m and 1.50 m below the floor and ground surface (Figure 1).
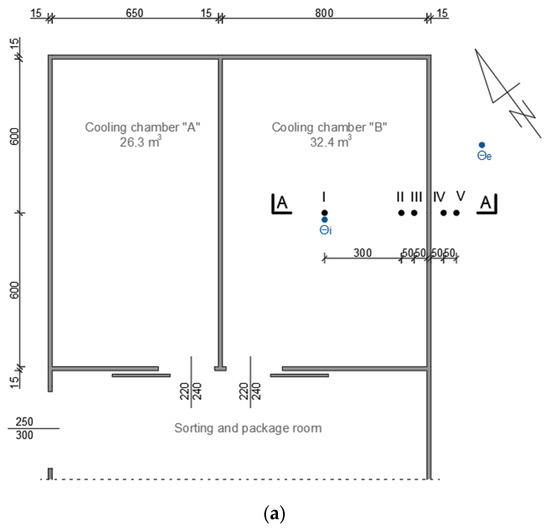
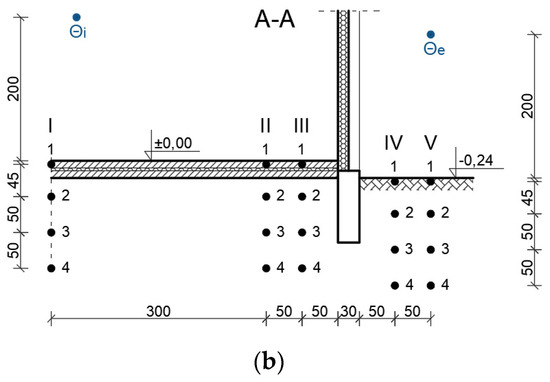
Figure 1.
Distribution of measurement points in the studied object: plan (a), cross-section (b); I, II, III, IV and V—measurement pipe and points (black spots); Өi—interior temperature, Өe—interior temperature (blue spots).
The study was conducted between 5 May 2020 and 4 May 2021. The cooling cycle in the studied facility was 8 months long (from 20 October to 30 June). The study used PT-100 sensors (measurement resolution of 0.1 °C, measurement error of 0.1 °C), connected to an HP 34970A recorder. A measurement interval of every 60 min was adopted.
2.3. Calculation Methods and Tools
The building’s geometry was modified in order to study the extent of the studied building’s impact on the surrounding soil and to assess its energy balance when the floor was located at a certain recessing depth. The location of the cold storage floor was assumed to be 0.75 m below ground level. Material and construction solutions were left unchanged (Table 1).

Table 1.
Physical parameters of the soil and materials of the cold storage partitions used in the calculations.
The obtained results of the field tests were implemented to carry out the validation of the numerical model, using the elementary balance method (EBM). The EBM is a universal numerical method in which calculations are carried out after extracting the so-called balance-difference elements (Figure 2).
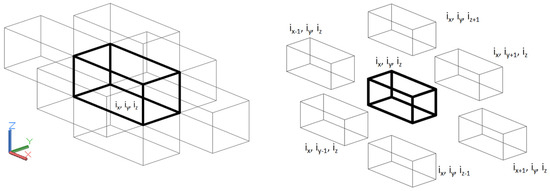
Figure 2.
Balance-difference element together with its neighboring elements.
The EBM enables accurate numerical analyses to solve tasks involving a variety of material structures, phase transformations, radiation, chemical reactions. The idea of the EBM is to divide a complex area into orthogonal balance-difference elements. For each element, it is possible to calculate the increase in internal energy, which depends on the temperature change [23], as shown in Formulas (1) and (2), where ΔQ—increase in internal energy of the element (J); C—total heat capacity of the element (J·K−1); Δθ—element temperature increase (K).
ΔQ = C · Δθ
C = v · c · ρ
Energy and temperature balance calculations are carried out assuming a time step for each balance-difference element in Formula (3), where Δτ—time step (s); Φixiyiz,…—heat flux flowing between element ix and iy and iz and neighboring elements (W).
ΔQ = Δτ⋅(Φ ixiyiz,ix+1iyiz + Φ ixiyiz,ix−1iyiz + Φ ixiyiz,ixiyiz+1 + Φ ixiyiz,ixiyiz-1 + Φ ixiyiz,ixiy+1iz + Φ ixiyiz,ixiy−1iz)
The computational analysis also included the heat flux density calculated based on Fourier’s law in Formula (4), where —heat flux density (heat flow density) (W·m−2); λ—thermal conductivity coefficient of the element material (W·m−1·K−1); ∇—Hamilton’s vector operator; —temperature gradient (K·m−1).
If the heat flow through the differential-balance element is stationary, the heat balance ΔQ = 0. In the case of non-stationary heat flow, it is necessary to take the increase in temperature with the phenomenon of heat gain into account in Formula (5), where ΣΦ—the sum of heat flows between individual elements (J); θk+1—temperature at time step k+1 (K); θk—temperature at time step k (K).
ΔQ = Δτ ∑Φ = C (θk+1 − θk)
Model validation was carried out using WUFI®Plus (ver. 3.2.0.48, Holzkirchen, Germany) specialty computer software. WUFI® Plus is a complete heat and moisture simulation tool. In addition to simulating hygrothermal conditions in building components, WUFI® Plus simulates the indoor environment and is therefore suitable for addressing comfort and energy consumption in buildings. Since simulations are based on user-specified climates and on user-defined ventilation, HVAC and internal loads, the simulations can accurately represent the situation at hand. The simulation of the interaction between building usage and system technology allows for the integral assessment of indoor climate, hygienic conditions, thermal comfort, indoor air quality and damage to components as a function of heating and cooling loads and the necessary effort to humidify/dehumidify. Integrated modules for dynamic analysis of 3-D bodies (e.g., thermal bridges) and for air exchange between conditioned zones and the outside further expand the capabilities of WUFI® Plus. The evaluation of the correct computational model calibration was performed based on the hourly criteria of FEMP 3.0, ASHRAE G14-2014 and IPMVP (Table 2). Uncertainty indices were used in the form of normalized mean bias error (NMBE) and the coefficient of variation of the root mean square error (CV (RMSE)) [24,25]. The correlation of real data and simulation results was also verified. The CV index (RMSE) was verified based on Formula (6), where CV(RMSE)—coefficient of variation of the root mean square error; mi—measured parameter; si—calculated parameter; n—number of measured data.
Table 2.
Criteria of FEMP 3.0, ASHRAE G14-2014 and IPMVP.
The NMBE index was determined using Formula (7), where NMBE—normalized mean bias error.
After the computational model validation process, the theoretical geometrical model of the studied cold storage was expanded, in which 7 measurement vertical sections (VI–XII) were added, allowing us to study the extent of the building’s impact over a 10 m wide strip of land (Figure 3).
Figure 3.
Distribution of measurement points in the theoretical object, subjected to numerical analysis: projection (a), cross-section (b). I, II, III, IV, V, VI, VII, VIII, IX, X, XI and XII—measurement pipe and points (green spots); Өi—interior temperature, Өe—interior temperature (blue spots).
Both the validation simulations and the subsequent calculations started by defining a uniform initial temperature for all 3D object elements. Thus, in order to obtain the right initial conditions in the ground, calculations were started 6 months in advance, and the results were considered only after 6 months of initial simulations. This approach allowed some model “training” with regard to real conditions and aligned the values of ground and partition temperatures with real data. To simulate the extent of the cold storage’s impact on the surrounding land, a climate representative of Krakow (TRY) was used, indicating the annual repeatability of the external and, consequently, internal climate (Figure 4).
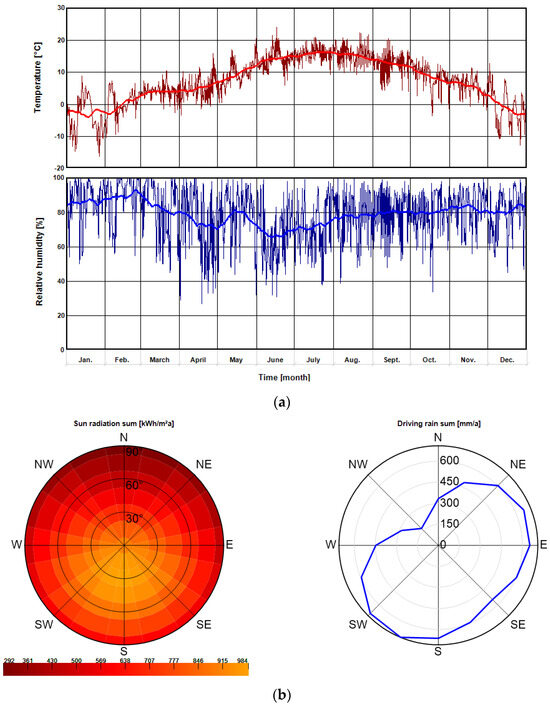
Figure 4.
Characteristics of a typical meteorological year (TMY) used in the numerical analysis: air temperature and humidity (a) and solar radiation intensity and annual precipitation (b).
3. Results
3.1. Validation of the Computational Model
The validation of the computational model was performed based on temperatures measured inside and outside the cold storage facility (Figure 5). With respect to ground temperature, it represented a Type III boundary condition. An initial ground temperature of 8.8 °C, which corresponds to the mean annual outdoor air temperature for Krakow (TRY), was also assumed. The cooling cycle in the studied facility was 8 months long (from October 20 to June 30). During that time, the temperature inside the facility was maintained between 0 °C and 4 °C. During the shutdown (from July 1 to October 19), the refrigeration system was turned off.
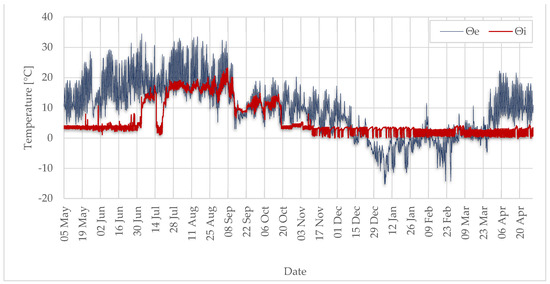
Figure 5.
The course of outdoor air temperature (Θe) and indoor air temperature (Θi).
A correlation analysis was performed for the simulation results and measurements obtained from all measurement points, based on Spearman’s rank test (the data did not have a normal distribution). The results for selected measured and theoretical points are shown graphically (Figure 6). The highest value of the correlation coefficient (0.95–0.99) was found for points V-2, V-3, V-4, IV-2, IV-3, IV-4, III-2, III-3, III-4, II-2, II-3 and II-4, as well as I-2, I-3 and I-4. Thus, it can be concluded that at depths of 0.50 m, 1.00 m and 1.50 m, there was a complete match between the measured and calculated data. For points V-1 and IV-1, located 0.05 m below the ground surface, and I-1, II-1 and III-1, located below the floor surface, the value of the correlation coefficient was in the range of 0.85–0.88. The match between the measured and calculated data at these points should be considered very high.
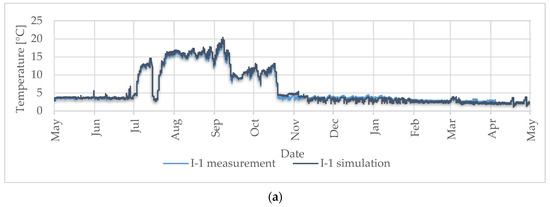
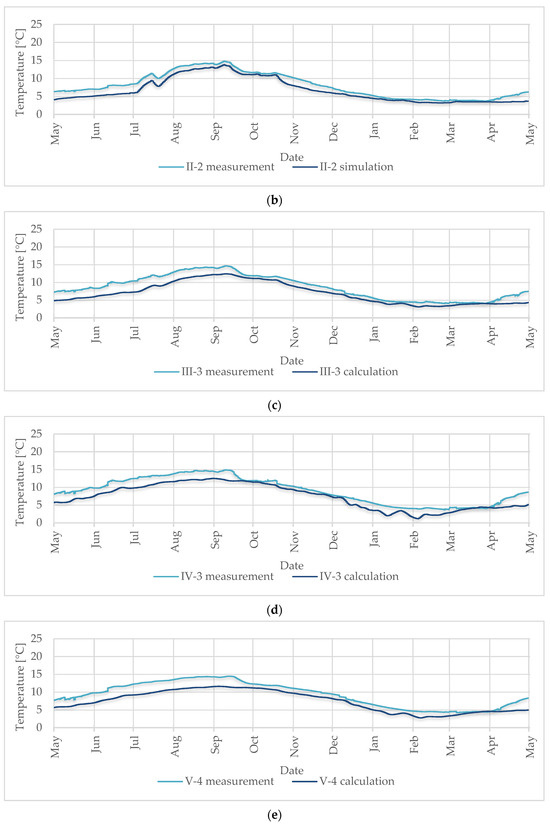
Figure 6.
The course of the measured and calculated temperature: (a) at measurement point I, (b) at measurement point II, (c) at measurement point III, (d) at measurement point IV, (e) at measurement point V.
3.2. Verification of the Calculation Model
The verification of the validation and calibration of the computational model showed high convergence between the actual and theoretical data (Figure 7). A maximum error of 6.5% was specified for all measurement points (monitors), with a mean value of 4.1%. The best match between the actual and theoretical data was found for point I-1, which represents floor temperature (2.1%). The data obtained allowed a positive reliability assessment of the theoretical data obtained. The CV rate (RMSE) was met in terms of the FEMP 3.0, ASHRAE G14-2014 and IPMVP criteria. The NMBE indicator was met in terms of the FEMP 3.0 and ASHRAE G14-2014 criteria. For the IPMVP criterion, there were slightly exceeded limit values (up to 1.5%) recorded at points IV-1 and V-1. This was found to be due to a certain limitation of the numerical model, which is the inability to take the variability in the snow cover around the building into account under non-stationary conditions.
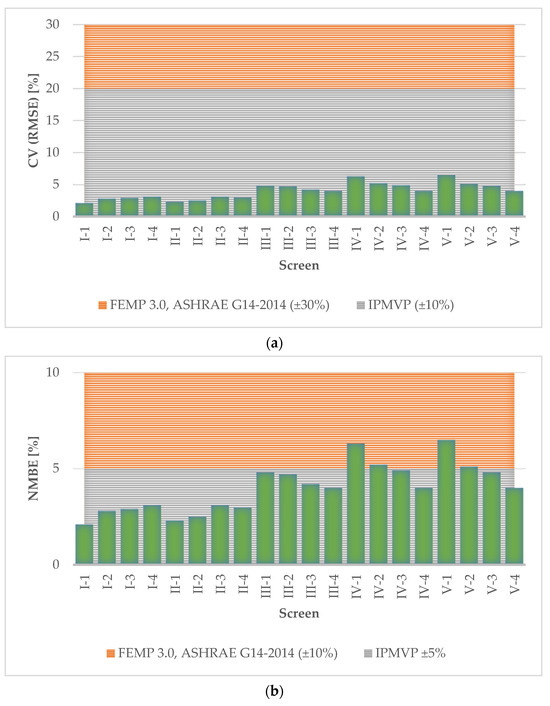
Figure 7.
Verification of the computational model validation with respect to the CV(RMSE) uncertainty index (a) and NMBE (b), based on FEMP 3.0, ASHRAE G14-2014 and IPMVP criteria.
3.3. Heat Exchange with the Ground and Energy Balance of Cold Storage Facilities—Existing Condition
Among other things, the performed numerical analysis allowed us to determine the formation of heat exchange with the ground and the energy balance of the studied cold storage. In the existing state, the total energy demand for building cooling was 5141 kWh, while for heating purposes, it was 527 kWh (Figure 8).
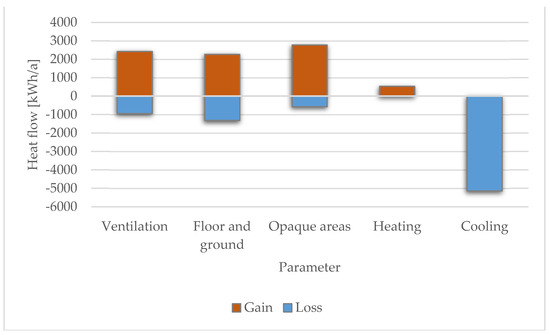
Figure 8.
Energy balance and heat flows through the partitions, floor and ground, as well as the cooling system (cooling and heating)—existing condition.
The results of the analysis of the heat exchange intensity between the indoor air and the ground showed that the ground contribution accounted for 16.6% of the total energy balance of the cold storage. The highest energy gains from the ground were found in October and amounted to 478 kWh. Due to the summer shutdown, there was an intense heat flow to the ground in July, which amounted to 588 kWh (Figure 9). The simulation results showed that the duration of the cooling period, during which, the refrigeration unit was required to lower the indoor air temperature, was 155 days, while the period during which the air had to be heated was 27 days.
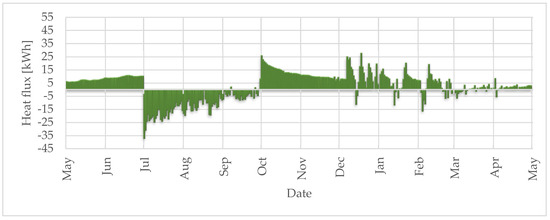
Figure 9.
Heat exchange between the studied vegetable cold storage and the ground—the existing condition.
3.4. Heat Exchange with the Ground and Energy Balance of Cold Storage—Theoretical Variant with Floor Recessed into the Ground
The results of the numerical analysis of the cold store, with the floor recessed into the ground, showed an increase in the contribution of the ground to the energy balance of the cold store, compared to the existing state. On an annual basis, the land’s share of the energy balance in this case was 33%. The highest value of heat gains occurred in October, at 892 kWh (Figure 10).
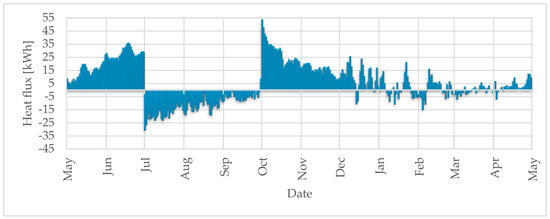
Figure 10.
Heat exchange between the studied vegetable cold storage facility and the ground—a cold storage facility with floor recessed into the ground.
Analysis of the ground heat exchange balance on an annual basis showed high energy gains of 2055 kWh. The total energy demand for cooling was 1723 kWh, while it was 1204 kWh for heating (Figure 11).
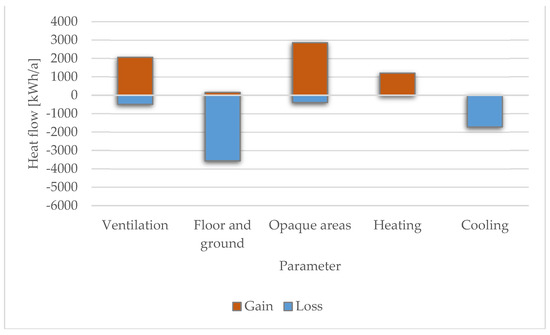
Figure 11.
Energy balance and heat flows through the partitions, floor and ground and the cooling system (cooling and heating—cold storage with floor recessed into the ground.
The length of the cooling period during which active cooling system operation was necessary was 148 days, while indoor air reheating was necessary for 24 days. Analysis of the extent of thermal impact with regard to the surrounding ground is presented graphically (Figure 12) for four representative days: May 2, September 2, November 2 and February 2.
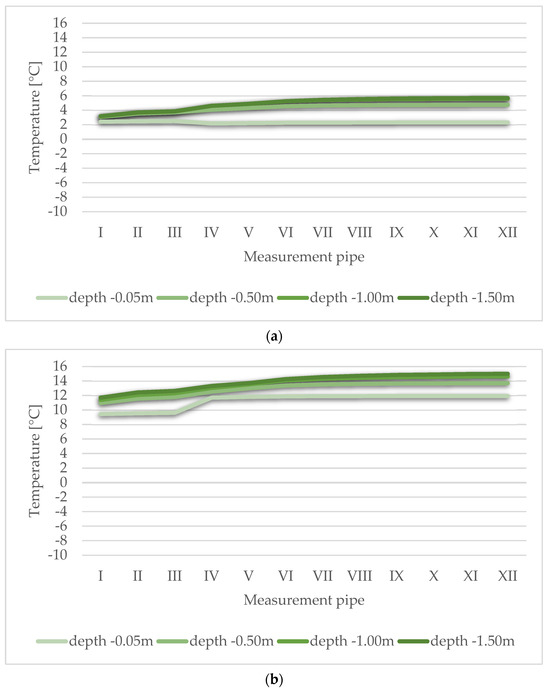
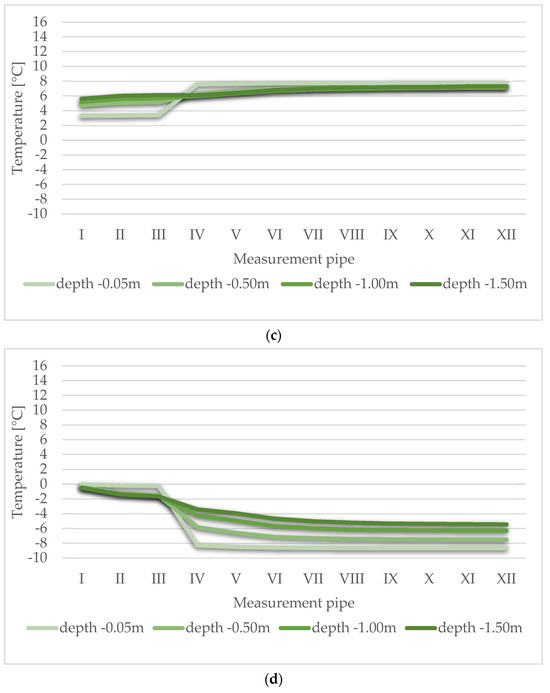
Figure 12.
The extent of the impact of a cold store with a recessed floor on the surrounding ground: (a) May 2, (b) September 2, (c) November 2, (d) February 2.
For each of the transitional periods analyzed (spring and autumn), it was found that the extent of cold storage’s impact on the surrounding ground did not exceed 4.0 m. In the winter period (February 2), it was possible to observe a drop in the temperature of the ground lying under the floor below 0.0 °C. Thus, the cooled floor and the ground under the cold storage in the autumn period may contribute to its freezing in the winter. In winter, there was an increased impact of cold storage with recessed floor on the surrounding ground compared to the fall and spring periods. In February, the range was found over a 6.0 m section at a depth of −1.50 m.
4. Discussion
Heat exchange with the ground and energy balance of agricultural buildings are important aspects. Proper understanding of the phenomena occurring in the building–soil system and the optimization of materials as well as construction solutions can affect the energy efficiency of a building and the condition of the surrounding environment. Depending on the specific case, various measures can be taken to minimize energy losses to the ground, particularly in the form of improving the thermal insulation of the zero state [26]. In small refrigeration facilities, very often with no adequate thermal insulation of the floor and foundations, it is necessary to consider the possibility of using the ground as a medium for stabilizing thermal conditions and a kind of cold accumulator [2,3]. The current state of knowledge shows that the contribution of land to the total energy balance of residential and industrial facilities is about 5–10% [27]. As a result of the study, it was possible to show that having the refrigeration facility floor recessed into the ground can contribute a very high proportion (33%) of the ground with regard to the overall energy balance. It should be noted here that this share could be significantly higher if a building with a year-round refrigeration cycle were analyzed. It is also extremely important to consider the effect of the thermal insulation use of the zero state on reducing the contribution of the ground to the energy economy of the studied facility [28]. The expected effect will be a significant reduction in the land contribution to the energy balance of this building type. Compared to a refrigeration facility with a floor at ground level, recessing the floor 0.75 m below ground level contributes to a 2.0 m increase in the thermal impact range. From the refrigeration facility energy balance perspective, recessing the floor with inadequate thermal insulation contributes to almost double the value of heat gains at the beginning of the refrigeration cycle. If this is the case, one should consider running a year-round cooling cycle to prevent the heat accumulation phenomenon by the ground during the technological shutdown occurring in the summer period. In order to accurately assess the ability of the ground to reduce thermal energy and suppress daily fluctuations in indoor air temperature, numerical analyses can be carried out for a reference building, theoretically devoid of ground but equivalent in terms of heat loss. Ground thermal accumulation refers to the ability of the soil to collect and store thermal energy. This process is important in the context of many fields, such as agriculture, environmental engineering and construction [29]. The heat accumulation of the ground depends on various factors, such as the type of soil, its moisture, organic content, type of vegetation and climatic conditions. Ground heat accumulation is important in agriculture because it affects soil temperature, which in turn affects plant growth and biological processes [30]. In environmental engineering, thermal accumulation is also important in the context of designing geothermal systems or assessing environmental impact. The impact of soil thermal accumulation on a number of issues in construction, especially in rural areas, is a complex process dependent on many factors that together affect the soil’s ability to accumulate and store thermal energy. In order to obtain a more detailed understanding of the above-mentioned relationships and their impact on the construction sector, numerical modeling can be used [31]. There are many numerical building modeling programs that offer different features and are used in various engineering fields. Some of the most popular are EnergyPlus, OpenFOAM, COMSOL Multiphysics, DAYSIM, DesignBuilder and TRNSYS. These programs enable engineers, architects and researchers to model various aspects of buildings, helping to design more efficient, functional and sustainable structures. The choice of a specific tool depends on the analysis goals, project specifics and user preferences. It should be noted, however, that it is necessary to learn the characteristics of the parameters used in numerical modeling through long-term field research [32,33]. It is not always possible to take into account all factors influencing a given situation. Some subtle effects may be missed, leading to some degree of underestimation of complex phenomena. In order to facilitate calculations, numerical models often need to include simplifications. This may lead to approximations that affect the accuracy of the results [34]. Among other things, an important issue may be the calculation interval, which can be several minutes or several hours. Some phenomena occur so dynamically that it may be necessary to use very short measurement and calculation intervals.
5. Conclusions
The obtained results made it possible to determine the range of the thermal impact of the vegetable cooling plant embedded in the ground on the surrounding ground. On their basis, these studies can be expanded by analyzing, among other aspects, the optimal distance between such buildings and the surrounding infrastructure, which may be exposed to, for example, cooling of the ground in its surroundings. In addition, the model used can also be used to study the analysis of thermal interaction between buildings of this type, with various material and construction solutions, which will undoubtedly allow further conclusions to be drawn in the field of environmental engineering, ecology and energy of this type of facility. The field measurements allowed us to assess the indoor and outdoor microclimate conditions at the study site. The ground temperature in the measurement vertical sections around the studied building was highly correlated with the outside air temperature. The data obtained was used in the following step to determine the boundary conditions for model validation and calibration. A series of iterative calculations was carried out to validate the computational model as accurately as possible. The evaluation of model calibration highlighted some areas of constraint, such as periodic snow cover. Despite this limitation, the method used can be considered appropriate, due to the fulfillment of indicators and criteria for evaluating the validation of numerical models. The current state of knowledge shows that the contribution of the ground to the total energy balance of residential and industrial facilities is insignificant (5–10%) in relation to heat flow through the envelope and ventilation losses. As a result of the study, it was proven that recessing a refrigeration facility floor can lead to an increase in the energy contribution of the ground up to 33% in the overall energy balance. Compared to a refrigeration facility with a floor at ground level, recessing the floor 0.75 m below ground level contributes to a 2.0 m increase in the thermal impact range. From the refrigeration facility energy balance perspective, recessing the floor with inadequate thermal insulation contributes to almost double the value of heat gains at the beginning of the refrigeration cycle. In terms of the energy management of small agricultural cold stores, it seems necessary to expand research in terms of material and construction solution optimization for partitions, as well as the adopted technology and refrigeration system operation duration. This is a particularly important issue in the context of ever-increasing climate change. The analysis performed is of a pilot nature, but also definitely developmental, in particular in the light of the general trend aimed at minimizing energy losses while using it from the environment, such as heat or cold from the ground. The next stage of the research will be to attempt to estimate the impact of soil moisture and the presence of groundwater in the vicinity of the building on its impact on the environment. As is known, moisture in the ground and building materials significantly increases the heat conduction parameter. Therefore, it is extremely important to know these relationships for rational energy management and the spatial planning of facilities of this type.
Author Contributions
Conceptualization, T.J., G.N. and P.S.; methodology, T.J., G.N. and P.S.; software, G.N. and P.S.; validation, G.N. and P.S.; formal analysis, T.J., G.N., P.S., A.A. and S.S.; investigation, T.J. and G.N.; resources, G.N. and P.S.; data curation, T.J., G.N. and P.S.; writing—original draft preparation, T.J., G.N., P.S., A.A. and S.S.; writing—review and editing, T.J. and G.N.; visualization, T.J., G.N. and P.S.; supervision, T.J. and G.N. All authors have read and agreed to the published version of the manuscript.
Funding
This research received no external funding.
Data Availability Statement
No new data were created or analyzed in this study. Data sharing is not applicable to this article.
Conflicts of Interest
The authors declare no conflict of interest.
Nomenclature
| ΔQ | increase in internal energy of the element (J) |
| C | total heat capacity of the element (J·K−1) |
| Δθ | element temperature increase (K) |
| v | element volume (m3) |
| c | specific heat of the element material (J·kg−1·K−1) |
| ρ | material density (kg·m−3) |
| i | element number |
| Φixiyiz,… | heat flux flowing between element ix and iy and iz and neighboring elements (W) |
| heat flux density (heat flow density) (W·m−2) | |
| λ | thermal conductivity coefficient of the element material (W·m−1·K−1) |
| ∇ | Hamilton’s vector operator |
| temperature gradient (K·m−1) | |
| ΣΦ | the sum of heat flows between individual elements (J) |
| θk+1 | temperature at time step k + 1 (K) |
| θk | temperature at time step k (K) |
| Δτ | time step (s) |
| mi | measured parameter |
| n | number of measured data |
| si | calculated parameter |
| mean value of measured parameters | |
| p | number of adjustable model parameters |
| NMBE | normalized mean bias error |
| CV(RMSE) | coefficient of variation of the root mean square error |
References
- Song, M.; Mao, N.; Xu, Y.; Deng, S. Challenges in, and the development of, building energy saving techniques, illustrated with the example of an air source heat pump. Therm. Sci. Eng. Prog. 2019, 10, 337–356. [Google Scholar]
- Sher, F.; Kawai, A.; Gulec, F.; Sadiq, H. Sustainable energy saling alternatives in small buildings. Sustain. Energy Technol. Assess. 2019, 32, 92–99. [Google Scholar]
- Sokołowski, P.; Nawalany, G. Analysis of Energy Exchange with the Ground in a Two-Chamber Vegetable Cold Store, Assuming Different Lengths of Technological Break, with the Use of a Numerical Calculation Method—A Case Study. Energies 2020, 13, 4970. [Google Scholar] [CrossRef]
- Martin, S.; Canas, I. A comparison between underground wine Cellary and aboveground storage for the aging of Spanish wines. Trans. ASABE 2006, 49, 1471–1478. [Google Scholar] [CrossRef]
- Nawalany, G.; Sokolowski, P.; Herbut, P.; Angrecka, S. Development of selected parameters of microclimate in a stand alone cellar plunged into soil. J. Ecol. Eng. 2017, 18, 156–161. [Google Scholar] [CrossRef]
- Sun, D.-W.; Wang, L. Experimental investigation of performance of vacuum cooling for commercial large cooked meat joints. J. Food Eng. 2004, 61, 527–532. [Google Scholar] [CrossRef]
- Comodi, G.; Carducci, F.; Sze, J.Y.; Balamurugan, N.; Romagnoli, A. Storing energy for cooling demand management in tropical climates: A techno-economic comparison between different energy storage technologies. Energy 2017, 121, 676–694. [Google Scholar] [CrossRef]
- Mazzeo, T.; Paciulli, M.; Chiavaro, E.; Visconti, A.; Pellegrini, N. Impact of the industrial freezing process on selected vegetables—Part II. Colour and bioactive compounds. Food Res. Int. 2015, 75, 89–97. [Google Scholar] [CrossRef]
- Zhang, Z.; Sun, D.-W. Effect of cooling methods on the cooling efficiencies and qualities of cooked broccoli and carrot slices. J. Food Eng. 2006, 77, 320–326. [Google Scholar] [CrossRef]
- Phillips, K.M.; Council-Troche, M.C.A.; McGinty, R.C.; Rasor, A.S.; Tarrago-Trani, M.T. Stability of vitamin C in fruit and vegetable homogenates stored at different temperatures. J. Food Compos. Anal. 2016, 45, 147–162. [Google Scholar] [CrossRef]
- Wu, Z.S.; Zhang, M.; Wang, S. Effects of high pressure argon treatments on the quality of fresh-cut apples at cold storage. Food Control 2012, 23, 120–127. [Google Scholar] [CrossRef]
- East, A.R.; Smale, N.J.; Trujillo, F.J. Potential for energy cost savings by utilizing alternative temperature control strategies for controlled atmosphere stored apples. Int. J. Refrig. 2013, 36, 1109–1117. [Google Scholar] [CrossRef]
- Xu, Y.; Zeng, Z.; Sun, D. Experimental and numerical investigation on heat transfer characteristics of vertical ground heat exchangers in karst areas. Energy Build. 2022, 275, 112481. [Google Scholar] [CrossRef]
- Bae, S.; Nam, Y.; Lee, E.-J. Evgueniy Entchev, Feasibility study of a novel hybrid energy system combining photovoltaic-thermal and modular ground heat exchanger. J. Build. Eng. 2022, 61, 105241. [Google Scholar] [CrossRef]
- Cui, P.; Yang, W.; Zhang, W.; Zhu, K.; Spitler, J.D.; Yu, M. Advances in ground heat exchangers for space heating and cooling: Review and perspectives. Energy Built Environ. 2024, 5, 255–269. [Google Scholar] [CrossRef]
- Cui, P.; Yang, H.; Fang, Z. Numerical analysis and experimental validation of heat transfer in ground heat exchangers in alternative operation modes. Energy Build. 2008, 40, 1060–1066. [Google Scholar] [CrossRef]
- Florides, G.; Kalogirou, S. Ground heat exchangers—A review of systems, models and applications. Renew. Energy 2007, 32, 2461–2478. [Google Scholar] [CrossRef]
- DECC. DUKES—Domestic Energy Consumption in the UK 2011; DECC: London, UK, 2011. [Google Scholar]
- SDC. Stock Take Delivering Improvements in Existing Housing; Sustainable Development Commission: London, UK, 2006. [Google Scholar]
- González, V.G.; Ruiz, G.R.; Bandera, C.F. Ground characterization of building energy models. Energy Build. 2022, 254, 111565. [Google Scholar] [CrossRef]
- Abergel, T.; Dulac, J.; Hamilton, I.; Jordan, M.; Pradeep, A. Global Status Report for Buildings and Construction—Towards a Zero-Emission, Efficient and Resilient Buildings and Construction Sector; United Nations Environment Programme: Nairobi, Kenya, 2019. [Google Scholar]
- Gdula, S. Przewodzenie Ciepła; PWN: Warszawa, Poland, 1984. [Google Scholar]
- PN-EN ISO 6946:2017-10; Building Components and Building Elements—Thermal Resistance and Thermal Transmittance—Calculation Methods. ISO: Geneva, Switzerland, 2017.
- Ruiz, G.R.; Bandera, C.F. Validation of calibrated energy models: Common errors. Energies 2017, 10, 1587. [Google Scholar] [CrossRef]
- González, V.G.; Colmenares, L.Á.; Fidalgo, J.F.L.; Ruiz, G.R.; Bandera, C.F. Uncertainy’s indices assessment for calibrated energy models. Energies 2019, 12, 2096. [Google Scholar] [CrossRef]
- Sun, D.W.; Wang, L. Heat transfer characteristics of cooked meats using different cooling methods. Int. J. Refrig. 2000, 23, 508–516. [Google Scholar] [CrossRef]
- Bambara, J.; Athienitis, A.K. Energy and Economic Analysis for greenhouse Ground Insulation Design. Energies 2018, 11, 3218. [Google Scholar] [CrossRef]
- Dong, C. Heat Loss via Concrete Slab Floors in Australian Houses. Procedia Eng. 2017, 205, 108–115. [Google Scholar]
- You, T.; Yang, H. Feasibility of ground source heat pump using spiral coil energy piles with seepage for hotels in cold regions. Energy Convers. Manag. 2020, 205, 112466. [Google Scholar] [CrossRef]
- Qian, H.; Wang, Y. Modeling the interactions between the performance of ground source heat pumps and soil temperature variations. Energy Sustain. Dev. 2014, 23, 115–121. [Google Scholar] [CrossRef]
- Liu, P.; Wu, Q.; Hu, W.; Tian, K.; Huang, B.; Zhao, Y. Effects of atmospheric deposition on heavy metals accumulation in agricultural soils: Evidence from field monitoring and Pb isotope analysis. Environ. Pollut. 2023, 330, 121740. [Google Scholar] [CrossRef]
- Nawalany, G.; Sokołowski, P.; Lendelova, J.; Zitnak, M.; Jakubowski, T.; Atilgan, A. Numerical analysis of the heat exchange model with the ground on the example of a complex of industrial halls. Energy Build. 2023, 300, 113689. [Google Scholar] [CrossRef]
- Moreira, M.; Silva, T.; Dias-de-Oliveira, J.; Neto, F.; Amaral, C. Numerical modelling of radiant systems and phase change materials in building applications—A review. Appl. Therm. Eng. 2023, 234, 121342. [Google Scholar] [CrossRef]
- Andersen, J.E.T.; Moemedi, K.; Katse, K. Modeling uncertainty by the principle of pooled calibrations and issues with method validations may influence consensus in science. Measurement 2022, 188, 110382. [Google Scholar] [CrossRef]
Disclaimer/Publisher’s Note: The statements, opinions and data contained in all publications are solely those of the individual author(s) and contributor(s) and not of MDPI and/or the editor(s). MDPI and/or the editor(s) disclaim responsibility for any injury to people or property resulting from any ideas, methods, instructions or products referred to in the content. |
© 2023 by the authors. Licensee MDPI, Basel, Switzerland. This article is an open access article distributed under the terms and conditions of the Creative Commons Attribution (CC BY) license (https://creativecommons.org/licenses/by/4.0/).