Article

Piecewise Linear Power Flow Algorithm of DC Distribution Networks Considering Automatic Adjustment of VSC Control Strategy

1
DC Power Distribution and Consumption Technology Research Center, Guangdong Power Grid, Zhuhai 519099, China
2
Key Laboratory of the Ministry of Education on Smart Power Grids, Tianjin University, Tianjin 300072, China
3
State Key Laboratory of HVDC, Electric Power Research Institute, China Southern Power Grid Company Limited (CSG), Guangzhou 510663, China
*
Authors to whom correspondence should be addressed.
Energies 2024, 17(1), 41; https://doi.org/10.3390/en17010041
Submission received: 8 November 2023 / Revised: 4 December 2023 / Accepted: 7 December 2023 / Published: 21 December 2023
(This article belongs to the Special Issue High-Power Electronics in Distribution Grids)

Abstract

:
Voltage source converter (VSC)-based DC distribution networks (DCDNs) can automatically adjust the control strategy of overloaded VSCs to adapt to the variation in renewable energy power, but it brings difficulties to the steady-state performance analysis of DCDNs. This paper presents a piecewise linear power flow (PLPF) algorithm to estimate the joint effect of power disturbance and VSC control strategy adjustment on steady-state performance. Firstly, according to the VSC power balance, the critical point of the VSC hitting the capacity limit is directly determined, and the power variations in each node before VSC control strategy adjustment are obtained. Then, the linear power flow is revised considering the VSC control strategy adjustment. Inversion of the block Jacobian matrix is used to improve the calculation speed of linear power flow revision. Finally, linear power flow calculation is performed in each stage, and the steady-state performance is obtained by using the superposition method. Simulation results show that the proposed PLPF model can estimate the steady-state performance faster and more simply.

1. Introduction

The large-scale integration of renewable energy promotes the progress of high-voltage direct current (HVDC) technology based on the voltage source converter (VSC) [1,2]. The HVDC technologies have been developed through theoretical research and practical verification [3,4]. A series of HVDC projects have been commissioned to connect remote offshore wind farms and regions with large number of electricity customers [5,6].
With the rapid development of distributed photovoltaic (PV) systems as well as electric vehicle (EV) charging piles, a large number of distributed converters lead to significant power losses in distribution network [7]. The VSC-based DC distribution network (DCDN) is a promising way of supplying electricity in areas with a high penetration of PV systems and DC loads [8]. Besides reducing power losses, the advantages of DCDNs include improving power supply reliability and power quality, hosting more PVs and EVs, and so on [9]. The DCDN has become an important research direction in the field of active distribution networks.
In DC networks, the voltage level and power flow distribution are mainly controlled by the VSCs. Constant-voltage controlled VSCs and constant-power controlled VSCs keep converter voltage or converter power constant [10]. Different from the constant-voltage control and the constant-power control, the VSC voltage changes with the VSC power in a droop-controlled VSC. In droop-controlled DC networks, when the load powers or the PV powers change randomly, all the droop-controlled VSCs regulate the DC voltage and share the power imbalance simultaneously [11]. The droop control strategy shows prominent advantages of high reliability and flexibility. The impact of droop control on power flow distribution has been of great interest to researchers in recent years [12].
The steady nodal voltages, VSC powers, and line powers of the entire DC grid can be obtained via accurate power flow calculation (PFC). However, in the conditions with high requirements of calculation speed, the application of a large amount of PFC is limited. Compared with accurate PFC, linear power flow models can directly calculate the steady DC voltage/power variation, which is also the basis for voltage control, optimal operation, and online power flow analysis [13]. A series of linear DC power flow models have been presented by considering different simplified conditions. An effective power flow model is proposed for droop-controlled VSCs, where the equivalent resistance is used to represent the effect of droop control on power flow [14]. Based on the equivalent resistance model, a linear model for estimating the power flow which accounts for DC line voltage drops is presented [15]. Further, a linear sensitivity model of nodal power to voltage is proposed for droop-controlled DC grids, and a quadratic network loss correction term is applied to improve the calculation accuracy with less calculation burden [16]. Ref. [17] proposed a linear power flow calculation method for a bipolar DC distribution network, where the steady-state model of flexible equipment is established based on the Taylor expansion.
The existing linear power flow models mainly concentrate the fixed VSC control strategy. With the high proportion of renewable energies, the operation environment of the DC grid is more complex. Due to the uncertainty of renewable energies, the DC grid must cope with various contingencies, which may lead to VSC outage or overload. In this circumstance, the existing linear power flow models lose efficacy. The power flow algorithms considering the adjustment of converter operation mode have been studied to tackle these issues. An analytical method was derived to address the power sharing problem after a converter outage in a droop-controlled DC system [18]. To obtain the critical point of the VSC hitting the capacity limit, a bisection algorithm-based analytical model is proposed to analyze the steady-state performance of droop-controlled DC systems after a converter hits its limits [19]. In the existing power flow algorithm, the power variations after VSC overload require iterative calculation, which impedes the application of the power flow model in the optimal operation and control of DC systems. There is no effective way to calculate the power flow distribution with the adjustable VSC control strategy. In DCDNs, the random variation in a high penetration of PVs and EVs may easily cause the VSC to reach the capacity limit [20] so that the corresponding VSC outputs constant power with the rated value. The existing linear power flow models cannot accurately estimate the steady-state performance of DCDNs.
The main contribution of this study is to present a more straightforward piecewise linear power flow (PLPF) model that can estimate the joint effect of power disturbance and VSC control strategy adjustment on steady-state performance. The advantages of the proposed PLPF algorithm are listed as follows:
  • The critical point of the VSC hitting the capacity limit can be directly determined through one linear calculation according to the VSC power balance. Compared with the bisection algorithm, the proposed PLPF algorithm has the same computational accuracy and less calculation time;
  • The proposed PLPF algorithm is more straightforward and effective for the situation with multiple overloaded VSCs.
The rest of this paper is organized as follows: Section 2 discusses the influence of VSC control strategy adjustment on power flow distribution. Section 3 introduces the PLPF model. Section 4 discusses the simulation results. Finally, conclusions are presented in Section 5.

2. Linear Power Flow Model

2.1. Control Strategies of DCDNs

The typical control strategies of VSCs include the constant-voltage control, constant-power control, and droop control. Figure 1 shows the main control system of a VSC. For the droop-controlled VSC at node n, the relationship between the VSC voltage Un and VSC power Pn,VSC can be expressed as:
U n = U n , ref k n ( P n , VSC P n , ref )
where Un,ref and Pn,ref are the reference voltage and reference power of the VSC at node n, respectively; kn is the droop coefficient of the VSC at node n.

2.2. Generalized Power Flow Model for VSC with Different Control Strategies

As shown in Figure 2, the improved equivalent line model proposed in [21] is used to express the droop node, constant-voltage node, and constant-power node.
The parameters of the equivalent line model for different control modes are expressed in Table 1. The adjustment of the VSC control strategy can be represented by three parameters, including the voltage of the ideal source, line resistance, and equivalent nodal power. When the droop-controlled VSC hits the capacity limit and outputs constant power with the value of its capacity, the line resistance is set to infinite, and the equivalent nodal power is set to its capacity.

2.3. Linear Power Flow Model for Nodal Voltages

The power flow of DCDNs can be expressed as:
{ P i , PV P i , L + U i j = 1 h g i j U j = 0             i M L U n U n , ref k n + P n , ref + U n j = 1 h g n j U j = 0             n M D
where Pi,PV and Pi,L are the PV output power and load power of node i, respectively; gij is the admittance of the line from node i to node j; Ui and Uj are the voltage of node i and node j, respectively; h is the number of nodes; ML is the set of load nodes and MD is the set of droop nodes.
The nodal voltage variation due to the change in nodal injection power can be expressed as:
Δ U = J 1 Δ P = S Δ P
where J is the Jacobian matrix, S is the nodal voltage sensitivity matrix, ΔP represents the change in nodal injection power, and ΔU represents the change in nodal voltage.
In (3), ΔP includes the variation in equivalent nodal power, load power, and PV power.
The line power Pij of the line lij can be expressed as:
P i j = U i ( U i U j ) g i j
The line power variation due to the change in nodal injection power is:
Δ P L = G Δ U = G S Δ P = T Δ P
where ΔPL represents the change in line power, T represents the sensitivity matrix of nodal injection power to line transmission power, and G is the derivative of voltage with respect to line power in (5).
The VSC power variation ΔPVSC is equal to the sum of the power changes in all lines that are connected to the VSC, thereby considering the influence of line loss. The linear power flow model for VSC powers is:
Δ P VSC = Δ P L = W Δ P
where W represents the sensitivity matrix of nodal injection power to VSC power.

3. Piecewise Linear Power Flow Model to Represent the VSC Control Strategy Adjustment

3.1. Power Flow Analysis Considering VSC Control Strategy Adjustment

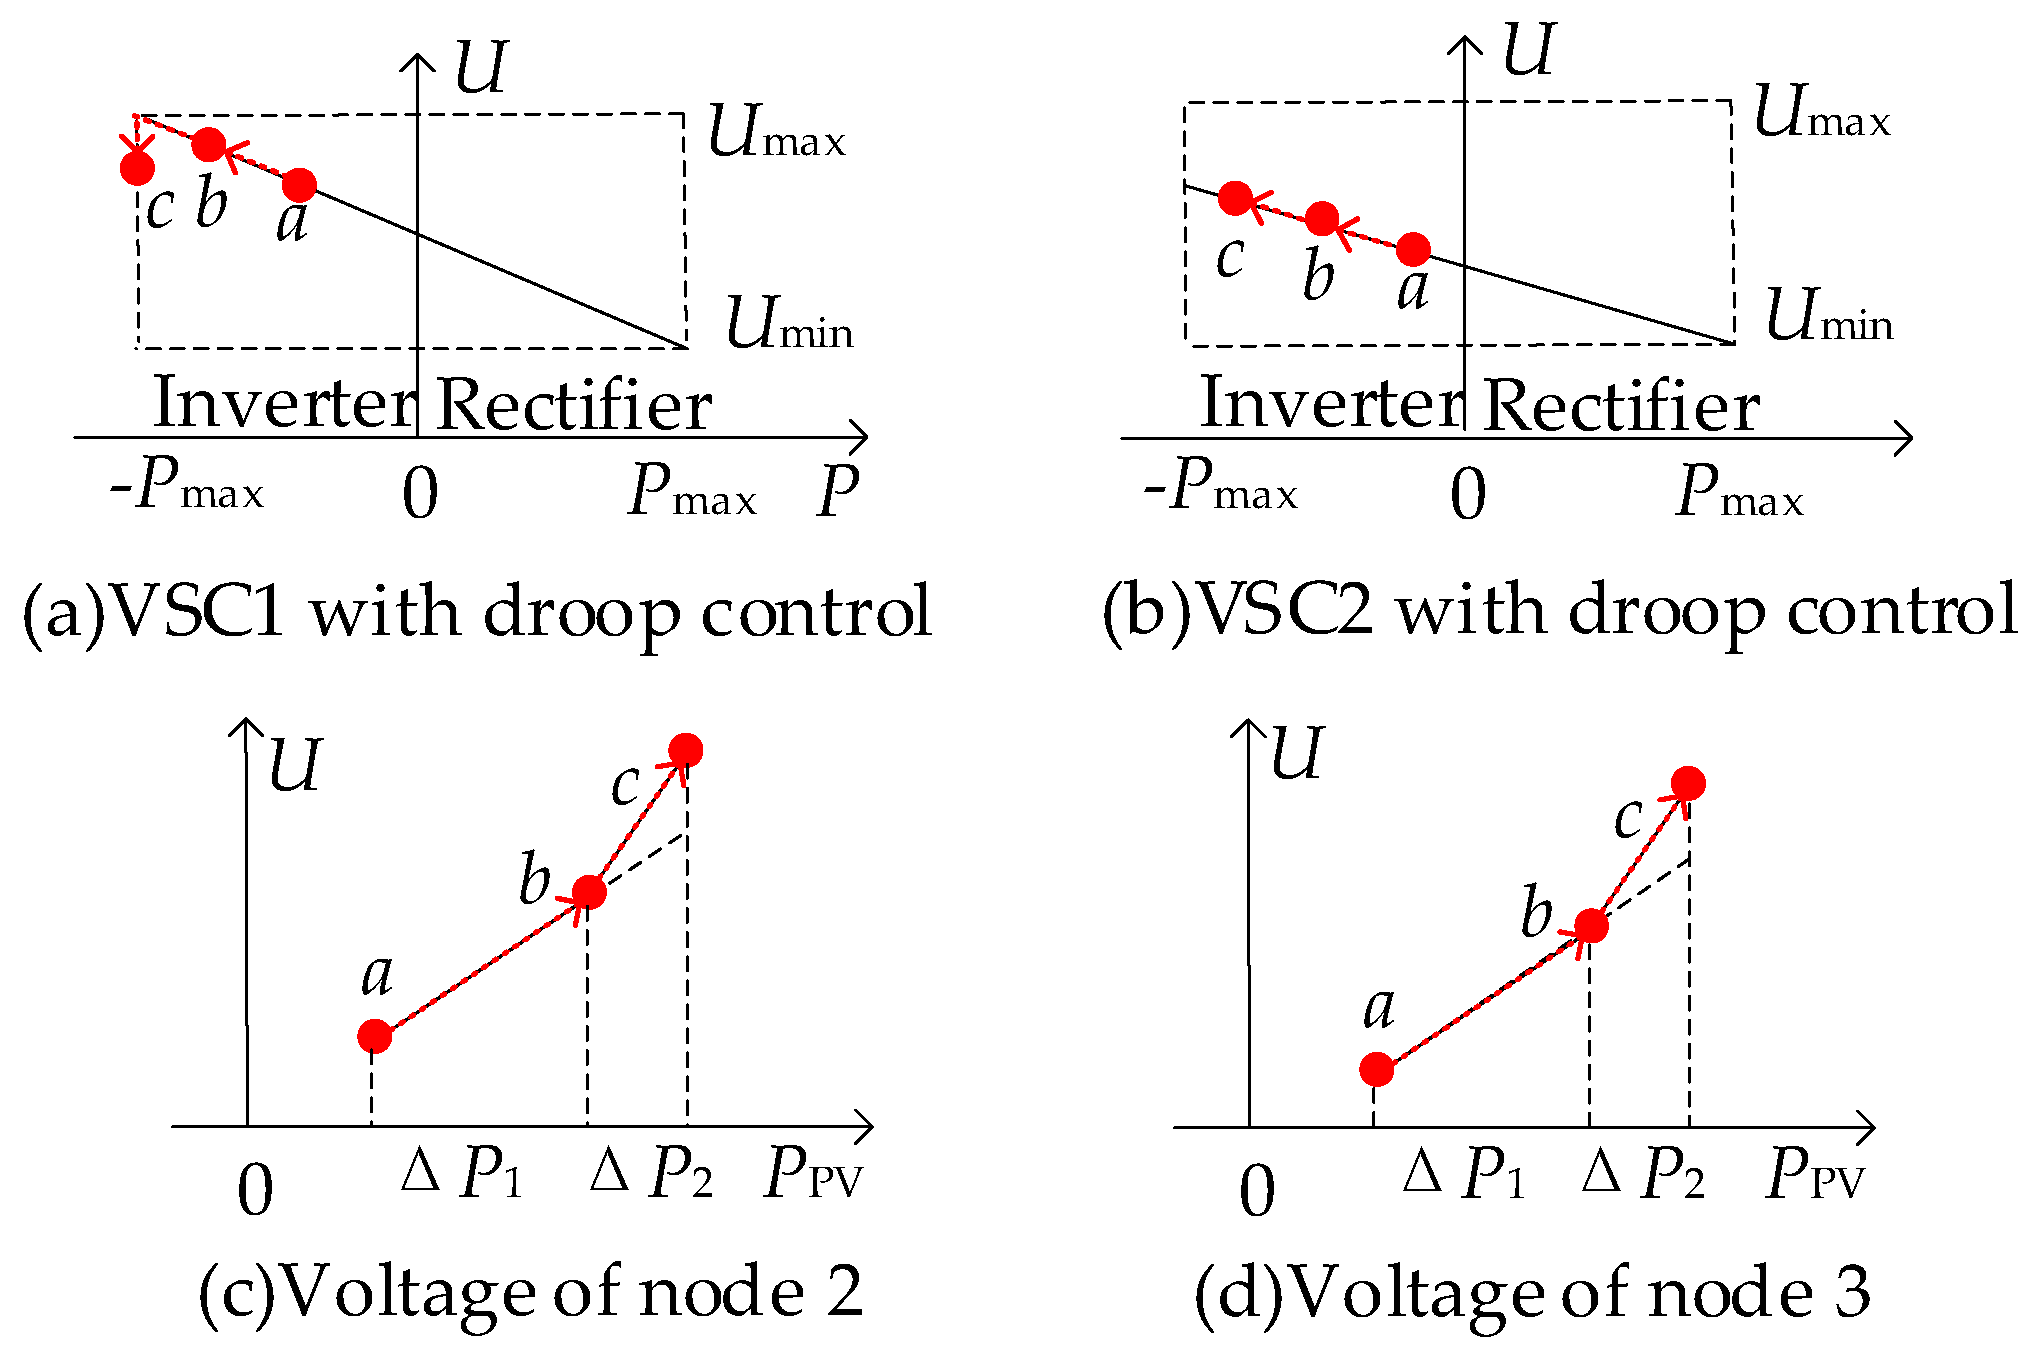
The simple two-terminal droop-controlled DCDN in Figure 3 is taken as an example to illustrate the influence of VSC control strategy adjustment on power flow distribution. The variation in VSC power and nodal voltage is briefly depicted in Figure 4.
In Figure 4, with the increase in PV power, the operation point changes from a to b to c. As shown in Figure 4, when the PV power begins to increase, the power of the two droop-controlled VSCs increases to share the PV power. The operation point changes from a to b. The linear model can be used to represent the voltage variation and VSC power variation. With the further increase in PV output power, one VSC reaches the capacity limit and keeps constant-power operation at that limit. The adjustment of the VSC control strategy leads to the change in sensitivity matrix in (3), (5), and (6). The updated linear model corresponding to the current operation point should be used to estimate the variations in voltage and VSC power.

3.2. Piecewise Linear Power Flow Model

For a fixed load level, the final steady-state performance is determined regardless of the transient responses process to the power disturbance. Referring to Figure 4, the voltage and power variation process caused by VSC control mode adjustment can be divided into different stages. In each stage, the linear power flow model can be used to calculate the variations in voltage and VSC power.
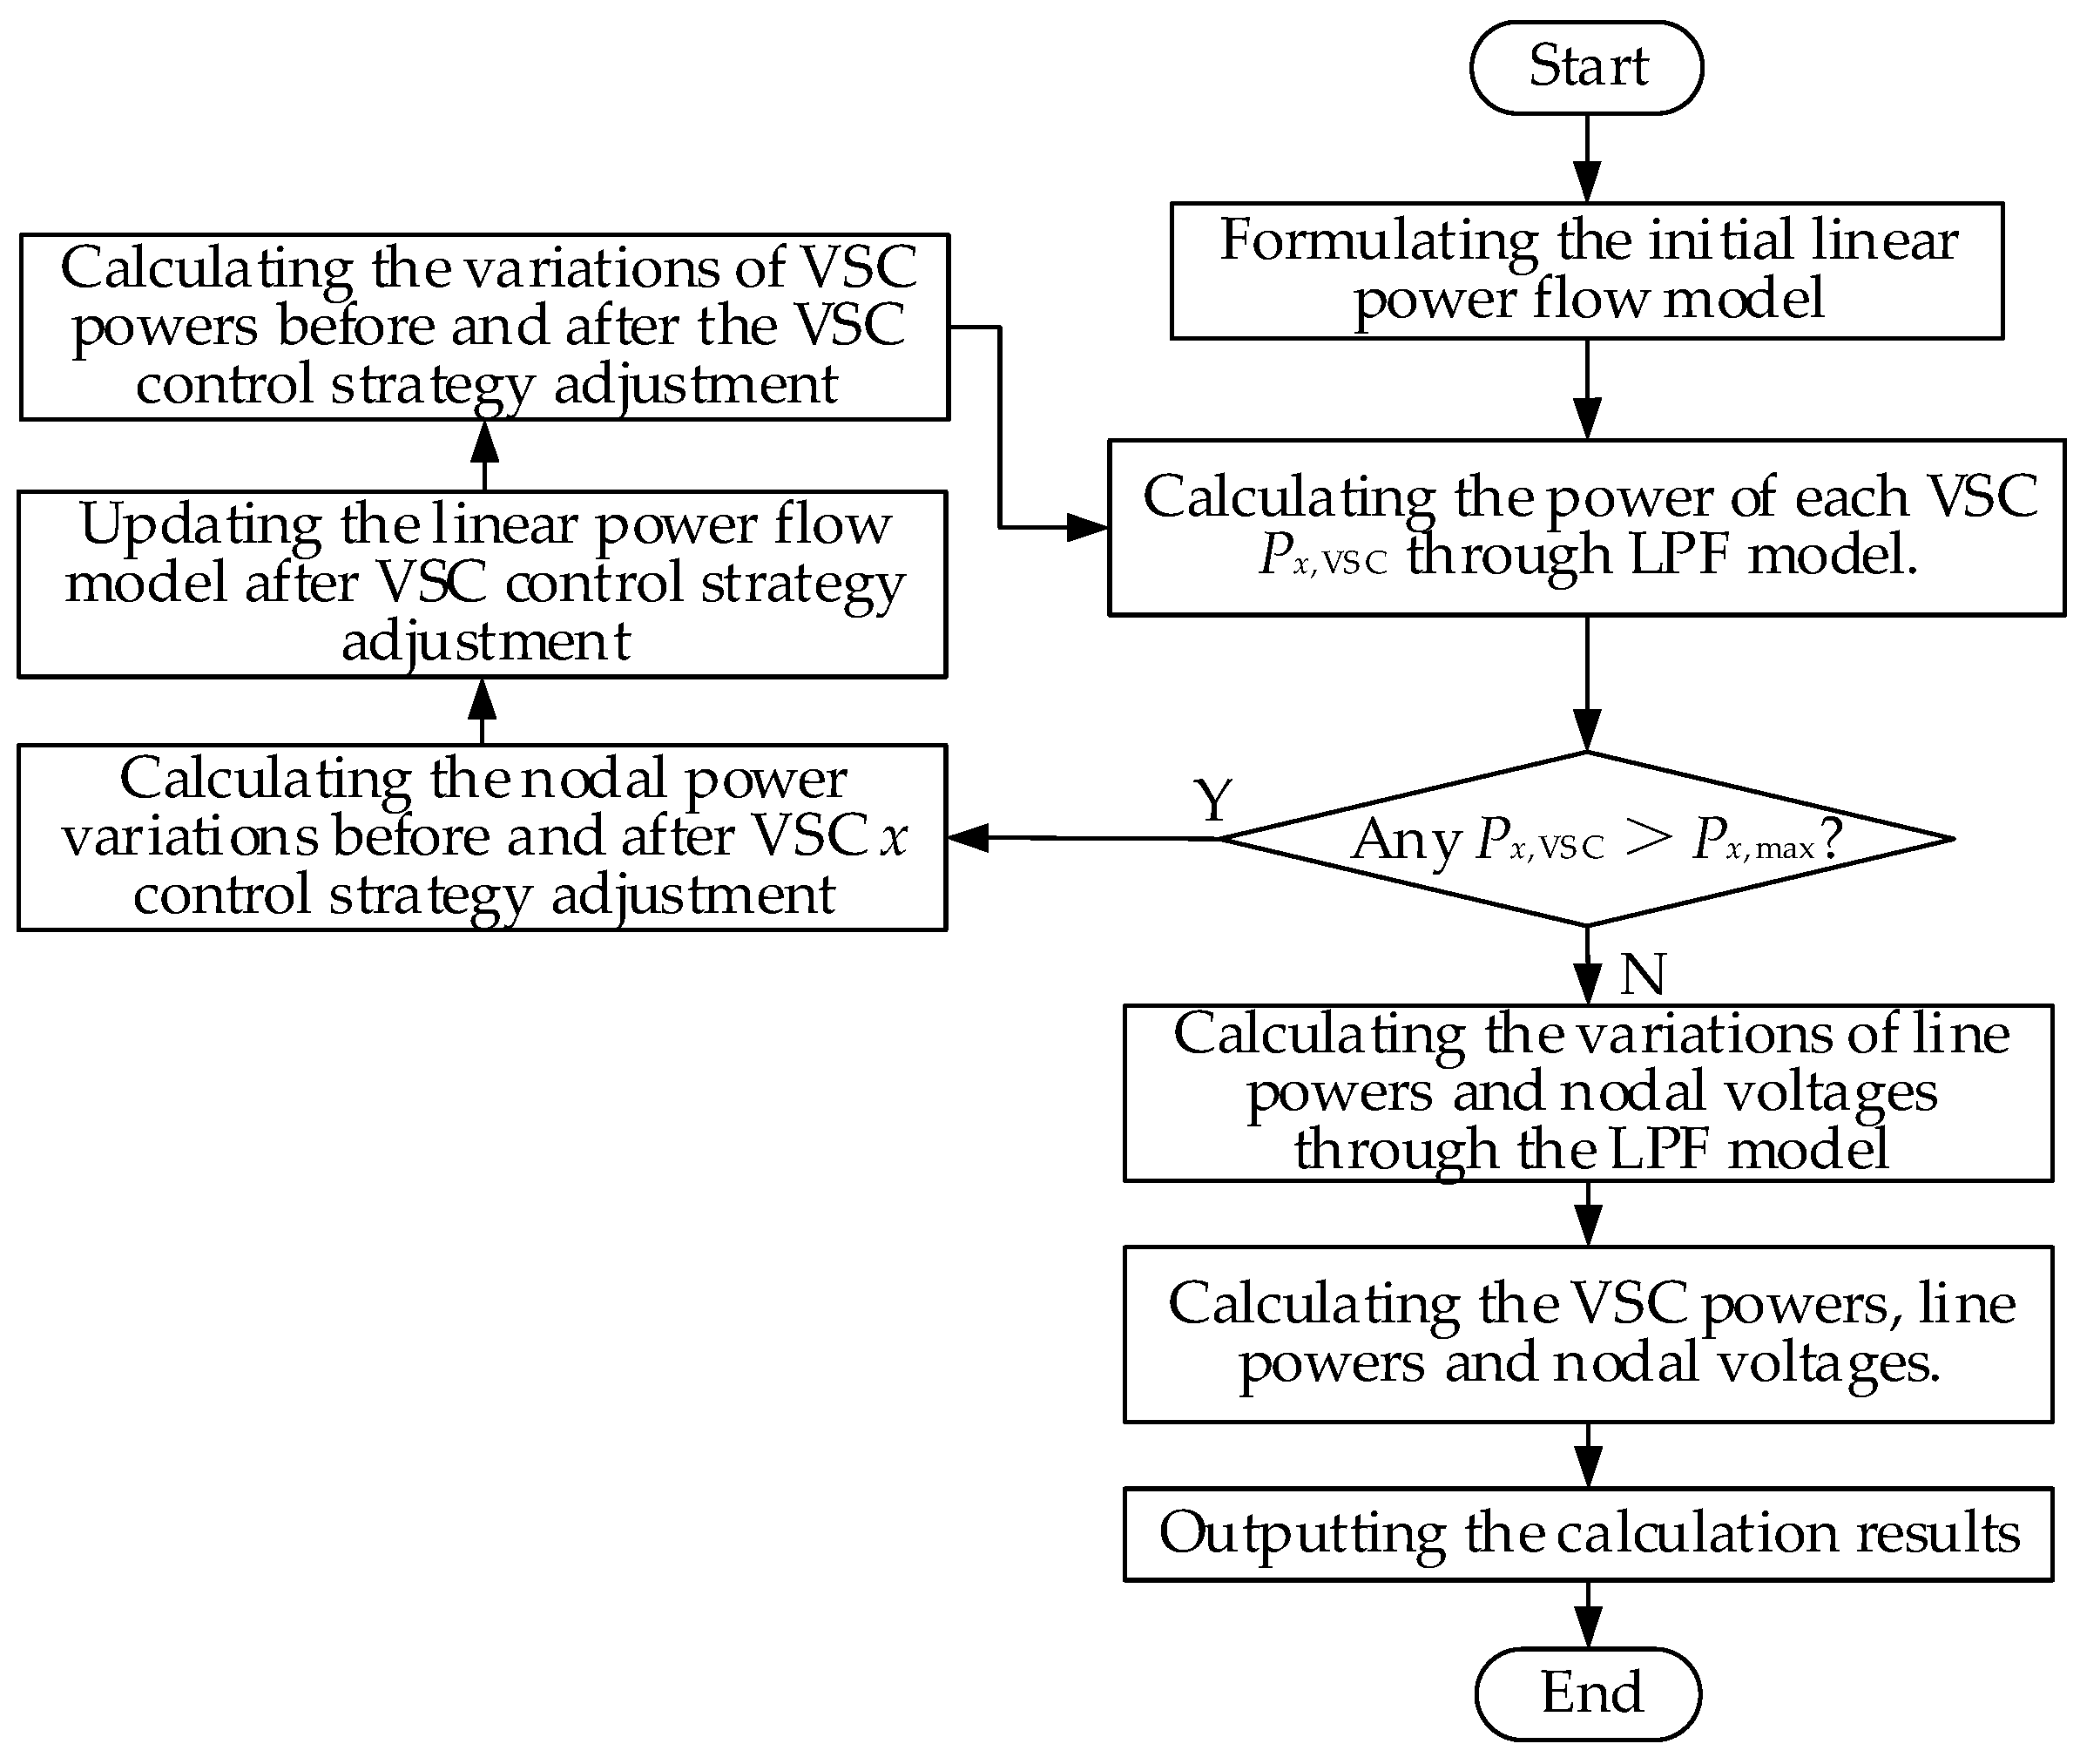
The difficulty is to determine the VSC control strategy and calculate the power variations in each stage in a straightforward way. To solve this problem, the nodal power variations in each stage are calculated by the sensitivity matrix in (6) according to the VSC power balance. The main process of PLPF calculation consists of the following steps:
Step 1: Formulate the initial linear power flow model.
Step 2: Calculate the power of each VSC through LPF model.
Step 3: If all the VSC powers are within the limit, calculate the variations in line powers and nodal voltages according to the linear power flow model, and go to step 8; otherwise, go to step 4.
Step 4: Calculate the nodal power variations before and after VSC control strategy adjustment.
Step 5: Update the linear power flow model after VSC control strategy adjustment.
Step 6: Calculate the variations in VSC powers, line powers, and nodal voltages before and after the VSC control strategy adjustment.
Step 7: Calculate the VSC powers, line powers and nodal voltages.
Step 8: Output the calculation results.
The flow chart of the centralized optimal control in DCDNs is shown in Figure 5.
The detailed explanations for the above steps are shown below:
In Step 1, the power flow calculation (PFC) is performed to obtain the nodal voltages and line powers. The LPF model expressed by (3), (5), and (6) is formulated.
In step 2, the power Px of the VSC at node x considering the variations in load powers and renewable energy powers is:
P x = P x , ini + Δ P x = P x , ini + i = 1 h W i , x Δ P i
where Px,ini is the initial power of the VSC at node x, ΔPx is the VSC power variation in the VSC at node x, ΔPi is the nodal power variation at node i, and Wi,x is the sensitivity of power variation at node i to the VSC power at node x.
In step 3, the line powers and nodal voltages can be expressed as:
P l = P l , ini + i = 1 h T i , l Δ P i
U j = U j , ini + i = 1 h S i , j Δ P i
where Pl is the power of line l; Pl,ini is the initial power of line l; Uj,ini is the initial voltage of node j; Ti,l represents the sensitivity of transmission power of line l to nodal injection power at node i; and Si,j represents the sensitivity of voltage of node j to nodal injection power at node i.
In step 4, it is supposed that the power of the VSC at node x is larger than its capacity, and the power variation before the VSC control strategy adjustment is:
P x , ini + α i = 1 h W i , x Δ P i = P x , max
where α is the proportion of the power variation before the VSC control strategy adjustment, and Px,max is the capacity of the VSC at node x.
From (10), α can be expressed as:
α = { 1 All   VSC   are   within   the   power   limit P x , max P x , ini i = 1 h W i , x Δ P i The   VSC   x   is   beyond   the   power   limit
In step 5, the droop coefficient of the VSC that changes from droop control to constant-power control is set to infinite, and the LPF model is updated.
In step 6, the power variations can be divided into different stages. The VSC powers, line powers, and nodal voltages can be expressed as:
P x = P x , ini + α i = 1 h W i , x Δ P i + ( 1 α ) i = 1 , i x h W i , x , s 2 Δ P i
P l = P l , ini + α i = 1 h T i , l Δ P i + ( 1 α ) i = 1 , i x h T i , l , s 2 Δ P i
U j = U j , ini + α i = 1 h S i , j Δ P i + ( 1 α ) i = 1 , i x h S i , j , s 2 Δ P i
where ΔPx is the power variation in VSC x; ΔPl is the power variation in line l; ΔUj is the voltage variation in node j; Wi,x,s2 represents the sensitivity of transmission power of VSC x to nodal injection power at node i after VSC control strategy change; Ti,l,s2 represents the sensitivity of transmission power of line l to nodal injection power at node i after VSC control strategy change; and Si,j,s2 represents the sensitivity of voltage of node j to nodal injection power at node i after VSC control strategy change.
It should be emphasized that when the VSC at node x changes from droop control to constant-power control, the power variation (1 − α) × ΔPx of the VSC at node x should not be considered in the PFC process of next stage.
In step 7, the power variations can be divided into different stages. The VSC powers, line powers, and nodal voltages can be expressed as:
P x = P x , ini + Δ P x
P l = P l , ini + Δ P l
U j = U j , ini + Δ U j

3.3. Multiple Overloaded Converters

In step 7, when the power of the VSC at node y calculated by (15) is greater than its capacity, it means that multiple VSCs are overloaded. In this circumstance, the power of the VSC at node y should be expressed as:
P y , ini + α i = 1 h W i , y Δ P i + β i = 1 , i x h W i , y Δ P i = P y , max
where β is the proportion of the power variation before the VSC at node y control strategy adjustment.
For instance, the nodal voltage in this circumstance can be expressed as:
U j = U j , ini + α i = 1 h S i , j Δ P i + β i = 1 , i x h S i , j , s 2 Δ P i + ( 1 α β ) i = 1 , i x , i y h S i , j , s 3 Δ P i
where Si,j,s3 represents the sensitivity of voltage of node j to nodal injection power at node i after the VSC control strategy is changed.
A DC distribution network with three VSCs is used to illustrate the conditions for different action scenario. Table 2 shows the conditions for each action scenario.
The general flow chart of the PLPF calculation is shown in Figure 6. Especially, when multiple VSCs are out of the limit in the first calculation in step 4, the proportion of the power variation α for each overloaded VSC is calculated according to (13). The VSC with the minimum α is supposed to be the first overloaded VSC.
For the error analysis for the PLPF algorithm, refer to ref. [16].

4. Numerical Examples

4.1. Test System 1

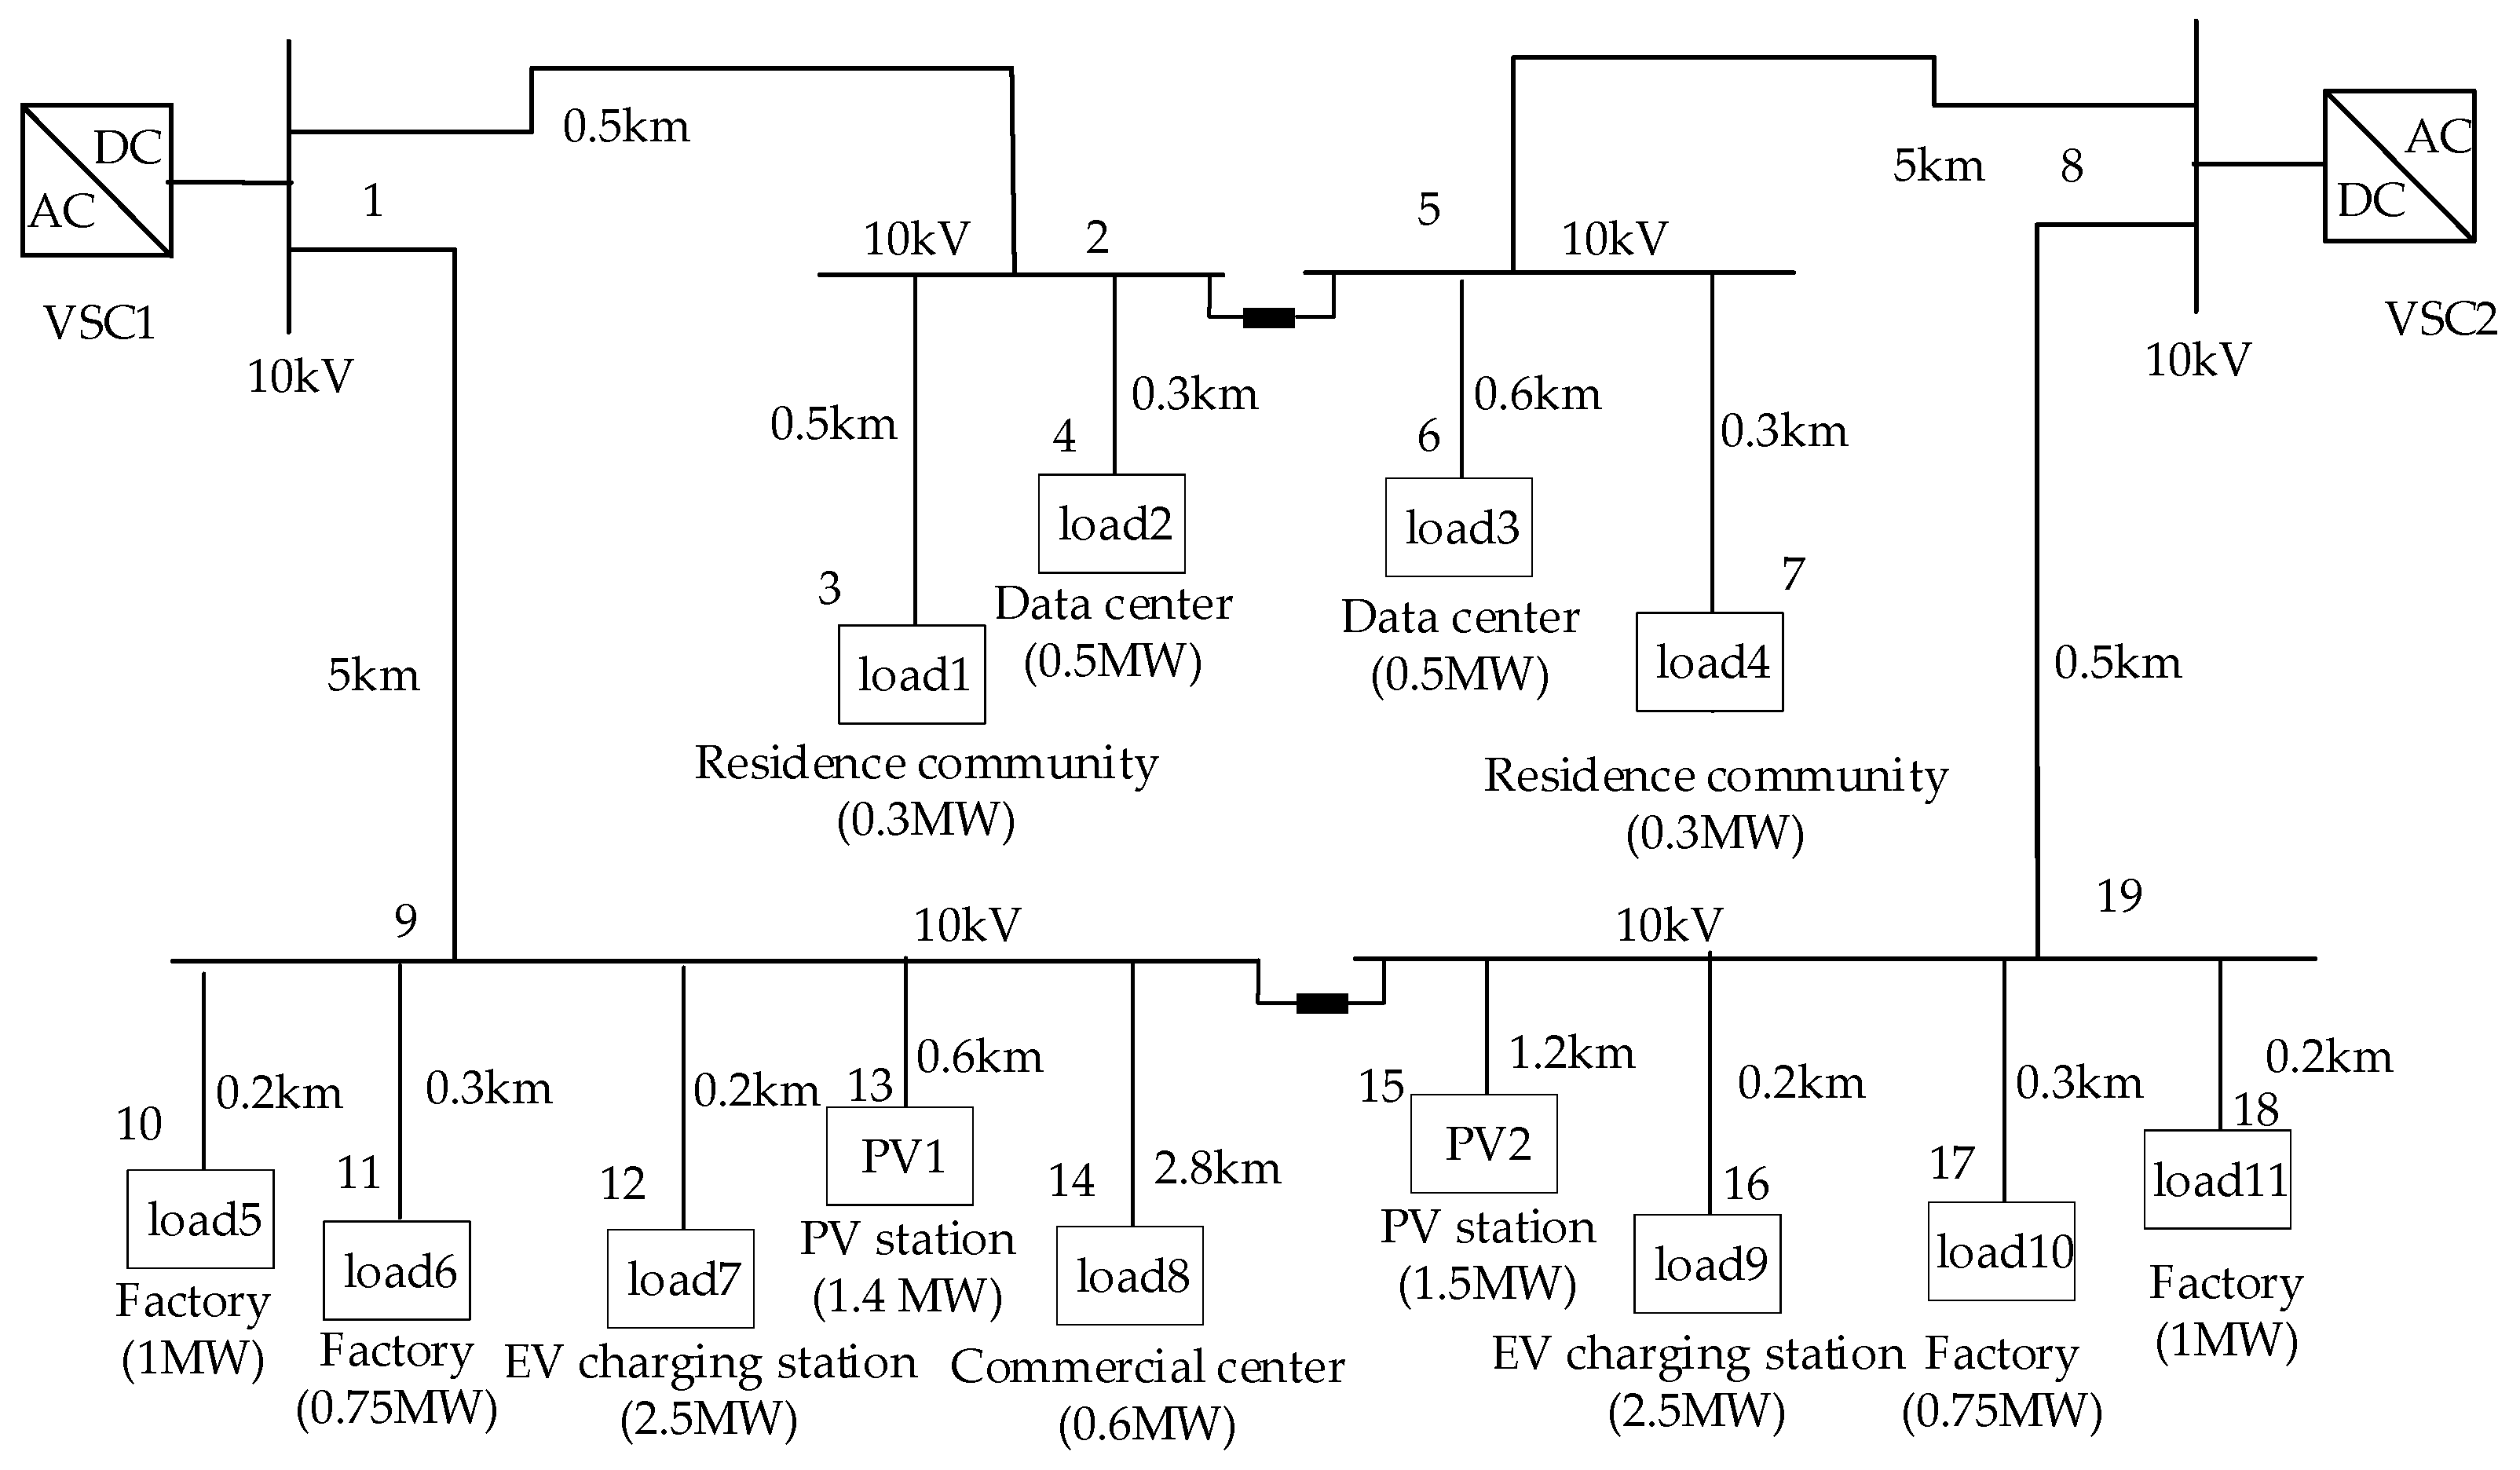
Figure 7 shows the DCDN in Suzhou, China. The VSC capacity was set to 5 MW; for the detailed parameters of the system, refer to [21]. The rated DC voltage was ±10 kV. The allowable voltage level was ±10% of the rated DC voltage. The VSCs were operated with a droop coefficient of 0.1 kV/MW and an operation reference power of 4 MW. The line parameters are shown in Table A1 of Appendix A. MATLAB 2022b with an Intel(R) Core(TM) i5-8350U CPU was used as the platform to implement the proposed strategy.

4.2. Accuracy Test of the Improved LPF Model

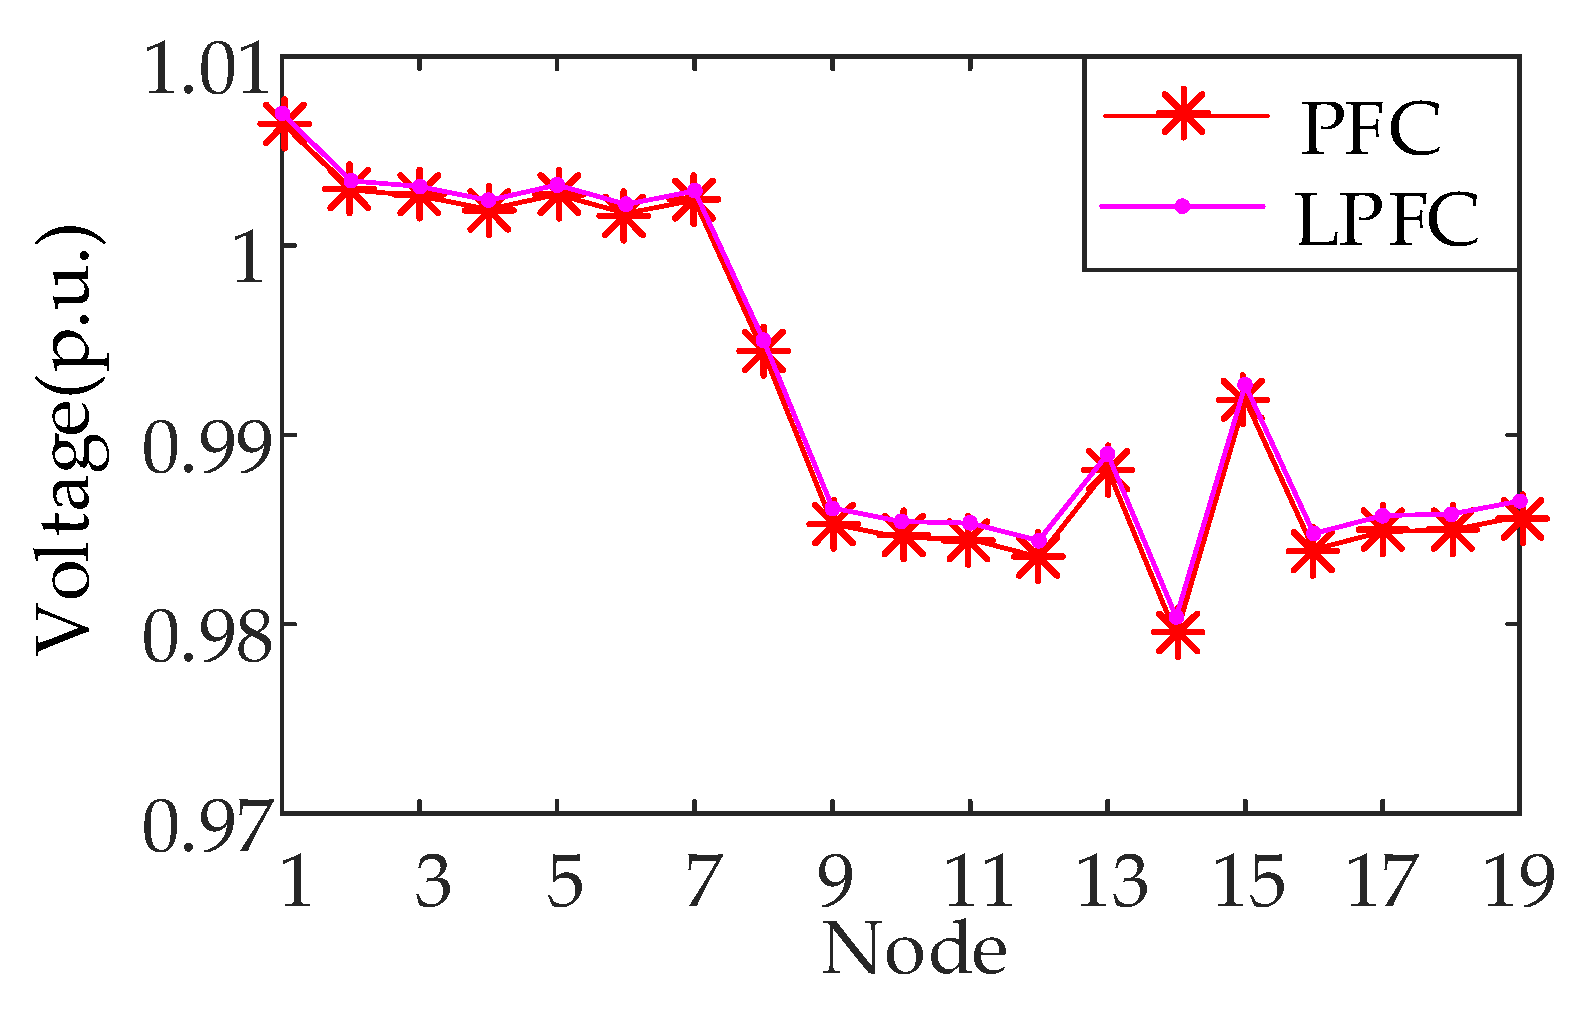
In the linear PFC (LPFC), the initial voltage was 1.0 p.u., and the initial nodal power variation was equal to the nodal power. The VSC power calculated via LPFC and PFC is shown in Table 3. The VSC1 power is less than the VSC capacity, and the maximum VSC power error of the proposed LPFC is 1.20%. The voltage comparisons are shown in Figure 8, and the maximum voltage error is 0.09%. In the situation with no VSC overload, the LPF model is accurate.
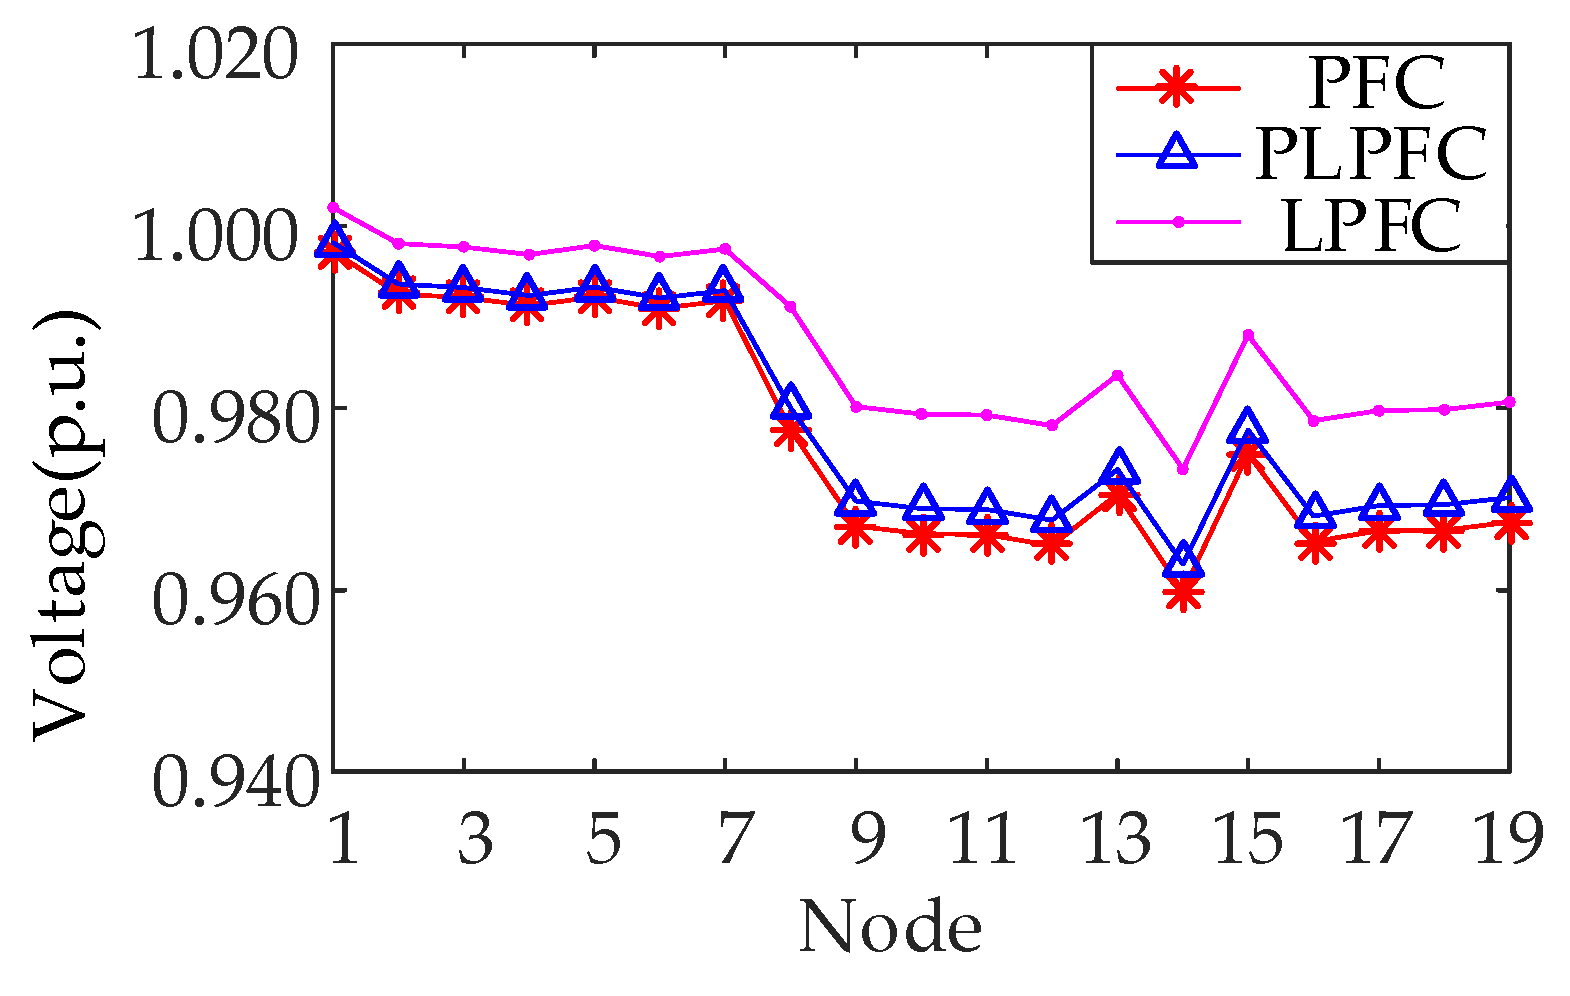
The load and PV powers were set to 1.2 times the initial value to perform LPFC. The VSC power calculation results of PLPF calculation (PLPFC) are shown in Table 4. In the first round of PLPFC, the VSC powers of VSC1 and VSC2 are 3.96 MW and 5.40 MW, respectively. The power of VSC2 hits the limit and outputs the constant power with 5 MW. The second round of calculation was then performed under the new working conditions of VSC2, and the final power of VSC1 is 4.36 MW.
The maximum VSC power error of the proposed PLPF is 4.18%, which is less than the 12.96% of the LPF. The voltage comparisons among the PFC, LPFC, and PLPFC are shown in Figure 9. The maximum voltage errors of PLPF and LPF are 0.22% and 1.14%, respectively. The simulation results show that the proposed PLPF is more accurate than the LPF when the VSC overloads.
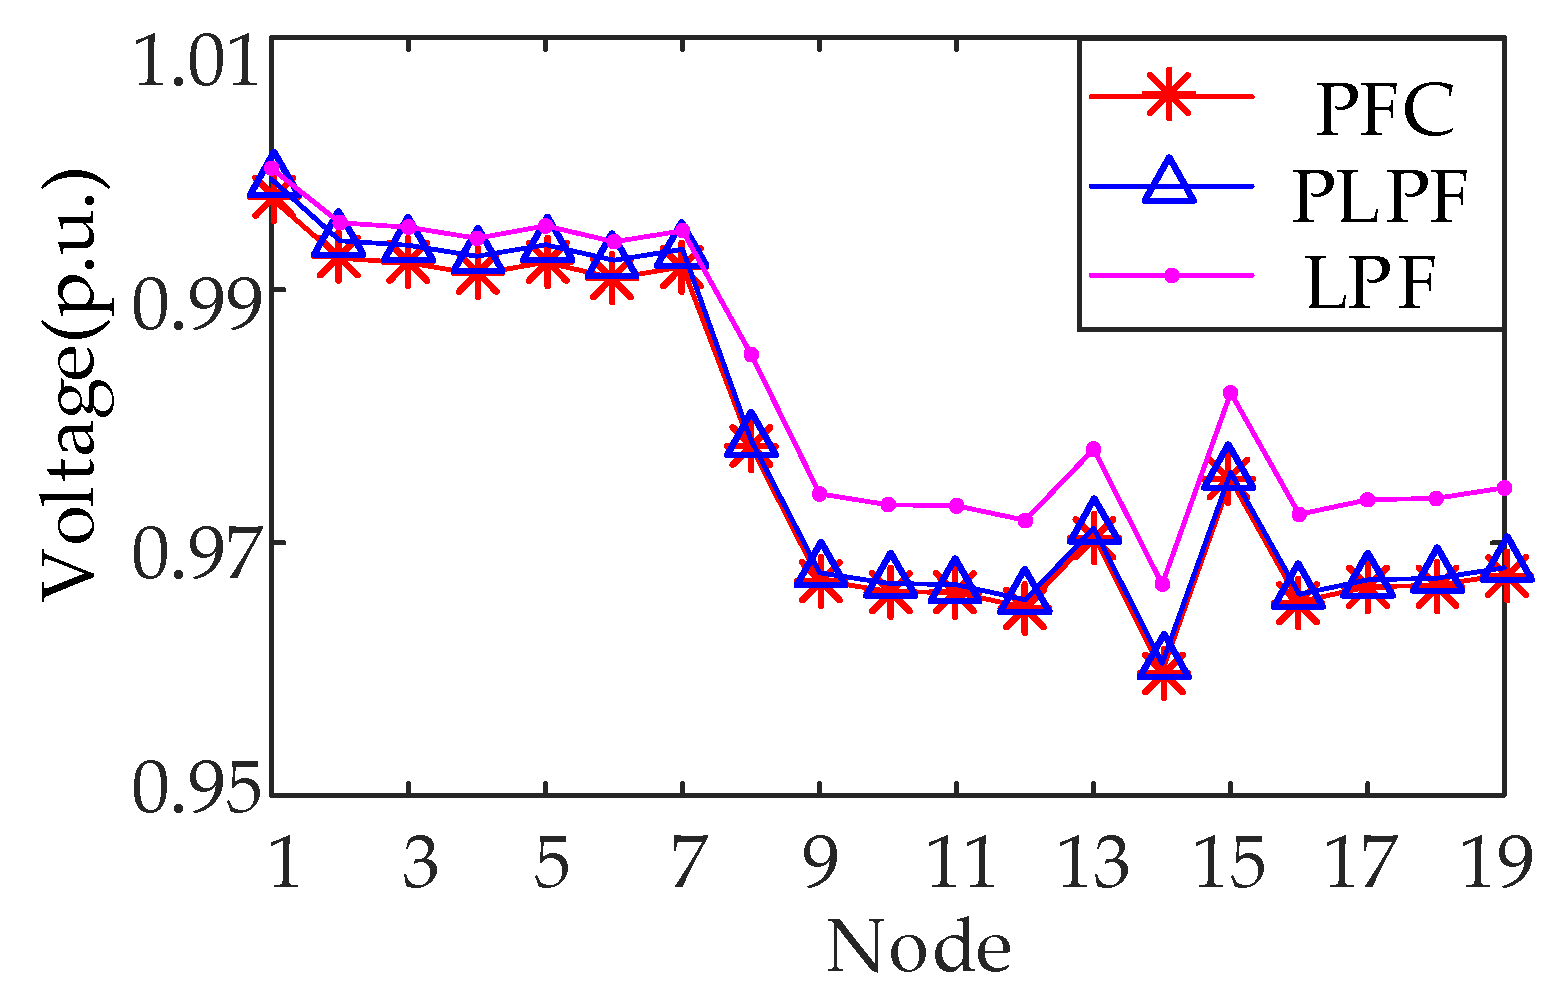
Next, the accuracy of the PLPF in steady-state performance analysis was tested, considering the influence of power disturbances. Accurate PFC was performed based on the initial value of the load power and PV output power. Then, the load power and PV output power were increased by 20%. The results of VSC power obtained by PLPFC, PFC, and LPFC are shown in Table 5. The maximum error of VSC power of the proposed PSPFC is 0.0021%. The voltage comparisons among PFC, LPFC, and PLPFC are shown in Figure 10. The maximum voltage error of PLPF and LPF is 0.14% and 0.73%, respectively. In the steady-state performance analysis of DCDN, when the accurate voltages are provided to the PLPF model, the accuracy of the PLPFC can be further improved.
The accuracy and calculation time comparison of the proposed PLPF and the bisection algorithm in [19] are shown in Table 6. It can be seen that the power variations in each stage calculated by the proposed algorithm are the same as those of [19]. It is because the sensitivity matrix W in (6) is the same in the two models. The calculation time of the proposed PLPF algorithm is less than that of the bisection algorithm because the power variations in each stage are directly calculated according to the VSC power balance.

4.3. Test System 2

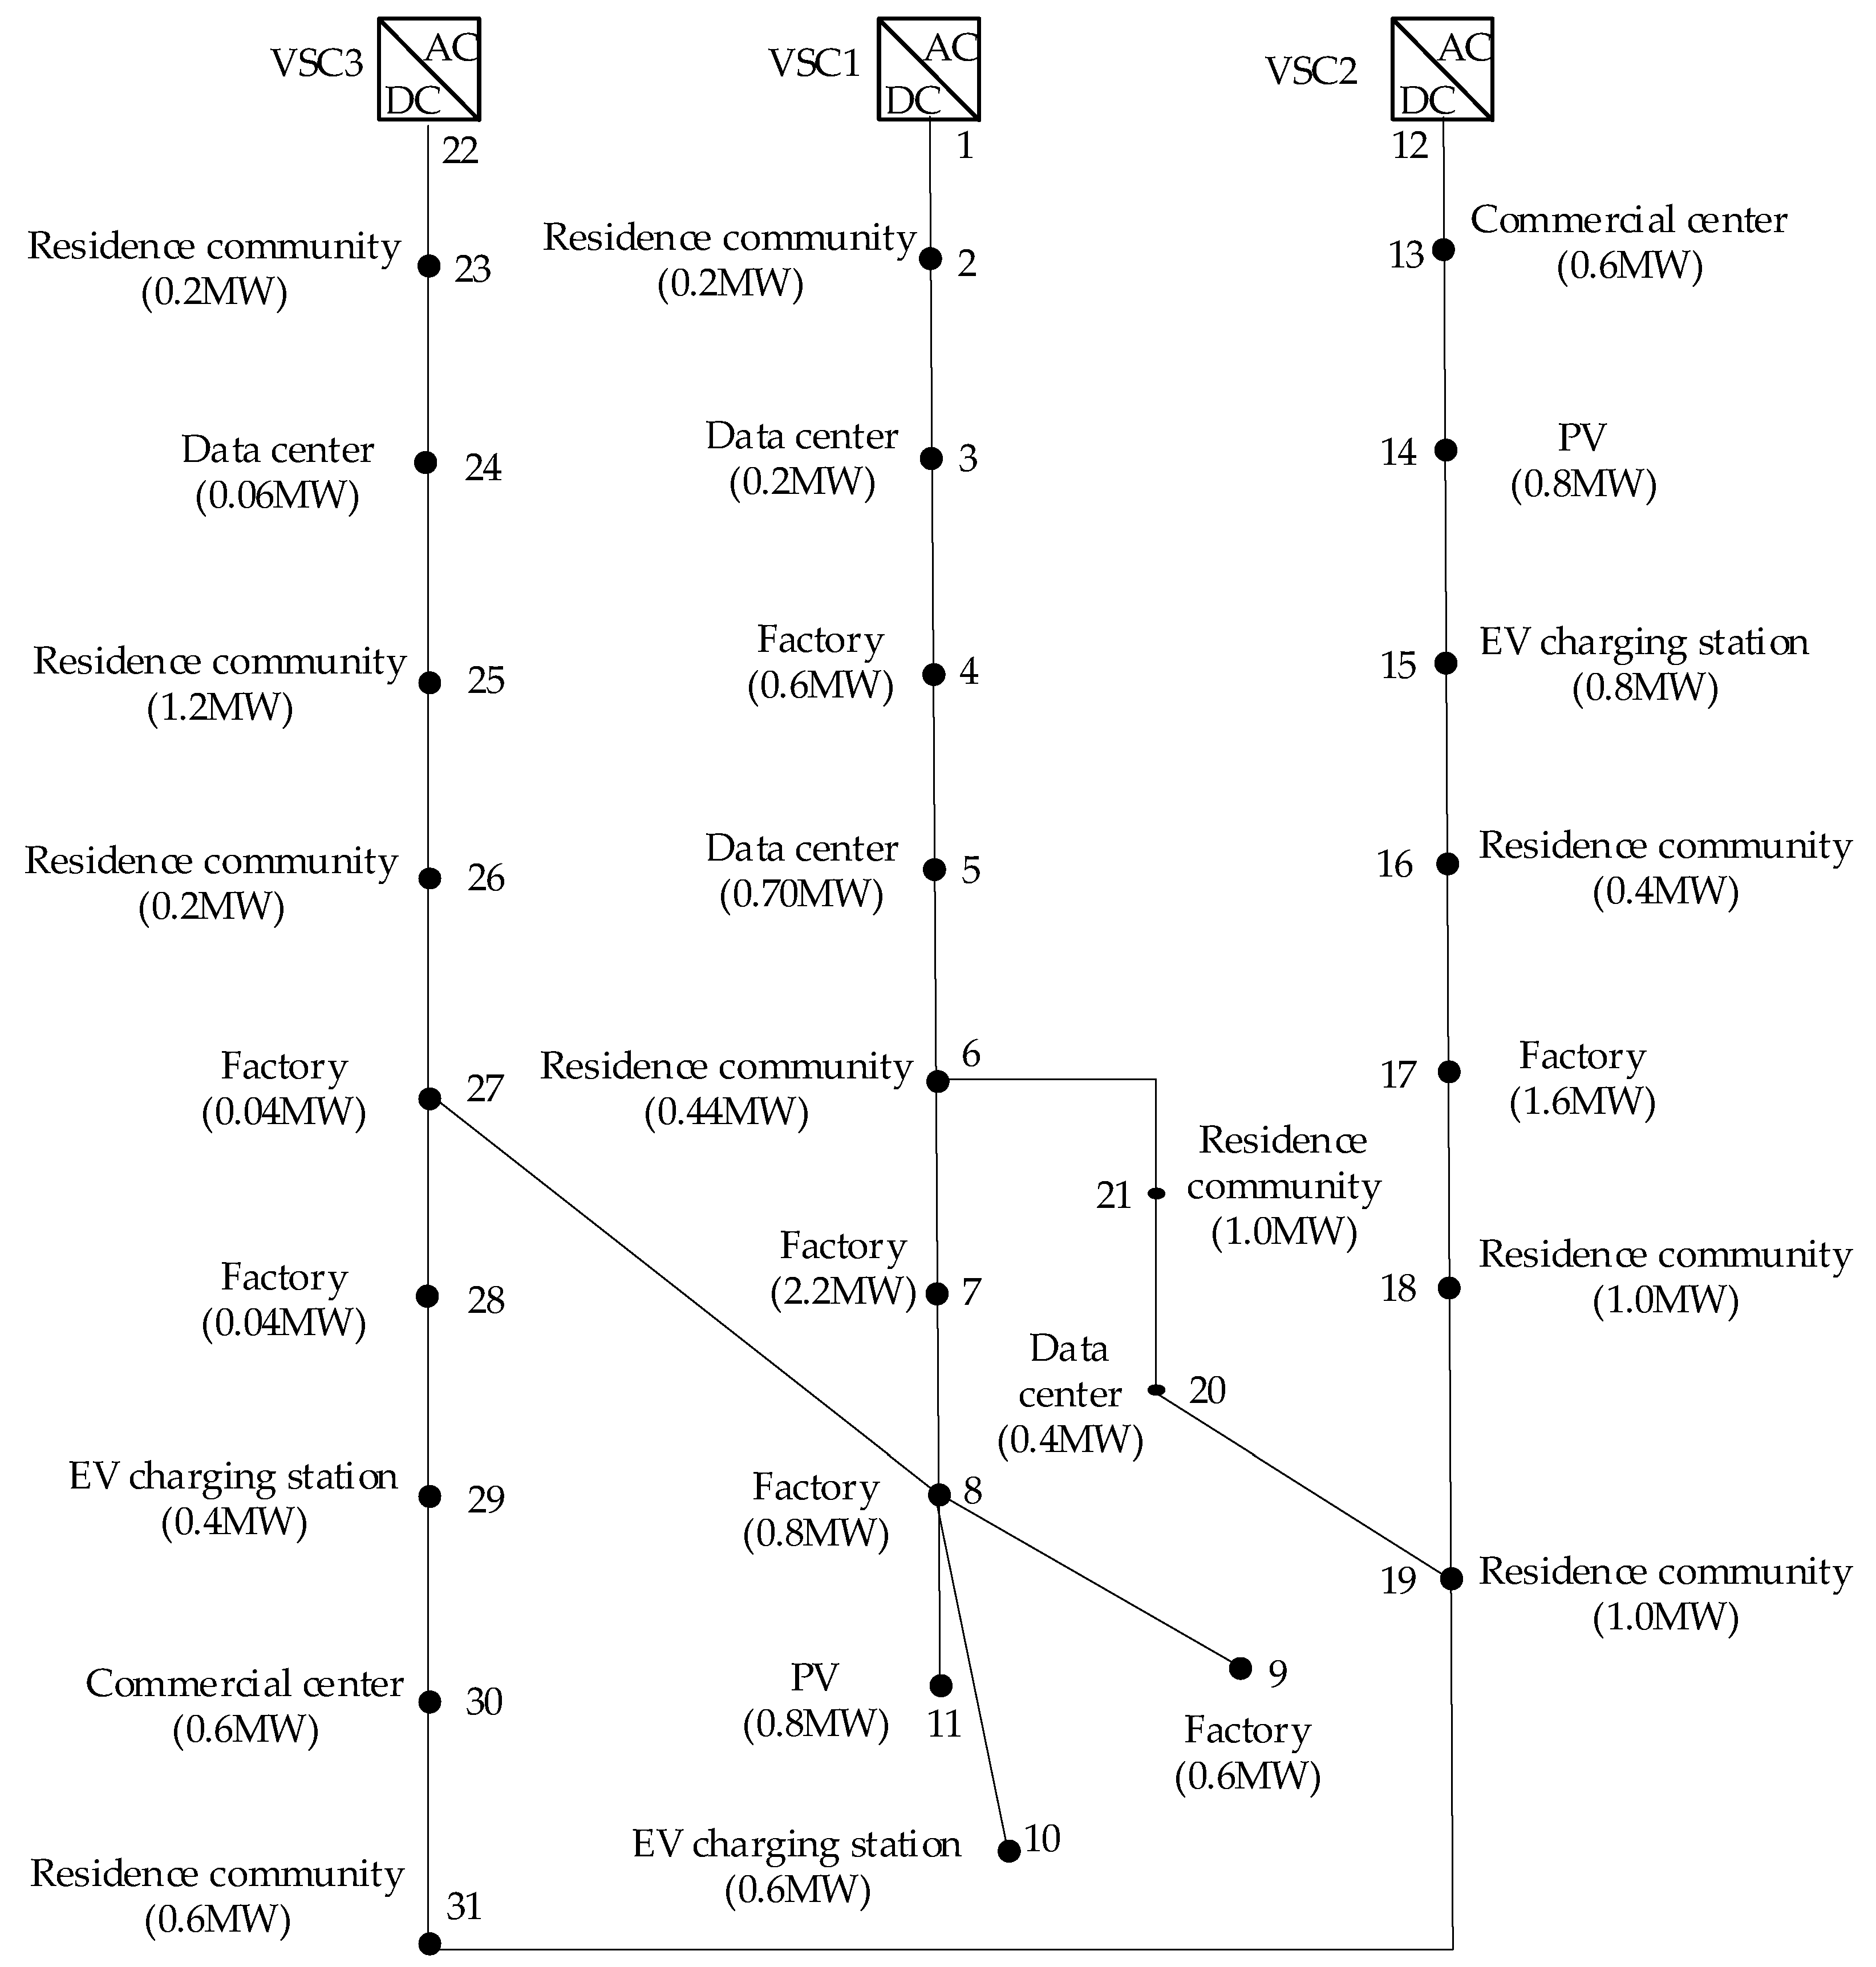
The proposed algorithm was tested with a large-scale three-terminal DCDN as shown in Figure 11 [22]. The rated DC voltage was ±10 kV. The allowable voltage level was ±10% of the rated DC voltage. The load and PV output powers were set to 1.2 times the initial value. The parameters of VSCs are shown in Table 7. The line parameters are shown in Table A2 of Appendix A.
Suppose that the load power and PV output power are increased by 40%. The obtained results of VSC power are shown in Table 8. The VSC2 hits the power limit and outputs the constant power with 10 MW. The maximum VSC power error of the proposed PLPF is 0.29%, which is less than 1.51% of the LPF.
The voltage comparisons are shown in Figure 12. The maximum voltage error of PLPF is 0.02%, which is less than the 0.21% of the LPF.
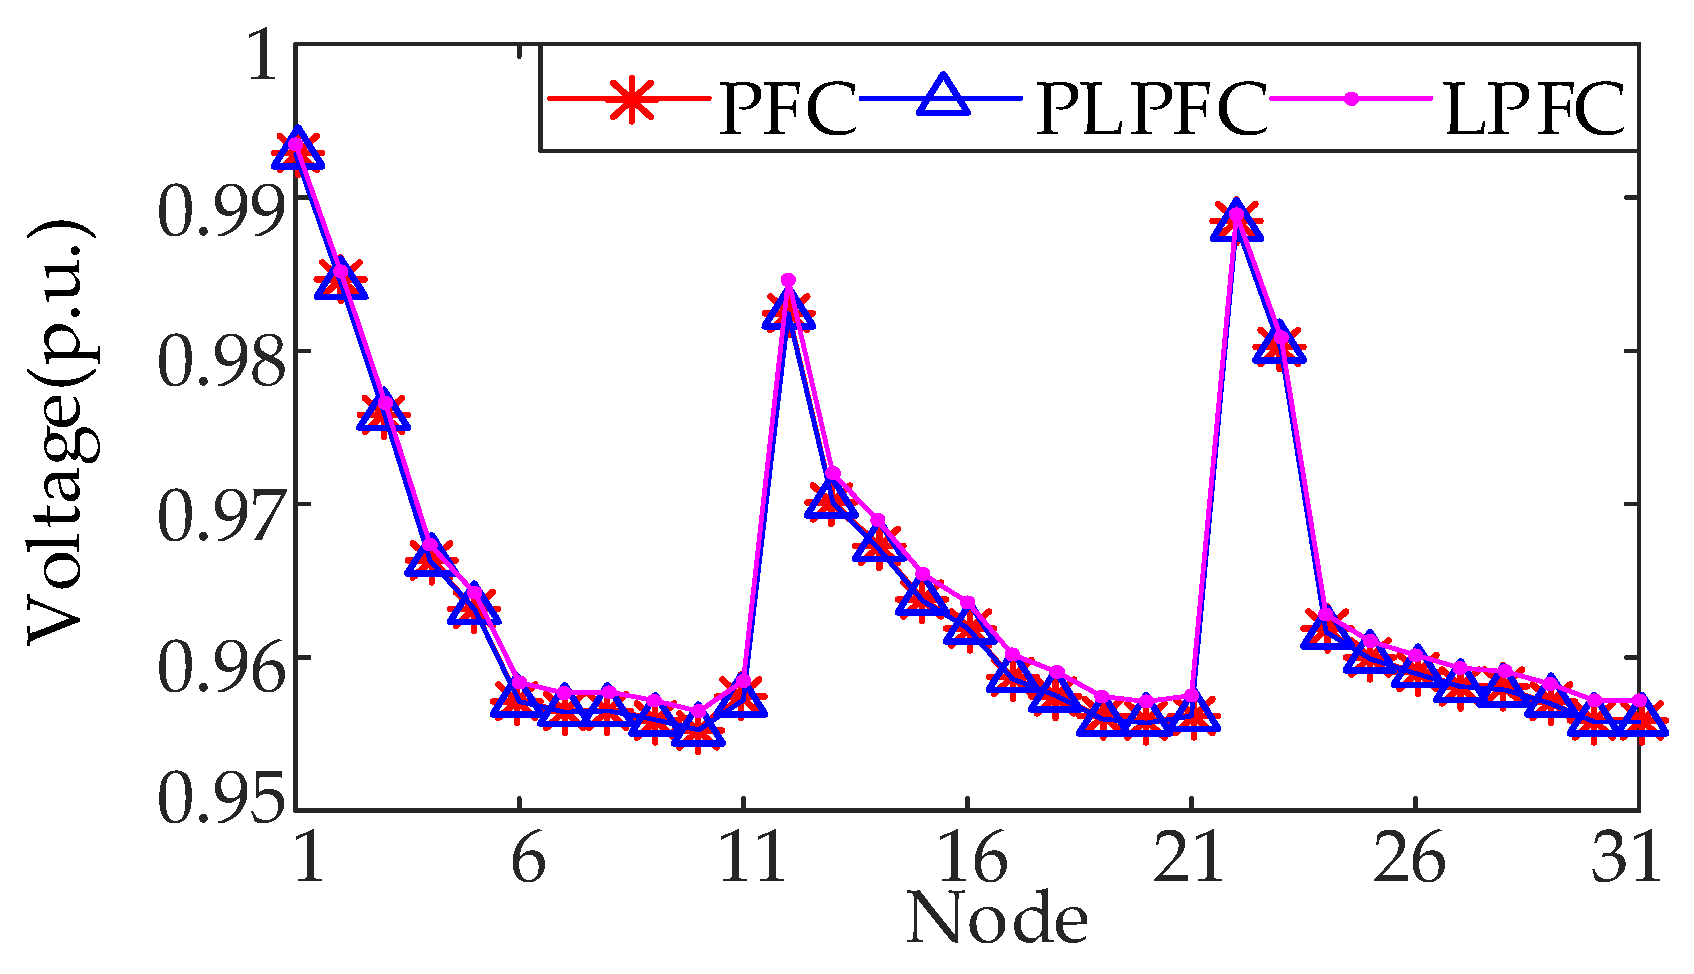
Next, the load power and PV output power were increased by 55% to analyze the circumstances with multiple overloaded VSCs. The VSC power calculation results are shown in Table 9. The VSC2 hits the capacity limit in the first round of calculations, and the VSC1 hits the capacity limit in the second round of calculations. The steady-state performance analysis was accomplished after three instances of LPFC. The maximum VSC power error of the proposed PLPF is 0.43%, which is less than 14.08% of the LPF. The voltage comparisons are shown in Figure 13, and the maximum voltage errors of PLPF and LPF are 0.04% and 1.27%, respectively. The simulation results prove the accuracy of the proposed PLPF when VSCs are overloaded.
The accuracy and calculation time comparison of the proposed PLPF and the bisection algorithm in [19] are shown in Table 10. The simulation results show that the proposed PLPF algorithm obtains the same results with fewer iterations and less calculation time compared with the bisection algorithm.

5. Conclusions

In this paper, a PLPF algorithm is presented to estimate the joint effect of power disturbance and VSC control strategy adjustment on the steady-state performance. In the proposed PLPF algorithm, the power variations before and after VSC overload can be directly calculated by the power sensitivity. The proposed PLPF algorithm is accurate enough for the situation with multiple overloaded VSCs, and the Maximum error of VSC power is less than 4%. Compared with the bisection algorithm, the proposed PLPF algorithm has the same computational accuracy only with half the calculation time of the bisection algorithm. The proposed PLPF algorithm provides a more accurate and straightforward way to estimate the steady-state performance.
Limited by the article space, only the principle of the PLPF algorithm was studied in this work. The application of the PLPF model in the optimization and planning of DC distribution networks can be studied in future work.

Author Contributions

Conceptualization, R.Y. and Y.W.; methodology, Y.W.; software, S.Y. and X.C.; validation, Y.W. and Y.C.; formal analysis, Y.W.; investigation, S.Y.; resources, R.Y.; data curation, S.Y.; writing—original draft preparation, R.Y. and Y.W.; writing—review and editing, Y.W.; visualization, S.Y. and X.C.; supervision, Y.W.; project administration, S.Y.; funding acquisition, R.Y. and Y.C. All authors have read and agreed to the published version of the manuscript.

Funding

This research was funded by the Science and Technology Project of CSG (030400KK52210064(GDKJXM20210061)) and National Key Research and Development Program (2022YFE0205100).

Data Availability Statement

Data are contained within the article.

Conflicts of Interest

Authors R.Y., Y.C., X.C. were employed by the company Guangdong Power Grid; S.Y. was employed by the company China Southern Power Grid Company Limited. The remaining author declares that the research was conducted in the absence of any commercial or financial relationships that could be construed as a potential conflict of interest.

Nomenclature

Un,refReference voltage of the VSC at node nWSensitivity matrix of nodal injection power to VSC power
Pn,refReference power of the VSC at node nPx,iniInitial power of the VSC at node x
knDroop coefficient of the VSC at node nΔPxVSC power variation in the VSC at node x
Pi,PVPV output power of node iΔPiNodal power variation at node i
Pi,LLoad power of node iWi,xSensitivity of power variation at node i to the VSC power at node x
gijAdmittance of the line from node i to node jTi,lSensitivity of transmission power of line l to nodal injection power at node i
UiVoltage of node iSi,jSensitivity of voltage of node j to nodal injection power at node i
MLSet of load nodesαProportion of the power variation before the VSC control strategy adjustment
MDSet of droop nodesPx,maxCapacity of the VSC at node x
SNodal voltage sensitivity matrixPl,iniInitial power of line l
ΔPChange in nodal injection powerUj,iniInitial voltage of node j
ΔUChange in nodal injection powerWi,x,s2Sensitivity of transmission power of VSC x to nodal injection power at node i after VSC control strategy change
ΔPLChange in line powerTi,l,s2Sensitivity of transmission power of line l to nodal injection power at node i after VSC control strategy change
TSensitivity matrix of nodal injection power to line transmission powerSi,j,s2Sensitivity of voltage of node j to nodal injection power at node i after VSC control strategy change
GDerivative of voltage with respect to line powerβProportion of the power variation before the VSC at node y control strategy adjustment
Si,j,s3Sensitivity of voltage of node j to nodal injection power at node i after the VSC control strategy is changedPx,maxCapacity of the VSC at node x
VSCVoltage source converterPVPhotovoltaic
DCDNDC distribution networkEVElectric vehicle
PLPFPiecewise linear power flowPFCPower flow calculation
HVDCHigh-voltage direct current

Appendix A

Table A1. Line parameter of the test system 1.
Head NodeEnd NodeLine Resistance (Ω)Head NodeEnd NodeLine Resistance (Ω)
120.17089120.0683
230.10259130.2050
240.20509140.9567
250.01709150.0170
560.205019150.4100
570.102519160.0683
581.708019170.1025
191.708019180.0683
9100.06801980.1708
9110.1025
Table A2. Line parameter of the test system 2.
Head NodeEnd NodeLine Resistance (Ω)Head NodeEnd NodeLine Resistance (Ω)
120.194417180.0786
230.209618190.0393
340.235819200.0786
450.091720210.0524
560.209622230.2268
670.039324250.5371
780.040525260.0524
890.104826270.0405
8100.235827280.0393
8110.104828290.0262
12130.243029300.1048
13140.065530310.2358
14150.06556210.1310
15160.065519310.0393
16170.03938270.1310

References

  1. Nami, A.; Rodriguez-Amenedo, J.L.; Arnaltes, S.; Cardiel-Álvarez, M.Á.; Baraciarte, R.A. Control of the parallel operation of DR-HVDC and VSC-HVDC for offshore wind power transmission. IEEE Trans. Power Deliv. 2022, 37, 1682–1691. [Google Scholar] [CrossRef]
  2. Gomis-Bellmunt, O.; Sau-Bassols, J.; Prieto-Araujo, E.; Cheah-Mane, M. Flexible converters for meshed HVDC grids: From flexible AC transmission systems (FACTS) to flexible DC grids. IEEE Trans. Power Deliv. 2020, 35, 2–15. [Google Scholar] [CrossRef]
  3. Obradović, D.; Oluić, M.; Eriksson, R.; Ghandhari, M. Supplementary power control of an HVDC system and its impact on electromechanical dynamics. IEEE Trans. Power Syst. 2021, 36, 4599–4610. [Google Scholar] [CrossRef]
  4. Li, X.; Li, Z.; Zhao, B.; Lu, C.; Song, Q.; Zhou, Y.; Rao, H.; Xu, S.; Zhu, Z. HVDC reactor reduction method based on virtual reactor fault current limiting control of MMC. IEEE Trans. Ind. Electron. 2020, 67, 9991–10000. [Google Scholar] [CrossRef]
  5. Tang, G.; He, Z.; Pang, H.; Huang, X.; Zhang, X.-P. Basic topology and key devices of the five-terminal DC grid. CSEE J. Power Energy Syst. 2015, 1, 22–35. [Google Scholar] [CrossRef]
  6. Yang, R.; Shi, G.; Cai, X.; Zhang, C.; Li, G.; Liang, J. Autonomous synchronizing and frequency response control of multi-terminal DC systems with wind farm integration. IEEE Trans. Sustain. Energy 2020, 11, 2504–2514. [Google Scholar] [CrossRef]
  7. Chai, Y.; Guo, L.; Wang, C.; Zhao, Z.; Du, X.; Pan, J. Network partition and voltage coordination control for distribution networks with high penetration of distributed PV units. IEEE Trans. Power Syst. 2018, 33, 3396–3407. [Google Scholar] [CrossRef]
  8. Zhang, L.; Liang, J.; Tang, W.; Li, G.; Cai, Y.; Sheng, W. Converting AC distribution lines to DC to increase transfer capacities and DG penetration. IEEE Trans. Smart Grid 2019, 10, 1477–1487. [Google Scholar] [CrossRef]
  9. Dastgeer, F.; Gelani, H.E.; Anees, H.M.; Paracha, Z.J.; Kalam, A. Analyses of efficiency/energy-savings of DC power distribution systems/microgrids: Past, present and future. Int. J. Electr. Power Energy Syst. 2019, 104, 89–100. [Google Scholar] [CrossRef]
  10. Xie, X.; Quan, X.; Wu, Z.; Cao, X.; Dou, X.; Hu, Q. Adaptive master-slave control strategy for medium voltage DC distribution systems based on a novel nonlinear droop controller. IEEE Trans. Smart Grid 2021, 12, 4765–4777. [Google Scholar] [CrossRef]
  11. Cao, X.; Han, M.; Nee, H.-P.; Yan, W. A new method for simplifying complex DC systems and obtaining the controller droop coefficients. IEEE Trans. Power Syst. 2022, 37, 996–1006. [Google Scholar] [CrossRef]
  12. Wang, W.; Barnes, M. Power flow algorithms for multi-terminal VSC-HVDC with droop control. IEEE Trans. Power Syst. 2014, 29, 1721–1730. [Google Scholar] [CrossRef]
  13. Zeng, L.; Chiang, H.-D. Toward an online minimum number of controls for relieving overloads. IEEE Trans. Power Syst. 2018, 33, 1882–1890. [Google Scholar] [CrossRef]
  14. Guerrero, J.M.; Vasquez, J.C.; Matas, J.; de Vicuna, L.G.; Castilla, M. Hierarchical control of droop-controlled AC and DC microgrids—A general approach toward standardization. IEEE Trans. Ind. Electron. 2011, 58, 158–172. [Google Scholar] [CrossRef]
  15. Haileselassie, T.M.; Uhlen, K. Impact of DC line voltage drops on power flow of MTDC using droop control. IEEE Trans. Power Syst. 2012, 27, 1441–1449. [Google Scholar] [CrossRef]
  16. Yuan, Z.; Wang, Y.; Yi, Y.; Wang, C.; Zhao, Y.; Wen, W. Fast linear power flow algorithm for the study of steady-state performance of DC grid. IEEE Trans. Power Syst. 2019, 34, 4240–4248. [Google Scholar] [CrossRef]
  17. Wang, H.; Zhou, N.; Zhang, Y.; Liao, J.; Tan, S.; Liu, X.; Guo, C.; Wang, Q. Linearized power flow calculation of bipolar DC distribution network with multiple flexible equipment. Int. J. Electr. Power Energy Syst. 2024, 155, 109568. [Google Scholar] [CrossRef]
  18. Beerten, J.; Belmans, R. Analysis of power sharing and voltage deviations in droop-controlled DC grids. IEEE Trans. Power Syst. 2013, 28, 4588–4597. [Google Scholar] [CrossRef]
  19. Xiao, L.; Xu, Z.; An, T.; Bian, Z. Improved analytical model for the study of steady state performance of droop-controlled VSC-MTDC systems. IEEE Trans. Power Syst. 2017, 32, 2083–2093. [Google Scholar] [CrossRef]
  20. Zhang, S.; Fang, Y.; Zhang, H.; Cheng, H.; Wang, X. Maximum hosting capacity of photovoltaic generation in SOP-based power distribution network integrated with electric vehicles. IEEE Trans. Ind. Inform. 2022, 18, 8213–8224. [Google Scholar] [CrossRef]
  21. Liu, Q.; Wang, Y.; Wang, S.; Liang, D.; Zhao, Q.; Zhao, X. Voltage regulation strategy for DC distribution networks based on coordination of centralized control and adaptive droop control. IEEE Trans. Power Deliv. 2022, 37, 3730–3739. [Google Scholar] [CrossRef]
  22. Liu, Q.; Wang, S.; Zhao, Q.; Wang, K. Interval power flow calculation algorithm for multi-terminal DC distribution networks considering distributed generation output uncertainties. IET Gener. Transm. Distrib. 2021, 15, 986–996. [Google Scholar] [CrossRef]
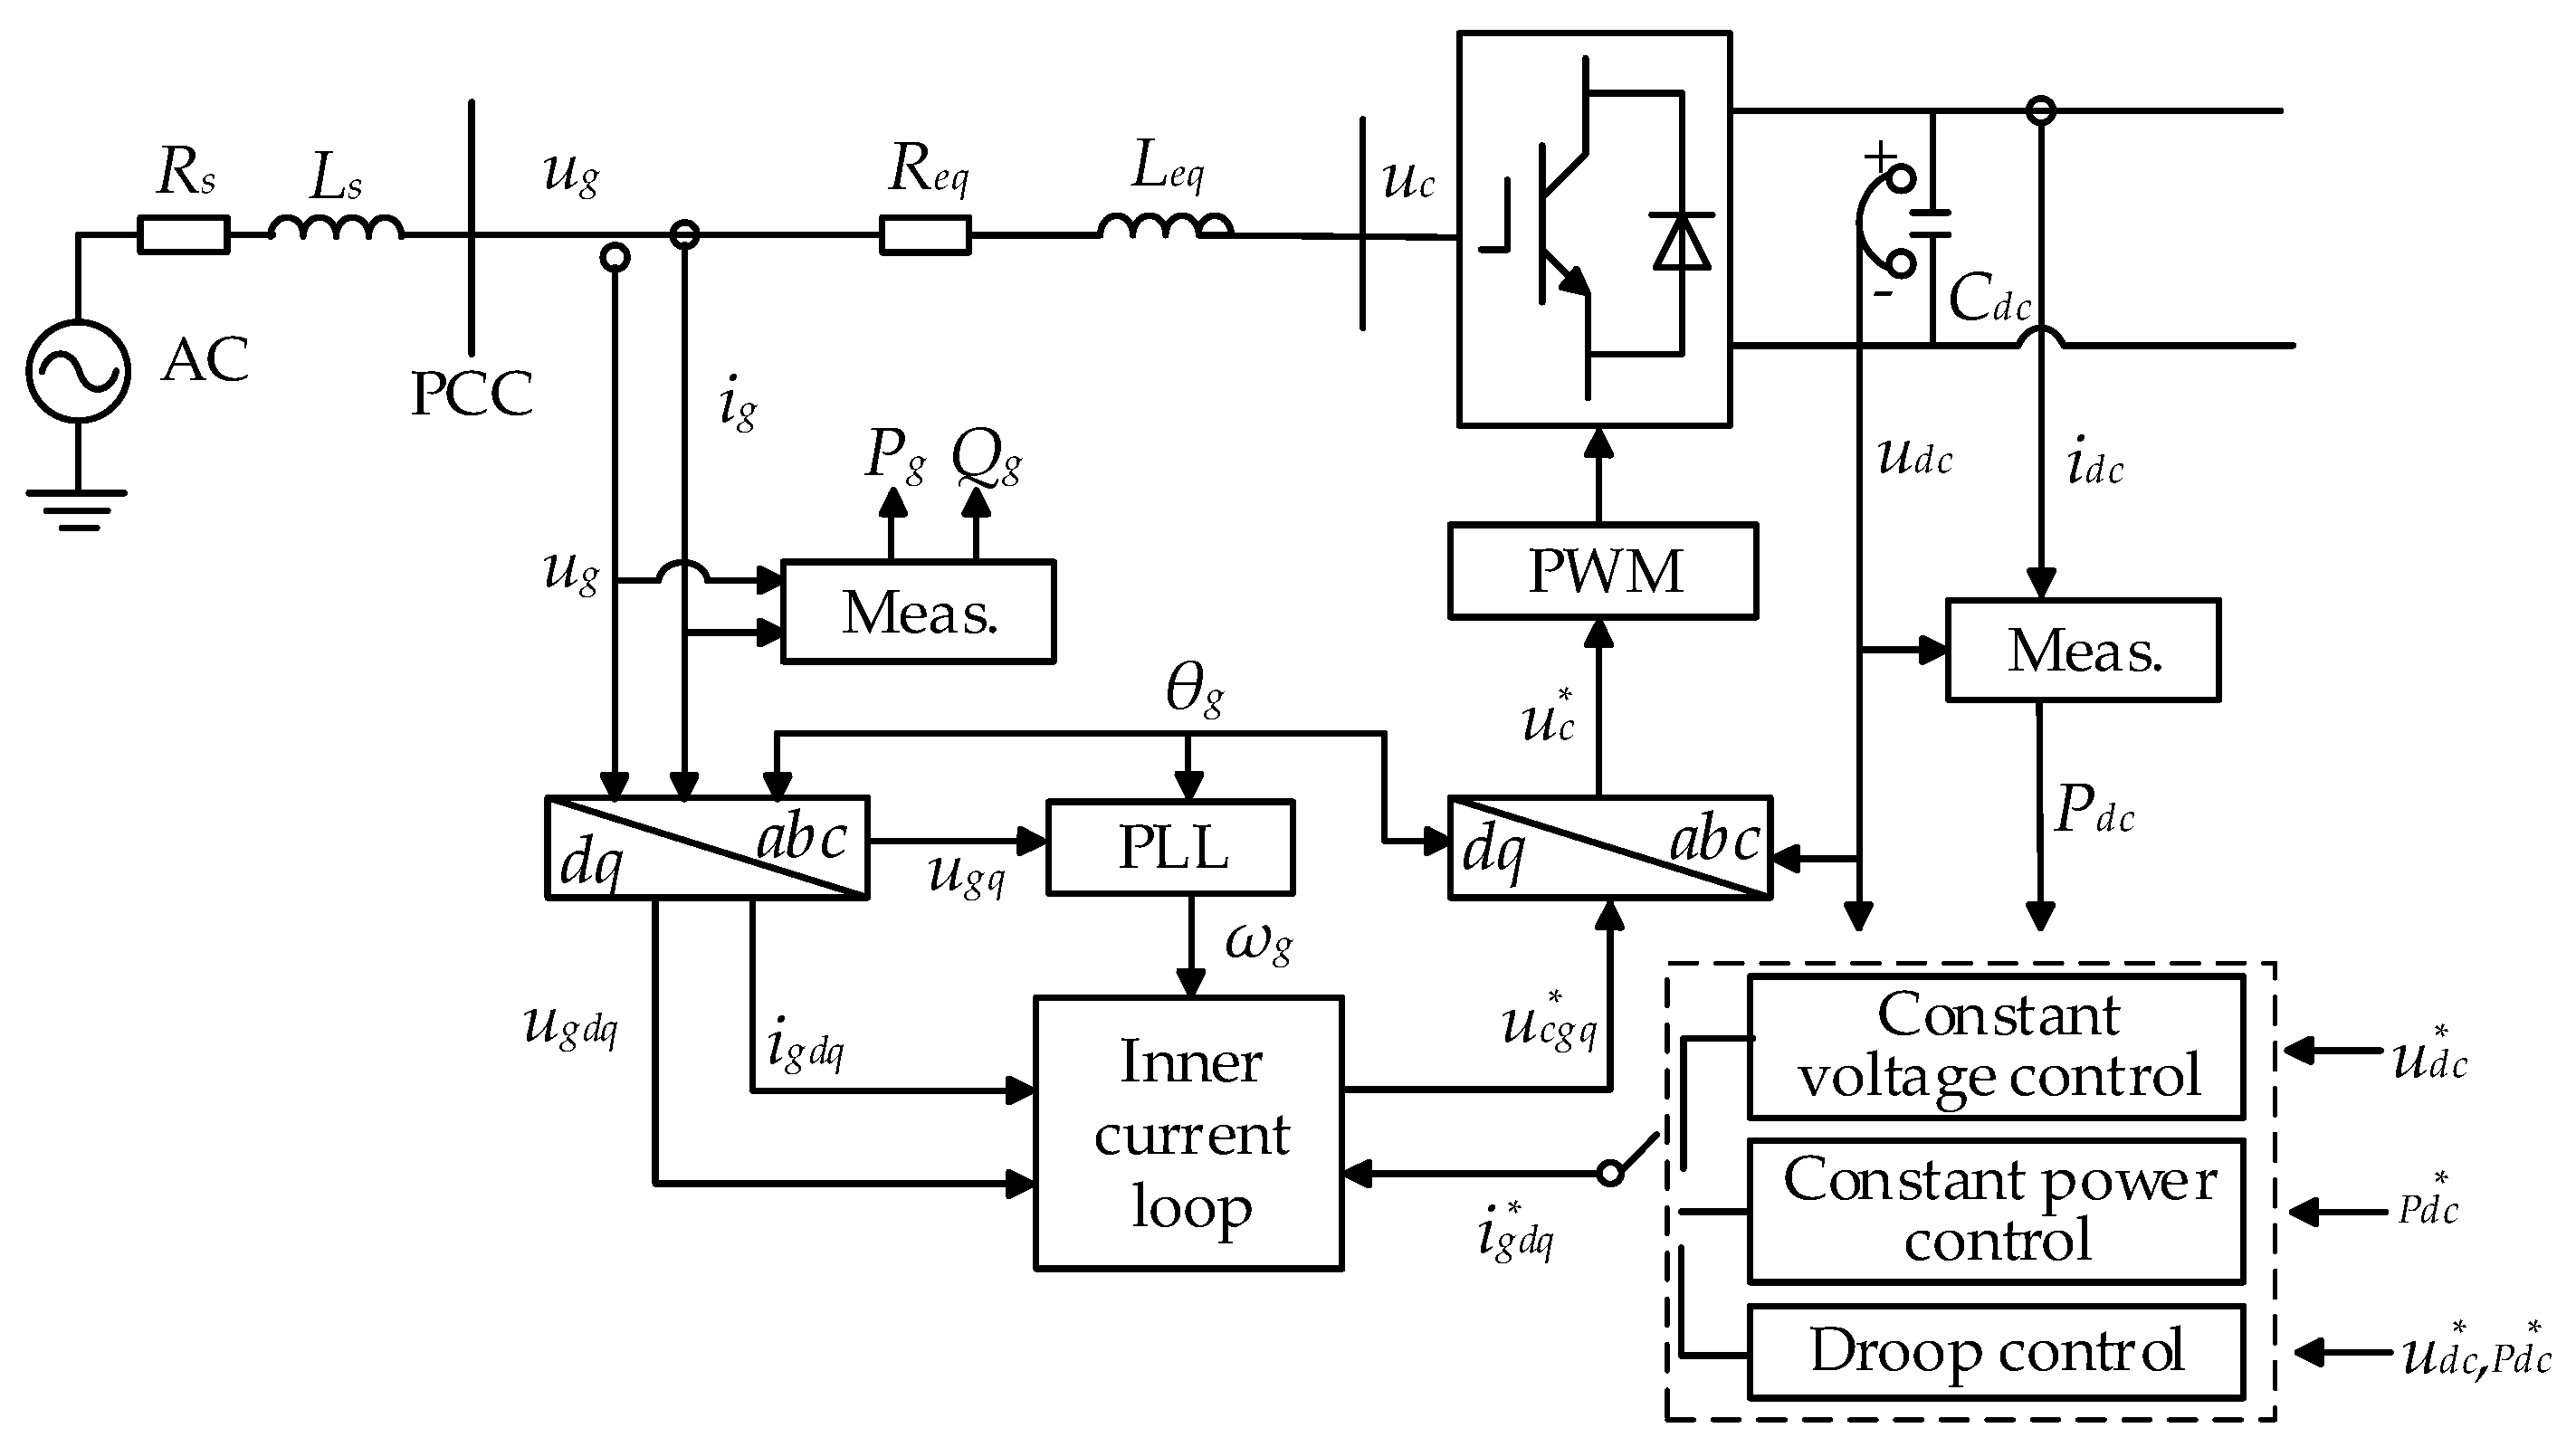
Figure 1. The main diagram and control system of a VSC.
Energies 17 00041 g001
Figure 2. Generalized power flow model for VSC.
Energies 17 00041 g002
Figure 3. Simple two-terminal DCDN.
Energies 17 00041 g003
Figure 4. Influence of control strategy adjustment on power flow.
Energies 17 00041 g004
Figure 5. Flow chart of the PLPF calculation for one overloaded VSC.
Energies 17 00041 g005
Figure 6. General flow chart of the PLPF calculation.
Energies 17 00041 g006
Figure 7. Single diagram of a realistic DCDN in Suzhou, China.
Energies 17 00041 g007
Figure 8. Calculation results of nodal voltages in the situation with no VSC overload.
Energies 17 00041 g008
Figure 9. Calculation results of nodal voltages in the situation with one overloaded VSC (1.2 times).
Energies 17 00041 g009
Figure 10. Calculation results of nodal voltages in the situation with one overloaded VSC (increased by 20%).
Energies 17 00041 g010
Figure 11. Three-terminal DCDN.
Energies 17 00041 g011
Figure 12. Calculation results of nodal voltages in the situation with two overloaded VSCs.
Energies 17 00041 g012
Figure 13. Calculation results of nodal voltages in the situation with two overloaded VSCs (increased by 55%).
Energies 17 00041 g013
Table 1. Parameters of equivalent line for different control strategies.
Control ModeVoltage of Ideal SourceLine ResistanceEquivalent Nodal Power
Droop controlReference voltageProduct of droop coefficient and reference voltageNegative reference power
Constant-voltage controlReference voltage0Negative maximum power
Constant-power controlReference voltageNegative reference power
Table 2. Conditions for each action scenario.
ScenarioNo Overloaded VSCsOnly VSC1 OverloadVSC1 and VSC2 Overload
ConditionsP1 < P1,max, P2 < P2,max, P3 < P3,maxP1 = P1,max, P2 < P2,max, P3 < P3,maxP1 = P1,max, P2 = P2,max, P3 < P3,max
Table 3. Calculation results of VSC power in the situation with no VSC overload.
AlgorithmVSC1VSC2
Power (MW)Error (%)Power (MW)Error (%)
PFC3.3457-4.5612-
LPFC3.30651.174.50051.33
Table 4. Calculation results of VSC power in the situation with one overloaded VSC (1.2 times).
AlgorithmVSC1VSC2
Power (MW)Error (%)Power (MW)Error (%)
PFC4.5461-5.0000-
LPF in [16]3.961012.875.40258.50
PLPFFirst round3.961012.875.40258.50
Second round4.36414.035.00000
Table 5. Calculation results of VSC power in the situation with one overloaded VSC (increased by 20%).
AlgorithmVSC1VSC2
Power (MW)Error (%)Power (MW)Error (%)
PFC4.5461-5.0000-
LPF in [16]3.668719.35.839116.78
PLPFFirst round3.668719.35.839116.78
Second round4.54620.00215.00000
Table 6. Comparison of bisection algorithm and PLPF algorithm (DCDN in Suzhou).
AlgorithmProportion of Power Variation in Stage 1Number of IterationsCalculation Time
Proposed PLPF0.3421150.032 s
Bisection algorithm in [19]0.342120.057 s
Table 7. Parameters of VSCs.
VSCDroop CoefficientReference PowerVSC Capacity
VSC10.1 kV/MW6 MW10 MW
VSC20.1 kV/MW6 MW10 MW
VSC30.1 kV/MW4 MW10 MW
Table 8. Calculation results of VSC power in the situation with one overloaded VSC (Three-terminal DCDN).
AlgorithmVSC1VSC2VSC3
Power
(MW)
Error (%)Power
(MW)
Error (%)Power
(MW)
Error (%)
PFC8.6128-10.0000-7.1297-
LPF8.50601.24%10.02735.467.02201.51
PLPFFirst round8.50601.24%10.02735.467.02201.51
Second round8.63350.2410.000007.15080.29
Table 9. Calculation results of VSC power in the situation with two overloaded VSCs.
AlgorithmVSC1VSC2VSC3
Power
(MW)
Error (%)Power
(MW)
Error (%)Power
(MW)
Error (%)
PFC10.0000-10.0000-8.6450-
LPF9.60873.91%11.596615.97%7.428214.07
PLPFFirst round9.60873.91%11.596615.97%7.428214.07
Second round10.1031010.000008.59720.55
Third round10.0000010.000008.68200.42
Table 10. Comparison of bisection algorithm and PLPF algorithm (Three-terminal DCDN).
AlgorithmProportion of Power Variation in Stage 1Proportion of Power Variation in Stage 2Number of IterationsCalculation Time
PLPF0.62110.358830.143 s
Bisection algorithm in [19]0.62110.3588270.293 s
Disclaimer/Publisher’s Note: The statements, opinions and data contained in all publications are solely those of the individual author(s) and contributor(s) and not of MDPI and/or the editor(s). MDPI and/or the editor(s) disclaim responsibility for any injury to people or property resulting from any ideas, methods, instructions or products referred to in the content.