1. Introduction
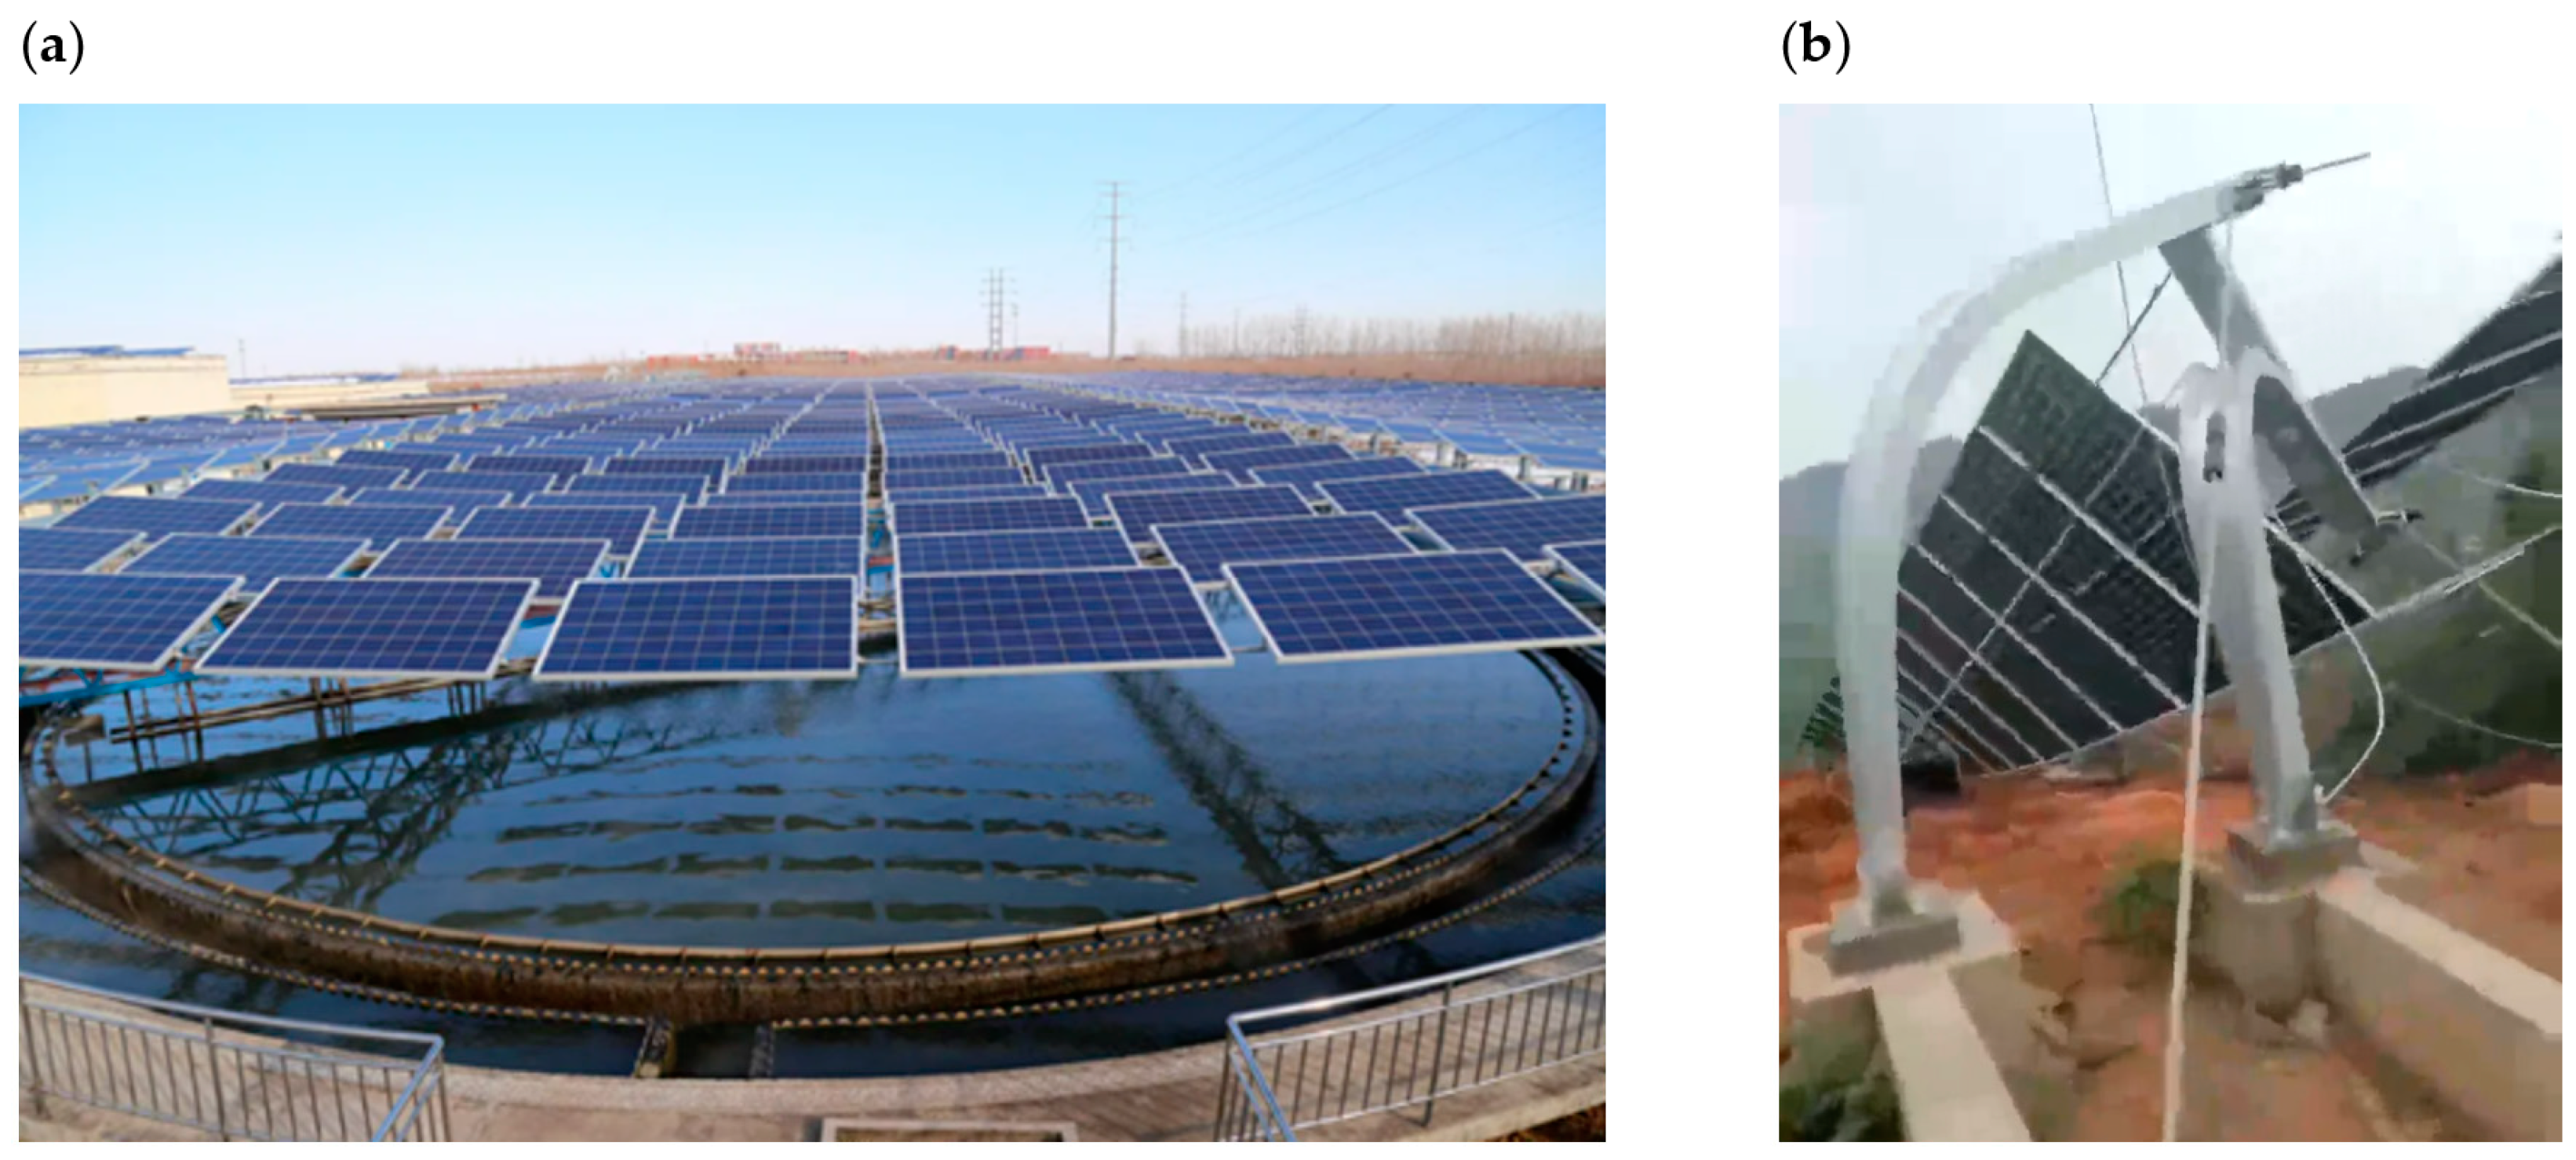
Under the background of global climate change and energy crisis, the photovoltaic power-generation market has experienced rapid growth. By 2022, the installed capacity of solar power in China reached 393 million kilowatts, and this number is expected to continue booming in the near future. However, with the rapid development of photovoltaic power plants, high-quality construction land such as flat ground and rooftops is quickly occupied. Therefore, solar plants are looking to new construction sites, e.g., water areas and undeveloped mountains. Traditional beam-supported structures are difficult to fit into such complex terrains; therefore, cable-suspended photovoltaic support structures have become increasingly popular in recent years due to their good spatial compatibility and terrain adaptability (
Figure 1a). Because of their large span features, cable-suspended PV power plants can also be combined with other industries, e.g., fishponds or orchards, to improve their economic efficiency. However, a shortcoming of this cable-suspended PV system is also obvious. Its lightweight and low-damping characteristics increase its sensitivity to wind action, and wind-induced module cracking and structure fatigue are frequently reported (
Figure 1b). Therefore, it is of great importance and necessity to study the wind effects of such long-span cable-suspended photovoltaic systems when aiming to providing reasonable guidance for wind-resistant design.
Most of the previous studies focused on the wind effects of rigidly (beam-column) supported photovoltaic arrays on the ground and on the roofs of buildings. For the ground-mounted photovoltaic array, Warsido et al., Kurt Strobel et al., and Chowdhury M. J. et al. [
1,
2,
3] experimentally investigated the wind loads of photovoltaic arrays mounted on the ground and found that the sheltering effect between different rows of PV modules is significant as well as that the first windward row may be subjected to the maximum wind pressure and wind suction. Aly et al. [
4] explored the impact of scale effects through wind tunnel experiments and CFD simulations. The results showed that the mean wind pressure was not influenced by the model size, but the peak wind pressure was affected by both the geometric scale and incoming turbulence. Shademan et al. [
5] used the detached eddy simulation (DES) method to numerically explore the influencing factors of wind load on ground photovoltaic modules. Their study indicated that an increase in height above the ground increases the average wind loads on the photovoltaic modules. For rooftop photovoltaic arrays, Radu et al. [
6,
7] conducted experiments on a solar collector model placed on flat roofs and found that both the first row of the photovoltaic module and the building itself had a sheltering effect on the internal (e.g., central) modules of the array, leading to a significant reduction in wind loads. Kopp et al. [
8] studied the aerodynamic characteristics of wind loads on rooftops’ photovoltaic arrays and indicated that rooftop photovoltaic arrays had more complex aerodynamic characteristics compared to ground-mounted ones. In a following study, Kopp and Pratt [
9] used the particle image velocimetry (PIV) technique to study the flow field characteristics around photovoltaic panels on flat roofs and revealed that the mean flow field above the roof insignificantly changed after the installation of photovoltaic modules, but it had a greater impact on the turbulence in the separation bubble above and around the photovoltaic modules.
For those newly developed cable-suspended photovoltaic systems, there are few studies regarding their wind effects. Tamura et al. [
10,
11] carried out a set of wind tunnel tests to study the aeroelastic characteristics of a solar wing system under different incoming flows. He et al. [
12] investigated the wind-induced vibration characteristics of a cable-suspended photovoltaic array through aeroelastic tests and proposed measures to suppress wind-induced structural responses. Liu and Li et al. [
13] conducted wind tunnel aeroelastic tests on a cable-suspended photovoltaic system with a span of 33 m and proposed a vibration control scheme for the structure. Their study showed that the maximum gust loading factors for each row of photovoltaic panels fell between 1.7 and 2.5 when there were no stability cables. Xu et al. [
14] used an aeroelastic wind tunnel test to study the influence of the wind speed, module tilt angle, and cable pretension vibration on the vibration response of a single-row, cable-suspended PV structure without regard to the wind load interference effect from other PV modules in an array. Most of the previous studies focused on the wind-induced vibration characteristics and vibration control method, but few of them presented detailed suggestions for wind-resistant design applications of such a cable-suspended photovoltaic structure.
For a large cable-suspended PV plant, which usually costs billions of CNY, the reasonable estimation of the wind load action is critical, as it not only affects the safe operation of the power plant but also directly determines the economy of the design and construction. Therefore, this study looks into the wind effects of the long-span cable-suspended photovoltaic structure and attempts to provide reasonable recommendations for key parameters (e.g., shape coefficient, gust loading factor, etc.) in wind-resistant design. To achieve this research objective, wind tunnel tests were conducted on four PV arrays with different lengths and widths. The distribution characteristics of the array’s wind load were characterized by the shape factor. We used the reduction factor of the wind load by the ratio of the shape factor of each row to the maximum shape factor to evaluate the sheltering effects between different row of PV modules. The results are also compared with the code provisions of China NB/T 10115-2018 [
15]. Based on finite element simulation analysis, the gust loading factor was calculated by taking into account the resonance response, background response, and their coupling terms simultaneously through the consistent load–response correlation (CLRC) method.
2. Wind Tunnel Test Setup
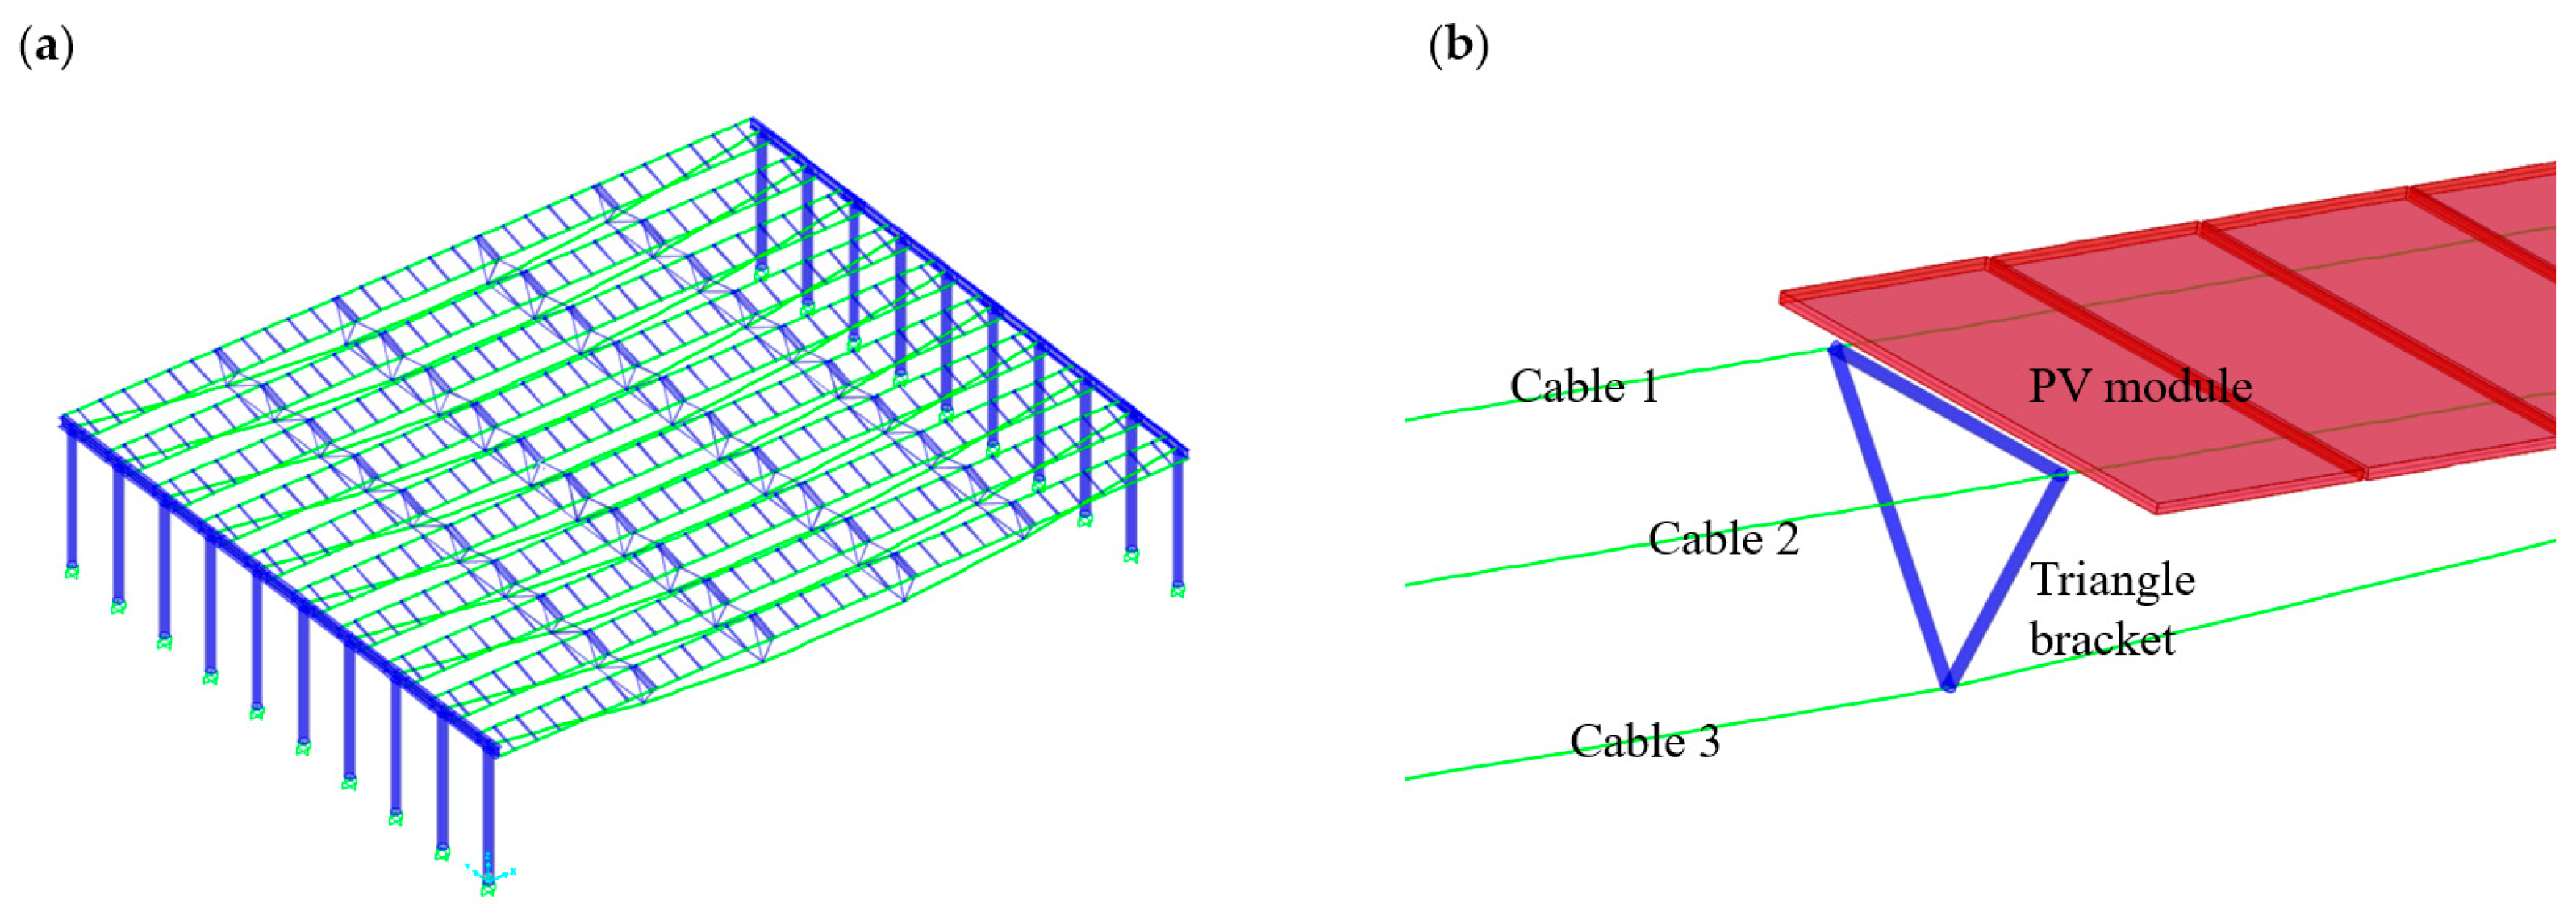
The prototype of the studied cable-suspended photovoltaic array had a span of 26.4 m and a height of 4 m, as shown in
Figure 2a. It included 10 rows and 24 columns of photovoltaic modules, with a row spacing of 0.82 m and a fixed tilt angle (
) of 15°. Each module had dimensions of 1950 mm (length) × 992 mm (width) × 50 mm (depth) and was independently fixed to the cables through U-shaped rigid supports at four corners. The cable-supported structure consisted of three cables and triangular truss structures, as shown in
Figure 2b. The pretensions for Cable1, Cable2, and Cable3 were 120 kN, 120 kN, and 30 kN, respectively. To investigate the influence of the array configuration on the wind load distribution, we designed four PV array models with different widths and lengths. The detailed model parameters and wind tunnel test cases are listed in
Table 1.
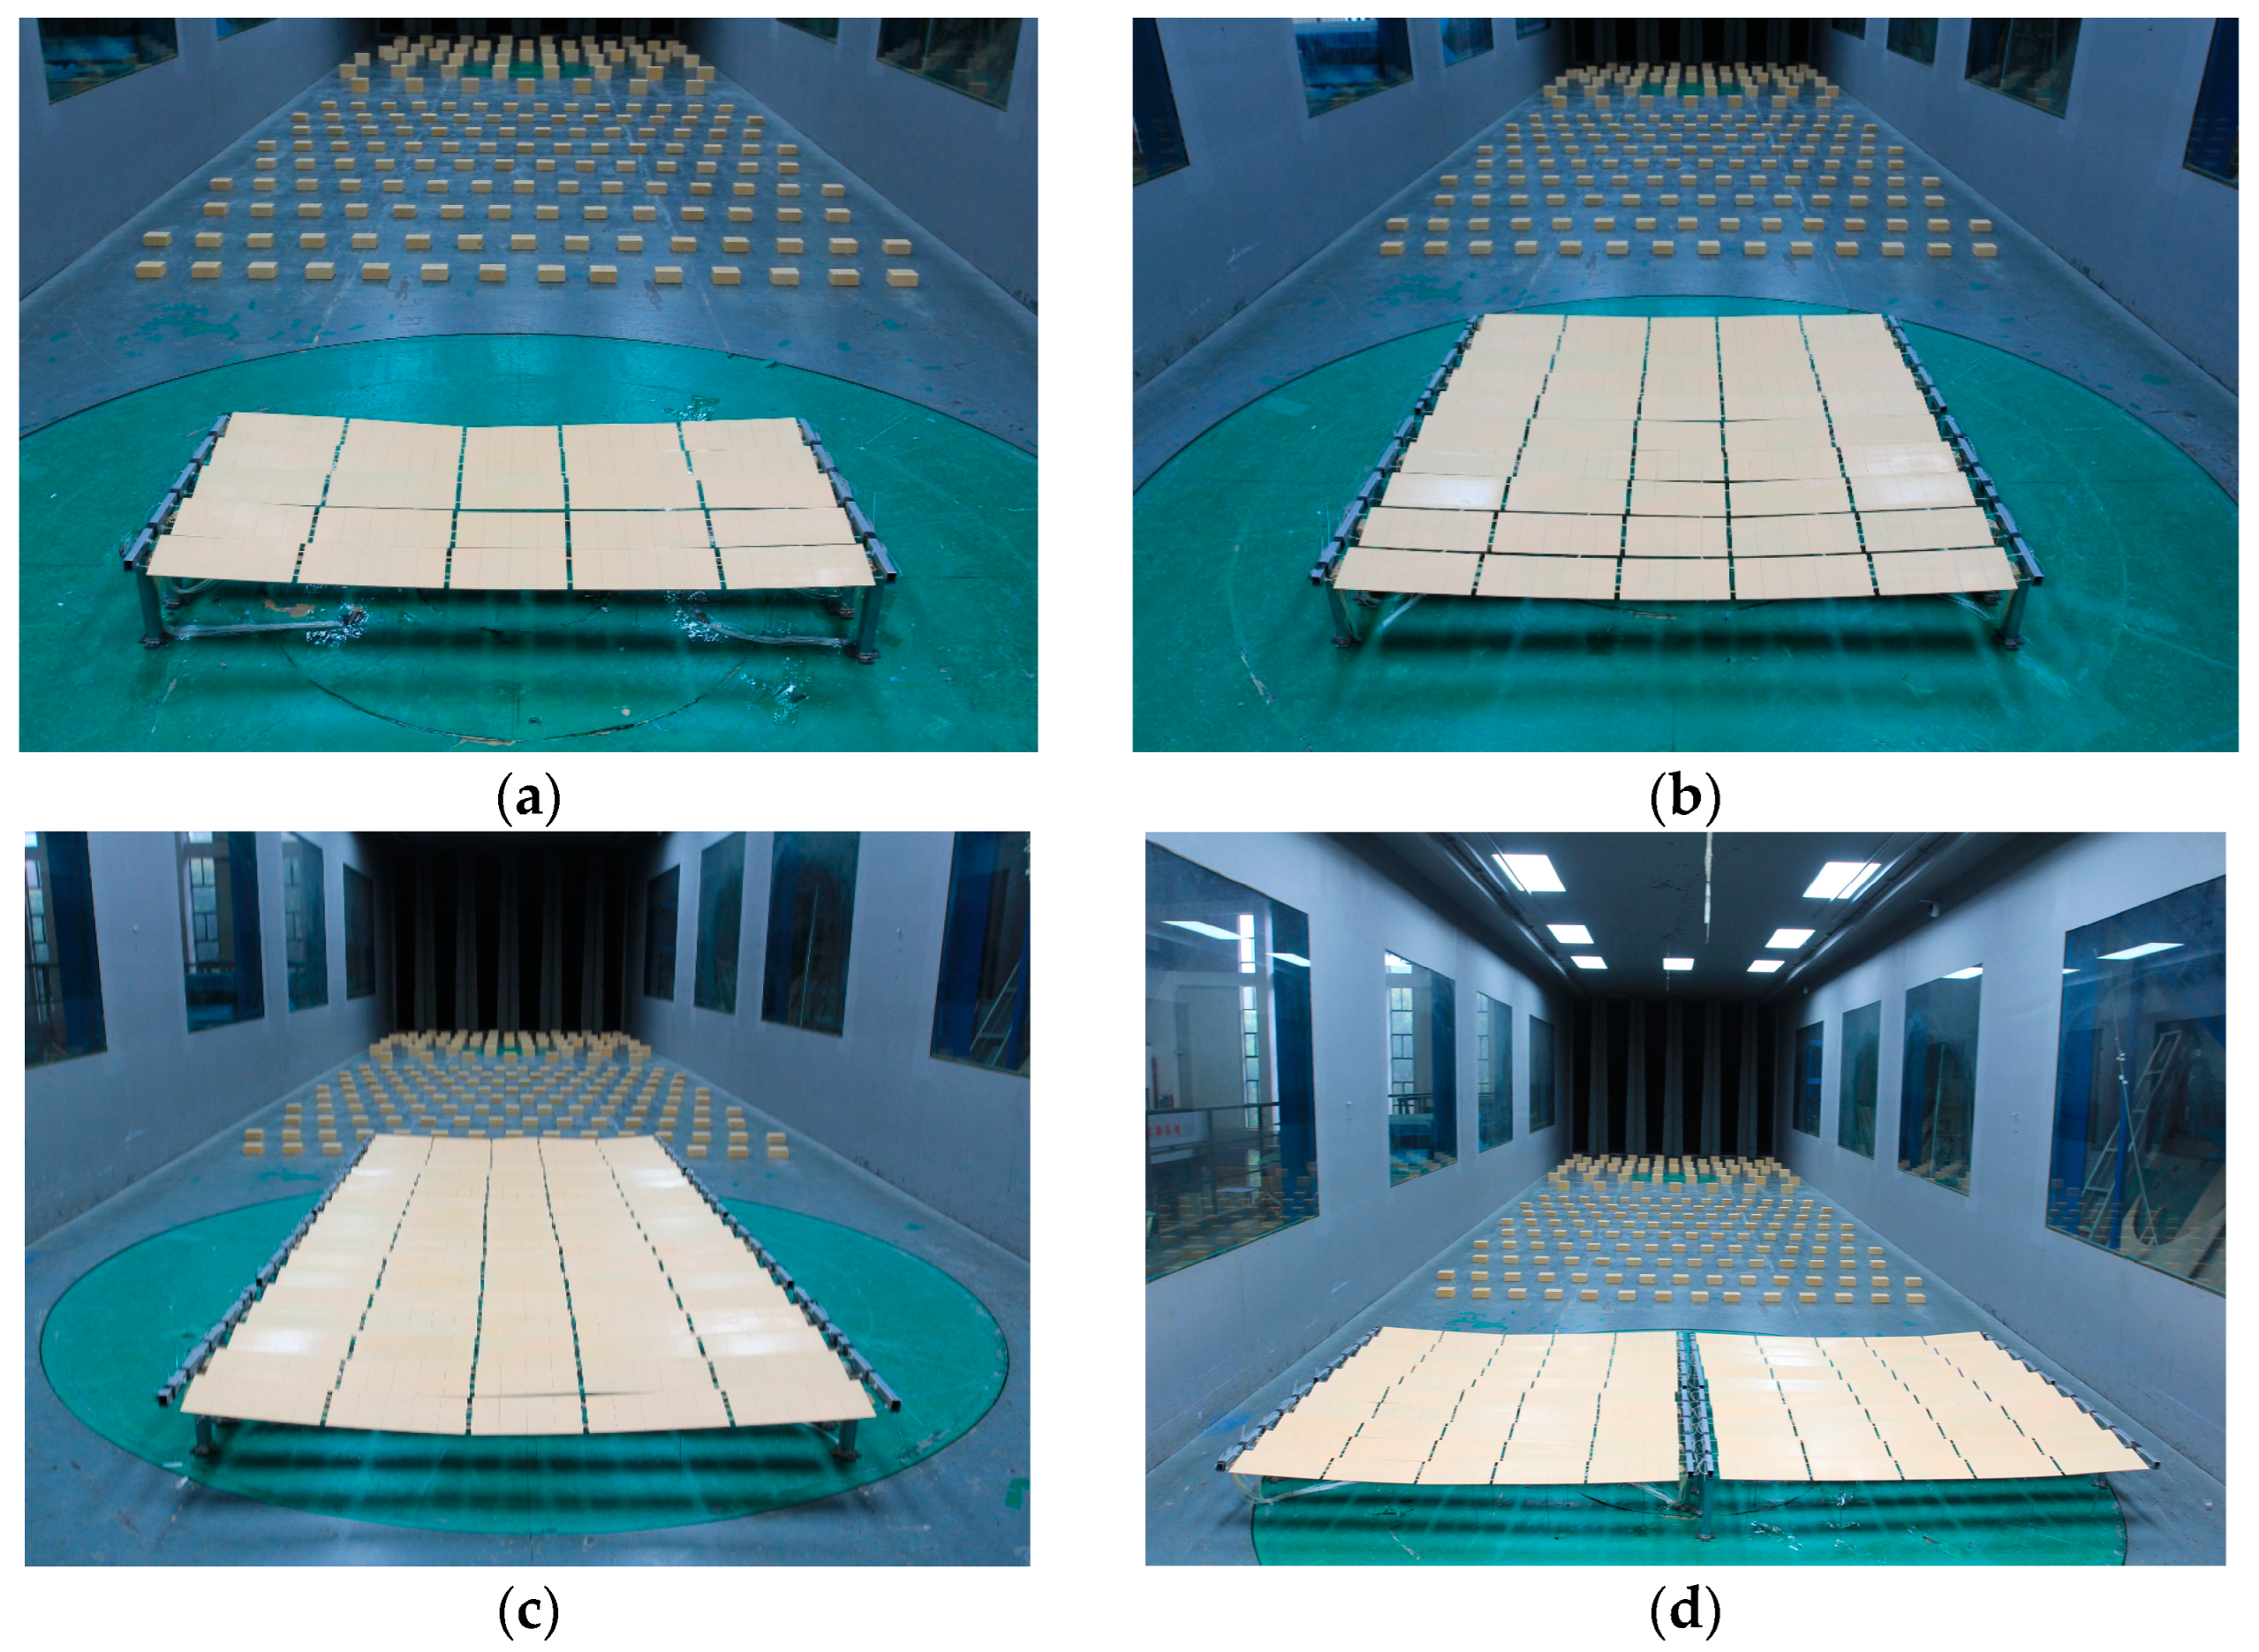
A model with a geometry scale of 1:17 was investigated in the wind tunnel at Zhejiang University, China, as shown in
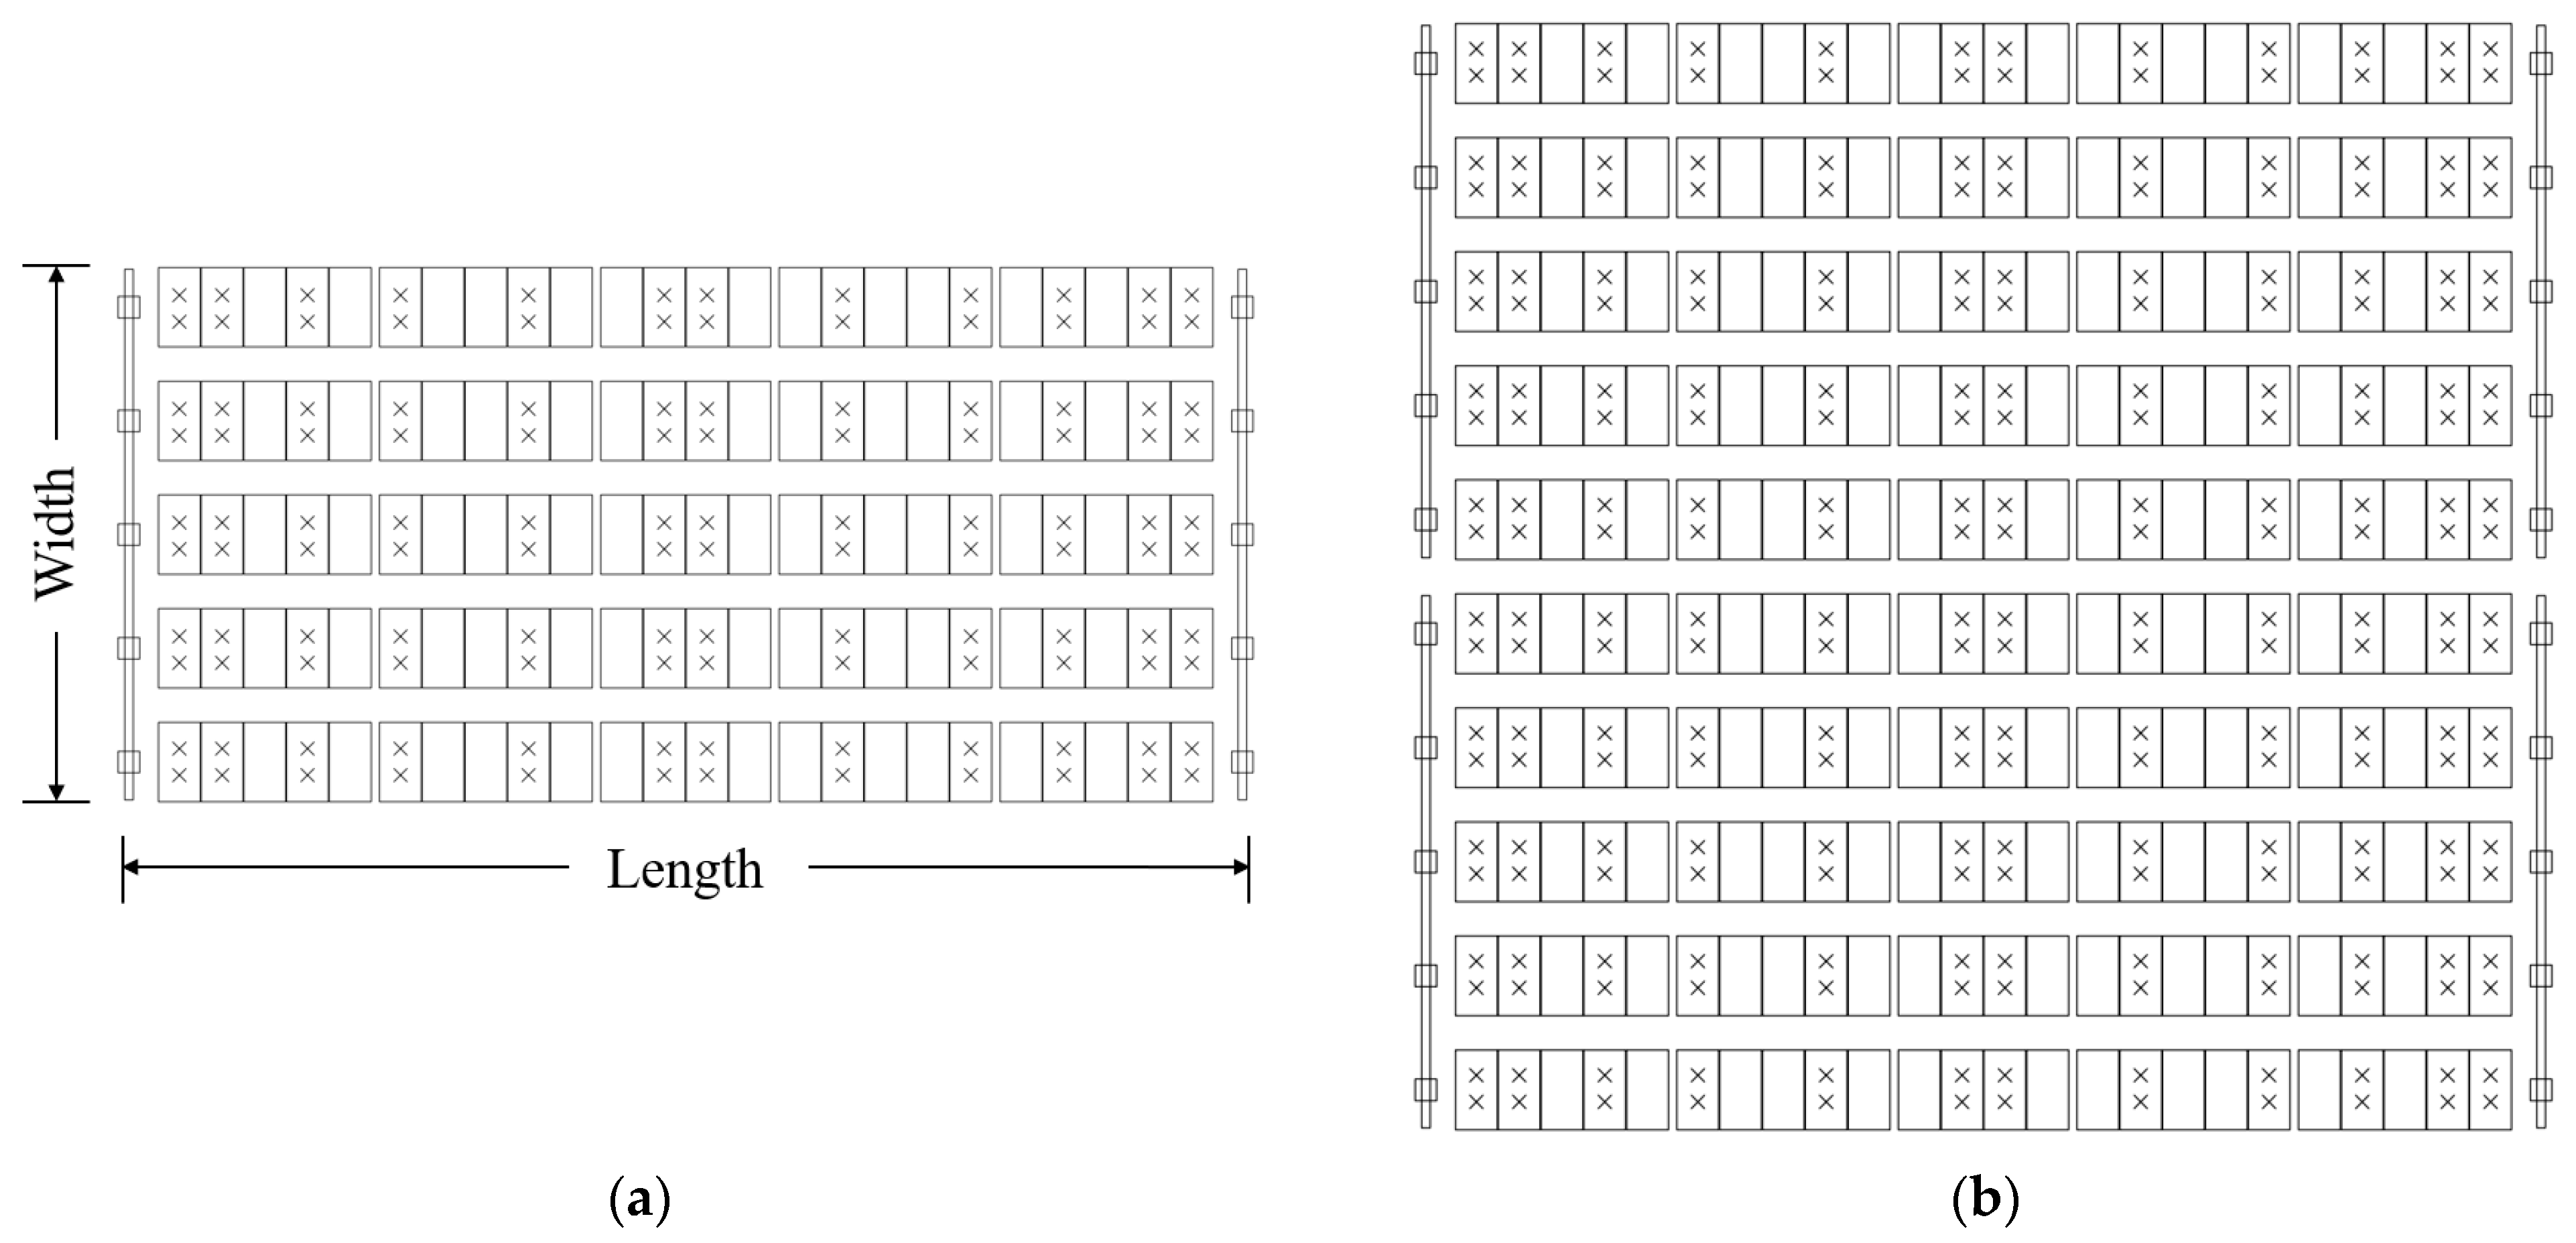
Figure 3. The module was made of acrylonitrile butadiene styrene (ABS), and the cables were constructed by rigid rods that could represent the initial structural deflection but restrained the structure vibration during the test. The layout of pressure taps on the test model is shown in
Figure 4 (only Cases 1 and 2 are given herein; others were similar). The pressure taps were mounted on both the top and bottom surfaces of the photovoltaic modules to obtain the net wind loads. The maximum blockage ratio of the model in the wind tunnel was less than 5%.
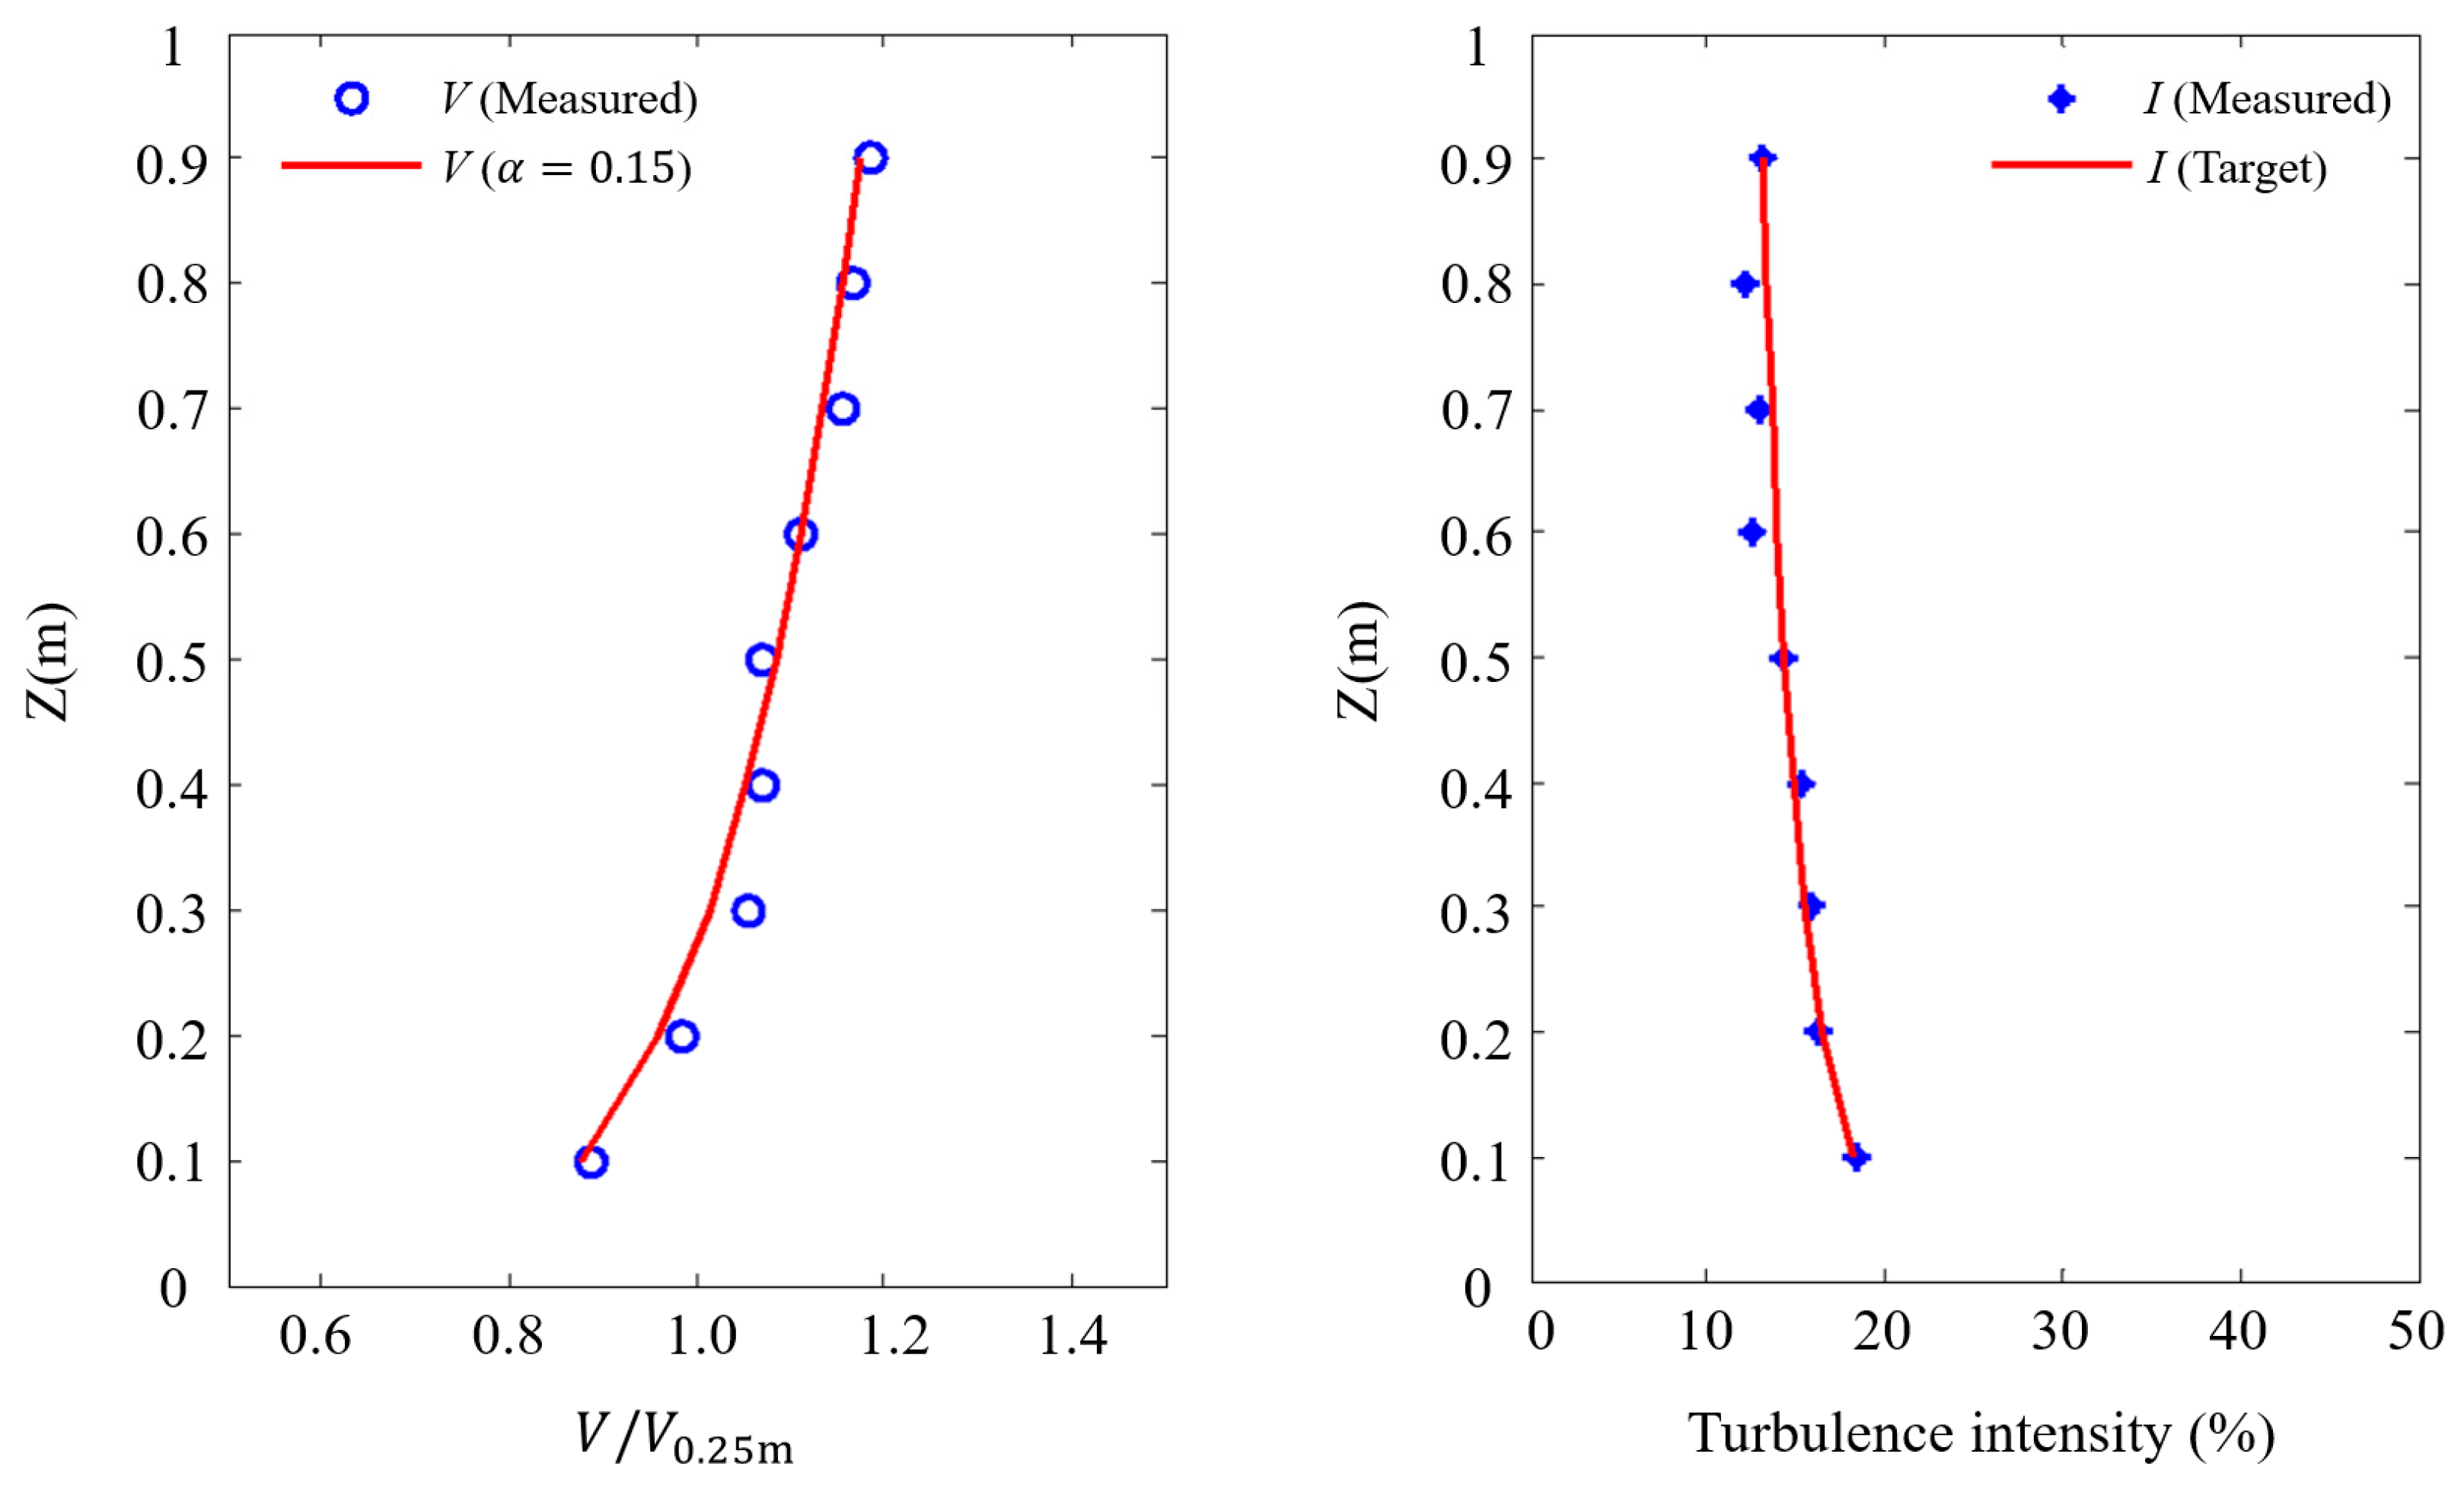
The test was conducted in the ZD-1 wind tunnel laboratory at Zhejiang University, China. A boundary layer wind profile, per Terrain Category B in the load code of China (GB 50009-2012), was simulated at a length scale of 1:17. The experimental mean wind speed at the reference height (i.e., 0.25 m above floor) was about 9 m/s.
Figure 5 compares the normalized experimental wind field with the code provisions (GB 50009-2012) [
16]. Good agreement can be observed for both the mean wind speed profile and the turbulence intensity profile between simulated and code data.
Considering the structural symmetry, the experimental wind directions for Cases 1 and 2 were chosen from 0° to 180°, with an interval of 15°. For comparison purposes, Cases 3 and 4 were only tested at wind directions of 0° and 180°. The definition of wind direction (
) in the experiment is shown in
Figure 6. For each wind direction, the wind pressure signal was sampled at a frequency of 312.5 Hz for 60 s.
The obtained wind pressure was further normalized to the pressure coefficient; thus,
where
is the net wind pressure coefficient at measurement point
on the module surface;
is the net wind pressure value at measurement point
after considering the difference in wind pressure between the top and bottom surfaces;
is the static pressure at the reference point;
is the wind speed at the reference point; and
is the air density. The positive and negative
represent the wind pressure and wind suction in this study, respectively. The maximum wind suction herein represents the maximum absolute value of the negative
.
3. Wind Load Shape Factor
The Chinese code GB 50009-2012 suggests using dimensionless shape factors to characterize the magnitude of the mean wind pressure, and it can be determined from the mean net wind pressure coefficient,
; thus,
where
is the shape factor at measurement point
;
is the height factor of the wind pressure at the reference point; and
is the height factor for the measurement point
. In this study, we used shape factors to describe the wind load distribution.
3.1. Influence of Array Length and Width on Wind Load
To study the spatial distribution of the wind load for photovoltaic arrays,
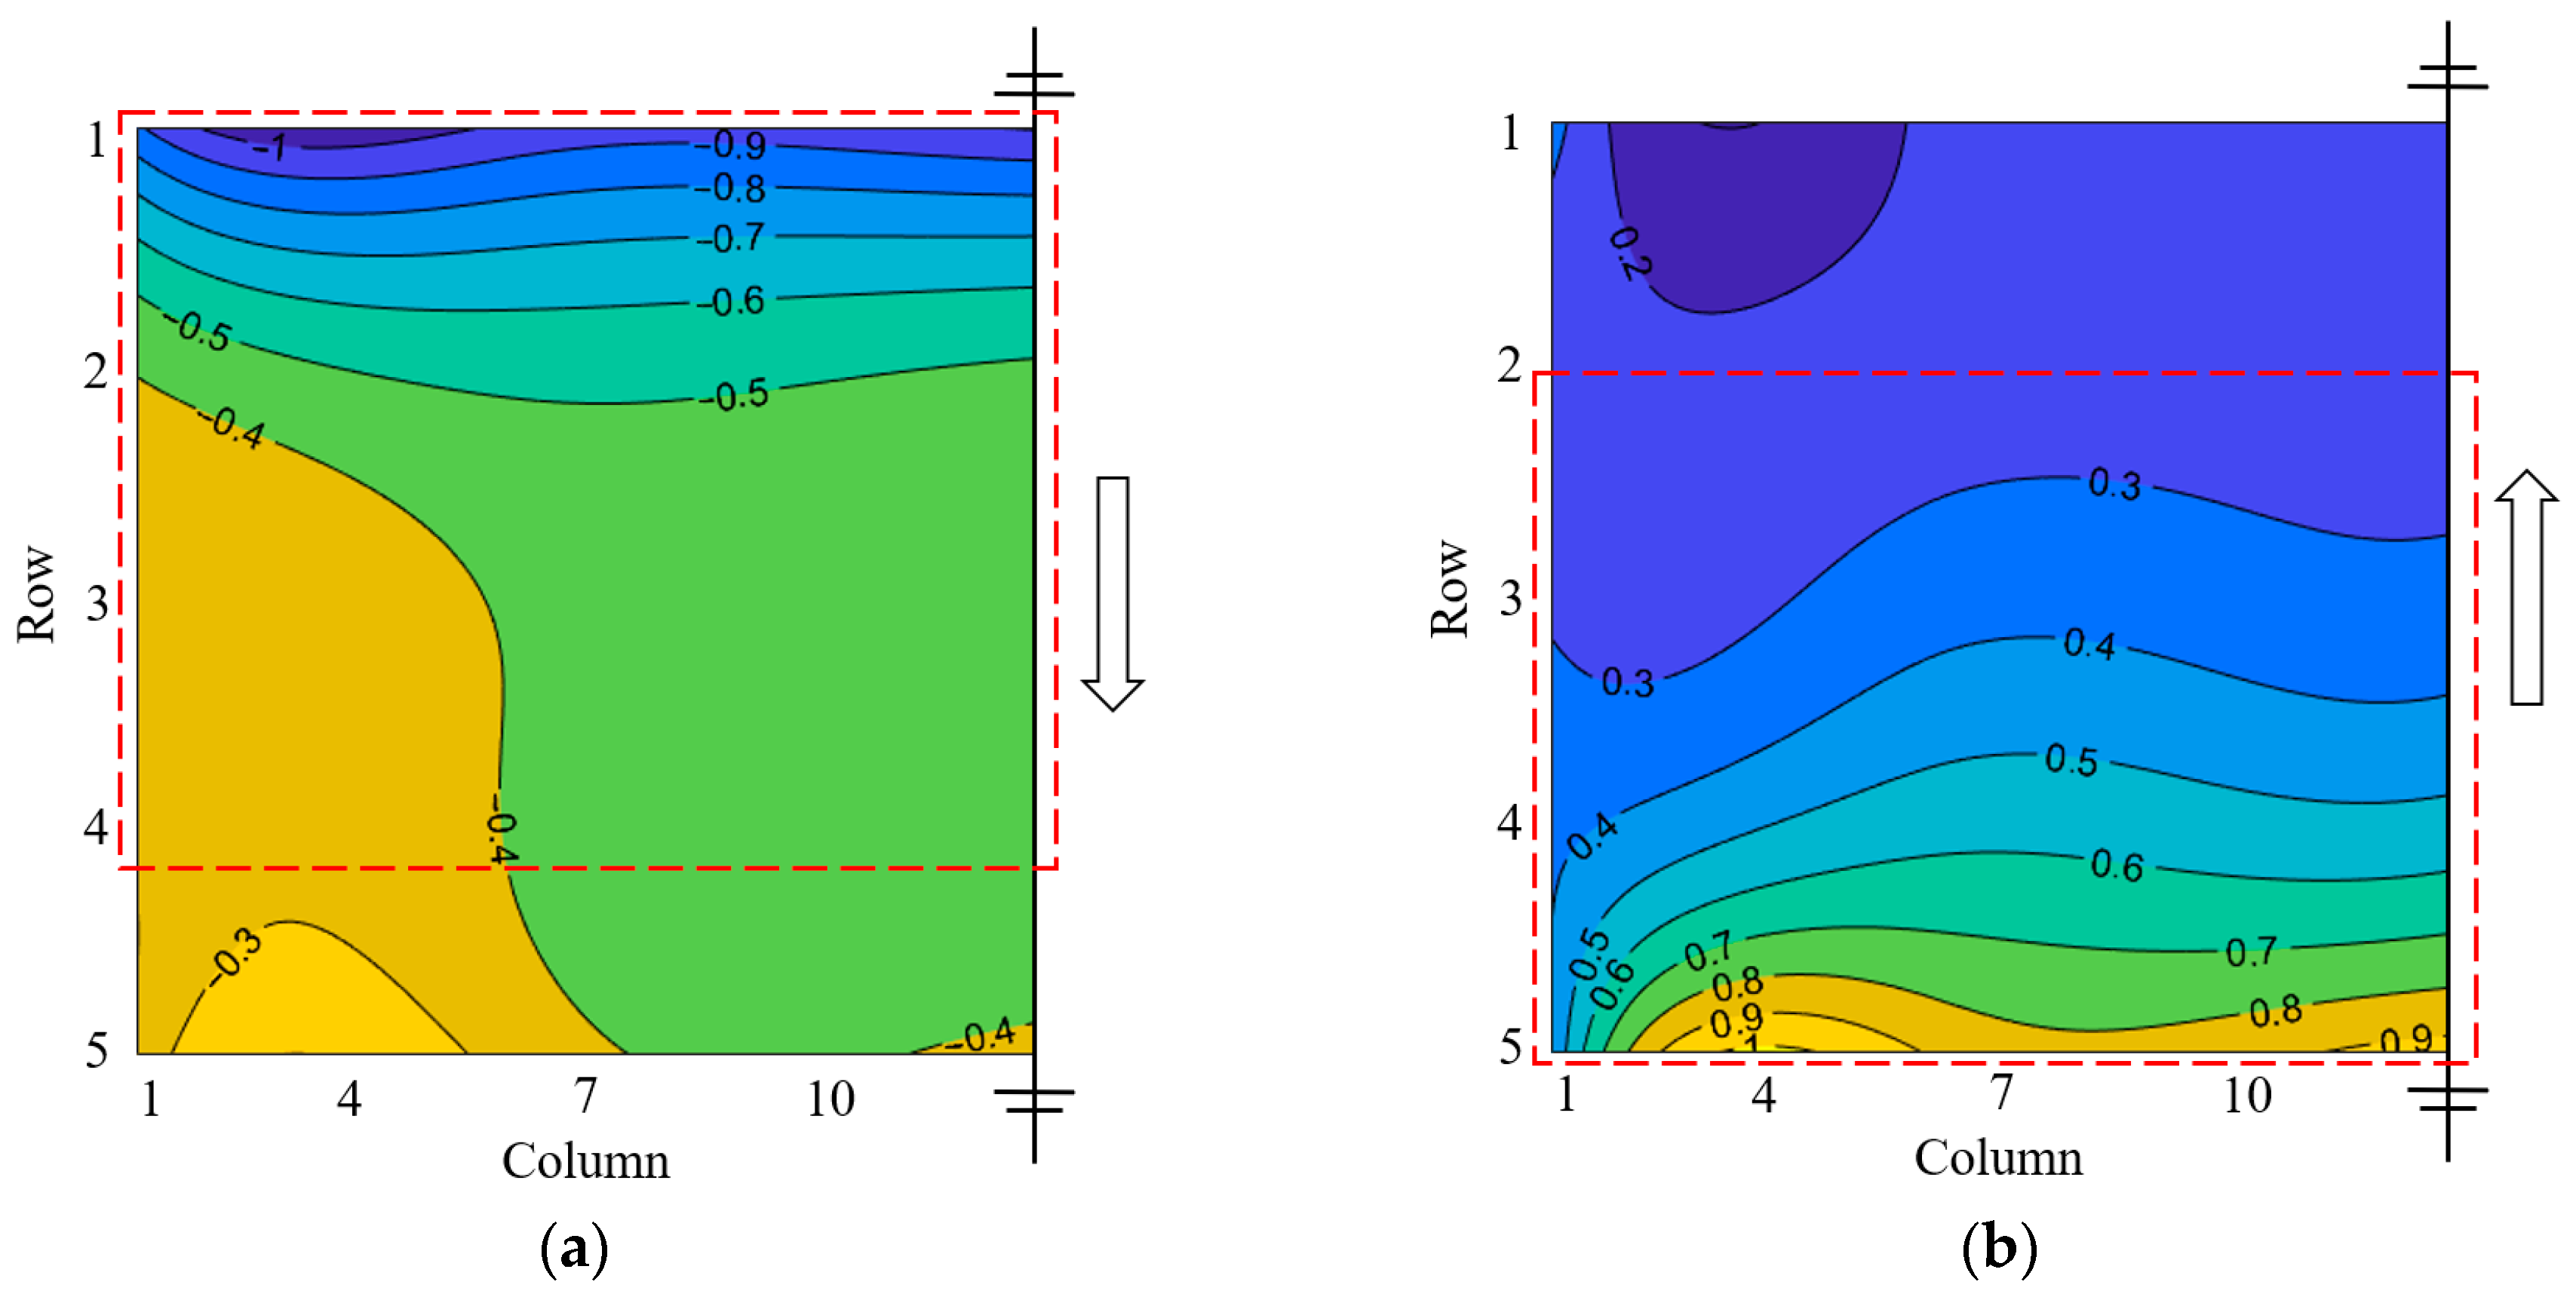
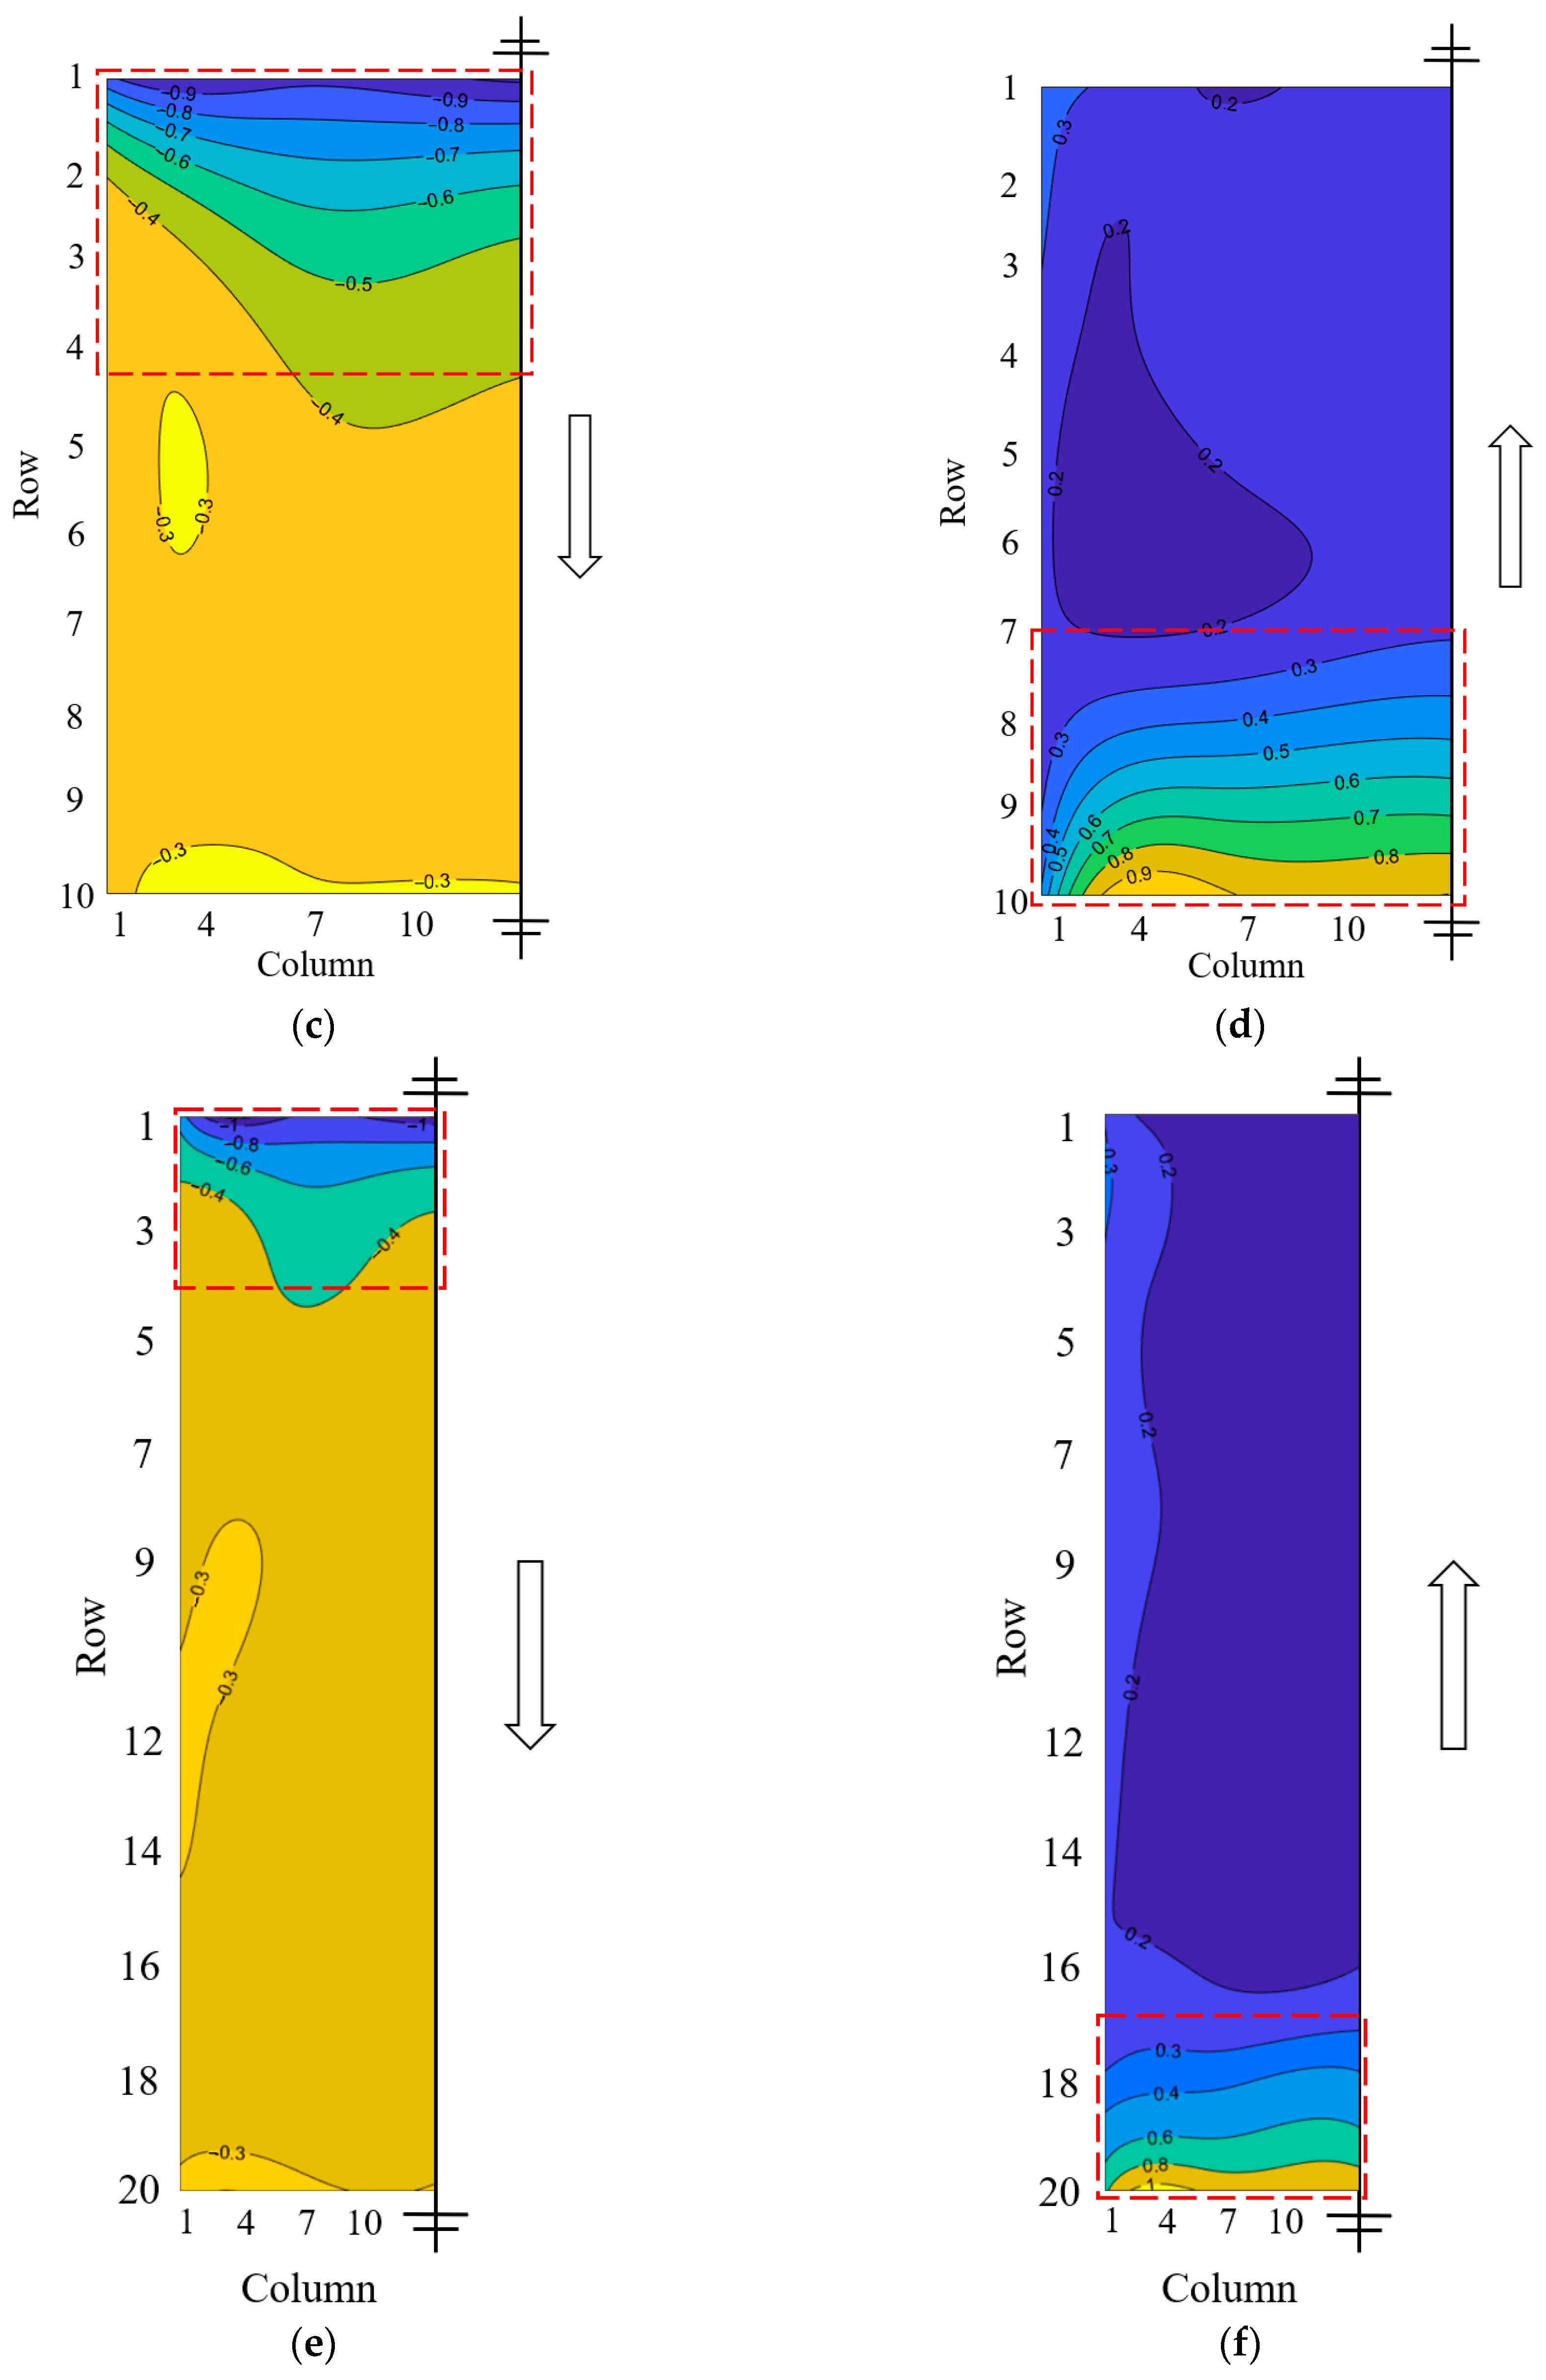
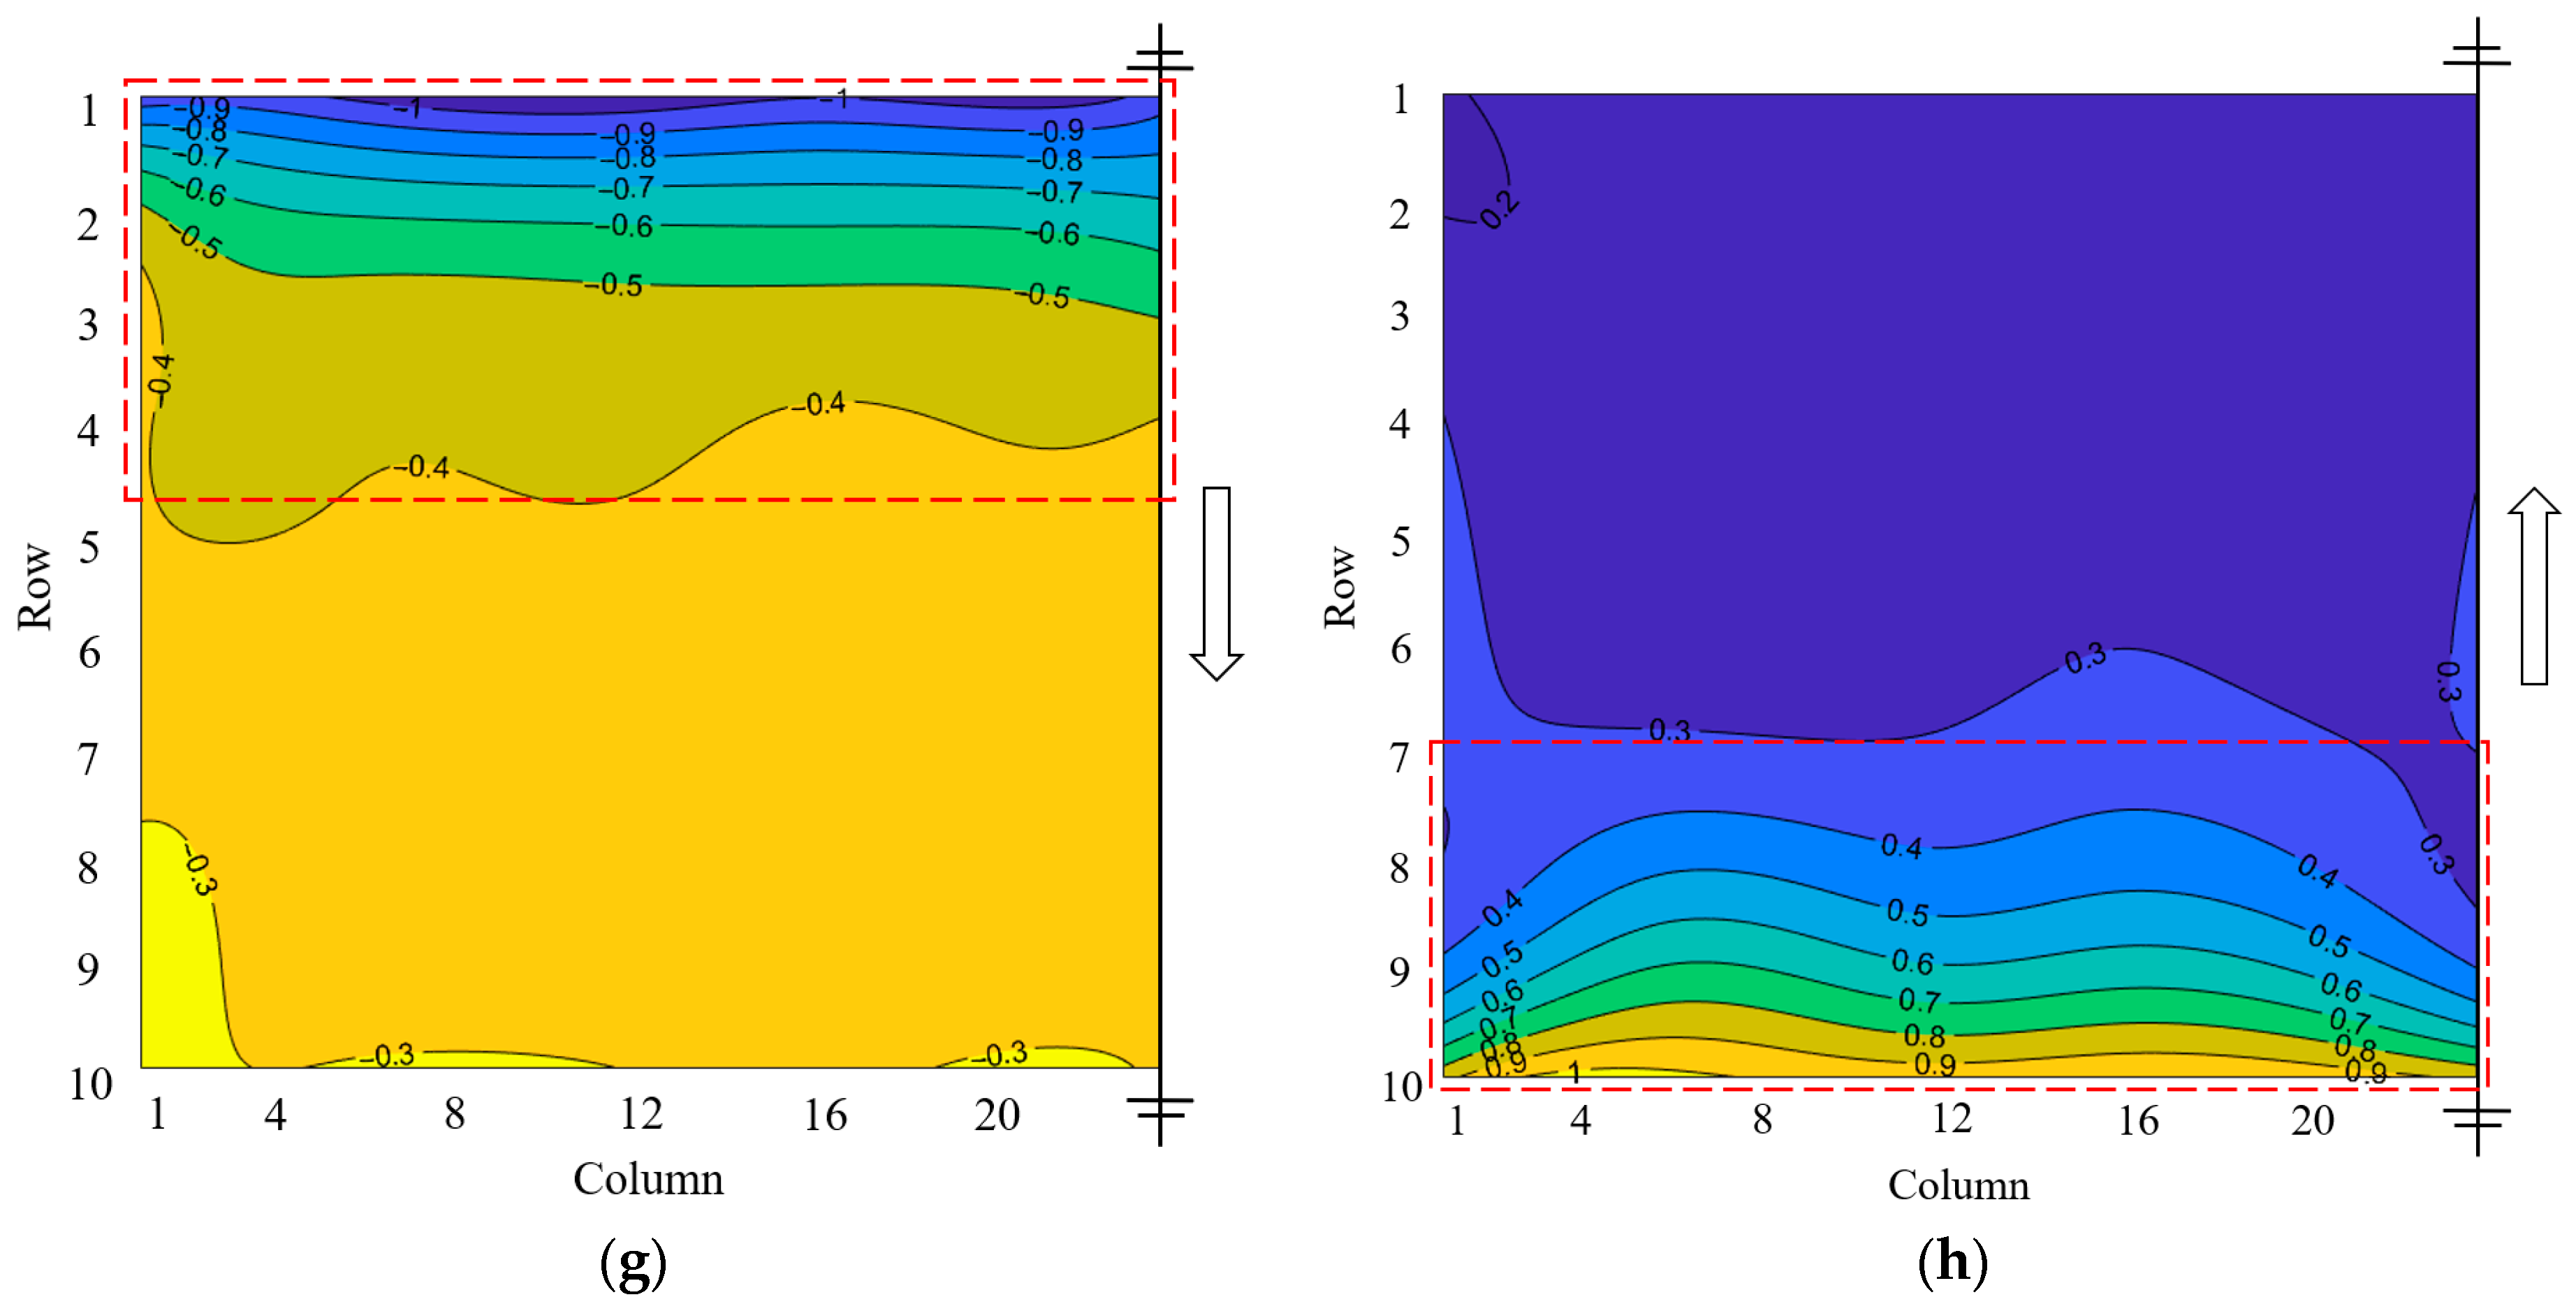
Figure 7 presents the shape factor for Cases 1–4 at two typical wind directions of 0° and 180°. Due to symmetry, the wind load distribution was only plotted on half of each array.
A comparison of Cases 1, 2, and 3 revealed that relatively significant wind suction or pressure mainly appears within the first four rows of the windward area for all cases, and it rapidly decreases along the wind direction in this area due to the sheltering effects of upstream modules. However, for the PV module, beyond the fourth row, relatively small and uniform wind pressure could be observed. The maximum shape factors of wind suction and wind pressure were both found in the windward first row, reaching approximately −1.09 (Row 1 at = 0°) and 1.0 (Row 10 at = 180°), respectively. This wind load distribution pattern remained almost the same with the increase in array length. Comparing the shape factor of Cases 2 and 4 shows that a similar wind load distribution could be observed for the two cases. This indicates that changes in the array width also have little effect on wind load distribution.
To explore the wind load characteristics of the PV array under oblique wind directions,
Figure 8 shows the shape factor distribution of Cases 1 and 2 under two typical oblique wind directions of 30° and 150°. It can be observed that the wind loads on the photovoltaic array rapidly attenuate along the wind direction. For the wind direction of 30°, significant wind suction occurred in the first row (Row 1) and the first column (Column 1), which faced the incoming flow, and the wind loads did not significantly decrease in these windward areas. A similar phenomenon was found for the wind direction of 150°, where the most unfavorable wind loads were in the first row (i.e., Row 5 for Case 1 and Row 10 for Case 2) and the first column (Column 1). Comparing Cases 1 and 2 shows that with an increase in the array length, the unfavorable wind pressure on or suction areas of the outermost windward row or column expand.
3.2. Influence of Wind Direction on Wind Load
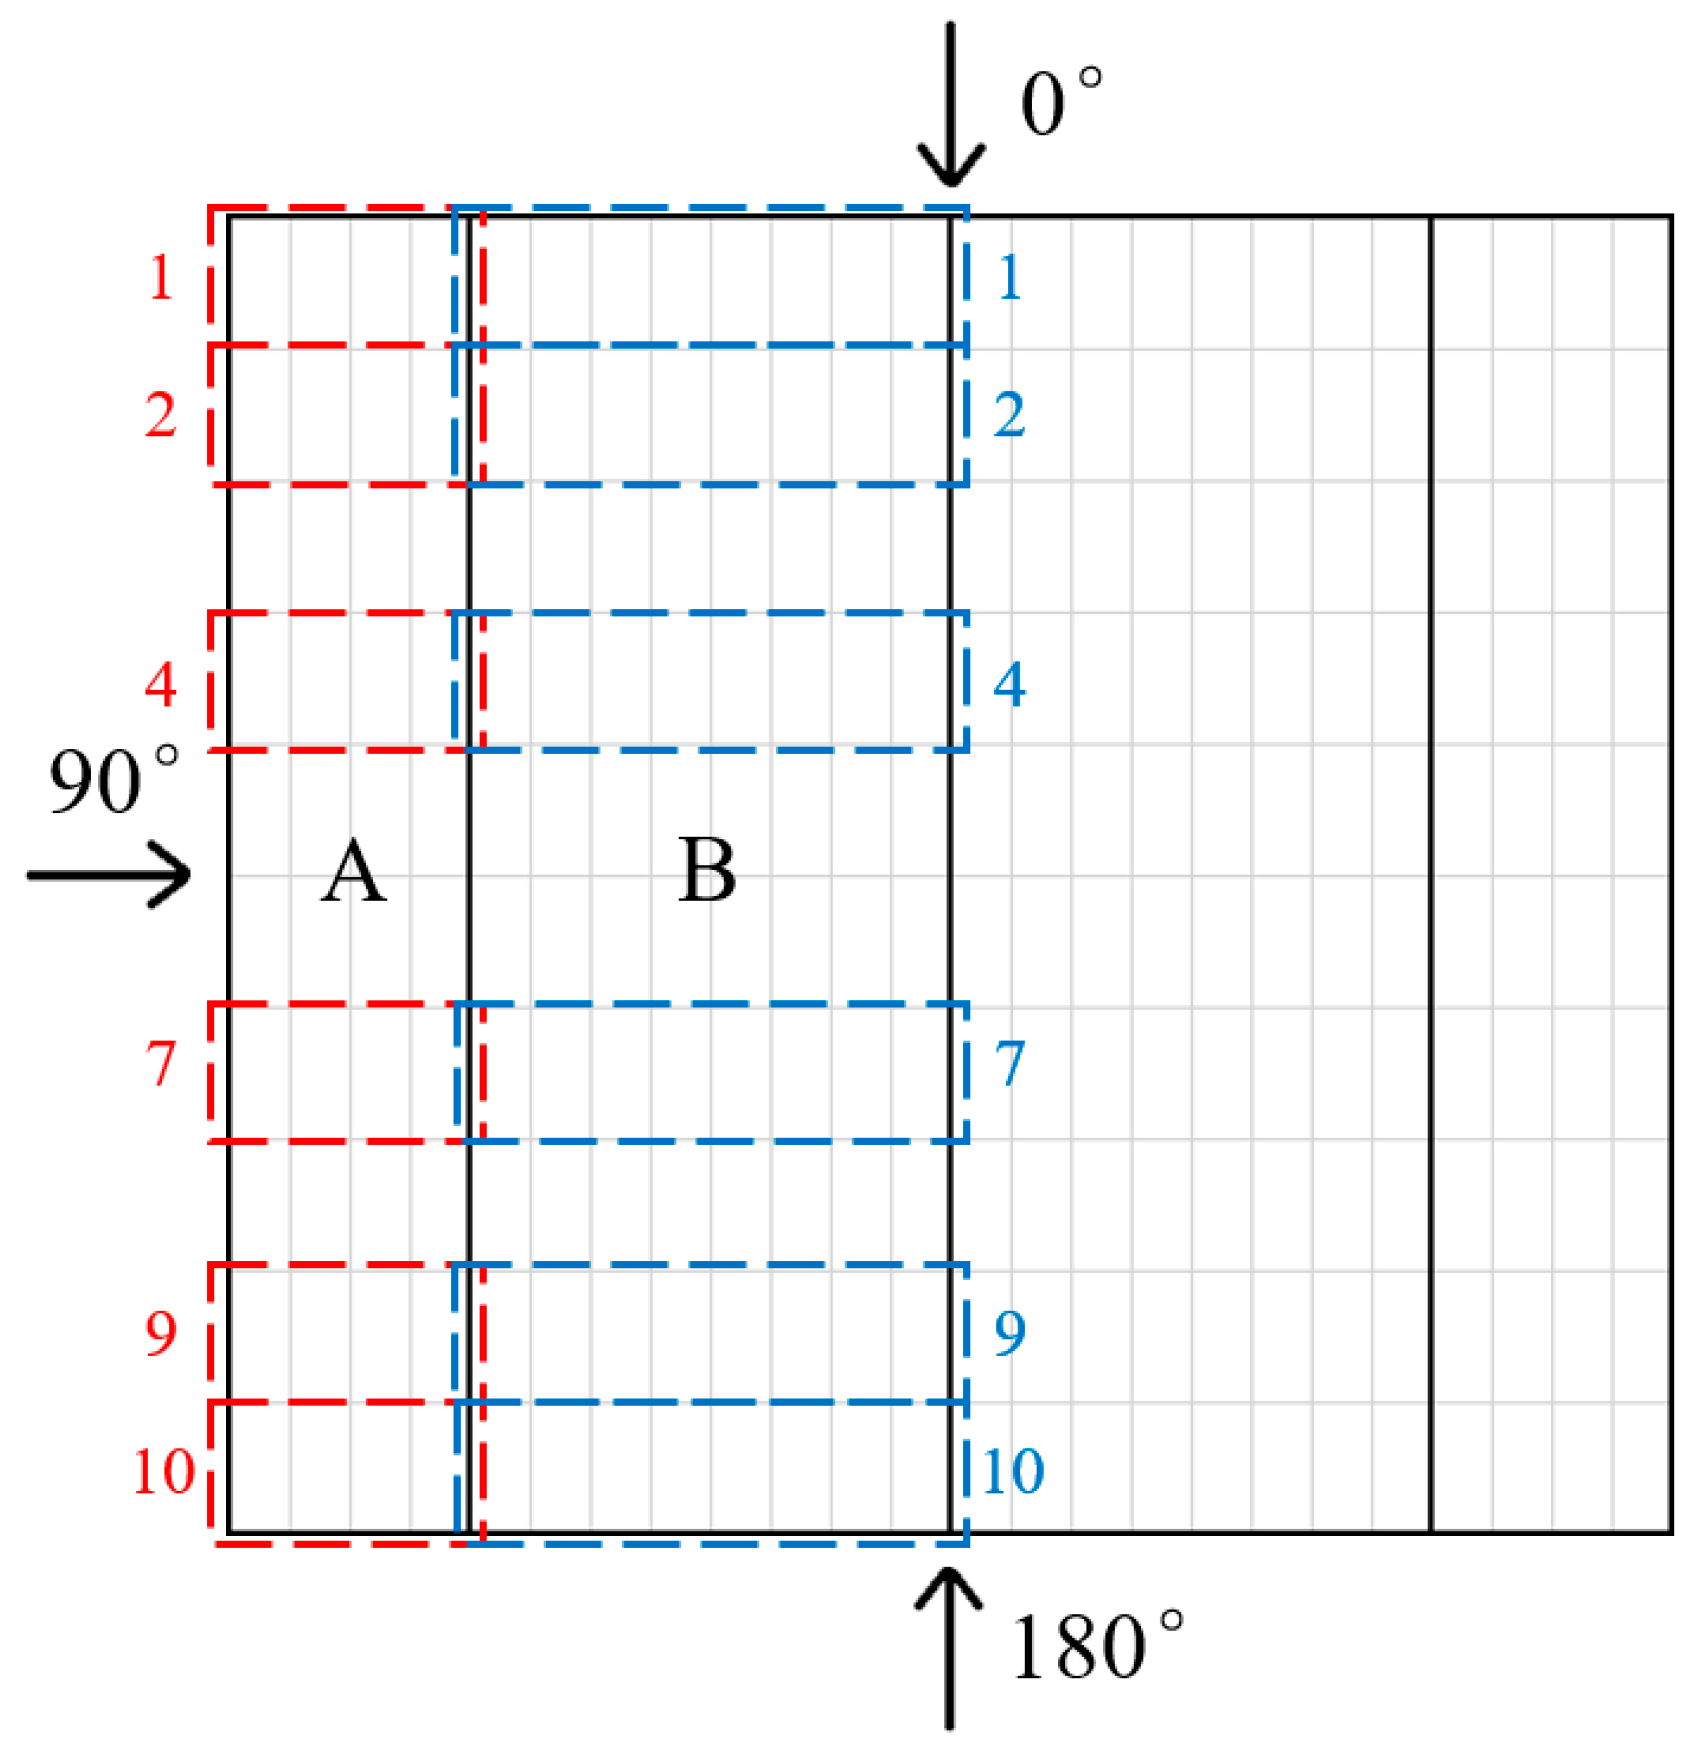
To investigate the wind load effects under different wind directions, herein, we used Case 2 for study. For ease of discussion, we divided the array of Case 2 into four zones, i.e., two outermost zones, which included the 4 outermost columns at two sides of the array (referred to as zone A), and two middle zones, which included 16 columns in the middle of the array (referred to as zone B), as illustrated in
Figure 9. In each zone, the mean wind loads of the PV modules in Rows 1, 2, 4, 7, 9, and 10 (indicated by the red and blue dashed rectangular box in the
Figure 9) were represented using area-averaged shape factors; thus,
where
is the area-averaged shape factor for the studied row of PV modules;
is the shape factor for the
-th measurement point within the studied row; and
is the corresponding control area for the
-th measurement point.
is the total number of measurement points in the studied row. Considering the symmetry, only half of the array is analyzed herein.
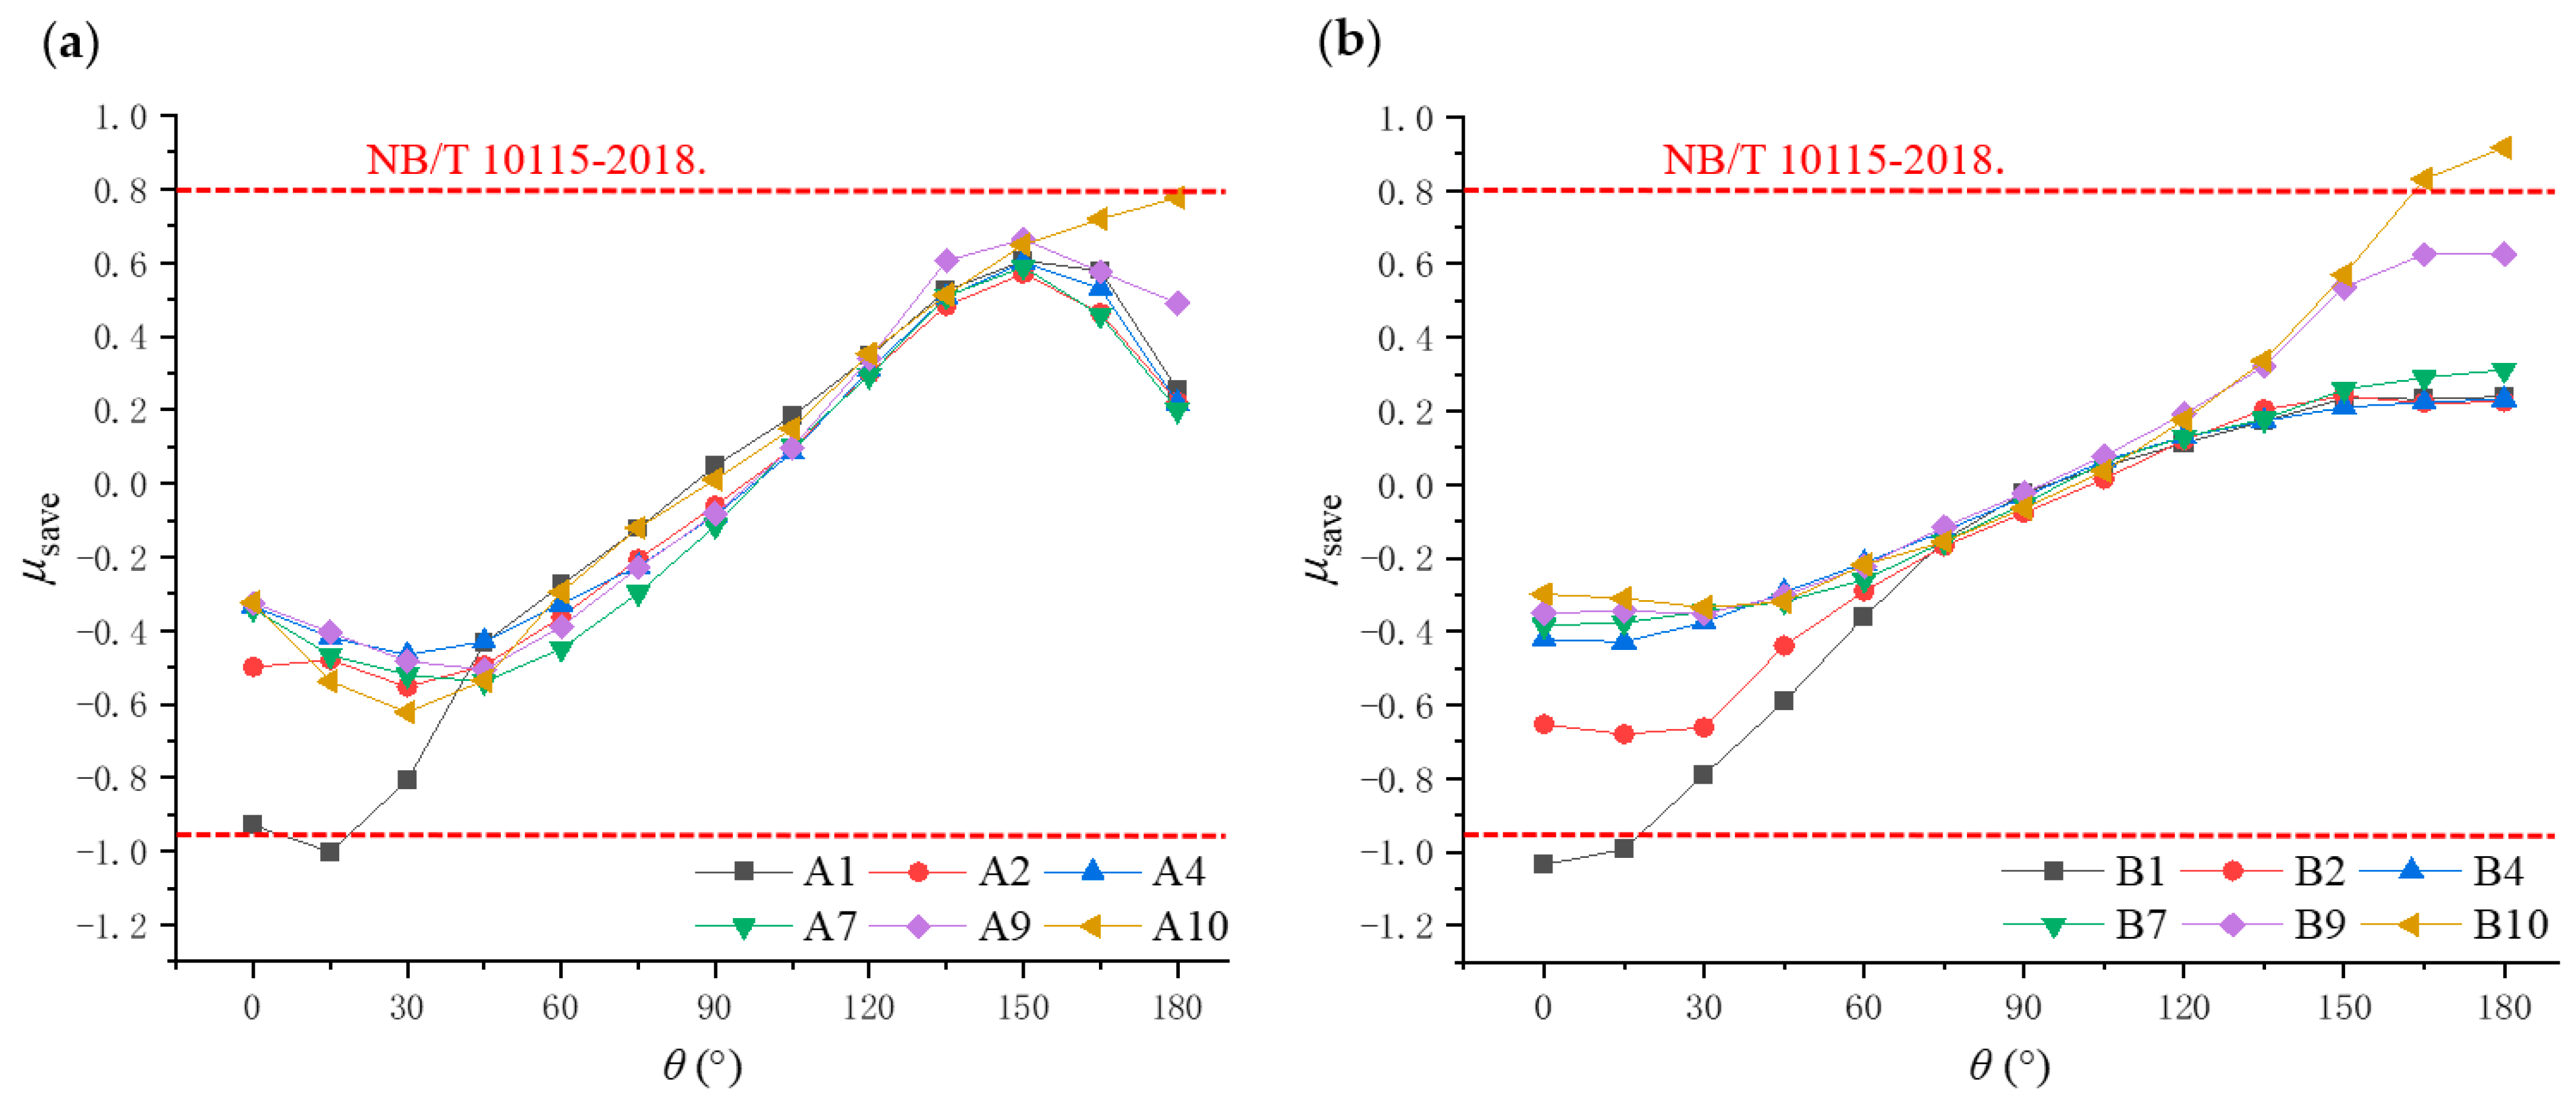
Figure 10 shows the variation in
with the wind directions for different zones. It can be observed that, for the middle zone B, the minimum and maximum wind loads of different rows were all reached at wind directions of 0° and 180°, respectively, and the last and first rows (i.e., B1 and B10) were subjected to the most dangerous wind pressure and wind suction, respectively. However, for the outermost zone A, the minimum and maximum wind loads of most rows always occurred at the oblique wind directions of 30° and 150°, respectively. It should be noticed that the maximum wind pressure of the outermost zone occurred in Row A10 at a wind direction of 180°, while the corresponding maximum wind suction appeared in Row A1 at a wind direction of 15°. This phenomenon is different from the patterns observed in other rows (i.e., A2–A9) because the modules in zone A10, located at the corner of the array, were under normal onset wind actions at the wind direction of 180°and bore the largest wind pressure on their upper surface. However, when they were under the oblique flow (e.g., 150°), strong flow separation occurred at the array corner, leading to a simultaneous decrease in the positive pressure on the upper surface and the negative pressure on the lower surface of the PV module.
For the studied PV array,
Figure 10 also provides the suggestion of shape factors from the Chinese code NB/T 10115-2018 (i.e., red dash lines) for designing wind pressure and wind suction. A comparison of the test results and code suggestions indicates that the most unfavorable measured shape factors of wind pressure and wind suction in the outermost zone A were consistent with those defined by the code. However, for the middle zone B, the corresponding unfavorable shape factors appearing at the first and last rows were −1.05 and 0.9, slightly higher than the recommended values.
4. Reduction Factor of Wind Load
Previous analysis showed that the sheltering effects between different rows of modules exert significant influence on the wind load distribution, and a clear decreasing trend in wind load can be observed from the upstream rows to the downstream rows of a photovoltaic array. Therefore, we introduced a zonal reduction factor to account for the differentiated wind loads caused by the sheltering effects. Referring to
Figure 9, similar zones A and B for the arrays of Cases 1–4 could be obtained. Then, the reduction factors for the most unfavorable wind pressure and wind suction of each zone were obtained for Cases 1–4; thus,
where
is the reduction factor of wind load for the
-th row of modules in the studied zone;
is the maximum (wind pressure) or minimum (wind suction) area-averaged shape factor for the
-th row of the modules in the studied zones for all wind directions; and
is the corresponding maximum value (wind pressure) or minimum value (wind suction) of
. According to the results of
Section 3,
basically occurs at the first (wind pressure) or last row (wind suction) of the array. Since the
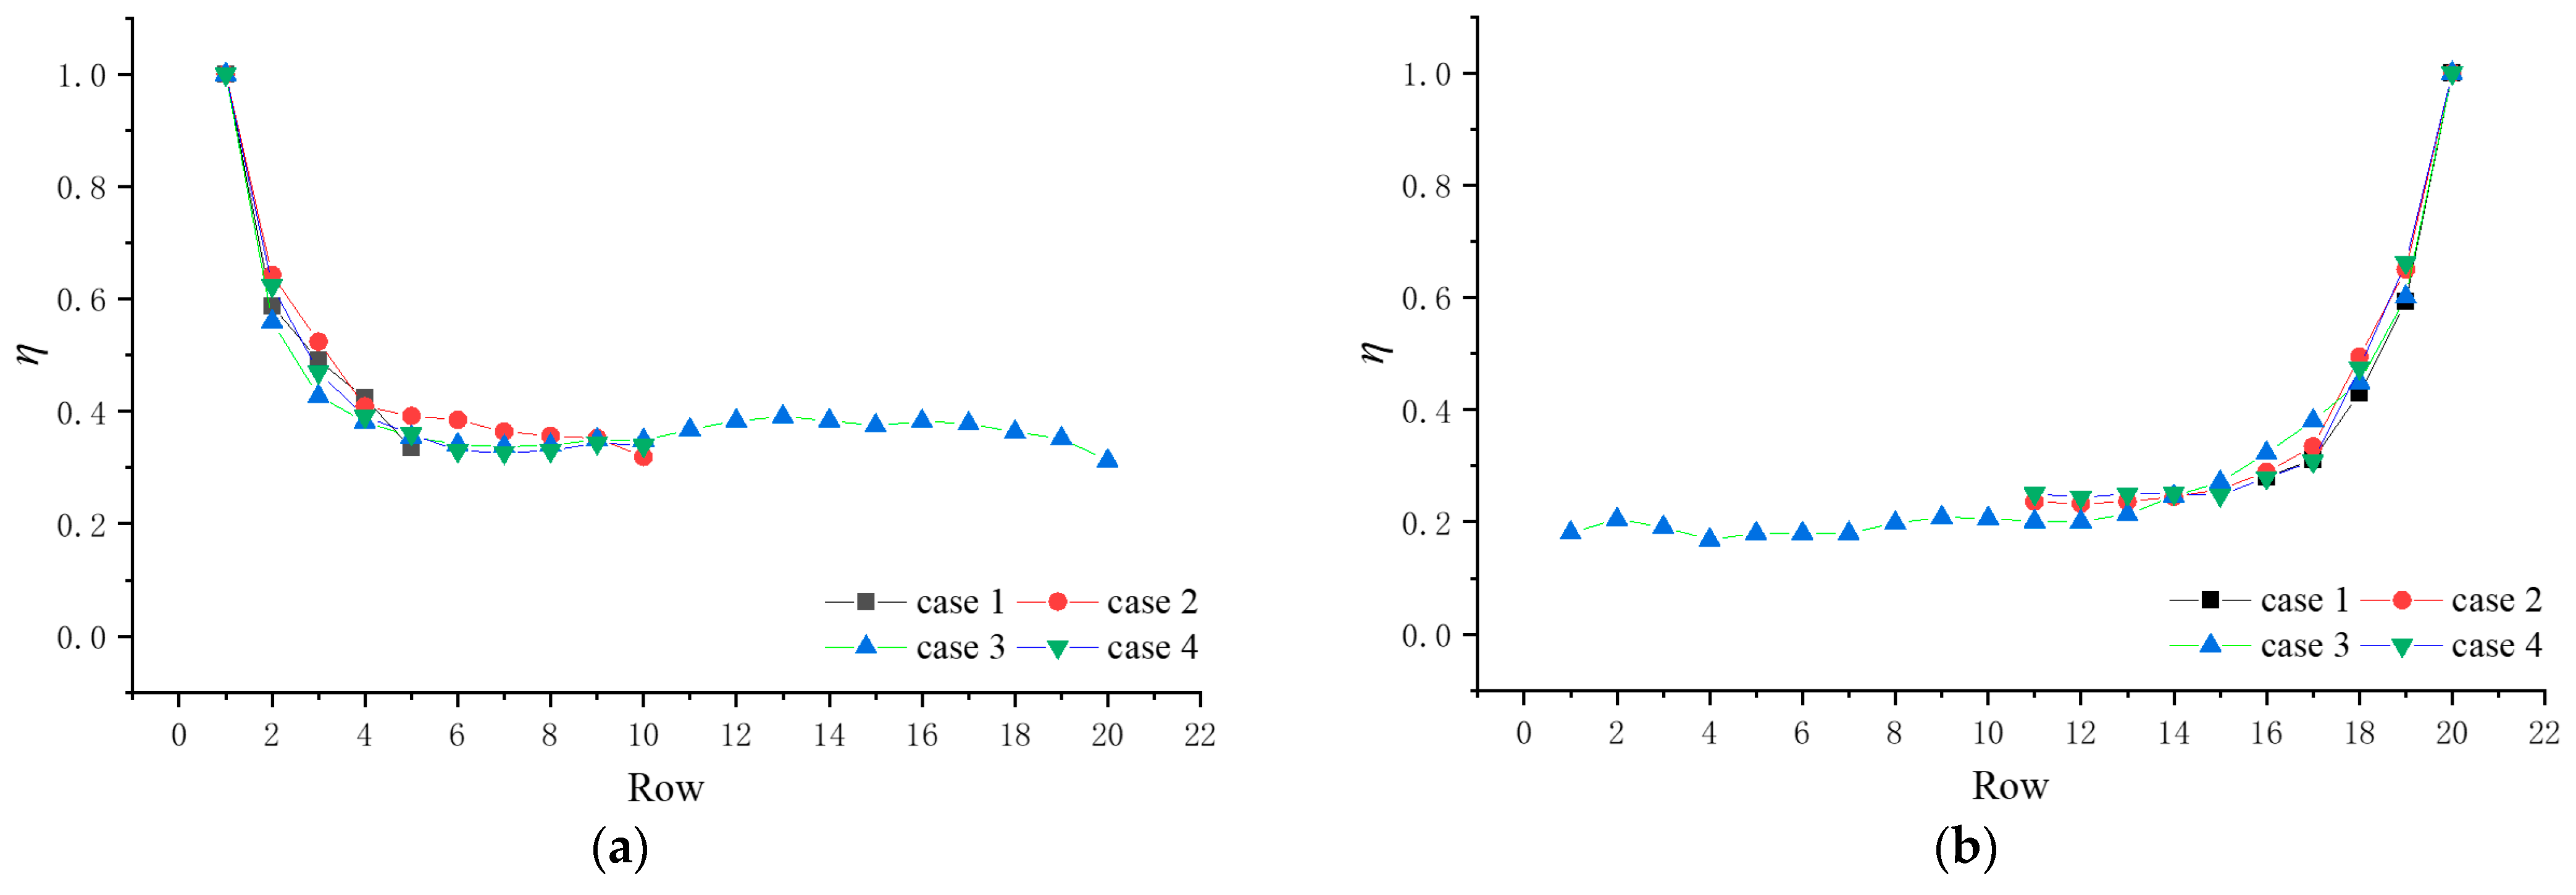
of each row in zone B appeared at two normal wind directions of 0° and 180°, the reduction factors of Cases 1–4 are plotted in
Figure 11. But for the outermost zone A, the
occurred under the oblique flow; therefore, only the
of Cases 1 and 2 is given, as shown in
Figure 12.
From
Figure 11, it can be observed that under different array cases, the reduction factor rapidly decreased within the windward first four rows and, thereafter, remained almost stable around 0.4 and 0.2 for the maximum wind suction and wind pressure, respectively. This finding is quite close to that of the study of Lou et al. [
17]. They investigated the reduction factor for a beam-column support PV array with a tilt angle of 12° through CFD simulations but only provided the results for wind directions of 0° and 180°, under which the reduction factors converged to 0.36 and 0.16, respectively.
For the outermost zone A, a similar phenomenon was observed for η, which finally stabilized at 0.5 for the maximum wind suction and 0.75 for the maximum wind pressure, respectively. Compared to zone B, the reduction factor of the maximum wind pressure in zone A was much larger. This is because the of the outermost zone occurred at the windward first row (e.g., Row 5 or Row 10) under a wind direction of 180°, while the of other rows were found under a wind direction of 150°. In this case, the sheltering effect was less pronounced compared to zone B, in which and appeared for the same wind directions, thereby leading to a greater reduction factor.
The Chinese code NB/T 10115-2018 also defined a constant reduction factor for the wind loads on the area between the first and the last rows, i.e., 0.85. It appears to be more conservative compared to the findings of this study.
5. Gust Loading Factor
The gust loading factor,
, is commonly used to describe the fluctuating wind-induced dynamic amplification of a static wind load, and it can be determined as follows:
where
is the gust loading factor;
is the equivalent static wind load;
is the dynamic wind load; and
is the mean wind load.
Based on the classical Inertia Wind Load and Load–Response Correlation (LRC + IWL) method [
18] and the Consistent Load–Response Correlation (CLRC) method [
19], which takes into the coupling term between the resonance response and the background response, the equivalent static wind loads on the PV structure could be determined. The structural response caused by a fluctuating wind load can be divided into the background response, resonance response, and coupling response between the two (hereafter referred to as the three-component method). The background response refers to the quasi-static process of structural vibration under fluctuating wind loads, while the resonance response is the structural response aroused at modal frequencies under fluctuating wind loads. According to the three-component method, the dynamic structural response can be expressed as follows:
where
is the variance matrix of the dynamic structural response;
is the variance matrix of the structural resonance response;
is the variance matrix of the structural background response; and
is the variance matrix of the coupling terms between the resonance and background response.
Once a dynamic response is obtained, the LRC + IWL method and CLRC principle can be applied to determine the equivalent static wind load corresponding to the extreme structural response at the
-th degree of freedom as follows:
where
is the peak factor;
is the variance matrix of the equivalent static wind load resonance component;
is the variance matrix of the equivalent static wind load background component;
is the variance matrix of the coupling terms between the resonance and background component;
is the influence function matrix; and
is the structural response at the
-th degree of freedom.
For wind-susceptible long-span cable-supported PV systems, the wind-induced vibration should be considered in the estimation of the wind load effects. However, few current codes can provide recommendations for the gust loading factors for such a PV structure. Therefore, we carried out wind-induced vibration analysis of a cable-supported PV array to obtain the dynamic structural response, which, in turn, can be used to estimate the gust loading factor through Equations (5)–(7). In this study, the maximum displacement at the midpoint of the structure span was taken as the equivalent target.
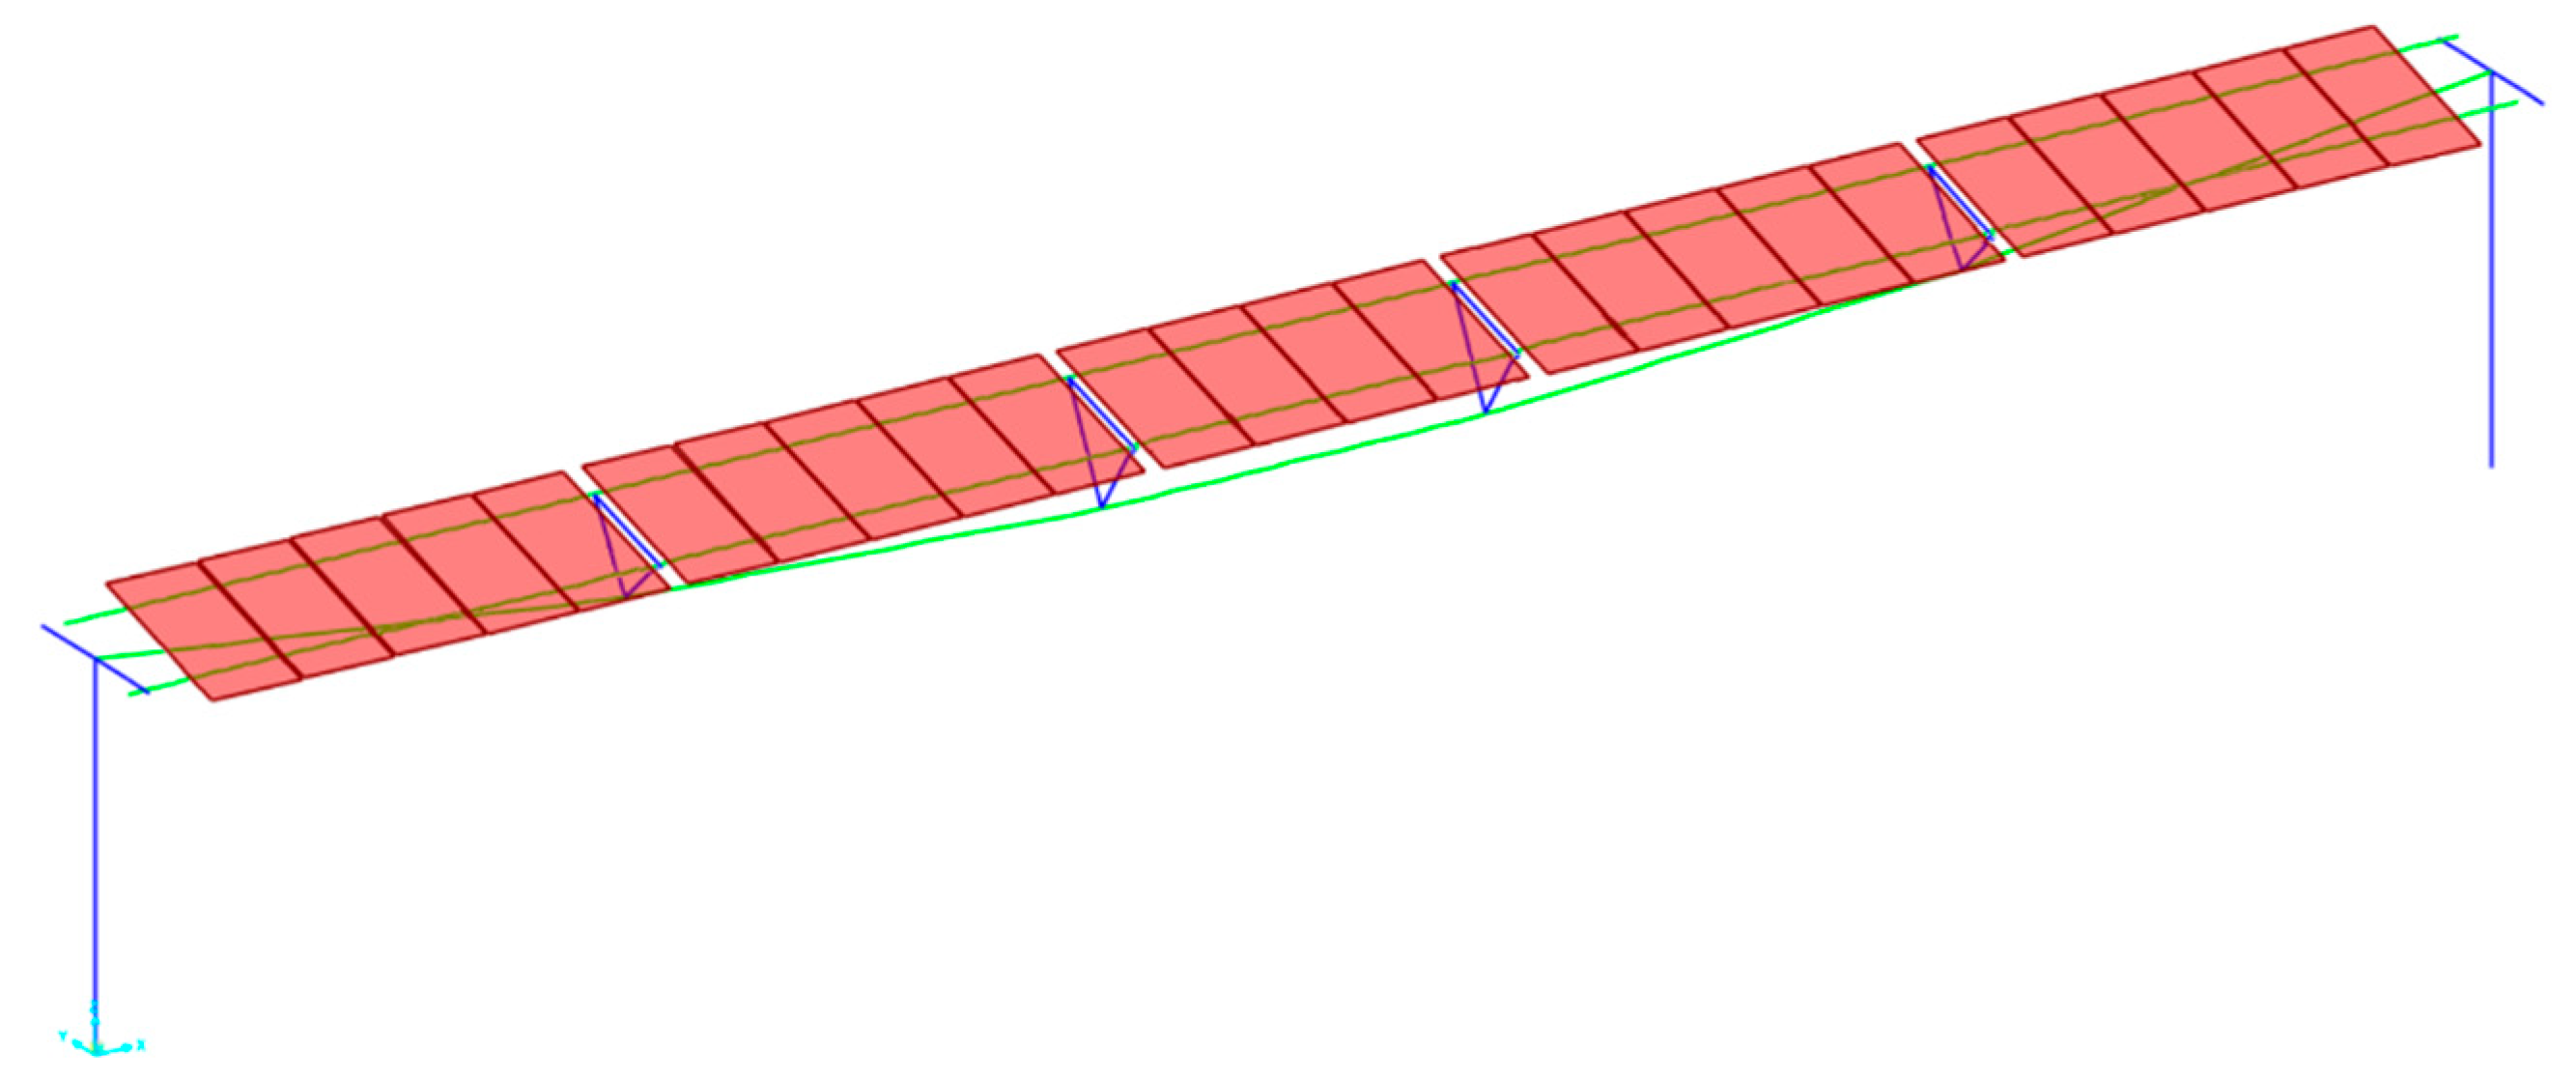
Taking Case 2 as an example, wind-induced vibration analysis of the PV structure was performed using SAP2000 v24 software. Beam elements were used to simulate the steel beams and columns. Shell elements were used to model the PV modules, and cable elements were used for the suspension cables. Pretention was obtained by applying tension loads. The numerical model of the single row cable-suspended photovoltaic structure is shown in
Figure 13. To facilitate design application, the PV array was also divided into the outermost and middle zones, as shown by
Figure 14. Area-averaged gust loading factors for each zone were obtained as follows:
where
is the area-averaged gust loading factor of the
-th zone;
is the net wind pressure coefficient of the
-th measuring point in the
-th zone;
is the corresponding control area for the
-th measurement point;
is the gust loading factor of the
-th measuring point in the
-th zone; and
is the number of measurement points in the
-th zone.
As shown in
Figure 14, the gust loading factor in the middle zone of the cable-suspended PV array ranged from 2.2 to 2.7, while that for the outermost zone was relatively smaller, generally between 1.3 and 1.5. Xu et al. [
14] obtained the gust loading factor of a single-row cable-suspended PV structure with an inclination angle of 10° through aeroelastic wind tunnel tests. They showed similar gust loading factors, which increased from 1.2 of the side span to 2.5 of the middle span. Liu et al. [
13] used aeroelastic wind tunnel tests to determine the maximum gust loading factors for a PV array, which were mainly found between 1.7 and 2.5, close to the findings from this study.
