Abstract
The H2-ICE project aims at developing, through numerical simulation, a new generation of hybrid powertrains featuring a hydrogen-fueled Internal Combustion Engine (ICE) suitable for 12 m urban buses in order to provide a reliable and cost-effective solution for the abatement of both CO2 and criteria pollutant emissions. The full exploitation of the potential of such a traction system requires a substantial enhancement of the state of the art since several issues have to be addressed. In particular, the choice of a more suitable fuel injection system and the control of the combustion process are extremely challenging. Firstly, a high-fidelity 3D-CFD model will be exploited to analyze the in-cylinder H2 fuel injection through supersonic flows. Then, after the optimization of the injection and combustion process, a 1D model of the whole engine system will be built and calibrated, allowing the identification of a “sweet spot” in the ultra-lean combustion region, characterized by extremely low NOx emissions and, at the same time, high combustion efficiencies. Moreover, to further enhance the engine efficiency well above 40%, different Waste Heat Recovery (WHR) systems will be carefully scrutinized, including both Organic Rankine Cycle (ORC)-based recovery units as well as electric turbo-compounding. A Selective Catalytic Reduction (SCR) aftertreatment system will be developed to further reduce NOx emissions to near-zero levels. Finally, a dedicated torque-based control strategy for the ICE coupled with the Energy Management Systems (EMSs) of the hybrid powertrain, both optimized by exploiting Vehicle-To-Everything (V2X) connection, allows targeting H2 consumption of 0.1 kg/km. Technologies developed in the H2-ICE project will enhance the know-how necessary to design and build engines and aftertreatment systems for the efficient exploitation of H2 as a fuel, as well as for their integration into hybrid powertrains.
1. Introduction
In the context of decarbonization of the transportation sector, regulators are imposing increasingly stringent limitations in terms of CO2 emissions, and the European Commission has declared its ambition to reach zero net Greenhouse Gas (GHG) emissions by 2050 [1]. As a matter of fact, 35% of the worldwide energy consumption is due to the transportation sector [2] and in 2020 road transport constituted 77% of all European Union (EU) transport GHG emissions [3]. In this sector, lorries, buses, and coaches are responsible for more than a quarter of GHG emissions in the EU (i.e., over 6% of total European GHG emissions) [4]. To mitigate this contribution, stronger CO2 emission standards have been set by the EU for Heavy-Duty Vehicles (HDVs), including smaller trucks and urban or suburban buses. The proposal establishes a 90% decrease in CO2 emissions per km from new HDVs by 2040 (compared to a mid-2019 to mid-2020 baseline) with intermediate targets for 2030 (45%) and 2035 (65%) [5].
In this framework, synergetic exploitation of decarbonized energy carriers and powertrain electrification could shift the public transportation fleets towards more sustainable mobility, compliant with current legislation targets. On the one hand, Battery Electric Vehicles (BEVs) may represent a promising alternative to improve the air quality of highly congested urban areas and to decarbonize the Light-Duty Vehicle (LDV) sector [6]. On the other hand, due to the limited specific energy of chemical batteries, BEVs are still not considered suitable for applications where the payload and the operative range are the main constraints (e.g., commercial vehicles or buses), requiring high initial costs and large batteries [7,8]. Among the possible alternatives for the HDV sector, the exploitation of hydrogen as an alternative fuel could play a key role in the EU energy transition [9], ensuring zero carbon-based emissions (e.g., CO, CO2, and soot) and high energy efficiency. In addition, the production path of hydrogen could rely on a wide variety of available technologies and energy resources, many of which are renewables and/or have low carbon impact, strengthening the argument for hydrogen as a long-term sustainable energy vector to fuel the future [10]. In the context of the public urban transportation sector, hydrogen has already been exploited in Fuel Cell Electric Vehicles (FCEVs), demonstrating significant advantages with respect to BEVs, both in terms of weight reduction and range increase, with a shorter refueling time [11,12]. Moreover, using hydrogen as a fuel to power Internal Combustion Engines (ICEs) could add further benefits with respect to Fuel Cell (FC) technology, such as a great tolerance to fuel contamination, significant cost savings (up to one order of magnitude), and the possible exploitation of existing production lines, due to familiar technologies and parts to current Internal Combustion Engine Vehicles (ICEVs) [13]. Furthermore, one of the main concerns regarding hydrogen vehicles is the need for new infrastructures for hydrogen distribution and refueling, while in the case of urban buses, a quite limited range is typically requested, and tank refueling is not an issue, since captive fleets can centralize the fuel station.
Despite the great potential of H2 as a fuel for ICEs in public transport, in the last two decades, it has been implemented in only a few prototypes [14,15] and real bus fleets, such as in the two demonstration projects HyFLEET:CUTE [16] and SunLine Cleen Fleet [17]. In particular, the HyFLEET project involved the operation of 47 hydrogen-powered buses in regular public transport service in 10 cities on three continents, from 2006 to 2009, testing on 15 buses two different types of H2-ICEs (naturally aspirated or turbocharged). In addition, SunLine Cleen Fleet tested a prototype hybrid H2-ICE bus in California for three years (2006–2008). The outcomes of both projects have shown that hydrogen can be a low or even emission-free transport fuel, implementing today’s technology. Nevertheless, some issues remain unresolved, such as the performance of the fuel injectors, the turbocharged operation, and the control of the engine management system. Moreover, a rising interest has been growing recently for the development of a new generation of ICEs designed to be operated at high boost levels with ultra-lean mixtures, thus simultaneously achieving extremely low NOx emissions (<0.05 g/kWh) along with high-efficiency values (>42%) at lambda > 2 [18,19,20]. A further enhancement could be obtained through the synergic combination with hybrid propulsion technologies, particularly suitable for urban bus applications, for which series hybrid architecture could significantly benefit from energy recovery through regenerative braking, as well as from a substantial downsizing of the ICE, with vehicle acceleration performance being decoupled from engine power output [21].
In this context, the present research project, the so-called H2-ICE project, aims to develop an innovative hybrid H2-fueled powertrain for urban bus application, giving insights into the current knowledge gap for H2 exploitation in ICEs. Specifically, the approach adopted for the H2-ICE project consists, at first, of defining the use case scenarios for the targeted application (i.e., 12 mt urban bus) and emission and fuel consumption targets to be met. This essential preliminary step allows the specification of the boundary conditions and the requirements delineating the development scope of the main vehicle subsystems. Then, in a second step, the H2 engine and its subsystems will be developed and optimized, starting from a state-of-the-art diesel engine. Afterwards, in a third step, the engine and its subsystems are tested and modeled to be integrated into a virtual high-fidelity simulation model and the energy management system will be developed exploiting Vehicle-To-Everything (V2X) connectivity. Then, the virtual demo vehicle will be evaluated to demonstrate its capabilities in real-world driving conditions. The present work is focused on the development phase of the engine and its subsystems and is organized as follows: Section 2 provides an overview of the project, with the case study description, a discussion of the challenging issues to be addressed, the overall fixed targets, and the hybrid powertrain technical specifications. Furthermore, Section 3 describes the analysis of the suitable combustion and fuel injection system, Section 4 the WHR system together with the aftertreatment technologies needed, and Section 5 the engine and powertrain management strategy. Finally, the actual findings and future steps of the project are presented in Section 6.
2. H2-ICE Project Overview
The H2-ICE project aims to enhance the know-how necessary to design and build engine and aftertreatment systems for the efficient exploitation of H2 as a fuel and for their integration into a hybrid powertrain for a series urban bus. In particular, the full exploitation of the potential of such a powertrain requires a substantial enhancement of the state of the art, since several challenging issues have to be addressed. At first, the combination of high efficiency, low emissions, high specific power output, and durability is not currently achievable in one H2 combustion concept. Starting from fuel injection, Port Fuel Injection (PFI) and Direct Injection (DI) are the two main considered and tested options [22,23]. On the one hand, PFI part load efficiency can be quite high with ultra-low NOx emissions, thanks to the possibility of ultra-lean operation allowed by the extremely high flame propagation and wide flammability limit characteristics of H2 combustion. However, the specific work output is typically limited to 14 bar Brake Mean Effective Pressure (BMEP) due to the low H2 density, even in highly boosted engines. On the other hand, DI engines have proved to be capable of achieving power densities 15% higher than PFI, while offering high efficiencies thanks to possible charge stratification at part load, with a lower risk of abnormal combustion [24]. Nevertheless, DI injectors still have to prove their durability as well as their operability with extra-high flow rates, typical of gaseous fuel such as H2. Moreover, the exploitation of fully optimized fuel injection strategies requires high injection pressures, typically above 100 bar, limiting H2 storage options [25]. Indeed, liquid H2 could be stored onboard in cryogenic tanks at a pressure of 16 bar, providing injection pressures onboard, or high-pressure tanks could be exploited to store gaseous hydrogen onboard with a working pressure generally ranging from 350 to 700 bar, but then the full tank capacity may not be utilized. As far as H2 combustion is concerned, the same properties that make H2 a suitable fuel for ICEs can be responsible for high risks of abnormal combustion phenomena: the wide flammability limits, the low ignition energy, and the high flame speeds can, as a matter of fact, result in combustion anomalies such as surface ignition, backfiring, preignition, and knock [26]. Although significant progress was made in improving computational tools for modeling and understanding mixture formation and combustion in H2 engines [27,28], the numerical simulation of mixture formation for DI H2 engines remains extremely challenging, because of the high-velocity gas jet, leading to a complex structure of shock waves and making charge stratification quite hard to achieve. Moreover, as far as combustion modeling is concerned, there is a shortage of data on H2 ignition and combustion properties in terms of engine conditions of pressure and temperature, and there has been little progress in extending the current dataset. Furthermore, both advanced WHR systems [29] and an innovative Selective Catalytic Reduction (SCR) aftertreatment system, based on hydrogen as the reductant element [30], need to be synergically developed to exploit the high exhaust gas enthalpy available and achieve near-zero tailpipe NOx. In addition, the use of H2 as a reducing fluid needs proper catalyst preparation, testing, and modeling to be then coupled to the engine. Finally, the elaboration of control strategies for the synergic operation of the developed WHR and H2-SCR aftertreatment systems and the exploitation of look-ahead information from V2X connectivity for the Energy Management System (EMS) of hybrid powertrains are just at the beginning of its exploitation [31]. The H2-ICE project thus aims not only to develop an innovative hybrid H2-fueled powertrain and related technological opportunities but also to contribute to filling the knowledge gap for H2 exploitation in ICEs, as summarized in Figure 1.
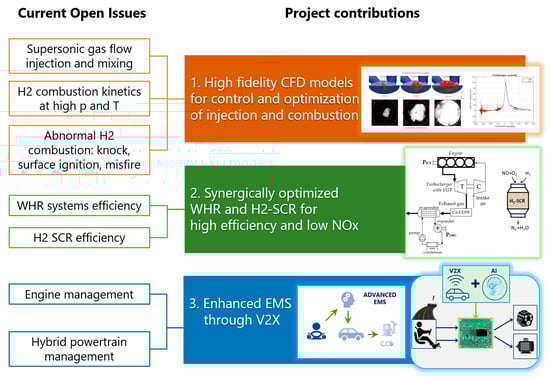
Figure 1.
H2-ICE project state-of-the-art enhancements.
Case Study
First of all, the H2-ICE project defines the use case scenarios for the targeted application and emission and fuel consumption targets to be met, allowing the definition of the boundary conditions and the requirements delineating the development scope of the main vehicle subsystems. The vehicle developed is a 12 mt urban bus with a series hybrid architecture, featuring an H2-ICE derived from a state-of-the-art diesel engine and a tractive electric motor as power units. A scheme of the hybrid architectures is presented in Figure 2 and the vehicle technical specifications and target settings are then listed in Table 1.
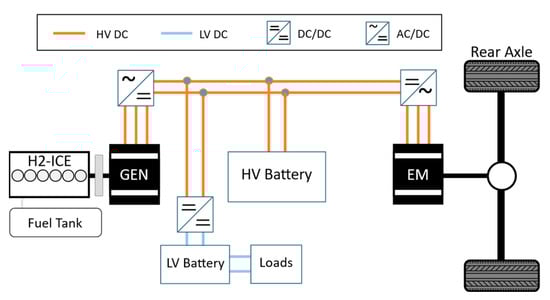
Figure 2.
Scheme of the adopted series hybrid architecture.

Table 1.
Hybrid bus specifications and target settings.
In addition, Table 2 presents the overall targets of the project.
Table 2.
H2-ICE targets for vehicle and engine efficiency and NOx emissions.
Both regulatory driving cycles and real-world mission profiles will be taken into account in the design of the hybrid traction system. In particular, three different mission profiles, representative of a typical urban bus operation, will be considered. The speed profiles are represented in Figure 3 and their specifications are listed in Table 3.
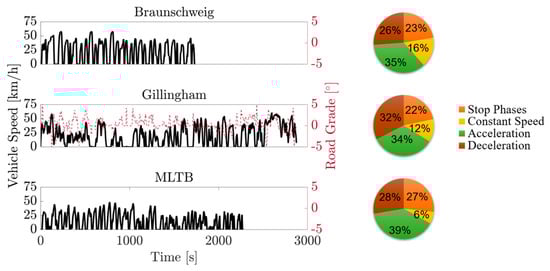
Figure 3.
Vehicle speed of the considered driving cycles (black lines), and road grade when present (red line).
Table 3.
Main Features of the considered mission profiles.
In particular, the Braunschweig is an urban driving cycle, employed in various research projects or equipment certification programs [32]. The MLTB cycle was developed by UK transport authorities in 1996 to verify the compliance of new vehicles with emissions and fuel economy standards [33]. Finally, the Gillingham Uphill is a real-world emission profile, obtained from GPS acquisitions, and features high elevation changes to also test challenging driving conditions [19].
The baseline reference engine is a diesel engine with 3.0 L of displacement, downsized to a rated power of 100 kW and modified in order to be exploited for H2 combustion, with a proper benchmark between the cost and the level of complexity [34]. Technical specifications of the different components have been set exploiting the outcomes of previous EU-funded projects such as ZeEUS [35] and based on an extensive literature review and market survey. Concerning the choice of the suitable Electric Motor (EM), at present almost the entire light-duty hybrid vehicle industry has shifted to Permanent Magnet (PM) machines in order to meet the increasing power density and efficiency requirements [36]. On the contrary, for medium- and heavy-duty vehicles induction machines remain an attractive option for their very low drag losses at part load. Nevertheless, the specific market of electrified buses is shifting towards PM electric machines with an average peak nominal power of 200 kW [35]. Finally, a PM synchronous machine has been chosen thanks to its high energy efficiency, delivering a peak power of 200 kW and continuous power of 140 kW. As far as the battery is concerned, at first, the battery sizing and energy content have been fixed, according to the route length and the final desired State of Charge (SoC) [37]. A total installed energy of 20 kWh is considered the most suitable for the present application, with a target maximum power of 200 kW, in consistency with the EM power. Regarding battery chemistry, a high-specific-power cell is desirable for a full hybrid series application [38]. In this field, the most exploited chemistries are the ones available with Li-ion batteries, granting high power densities and long life cycles, necessary for long traveled distances [39]. Among the different options, Lithium-Ferro-Phosphate (LFP) offers a longer life cycle, ensuring lower replacements, with a comparable carbon footprint of battery stack production with respect to other chemistries such as lithium Nickel Manganese Cobalt Oxide (NMC) batteries. In conclusion, the chosen cell is made of LFP, and the main characteristics are reported from [40], with 120 cells in series and 20 in parallel to achieve the target power and density. The main powertrain components’ technical specifications are summarized in Table 4.
Table 4.
Hybrid powertrain technical specifications.
3. Combustion and Fuel Injection System
The present section describes the development and optimization of the fuel injection and combustion systems suitable for the H2-fueled internal combustion engine, through both numerical simulation and dedicated experiments in an optically accessible laboratory single-cylinder engine. In particular, the control of the fuel injection and the combustion process for a hydrogen engine is extremely challenging, due to the high risk of backfire in the case of port fuel injection and to the complexity of managing mixture formation through the supersonic flow of the gaseous fuel in the case of direct injection. Then, the development of high-fidelity CFD models to highlight the in-cylinder H2 fuel injection through supersonic flows and to describe accurately the hydrogen combustion, including anomalies such as knock, preignition, and misfire is fundamental to combine high efficiency, low emissions, high specific power output, and durability all in one concept.
3.1. Injection
Regarding the choice of the fuel injection system, different options have been analyzed, ranging from PFI to DI, as mentioned in Section 2. Indeed, to achieve high power output and efficiency, hydrogen DI is preferable, however, the low hydrogen density leads to supersonic chocked flows, with high penetration and reduced in-cylinder mixing times, despite hydrogen’s extremely high laminar diffusivity. Injection pressure levels and nozzle design therefore need to be carefully scrutinized. In this context, high-fidelity Large Eddy Simulations (LESs) of the turbulent under-expanded H2 jets can play a crucial role in the fundamental understanding and prediction of the physical mixing process, allowing the design of an optimized injector nozzle and associated injection strategies. In addition to high-resolution CFD simulations, the Reynolds-Averaged Navier–Stokes (RANS) modeling approach could also be employed as a cost-effective engineering tool to predict and explore several nozzle designs and pressure ratios [41,42,43,44]. Boundary and operating conditions are derived from reduced-order models (cf. Section 2 and Section 5).
As a first step, LES fundamental studies have been conducted on nitrogen jets for validation of the developed injection model, and predictions [41] have been compared with experimental data [44,45]. An example is shown in Figure 4, where the contours of the density gradient of the nitrogen jet are presented at different time steps, with 5.8 bar of Nozzle Pressure Ratio (NPR) and 1 bar of ambient pressure, and the predicted axial density is compared for validation against the two reference studies. Normalized centerline density was predicted relatively well, with a small phase difference after the Mach disk, also due to uncertainties in the actual nozzle conical shape [44]. The formation of the barrel-shocks and slip lines and the rolling up of the initial vortices are well visible.
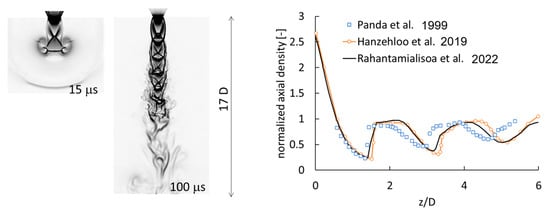
Figure 4.
LES of nitrogen injection at 5.8 bar into 1 bar ambient backpressure, through a 1 mm diameter nozzle. Simulation results of the jet development in terms of density gradient over time (left). Normalized axial density vs. axial distance (right), for the study reported in [41] and two reference studies [44,45].
By increasing the NPR up to 30, and considering actual hydrogen injections, the jet morphology changes substantially, as visible in Figure 5 (left). The higher NPR generates a larger barrel-shock, with only one shock cell. Immediately afterwards, the flow transitions to turbulent flow, which eventually reduces the tip penetration. The expected main characteristics of the jets are captured by the CFD model, such as the turbulent mixing and the emitted aerodynamic sound. Simulations have also been performed on pintle outward opening nozzles, with similar considerations. Less demanding RANS studies have then been conducted to explore a wide range of injection pressure and backpressure operating conditions, including the effect of nozzle shape, like inward vs. outward opening (Figure 5, right). In this modeling framework, even if capturing H2 far-field mixing remains challenging, RANS results provide an adequate description of the flow physics for engine CFD models allowing the screening of multiple design parameters at an affordable cost.
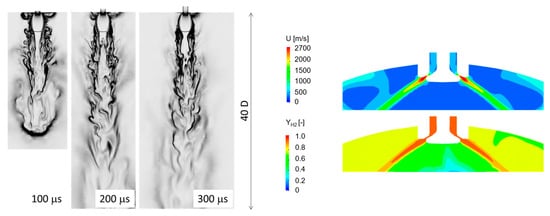
Figure 5.
H2 injection simulations at 30 bar into 1 bar. LES simulation of a single-hole nozzle; predicted contours of density gradient over time (left) [41]. RANS simulation of a pintle injector; predicted velocity magnitude and fuel mass fraction (right).
3.2. Mixture Formation
Still, limited experimental work is available in the literature dealing with H2 jet evolution, mixing, and combustion. To build a reliable CFD design workflow, quantitative measurements of H2 injection and combustion are needed for validation. Regarding hydrogen mixing in a motored engine, the most comprehensive dataset is available from Sandia’s Optical Hydrogen Engine (SOpHy) [46]. Indeed, the CFD modeling capabilities have been tested against velocity and hydrogen mass-fraction fields measured in these experiments. The CFD software CONVERGE, version 3.0, is used for the analyses, with a second-order scheme for convective flux reconstruction and the implicit Euler scheme for temporal discretization. The considered engine features a central mounter single-hole injector, whose mesh resolution, geometry details, and boundary types were designed based on previous activities [47,48]. For the specified motored engine operation [49], various RANS turbulence models within the k-ε family, grid managements, wall treatments, and turbulent Schmidt numbers have been scrutinized.
The realizable k-ε model performed relatively better than others, and its corresponding results are shown in Figure 6 (left) in terms of mixture distribution. In the central column, the experimentally measured H2 distribution is presented at two different time steps for the optical accessible window, while in the right column, the simulation results are visible. Comparing the direction and spread of the hydrogen jet, especially at −130 deg., the numerical model can correctly predict the air/gas during the intake stroke, while a slight under-prediction of the mixing is visible at −30 deg. In Figure 6 (right), the results of the turbulent Schmidt number variation are presented in the velocity profile along the cylinder axis. Calibrating the Schmidt number, the hydrogen diffusion predictions are improved to some extent at the end of the compression stroke. Future project analyses regarding the fuel injection system will include the test of other turbulence models, such as low-Reynolds variants, or Reynolds stress model, still within the RANS framework for computationally efficiency.
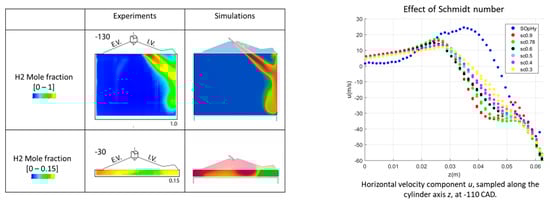
Figure 6.
Hydrogen mixing in the motored engine SOpHy [46,49] experiments vs. simulation. Hydrogen mole fraction at two different timings (left), and velocity profile varying the Schmidt number (right).
3.3. Full Engine Model with Combustion
In the third step of the analysis, combustion conditions are considered, with numerical and experimental analyses on the single-cylinder naturally aspirated optical-access engine of the University of Perugia which allows combustion visualization through the transparent piston and side windows (see Table 5 for more engine details).
Table 5.
Optical-access engine specifications.
At the time of writing, tests are ongoing and experimental data are not yet available. All the results of the combustion measurements will serve as a validation data for both LES and RANS models to build a reliable and validated CFD model. The selected engine point is at 1000 rpm with 5 bar BMEP. In particular, various excess air ratios are considered (i.e., λ = 2 ÷ 3.5) with two main injection categories:
- premixed cases, meant to reproduce the behavior of a PFI engine assuming that hydrogen and air are perfectly mixed (limiting case);
- DI cases with side-mounted injector and central spark, at various Start of Injection (SoI) times.
Simulations have been carried out using the same software, CONVERGE, as detailed above. An assessment of the CFD model has been carried out via mesh sensitivity analysis. Furthermore, a validation of the laminar flame speed has been carried out against literature data, which led to the choice of the LLNL reaction mechanism developed by O’Conaire et al. [50]. Combustion is modeled using the well-mixed approach, and the energy deposition method is adopted to model ignition leveraging previous experiences and data [51]. Figure 7 presents a comprehensive summary of the combustion numerical analysis, with the mass fraction burned (left, center) at different values of lambda and SoI and the combustion efficiency (right). The port fuel injection cases (black lines) mimicked by a premixed assumption show the maximum combustion efficiency at all lambda values (Figure 7, right). Of course, volumetric efficiency will be lower, and a higher intake pressure will be needed to maintain the same load. With DI strategies, mixing tends to improve advancing SoI. At λ = 3, the fuel mass fraction burned was lower than the premixed case and SoI had no significant effect, while at λ = 3.5 SoI had a visible effect on the fuel mass fraction burned which increases as the SoI advances. The combustion efficiency at λ = 3.5 is very poor, and such a level of air–fuel ratio cannot be used, at least without further countermeasures.
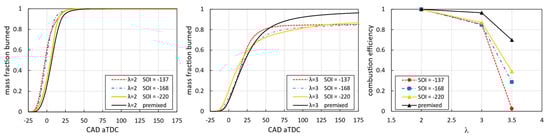
Figure 7.
Effect of SoI timing on DI engine combustion at various air excess ratios. Mass fraction burned at λ = 2 (left) and λ = 3 (center). Combustion efficiency as a function of λ (right).
The main task of this work will then be the metal engine design optimization carried out through thermo-fluid-dynamic simulations of the engine combustion system. RANS simulations can guide injection and combustion systems towards the achievement of targets specified in the previous section by tuning the injection system design with the piston and chamber geometry design. As a result of the 3D-CFD models, heat release rates can be derived as a function of the combustion system and operating conditions. These data can feed the 1D engine model developed in GT-Power which can be used for the overall engine performance assessment, such as generating engine maps of efficiency, performance, and emissions. Based on such calibration and validation steps, the 1D engine model will then be used to explore several additional parameters, such as injection strategies, ignition timings, lean stability, Exhaust Gas Recirculation (EGR) rate, and boost level, under various speed–load conditions. A crucial aspect will also be the prediction of abnormal combustions, due to preignition and end-gas autoignition, which will rely on calibrated combustion models against preliminary experimental tests on a prototype.
4. Waste Heat Recovery Technologies and Aftertreatment System
In parallel with the activities of engine design, the engine subsystems have been developed and optimized through both experimental and simulation activities. Different WHR technologies have been scrutinized, while for the aftertreatment system, an H2-SCR system has been chosen to achieve near-zero NOx emission levels, and the analysis is focused on the experimental characterization of the possible catalytic system to be implemented in this device.
4.1. WHR Technologies
The evaluation of the WHR has been preliminarily assessed on the reference engine: a 3.0 L turbocharged diesel one. The possibility to test a baseline-like engine mounted on the test bench at the ICE laboratory of the University of L’Aquila provides engine exhaust data, fundamental to evaluate the energy recovery potential. In particular, the temperature of the exhaust gases Texh is measured after the catalyst and particulate filter devices in order to preserve their operating conditions. Exhaust mass flow rate mexh is calculated by knowing the engine air intake and the fuel rate [52]. In the turbocharger diesel engine tested on the bench, both engine speed and torque have been varied in order to have a wide and comprehensive range of operating points. Engine power has been chosen as a reference parameter to hold engine speed and torque (Figure 8). Exhaust mass flow rate and temperature are almost linear with the engine power, since the control unit of the engine acts simultaneously on the boost pressure produced by the turbocharger and the fuel injection to achieve the desired power (torque and speed).
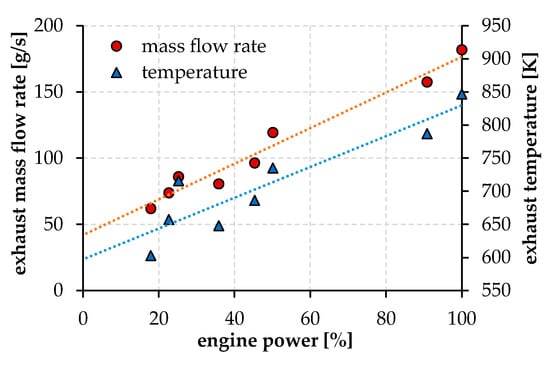
Figure 8.
Reference data for engine exhaust mass flow rate and temperature as a function of the engine power, evaluated downstream of the aftertreatment devices. Red dots represent experimental values of engine exhaust mass flow rate, while blue triangles experimental data of exhaust temperature. Red and blue dashed lines are, respectively, linear fittings of data.
The turbocharger is managed to obtain a certain intake air flow rate, and fuel injection is more related to torque control. The resulting air/fuel ratio can be considered as a parameter for controlling the engine power. Moreover, the engine is operated in lean combustion conditions as highlighted in Figure 9, where the value of lambda is reported. This value ranges from 1.4 (in highest power condition) to 2.4 (at 20% of rated power). In Figure 8 is also reported the corresponding exhaust gas temperature.
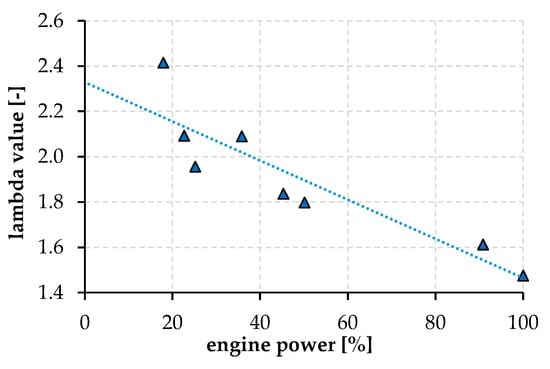
Figure 9.
Values of lambda for different engine powers reproduced on test bench, triangles for observed values, dotted line to fit the data.
4.1.1. ORC-Based Unit
The first option studied for WHR is the possibility to introduce an indirect waste heat recovery section, based on an Organic Rankine Cycle (ORC) unit. This is composed of an evaporator, where the energy of the exhaust gases can be exchanged with the organic fluid to vaporize and superheat it, an expander, which converts the thermo-dynamic energy of the fluid into mechanical and eventually electrical energy, a condenser, which exchanges heat towards the cold sink, and a pump to pressurize the fluid and close the thermo-dynamic cycle (Figure 10). The ORC-based unit proposed has a volumetric machine for the expander (of scroll type), suitable for its flexibility and capability to adapt in dynamic and off-design conditions [53,54], and it has been tested specifically to derive a numerical model of the whole ORC unit [55]. The model has been validated through experimental data [56] and is based on general assumptions: (a) the organic fluid is R245fa; (b) the cold sink is cooling water at 45 °C, to simulate the cooling conditions onboard; (c) the overall amount of fluid is equal to 7 kg; (d) pump and expander rotational speeds are controlled to match the thermal power available and to improve the overall performance considering the permeability of the ORC circuit.
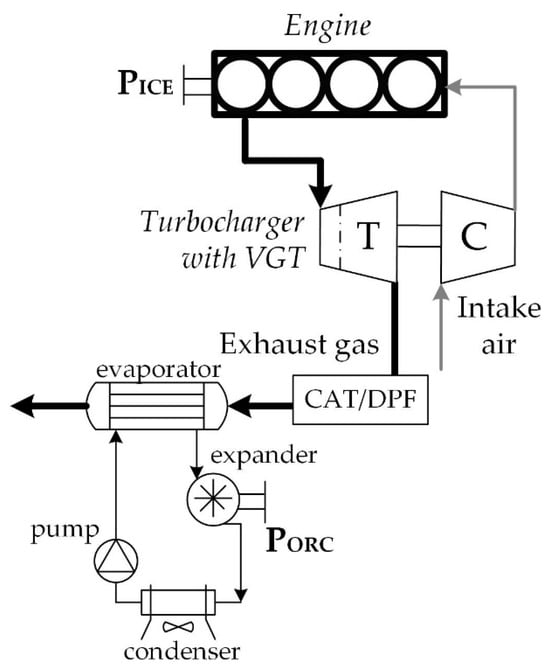
Figure 10.
Scheme of the ORC-based unit proposed for exhaust heat recovery.
The control of the pump speed and the contextual one of the expander are needed to have the right mass flow rate of working fluid which matches the most suitable conditions at the evaporator. The evaporating pressure, moreover, is strictly related to the permeability of the circuit, mainly dependent on the WF flow rate and consequently from the entity of the thermal power recovered (i.e., the exhaust gas temperature entering the evaporator). Figure 11 shows the resulting values, which range from 10 to 25 bar, almost linearly with the exhaust temperature. It is just a point to notice that the maximum pressure achieved is not so far from the critical point of the R245fa fluid and also represents a technical limitation for safety and technology of the components and materials [57].
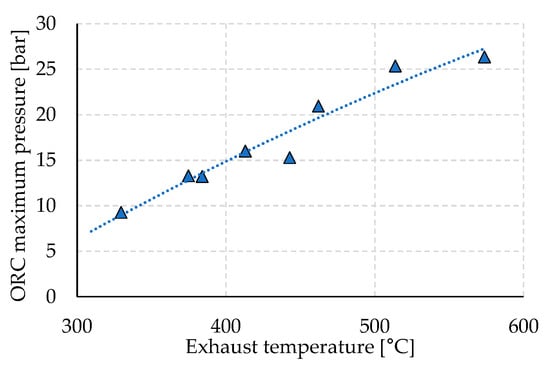
Figure 11.
ORC evaporating pressure and exhaust temperature, triangles for observed values, dotted line to represent the fit the data.
The evaporating pressure is also the parameter that sets the ORC efficiency since the condensing pressure is almost fixed at the value of 4 bar, related to the environmental conditions of the cold sink onboard. Figure 12 (left) shows the values of the ORC efficiency, evaluated according to the Equation (1), and ranging from 4% to 9.5%, at the maximum pressure:
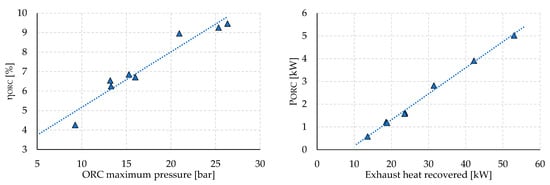
Figure 12.
(Left) ORC efficiency vs. evaporating pressure; (right) ORC net power recovered, triangles for observed values, dotted line to fit the data.
Finally, the net ORC power PORC is evaluated and plotted vs. the exhaust thermal power recovered from the engine in Figure 12, right. It is up to 5 kW in higher engine power conditions, where the recovered thermal power Pexh is equal to 53 kW.
4.1.2. Turbocompound
The second option investigated is a direct recovery, where the same exhaust gases are expanded in an additional turbine, placed downstream of the main turbine of the turbocharger (Figure 13). The possible recovery has been evaluated thanks to a 0D model, where the recovery turbine Taux is represented by a characteristic map (mass flow rate vs. pressure ratio vs. efficiency vs. rotational speed), derived from an existing one and adapted to the specific case study.
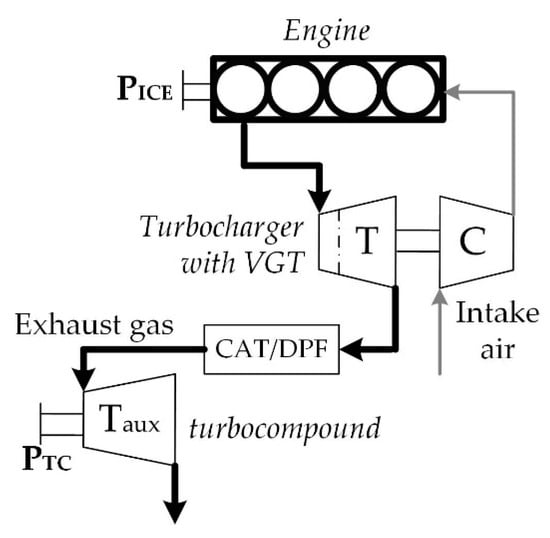
Figure 13.
Layout of the turbocompound under the engine exhaust.
The first result is the pressure ratio of the turbocompound βTC, which is related to the pressure admissible on the exhaust line since the outlet pressure is close to the environmental one. The growth in turbocompound pressure ratio increases the engine backpressure, although the presence of a Variable Geometry Turbocharger (VGT) mitigates this value on the exhaust manifold of the engine [58,59] and it is considered in the net power estimation (PTC, net). Figure 14 shows the turbocompound pressure ratio, which is linearly dependent on the exhaust temperature Texh (i.e., turbocompound inlet temperature) and ranges from 1.2 to 1.6. For engine exhaust temperatures lower than 350 °C, the available thermal power is not sufficient to drive the turbocompound, and the resulting pressure ratio is too low.
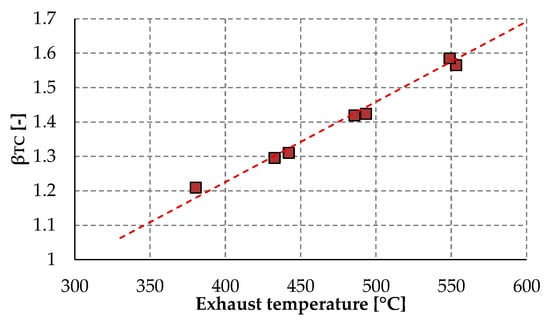
Figure 14.
Turbocompound pressure ratio and exhaust temperature (i.e., turbocompound inlet temperature), squares for observed values, dotted line to fit the data.
The operation of the turbocompound is evaluated thanks to a characteristic map of the additional turbine, where the efficiency ηTC is a function of the specific working point in terms of mass flow rate and pressure ratio. In Figure 15 (left), the efficiency is plotted as a function of the exhaust mass flow rate mexh: the values range from 55% to 68%, and this provides a possible optimization of the design of the machine for the specific application.
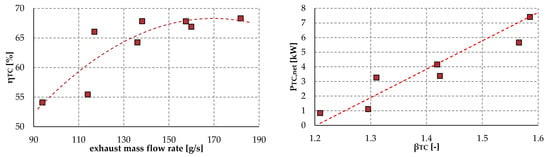
Figure 15.
(Left) Turbocompound efficiency vs. exhaust mass flow rate crossing the auxiliary turbine. (Right) Final net power recovered by the turbocompound vs. pressure ratio of the turbine, squares for observed values, dotted line to fit the data.
Finally, the net turbocompound power has been reported in Figure 15 (right). The values are up to 8 kW and linearly dependent on the pressure ratio across the auxiliary turbine. As already stated, this dependence is limited by the backpressure effect on the engine: if the pressure ratio on the turbine is higher, the side effect on the engine can overcome the increase in turbocompound power and nullify the recovery.
4.1.3. Engine Side Effects
The introduction of the WHR section on the exhaust gas line will produce an unavoidable engine backpressure increase. This could be more significant for the turbocompound specifically if it is placed downstream of the turbocharger (series turbocompound). However, if a parallel turbocompound is also considered, the rearrangement of the equilibrium of the turbocharger, to meet the request of the boost pressure and leave room for possible recovery, could produce a backpressure increase in the exhaust manifold. In this case, the possibility of introducing two sections of waste heat recovery, combining direct and indirect ways, can significantly increase the recovery and better exploit the available thermal energy from the exhausts [60].
Considering the ORC-based unit, the backpressure increase is strongly related to the permeability of the heat exchanger used as an evaporator on the gas side. In this case, the technology chosen for this component is crucial. Finned tube heat exchangers seem to have the best performances in this regard [61] and, if these pressure drops are limited (e.g., <100 mbar), the negative effect of the engine can be neglected. However, the introduction of the ORC unit is more invasive than the turbocompound and requires more space onboard. Moreover, it introduces a non-negligible extra weight, whose influence on the propulsive power should be estimated. But, considering the application of the H2-ICE project (i.e., 12 m bus), this extra weight may not be so significant if related to the overall weight of the vehicle and its payload.
4.2. SCR System
Although the H2-fueled engine is intended to operate with an extremely lean mixture, thus producing low NOx emissions, the target of the hybrid bus application is to reach almost zero emissions. Therefore, NOX abatement by the aftertreatment system is still mandatory and is at present based on SCR [62]. Currently, the SCR system is based on a technology that consists of reductive treatment with ammonia (NH3-SCR) to catalytically convert NOx into nitrogen (N2) and water (H2O) molecules. Due to the toxicity and hazardous nature of ammonia, it is produced in vehicles using an aqueous solution, called AdBlue, containing 32.5 wt.% urea CO(NH2)2 [63]. This additive is stored in a separate tank and injected before the SCR converter into the gas stream leaving the particulate filter, where the urea thermally decomposes to produce isocyanic acid (HNCO) and ammonia (NH3) [64]. Although ammonia and urea are currently the preferred choice for the selective catalytic reduction of NOx, hydrogen has recently attracted strong interest as a reducing agent, representing a rather interesting alternative. Indeed, in recent years, several researchers have focused their studies on the development of a suitable catalytic system for the selective catalytic reduction of NOx using hydrogen (H2-SCR [65,66,67]). The latter technology has several advantages: zero carbon footprint, as there is no formation of CO and CO2 molecules during NOx removal; formation of water from hydrogen combustion (O2 present in the gas stream); high NOx conversion activity at lower temperatures (T < 200 °C) with respect to NH3-SCR counterparts (T = 350–400 °C) [68]; possibility of drawing from a single tank using hydrogen also as a fuel to partially replace diesel or petrol in the combustion mixture. Four main reactions occur in selective catalytic reduction with hydrogen in the presence of oxygen, but the desiderated one has two NO molecules reacting with four hydrogen molecules to form N2 [62,65]. Studies reported so far in the literature have shown a low selectivity towards N2 production with undesirable productions of partially reduced species such as N2O and NH3.
As a first step, the preparation of suitable catalytic systems using palladium (Pd) as the active phase and metal oxides as supports is the object of the study. These catalytic systems could be deposited on monolithic cordierite support [69] for the realization of a system that can be implemented in the last stage of treatment in diesel engine flue gas purification. In particular, the catalytic support that is to be developed consists of the mixture of the two metal oxides CeO2 and ZrO2 and of a Pd-based active catalytic phase (hereinafter called PCZ). The catalytic systems were made by wet impregnation using 60 wt% CeO2 and 40 wt% ZrO2 properly mixed with deionized water at 40 °C for 2 h. Then, the catalytic support was dried in an oven at 120 °C for 12 h until completely dry. To the resulting powder, palladium nitrate hydrate (Pd(NO3)2 2H2O) was added so as to obtain a Pd loading of 1 wt.%, as from previous studies it appears to be the best in terms of NOx conversion and selectivity toward N2. Wet impregnation was performed at 70 °C at a constant pH of 9.5 (dropwise addition of a 0.25 M NH4OH solution), where a color change from white to brownish due to the presence of palladium is observed. The obtained catalytic system is first dried in an oven at 120 °C for 12 h and then calcined in air at 500 °C for 4 h. Figure 16 shows the diffraction patterns of the raw CeO2 (a) and ZrO2 (b) powders, of the mixture CeO2-ZrO2 (c), and the complete catalytic system (active phase and catalytic support) Pd/CeO2-ZrO2 (d). The CeO2-ZrO2 catalytic support (c) shows peaks attributable to the crystalline phases of the starting metal oxides and the Pd/CeO2-ZrO2 (PCZ) catalytic system (d) shows a diffraction pattern with narrower peaks than the only support. The crystalline phases of Pd cannot be appreciated due to the small quantity of metal on the catalytic support.
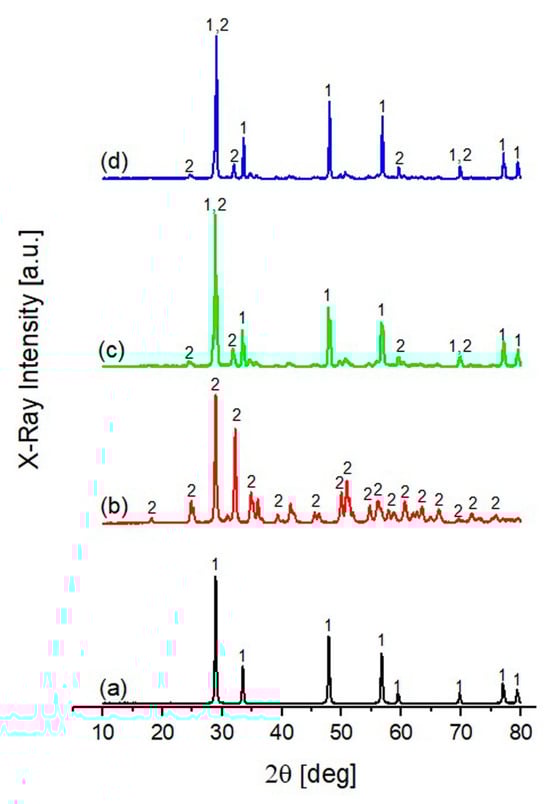
Figure 16.
X-ray diffraction pattern of CeO2 (a) and ZrO2 (b) precursor powders, CeO2-ZrO2 catalytic support (c) and catalytic system Pd/CeO2-ZrO2 (d); 1 = Cerianite, CeO2; 2 = Zirconium Oxide, ZrO2.
Figure 17 shows micrographs at various magnifications of the PCZ catalytic system. From these micrographs, it is possible to see a very regular and compact surface in which there is good interaction between the two metal oxides that act as the catalytic support. Specifically, one can observe areas (circled in red) with a regular spherical morphology attributable to cerium oxide and areas (circled in green) with a smaller average crystalline domain size attributable to zirconium oxide. The structure of the produced support material thus presents the two support oxides evenly distributed in space with exposed sites of both precursors.
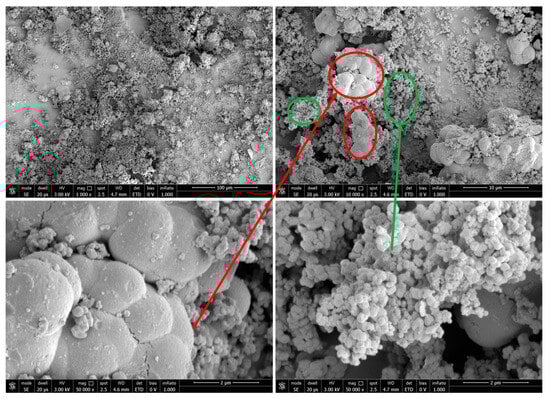
Figure 17.
SEM micrographs at various magnifications of the Pd/CeO2-ZrO2 catalytic system, regular spherical morphology circled in red and smaller averga cristallin domain circled in green.
As a second step, small-scale prototypes of coated cordierite substrate will be tested with real currents emitted by a diesel engine at the test bed, studying the degree of conversion and selectivity of the catalyst under different engine operating conditions and with different flow rates of H2. The experimental setup is schematized in Figure 18. The reagent mixture is obtained by flowing the exhaust gases downstream of the turbine. The hydrogen is injected into the prototype exhaust gas line upstream of the H2-SCR reactor.
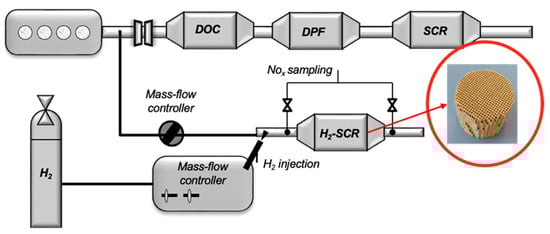
Figure 18.
Experimental setup scheme for the small-scale substrate prototype.
5. Engine and Hybrid Powertrain Management
The present section describes the development of the engine and hybrid powertrain management strategies. On the one hand, the load control of H2-ICEs is crucial to ensure good performance and low emissions: a proper control strategy is required to avoid the risk of combustion anomalies (e.g., knock and preignition) while limiting NOx emissions and enhancing engine efficiency. Since the 1D GT Power engine model of the H2-ICE featured in the present work has been already discussed [70] such a model has been exploited to generate a set of reference data that accurately represent the behavior of the engine. As a starting point, a fast-running engine model based on Artificial Neural Networks (ANNs) has then been developed, based on GT Power results. The advantage of such a model is the low computational time, which makes it suitable for the development of the H2-ICE control strategy using a Model-in-the-Loop (MIL) approach. On the other hand, since in a hybrid powertrain both fuel economy and pollutant emission reduction strongly depend on the exploitation of each energy source (i.e., fuel and battery), a supervisory high-level control strategy is mandatory to determine the power which has to be delivered by each source. Two methodologies have been developed for the design of the energy management strategies, the former based on a heuristic rule-based approach, the latter based on the minimization of the equivalent fuel consumption (ECMS) by means of Pontryagin’s Minimum Principle (PMP). Both approaches are intrinsically causal as they do not require the a priori knowledge of the mission profile, nevertheless this information is accounted for in the design process to improve the accuracy of the strategy in reaching a target SoC. It is worth noting that for urban buses, for which the route is defined a priori, this could be a non-critical issue.
5.1. Engine Model Description
The engine model has been developed in Matlab/Simulink starting from available data of the H2-ICE. To cover as much as possible the whole operating envelope, the engine model has been validated in a wide operational range for each of the controllable variables as shown in Table 6.
Table 6.
Engine Model Limits.
The engine model is necessarily coupled to the control strategy: indeed, the inputs of the model are the outputs of the control strategy, thus all the modeled quantities have to be directly or indirectly (e.g., derived from an intermediate block) calculated based on the control actions: this makes the simulation a loop including the engine model and the engine controller. The model outputs concern combustion metrics, and intake and exhaust conditions, as shown in the I/O sketch reported in Figure 19.
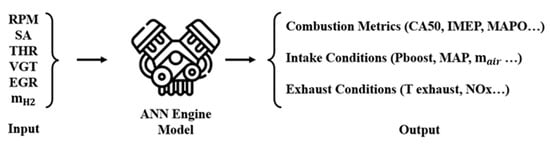
Figure 19.
Input and output of the engine model.
The modeling approach allows representing the cycle-by-cycle behavior: it can be explained by taking as an example the generation of Indicated Mean Effective Pressure (IMEP) as shown in Figure 20:
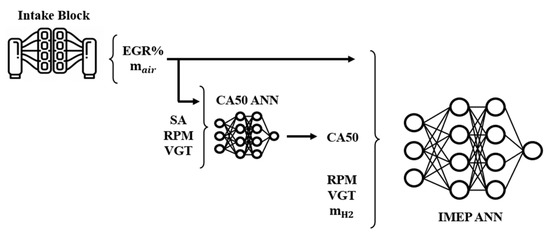
Figure 20.
Input and output of the engine model, IMEP example.
- The intake conditions, in terms of air mass and EGR percentage, are estimated from the intake block;
- RPM, Spark Advance (SA), mass of fuel, and the intake conditions are the input parameters for the Crank Angle of 50% Heat Release (CA50) ANN;
- CA50, intake conditions, mass of fuel, RPM, and VGT position are the input for the IMEP ANN.
Table 7 summarizes the accuracy of the engine model (compared to reference data) in steady-state conditions, in terms of Root Mean Square Error (RMSE) and percentual RMSE.
Table 7.
Engine Model Accuracy.
As shown in Table 7, the percentage RMSE is always lower than 1% for each predicted variable. Once the model has been validated in steady-state conditions, the capability of representing cycle-by-cycle variations is introduced. Specifically, two additional ANNs have been introduced to properly represent the statistical distribution of CA50, which propagates to other combustion metrics. For knock intensity, a further statistical dispersion is used to represent Maximum Amplitude Pressure Oscillation (MAPO) variations at fixed CA50 levels. Finally, the model has been completed with intake manifold and turbocharger dynamics. Figure 21 shows a comparison, in terms of BMEP, Brake Specific Fuel Consumption (BSFC), and NOx, between the GT Power and the Simulink model outputs in a transient simulation where RPM, VGT, Throttle Valve (THR), SA, and mass of injected fuel change. As it is possible to see, the model is capable of replicating the engine behavior in terms of torque production, consumption, and emissions.
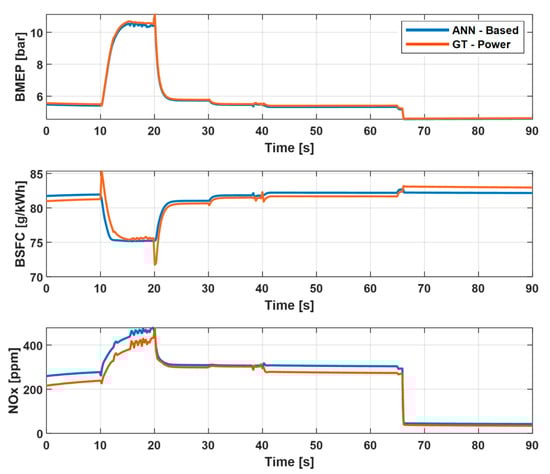
Figure 21.
BMEP, BSFC, and NOx simulated in GT Power in a transient simulation and BMEP simulated from the presented engine model.
Control Strategy Description
Once the engine model has been validated, a torque control strategy can be implemented. The inputs of the latter are the requested BMEP at the current RPM, the manifold and boost pressure, and the feedback from a combustion analyzer (CA50, Pcyl, max, and MAPO), as shown in Figure 22. Based on these inputs, the control strategy sets the position of the actuators (e.g., SA, THR, VGT, etc.).
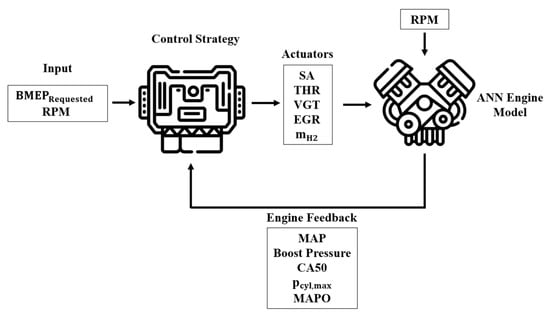
Figure 22.
Input and output of the control strategy.
In order to avoid abnormal combustions (e.g., knock, preignition, etc.) and limit NOx emissions, the lambda value has to be above 2.2, thus the load control can be directly managed with the amount of injected fuel. However, the fuel request has to be saturated between the knock and misfire conditions to keep the engine in safe operating conditions. As regards combustion phasing, proper control of the CA50 position results is crucial in order to maximize efficiency without compromising reliability. For this purpose, a CA50-based control strategy has been implemented. The target CA50 is defined as a function of the current operating condition (RPM, load request, EGR, and lambda) and is saturated under knocking conditions. The SA allowing achievement of the target CA50 for the current conditions is then calculated using a dedicated ANN. Moreover, the open loop positions of the THR, VGT, and EGR settings are calculated from calibrated maps as a function of engine speed and load request. Finally, a closed loop control has been developed, on manifold pressure and boost pressure, acting respectively on THR and VGT. Figure 23 shows an example of the control strategy behavior. As can be noticed, the engine is also capable of following the BMEP request under transient conditions.
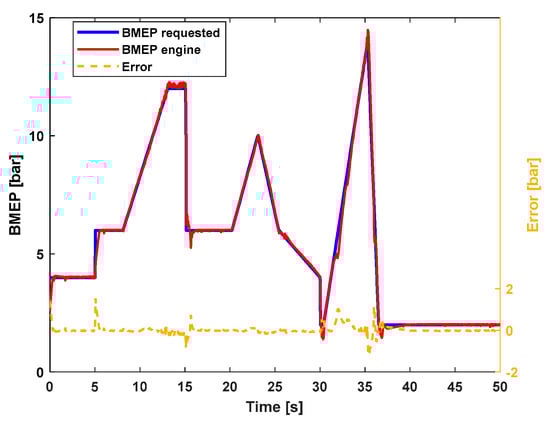
Figure 23.
BMEP request, BMEP provided, and error.
Figure 24 shows the actuator (THR, VGT, SA, fuel) settings and the corresponding achieved CA50. It is worth noticing how after a sudden drop in the requested BMEP, the control strategy saturates the minimum requestable fuel and retards the CA50 to keep the BMEP on target.
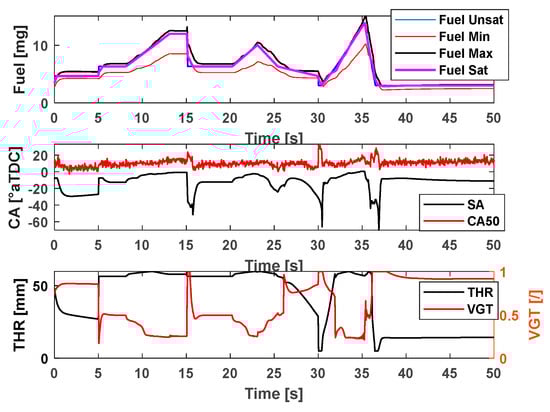
Figure 24.
Fuel, SA, CA50, THR, and VGT over time.
5.2. Hybrid Powertrain Management
The Energy Management Strategy (EMS) of the hybrid powertrain is aimed at controlling the power provided by the range extender (i.e., ICE-EG) in order to guarantee sustaining the battery charge with the minimum energy consumption. A vehicle model has been developed for the EMS design and simulation, according to the data flow shown in Figure 25. Starting from fitting the experimental data of the various vehicle components and vehicle parameters, the optimal operating points of the range extender were identified as a function of speed and torque through an optimization process. This is made possible by the series architecture of the powertrain, which allows its fixed-point operation.
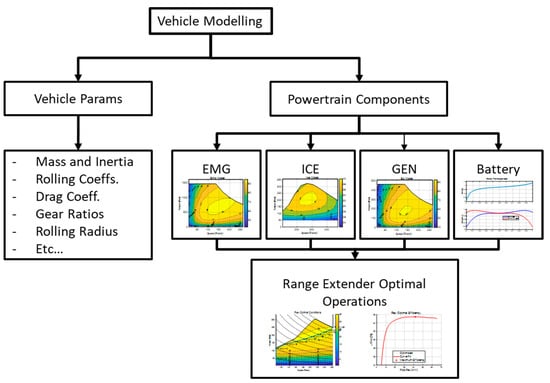
Figure 25.
Vehicle Modeling Data Flow.
Two Energy Management Strategies (EMSs) have been developed. Specifically, a heuristic rule-based strategy and an optimal strategy based on the minimization of the equivalent fuel consumption by means of the Pontryagin Minimum Principle (PMP). The rule-based strategy has been implemented to achieve a causal non-optimal benchmark to be used as a reference for tuning the optimized PMP strategy.
5.2.1. Rule-Based Strategy
The EMS consists of a Rule-Based (RB) controller of the ICE-EG, in which the state variable is the battery SoC [16], as can be seen in Equation (2):
The initial State of Charge (SoC) level, denoted as , represents the starting point, while is the final SoC desired. The ICE-EG is activated when SoC decreases down to the lower threshold, , while it is deactivated when the SoC reaches the upper threshold, . These thresholds vary with time and are calculated based on the target SoC () multiplied by predefined tolerance (Max and Min) factors. This ensures that the target SoC stays within a defined window throughout the simulation. The two thresholds and decrease along the driving transient, in accordance with the expected battery discharge rate ().
An additional activation threshold for the ICE-EG () is also provided, in which, in the event of excessive battery discharge, more power is requested to cope with an unexpected increase in load. The flow chart of the rule-based EMS is shown in Figure 26.
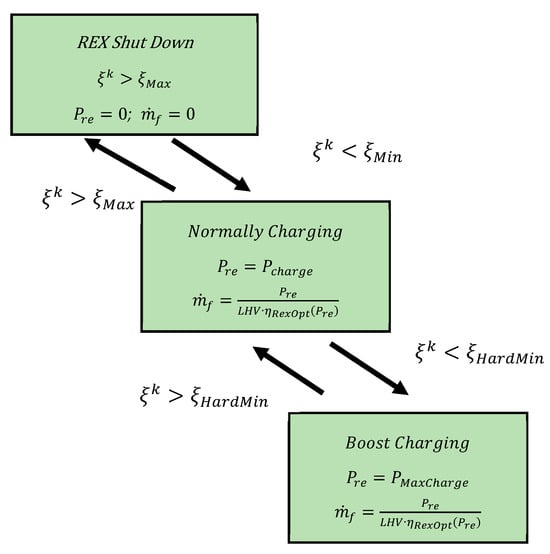
Figure 26.
Rule-Based Flow Chart.
Pre denotes the selected delivered power by ICE-EG, which can fluctuate between two power levels: Pchg where maximum efficiency is achieved, and representing the maximum delivered power by the ICE-EG when the SoC reaches the second lower threshold (). is the fuel consumption. Figure 27 shows the time trajectory of the battery SoC with the different SoC thresholds for a generic driving cycle.
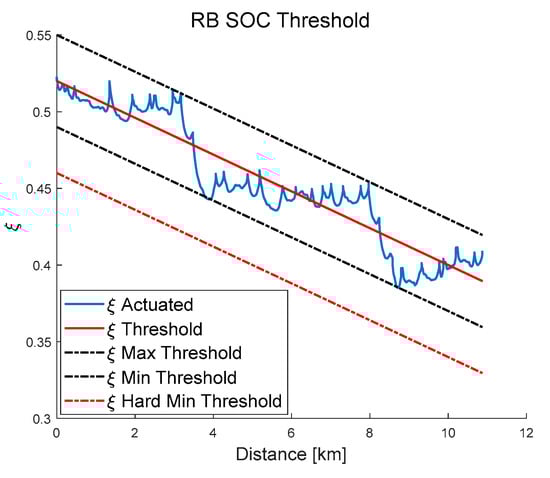
Figure 27.
SoC Thresholds.
5.2.2. Equivalent Consumption Minimization Strategy
The Pontryagin Minimum Principle (PMP) is a crucial tool in the study of optimal control problems for dynamic systems. It addresses the challenge of finding the best trajectory that minimizes a given performance criterion, subject to the system’s dynamics and constraints. Further theoretical details on the principle can be found in [71], while examples of its application to the HEV powertrain control can be found, e.g., in [72,73].
In the current application, the problem is formulated by considering the battery State of Charge (SoC) as the state variable and the battery power ( as a control variable. The Hamiltonian can be defined as the sum of the fuel mass consumed by the engine and an equivalent fuel mass consumed by the electric motor weighted by an equivalence factor, represented by the co-state (λ), thus leading to an Equivalent Consumption Minimization Strategy (ECMS). The co-state drives the solution alternatively towards battery charging or battery depletion and the ECMS-based technique minimizes the Hamiltonian while adjusting the equivalent factor dynamically over time to guarantee the charge is sustained throughout the whole reference driving cycle. Figure 28 shows the results of the co-state identification and the deviation of the final SoC vs. the target value corresponding to the initial one.
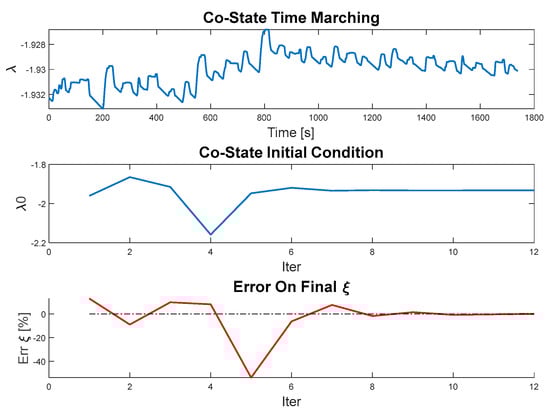
Figure 28.
Co-State Identification results.
Table 8 compares the results in terms of fuel consumption and powertrain efficiency achieved by the two proposed EMSs (i.e., RB and PMP) for the three driving cycles considered. It can be noted that the use of the optimization strategy leads to an improvement (on average, 9%) compared to the use of the causal strategy. It is worth noting that the fuel consumption is still higher than the imposed target of 10 kg/100 km, nevertheless, a significant reduction is expected to be achieved by further improvements in engine combustion system and control, implementation of WHR technologies, and further refinement of the EMS. Figure 29 shows the time trajectories of the SoC and cumulative fuel consumption, evidencing that both RB and PMP guarantee suitable charge sustaining throughout the whole driving cycle though the former EMS exhibits a larger SoC deviation from the mean value, especially in Braunschweig and MLTB cycles.
Table 8.
Simulations results: PMP vs. RB.
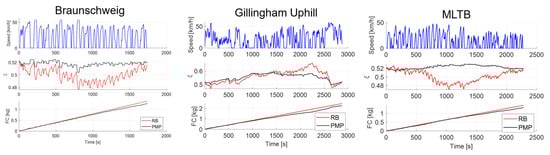
Figure 29.
Fuel consumption and state of charge time trajectories achieved by RB and PMP for the three driving cycles. Braunschweig (left), Gillingham (center), MLTB (right).
Where the powertrain efficiency, , is defined as in Equation (3):
6. Conclusions and Future Steps
In the present work, preliminary results achieved to date from the H2-ICE project were presented. A comprehensive methodology has been developed to support the design of engine concepts and vehicle subsystems for the efficient exploitation of H2 as a fuel, as well as for their integration in a hybrid powertrain for an urban bus application. High-fidelity CFD models have been developed and validated to assess the potential of different injection options from Port Fuel Injection (PFI) to Direct Injection (DI), with different levels of nozzle designs and pressure ratios, and to control and optimize the combustion, setting a maximum of λ = 3 to keep the combustion efficiency above 85%. Two different Waste Heat Recovery (WHR) systems have been analyzed and tested to enhance engine efficiency at higher levels: for a direct heat recovery system based on the Organic Rankine Cycle (ORC), a net recovered power of 5 kW has been obtained in higher-engine-power conditions, while for an indirect turbocompound it is up to 8 kW recovered power, limited by engine backpressure effects. Regarding the aftertreatment system, the preparation of suitable catalytic systems for the Selective Catalytic Reduction (SCR) of NOx using hydrogen as a reducing agent has been completed. Moreover, a dedicated control strategy has been developed exploiting a fast-running engine model based on Artificial Neural Networks (ANNs) together with the torque control strategy. Finally, two approaches to an Energy Management System (EMS) have been tested to target the desired fuel consumption (i.e., 0.1 kg/km) and to guarantee a suitable SCR operation: a Rule-Based (RB) approach and an optimal strategy based on the equivalent fuel consumption minimization (ECMS). A gain in the fuel consumption near 10% is obtained with the PMP strategy with respect to the RB one in the different considered driving cycles. Future steps of the project will be focused on:
- further developing the engine combustion system, also exploiting the outcomes of the upcoming experimental campaign on the mentioned single-cylinder optical-access engine, to further decrease the hydrogen consumption,
- assessing the capability of the two WHR systems tested for different operating conditions and considering the possibility of introducing two sections of WHR, combining direct and indirect ways to increase the recovery,
- giving additional insights on the behavior of the H2-SCR reactor with the experimental testing of small-scale prototypes in a wide range of operating conditions,
- optimizing the Energy Management System (EMS) to reach the desired target in terms of fuel consumption, together with the H2-ICE optimization, over the different mission profiles.
Then, the final outcome of the project would be not only the development of a traction system for a new generation of H2-ICE but also the enhancement of the know-how for sustainable H2 exploitation in the context of public transport mobility.
Author Contributions
Conceptualization, I.A., M.B., R.C., E.C. and F.M; methodology, P.P.B., D.D.B., B.P.P., A.O., F.M., L.R. and J.Z.; validation, P.P.B., D.D.B., A.O., L.R. and J.Z., formal analysis, I.A., M.B., R.C., E.C. and F.M.; investigation, P.P.B., D.D.B., A.O., L.R. and J.Z.; writing—original draft preparation, I.A., M.B., P.P.B., D.D.B., A.O., B.P.P. and J.Z.; writing—review and editing, I.A., B.P.P., M.B., R.C., E.C., F.M. and L.R.; supervision, I.A., M.B., R.C., E.C. and F.M.; project administration, I.A., M.B., R.C., E.C. and F.M.; funding acquisition, I.A., M.B., R.C., E.C. and F.M. All authors have read and agreed to the published version of the manuscript.
Funding
Research funded by Ministero dell’Istruzione, dell’Università e della Ricerca (MIUR) (2020R92Y3Z).
Data Availability Statement
The data presented in this study are partially available on request from the corresponding author.
Conflicts of Interest
The authors declare no conflict of interest.
Abbreviations
| ANN | Artificial Neural Networks |
| BEV | Battery Electric Vehicle |
| BMEP | Break Mean Effective Pressure |
| BSFC | Brake Specific Fuel Consumption |
| CA50 | Crank Angle of 50% Heat Release |
| CFD | Computational Fluid Dynamics |
| DI | Direct Injection |
| DP | Dynamic Programming |
| EGR | Exhaust Gas Recirculation |
| EM | Electric Motor |
| EMS | Energy Management System |
| EU | European Union |
| FCEV | Fuel Cell Electric Vehicle |
| GHG | Greenhouse Gas |
| HDV | Heavy-Duty Vehicle |
| ICE | Internal Combustion Engine |
| ICE-EG | Internal Combustion Engine—Range Extender |
| IMEP | Indicated Mean Effective Pressure |
| IVO | Intake Valve Opening |
| LDV | Light-Duty Vehicle |
| LES | Large Eddy Simulation |
| LFP | Lithium-Ferro-Phosphate |
| MAPO | Maximum Amplitude of Pressure Oscillations |
| MIL | Model-in-the-Loop |
| NMC | Nickel Manganese Cobalt Oxide |
| NPR | Nozzle Pressure Ratio |
| ORC | Organic Rankine Cycle |
| Pcyl, max | Maximum In-Cylinder Pressure |
| PFI | Port Fuel Injection |
| PM | Permanent Magnet |
| PMP | Pontryagin Minimum Principle |
| RANS | Reynolds-Averaged Navier–Stokes |
| RB | Rule Based |
| RMSE | Root Mean Square Error |
| RPM | Revolutions Per Minute |
| SA | Spark Advance |
| SCR | Selective Catalytic Reduction |
| SoC | State of Charge |
| SoI | Start of Injection |
| SOpHy | Sandia’s Optical Hydrogen Engine |
| Tcyl, max | Maximum In-Cylinder Temperature |
| THR | Throttle Valve |
| V2X | Vehicle To Everything |
| VGT | Variable Geometry Turbocharger |
| WF | Working Fluid |
| WHR | Waste Heat Recovery |
References
- UNECE. European Green Deal: Commission Proposes Transformation of EU Economy and Society to Meet Climate Ambitions. 2021. Available online: https://ec.europa.eu/commission/presscorner/detail/en/IP_21_3541 (accessed on 31 July 2023).
- IEA. Largest End Uses of Energy by Sector in Selected IEA Countries. Available online: https://www.iea.org/data-and-statistics/charts/largest-end-uses-of-energy-by-sector-in-selected-iea-countries-2019 (accessed on 31 July 2023).
- EEA. Greenhouse Gas Emissions from Transport in Europe. 2023. Available online: https://www.eea.europa.eu/ims/greenhouse-gas-emissions-from-transport (accessed on 31 July 2023).
- ACEA. Fact Sheet: CO2 Standards for Heavy-Duty Vehicles. 2023. Available online: https://www.acea.auto/fact/fact-sheet-co2-standards-for-heavy-duty-vehicles/ (accessed on 31 July 2023).
- European Commission. Proposal for a Regulation of the European Parliament and of the Council Amending Regulation (EU) 2019/1242 as Regards Strengthening the CO2 Emission Performance Standards for New Heavyduty Vehicles and Integrating Reporting Obligations, and Repealing Regulation (EU) 2018/956; European Commission: Brussels, Belgium, 2023. [Google Scholar]
- Zhang, C.; Zhao, X.; Sacchi, R.; You, F. Trade-off between critical metal requirement and transportation decarbonization in automotive electrification. Nat. Commun. 2023, 14, 1616. [Google Scholar] [CrossRef] [PubMed]
- Mareev, I.; Becker, J.; Sauer, D.U. Battery dimensioning and life cycle costs analysis for a heavy-duty truck considering the requirements of long-haul transportation. Energies 2018, 11, 55. [Google Scholar] [CrossRef]
- Çabukoglu, E.; Georges, G.; Küng, L.; Pareschi, G.; Boulouchos, K. Battery electric propulsion: An option for heavy-duty vehicles? Results from a Swiss case-study. Transp. Res. Part C Emerg. Technol. 2018, 88, 107–123. [Google Scholar] [CrossRef]
- Moriarty, P.; Honnery, D. Prospects for hydrogen as a transport fuel. Int. J. Hydrogen Energy 2019, 44, 16029–16037. [Google Scholar] [CrossRef]
- Sharma, S.; Ghoshal, S.K. Hydrogen the future transportation fuel: From production to applications. Renew. Sustain. Energy Rev. 2015, 43, 1151–1158. [Google Scholar] [CrossRef]
- Kim, H.; Hartmann, N.; Zeller, M.; Luise, R.; Soylu, T. Comparative tco analysis of battery electric and hydrogen fuel cell buses for public transport system in small to midsize cities. Energies 2021, 14, 4384. [Google Scholar] [CrossRef]
- Vodovozov, V.; Raud, Z.; Petlenkov, E. Review of Energy Challenges and Horizons of Hydrogen City Buses. Energies 2022, 15, 6945. [Google Scholar] [CrossRef]
- Heid, B.; Martens, C.; Orthofer, A. How Hydrogen Combustion Engines Can Contribute to Zero Emissions; McKinsey & Company: Chicago, IL, USA, 2021. [Google Scholar]
- Verhelst, S. Recent progress in the use of hydrogen as a fuel for internal combustion engines. Int. J. Hydrogen Energy 2014, 39, 1071–1085. [Google Scholar] [CrossRef]
- Verhelst, S.; Wallner, T. Hydrogen-fueled internal combustion engines. Prog. Energy Combust. Sci. 2009, 35, 490–527. [Google Scholar] [CrossRef]
- HyFLEET:CUTE, Hydrogen Transport, Bus Technology & Fuel for Today and for a Sustainable Future. 2023. Available online: https://cordis.europa.eu/project/id/19991 (accessed on 31 July 2023).
- SunLine Transit Agency Hydrogen-Powered Transit Buses: Third Evaluation Report. Available online: https://www.nrel.gov/docs/fy08osti/43741-1.pdf (accessed on 31 July 2023).
- Matthias, N.S.; Wallner, T.; Scarcelli, R. A Hydrogen Direct Injection Engine Concept that Exceeds U.S. DOE Light-Duty Efficiency Targets. SAE Int. J. Engines 2012, 5, 838–849. [Google Scholar] [CrossRef]
- Golisano, R.; Scalabrini, S.; Arpaia, A.; Pesce, F.; Vassallo, A.; Borgia, F.; Cubito, C.; Biasin, V.; Knichel, T.; Millo, F.; et al. Hydrogen Internal Combustion Engine & KERS: An Appealing Value-Proposition for Green Power Pack. In Proceedings of the 42nd International Vienna Motor Symposium, Online, 29–30 April 2021. [Google Scholar]
- Koch, T.D.; Sousa, A.; Bertram, D. H2-Engine Operation with EGR Achieving High Power and High Efficiency Emission-Free Combustion; SAE Technical Papers 2019-01-2178; SAE: Warrendale, PA, USA, 2019. [Google Scholar] [CrossRef]
- Millo, F.; Rolando, L.; Fuso, R.; Zhao, J. Development of a new hybrid bus for urban public transportation. Appl. Energy 2015, 157, 583–594. [Google Scholar] [CrossRef]
- Wang, L.; Yang, Z.; Huang, Y.; Liu, D.; Duan, J.; Guo, S.; Qin, Z. The effect of hydrogen injection parameters on the quality of hydrogen–air mixture formation for a PFI hydrogen internal combustion engine. Int. J. Hydrogen Energy 2017, 42, 23832–23845. [Google Scholar] [CrossRef]
- Li, Y.; Gao, W.; Zhang, P.; Ye, Y.; Wei, Z. Effects study of injection strategies on hydrogen-air formation and performance of hydrogen direct injection internal combustion engine. Int. J. Hydrogen Energy 2019, 44, 26000–26011. [Google Scholar] [CrossRef]
- Dhyani, V.; Subramanian, K.A. Fundamental characterization of backfire in a hydrogen fuelled spark ignition engine using CFD and experiments. Int. J. Hydrogen Energy 2019, 44, 32254–32270. [Google Scholar] [CrossRef]
- Keck, M.; Bessey, D.; Buehler, F.; Manuel, D.; Faiß, E. Hydrogen Storage Technologies. In International MTZ Conference on Heavy-Duty Engines; Springer Fachmedien Wiesbaden: Wiesbaden, Germany, 2022; pp. 123–130. [Google Scholar]
- Ringler, J.; Gerbig, F.; Eichlseder, H.; Wallner, T. Insights into the development of a hydrogen combustion process with internal mixture formation. In Proceedings of the Sixth International Symposium on Internal Combustion Engine Diagnostics, Baden Baden, Germany, 15–16 June 2004; pp. 290–304. [Google Scholar]
- Scarcelli, R.; Kastengren, A.L.; Powell, C.F.; Wallner, T.; Matthias, N.S. High-pressure gaseous injection: A comprehensive analysis of gas dynamics and mixing effects. In Proceedings of the ASME 2012 Internal Combustion Engine Division Fall Technical Conference, ICEF 2012, Vancouver, BC, Canada, 23–26 September 2012; pp. 793–801. [Google Scholar] [CrossRef]
- Scarcelli, R.; Wallner, T.; Matthias, N.; Salazar, V.; Kaiser, S. Mixture Formation in Direct Injection Hydrogen Engines: CFD and Optical Analysis of Single-and Multi-Hole Nozzles. SAE Int. J. Engines 2011, 4, 2361–2375. [Google Scholar] [CrossRef]
- Di Battista, D.; Di Bartolomeo, M.; Villante, C.; Cipollone, R. On the limiting factors of the waste heat recovery via ORC-based power units for on-the-road transportation sector. Energy Convers. Manag. 2018, 155, 68–77. [Google Scholar] [CrossRef]
- Väliheikki, A.; Petallidou, K.C.; Kalamaras, C.M.; Kolli, T.; Huuhtanen, M.; Maunula, T.; Keiski, R.L.; Efstathiou, A.M. Selective catalytic reduction of NOx by hydrogen (H2-SCR) on WOx-promoted CezZr1−zO2 solids. Appl. Catal. B 2014, 156–157, 72–83. [Google Scholar] [CrossRef]
- Hegde, B.; Ahmed, Q.; Rizzoni, G. Velocity and energy trajectory prediction of electrified powertrain for look ahead control. Appl. Energy 2020, 279, 115903. [Google Scholar] [CrossRef]
- Kivekäs, K.; Lajunen, A.; Vepsäläinen, J.; Tammi, K. City bus powertrain comparison: Driving cycle variation and passenger load sensitivity analysis. Energies 2018, 11, 1755. [Google Scholar] [CrossRef]
- Transport for London: London Exhaust Emissions Study: A summary of the Drive Cycle Development, Test Programme and Comparison of Test Data Compared with Type Approval Data. Available online: https://content.tfl.gov.uk/london-exhaust-emissions-study-drive-cycle-development.pdf (accessed on 31 July 2023).
- Vassallo, A.; Pesce, F.; Arpaia, A.; Millo, F.; Rolando, L.; Piano, A.; Bianco, A. Ultra-lean Combustion System Optimization for H2-fuelled ICEs via Synergistic Application of 1D- and 3D-CFD. In Proceedings of the SIA International Conference and Exhibition on Powertrain & Power Electronics, Paris, France, 9–10 June 2021; pp. 1–9. [Google Scholar]
- ZeEUS eBus Report #2 An Updated Overview of Electric Buses in Europe. Available online: https://zeeus.eu/uploads/publications/documents/zeeus-ebus-report-2.pdf (accessed on 31 July 2023).
- EL-Refaie, A.M. Electrical Machines for Traction and Propulsion Applications. In Transportation Electrification: Breakthroughs in Electrified Vehicles, Aircraft, Rolling Stock, and Watercraft; John Wiley & Sons: Hoboken, NJ, USA, 2023; pp. 1–26. [Google Scholar]
- Shaobo, X.; Qiankun, Z.; Xiaosong, H.; Yonggang, L.; Xianke, L. Battery sizing for plug-in hybrid electric buses considering variable route lengths. Energy 2021, 226, 120368. [Google Scholar] [CrossRef]
- Carlsson, L.O.; Larsson, D.; Sauer, A.; Speckens, F.W. High-performance Battery for Premium Class Hybrid Vehicles. MTZ Worldw. 2021, 82, 28–35. [Google Scholar] [CrossRef]
- Ellingsen, L.A.W.; Thorne, R.J.; Wind, J.; Figenbaum, E.; Romare, M.; Nordelöf, A. Life cycle assessment of battery electric buses. Transp. Res. D Transp. Environ. 2022, 112, 103498. [Google Scholar] [CrossRef]
- A123 Systems Nanophosphate® High Power Lithium-Ion Cell. Available online: https://www.batteryspace.com/prod-specs/6610.pdf (accessed on 31 July 2023).
- Rahantamialisoa, F.N.Z.; Zembi, J.; Miliozzi, A.; Sahranavardfard, N.; Battistoni, M. CFD simulations of under-expanded hydrogen jets under high-pressure injection conditions. J. Phys. Conf. Ser. 2022, 2385, 012051. [Google Scholar] [CrossRef]
- Duronio, F.; Ranieri, S.; Di Mascio, A.; Vita, A. De Simulation of high pressure, direct injection processes of gaseous fuels by a density-based OpenFOAM solver. Phys. Fluids 2021, 33, 066104. [Google Scholar] [CrossRef]
- Rahantamialisoa, F.; Battistoni, M.; Miliozzi, A.; Sahranavardfard, N.; Zembi, J. Investigations on Hydrogen Injections Using a Real-Fluid Approach; SAE Technical Papers 2023-01-0312; SAE: Warrendale, PA, USA, 2023. [Google Scholar] [CrossRef]
- Panda, J.; Seasholtz, R.G. Measurement of shock structure and shock-vortex interaction in underexpanded jets using Rayleigh scattering. Phys. Fluids 1999, 11, 3761–3777. [Google Scholar] [CrossRef]
- Hamzehloo, A.; Aleiferis, P.G. LES and RANS modelling of under-expanded jets with application to gaseous fuel direct injection for advanced propulsion systems. Int. J. Heat Fluid Flow 2019, 76, 309–334. [Google Scholar] [CrossRef]
- Engine Combustion Network (ECN). Available online: https://ecn.sandia.gov/ (accessed on 31 July 2023).
- Zembi, J.; Cruccolini, V.; Mariani, F.; Scarcelli, R.; Battistoni, M. Modeling of thermal and kinetic processes in non-equilibrium plasma ignition applied to a lean combustion engine. Appl. Therm. Eng. 2021, 197, 117377. [Google Scholar] [CrossRef]
- Zembi, J.; Battistoni, M.; Mariani, F.; Irimescu, A.; Vaglieco, B.M.; Merola, S.S. Investigations on the impact of port water injection on soot formation in a DISI engine through CFD simulations and optical methods. Fuel 2023, 337, 127170. [Google Scholar] [CrossRef]
- Salazar, V.; Kaiser, S. Interaction of Intake-Induced Flow and Injection Jet in a Direct-Injection Hydrogen-Fueled Engine Measured by PIV; SAE 2011 World Congress and Exhibition; Technical Paper 2011-01-0673; SAE: Warrendale, PA, USA, 2011. [Google Scholar] [CrossRef]
- Ó Conaire, M.; Curran, H.J.; Simmie, J.M.; Pitz, W.J.; Westbrook, C.K. A comprehensive modeling study of hydrogen oxidation. Int. J. Chem. Kinet. 2004, 36, 603–622. [Google Scholar] [CrossRef]
- Zembi, J.; Battistoni, M.; Mariani, F.; Irimescu, A.; Merola, S.S. Pressure and Flow Field Effects on Arc Channel Characteristics for a J-Type Spark Plug; SAE Technical Papers 2022-01-0436; SAE: Warrendale, PA, USA, 2022. [Google Scholar] [CrossRef]
- Di Battista, D.; Di Bartolomeo, M.; Cipollone, R. Flow and thermal management of engine intake air for fuel and emissions saving. Energy Convers. Manag. 2018, 173, 46–55. [Google Scholar] [CrossRef]
- Dickes, R.; Dumont, O.; Legros, A.; Quoilin, S.; Lemort, V. Analysis and comparison of different modeling approaches for the simulation of a micro-scale organic Rankine cycle power plant. In Proceedings of the ASME-ORC 2015, Brussels, Belgium, 12–14 October 2015. [Google Scholar]
- Legros, A.; Guillaume, L.; Diny, M.; Lemort, V. Modelling, sizing and testing a scroll expander for a waste heat recovery application on a gasoline engine. In IOP Conference Series: Materials Science and Engineering; IOP Publishing: Bristol, UK, 2015; Volume 90. [Google Scholar] [CrossRef]
- Fatigati, F.; Vittorini, D.; Coletta, A.; Cipollone, R. Assessment of the differential impact of scroll and sliding vane rotary expander permeability on the energy performance of a small-scale solar-ORC unit. Energy Convers. Manag. 2022, 269, 116169. [Google Scholar] [CrossRef]
- Marchionni, M.; Fatigati, F.; Di Bartolomeo, M.; Di Battista, D.; Petrollese, M. Experimental and Numerical Dynamic Investigation of an ORC System for Waste Heat Recovery Applications in Transportation Sector. Energies 2022, 15, 9339. [Google Scholar] [CrossRef]
- Di Battista, D.; Cipollone, R. Waste Energy Recovery and Valorization in Internal Combustion Engines for Transportation. Energies 2023, 16, 3503. [Google Scholar] [CrossRef]
- Di Battista, D.; Carapellucci, R.; Cipollone, R. Integrated evaluation of Inverted Brayton cycle recovery unit bottomed to a turbocharged diesel engine. Appl. Therm. Eng. 2020, 175, 115353. [Google Scholar] [CrossRef]
- Shi, M.; Wang, H.; Yang, C.; Wang, Y.; Niu, X. Experimental Research on the Matching Characteristics of the Compound VGT-STC System with a V-Type Diesel Engine. Machines 2022, 10, 788. [Google Scholar] [CrossRef]
- Di Battista, D.; Di Bartolomeo, M.; Cipollone, R. Full energy recovery from exhaust gases in a turbocharged diesel engine. Energy Convers. Manag. 2022, 271, 116280. [Google Scholar] [CrossRef]
- Di Bartolomeo, M.; Di Battista, D.; Fatigati, F.; Cau, G.; Cipollone, R. Direct and Indirect Exhaust Heat Recovery from Turbocharged Heavy-Duty Engine; SAE Technical Paper 2023-24-0122; SAE: Warrendale, PA, USA, 2023. [Google Scholar] [CrossRef]
- Savva, Z.; Petallidou, K.C.; Damaskinos, C.M.; Olympiou, G.G.; Stathopoulos, V.N.; Efstathiou, A.M. H2-SCR of NOx on low-SSA CeO2-supported Pd: The effect of Pd particle size. Appl. Catal. A Gen. 2021, 615, 118062. [Google Scholar] [CrossRef]
- Nanba, T.; Kohno, C.; Masukawa, S.; Uchisawa, J.; Nakayama, N.; Obuchi, A. Improvements in the N2 selectivity of Pt catalysts in the NO-H2-O2 reaction at low temperatures. Appl. Catal. B 2003, 46, 353–364. [Google Scholar] [CrossRef]
- Granger, P.; Dhainaut, F.; Pietrzik, S.; Malfoy, P.; Mamede, A.S.; Leclercq, L.; Leclercq, G. An overview: Comparative kinetic behaviour of Pt, Rh and Pd in the NO + CO and NO + H2 reactions. Top. Catal. 2006, 39, 65–76. [Google Scholar] [CrossRef]
- Zheng, L.; Casapu, M.; Stehle, M.; Deutschmann, O.; Grunwaldt, J.D. Selective Catalytic Reduction of NOx with Ammonia and Hydrocarbon Oxidation Over V2O5–MoO3/TiO2 and V2O5–WO3/TiO2 SCR Catalysts. Top. Catal. 2019, 62, 129–139. [Google Scholar] [CrossRef]
- Lang, W.; Laing, P.; Cheng, Y.; Hubbard, C.; Harold, M.P. Co-oxidation of CO and propylene on Pd/CeO2-ZrO2 and Pd/Al2O3 monolith catalysts: A light-off, kinetics, and mechanistic study. Appl. Catal. B 2017, 218, 430–442. [Google Scholar] [CrossRef]
- Sheng, L.; Ma, Z.; Chen, S.; Lou, J.; Li, C.; Li, S.; Zhang, Z.; Wang, Y.; Yang, H. Mechanistic insight into N2O formation during NO reduction by NH3 over Pd/CeO2 catalyst in the absence of O2. Chin. J. Catal. 2019, 40, 1070–1077. [Google Scholar] [CrossRef]
- Zhang, Q.; Geng, G.N.; Wang, S.W.; Richter, A.; He, K. Bin Satellite remote sensing of changes in NOx emissions over China during 1996–2010. Chin. Sci. Bull. 2012, 57, 2857–2864. [Google Scholar] [CrossRef]
- Khoder, M.I. Atmospheric conversion of sulfur dioxide to particulate sulfate and nitrogen dioxide to particulate nitrate and gaseous nitric acid in an urban area. Chemosphere 2002, 46, 675–684. [Google Scholar] [CrossRef]
- Millo, F.; Piano, A.; Rolando, L.; Accurso, F.; Gullino, F.; Roggio, S.; Bianco, A.; Pesce, F.; Vassallo, A.; Rossi, R. Synergetic Application of Zero-, One-, and Three-Dimensional Computational Fluid Dynamics Approaches for Hydrogen-Fuelled Spark Ignition Engine Simulation. SAE Int. J. Engines 2021, 15, 561–580. [Google Scholar] [CrossRef]
- Liberzon, D. Calculus of Variations and Optimal Control Theory: A Concise Introduction; Princeton University Press: Princeton, NJ, USA, 2011. [Google Scholar]
- Onori, S.; Serrao, L.; Rizzoni, G. Hybrid Electric Vehicles: Energy Management Strategies; Springer: Berlin/Heidelberg, Germany, 2016. [Google Scholar]
- Donatantonio, F.; Ferrara, A.; Polverino, P.; Arsie, I.; Pianese, C. Novel Approaches for Energy Management Strategies of Hybrid Electric Vehicles and Comparison with Conventional Solutions. Energies 2022, 15, 1972. [Google Scholar] [CrossRef]
Disclaimer/Publisher’s Note: The statements, opinions and data contained in all publications are solely those of the individual author(s) and contributor(s) and not of MDPI and/or the editor(s). MDPI and/or the editor(s) disclaim responsibility for any injury to people or property resulting from any ideas, methods, instructions or products referred to in the content. |
© 2023 by the authors. Licensee MDPI, Basel, Switzerland. This article is an open access article distributed under the terms and conditions of the Creative Commons Attribution (CC BY) license (https://creativecommons.org/licenses/by/4.0/).