Article

Short-Term Photovoltaic Power Generation Prediction Model Based on Improved Data Decomposition and Time Convolution Network

1
Tianjin Key Laboratory for Advanced Mechatronic System Design and Intelligent Control, School of Mechanical Engineering, Tianjin University of Technology, Tianjin 300384, China
2
National Demonstration Center for Experimental Mechanical and Electrical Engineering Education(Tianjin University of Technology), Tianjin 300384, China
*
Authors to whom correspondence should be addressed.
Energies 2024, 17(1), 33; https://doi.org/10.3390/en17010033
Submission received: 13 November 2023 / Revised: 16 December 2023 / Accepted: 17 December 2023 / Published: 20 December 2023
(This article belongs to the Section A2: Solar Energy and Photovoltaic Systems)

Abstract

:
In response to the volatility of photovoltaic power generation, this paper proposes a short-term photovoltaic power generation prediction model (HWOA-MVMD-TPA-TCN) based on a Hybrid Whale Optimization Algorithm (HWOA), multivariate variational mode decomposition (MVMD), temporal pattern attention mechanism (TPA), and temporal convolutional network (TCN). In order to improve the accuracy of photovoltaic power generation forecasting, HWOA-MVMD is used for data decomposition, the Minimum Mode Overlap Component (MMOC) is used as the objective function, the photovoltaic power generation sequence is decomposed into finite Intrinsic Mode Functions (IMFs) according to the optimal solution, and the training set is formed with key meteorological variable data such as total radiation (unit: W/m2), ambient temperature, and humidity. Then, the TPA-TCN model is used to train the sub-sequences, the final predicted values are obtained after superimposing the reconstruction of the prediction results, and finally the prediction error of the photovoltaic power generation data is studied. The proposed method is applied to real photovoltaic power generation data from a commercial center in Tianjin and is compared with HWOA-MVMD-BiLSTM, GWO-MVMD-TPA-TCN, and TPA-TCN prediction models. The simulation results demonstrate that the MAE value of the forecast method proposed in this paper is 1.95 MW and the RMSE value is 2.55 MW, which can be reduced by up to 33.74% and 38.85%, respectively. The HWOA-MVMD-TPA-TCN-based short-term photovoltaic power generation prediction model presented in this paper achieves higher prediction accuracy and superior performance, serving as a valuable reference for related research.

1. Introduction

With the rapid development of photovoltaic power generation, the impact of large-scale photovoltaic grid connections on the power system is becoming more and more obvious, and accurate short-term photovoltaic power generation prediction can effectively alleviate the pressure caused by photovoltaic grid connections on the power system, which is of great significance to ensure the stable operation of the power grid and the reasonable allocation of resources [1,2]. Therefore, obtaining reliable data for the power generation forecast of photovoltaic power plants has also become an important issue [3].
In recent years, research in photovoltaic power generation forecasting has predominantly focused on artificial intelligence technologies, utilizing machine learning and neural networks to capture the randomness of photovoltaic power generation sequences [4]. Table 1 shows the current research status.
While there are many forecasting methods as mentioned above, they often struggle to effectively capture nonlinearity in time series data that exhibit dynamic and complex behaviors with multiple variables. Many data points within these sequences may not be adequately represented, which can directly impact the final prediction results, potentially leading to forecast errors exceeding acceptable limits. Therefore, this paper proposes a short-term photovoltaic power generation prediction model based on the HWOA-MVMD-TPA-TCN. This approach utilizes HWOA-MVMD to decompose the photovoltaic power generation sequence comprehensively, reducing the sequence complexity while deeply mining data features. The obtained subsequences and key meteorological factors are used as inputs for iterative training in the TPA-TCN. The prediction results for each subsequence are then aggregated and reconstructed to obtain the final forecast value. When compared to HWOA-MVMD-BiLSTM, GWO-MVMD-TPA-TCN, and TPA-TCN models, the proposed forecasting model demonstrates a higher level of prediction accuracy. This approach not only provides valuable insights for energy forecasting but also has the potential to be applied in a broader context of energy prediction.
The overall organization of this article is as follows: The first chapter is an introduction. The second chapter introduces data decomposition, using a multivariational mode to decompose photovoltaic power generation data and using the improved Hybrid Whale Algorithm to optimize the hyperparameters of multivariational modal decomposition. The third chapter presents iterative training using the results and key meteorological factors obtained in the second chapter as the input of the TPA-TCN. The fourth chapter presents the prediction process of the short-term photovoltaic power generation prediction model based on the HWOA-MVMD-TPA-TCN, and the fifth chapter presents the analysis of an example.

2. Optimization of Multivariate Variational Modal Decomposition

2.1. Common Data Decomposition Methods

From the current research status, data decomposition methods generally fall into several categories, as shown in Table 2. These methods were used in many aspects, such as wind power prediction [27], bearing fault diagnosis [28], and the low-frequency oscillation mode identification of power systems [29]. These methods often exhibit certain issues during the data decomposition process.
According to Table 2, there are currently two main issues with data decomposition methods: (1) In signal decomposition, the selection of primary parameters is often based on past empirical experience, which limits the results of the decomposition. (2) Problems exist such as modal aliasing, endpoint effects, and difficulty in determining stopping conditions. To address these issues, this paper employs an improved Hybrid Whale Optimization Algorithm. It defines the modal overlap component as the fitness function, and when this indicator reaches its minimum value, the independence and correlation between different modal components are maximized. This helps avoid modal aliasing. At this point, the corresponding optimal combination of intrinsic mode numbers and penalty factors is achieved, preventing under-decomposition or over-decomposition phenomena.

2.2. Hybrid Whale Optimization Algorithm

The Whale Optimization Algorithm (WOA) has the advantages of simple operation and few setting parameters and has been widely used in the optimization of target problems. And the introduction of the WOA in the prediction model can effectively search the solution space and find the global optimal solution or the approximate optimal solution. However, the traditional WOA is prone to fall into local optima, and the global search capability and local development capability are unbalanced [30]. Therefore, this article improves on the traditional WOA.

2.2.1. Tent Mapping

The Whale Optimization Algorithm (WOA), like most swarm intelligence optimization algorithms, initially starts with a random distribution of individuals, which can lead to population clustering and poor diversity. The population may struggle to achieve a uniform distribution throughout the search space. To enhance the performance of the Whale Optimization Algorithm, Tent Mapping is applied in the optimization process of the WOA [30]. The Tent Mapping formula is as follows:
If 0 < x j < 0.5 :
x j + 1 = δ × x j
If 0.5 x j 1 :
x j + 1 = δ 1 x j
Assuming a population size of N , we obtain a population χ = χ j , j = 1 , 2 , N , where δ = 0 , 2 is the chaos parameter, and the larger the value of this parameter, the better the chaotic effect. x j is the position of each whale in the search space. Therefore, when δ = 2 , the population’s exploration capability and the algorithm’s solving speed are expected to be superior to other mapping methods.

2.2.2. Elite Reverse Learning Strategy

First, by employing a group selection strategy, after generating reverse solutions from elite individuals, the s individuals with lower fitness values are selected as the next generation’s whale individuals [31].
In a D-dimensional space, if there is a feasible solution X = x 1 , x 2 , , x n , then its reverse solution X ¯ = x ¯ 1 , x ¯ 2 , , x ¯ n , which is an elite individual in the population, corresponds to the extremum point X i , j e in the whale population itself. X i , j e X i , 1 e , X i , 1 e , , X i , n e i = 1 , 2 , , s ; j = 1 , 2 , , n is set as its reverse solution X ¯ i , j e X ¯ i , 1 e , X ¯ i , 1 e , , X ¯ i , n e , which can be defined as X ¯ i , j e X ¯ i , 1 e , X ¯ i , 1 e , , X ¯ i , n e , where γ is a random number between 0 and 1, and α j and β j are dynamic boundaries.
The elite reverse learning strategy can effectively enhance the diversity of the population and, when there are many selectable solution variables, using fitness-based sorting significantly improves the search efficiency of the algorithm. Additionally, for each generation of the whale population, the use of the elite reverse learning strategy can generate reverse solutions that are not near extremum points. This can help the algorithm escape local optima, strengthen its global optimization capabilities, and enhance algorithm stability. Lastly, incorporating dynamic boundaries can preserve the algorithm’s search experience, aiding convergence, and improving both local exploitation and global exploration capabilities. This speeds up the algorithm’s convergence rate.

2.2.3. Nonlinear Adaptive Weight Strategy

Taking into consideration the impact of the target prey, which is the optimal location, on the whale population during the hunting process in the original WOA (Whale Optimization Algorithm), a weight is introduced before the optimal location. This weight represents the degree to which the current whale individual inherits the previous generation’s optimal location [32]. The whale position updating formula is as follows:
X i T = 1 = ω X b T A × D 1 ,   p < 0.5
X i T = 1 = ω X b T D 2 e Z M cos 2 π M ,   p 0.5
The weight ω , which controls the variation in the whale individual positions, is adjusted by using the following calculation formula:
ω = ω 1 + ω 1 ω 2 2 π arccos T T M A X
where ω 1 is the initial weight value, ω 2 is the final weight value, T represents the current iteration count, and T M A X represents the maximum iteration count.
The Hybrid Whale Optimization Algorithm (HWOA) is built upon the foundation of the WOA but incorporates the use of Tent chaotic mapping to initialize positions within the search space. It employs MMOC (Multi-Modal Optimization Competition) as the objective function and introduces both elite reverse learning and nonlinear adaptive weight strategies. This not only accelerates the algorithm’s convergence speed but also enhances its capability to track global minimum modes. By using the Hybrid Whale Algorithm to search and update the positions of the whales, it aims to find the optimal solution, ultimately improving the global search capability and the computational accuracy of the algorithm.

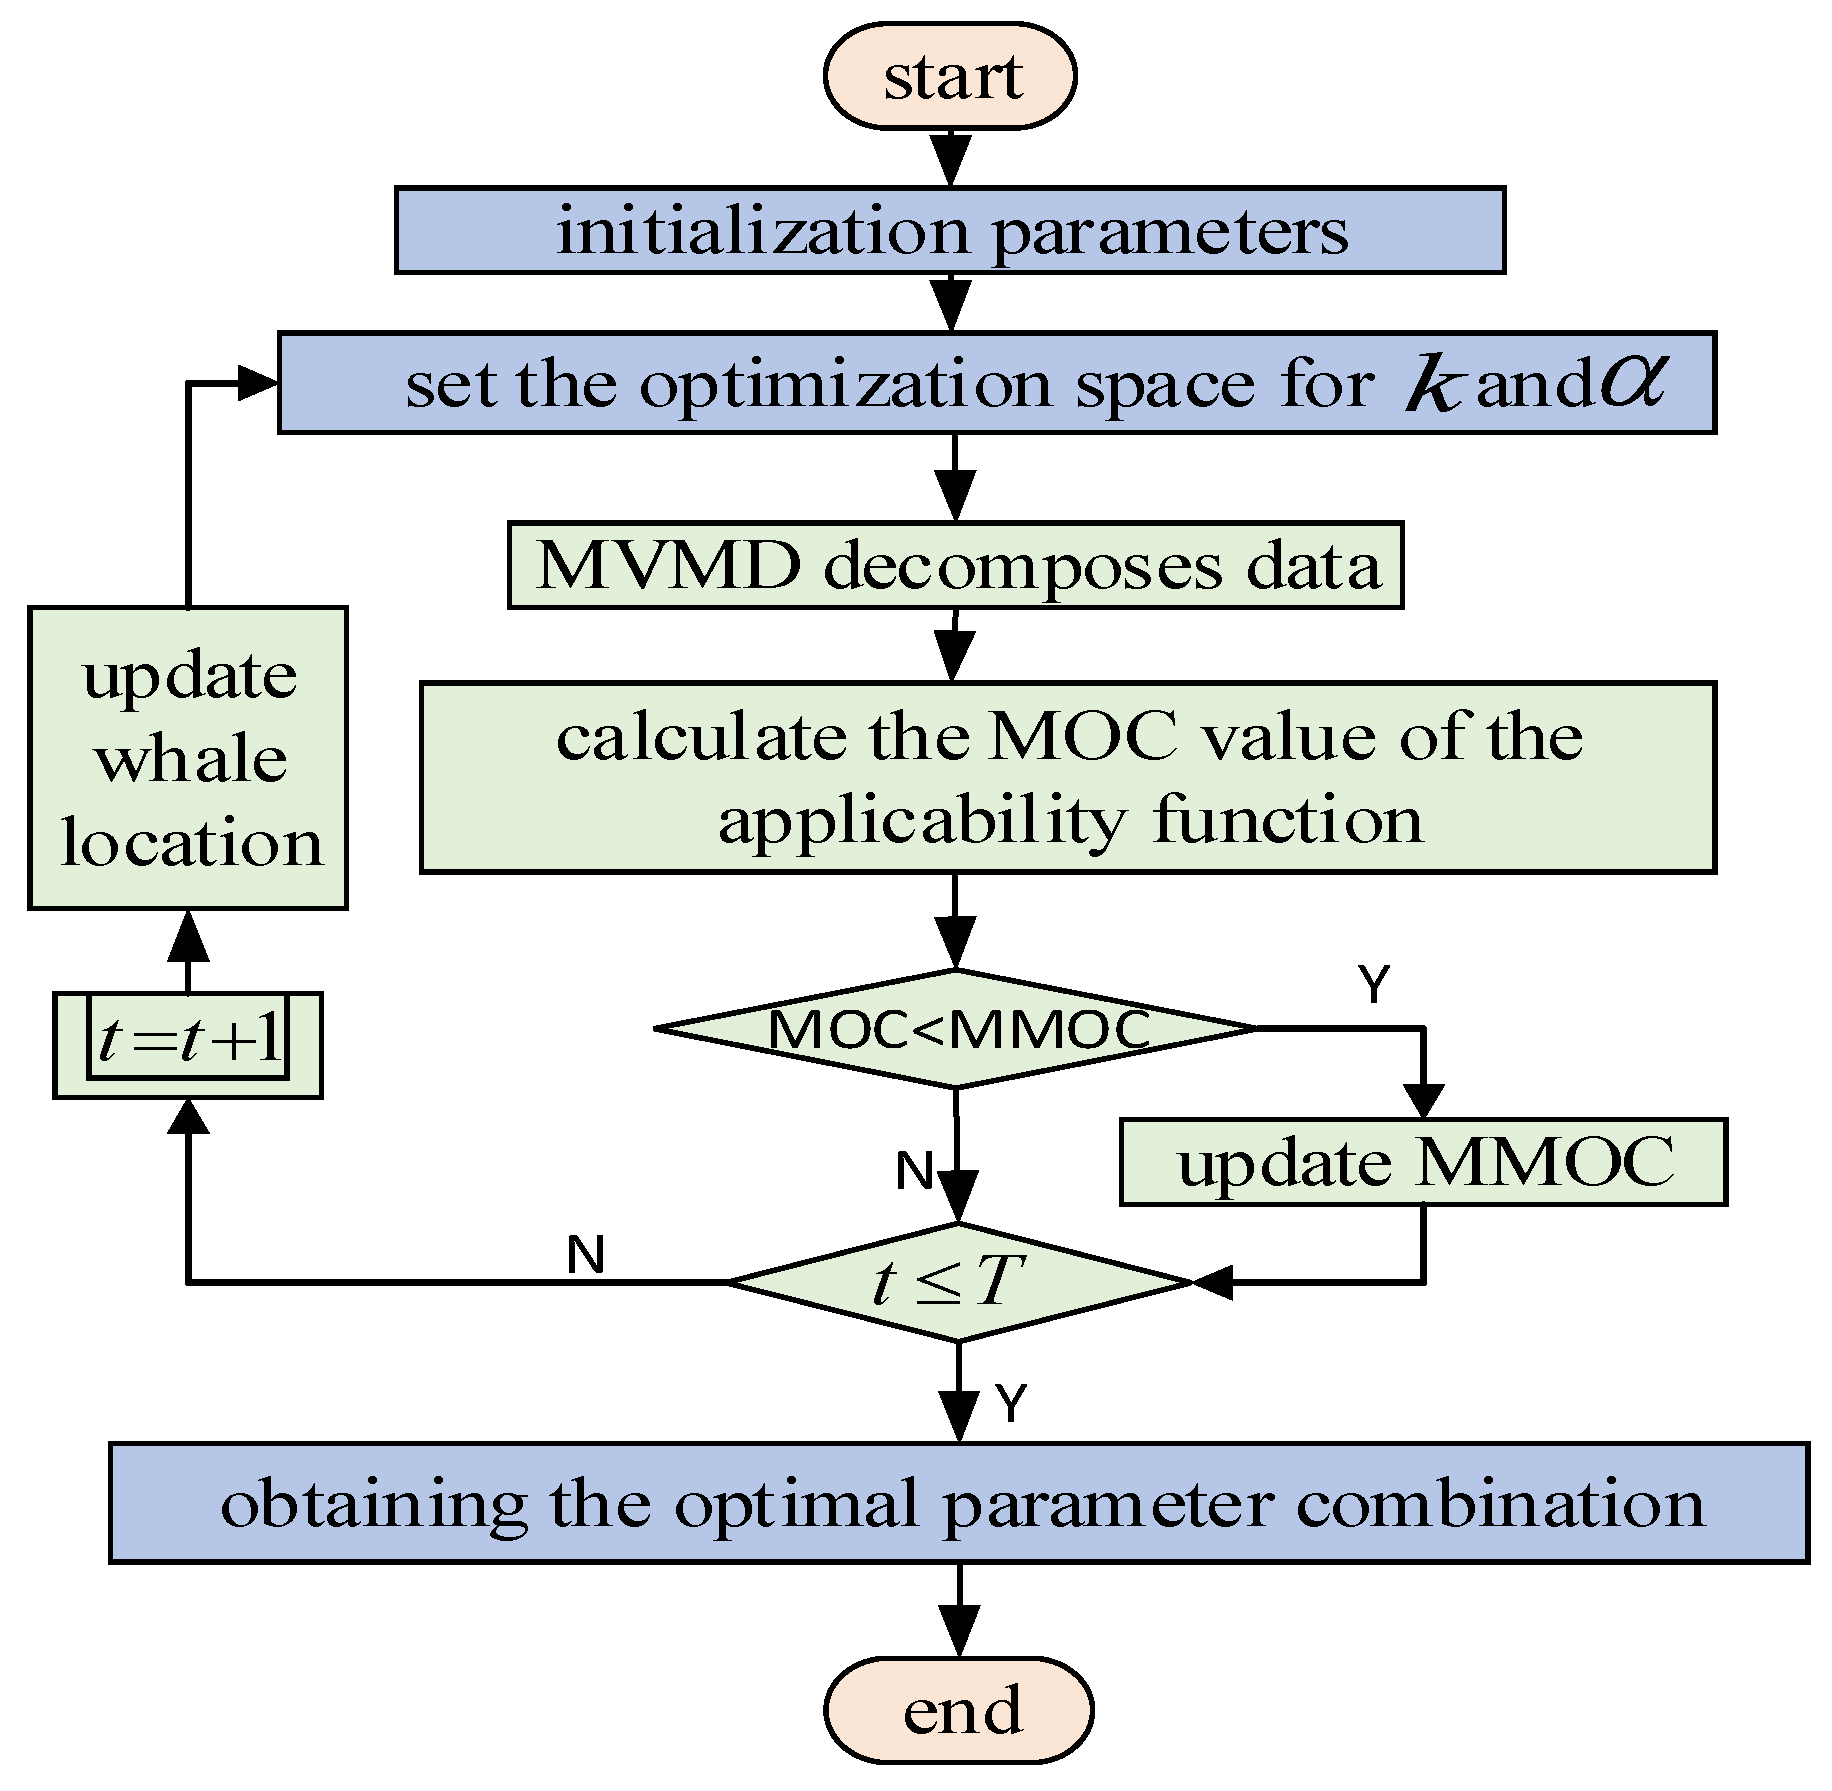
2.3. HWOA-MVMD Algorithm

MVMD is a typical data decomposition algorithm, which has good generalization ability when dealing with sample data decomposition problems. In practice, the selection of eigenmode numbers k and penalty parameters α is often subjective, which will directly affect the generalization ability and decomposition accuracy of the algorithm, and the core idea of the algorithm is to construct a variational problem for solving the modality [33], so the Hybrid Whale Optimization Algorithm is used to optimize these two parameters to achieve the optimal decomposition effect.
The improved multivariate variational modal decomposition applies the HWOA to the parameter optimization of MVMD, allowing the algorithm to set parameters based on the characteristics of the signal itself and achieve the best decomposition effect. The flowchart of the proposed HWOA-MVMD algorithm is shown in Figure 1, and the detailed implementation steps are as follows:
(1)
Set the whale population size, maximum number of iterations, optimization parameter optimization space, and initialization population position;
(2)
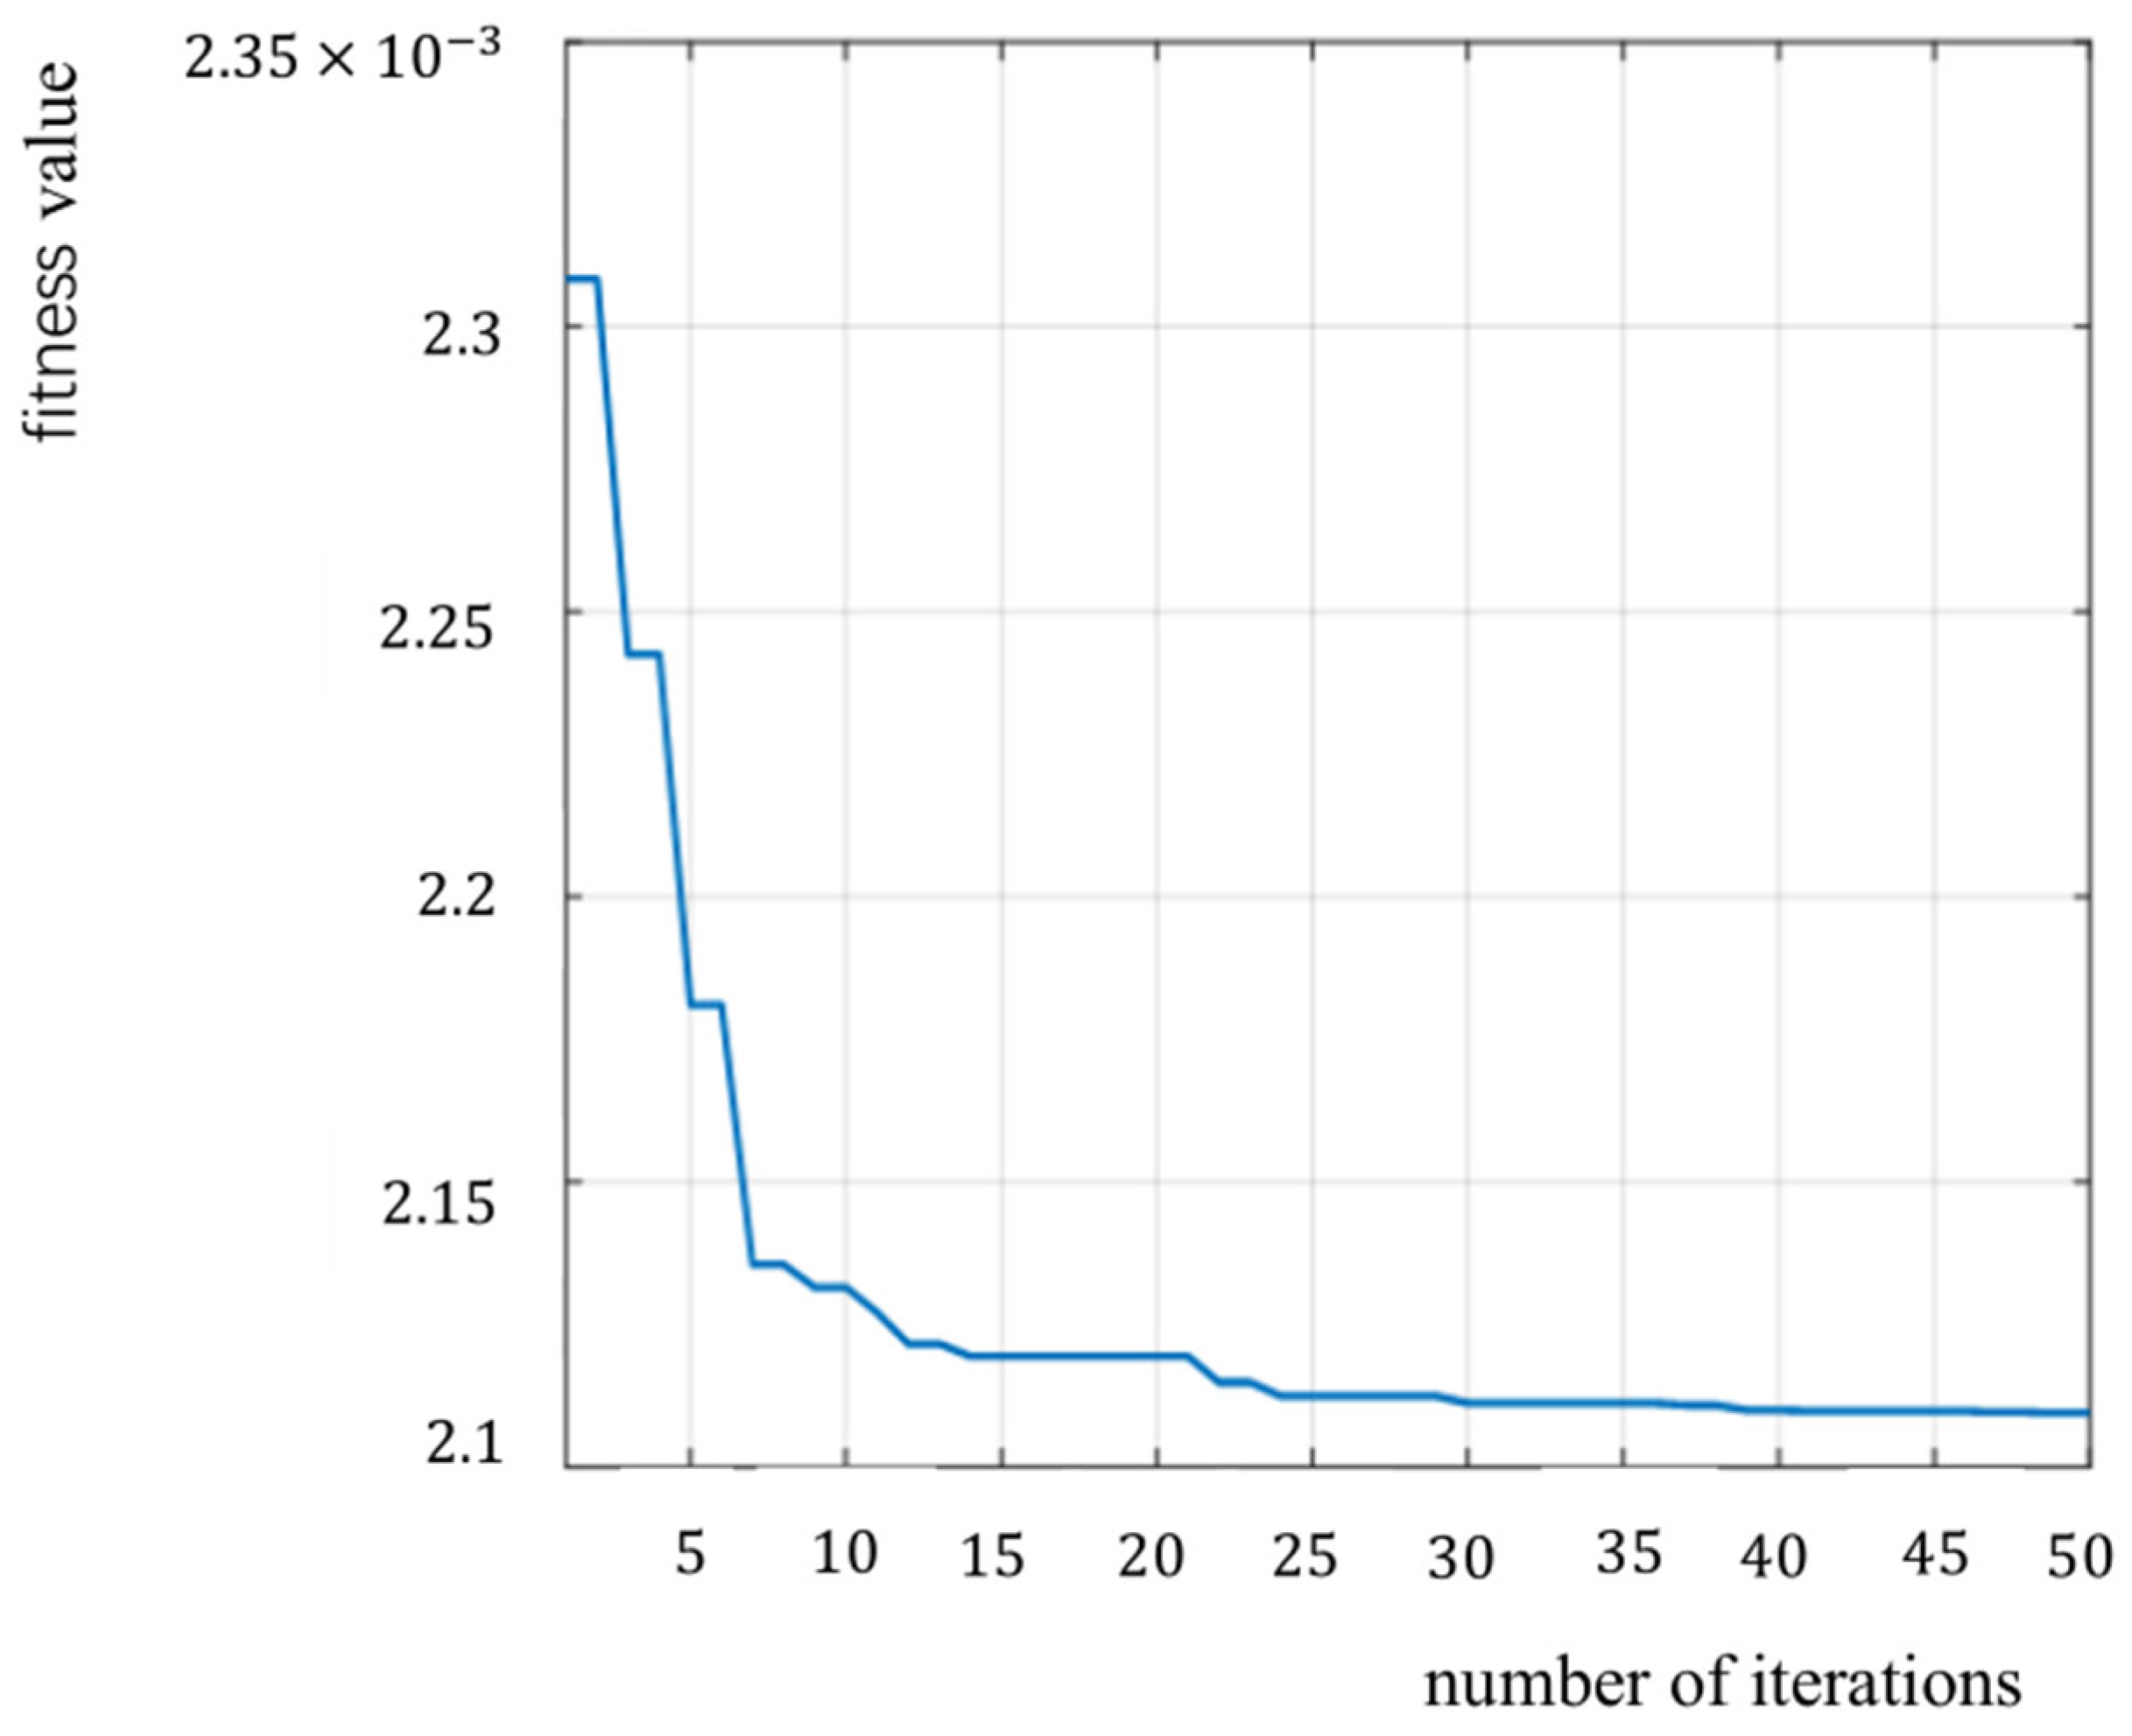
Take the minimum modal overlap component as the fitness function, calculate the fitness value according to the position of the population, and save the current optimal value;
(3)
Search for the optimal individual update search area, and update the position of the whale’s next iteration according to the fitness value level;
(4)
Determine whether the termination conditions are met: if it is met, jump out of the loop to execute step (5); otherwise, re-execute steps (2)–(3);
(5)
Save the result of the final global optimal solution [ k 0 , α 0 ]; HWOA-MVMD will decompose the original data according to the parameter optimal solution to obtain different modal components.
Figure 1. Flow chart of HWOA-MVMD algorithm.
Energies 17 00033 g001

3. TPA-TCN Prediction Model

3.1. Analysis of Photovoltaic Power Generation Characteristics

Solar energy has the advantages of being renewable, pollution-free, and low-cost. There are significant differences in climate types across regions, which has a significant impact on the characteristics of photovoltaic power generation. Various factors have led to the uncontrollability of natural solar energy, and photovoltaic power generation has significant randomness and volatility. In order to improve the accuracy of photovoltaic power generation prediction, according to the correlation analysis between each influencing factor and photovoltaic power generation [34], the main influencing factors considered in this paper include total radiation (unit: W/m2), direct radiation, scattered radiation, ambient temperature, wind speed, humidity, and atmospheric pressure.

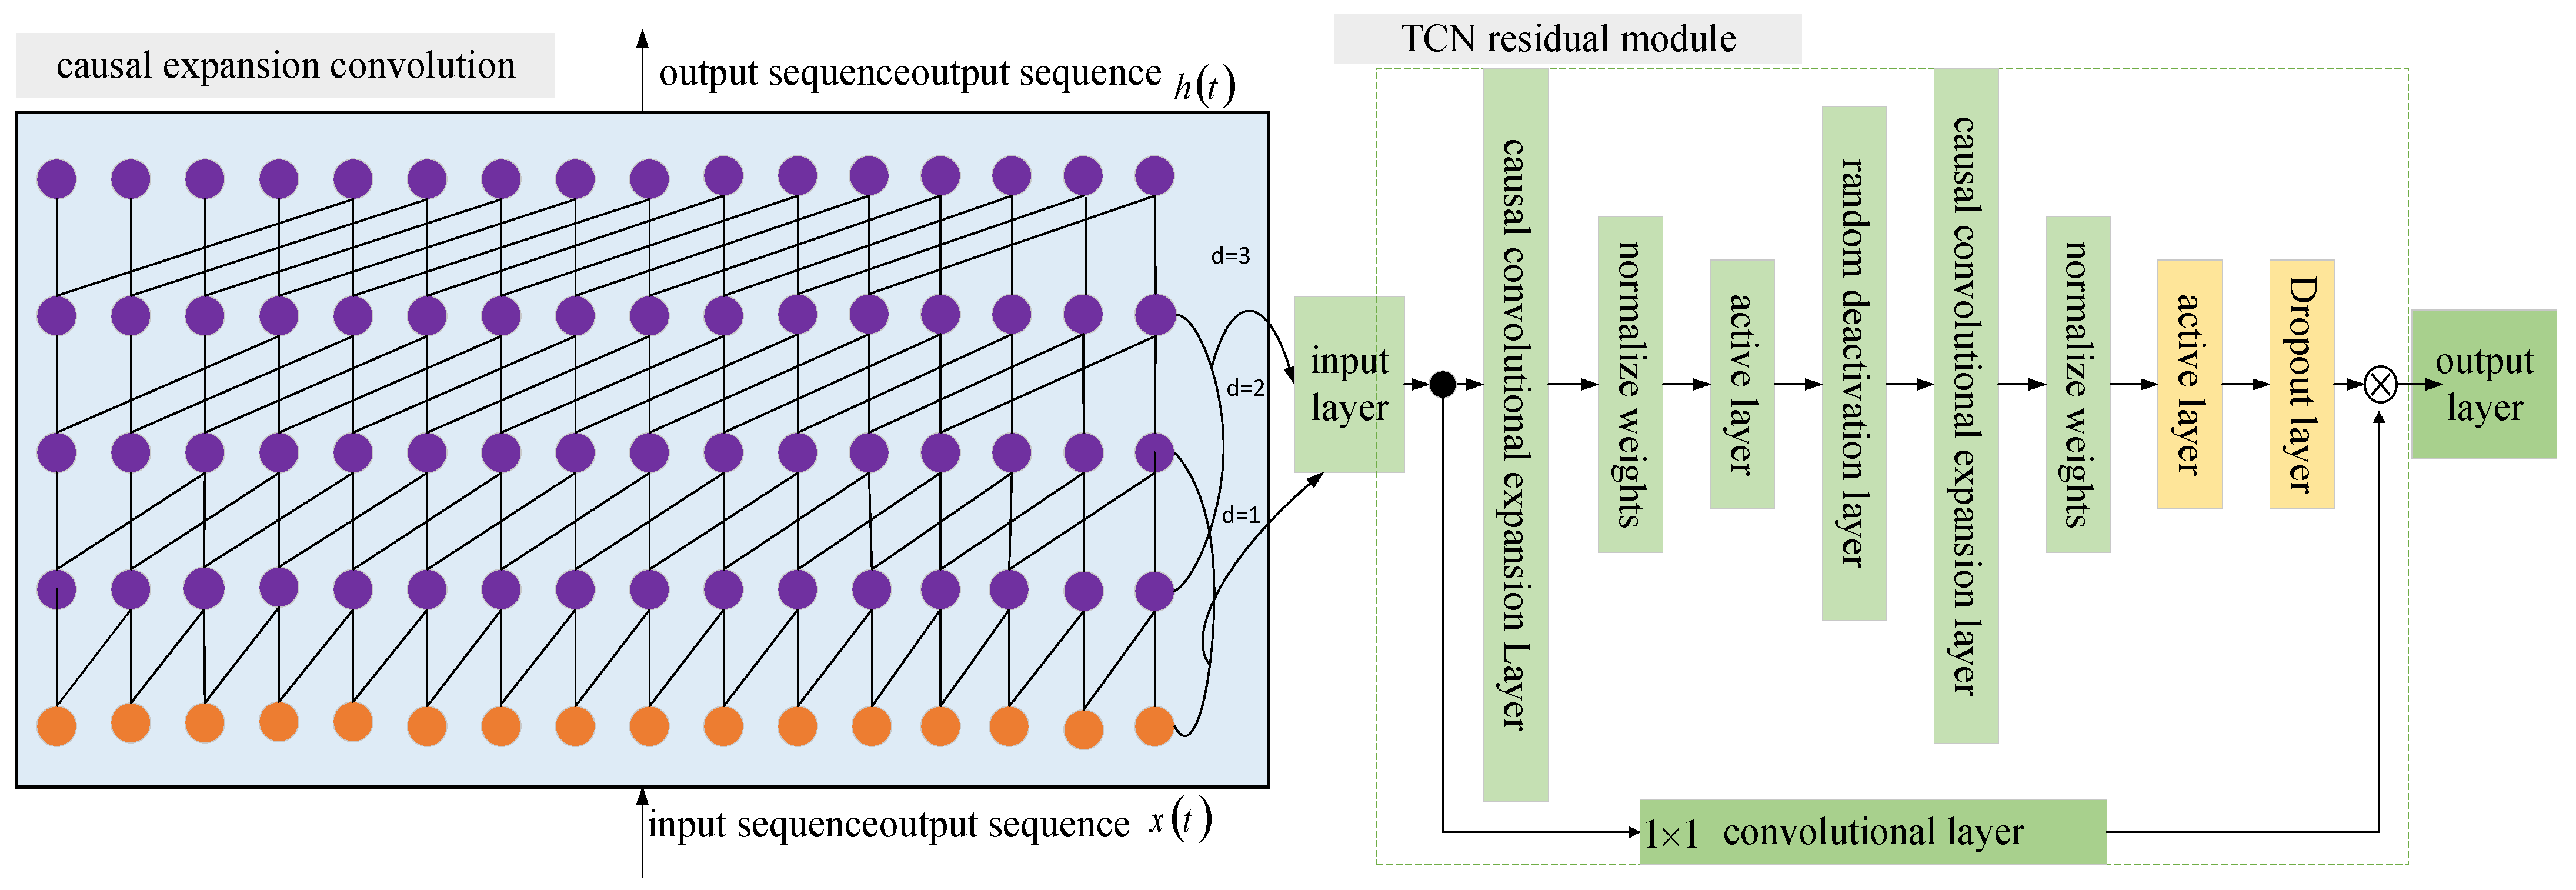
3.2. Time Convolutional Network

Time convolutional networks are effective models for predicting time series. Its core structure is shown in Figure 2, where it gradually increases the receptive field directly through a series of dilated convolutions, allowing the output to contain rich information. In causal dilated convolutions, capturing the overall characteristics of long-time sequences can be achieved by adjusting parameters such as the convolutional kernel, convolutional layers, and dilation factor ‘d’, thereby further deepening the impact of the sequence on the deep network. In the causal dilation network, the part connected by the arc is the residual module, which can solve the problem of information loss that may occur when the number of TCN layers deepens.
The amount of electricity generated in time t 1 , 2 , 3 , k is recorded as x t , x t = x 1 , x 2 , x 3 , x t .
For an input one-dimensional sequence x 0 t , the specific output expression for feature extraction through the TCN is
F s = x f s = i = 0 k 1 f i x s d × i
where d is the expansion coefficient, is a convolution operation for extracting feature information, f : 0 , , k 1 is the convolutional kernel, and k is the size of the convolutional kernel.
By combining the multivariate feature x 1 t , x 2 t , x k t with the subcomponent sequence x 0 t to form a multivariate time series x t and extracting features from the multidimensional time series, the following can be concluded:
h t n = F h t 1 n , x t
where n = 1 , 2 , m and m is the dimension of the multivariate time series dataset.

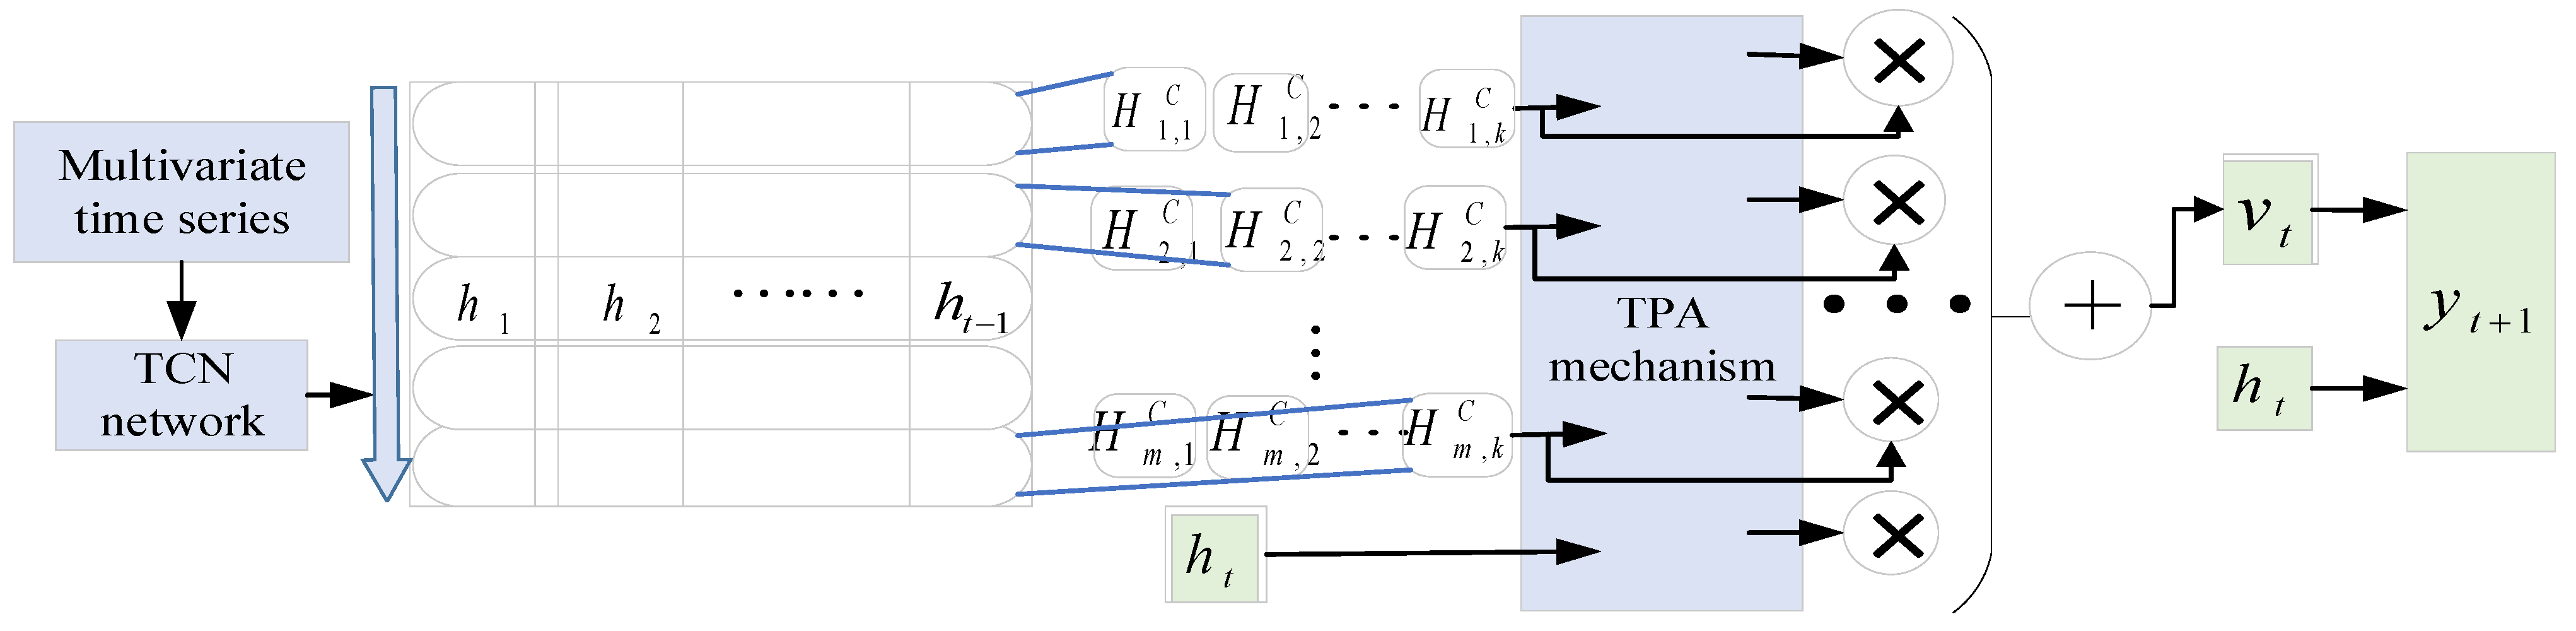
3.3. Temporal Convolutional Network Model Based on Time Pattern Attention

In the actual prediction of photovoltaic power generation, the important data not only include the historical total radiant intensity of the sun but also include the temperature, humidity, atmospheric pressure, and other multivariate variables. Each variable has a different impact on photovoltaic power generation, and the degree of influence varies as well. Therefore, in order to improve the accuracy of photovoltaic power generation prediction and solve the complex, dynamic, and interdependent relationship between variables, in this study, multivariate variables and time series are combined to form a multivariate time series, and the time pattern attention (TPA) is introduced into the TCN model [35], which can capture the impact of each variable on the prediction sequence in the prediction model and effectively improve the prediction accuracy. Figure 3 shows the TPA-TCN prediction model.
(1)
TCN layer
The output of the TCN layer is the hidden state of each time step, and the hidden information h t R m at time t is output. It can be represented by Equation (7).
(2)
Time mode capture layer
Using the TCN’s convolutional kernel on the row vector of feature matrix H = H 1 , H 2 , H t 1 for feature extraction, the output is
H i , j C = l = 1 w H i , l 1 C j , l
where H i . j C is the convolution output value of the i-th row vector and the j-th convolution kernel, C represents all convolutional kernels, and l is the length of the time series.
(3)
Time Mode Attention Layer
Let f be the evaluation correlation function, and select the activation function output by the weight of the sigmoid function; then,
f H i C , h t = H i C T W α h t
Then, the weight α i is
α i = s i g m o i d f H i C , h t
Calculate v t by weighting H C :
v t = i = 1 t H t C α i
Integrate h t and v t , with weight coefficient matrix W , to obtain
h t = W h h t + W v v t
y t + 1 = W h h t

4. Short-Term Photovoltaic Power Generation Prediction Model Based on HWOA-MVMD-TPA-TCN

4.1. Prediction Model Process

Based on the modelling process mentioned above, the prediction process of the short-term photovoltaic power generation prediction model based on the HWOA-MVMD-TPA-TCN can be obtained, as shown in Figure 4. The specific prediction steps of the combined model are as follows:
(1)
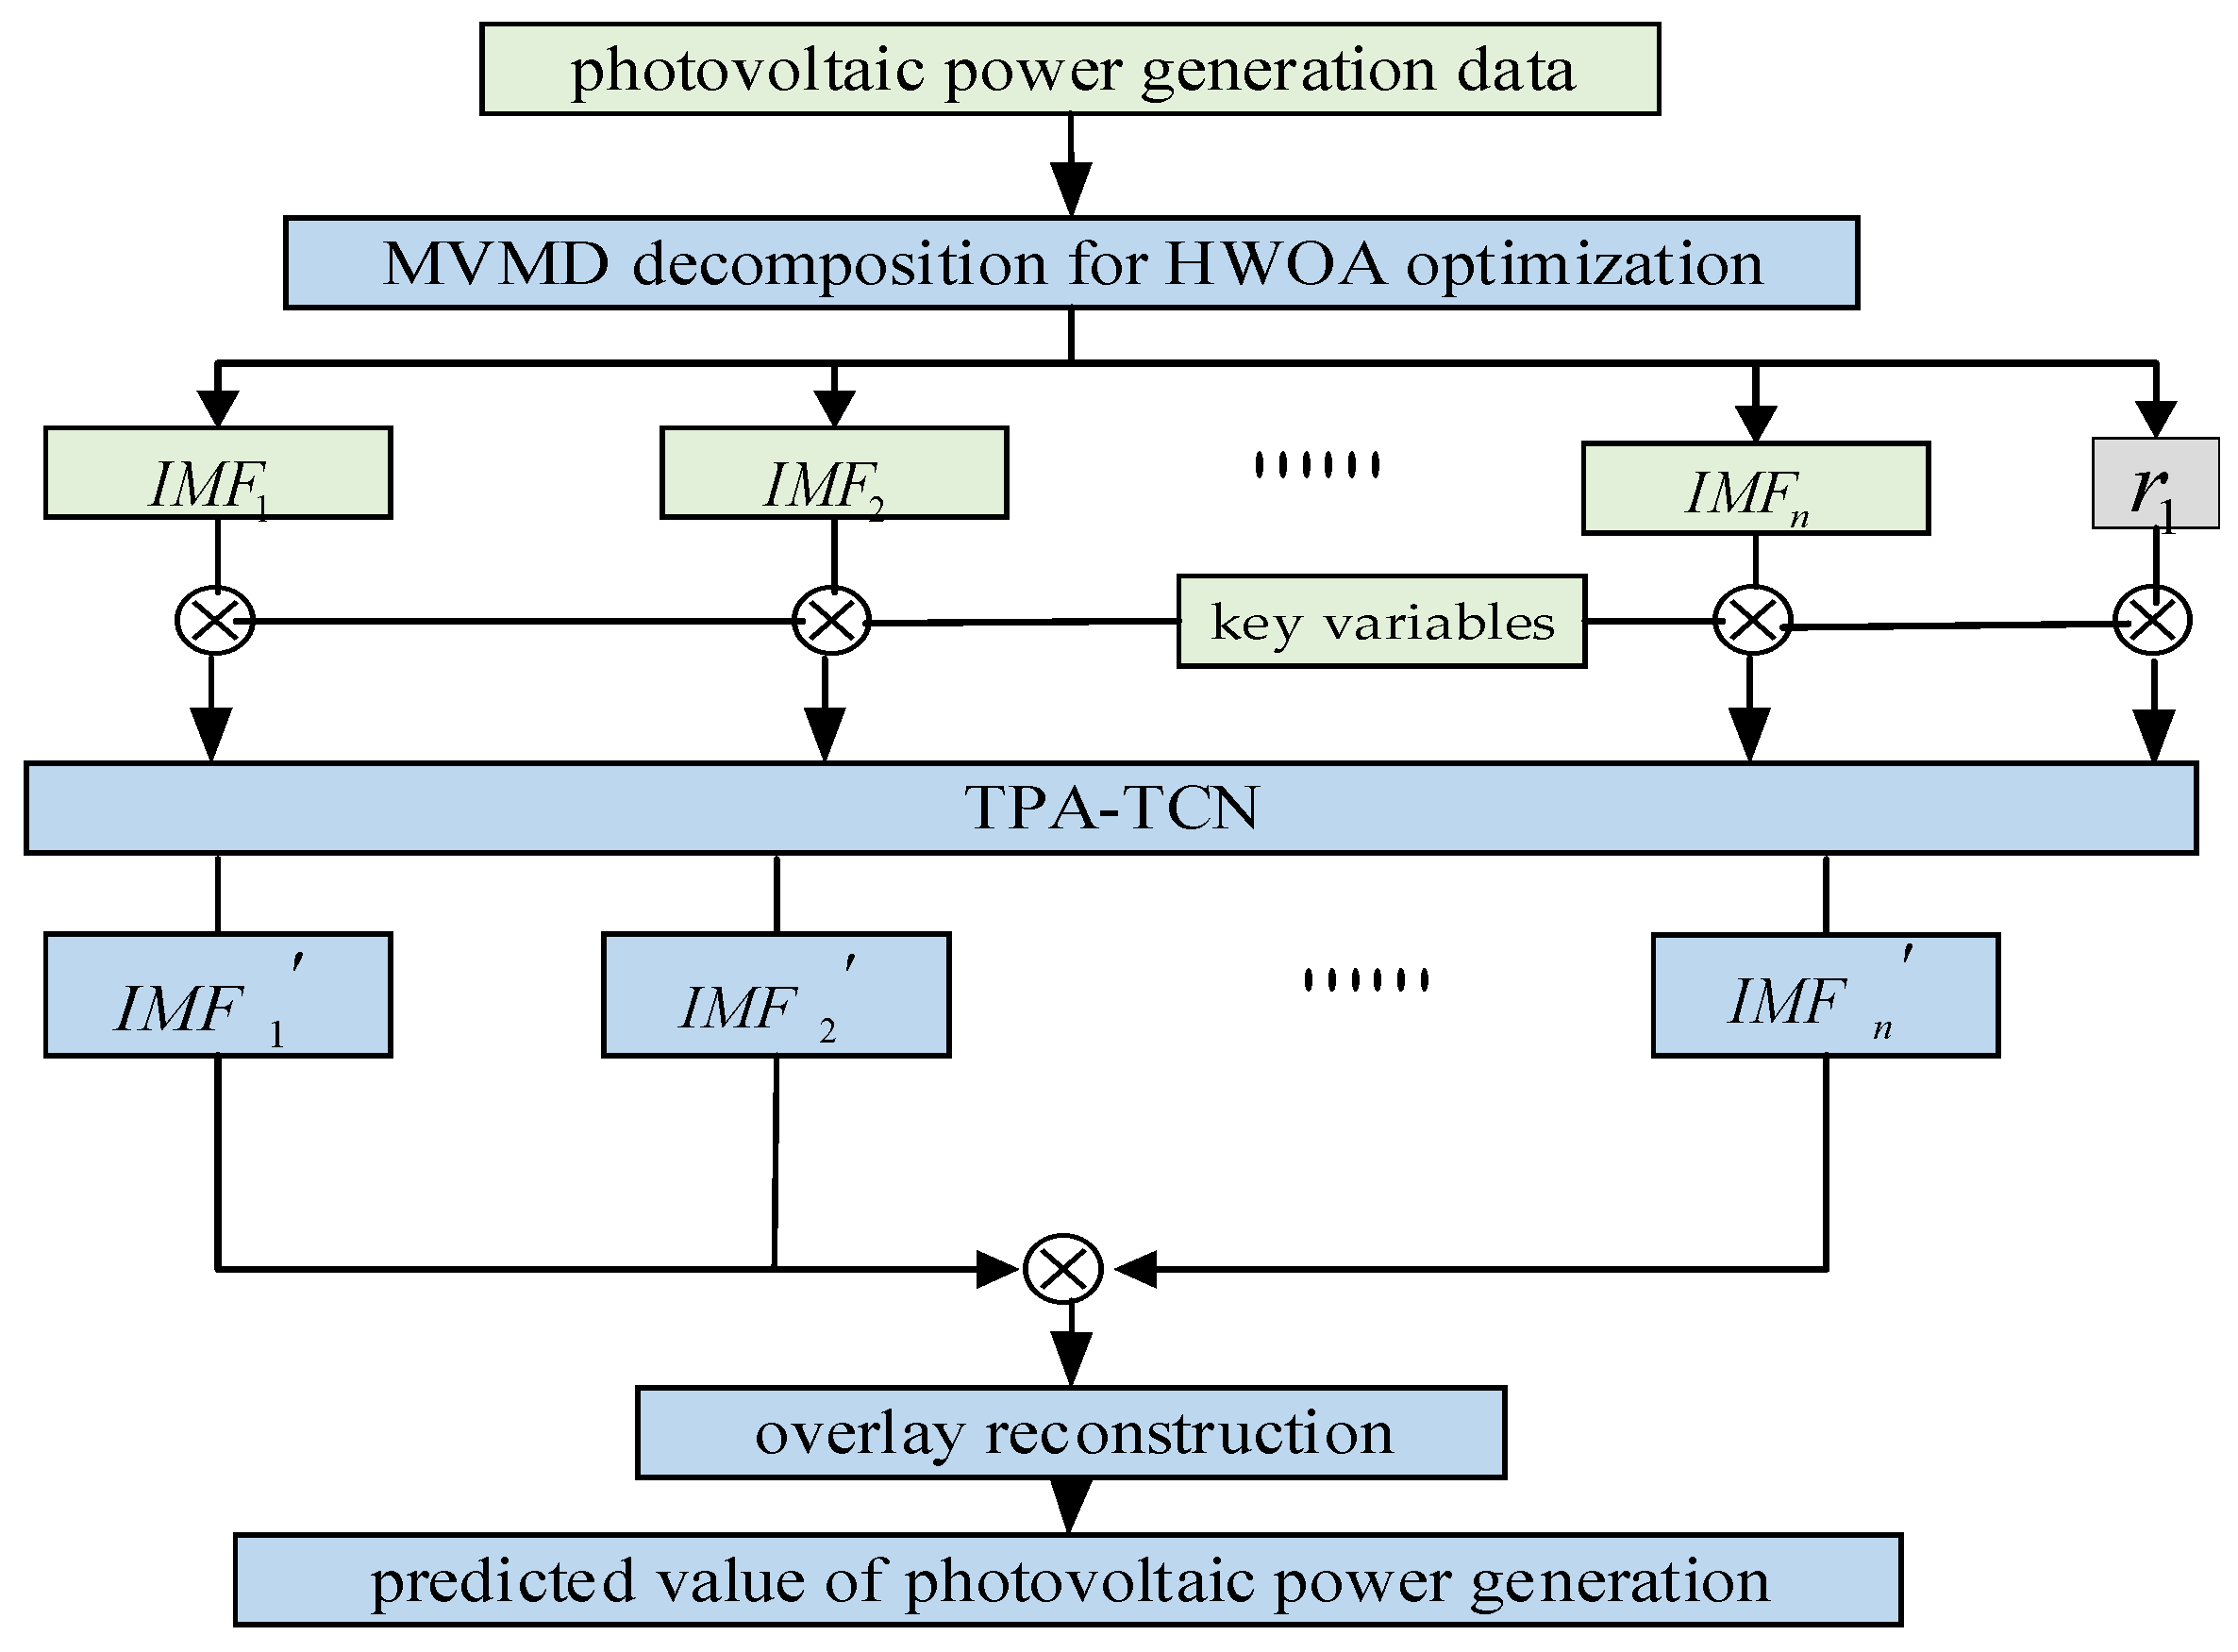
Utilize the HWOA to optimize the modal number k and penalty factor α in MVMD, with the MMOC as the objective function, to obtain and save the optimal solution.
(2)
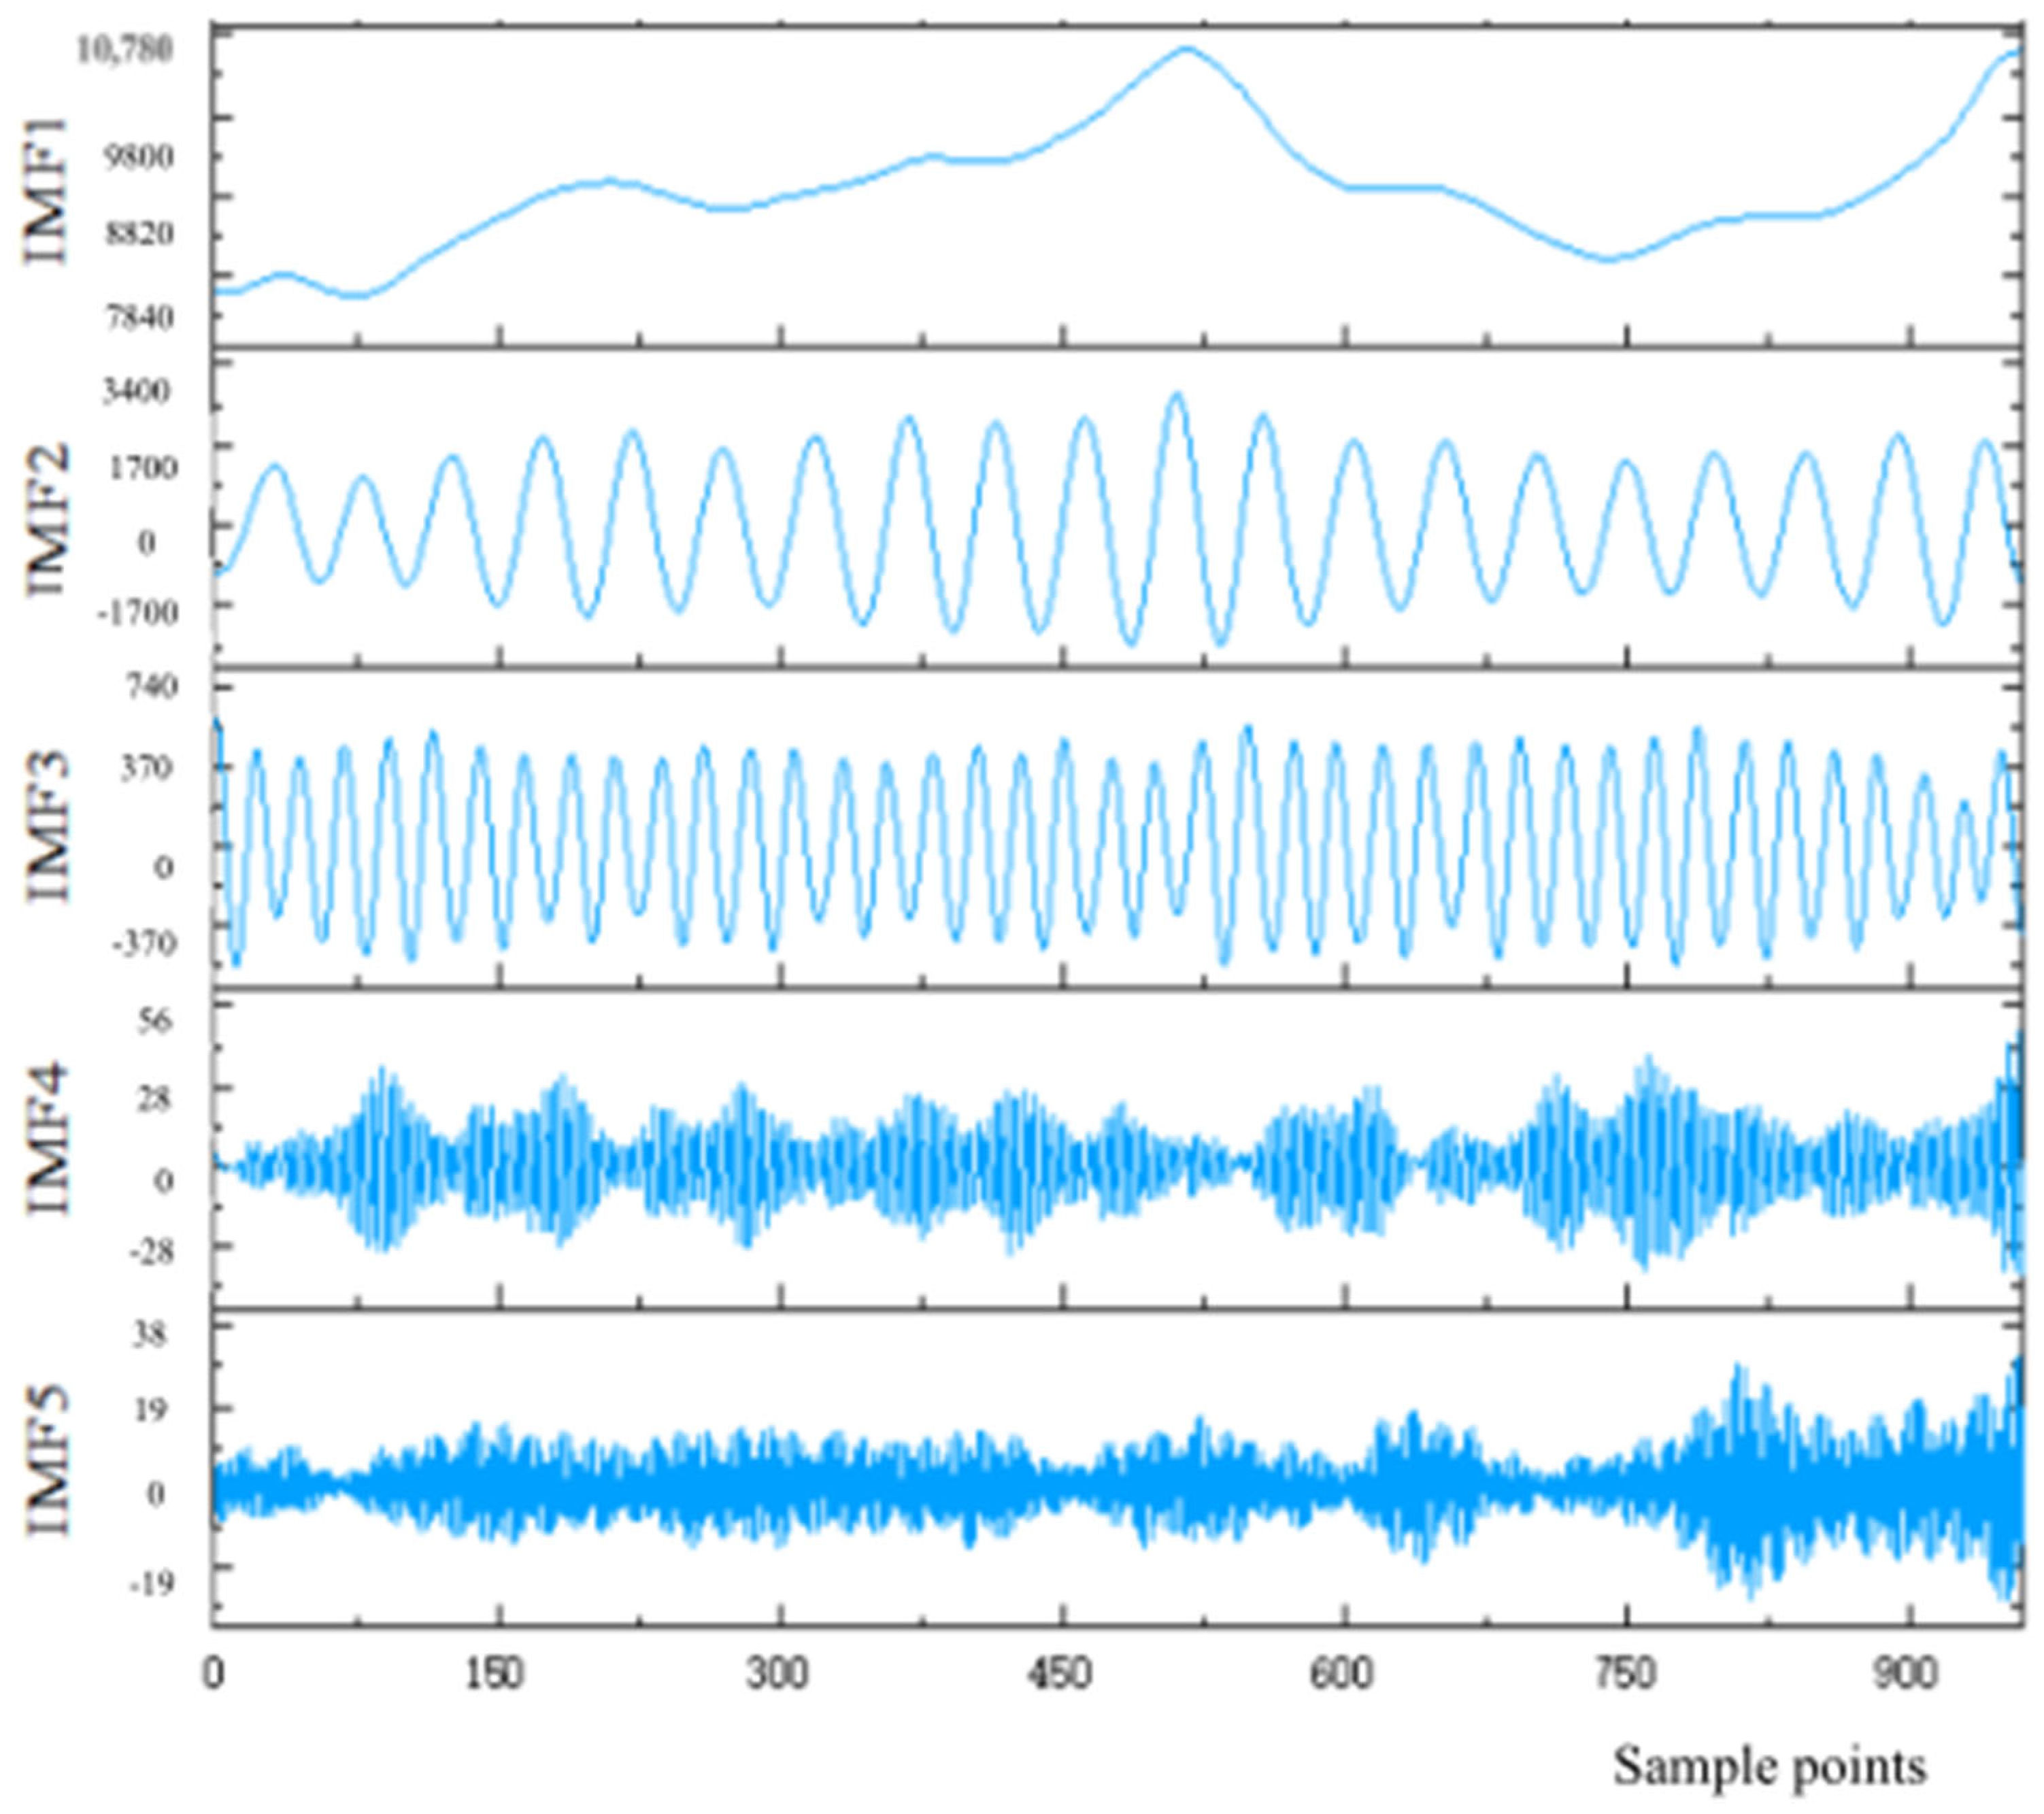
According to the optimal solution in (1), the original photovoltaic power generation sequence is decomposed using the HWOA-optimized MAMD to obtain k different IMF components and a residual component r 1 .
(3)
Each component of the original data after decomposition, k different IMF components, and the key influencing factor variable data are combined into a training set and input into the TPA-TCN model to obtain k different I M F components.
(4)
The superposition and reconstruction of the predicted values of k different I M F components are performed to obtain the final predicted value of photovoltaic power generation.
(5)
The predicted photovoltaic power generation value is compared with the actual photovoltaic power generation data, and the error is analyzed.
Figure 4. Specific prediction principle diagram of the combination prediction model.
Energies 17 00033 g004

4.2. Data Preprocessing

4.2.1. Normalization

First, all the historical data in this paper are normalized, that is, all data are mapped to [–1, 1]:
x = x x min x max x min
where x min and x max are the minimum and maximum values of the input data, respectively.

4.2.2. Selection of Evaluation Indicators for Prediction Error

To ensure that the accuracy of the overall model can be effectively evaluated, two evaluation indicators are selected to evaluate the prediction model of the time series, namely, the mean absolute error (MAE) and root-mean-square error (RMSE) [22]. The error calculation formulas are
M A E = 1 n i = 1 n Y i Y ˜ i
R M S E = 1 n i = 1 n Y i Y ˜ i 2
where n represents the total predicted amount, while Y i and Y ˜ i represent the true and predicted photovoltaic power generation values of the input data, respectively.
It can be seen from the above that MAE and RMSE are inversely proportional to the final evaluation effect, and the smaller the number of MAE and RMSE, the smaller the gap between it and the actual data, and the better the evaluation effect.

4.2.3. Preprocessing of the Photovoltaic Power Generation Sequence

To improve the final prediction accuracy of photovoltaic power generation and weaken the influence of nonstationary features on the prediction, an improved MVMD algorithm is used to decompose and preprocess the photovoltaic power generation sequence obtained from data feature extraction. During the process of optimizing the parameters of MVMD using the HWOA, when the algorithm performs the 38th iteration, the fitness value is the smallest, that is, the minimum modal overlap component is 2.111, as shown in Figure 5. At this time, the optimal solution is obtained by the modal k number and penalty factor α , where k is 5 and α is 3249. Therefore, the original data of photovoltaic power generation will be decomposed into five subsequences, and the IMF components obtained from the decomposition are shown in Figure 6.

5. Example Analysis

We select, as an example, the actual photovoltaic power generation data of a business center in Tianjin that is located at east longitude 117 2 and north latitude 39 1 3 from 23 June to 2 August 2021. Tianjin is located in northern China, and the cloud cover during the summer months (June to July) is typically influenced by seasonal weather patterns. The climate in Tianjin is generally hot with high humidity, leading to frequent cloud formation, especially in the afternoon and evening. During this season, various types of clouds may appear, including cumulus clouds and stratocumulus clouds. Afternoon convective heating often results in the formation of cumulonimbus clouds, leading to possible increased rainfall and thunderstorm activity with dense cloud cover. The cloud cover throughout the day can vary significantly. For instance, the morning may be relatively clear, but as temperatures rise in the afternoon, cloud cover may increase. For a more precise description, local meteorological data, including cloud cover records, sunshine hours, and precipitation, can be referenced. Among them, meteorological data include total radiation (unit: W/m2), direct radiation, scattered radiation, ambient temperature, humidity, wind speed, and atmospheric pressure characteristics; the sampling interval between every two groups of data is 1 h; and the number of data samples obtained for each feature is 432. The first 90% of the data are used as the training set, and the last 10% of the data are used as the test set [27].

5.1. Parameter Settings for the Prediction Models

After decomposing and normalizing the original sequence, for different reconstructed components, the data batch size b is adjusted based on their different characteristics. Repeated experiments are conducted on hyperparameters such as the size, learning rate lr, random inactivation ratio dropout, and residual block expansion coefficient d, as shown in Table 3. The settings of other training parameters (such as the convolution kernel size k_size, optimizer, activation function, and training epoch) are shown in Table 4. The TPA-TCN model is built using the Python language, and a deep learning network model is constructed using the TensorFlow framework and Keras. The GridSearchCV method in the sklearn library is called to perform a grid search on the hyperparameters and find the optimal parameter settings.
Through repeated experiments, it was found that a higher dilation factor can yield better predictive results for high-frequency reconstruction components. Consistent with the analysis in the previous section, a higher dilation factor allows for a larger convolutional receptive field, thus more accurately capturing the overall sequence characteristics of high-frequency components while ignoring local trends. In other words, a larger dilation factor ‘d’ is more suitable for predicting high-frequency components.

5.2. Photovoltaic Power Generation Prediction Based on TAP-TCN

The IMF components obtained through HWOA-MVMD, along with the seven key influencing factors, serve as inputs to the TPA-TCN model. In order to more comprehensively uncover the patterns of photovoltaic power generation and effectively enhance the prediction accuracy, predictions were separately conducted for five sub-sequences. The predictive results for each component are shown in Figure 7.
Through the prediction results of each component in Figure 7, it can be seen that the five subseries are basically consistent with their corresponding prediction results, which proves that the photovoltaic power generation prediction performance based on the TAP-TCN is better.

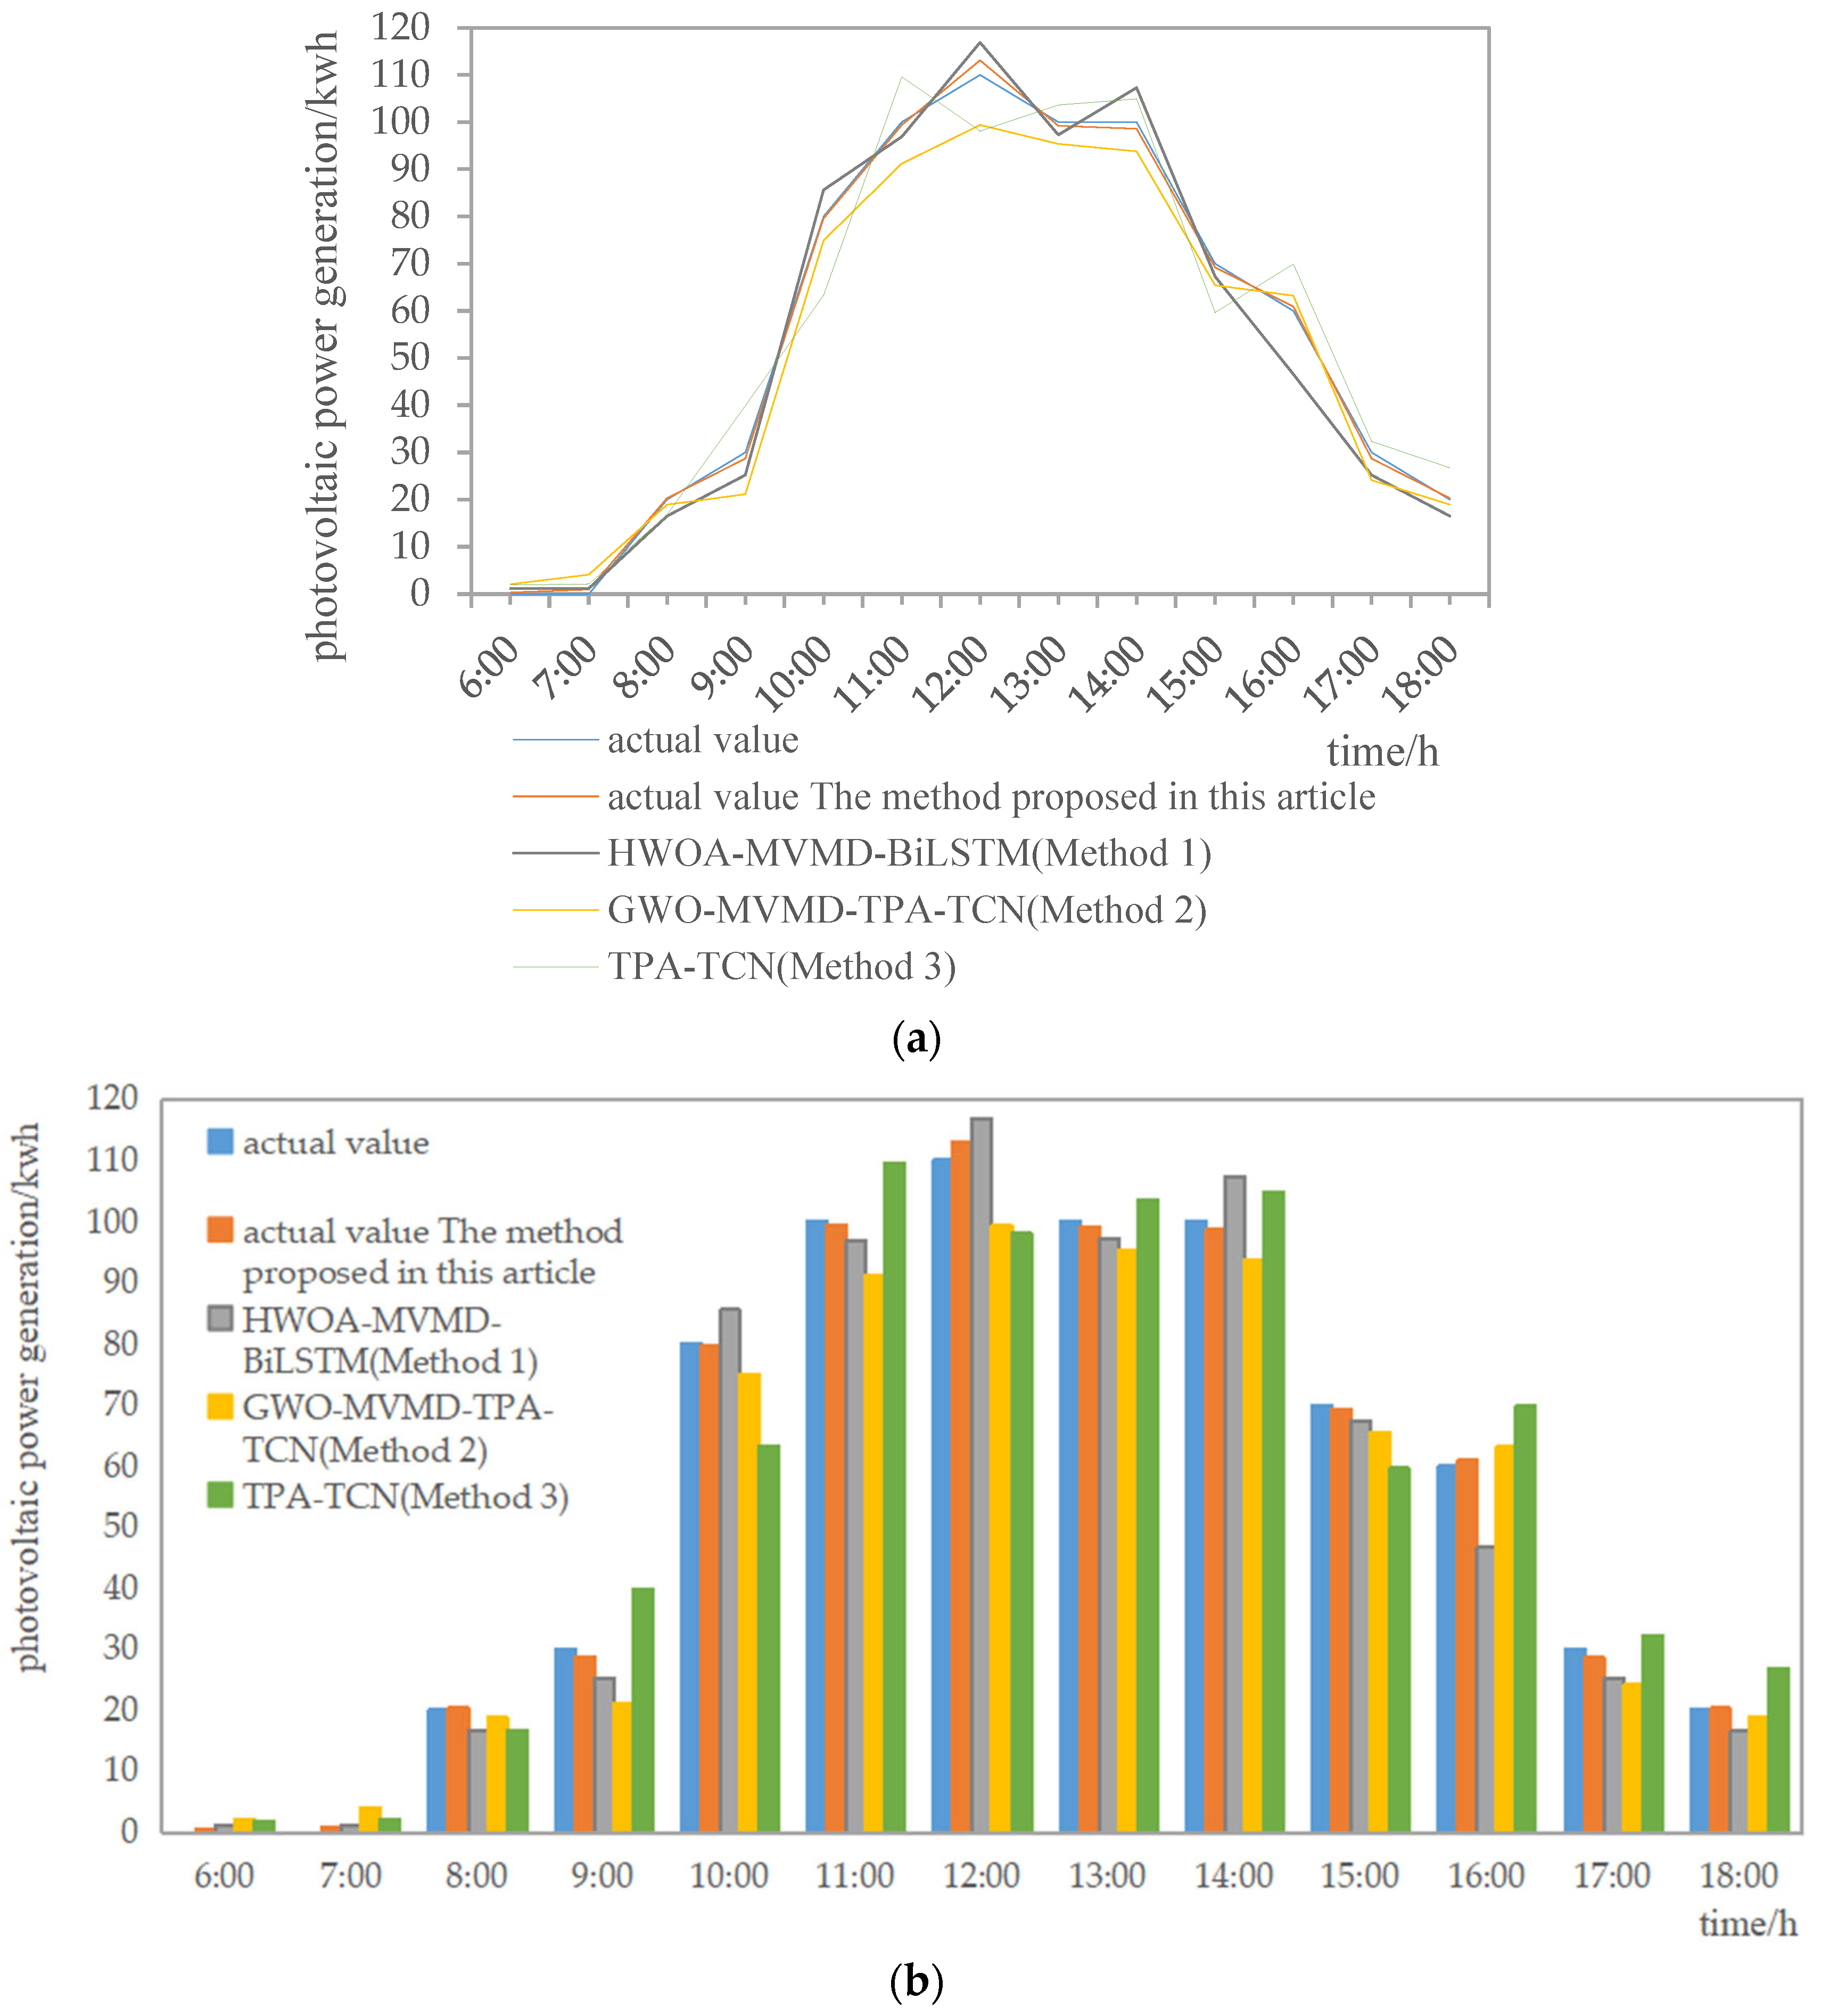
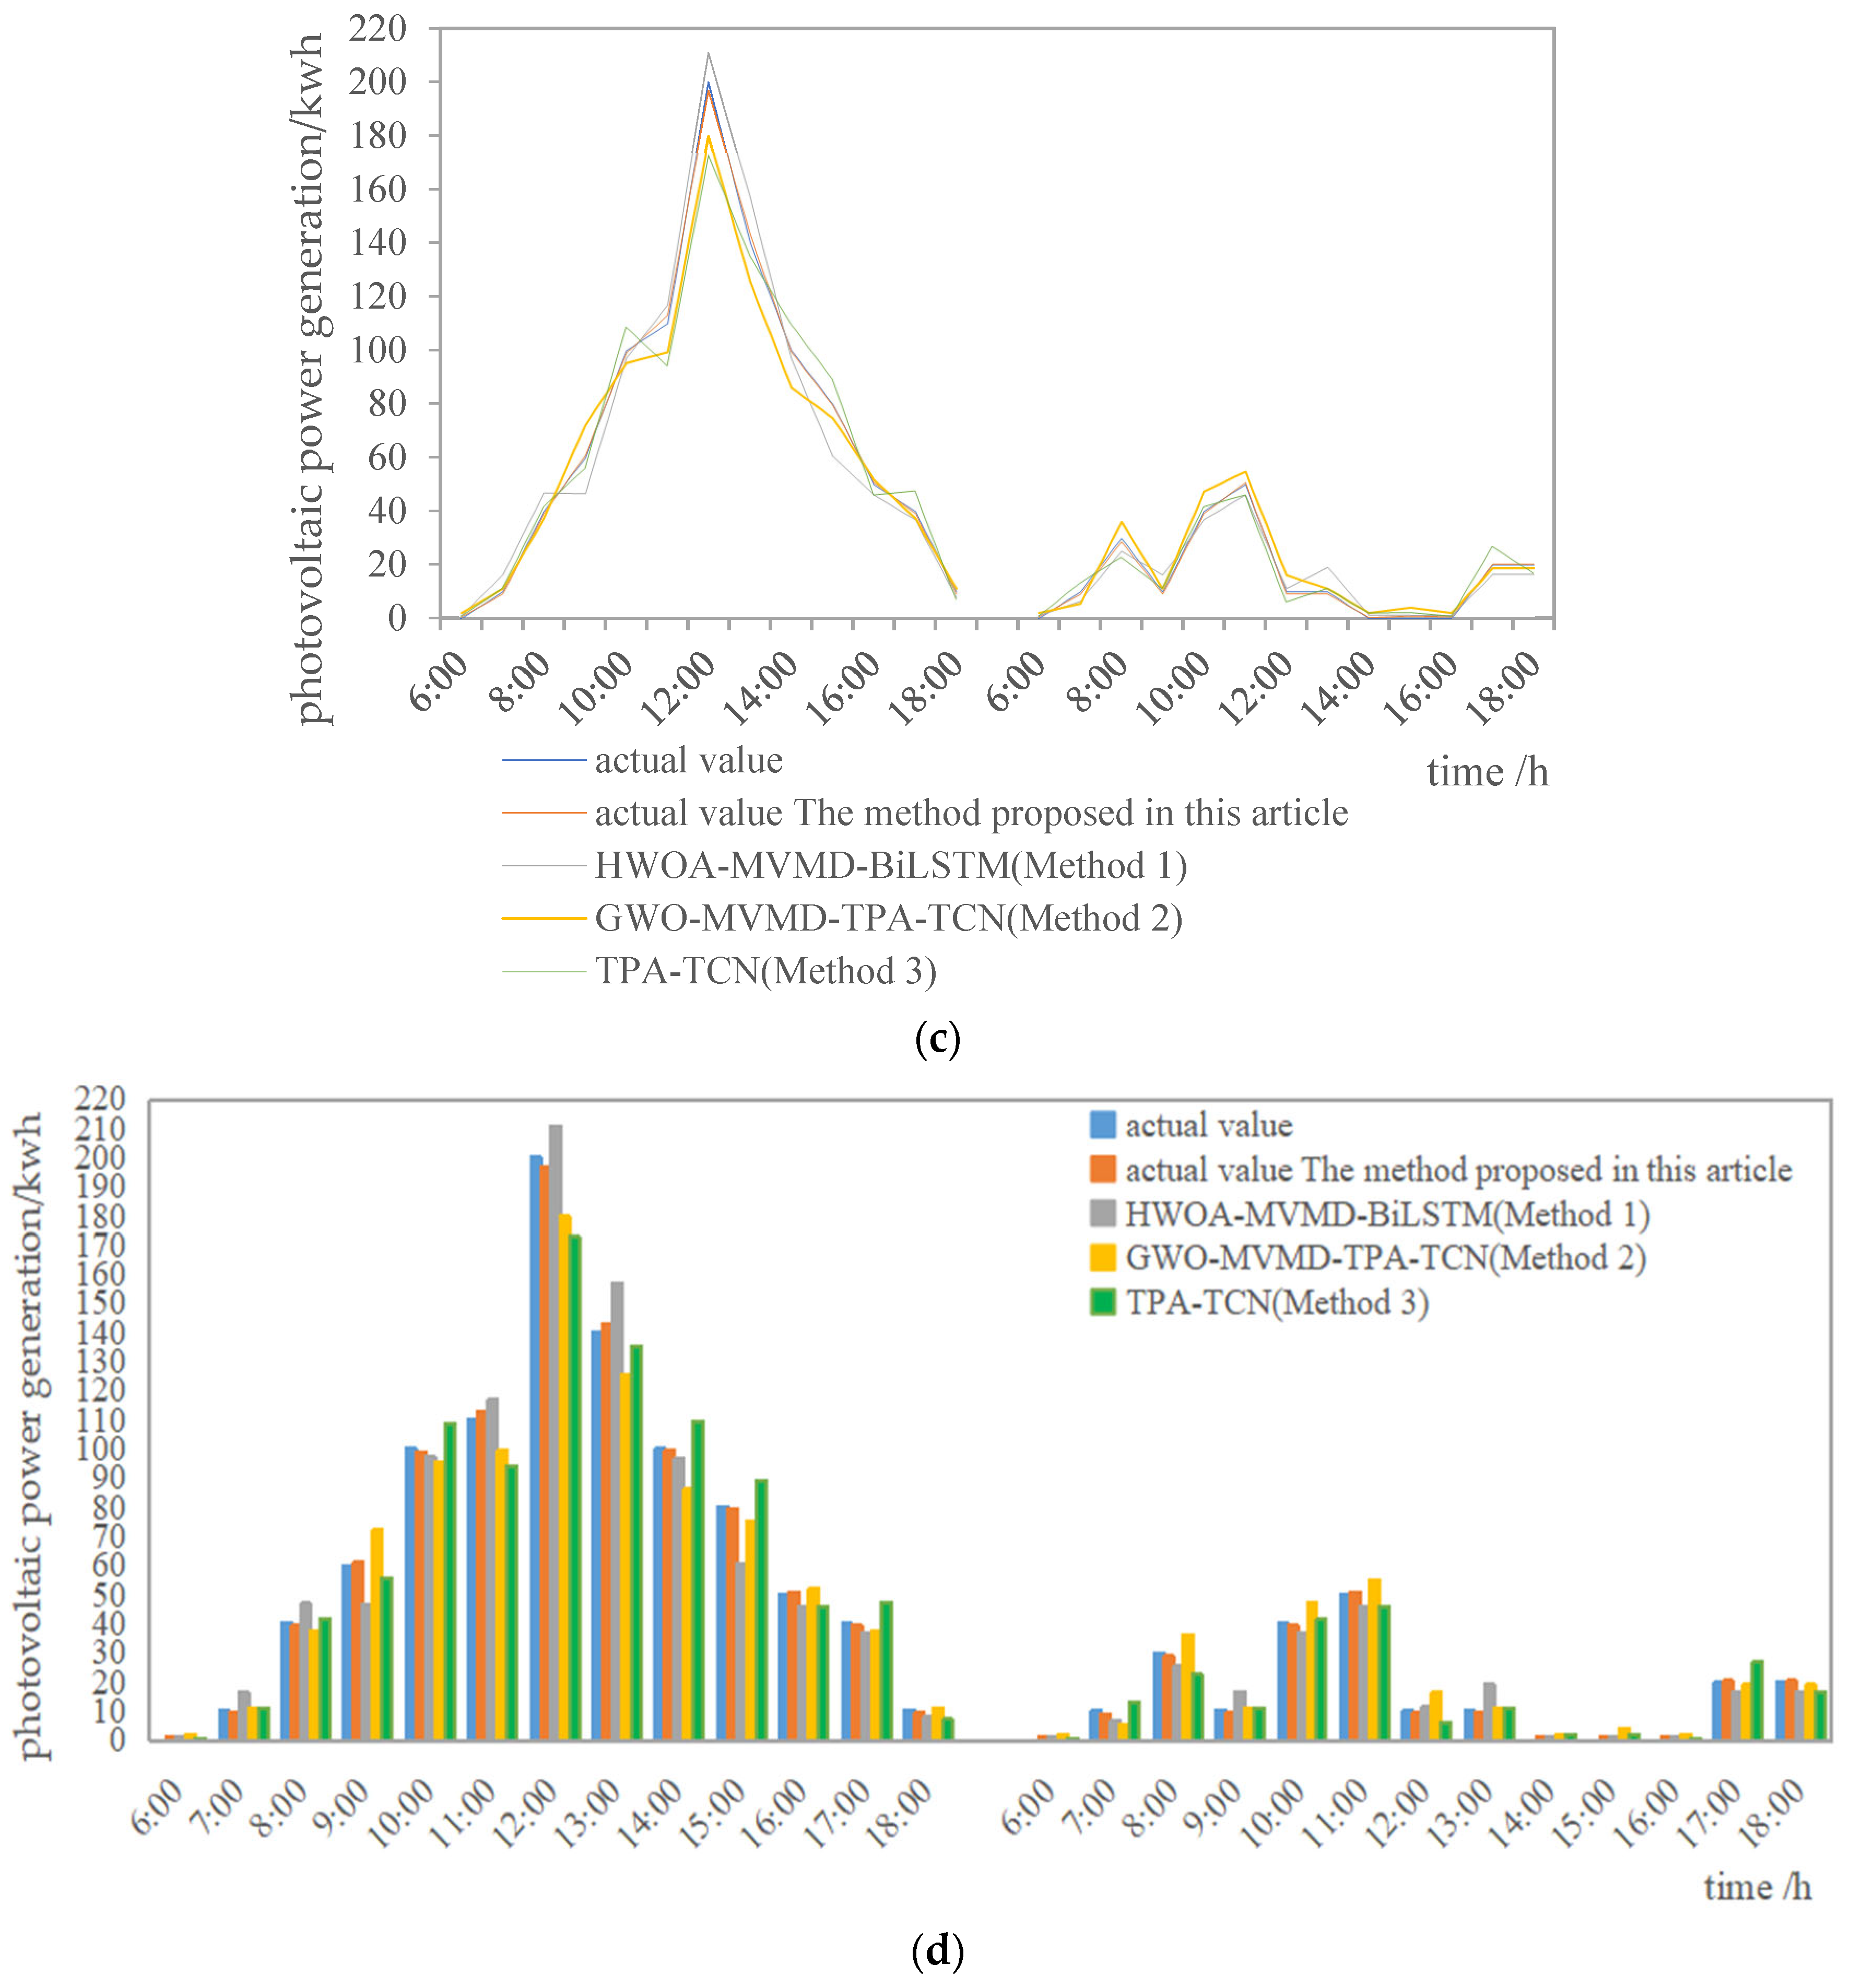
5.3. Comparative Analysis of Prediction Methods

To validate the effectiveness of the HWOA-MVMD data decomposition method, this paper compares the proposed method with HWOA-MVMD-BiLSTM (Method One). Additionally, to demonstrate the effectiveness of the HWOA, the proposed method is simulated in comparison with the GWO-MVMD-TPA-TCN (Method Two) and TPA-TCN (Method Three). To increase the persuasiveness of the prediction effect, the photovoltaic power generation for five consecutive days from 29 July to 2 August is predicted. The line chart and bar chart are used to display the forecast results more intuitively, and the prediction results of each method are shown in Figure 8, of which Figure 8a,b show the corresponding photovoltaic power generation prediction results of each method on 29 July; Figure 8c,d show the prediction results of each method when the photovoltaic power generation is changed from a large fluctuation series (30 July) to a more stable series (31 July); and Figure 8e,f show the prediction results of each method when there are two successive large fluctuation sequences of photovoltaic power generation. The detailed prediction error results for each method and the average error results over the past five days are shown in Table 5.
Analyzing the predictive results in Figure 8, it can be observed that Method One, Method Two, and Method Three to some extent capture the overall trend of power generation. However, the fitting of their prediction curves to the actual curve is poor, with significant local deviations. Notably, Method Three exhibits the poorest predictive performance, indicating that data decomposition can enhance forecasting accuracy. In contrast, the proposed method shows a high degree of alignment with the actual values, minimal volatility, and a high degree of curve similarity. This suggests that the HWOA-MVMD-TPA-TCN model outperforms the others in terms of performance.
The predictive results of Method One, Method Two, and Method Three all exhibit noticeable local deviations. In contrast, the results of the method proposed in this paper show only brief, slight fluctuations while still effectively capturing the trend in photovoltaic power generation. This indicates superior forecasting performance.
Based on Figure 8 and Table 5, Method One and Method Two proposed in this paper decompose the data first, while Method Three does not decompose the data, and the prediction error of Method Three is the largest, indicating that decomposition of the original data is conducive to power generation prediction. In addition, compared with Methods Two and Three, the method proposed in this paper shows that after HWOA-MVMD, the change trend of short-term photovoltaic power generation can be better predicted as a whole, and the prediction error is significantly reduced, among which the average MAE value is 1.95 MW and the RMSE value is 2.55 MW, which can be reduced by 33.74% and 38.85%, respectively. In addition, under the condition that the actual data of photovoltaic power generation fluctuate greatly (29 July~2 August), the prediction error of the method in this paper remains basically stable, which verifies the effectiveness of the method proposed in this paper.

6. Conclusions

This article proposes a short-term photovoltaic power generation prediction model based on the HWOA-MVMD-TPA-TCN model, which improves the prediction accuracy for photovoltaic power generation and draws the following conclusions:
(1)
Using the actual data example analysis of a business center in Tianjin, the HWOA-MVMD-TPA-TCN model effectively reduces the prediction error of photovoltaic power generation, in which the MAE value is 1.95 MW and the RMSE value is 2.55 MW, which can be reduced by up to 33.74% and 38.85%, respectively. The effectiveness of the forecasting model proposed in this paper is proved, and the model has certain reference value in the field of time series forecasting.
(2)
The IMF components resulting from the decomposition of photovoltaic power generation possess distinct characteristic changes. Exploring more efficient prediction methods for these components requires further research. Additionally, analyzing error components and improving prediction accuracy through error correction should be considered. Future research can focus on these aspects to advance photovoltaic power generation prediction.

Author Contributions

Conceptualization, R.C., H.T. and D.L.; methodology, R.C.; software, R.C.; validation, R.C.; formal analysis, R.C.; investigation, R.C.; resources, M.F.; data curation, H.F.; writing—original draft preparation, R.C.; writing—review and editing, R.C., H.T. and D.L.; visualization, R.C.; supervision, H.T. and D.L.; project administration, R.C., H.T. and D.L. All authors have read and agreed to the published version of the manuscript.

Funding

This research was funded by State Grid Tianjin Electric Power Company Science and Technology Project, grant number KJ21-1-21; Tianjin Postgraduate Scientific Research Innovation Project, grant number 2022SKYZ070; and Tianjin University of Technology 2022 school-level postgraduate scientific research innovation practice project, grant number YJ2209.

Data Availability Statement

The data involve project confidentiality and cannot be disclosed.

Conflicts of Interest

The corresponding author represents all authors and declares that there are no conflict of interest.

References

  1. Gong, S.; Pan, T. Photovoltaic electricity generation power prediction based on similar day and LS-SVM with EP-SO. Transducer Microsyst. Technol. 2019, 38, 46–48+52. [Google Scholar]
  2. Yang, D.; Kleissl, J.; Gueymard, C.A.; Pedro, H.T.; Coimbra, C.F. History and trends in solar irradiance and PV power forecasting: A preliminary assessment and review using text mining. Sol. Energy 2018, 168, 60–101. [Google Scholar] [CrossRef]
  3. Zhang, C.; Bai, J.; Lan, K.; Huan, X.; Fan, C.; Xia, X. Prediction of power generation of photovoltaic power station based on data mining and genetic wavelet neural network. J. Sol. Energy 2021, 42, 375–382. [Google Scholar]
  4. Gigoni, L.; Betti, A.; Crisostomi, E.; Franco, A.; Tucci, M.; Bizzarri, F.; Mucci, D. Day-ahead hourly forecasting of power generaion from photovoltaic plants. IEEE Trans. Sustain. Energy 2018, 9, 831–842. [Google Scholar] [CrossRef]
  5. Liu, L.; Qiu, J.; Chen, X. Solar photovoltaic power prediction based on Ant colony optimization algorithms. Comput. Digit. Eng. 2021, 49, 2396–2401. [Google Scholar]
  6. Ni, A.; Wang, Y.; Xue, H. Prediction of ultra short term photovoltaic power generation output based on improved whale optimization algorithm based on chaotic characteristics—Relevance vector machine. Mod. Power 2021, 38, 268–276. [Google Scholar]
  7. Zhao, H.; Zhao, Z.; Wang, H.; Yue, Y. Short-term photovoltaic power prediction based on DE-GWO-LSTM. In Proceedings of the 2020 IEEE International Conference on Mechatronics and Automation (ICMA), Beijing, China, 13–16 October 2020. [Google Scholar]
  8. Zhang, X.; Han, P.; Xu, L.; Zhang, F.; Wang, Y.; Gao, L. Research on bearing fault diagnosis of wind turbine gearbox based on 1DCNN-PSO-SVM. IEEE Access 2020, 8, 192248–192258. [Google Scholar] [CrossRef]
  9. Dai, B.; Hu, T.; Tan, J.; Sun, X.; Huang, Y.; Zhu, L.; Hu, T.; Yi, J. Prediction of photovoltaic power generation based on SWOA optimized BPNN. J. Hubei Univ. Natl. Nat. Sci. Ed. 2021, 39, 321–325+331. [Google Scholar]
  10. Ling, N.; An, W.; Zhou, Y.; Jiang, Z.; Li, S. Research on the photovoltaic power generation prediction model based on HBA-SVR. Electr. Appl. 2023, 42, 72–78. [Google Scholar]
  11. Li, P. Short term photovoltaic power generation prediction based on ISSA-SVR. Sci. Technol. Innov. 2023, 1, 34–37. [Google Scholar]
  12. Zhao, J.; Zhang, J.; Mao, L.; Qu, K.; Huang, C.; Jie, Y. Research on photovoltaic power generation prediction based on PSO Soft attention bidirectional LSTM algorithm. Smart Power 2022, 50, 1–7. [Google Scholar]
  13. Liu, C. Research on Photovoltaic Power Generation Prediction and FPGA Acceleration Based on QLSTM. Master’s Thesis, Nanchang University, Nanchang, China, 2022. [Google Scholar]
  14. Dai, B. Research and Implementation of Photovoltaic Power Generation Prediction Algorithm Based on BP Neural Network. Master’s Thesis, Hubei University for Nationalities, Enshi City, China, 2022. [Google Scholar] [CrossRef]
  15. Hai, T.; Wen, K.; Zhou, L.; Hu, X.; Zhang, C. Photovoltaic power generation prediction method based on meteorological similarity and Markov chain. J. Guangxi Univ. Nat. Sci. Ed. 2015, 40, 1452–1460. [Google Scholar]
  16. Tan, J.; Deng, C.; Yang, W.; Liang, N.; Li, F. Adaboost weather clustering ultra short term prediction method for microgrid photovoltaic power generation. Power Syst. Autom. 2017, 41, 33–39. [Google Scholar]
  17. Xi, F.; An, Y.; Yao, J. Prediction of photovoltaic power generation based on nonlinear combination models. In Proceedings of the 2016 Second International Conference on Electrical and Industrial Engineering, Shanghai, China, 11–12 December 2016. [Google Scholar]
  18. Jiao, C. Research on Short-Term Photovoltaic Power Prediction Method Based on Machine Learning. Master’s Thesis, Zhongyuan University of Technology, Zhengzhou, China, 2021. [Google Scholar] [CrossRef]
  19. Liu, F.; Ji, C.; Peng, Y.; Jiang, W. Photovoltaic power generation combination prediction model based on ACO-KF-GRU-EC. Comput. Simul. 2022, 39, 118–123+147. [Google Scholar]
  20. Zhang, F. Combined application of photovoltaic power generation prediction method based on historical data. Commun. Power Technol. 2020, 37, 190–191. [Google Scholar] [CrossRef]
  21. Wang, X.; Luo, D.; Sun, Y.; Li, C.; Li, J. Research on the combined prediction method of daily power generation in photovoltaic microgrids based on ABC-SVM and PSO-RF. J. Sol. Energy 2020, 41, 177–183. [Google Scholar]
  22. Gao, Q.; Lu, J. Short term photovoltaic power prediction based on CEEMDAN-LSSVM-ARIMA model. Sens. Microsyst. 2022, 41, 118–122. [Google Scholar]
  23. Zhang, M.; Han, Y.; Zalhaf, A.S.; Wang, C.; Yang, P.; Wang, C.; Zhou, S.; Xiong, T. Accurate ultra-short-term load forecasting based on load characteristic decomposition and convolutional neural network with bidirectional long short-term memory model. Sustain. Energy Grids Netw. 2023, 35, 101129. [Google Scholar] [CrossRef]
  24. Elboshy, B.; Alwetaishi, M.; Aly, R.M.; Zalhaf, A.S. A suitability mapping for the PV solar farms in Egypt based on GIS-AHP to optimize multi-criteria feasibility. Ain Shams Eng. J. 2022, 13, 101618. [Google Scholar] [CrossRef]
  25. Zhao, E.; Han, Y.; Lin, X.; Yang, P.; Blaabjerg, F.; Zalhaf, A.S. Impedance characteristics investigation and oscillation stability analysis for two-stage PV inverter under weak grid condition. Electr. Power Syst. Res. 2022, 209, 108053. [Google Scholar] [CrossRef]
  26. Zhao, E.; Han, Y.; Lin, X.; Liu, E.; Yang, P.; Zalhaf, A.S. Harmonic characteristics and control strategies of grid-connected photovoltaic inverters under weak grid conditions. Int. J. Electr. Power Energy Syst. 2022, 142, 108280. [Google Scholar] [CrossRef]
  27. Wen, B.; Chen, F.; Wang, H. Short-term wind power prediction based on data feature extraction and SSA-BiLSTM. Appl. Sci. Technol. 2023, 50, 71–78. [Google Scholar]
  28. Shi, P.; Zhang, H.; Yi, S.; Han, D. An improved method for extracting fault signal characteristics of adaptive multivariational modal decomposition bearings. J. Metrol. 2022, 43, 1326–1334. [Google Scholar]
  29. Liu, N.; Cai, G.; Yang, D.; Wang, B. Identification of low-frequency oscillation modes of power system based on adaptive multivariational mode decomposition. J. Northeast. Dianli Univ. 2020, 40, 1–7. [Google Scholar] [CrossRef]
  30. Wang, J. Research on Multi-Energy Microgrid Optimization Based on Improved Whale Algorithm. Master’s Thesis, Beijing University of Civil Engineering and Architecture, Beijing, China, 2023. [Google Scholar] [CrossRef]
  31. Xiao, Z.; Liu, S. Research on elite inverse golden sinusoidal whale algorithm and its engineering optimization. Acta Electron. Sin. 2019, 47, 2177–2186. [Google Scholar]
  32. Chen, D.; Chen, Z.; Li, Z.; Zhang, J. Permanent magnet synchronous motor control strategy based on improved whale optimization algorithm. Radio Eng. 2023, 1–8. Available online: http://kns.cnki.net/kcms/detail/13.1097.TN.20231016.0950.002.html (accessed on 22 October 2023).
  33. Li, J.; Li, M.; Yao, X.; Wang, H.; Yu, Q.; Wang, X. Rolling bearing fault diagnosis based on set empirical mode decomposition and K-neneneba singular value decomposition dictionary learning. J. Metrol. 2020, 41, 1260–1266. [Google Scholar]
  34. Wang, X. Research on All-Weather System and Output Prediction Method of Distributed Photovoltaic Power Generation. Master’s Thesis, China University of Mining and Technology, Xuzhou, China, 2022. [Google Scholar] [CrossRef]
  35. Shih, S.; Sun, F.; Lee, H. Temporal pattern attention for multivariate time series forecasting. Mach. Learn. 2019, 108, 8–9. [Google Scholar] [CrossRef]
Figure 2. Causal expansion network.
Energies 17 00033 g002
Figure 3. TPA-TCN prediction model.
Energies 17 00033 g003
Figure 5. Convergence iteration diagram.
Energies 17 00033 g005
Figure 6. Decomposed IMF components.
Energies 17 00033 g006
Figure 7. Prediction results of each component.
Energies 17 00033 g007
Figure 8. Prediction result curves of various models from 29 July to 2 August. (a) Curve of predicted results by various methods on 29 July; (b) curve of predicted results by various methods on 29 July; (c) curve of predicted results by various methods from 30 to 31 July; (d) curve of predicted results by various methods from 30 to 31 July; (e) prediction result curves of various methods from 1 to 2 August; (f) prediction result curves of various methods from 1 to 2 August.
Energies 17 00033 g008aEnergies 17 00033 g008bEnergies 17 00033 g008c
Table 1. Research status.
File NumberMain ContentAreas of Shortcoming
Establish a single predictive model[5]Using ant element data packets to probe the network environment, selecting information transmission links, constructing roaming paths, and enhancing predictive accuracy through iterative computations to search for optimal solutions.Ignored the problem of poor population diversity and the tendency for the initialization to fall into local optima.
[6]Optimizing the photovoltaic power output prediction algorithm based on the Whale Optimization Algorithm for Support Vector Machines. Optimizing time delay and embedding dimensions in the kernel function to improve generalization ability and convergence speed, resulting in better adaptability.
[7]Optimizing the photovoltaic power prediction algorithm using the Grey Wolf Algorithm to optimize the weights of Long Short-Term Memory (LSTM) neural networks. Predicting power based on optimal weights, overcoming the drawbacks of backpropagation, and improving prediction accuracy.
[8,9,10,11,12]Establishing optimization models using the Honey Badger Algorithm, Sparrow Algorithm, and PSO (Particle Swarm Optimization) Algorithm for predicting the power generation of photovoltaic power stations. Enhancing prediction accuracy.
[13,14]Taking into account the impact of solar irradiance on photovoltaic power generation. Integrating variational quantum circuits with Long Short-Term Memory (LSTM) neural networks, forming a Quantum LSTM neural network applied in predictive research. Accelerating the prediction algorithm through an FPGA hardware platform to reduce computational complexity.Required a large amount of historical data support.
Combined forecasting method [4][15,16,17,18,19,20]Pointing out the random fluctuations due to meteorological factors in ultra-short-term photovoltaic power generation forecasting.Low prediction accuracy and did not comprehensively consider all meteorological factors.
[21]Utilizing the Artificial Bee Colony Optimization Support Vector Machine (ABC-SVM) classification model, combined with the Particle Swarm Optimization Random Forest (PSO-RF) model, for classification training based on meteorological data.Suitable for small sample analysis, but the time complexity increased with the growth of the sample size.
[22]Adopting the Complex Empirical Mode Decomposition with Adaptive Noise (CEEMDAN) method to decompose the photovoltaic power sequence, reducing the impact of non-stationary features on the prediction.There were challenges related to mode mixing and difficulty in determining the stopping conditions.
[23,24,25,26]Establishing a combined forecasting model to enhance the accuracy and stability of ultra-short-term load forecasting.For nonlinear time series, it did not perform well in capturing nonlinearity.
Table 2. Classification and existing problems of data decomposition methods.
Data Decomposition MethodProblems
Wavelet decompositionWavelet transform is limited by the need for the manual determination of wavelet bases and the Heisenberg uncertainty principle, which ultimately affects the accuracy of the prediction results.
Empirical mode decomposition (EMD)There are problems such as modal aliasing, endpoint effects, and difficulty in determining the stopping conditions.
Variational mode decomposition (VMD)VMD requires predefined modal numbers. Inaccurate modal numbers can lead to insufficient or excessive modal decomposition, and if the signal is long, the bandwidths may overlap.
Multivariate variational modal decomposition (MVMD)The influencing parameters in its decomposition process are related to the number of intrinsic modes and the quadratic penalty factor, and these parameters must be preset.
Table 3. Training parameter setting 1.
Weightb_SizeIrDropoutd
IMF 1
IMF 2
32, 64, 1280.0010.013, 4, 5, 6, 7
IMF 3
IMF 4
IMF 5
r 1
32, 64, 1280.0010.000013, 4, 5, 6, 7
Table 4. Training parameter setting 2.
Training ParameterValue
k_size3
OptimizerAdam
ActivationSigmoid
Epochs80
Table 5. Prediction errors of various methods.
TimeStandard/MWProposed MethodHWOA-MVMD-
BiLSTM (Method 1)
GWO-MVMD-TPA-TCN (Method 2)TPA-TCN (Method 3)
29 JulyMAE2.073.144.125.31
RMSE2.204.215.836.83
30 JulyMAE2.744.756.0111.22
RMSE3.586.767.1810.58
31 JulyMAE1.071.693.685.03
RMSE1.312.094.537.12
1 AugustMAE2.463.325.086.38
RMSE3.074.506.187.62
2 AugustMAE1.932.584.135.51
RMSE2.593.565.676.79
average errorMAE1.953.104.606.69
RMSE2.554.175.887.79
Disclaimer/Publisher’s Note: The statements, opinions and data contained in all publications are solely those of the individual author(s) and contributor(s) and not of MDPI and/or the editor(s). MDPI and/or the editor(s) disclaim responsibility for any injury to people or property resulting from any ideas, methods, instructions or products referred to in the content.

