1. Introduction
The worldwide energy landscape is shifting towards sustainable sources to reduce carbon dioxide emissions [
1]. And now, 193 states and the EU have signed the Paris Agreement. Overall, 174 parties have ratified, approved, or acceded to the accord, representing 87% of global carbon emissions, but just 25 have established net-zero emission targets. Limiting the increase in global mean temperature reduces the risks and negative effects of global warming [
2]. The EU’s proposed Renewable Energy Directive recast intends to attain 32% renewable energy sources (RES) in final energy consumption by 2030 [
3]. All new EU buildings must meet Zero Energy Building (ZEB) standards by 2030 [
4]. High-performance buildings use renewable energy sources (RES) to save energy. Before 2030 and throughout the current decade, the incentive structure for low- or zero-emission vehicles will encourage the growth of vehicles that emit between zero and 50 g CO
2/km. This includes battery, hydrogen-powered fuel-cell, and plug-in hybrid electric vehicles [
5]. The EU’s Low Voltage Distribution Networks will face problems. Installing solar systems on rooftop photovoltaics (PVs) may cause unwanted overvoltage for ZEB approval. On the other hand, large numbers of battery electric vehicles (BEVs) charging on LV networks might cause undervoltage and overloading.
Hence, it is anticipated that there will be a persistent expansion of renewable energy resources. The overall proportion of renewable energy has indeed risen culminating in a total capacity exceeding 3.3 TW by 2022. The PV sector has exhibited remarkable expansion, 945.7 GW of PVs of which 70% have been installed in the last five years [
6,
7,
8]. In the past decade, there has been a notable acceleration in the progress of grid-connected Photovoltaic systems in Malta. The installed capacity of photovoltaic (PV) systems has exhibited a significant growth trajectory, rising from 745 kilowatts peak (kWp) in 2010 to a staggering 203.7 megawatts peak (MWp) by the end of 2019. According to reference [
9], the aggregate quantity of photovoltaic installations has surpassed 30,972 units.
Electric Vehicles (EVs) have emerged as a promising green alternative to address the growing challenge of greenhouse emissions and are poised to become a significant component of future transportation mobility. The number of electric vehicles (EVs) sold in 2021 reached a new milestone, a record-breaking 6.6 million units [
10]. The current state of electric vehicle integration in Malta is deemed inadequate; however, there is an anticipated increase in its adoption with electric registering quarterly increases of over 5% compared to insignificant increase in other types of vehicles [
11].
Although PVs and EVs technologies offer advantages as low-carbon options, there exist obstacles that must be resolved immediately now that we are facing mature and early adaptations, respectively.
The issue of PV penetration on LV networks has garnered significant interest in recent times. It has been observed that overvoltage may arise when residential PV systems attain a certain threshold, necessitating appropriate measures. Additionally, research has demonstrated that Medium Voltage MV networks may also be affected by this phenomenon. According to various sources [
12,
13,
14], the implementation of storage has been proposed as a potential solution to address this matter. Moreover, as demonstrated in reference [
15], the preservation of distributed network self-consumption beyond a certain threshold has the potential to stabilize voltage levels.
Numerous scholars have also investigated the significant impact of electric vehicles on distribution networks. The widespread adoption of EVs may potentially result in challenges related to power quality and imbalances between supply and demand, as noted in reference [
16]. According to the research conducted in reference [
17], EVs have an impact on DNs that is contingent upon factors such as charging duration, charging characteristics, driving behaviors, and transportation network. According to reference [
18], unregulated electric vehicle charging may pose a potential issue even with a 10% adoption rate.
A charging strategy that is regulated has been formulated with the aim of enhancing voltage quality and minimizing customer discomfort, as stated in reference [
19]. A recent research study has demonstrated that voltage quality can be enhanced through reactive power regulation in cases where distributed generation systems, such as PVs and EVs, are connected to a common distribution network DN [
20].
The present manuscript, a combined assessment of high PV and EV charging penetration, which is an extension of a previous publication [
21], is structured in the following manner.
Section 2 of the paper outlines the methodology-based framework employed in the study.
Section 3 presents the demonstration of the methodology and framework through a study of the impact on an actual Maltese LV network that originates from a solitary 11/0.4 kV substation and comprises seven LV feeders. The Cumulative Distribution Function (CDF) obtained from the Monte Carlo methods is utilized in
Section 4 to analyze the probability of LV Network issues. Subsequently,
Section 5 expounds upon and analyses the comprehensive empirical findings of the Maltese LV multi-feeder impact study.
Section 6 presents an exposition of the regression analysis tool and its corresponding outcomes.
Section 7 of the article presents the main findings and a significant discovery that distinguishes it from other studies on the inadequate measure for non-linear regression. This section serves as the conclusion of the article.
2. The Methodology-Based Framework
OpenDSS [
22] is utilized to conduct a time-series power flow analysis that is unbalanced and three-phase in nature.
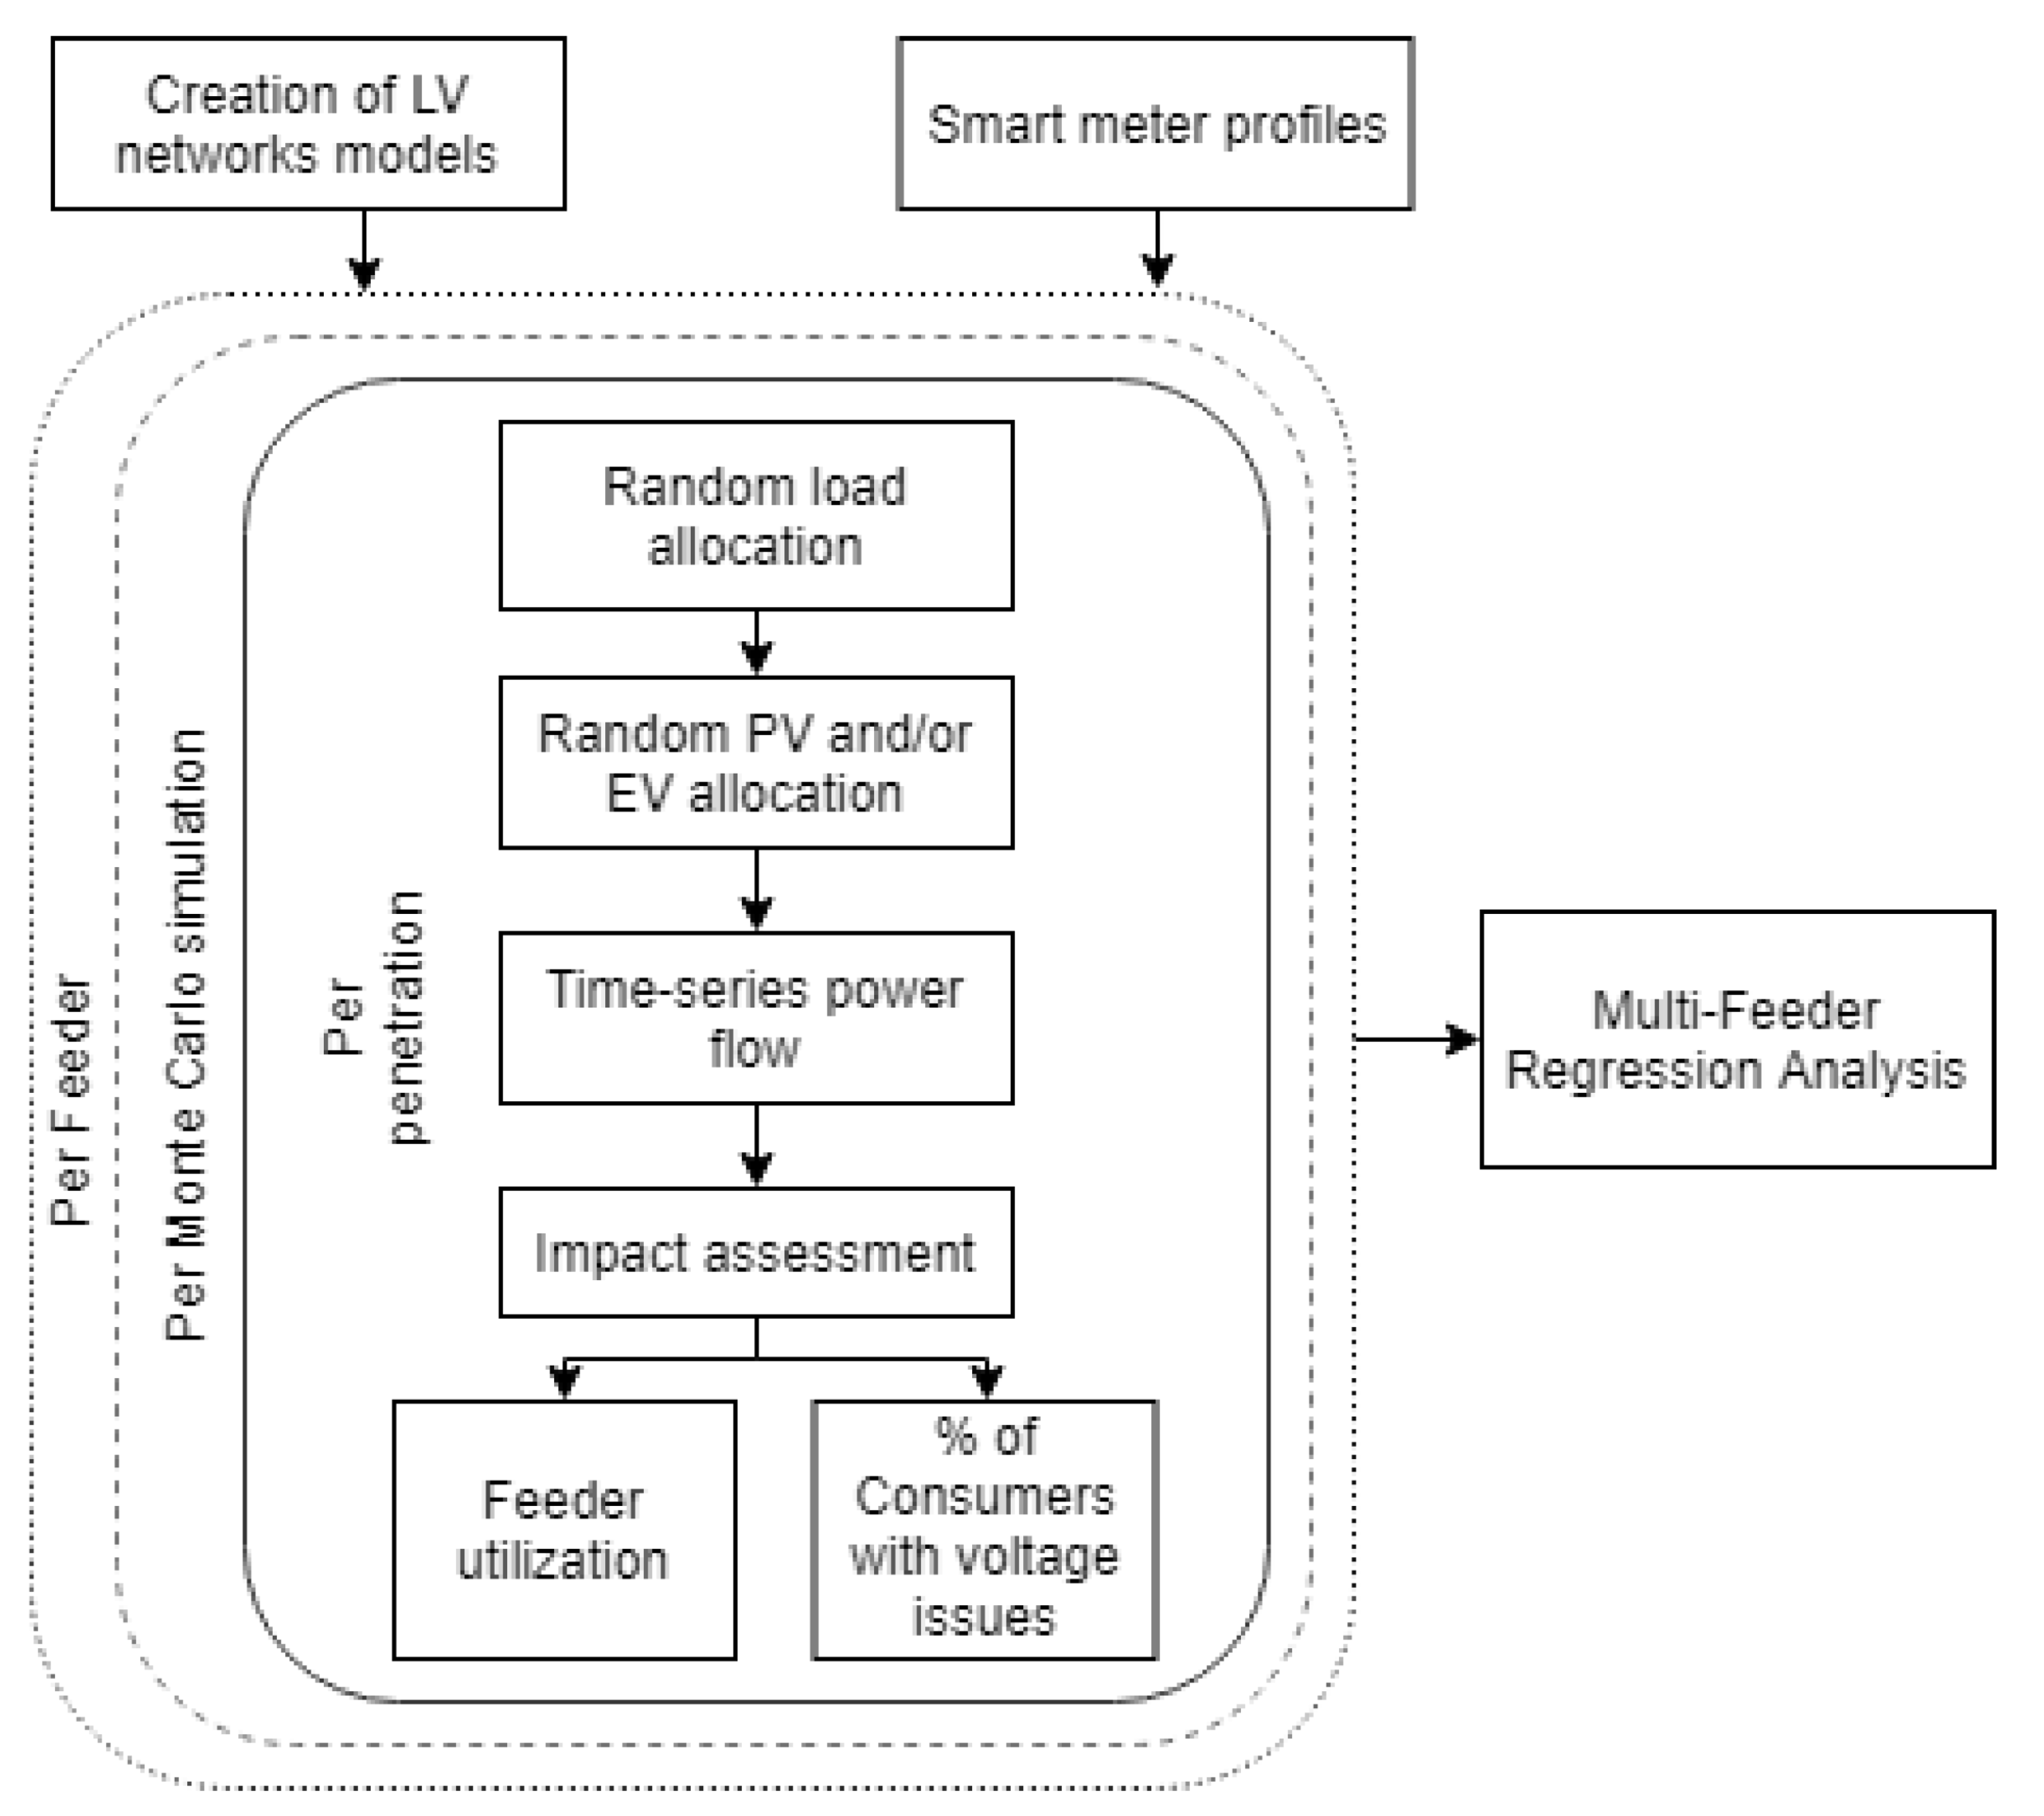
Figure 1 depicts the methodology employed to assess the impact of PV/EV penetration on LV networks, taking into account the uncertainties associated with size and behavior, as described in reference [
21]. The computer models for LV feeders and EV profiles are developed prior to the loading of smart meter load and PVs and the developed EV profiles [
22]. A Monte Carlo simulation is executed for a designated feeder.
Multiple power flows are evaluated for every level of PV and EV charging simultaneously, ranging from 0% to 100% in increments of 10%. For each power flow analysis, a set of profiles is available from which a random load, PV and EV profile are selected. The measure of effect analysis for every simulation, namely the utilization factor and the percentage of users encountering voltage issues, is recorded. The study concludes by conducting a comparative analysis of numerous feeders to identify specific feeder characteristics that may provide insights into technical concerns.
Impact Assessment
It is imperative to comprehend that technical impacts are subject to change over the course of the day owing to the time-dependent characteristics of electricity demands, PV generation, and EV Charging. Therefore, it is imperative to take this into account when assessing technical matters. In light of this objective, the subsequent indices are executed:
Individuals experiencing voltage-related problems. The metric evaluates the voltage calculated for individual consumers and verifies its adherence to the European Standard EN50160, which specifies that the voltage magnitude must fall within the range of 230 V +/− 10%. Any deviation from this range, such as voltage levels below 207 V or above 253 V, is identified as a violation. Non-compliance by a consumer is regarded as problematic. The aggregate count of individuals experiencing voltage-related difficulties is tallied, and the corresponding proportion is computed. The EN50150 standard would be violated if a single value exceeds the limit, as profiles are recorded at a resolution of fifteen minutes.
The utilization factor is a metric used to measure the efficiency of a system or process by determining the proportion of time that it is being utilized or actively engaged in performing its intended function. The aforementioned metric is derived by dividing the maximum current by its corresponding current carrying capacity. The presented index illustrates the utilization of the feeder in relation to varying levels of EV and PV penetration.
4. Likelihood of LV Network Challenges
The assessment of impact, as outlined in
Section 3, has been expanded to account for the stochastic properties inherent in this particular analysis. The assessment of the acceptability of a given penetration level causing technical problems can be based on the probability of encountering voltage or thermal issues. Quantifying this probability can aid utility companies in assessing the viability of accepting penetration levels that denote low probabilities of technical obstacles, as opposed to investing in infrastructure.
The Monte Carlo method enables the derivation of a Cumulative Distribution Function (CDF) that can effectively showcase the likelihood of encountering voltage and overloading issues. Based on the collected empirical data from one hundred simulations, an empirical cumulative distribution function (CDF) is selected. The method allocates a probability of 1/n to each individual datum and subsequently computes the cumulative sum of these probabilities, encompassing the given datum. The outcome is a discontinuous function that exhibits a staircase-like pattern, where each step is augmented by a value of 1/n.
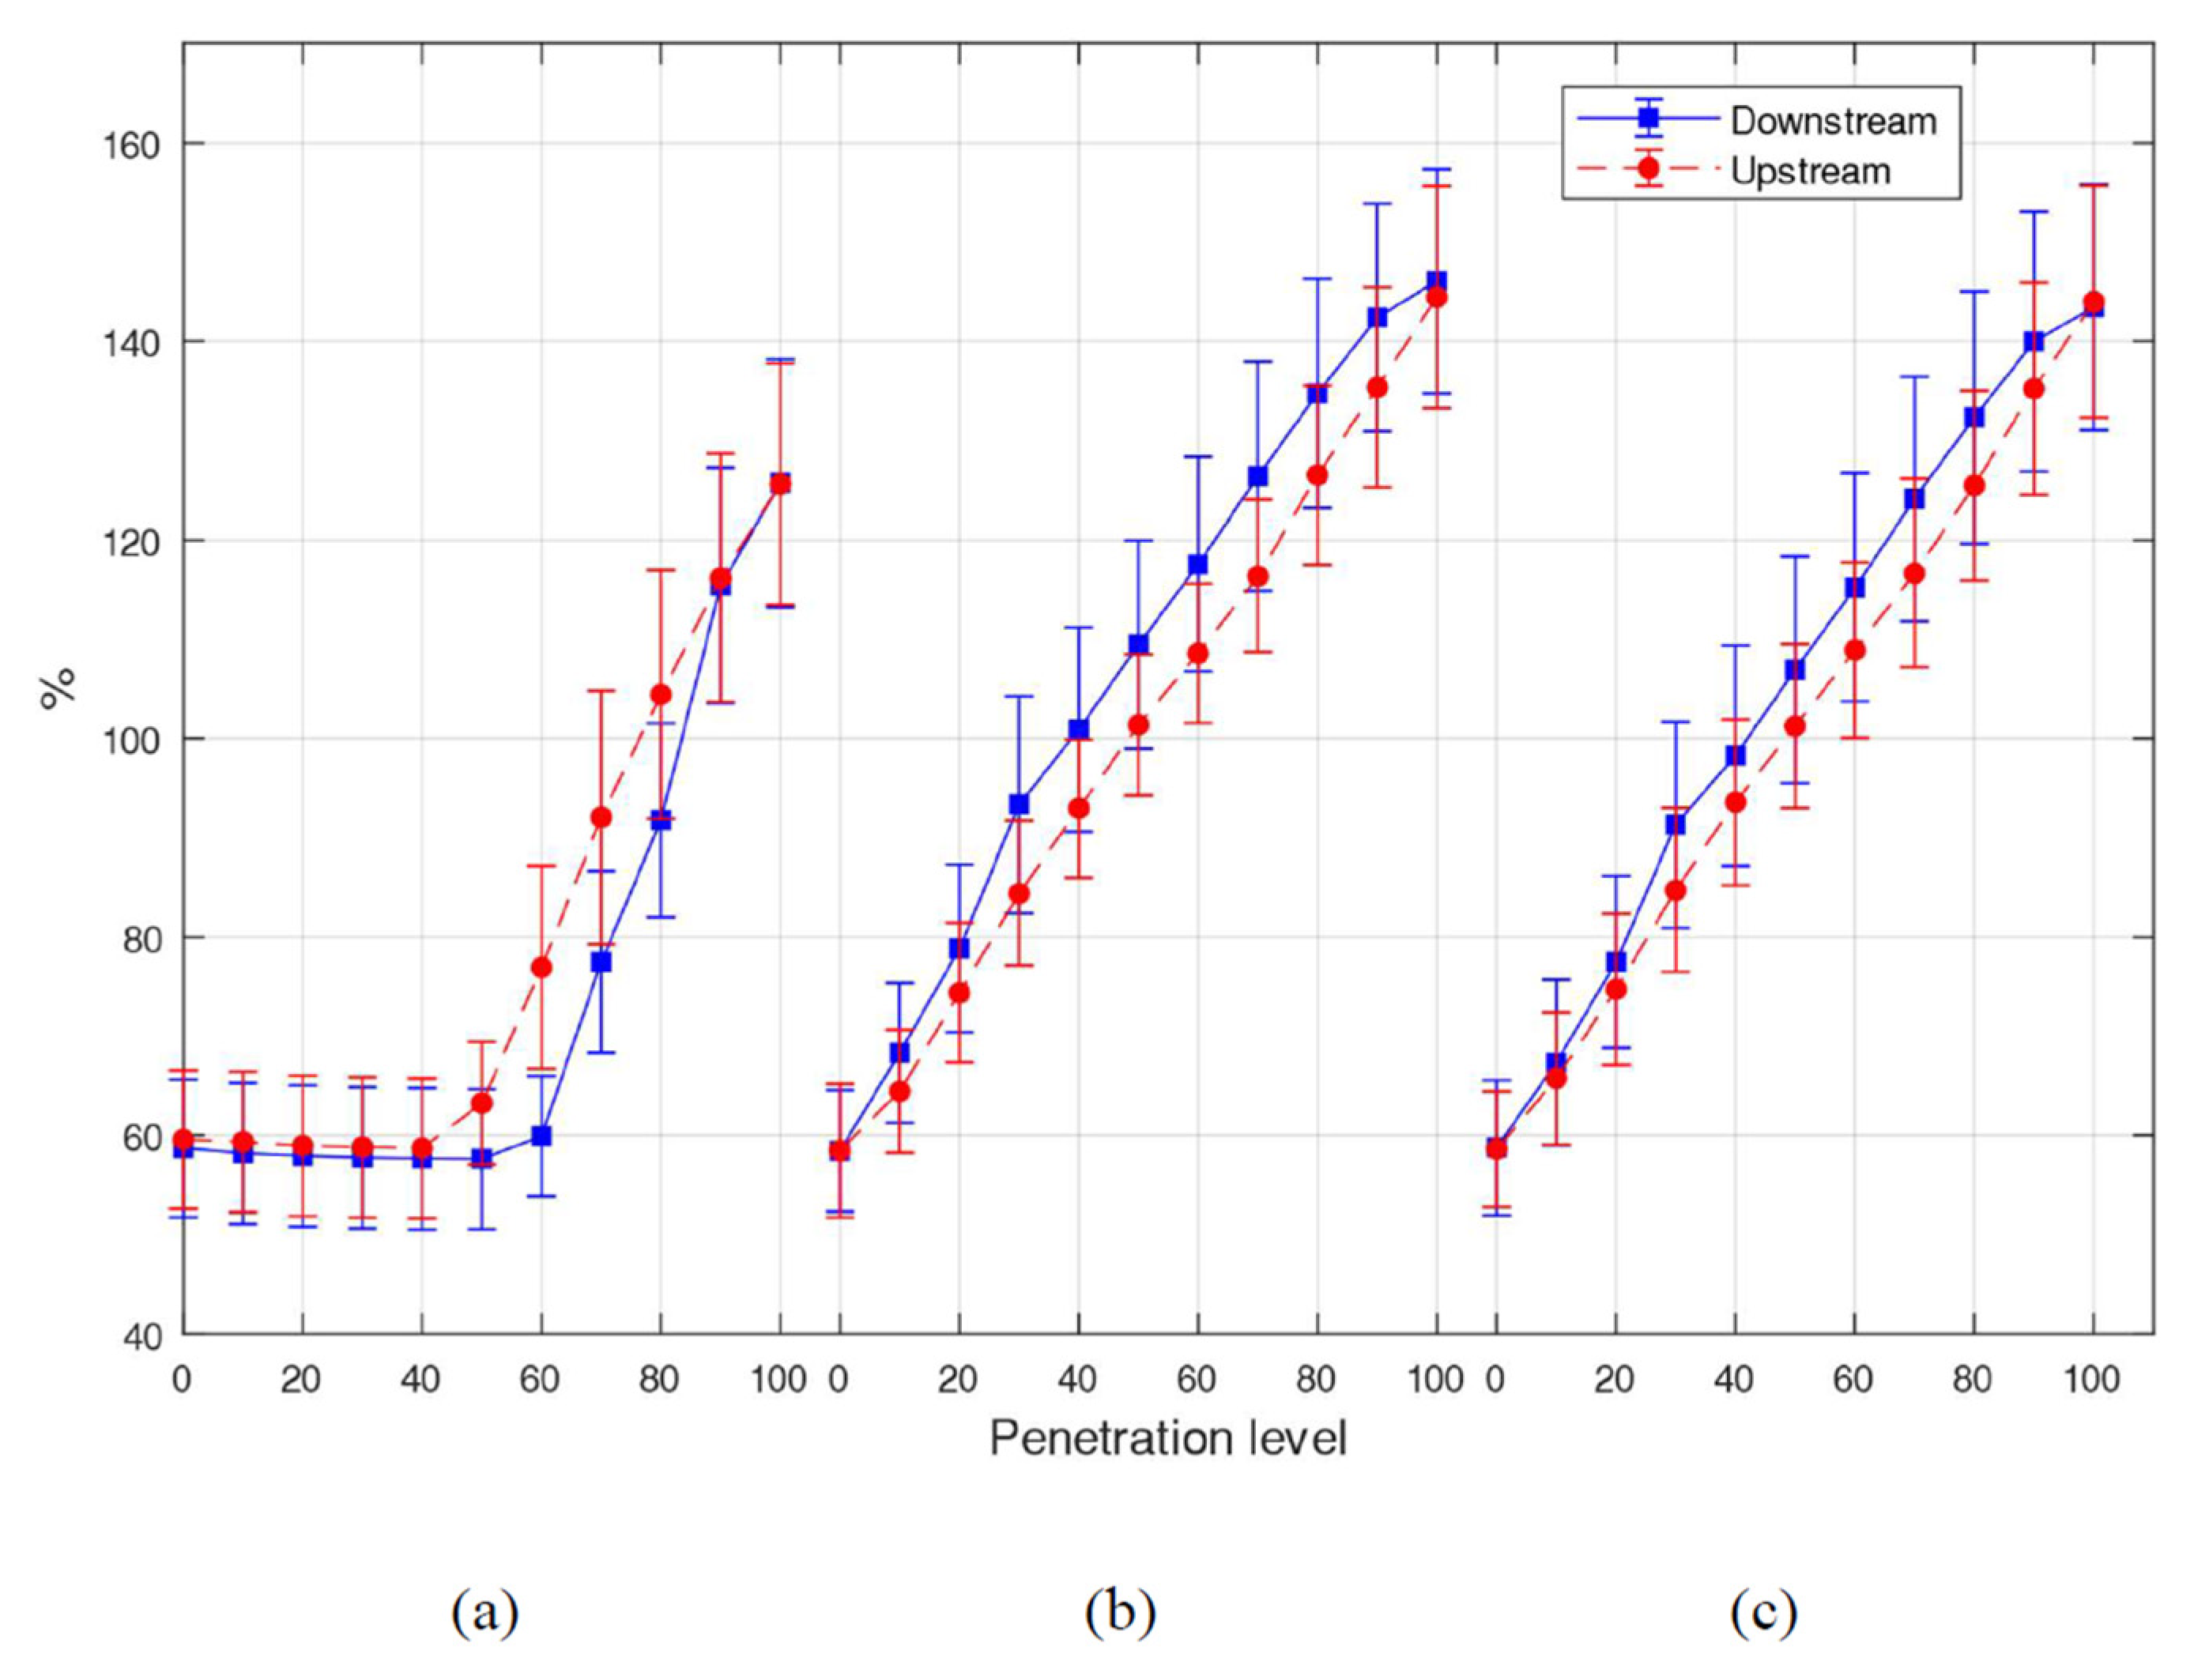
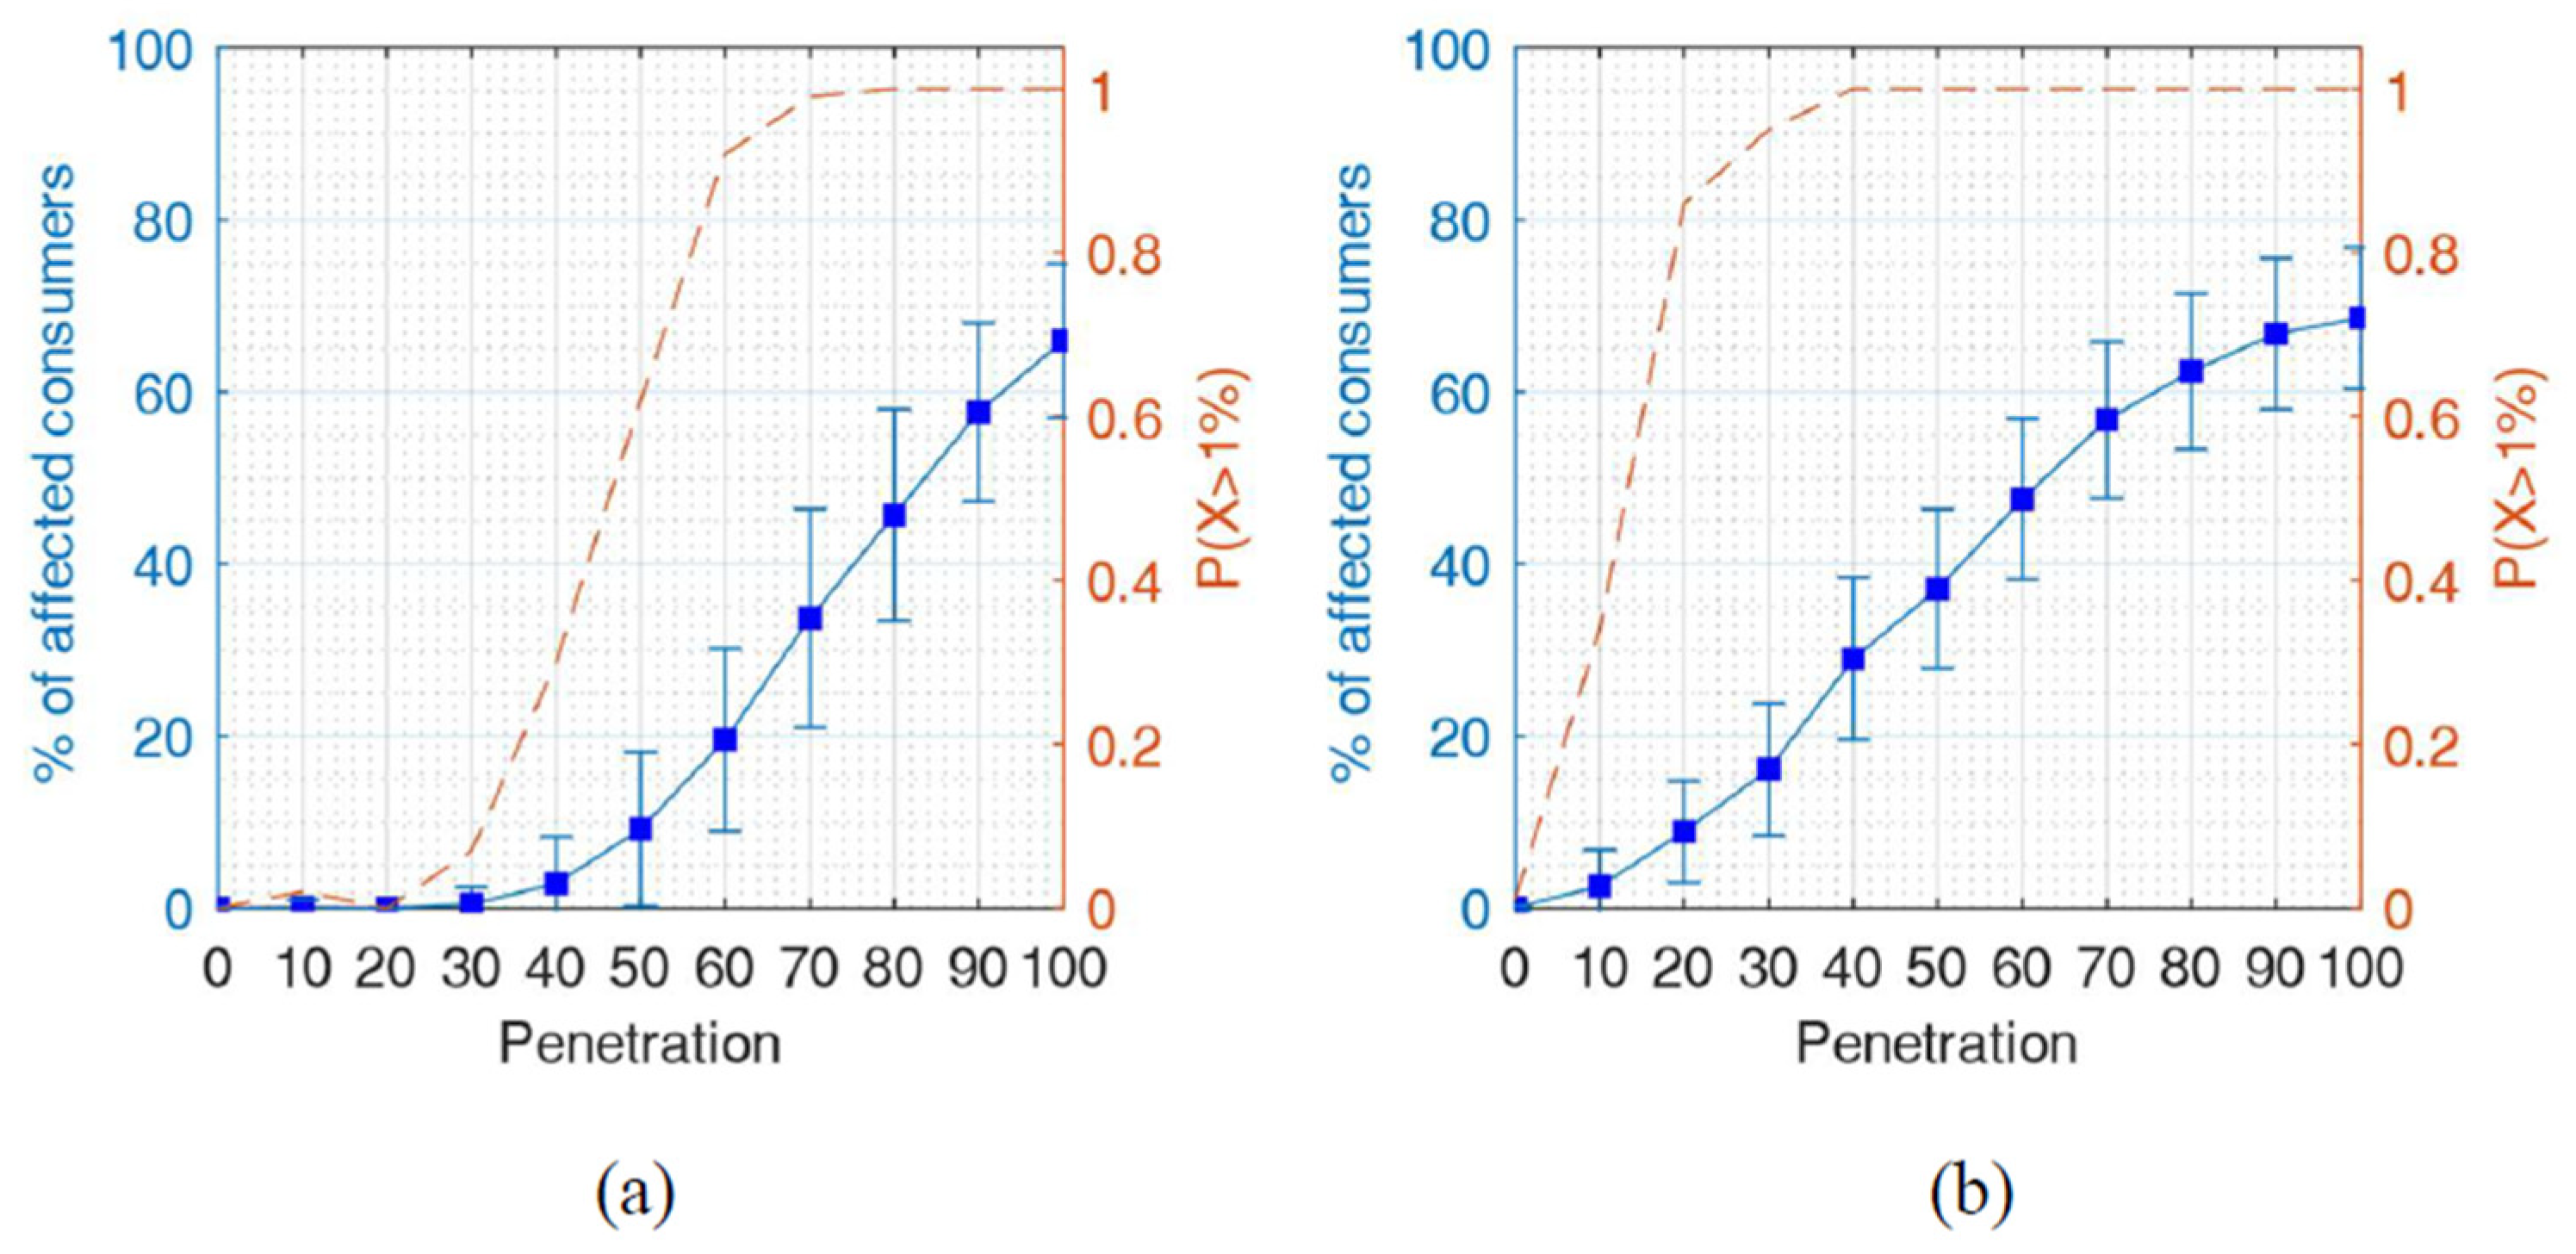
The likelihood of voltage problems arising in both downstream (a) and upstream (b) allocation situations can be graphically illustrated through the cumulative distribution functions (CDFs), as presented in
Figure 4. Having >20% of consumers with voltage violations, the likelihood is found to be 0.1, 0.5, and 0.9 at 50%, 60%, and 70% penetration for downstream allocation scenarios, respectively, and for upstream scenarios, 0.2, 0.78, and 0.95 probability at 30%, 40%, and 50% penetration levels, respectively, of both PV and EVs.
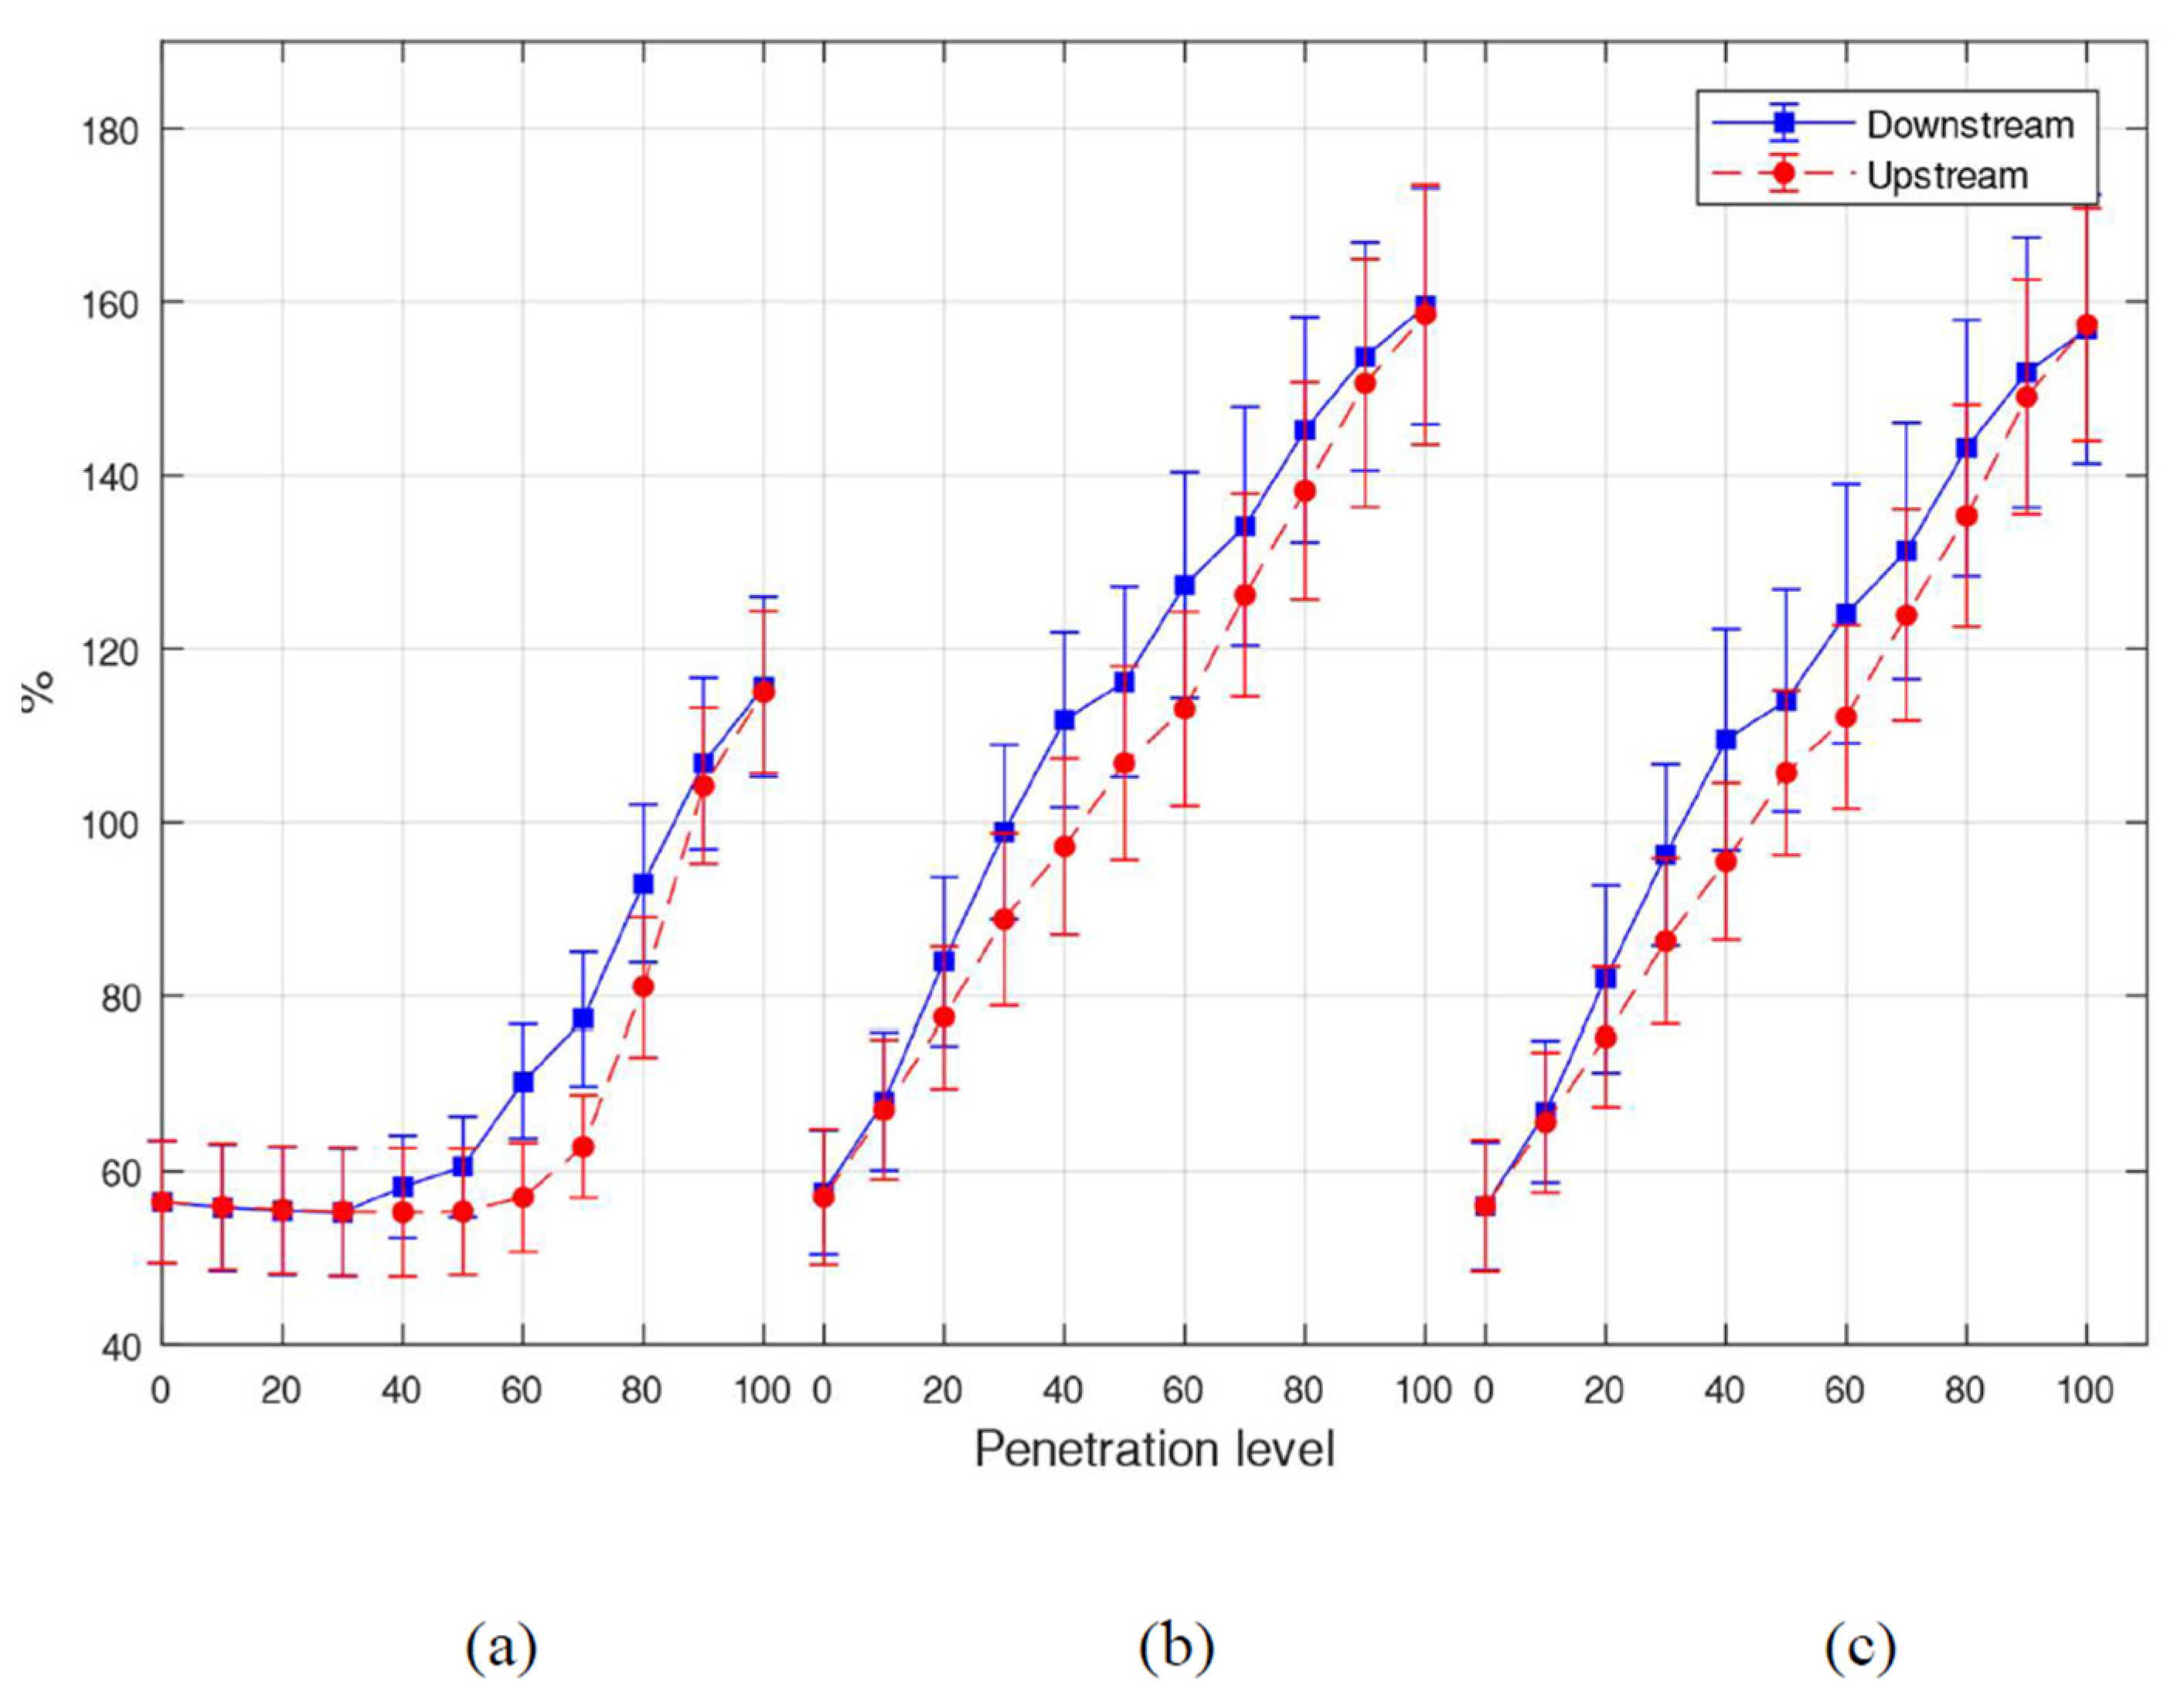
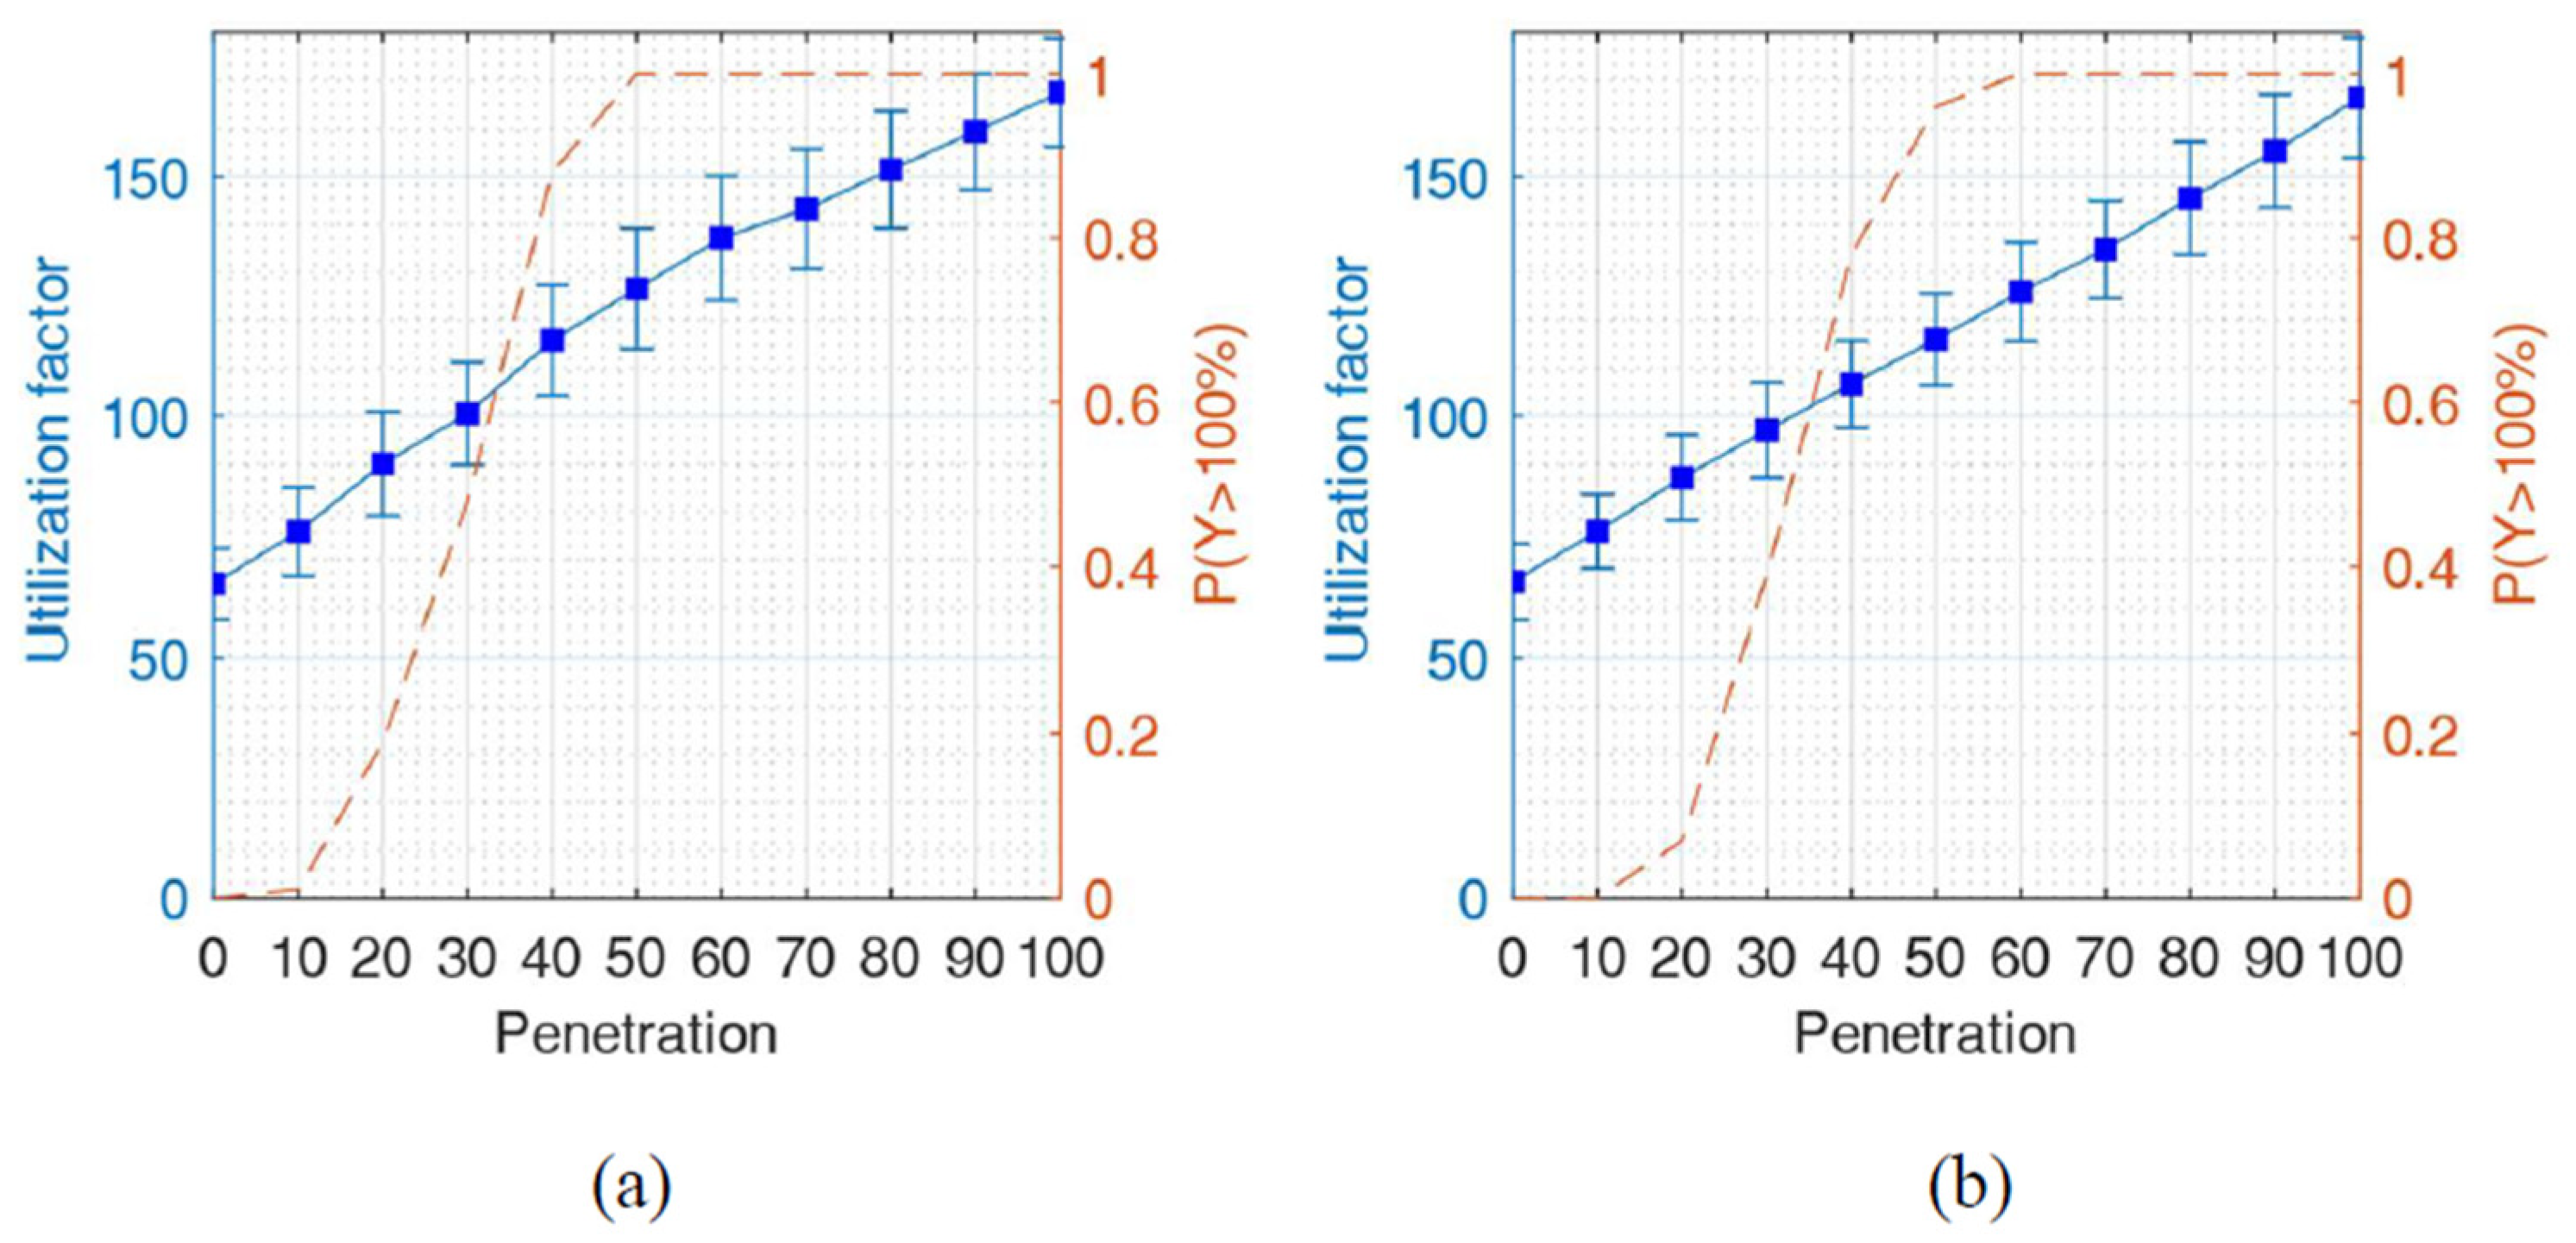
The likelihood of observing a utilization factor exceeding 100% is 0.2, 0.43, and 0.9 for penetration rates of 20%, 30%, and 40%, respectively, in the downstream allocation scenario as shown in
Figure 5. Once the penetration reaches 60% in upstream scenario, the likelihood of encountering overloading issues increases to 100%. It is noteworthy that, in contrast to the PV scenario [
21], the primary challenge for combined systems is the issue of overloading.
Regarding the acceptance of a potential technical issue, utility companies can determine whether a problem is deemed significant only if the likelihood of having a prevalence of voltage issues among consumers exceeding a specified threshold, such as 1%, is greater than a certain level. Hence, in the event that the utility is unresponsive to any conceivable technical difficulties, the aforementioned parameter may be assigned a value of zero, indicating that the infractions are identified as soon as a voltage issue is detected in any of the simulations. On the contrary, if the utility is willing to tolerate a certain level of potential technical issues, it has the option to increase the threshold accordingly.
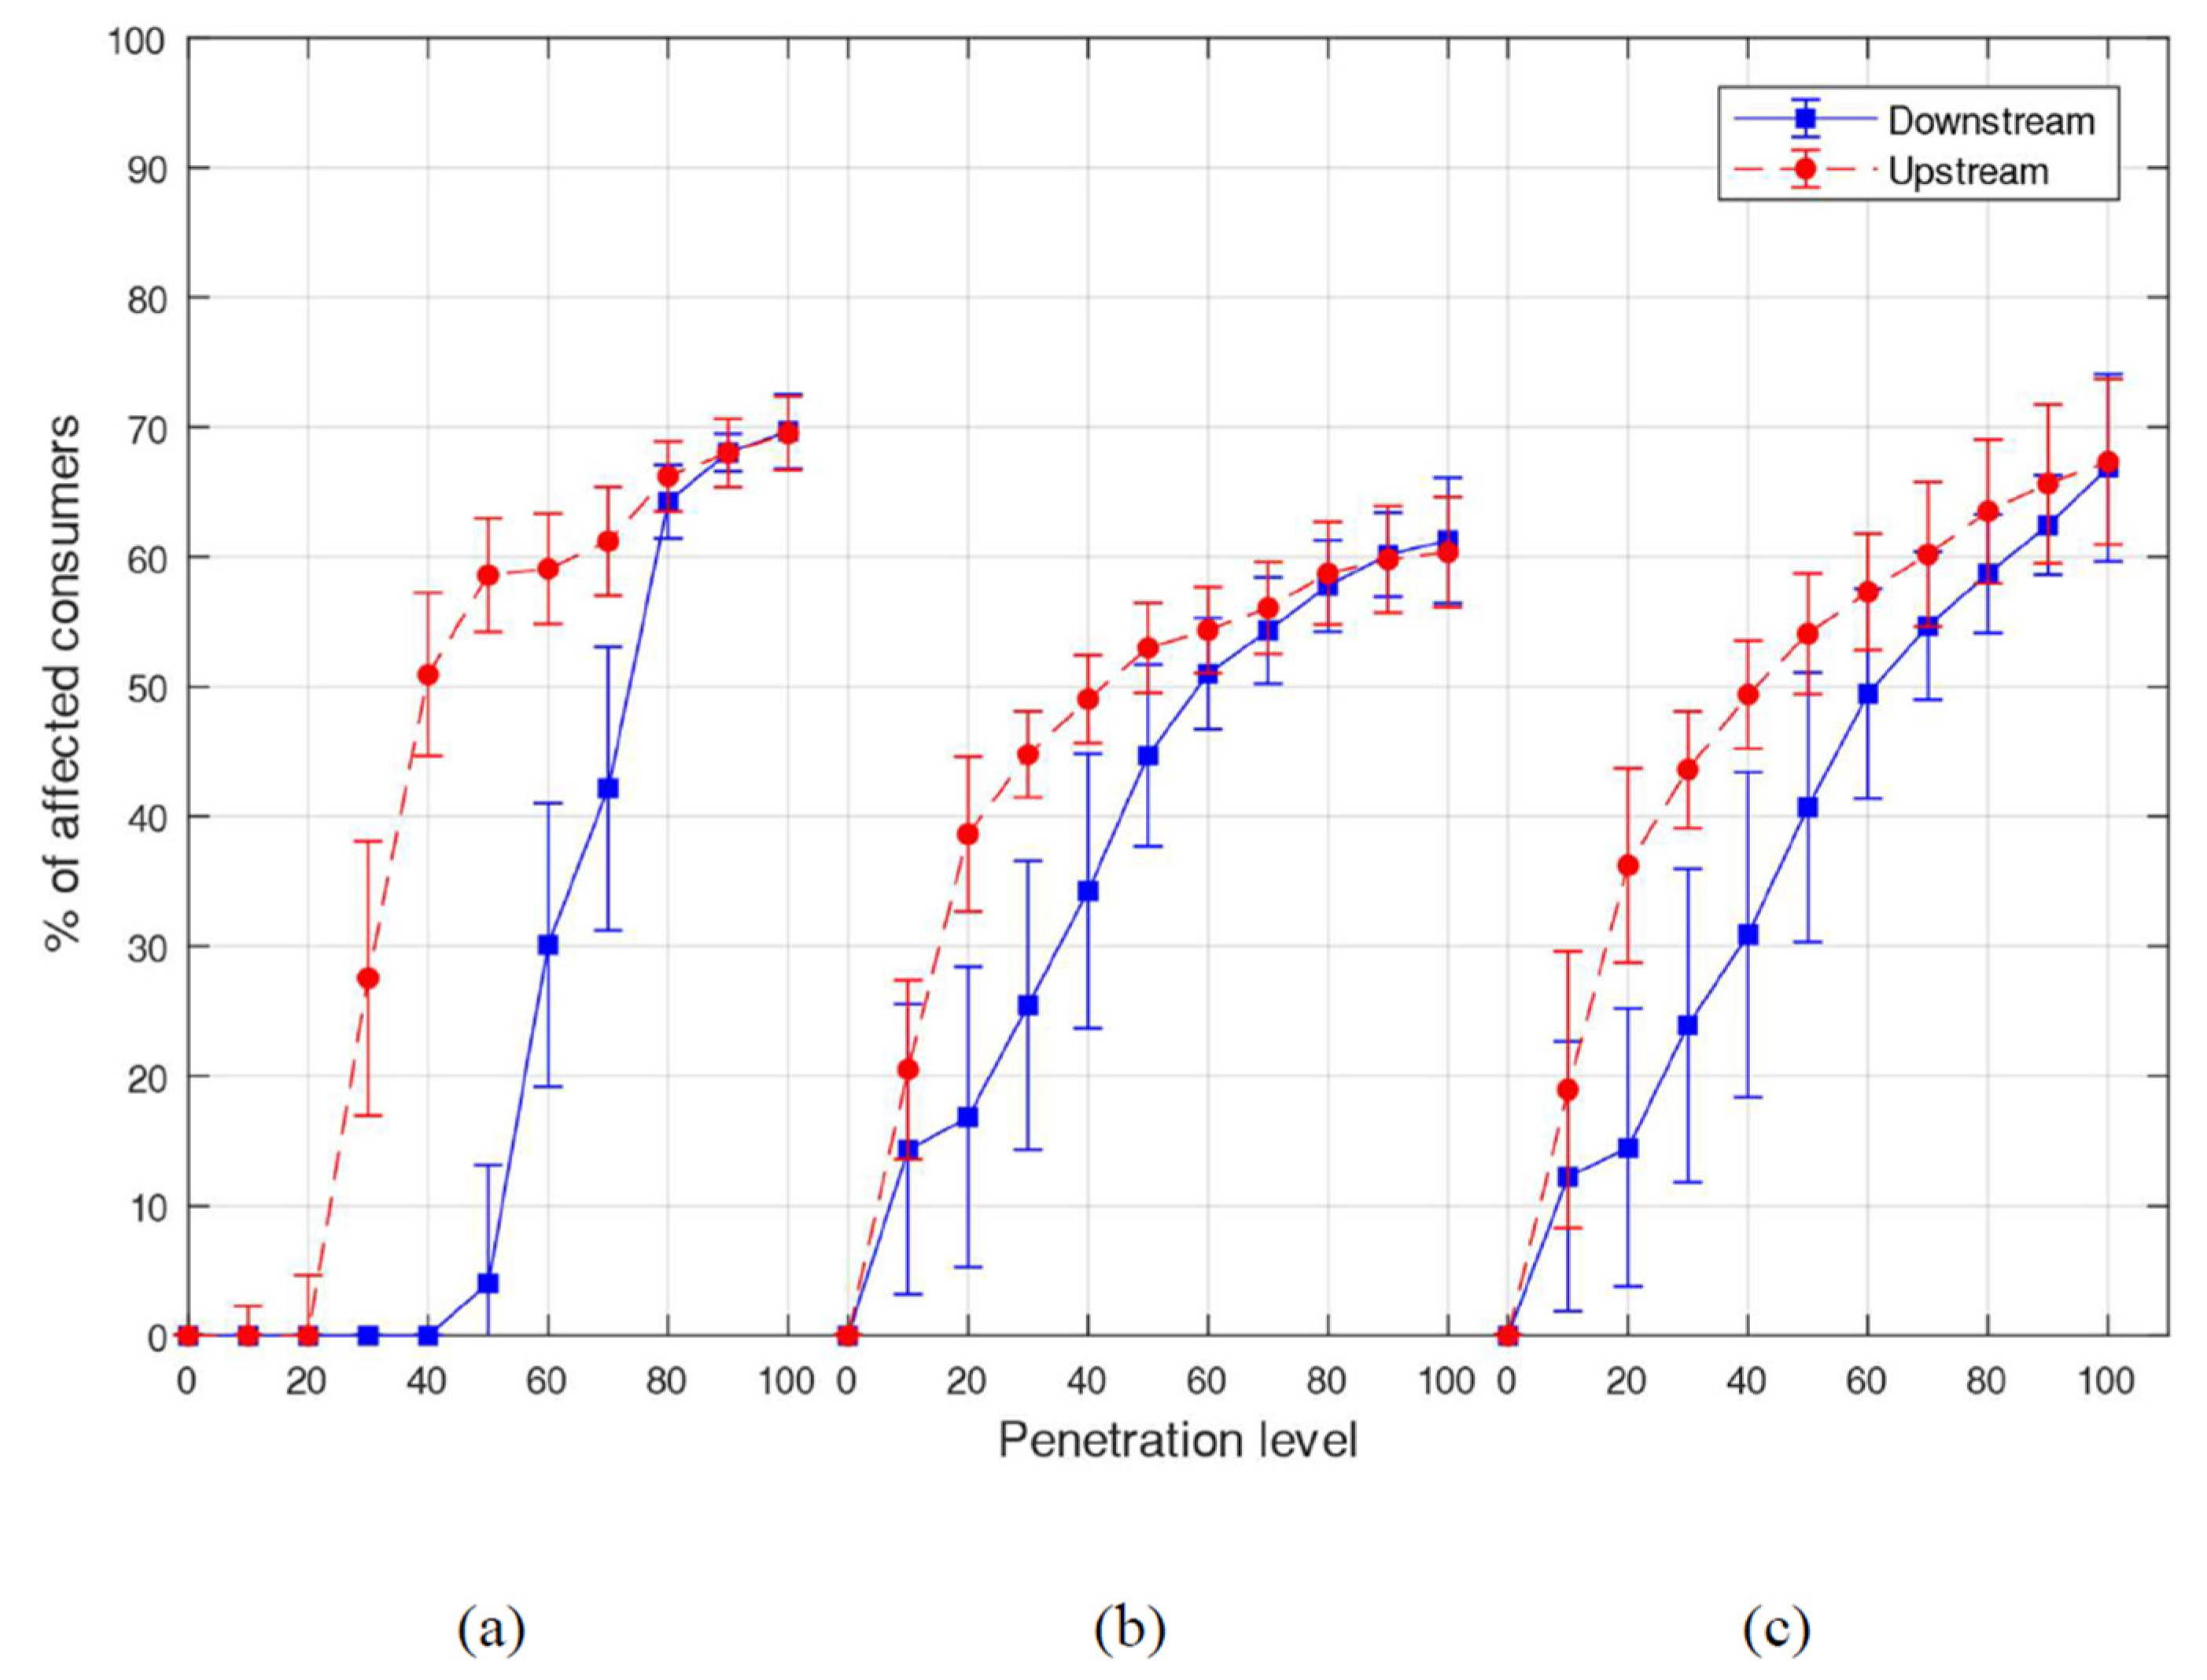
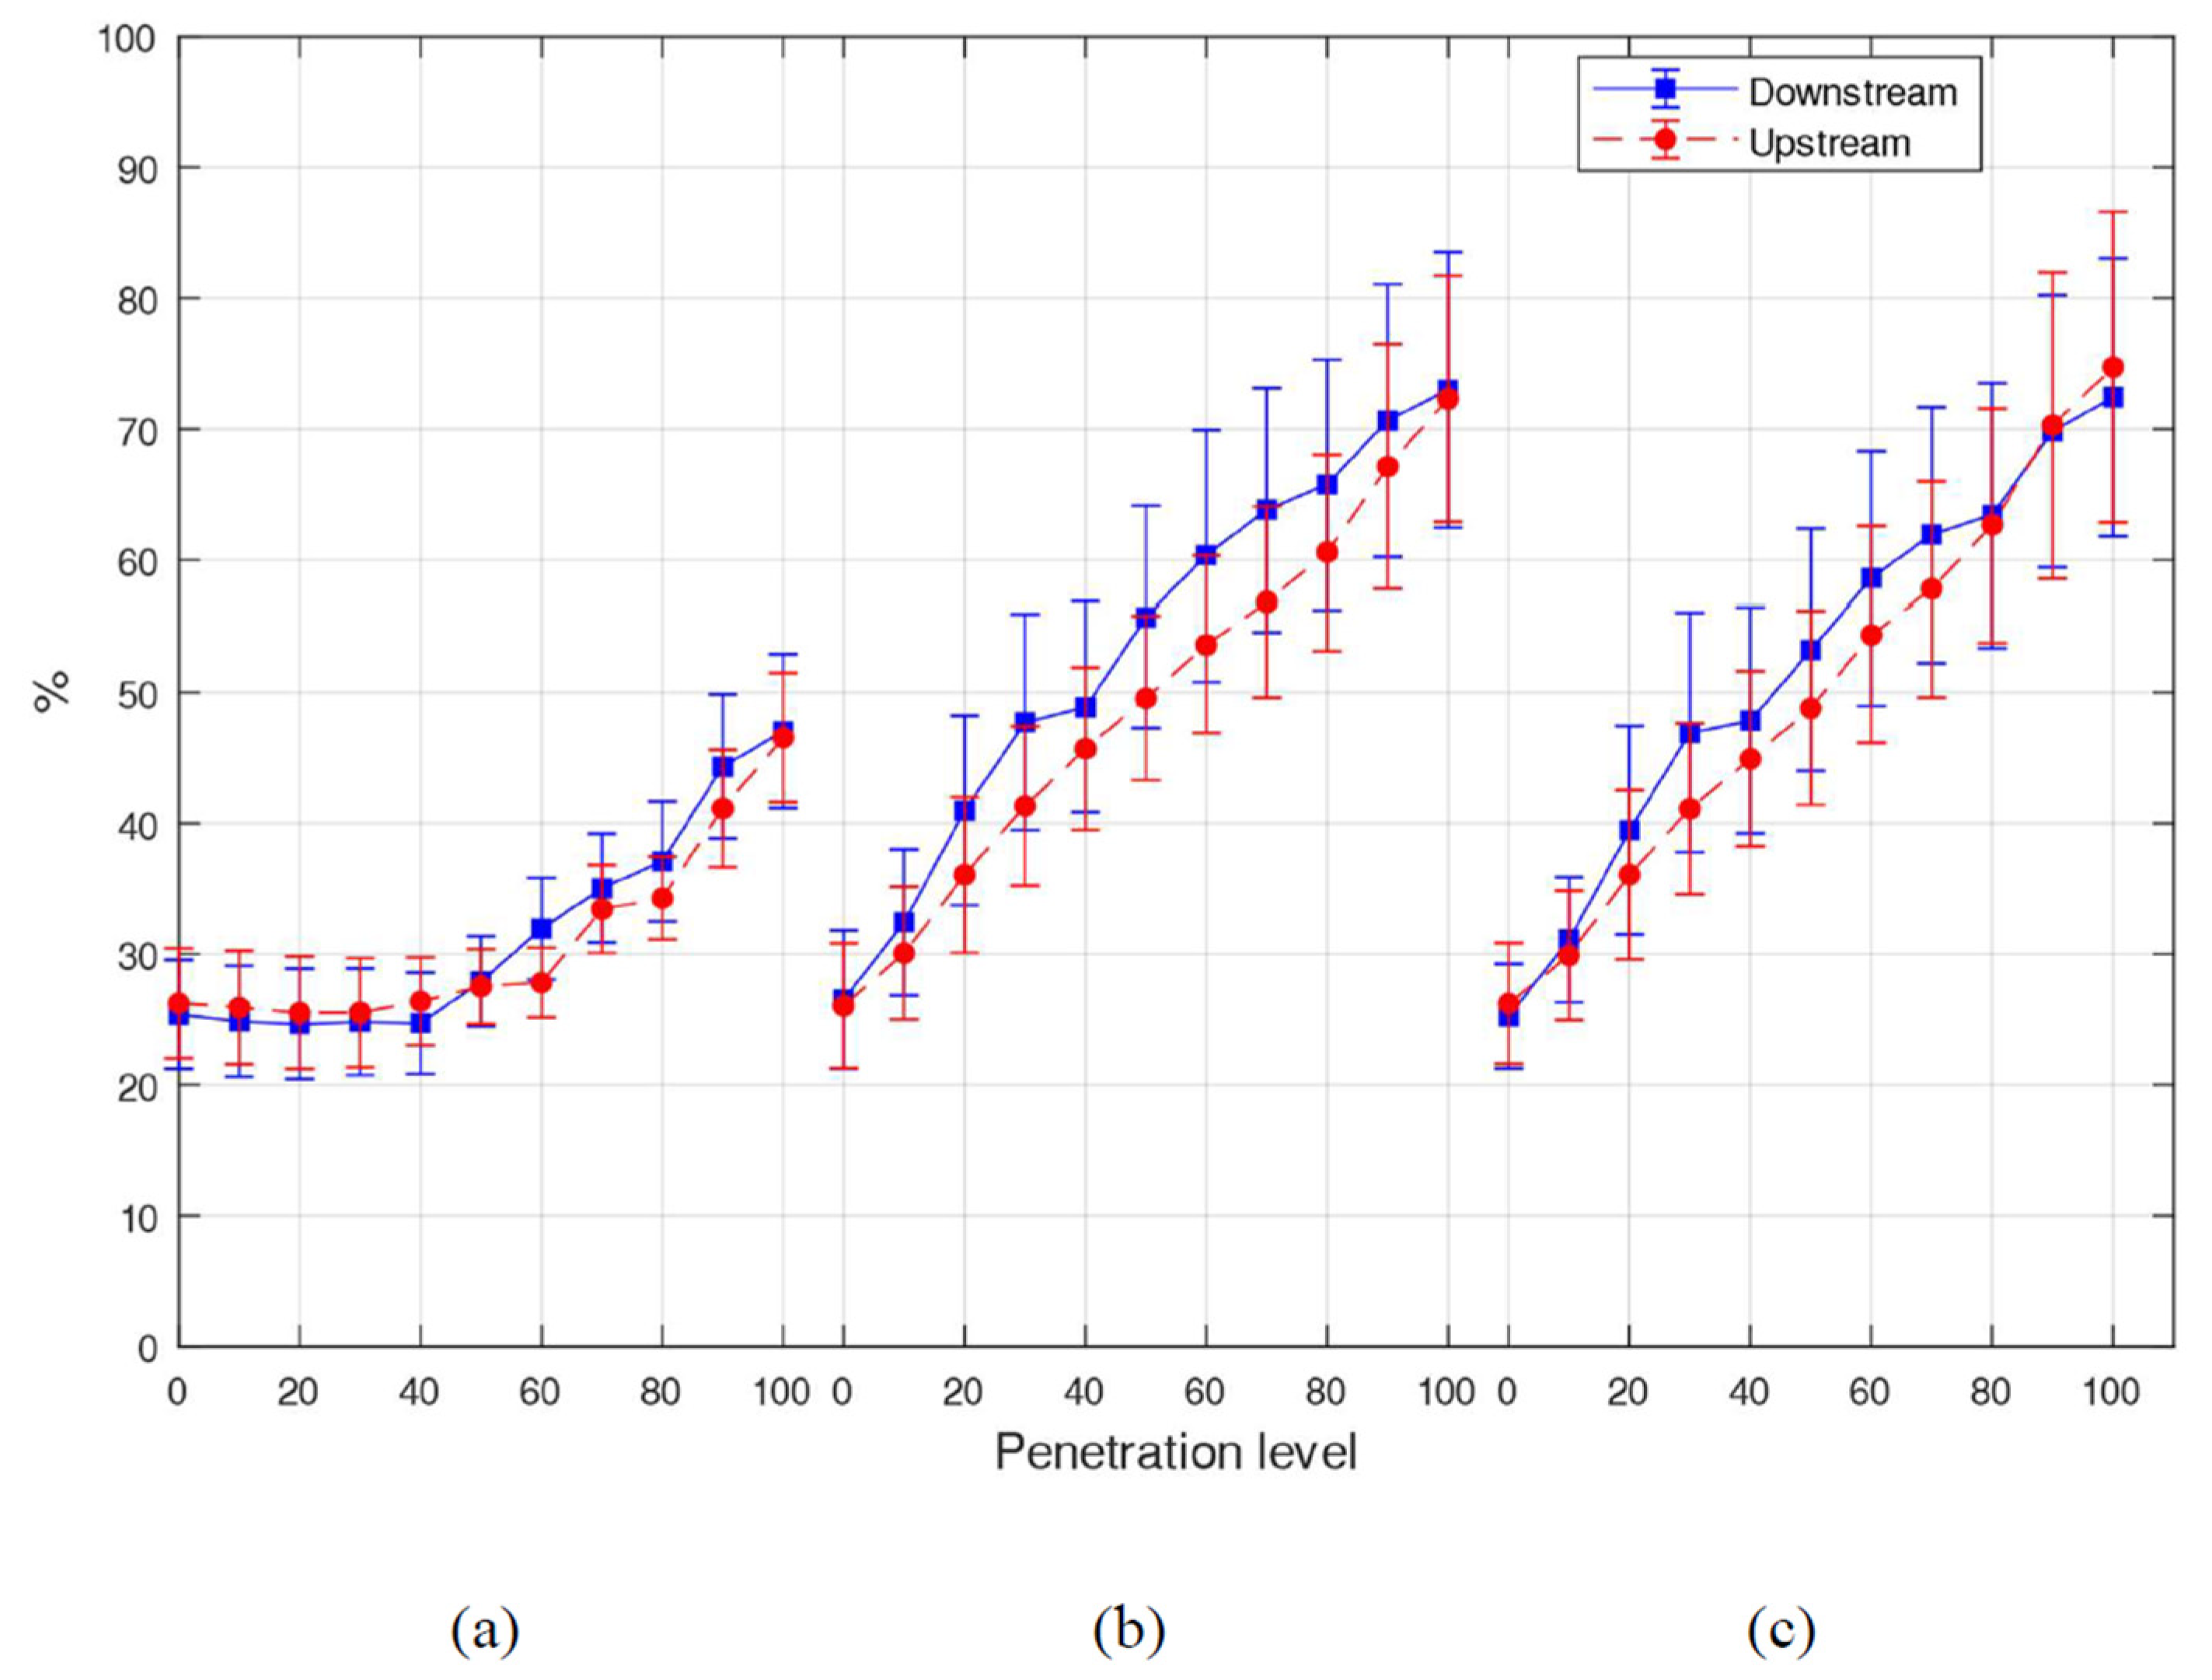
Figure 6 depicts the average percentage of consumers experiencing voltage issues, along with the corresponding standard deviation, resulting from the integration of PV and EV charging.
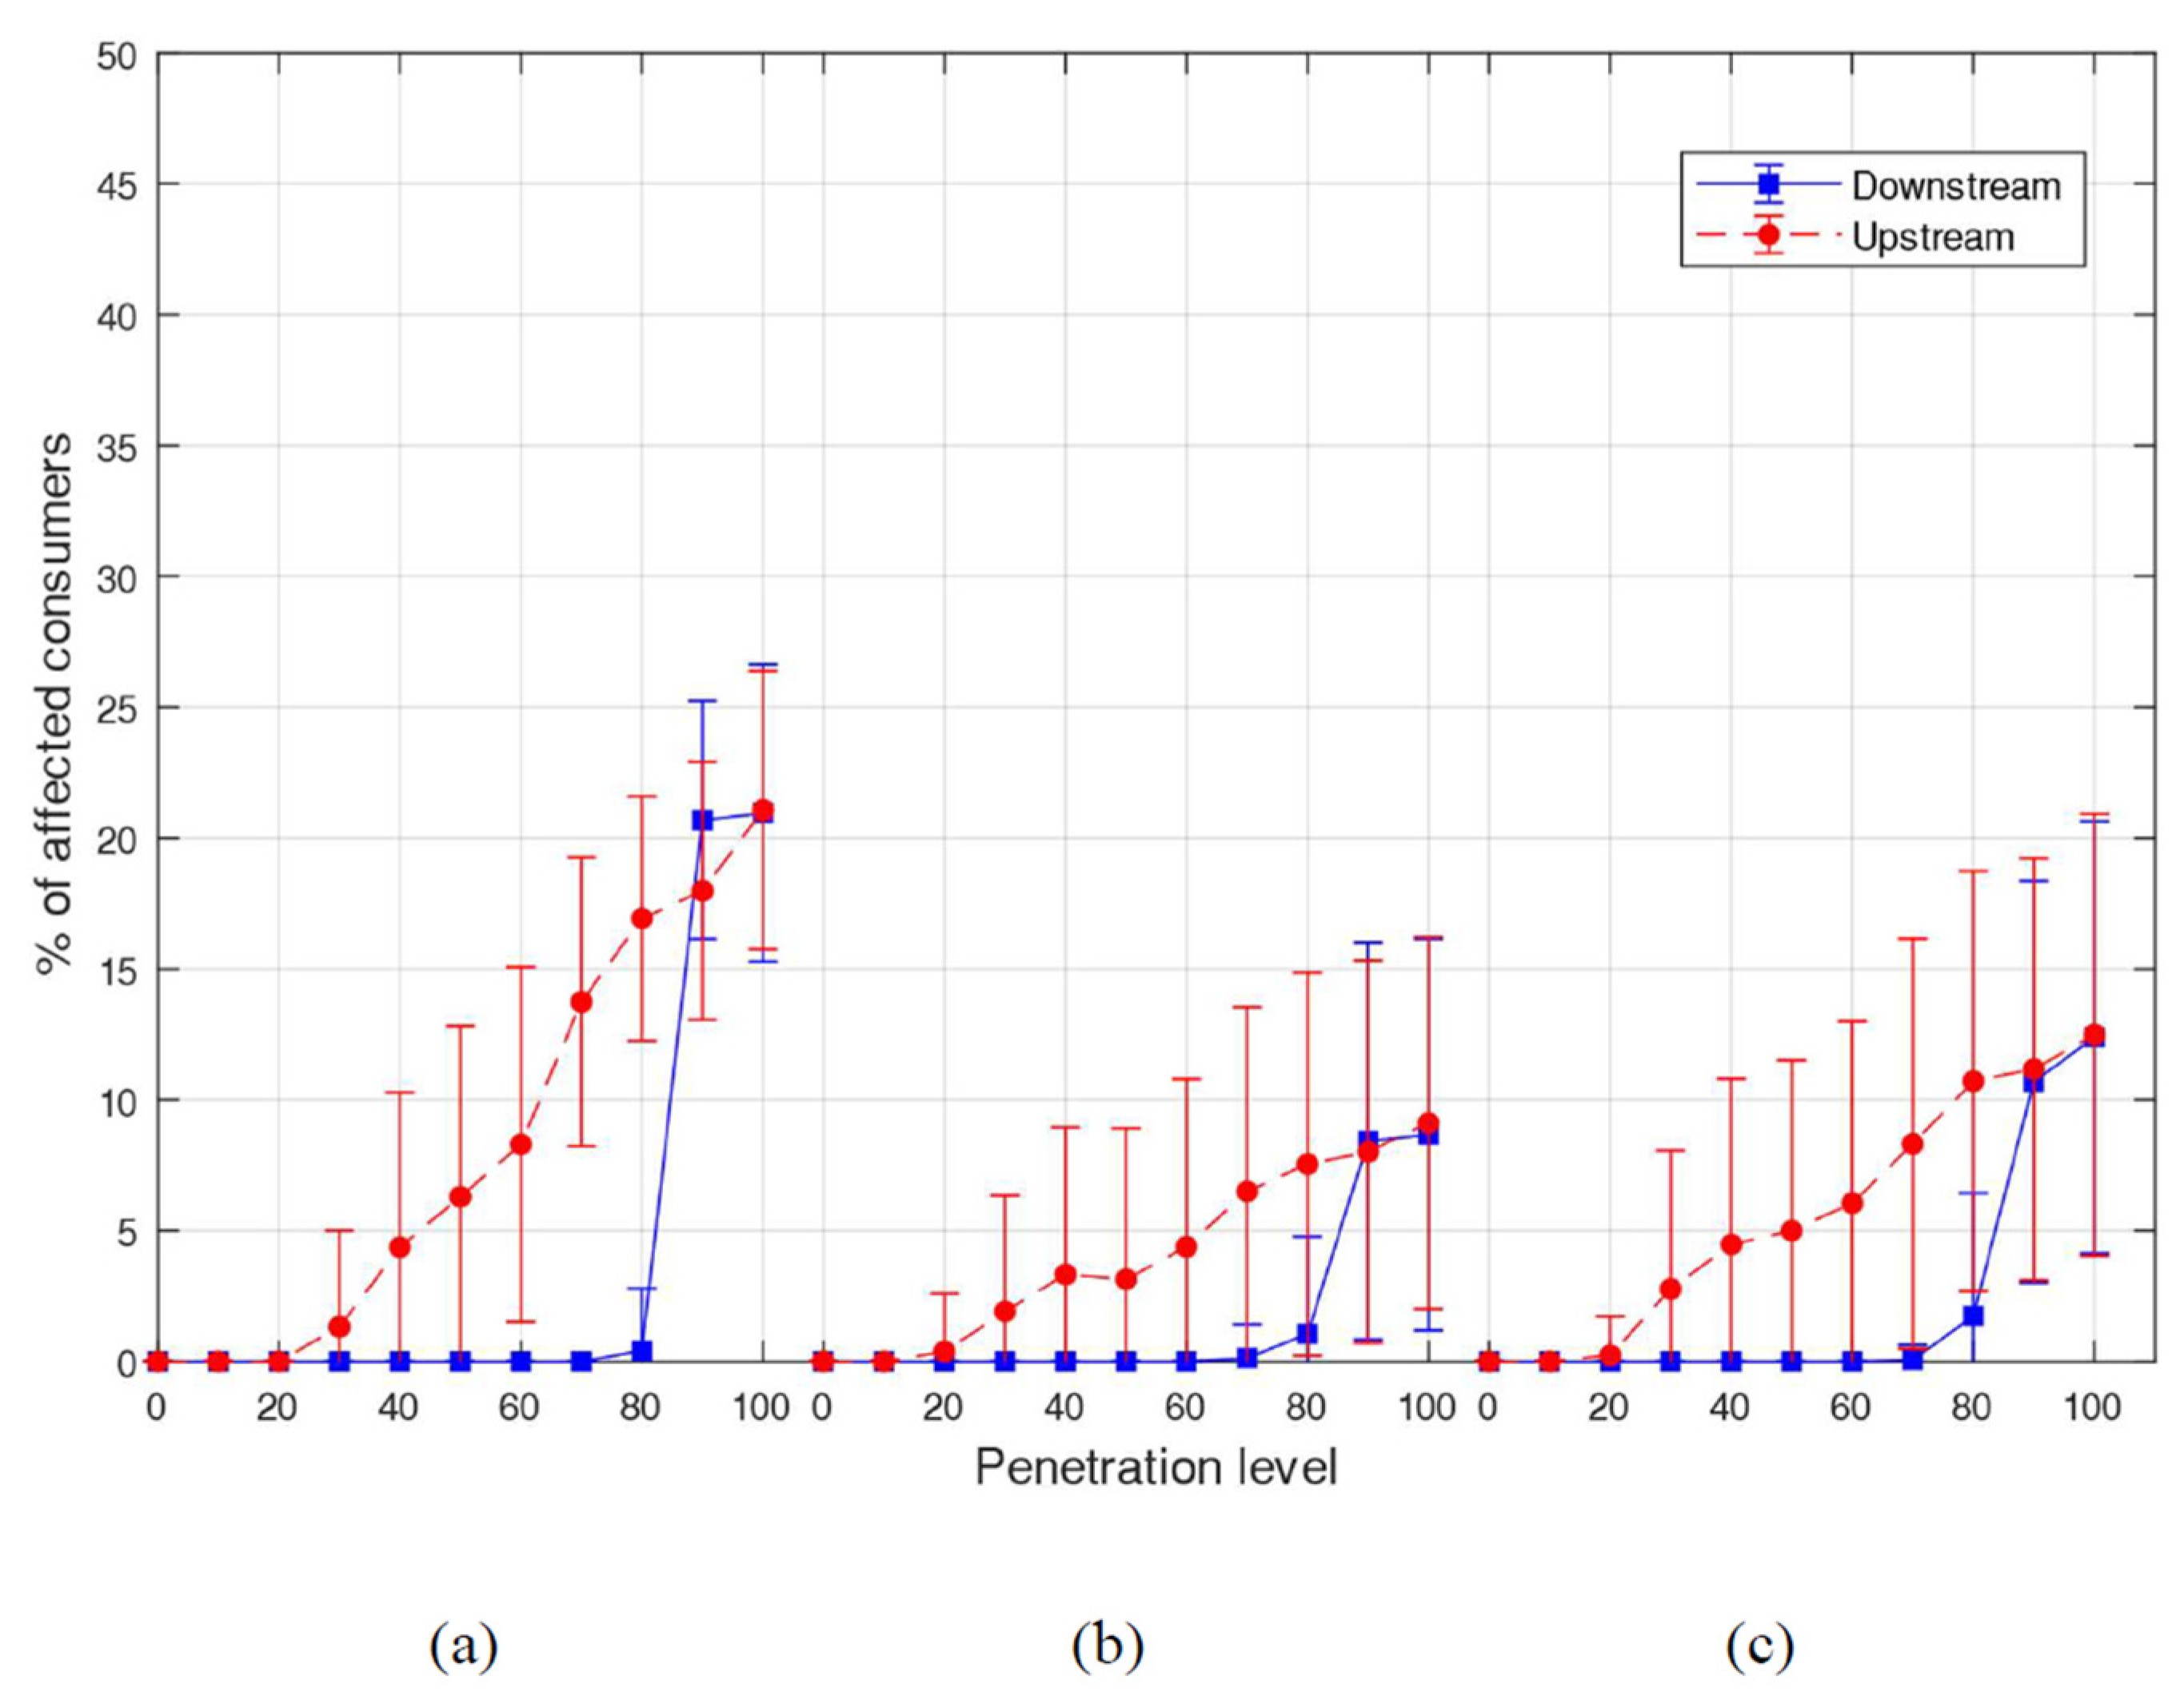
A comparable evaluation is conducted to determine the point at which a loading level of the feeder (utilization factor > 100%) is deemed problematic or not, based on the utilization factor. The graphical representation depicted in
Figure 7 illustrates the effects of overloading resulting from the integration of photovoltaic (PV) and electric vehicle (EV) technologies on Feeder 4. Specifically, it portrays the likelihood of observing a utilization factor exceeding 100% per penetration level in the downstream scenario. Consequently, in the event that a utility opts to utilize a cautious scenario, difficulties may arise at a mere 10% level of penetration, where the likelihood is equivalent to 0.01. Generally, utilities tend to permit a certain level of asset overload. Thus, it is possible for them to determine that issues are deemed significant solely in instances where overloading transpires with a likelihood exceeding 0.05. This phenomenon leads to a greater level of penetration; however, it also significantly increases the likelihood of overloading issues. Such issues are expected to arise at approximately 30–40% penetration for both downstream and upstream allocation scenarios.
5. Multi-Feeder Impact Analysis
The impact analysis is applied to 95 LV distribution feeders to provide further investigation on the impacts of PV integration. The studied feeders are located in Malta, owned and operated by Enemalta plc. They have been modelled considering Geographic Information System (GIS) data provided by Enemalta plc. Hence, the conductor attributes, consumer geographical position, actual network configuration (comprising the coordinates and extent of each line), and phase interconnections are taken into account.
5.1. General Assessment of PV and EV Impacts
Through the utilization of Monte Carlo simulations, it becomes feasible to quantify the technical complications stemming from varying levels of PV and EV penetrations and subsequently assess their respective probabilities. Hence, a voltage infraction is identified when the likelihood of the feeder to encounter voltage problems among more than 1% of its consumers (X) surpasses a specific threshold value α, that is, P(X ≥ 1) ≥ α. The establishment of this threshold is determined by the utility company based on its tolerance for potential technical issues. Furthermore, it is deemed that a feeder has exceeded its capacity if the likelihood of its utilization factor surpassing 100% of the designated feeder capacity is equal to or greater than α, expressed as P(Y > 100) ≥ α. Thus, in the event that the utility set α is assigned a value of zero, technical difficulties may arise as soon as any of the simulations encounter an issue. Conversely, when α is assigned a value of 0.05, the occurrence of technical issues is deemed to be significant if they manifest in no less than 5% of the simulations.
5.2. Feeder Level Impacts
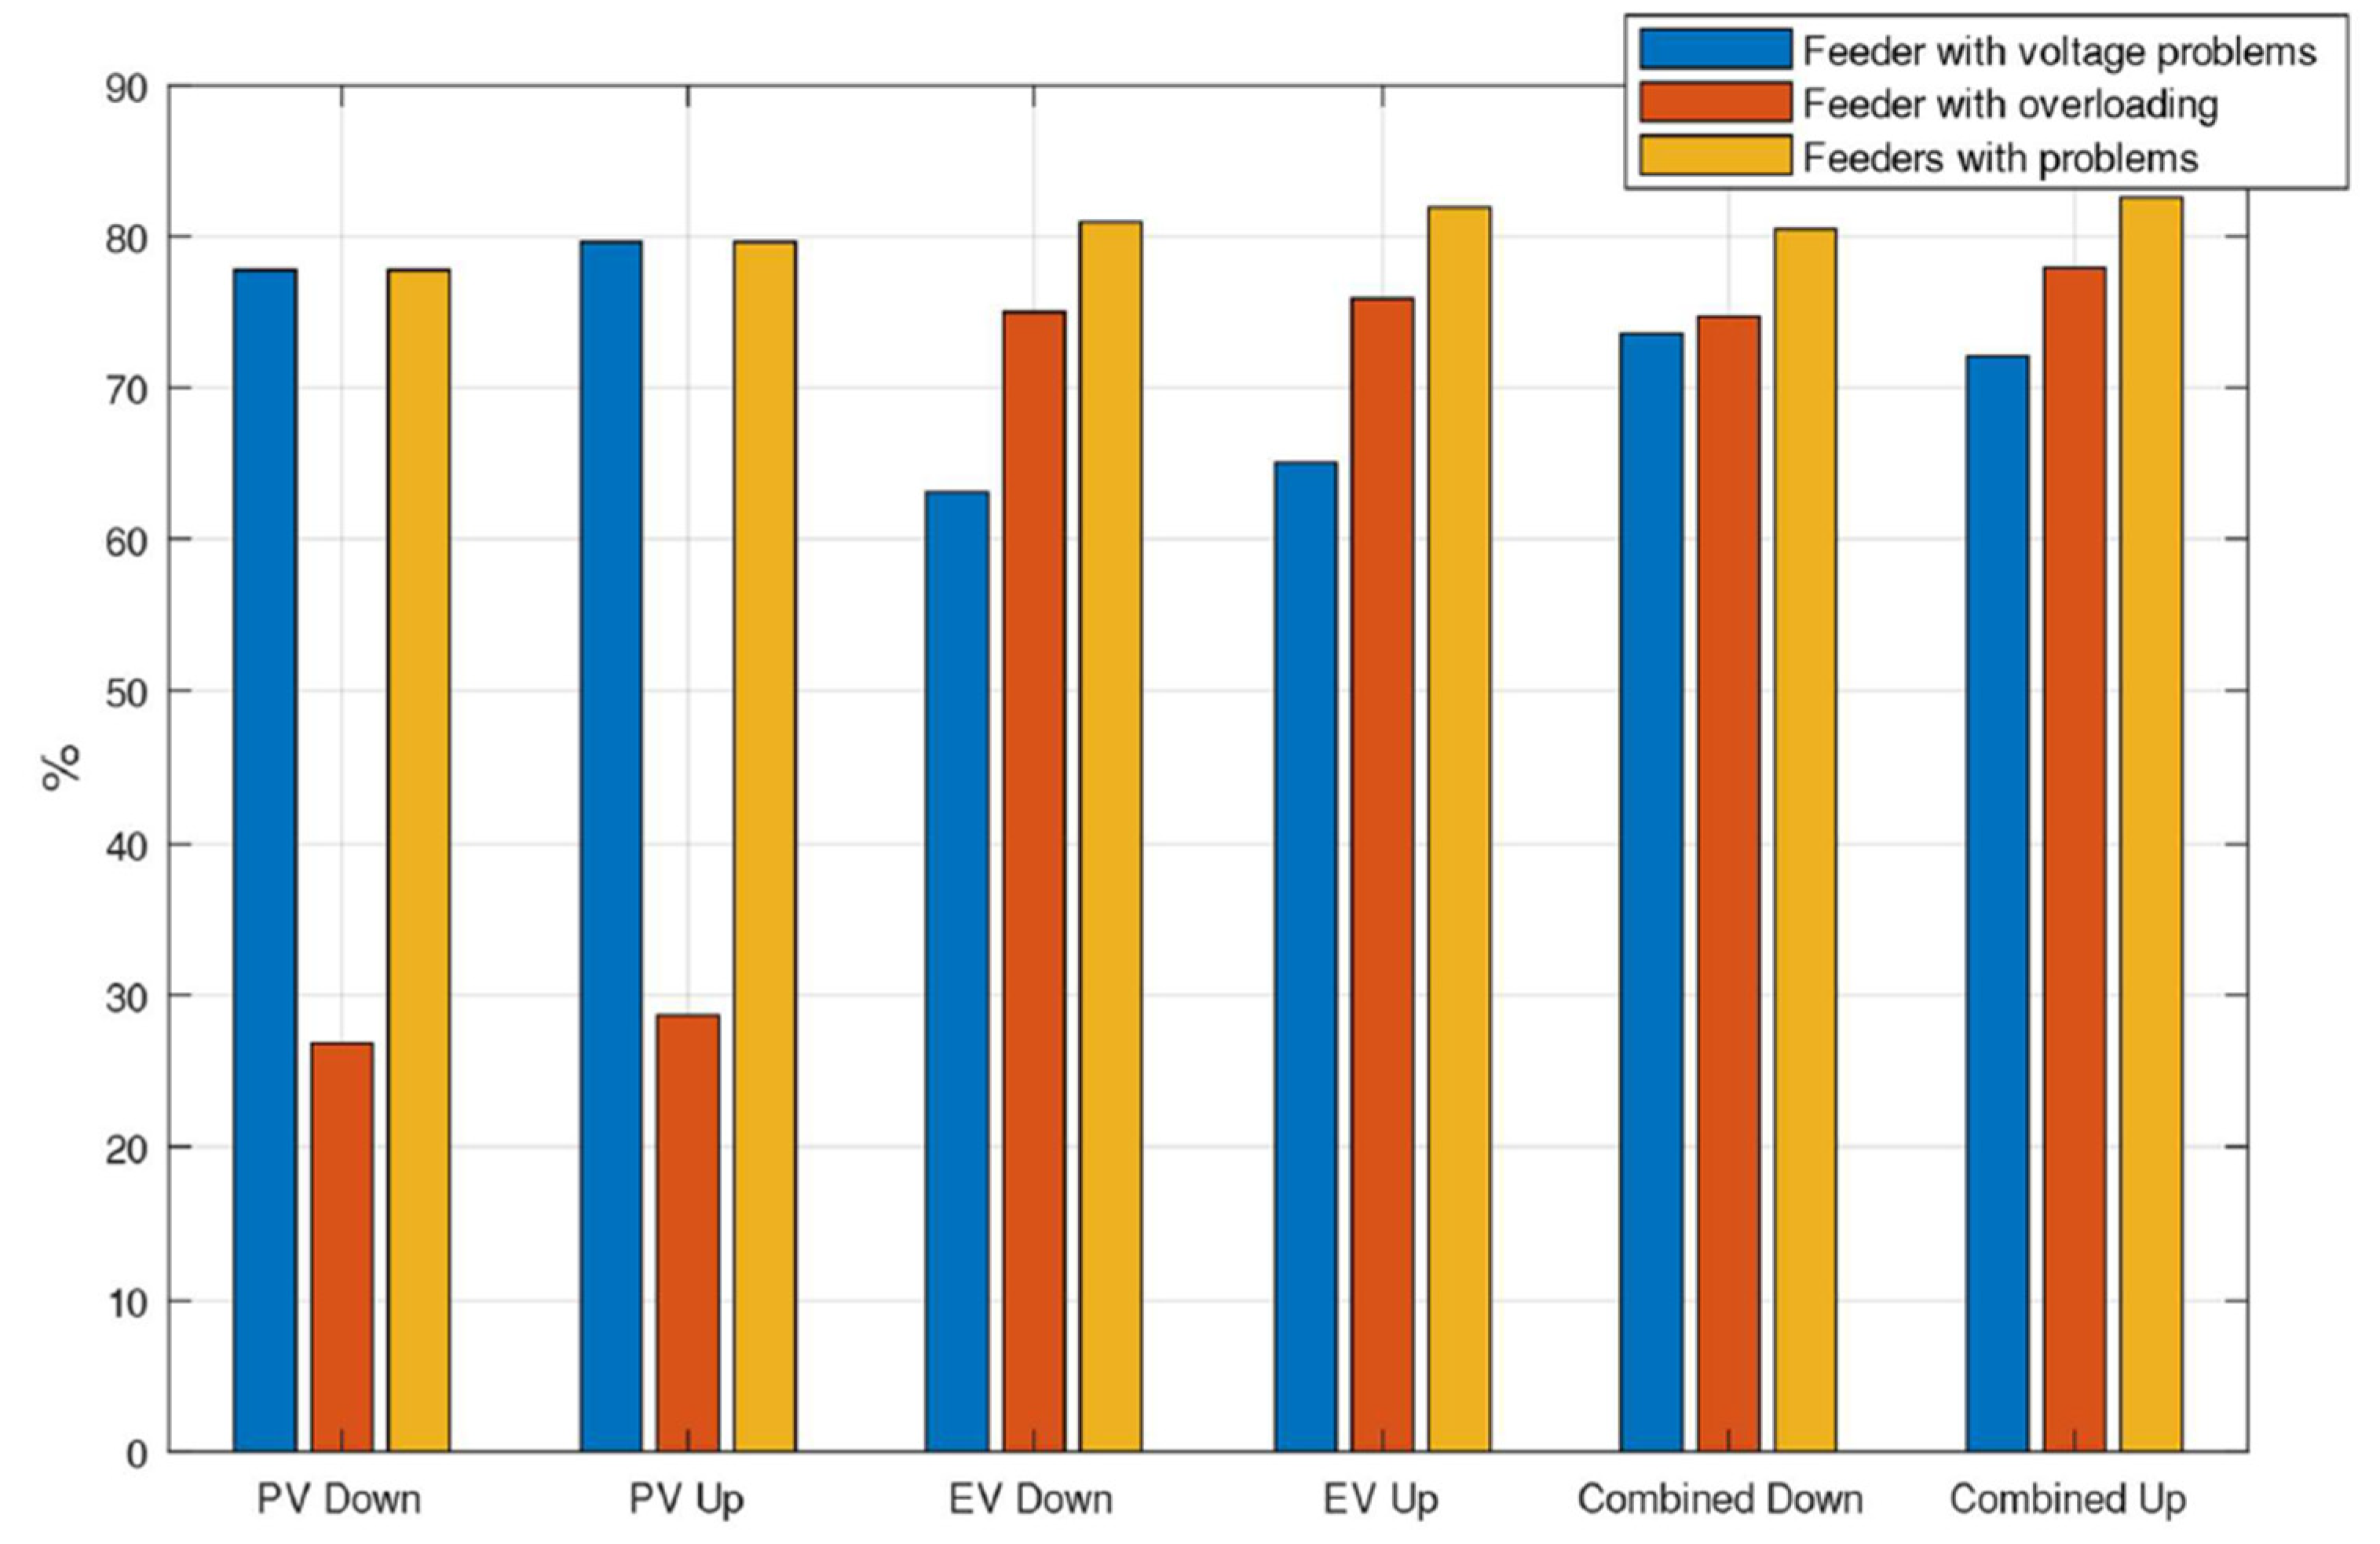
Figure 8 illustrates the proportion of feeders that encounter voltage or overloading issues for a range of penetration levels between 0% and 100%. The results are presented for the most conservative threshold, α = 0. The aforementioned criterion stipulates that in the event that a single simulation exhibits a voltage issue or a utilization factor surpassing 100% for over 1% of consumers across any penetration level ranging from 0% to 100%, the feeder in question is deemed to be problematic.
Figure 8 presents the calculated total percentage of feeders that are experiencing technical difficulties.
The integration of PV and EV exhibits comparable percentages, albeit with a greater proportion of feeders experiencing voltage complications. The integration of PV and EV technologies yielded a noteworthy outcome whereby the percentage of feeders experiencing voltage issues for the PV scenario exhibited a marginal reduction of 4%. The marginal decrease can be attributed to the lack of alignment between the peaks of photovoltaic (PV) generation and electric vehicle (EV) charging, as demonstrated in
Section 3.2. Additionally, it can be noted that there is no statistically significant distinction among allocation scenarios.
Furthermore, as depicted in
Figure 8, the proportion of feeders experiencing technical difficulties is equivalent to that of the primary issues, namely overvoltage for PV scenarios and overloading for EVs and combined integrations at all levels of penetration. This is due to the fact that those feeders encounter additional technical difficulties as the penetration level increases.
Table 2 illustrates the percentage of feeders that experience voltage and overloading issues at two distinct thresholds, namely α = 0 and α = 0.05. The table demonstrates that a higher frequency of issues is encountered when utilizing a more conservative threshold (α = 0). In addition, the integration of PV and EV combined allocations has resulted in a reduction of 4.8% and 7.1% in the number of feeders encountering overloading issues for downstream and upstream allocation scenarios, respectively.
Hence, in the event that the utility company does not tolerate any level of potential technical complications, it becomes imperative to implement proactive measures across multiple feeders to mitigate any plausible technical impediments. The present analysis revealed that feeders exhibiting a consumer count of less than 40 and a length of less than 0.5 km did not exhibit any issues pertaining to the integration of photovoltaic (PV) and electric vehicle (EV) technologies for both allocation scenarios. This provides crucial insight for utility companies, as it underscores the notion that preventative measures should not be concentrated on the aforementioned feeders.
5.3. First Occurrence of LV Network Challenges
The preceding segment presented a comprehensive examination of the technical difficulties encountered by feeders in relation to PV [
21], EV [
24], and combined integration (both downstream and upstream) at varying levels of penetration. This section presents histograms depicting the penetration level at which feeders encounter technical difficulties, in order to facilitate a more comprehensive evaluation. The calculation of the penetration level is determined through the utilization of Equations (1) and (2).
where
Q is the set of penetration levels (0% to 100%) and
pi is the penetration level
i.
Hence, the variables
p1 and
p2 denote the initial level of penetration at which voltage or overloading predicaments arise. The provided visual aid in
Figure 9 depicts the proportion of feeders that experience initial voltage issues, denoted as
p1, in two allocation scenarios across three cases (solely photovoltaic [
21], solely electric vehicle [
24], and a combination of both) while adhering to the highest conservation threshold. It is imperative to acknowledge that there exists a substantial disparity between the two allocation scenarios in all three instances. In the context of combined integration, it has been observed that the incidence of voltage issues among feeders increases by 22% when the penetration level is at 10% for the upstream allocation scenario. This insight holds significant value for utility companies as it facilitates the identification of the limits pertaining to the integration of PV systems and EV charging stations.
Figure 10 depicts the proportion of feeders that experience initial occurrences of overloading issues, denoted as
p2, at a specific level of penetration for all three cases under both allocation scenarios. The presented figure indicates that, in the context of photovoltaic (PV) systems, a majority of the feeders that encounter issues with overloading tend to experience their initial congestion problems at penetration levels that are relatively high, specifically at or above 70% [
21]. Regarding electric vehicle (EV) scenarios, the initial issues with overloading are relatively widespread across various levels of penetration [
24]. The findings from
Figure 9 and
Figure 10 indicate that for a combined PV and EV integration a higher frequency of overloading issues is exhibited, while it does not really subside to the primary limiting factor for PV integration.
6. A Tool for Predicting Impacts through Regression Analysis
Regression analysis is a highly potent technique in the realm of network planning and operation [
21,
24]. A regression analysis may be conducted to investigate the underlying reasons for the occurrence of technical problems in certain feeders before others. To achieve this, various parameters were analyzed from the 95 feeders studied, including total length and customer count. The identification of parameters with the most optimal fit utilizing the standard error of the regression enables the determination of a given feeder’s PV, EV, and combined integration hosting capacity. In this study, the standard error of the regression (
S), which is also referred to as the standard error of the estimate, is considered a more favorable indicator of the goodness-of-fit compared to the coefficient of determination (
R2) [
25].
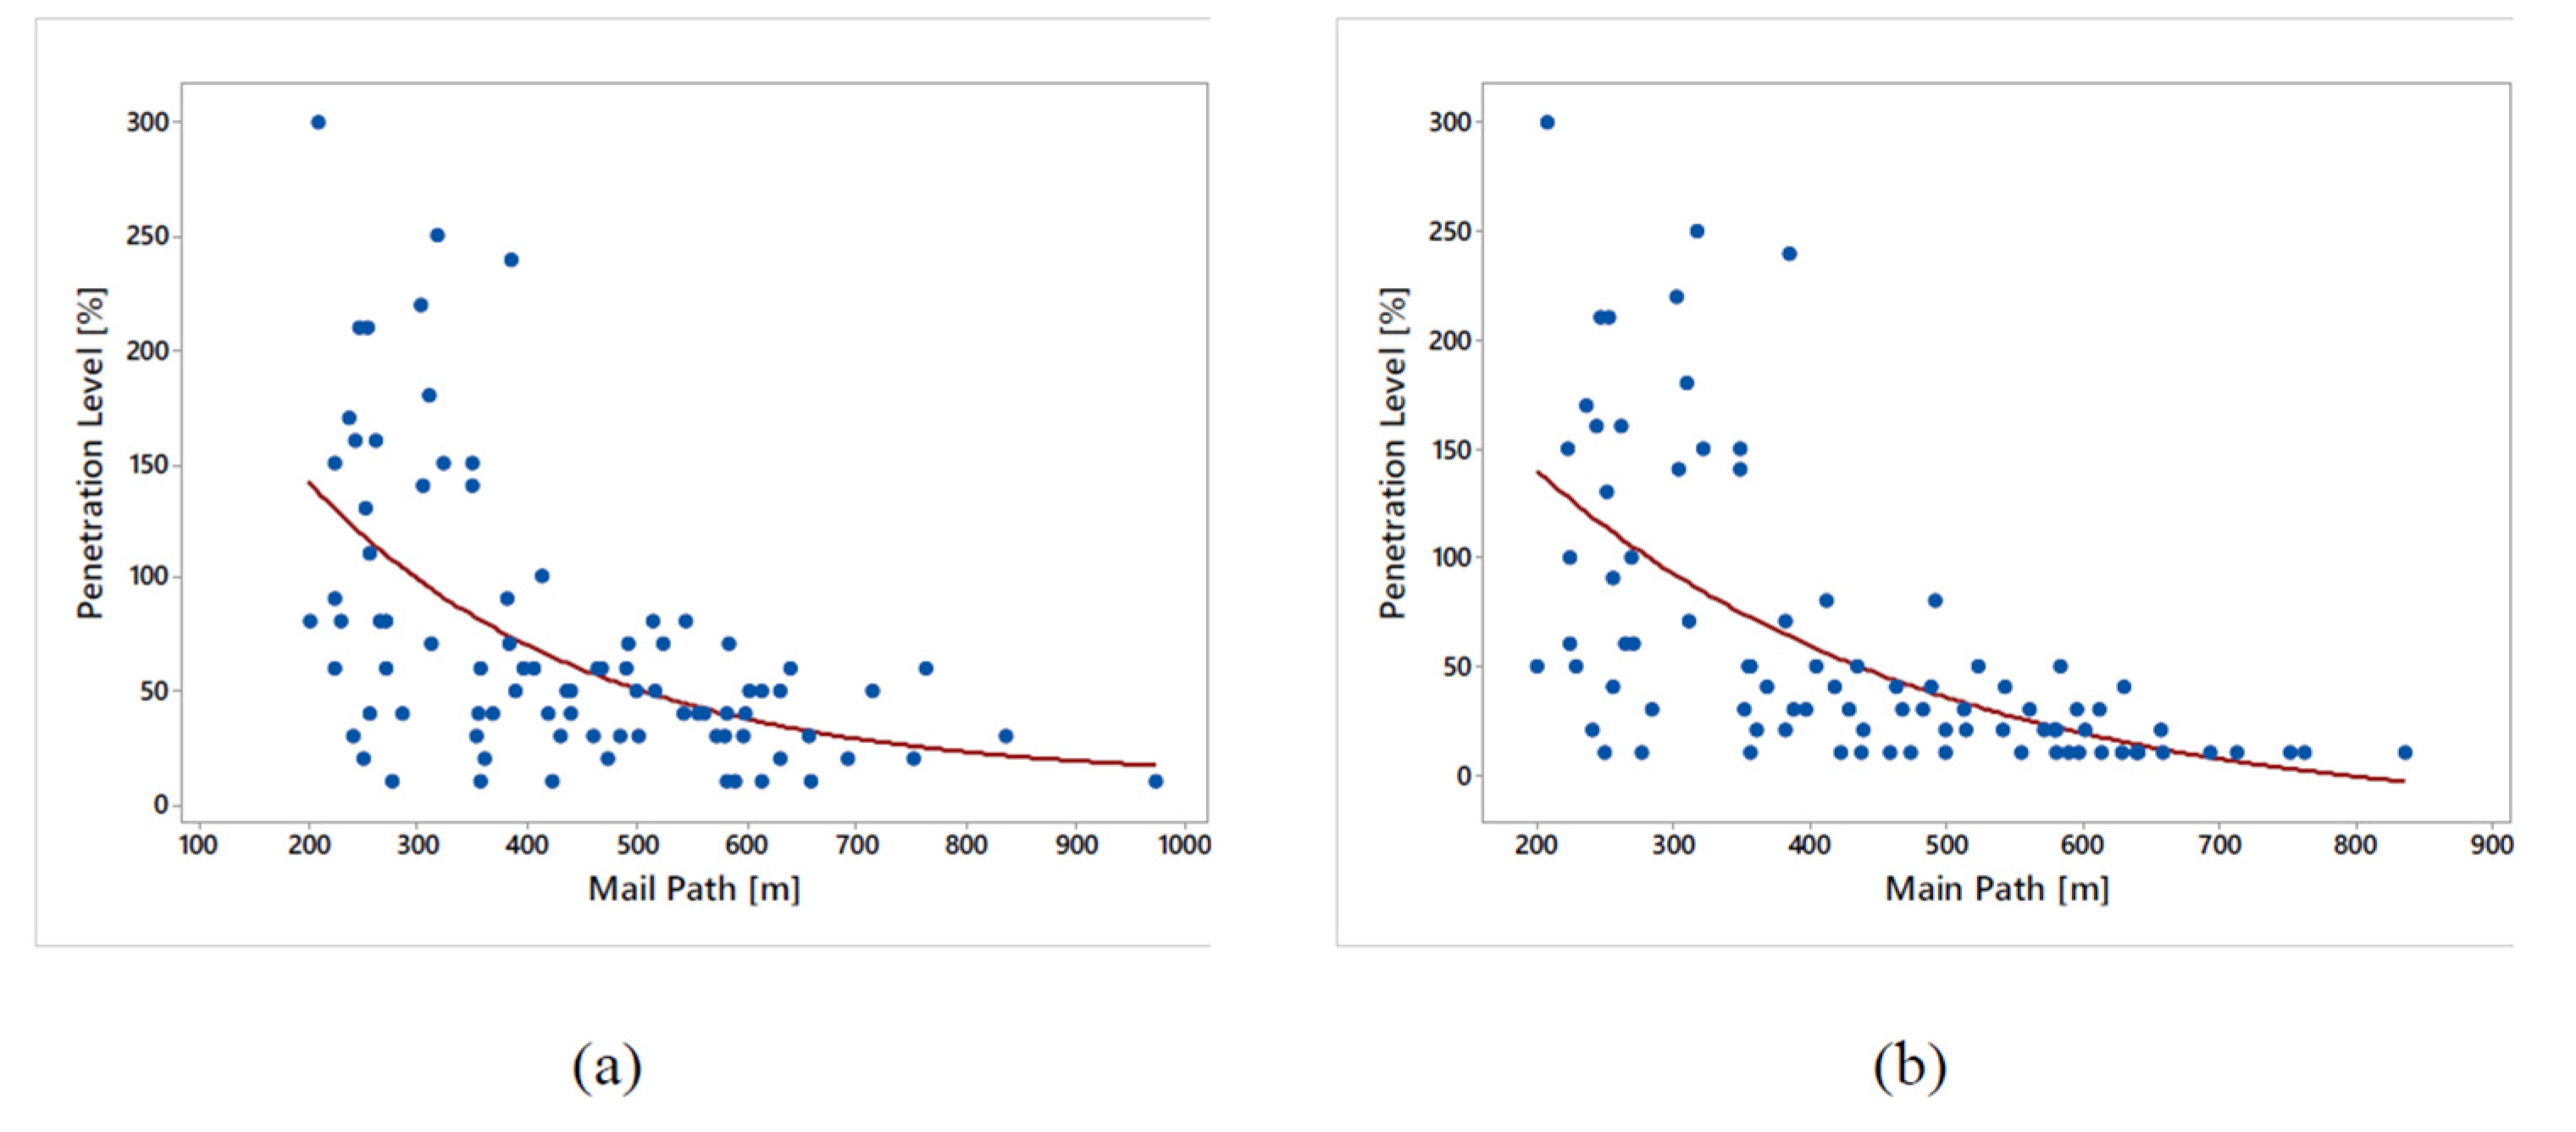
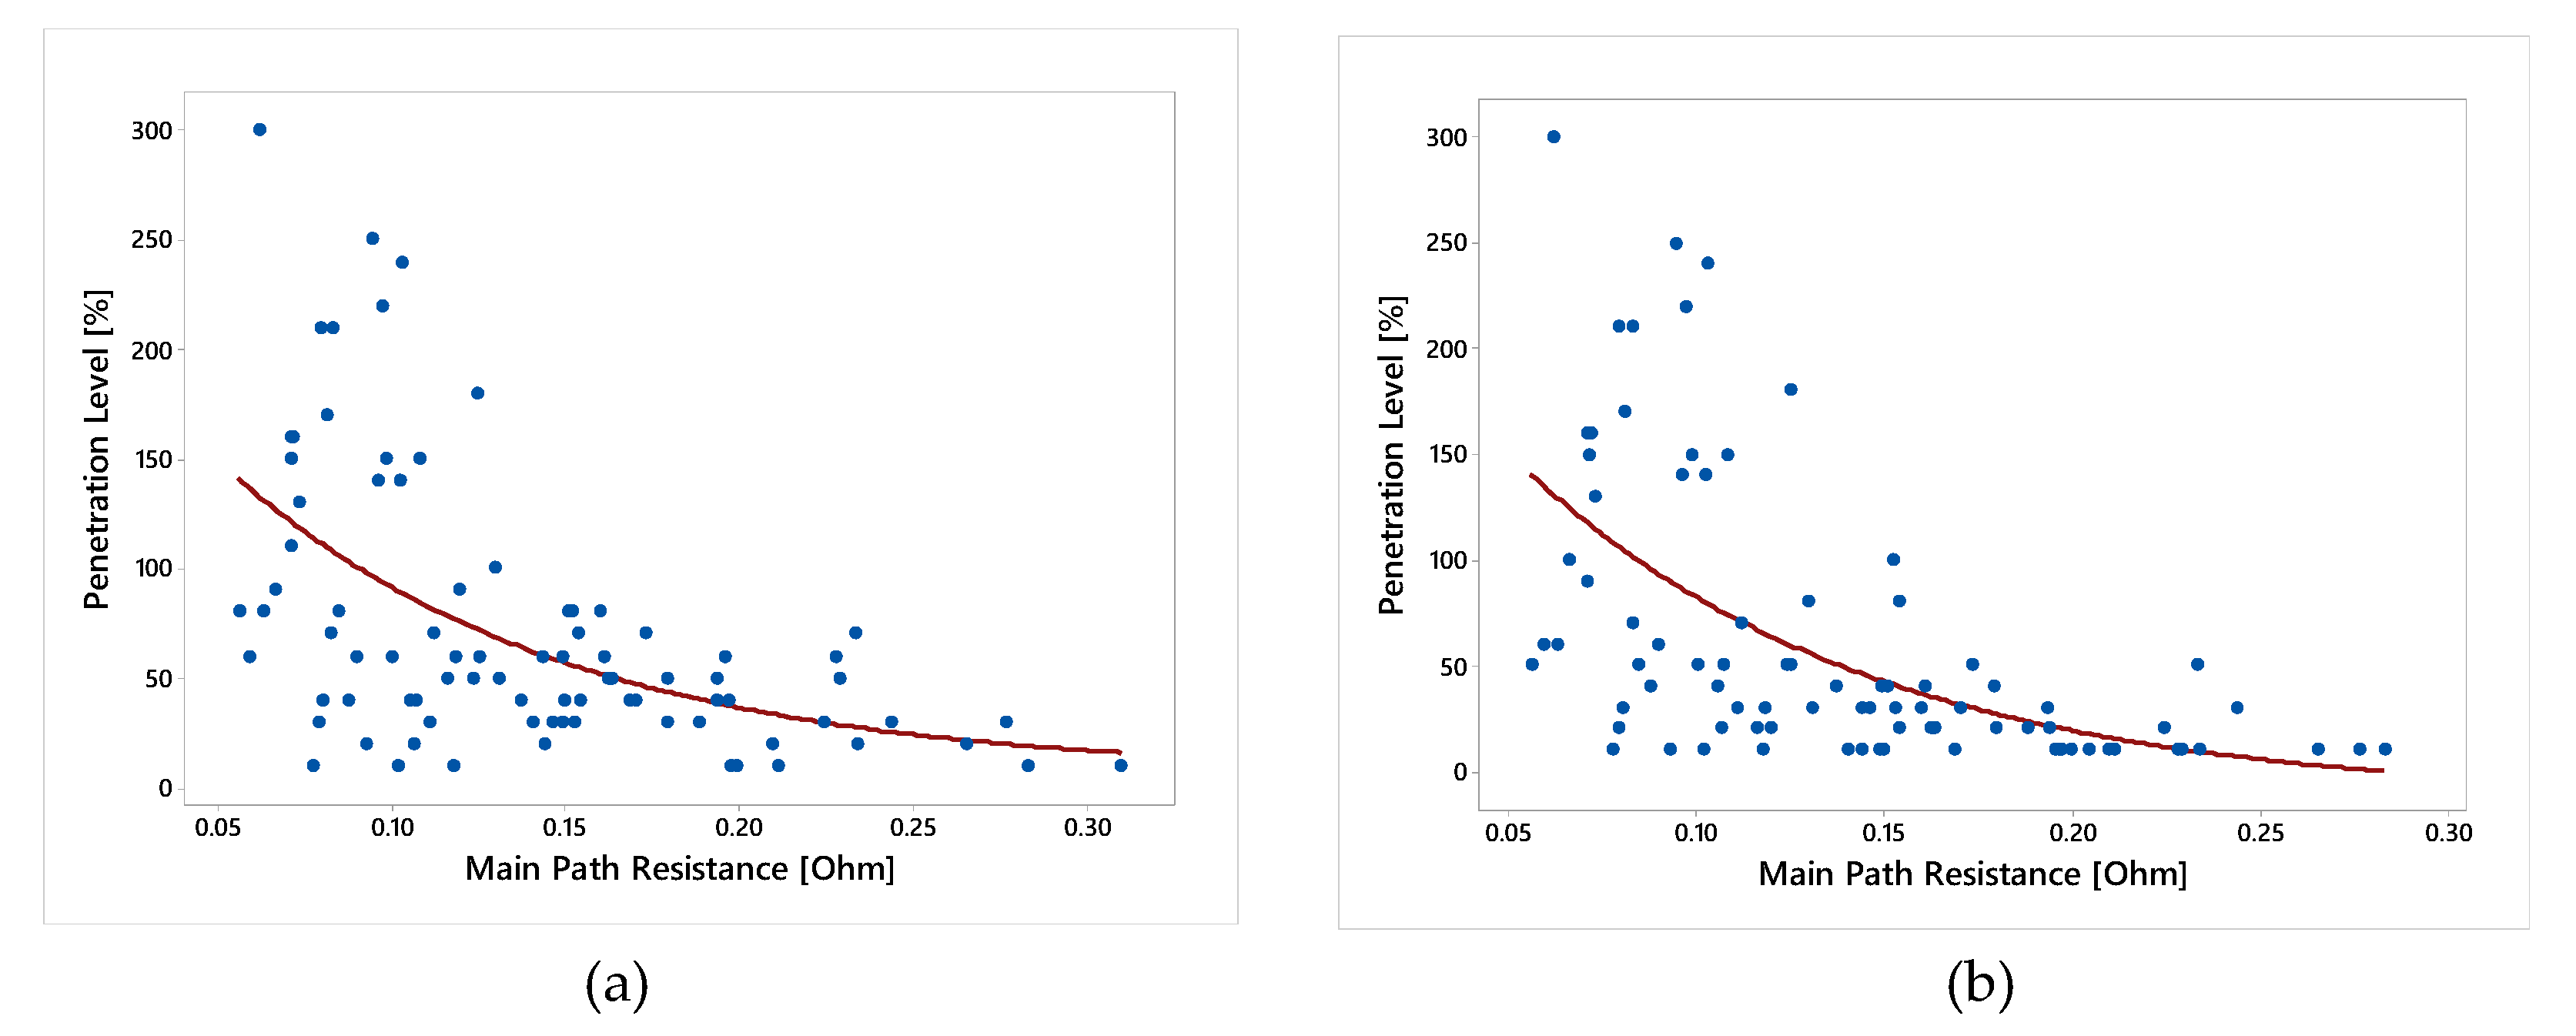
The seven feeder characteristic parameters [
21,
24] were (i) Feeder Length, (ii) Number of Customers, (iii) Total Path Resistance (TPR), (iv) Initial Utilization Factor, (v) Main Path Distance, (vi) Main Path Resistance (MPR), and (vii) Total Resistance. It is important to note that the calculation of intricate impedance is not performed, and exclusively, the assessment of resistance is considered, as it constitutes a more straightforward and economical approach for the utility to implement.
Regression analysis was utilized to evaluate all proposed parameters and technologies for both allocation scenarios while taking into account two potential technical issue thresholds of α = 0 and α = 0.05.
Table 3 displays the corresponding
S for α = 0, which is considered the most conservative threshold, as the results for both thresholds are comparable.
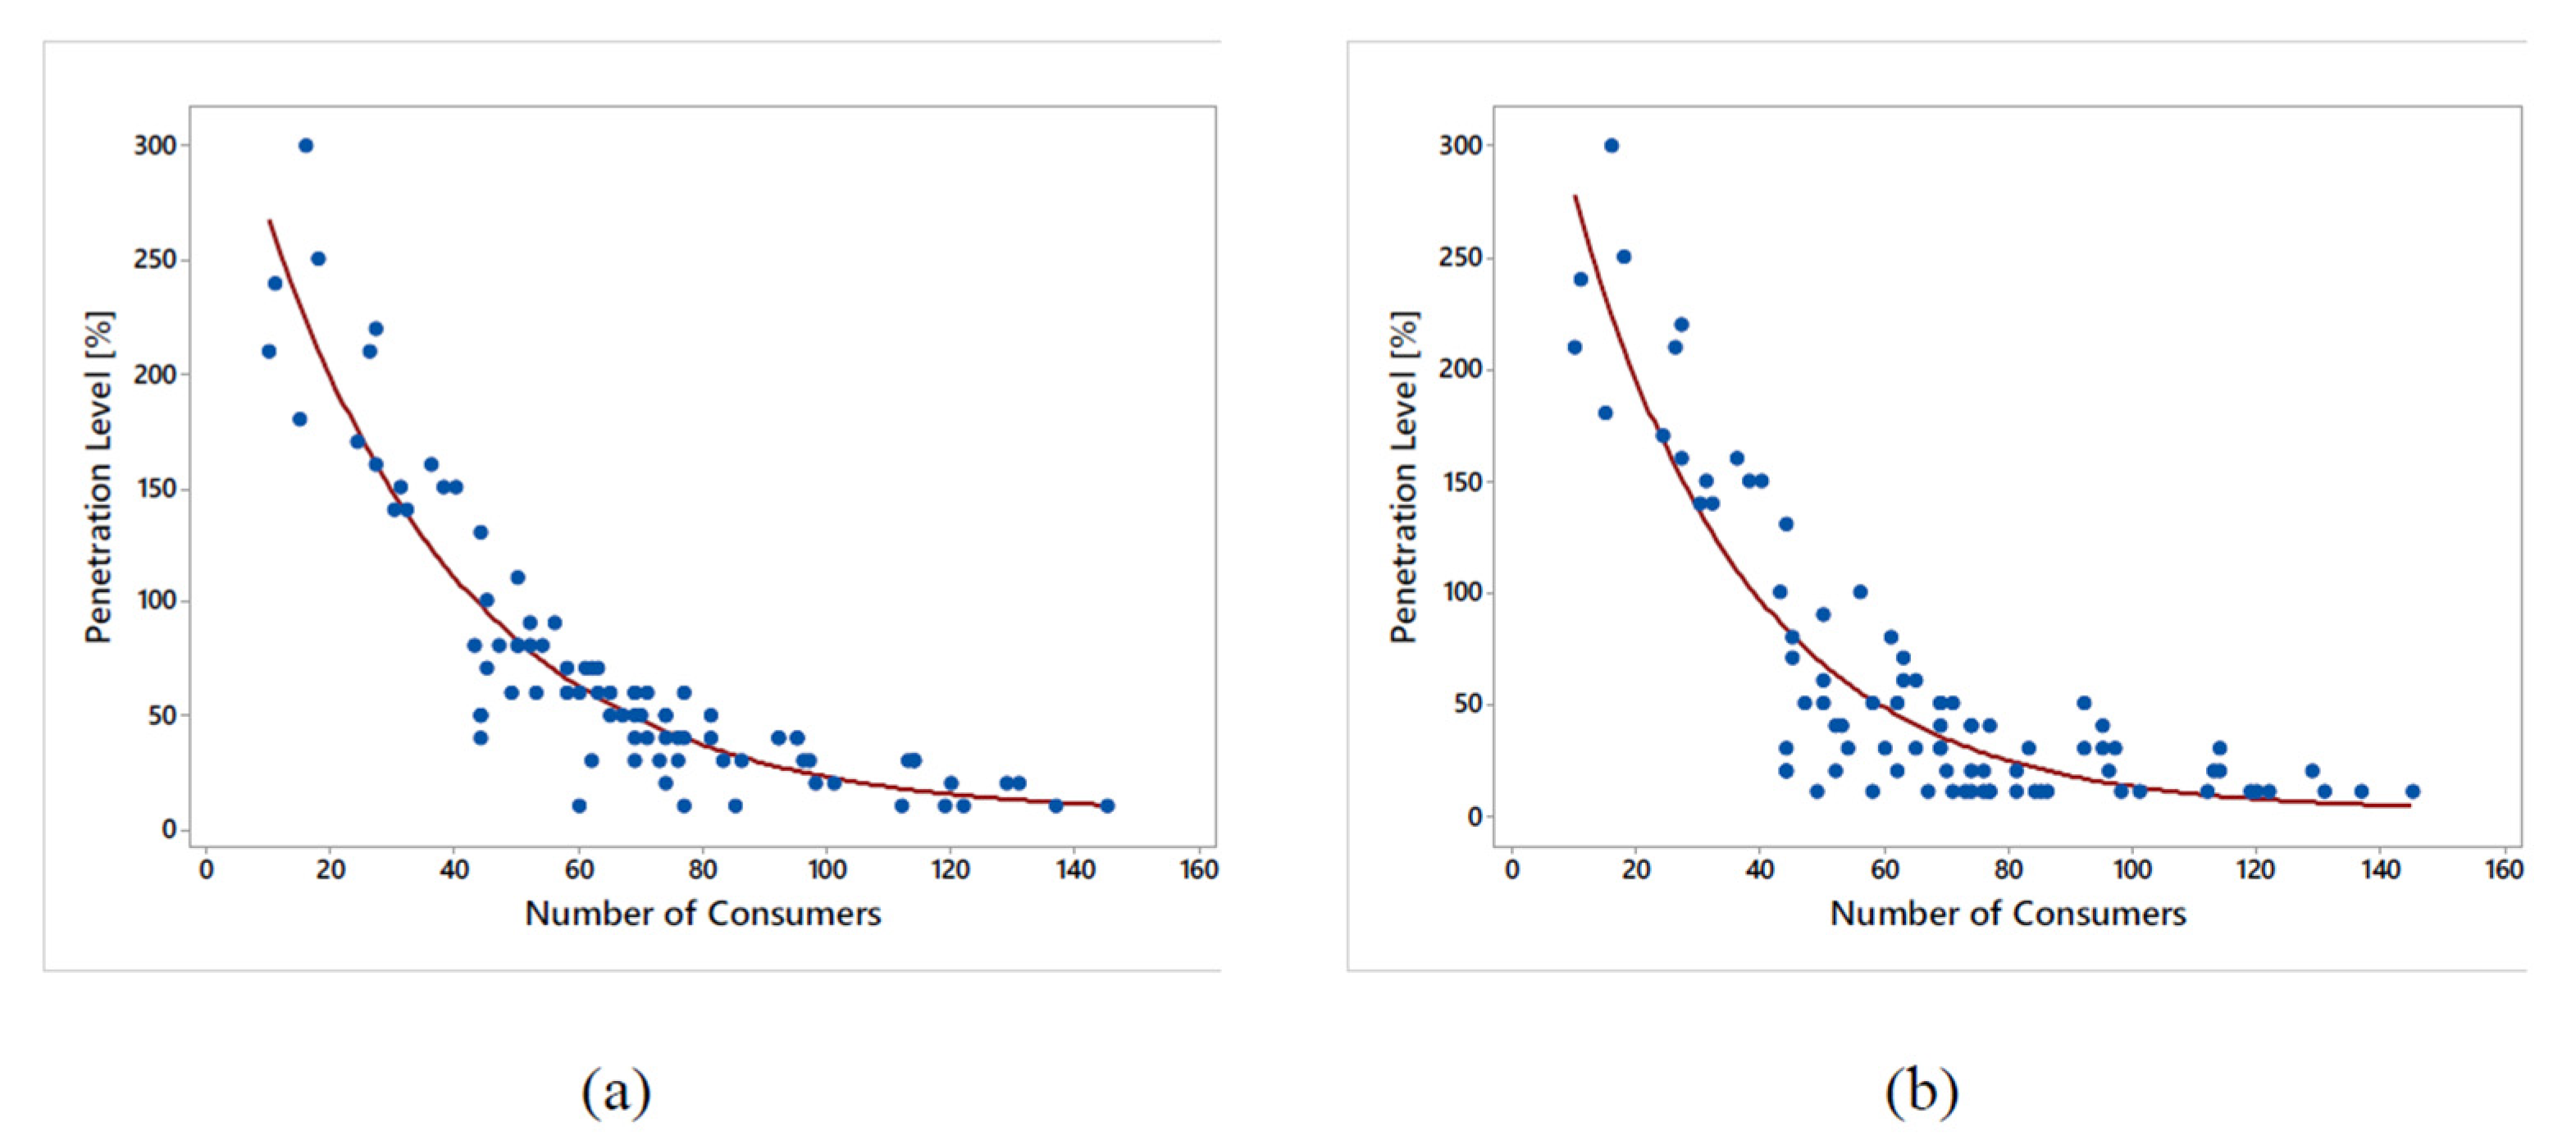
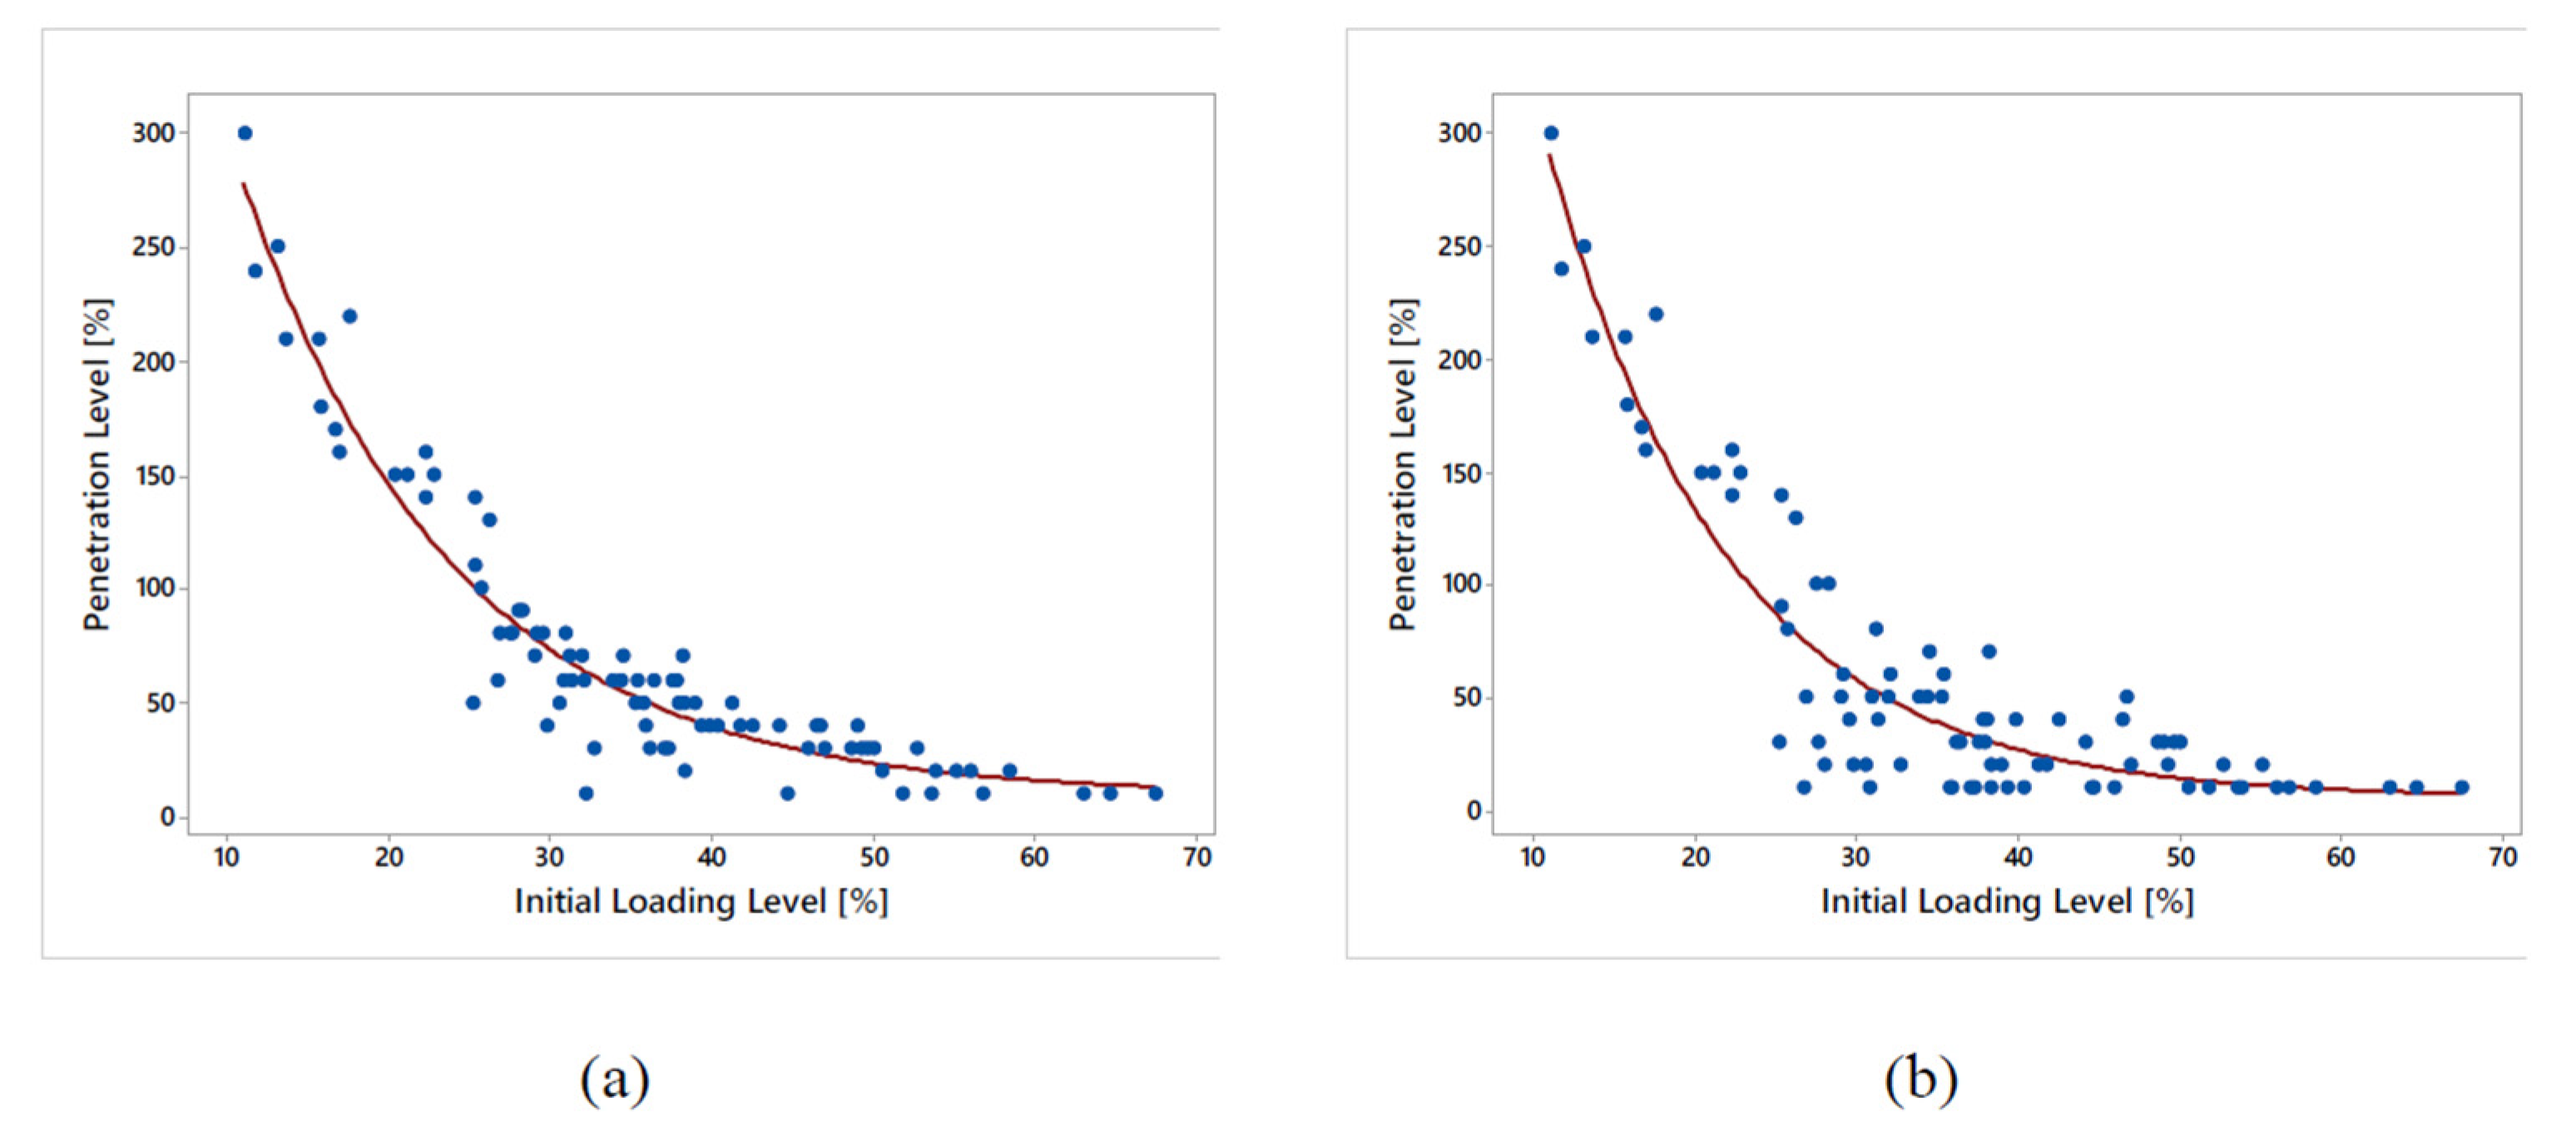
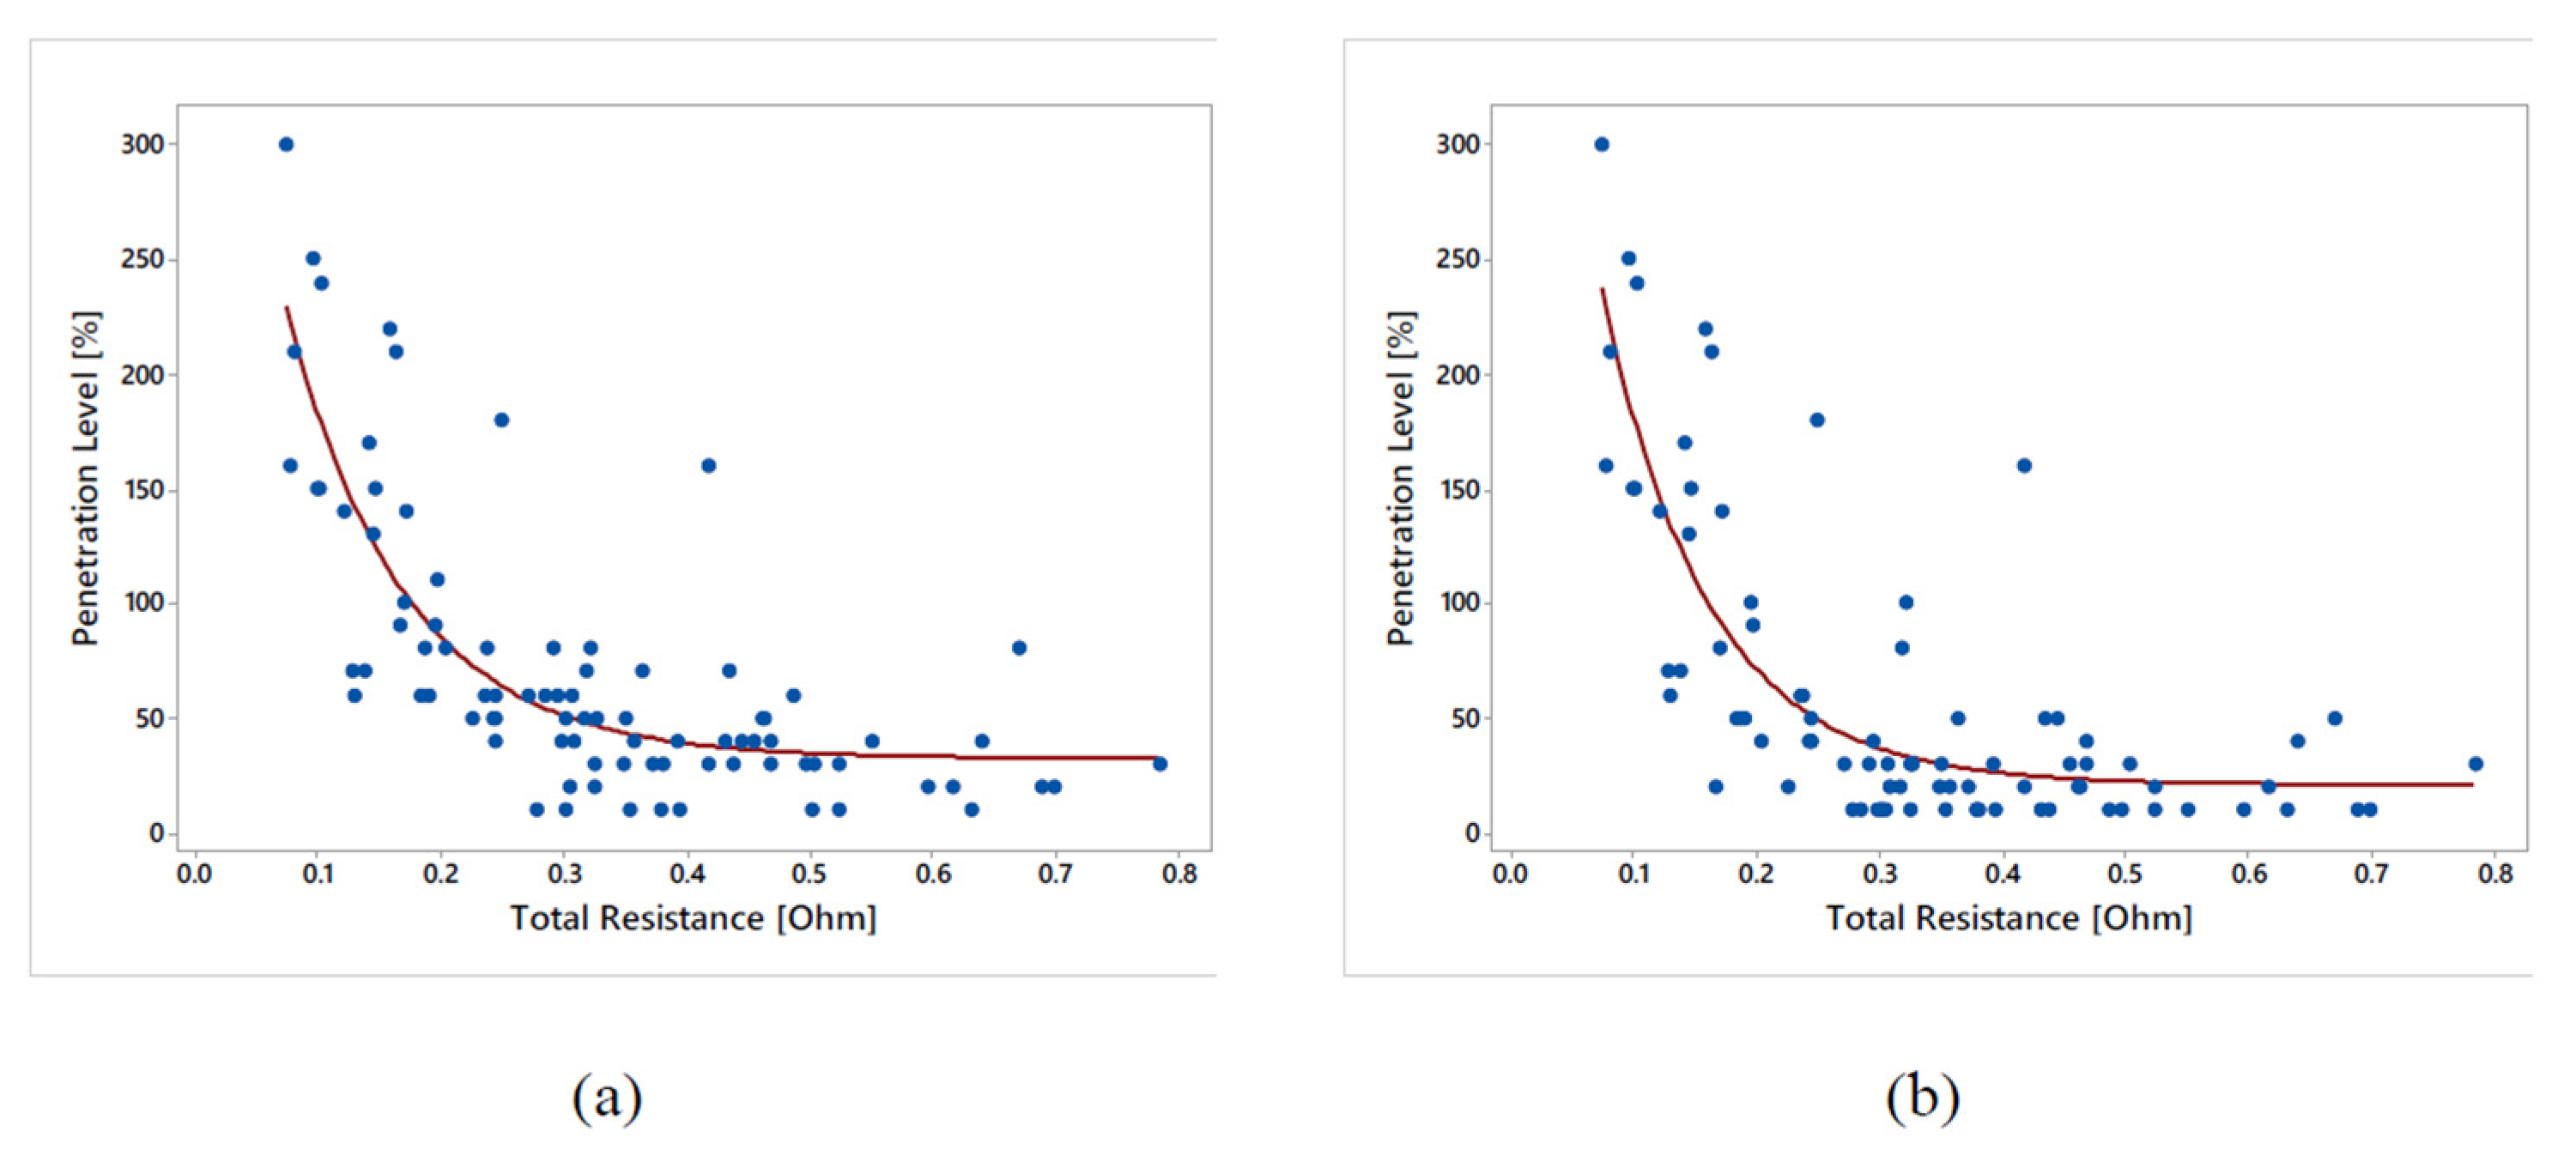
According to
Table 3, the number of customers, total path resistance, and initial loading are the metrics with the best correlations or lowest
S. The former incorporates the feeders’ total resistance; therefore, there is a strong correlation between potential voltage increases and decreases. On the other hand, the latter offers data on how assets are being utilized, i.e., 0% penetration (no units allotted), and as a result, can anticipate the onset of overloading issues.
Appendix C presents the regression analysis plots for the combined PV and EV integration of the seven key feeder characteristics.
7. Conclusions
The emerging technologies of Electric Vehicles (EVs) and Photovoltaics (PVs) are highly promising and anticipated to have a substantial impact on the electricity industry in the forthcoming decade. The incorporation of photovoltaic (PV) units and electric vehicles (EVs) into the electrical grid presents technical obstacles related to voltage stability and asset utilization. The objective of this research was to perform a pioneering investigation on the Maltese archipelago by employing stochastic methods to examine the possible technical obstacles associated with the integration of photovoltaic (PV) and electric vehicle (EV) systems on actual low-voltage (LV) distribution networks. The study was conducted using real-world data and scenarios, while also providing a summary of previous independent studies on these technologies for comparative purposes. This study is noteworthy for being the initial endeavor to assess the technical consequences of the extensive integration of combined photovoltaic and electric vehicle systems on a significant number of electric networks, while taking into account real-life situations and data obtained from smart meters.
The present study introduced a probabilistic impact analysis approach that utilizes Monte Carlo simulations to summarize the technical effects of photovoltaic (PV) and electric vehicle (EV) integration. The study also compared the outcomes of PV and EV integration separately with the combined integration of both on low-voltage (LV) residential networks. Time-series profiles of smart meters were utilized for residential loads and photovoltaic (PV) units, with a resolution of 15 min. On the other hand, electric vehicle (EV) profiles were produced using data from the ‘My Electric Avenue’ initiative. In order to account for the variability associated with the dimensions and actions of loads, photovoltaic units, and electric vehicle charging, a total of one hundred simulations are conducted for each level of penetration. Furthermore, in order to account for the most unfavorable circumstances, two allocation strategies were evaluated, namely downstream and upstream allocation. In the downstream scenario, photovoltaic (PV) and electric vehicle (EV) resources are assigned from the substation to the farthest consumer, while in the upstream scenario, they are assigned from the farthest consumers to the head of the feeder. The quantification of the effects of daily analysis is accomplished through the utilization of two primary metrics, namely, the proportion of consumers experiencing voltage-related problems and the utilization factor at the head of the feeder.
The findings indicated that feeders with greater length and weight capacity pose technical difficulties at an earlier stage compared to those with shorter length and lower weight capacity.
By utilizing the Monte Carlo method, it was feasible to derive a Cumulative Distribution Function (CDF) that illustrates the likelihood of encountering voltage and utilization issues. The findings indicate that the primary constraint for the concurrent integration of photovoltaics (PVs) and electric vehicles (EVs) is the utilization level, commonly referred to as the ‘bottleneck’, while the voltage problem remains unresolved.
A total of 95 LV feeders serving residential areas were examined in order to elucidate the occurrence of technical difficulties. The assessment of the findings was conducted with consideration of their probabilistic nature. Specifically, the likelihood of encountering technical issues, such as voltage rise/fall and/or overloading exceeding a predetermined threshold, was taken into account. This threshold was established by the utility to reflect their tolerance for potential technical difficulties. This study examined two distinct values, namely a zero-tolerance threshold for technical issues (α = 0) and a threshold of greater than 5% of Monte Carlo simulations for a given penetration to encounter a technical problem (α = 0.05).
The conclusions drawn from the results remain consistent despite the variation in magnitudes, which can be attributed to the utilization of two distinct levels of acceptance. The integration of the combined system resulted in technical issues in approximately 80% and 82% of the analyzed feeders. Furthermore, the study revealed that feeders possessing a consumer count of less than 40 and a length of less than 0.5 km did not exhibit any issues concerning the integration of photovoltaic (PV) and electric vehicle (EV) technologies for both allocation scenarios.
The aforementioned results may serve as a basis for utilities to concentrate their endeavors on feeders with greater length and a higher number of consumers. The aforementioned findings indicate that the implementation of solutions aimed at addressing the challenges associated with the integration of a specific technology may not necessarily alleviate the impacts arising from the integration of another technology. Whilst it is acknowledged that the integration of photovoltaic (PV) and electric vehicle (EV) systems has the potential to overcome technical obstacles associated with each technology, research has demonstrated that the decrease in such challenges is insignificant. The reason for this is that the peaks of photovoltaic (PV) generation and electric vehicle (EV) charging are not synchronized.


