Article

Optimizing Formic Acid-Assisted Co-HTL of Digested Sewage Sludge and Lignocellulosic Waste for Enhanced Bio-Crude Yield and Energy Recovery

by
Kristoffer Mega Herdlevær
* and
Tanja Barth
Department of Chemistry, University of Bergen, Allégaten 41, N-5007 Bergen, Norway
*
Author to whom correspondence should be addressed.
Energies 2024, 17(1), 258; https://doi.org/10.3390/en17010258
Submission received: 6 December 2023 / Revised: 28 December 2023 / Accepted: 31 December 2023 / Published: 4 January 2024
(This article belongs to the Section A4: Bio-Energy)

Abstract

:
In recent years, hydrothermal liquefaction (HTL) has gained attention as a means of enhancing and increasing the production of biofuels from biomass. Co-HTL involves the simultaneous processing of two or more feedstocks, with the potential for interactions that can affect the overall yield and quality of the resulting biofuels. This study investigates the bio-crude yield, chemical composition, and energy content of bio-crudes obtained through formic acid-assisted hydrothermal liquefaction of combined digested sewage sludge (DSS) and lignocellulose (LC). The bio-crude yields are in the range of 26.8–58.9 wt%, with a higher heating value (HHV) of approximately 32 MJ/kg. The best experiment shows that mixtures with more DSS and high levels of process condition variables (350 °C, formic acid present, and 50 wt% EtOH) give high bio-crude yields with a maximum value of 58.9 wt%. For comparison, pure DSS and LC run at these process conditions resulted in a bio-crude yield of 52.5 wt% and 48.3 wt%, respectively. Partial least squares (PLS) regression reveals a synergistic effect from mixing the feedstocks, as the quadratic term of the regression equation for mixture ratio shows a negative coefficient. GC–MS data show that combining feedstocks results in the formation of new compounds, mostly phenols, that are not present in the bio-crudes from the separate feedstocks. Thus, combining feedstocks will not only increase the resource availability for hydrothermal liquefaction and streamline the process but will also increase the overall production of bio-crude with its synergistic effect.

1. Introduction

The world is facing significant challenges in meeting its energy needs while minimizing its environmental impact. The finite nature of fossil fuels and the increasing concerns about greenhouse gas emissions have led to the exploration of alternative energy sources [1]. Energy from biomass is one such alternative that has gained widespread attention due to its potential to reduce dependence on fossil fuels while reducing greenhouse gas emissions. Biomass can be used for various purposes, including heat, power, and transportation fuels, with biofuels being a key area of interest.
Hydrothermal liquefaction (HTL) has emerged as a promising technology for the conversion of biomass into biofuels [2]. HTL uses high temperatures and pressure to convert wet biomass into a liquid bio-crude that can be refined into transportation fuels. The process has several advantages over other biofuel production technologies, including the ability to process a wide range of feedstocks because of its acceptability of water, high energy efficiency as no prior drying of feedstock is required, and the potential to produce high-quality biofuels. In this study, EtOH and FA are used as part of the reaction medium.
The inclusion of ethanol (EtOH) in the HTL process is a significant factor deserving of consideration. It appears that EtOH exerts a promoting effect on bio-crude yield, as shown in previous studies [3,4]. This might be due to EtOH’s ability to de-polymerize the lignin structures and esterify the acids from the de-amination of amino acids [5]. However, derivatives from EtOH, such as ethyl esters, might also become part of the bio-crude phase, resulting in better yields with higher concentrations. In the reaction medium comprising water, EtOH, and FA, there is a potential to produce ethyl formate, a compound that might be incorporated into the bio-crude. To elucidate this phenomenon and accurately assess the contribution of EtOH to the bio-crude, further investigations are warranted as part of future work, including GC–MS analysis to assess compounds that might be derived from EtOH and FA and how much they contribute to the overall bio-crude yield.
In 2008, a significant advancement in the hydrothermal liquefaction process was introduced by incorporating formic acid (FA) as an in-situ hydrogen donor. This innovative approach, known as the lignin-to-liquid process, initially focused on lignin-rich feedstocks, resulting in impressive bio-crude yields ranging from 60–80%, as shown in the study conducted by Kleinert et al. [6]. Since its inception, formic acid-assisted HTL has undergone continuous refinement, with adaptations including the utilization of water as the reaction medium and different feedstocks such as Spirulina [7]. Notably, Hegdahl et al. demonstrated the adaptability of this method to digested sewage sludge despite its original design for lignin-rich feedstocks [8]. This evolution highlights the versatility and potential of the lignin-to-liquid process in accommodating a broader range of feedstock sources and underscores its significance in the context of bio-crude production.
In recent years, co-HTL has gained attention as a means of enhancing and increasing the production of biofuels from biomass, especially in terms of enlarging the feedstock base for continuous production of biofuels [9]. Co-HTL involves the simultaneous processing of two or more feedstocks, resulting in a potential interaction that can affect the overall yield and quality of the resulting biofuels. In this study, digested sewage sludge and lignocellulosic waste from spruce are investigated regarding an interaction effect on yield and bio-crude quality.
Digested sewage sludge and lignocellulosic waste are both valuable feedstocks for the production of renewable fuels and chemicals. Digested sewage sludge is a byproduct of wastewater treatment processing, which produces biogas by anaerobic digestion. The solid residue still contains high levels of organic carbon, including recalcitrant components and microbial biomass [10]. It is to some degree used as fertilizer but is also disposed of in landfills or incinerated, which can lead to negative environmental impacts. However, the use of digested sewage sludge as a feedstock for HTL can convert this waste into a valuable resource. Similarly, lignocellulosic waste, such as sawdust and wood chips, is a byproduct of the forestry and wood industries [11]. These wastes are often burned for energy or disposed of in landfills. However, they can also be converted into biofuels and high-value chemicals through HTL. The use of these waste streams as feedstocks for HTL has the potential to not only reduce waste and emissions but also provide a sustainable source of biofuels and chemicals. By combining these two feedstocks in the HTL process, there could be a potential to achieve a synergistic effect, leading to higher yields and better-quality biofuels.
The inherent heterogeneity observed in the feedstocks [8], particularly in the DSS, presents a notable source of uncertainty. The variability in DSS composition can be attributed to several factors, including geographical location, seasonal variations, and the specific sources of wastewater. These dynamic environmental conditions can lead to significant fluctuations in the chemical and physical properties of the DSS feedstock, introducing variability between different batches. Even within the same batch, DSS exhibits heterogeneity due to the complex nature of sewage sludge. Replicate experiments conducted on such heterogeneous feedstock are susceptible to inherent variations, which may impact the reproducibility of results. Consequently, it is imperative to acknowledge and address the uncertainties stemming from feedstock heterogeneity in the context of experimental design and data interpretation, as they can influence the robustness and reliability of the findings.
In this paper, we present the results of co-HTL of digested sewage sludge and lignocellulosic waste (spruce) and demonstrate the potential for this approach to increase and enhance the production of biofuels from biomass. This study investigates the effects of different operating conditions on the co-HTL process and evaluates the properties of the resulting bio-crudes.
To investigate the effects of operational conditions, several multivariate methods are employed, including factorial design, principal component analysis (PCA), and partial least squares regression (PLS). Additional experiments are being carried out to further elucidate the effect of the feedstock ratio. These methods enable a thorough exploration of the complex interactions between various parameters, such as temperature, hydrogen donors, and reaction medium, and their impact on the final product.

2. Materials and Methods

2.1. Digested Sewage Sludge

The digested sewage sludge (DSS) utilized in this study was obtained from the Bergen Biogas Facility in Bergen, Norway, following the completion of anaerobic digestion of sewage sludge. The Bergen Biogas Facility is owned by the municipality and sources its input for biogas production from wastewater treatment plants in the vicinity of Bergen [12]. DSS typically comprises a complex mixture of organic and inorganic components, including residual organic matter, microorganisms, nutrients, and various contaminants. It commonly contains organic materials in the form of cellulosic and lignocellulosic materials, proteins, lipids, and other organic compounds originating from human waste, food residues, and household products. Additionally, DSS might contain inorganic constituents such as metals, salts, and minerals originating from wastewater. Before its acquisition, the DSS feedstock underwent a dewatering process at the Bergen Biogas Facility. Their analysis showed that this particular batch of DSS contains 74.6% water. A total of 61.0% of the dry matter is organic.

2.2. Lignocellulose

Lignocellulosic biomass (LC) is predominantly composed of cellulose, hemicellulose, and lignin, which form the structural basis of plant cell walls. Cellulose provides strength, hemicellulose offers flexibility, and lignin imparts rigidity [13]. LC also contains minor components like extractives (oils and resins) and ash. The lignocellulosic component of the total feedstock in this study consisted of samples of cut spruce collected from a logging field located on Osterøy, an island situated on the coast of Western Norway. The collected spruce samples were milled to produce coarsely ground sawdust particles measuring approximately 0.5 cm3 in size. Subsequently, the sawdust was oven-dried at a temperature of 105 °C until the weight change did not exceed 1%, with measurements taken at 24-h intervals.

2.3. Hydrothermal Liquefaction

The HTL process was carried out as shown in Figure 1 using the following procedure: 1 g of organic sample (calculated by the organic content of DSS provided by Bergen Vann), 1 mL of FA, and enough distilled water/EtOH to fill to constant loading (6.7 mL) were combined in a non-stirred 25 mL Parr reactor from the 4740 series, manufactured by Parr Instrument Company in Moline, IL, USA. The reactor was tightly sealed and placed inside a preheated Carbolite Laboratory high-temperature oven, where it was heated within a temperature range of 320–360 °C for a duration of 3 h. Subsequently, the reactor was allowed to cool to room temperature.
To separate the gaseous phase, the reactor was vented while the solid phase was filtered using a glass fiber filter (Whatman, GF/A, Whatman plc, Maidstone, Kent, UK). Filtration was performed using a solvent mixture composed of ethyl acetate (EtOAc) and tetrahydrofuran (THF) in a ratio of 9:1 (v/v). The organic phase was separated from the aqueous phase by decanting and then subjected to further drying with sodium sulfate. The solvent was subsequently evaporated using a rotary evaporator at 40 °C and 212 mbar. The weight of the reactor was measured before and after venting to determine the yield of the gaseous phase, while the weight of the filtration equipment was measured before and after filtration and drying to determine the solid yield. Finally, the bio-crude yield was determined by weighing the mass after the evaporation of the solvent.
It is important to note that water recovery was not measured due to the substantial water loss during the evaporation of EtOAc, which made accurate measurements impractical in this particular step of the process.

2.4. GC–MS

For the GC–MS analysis of all bio-crude samples, an Agilent Technologies 7890A GC equipped with an auto-sampler and an Agilent 5977A MSD detector were employed. Injection of the samples was carried out in splitless mode, utilizing an injection temperature of 280 °C. A 30 m HP-5 ms column from Agilent Technologies (Santa Clara, CA, USA), featuring an inner diameter of 250 μm and a thickness of 0.25 μm, was utilized. The temperature program for the column included an initial temperature of 50 °C for 2 min, followed by a ramping rate of 10 °C per minute up to 200 °C, and then a further increase at a rate of 20 °C per minute up to 300 °C, which was maintained for 5 min.
The mass spectrometer detector was equipped with an ion-source temperature of 230 °C and covered a mass range from 25 to 400 μ. Positive ionization was employed at 70 eV. Compound identification was conducted using Agilent MassHunter Qualitative Analysis version 10.0 coupled with the NIST 2.0 library. A solvent delay of 5.50 was implemented to ensure accurate detection and analysis of the bio-crude samples.
A silylation process was employed to enhance the separation of the compounds during GC analysis. Firstly, 0.005 g of the bio-crude sample was added to a vial and dissolved in a mixture of ethyl acetate/tetrahydrofuran (EtOAc/THF) (1.5 mL, 9/1, v/v). A total of 0.01 mg/mL of hexadecane was included as an internal standard. A total of 1 mL was extracted from the mixture before adding 0.150 mL of pyridine and 0.150 mL of N,O-bis(trimethylsilyl)trifluoroacetamide. The vials were securely capped and heated at 70 °C for 30 min, followed by cooling to room temperature.
Subsequently, 0.700 mL of the silylated bio-crude was transferred to a new vial and mixed with 0.700 mL of pentane, resulting in a solution containing approximately 1.3 mg/mL of the silylated oil and 4.2 μg/mL of the internal standard. The samples were then cooled at 5 °C overnight and subsequently filtered through a 0.45 μm Puradisc NYL filter before being subjected to GC–MS analysis. This silylation procedure and subsequent filtration step helped to improve the separation and preparation of the bio-crude samples for analysis.

2.5. Elemental Analysis and Heating Value Calculations

Two replicates were analyzed using a Vario EL III instrument in CHNS mode to conduct elemental analysis on the bio-crude samples. Helium was utilized as the carrier gas during the analysis. The oxygen content was estimated as the difference in elemental composition. The obtained data from the elemental analysis were utilized to characterize the bio-crudes based on the hydrogen-to-carbon (H/C) and oxygen-to-carbon (O/C) ratios. Additionally, these ratios were employed to calculate an estimated higher heating value (HHV), providing valuable knowledge of the energy content of the bio-crudes. This calculation is proposed by Channiwala et al. [14]. The energy recovery was calculated by (HHVbio-crude × massbio-crude)/(HHVFeedstock × massFeedstock). Formic acid and ethanol are not included in the heating value calculations, so a full energy balance for the reaction system is not attained.

2.6. Experimental Design

The experimental setup followed a 24−1 fractional factorial design, encompassing four main factors: the mixture ratio of DSS and LC, temperature, EtOH concentration, and the presence of FA. Two center-point experiments were conducted, one including FA and the other without it. The variable ranges for these factors were established based on prior screening studies involving lignocellulosic feedstocks (Alper et al., 2019 [15] and Xu et al., 2012 [16]), ensuring comprehensive coverage of oil conversion across a wide spectrum. To ensure the reliability of the results, replicated experiments were conducted to assess their reproducibility. Complete details regarding the experimental conditions can be found in Table 1.
Based on the results from the fractional factorial design, a new set of experiments was conducted to delve deeper into the analysis of one specific variable while keeping the remaining variables at the levels that resulted in the highest response (
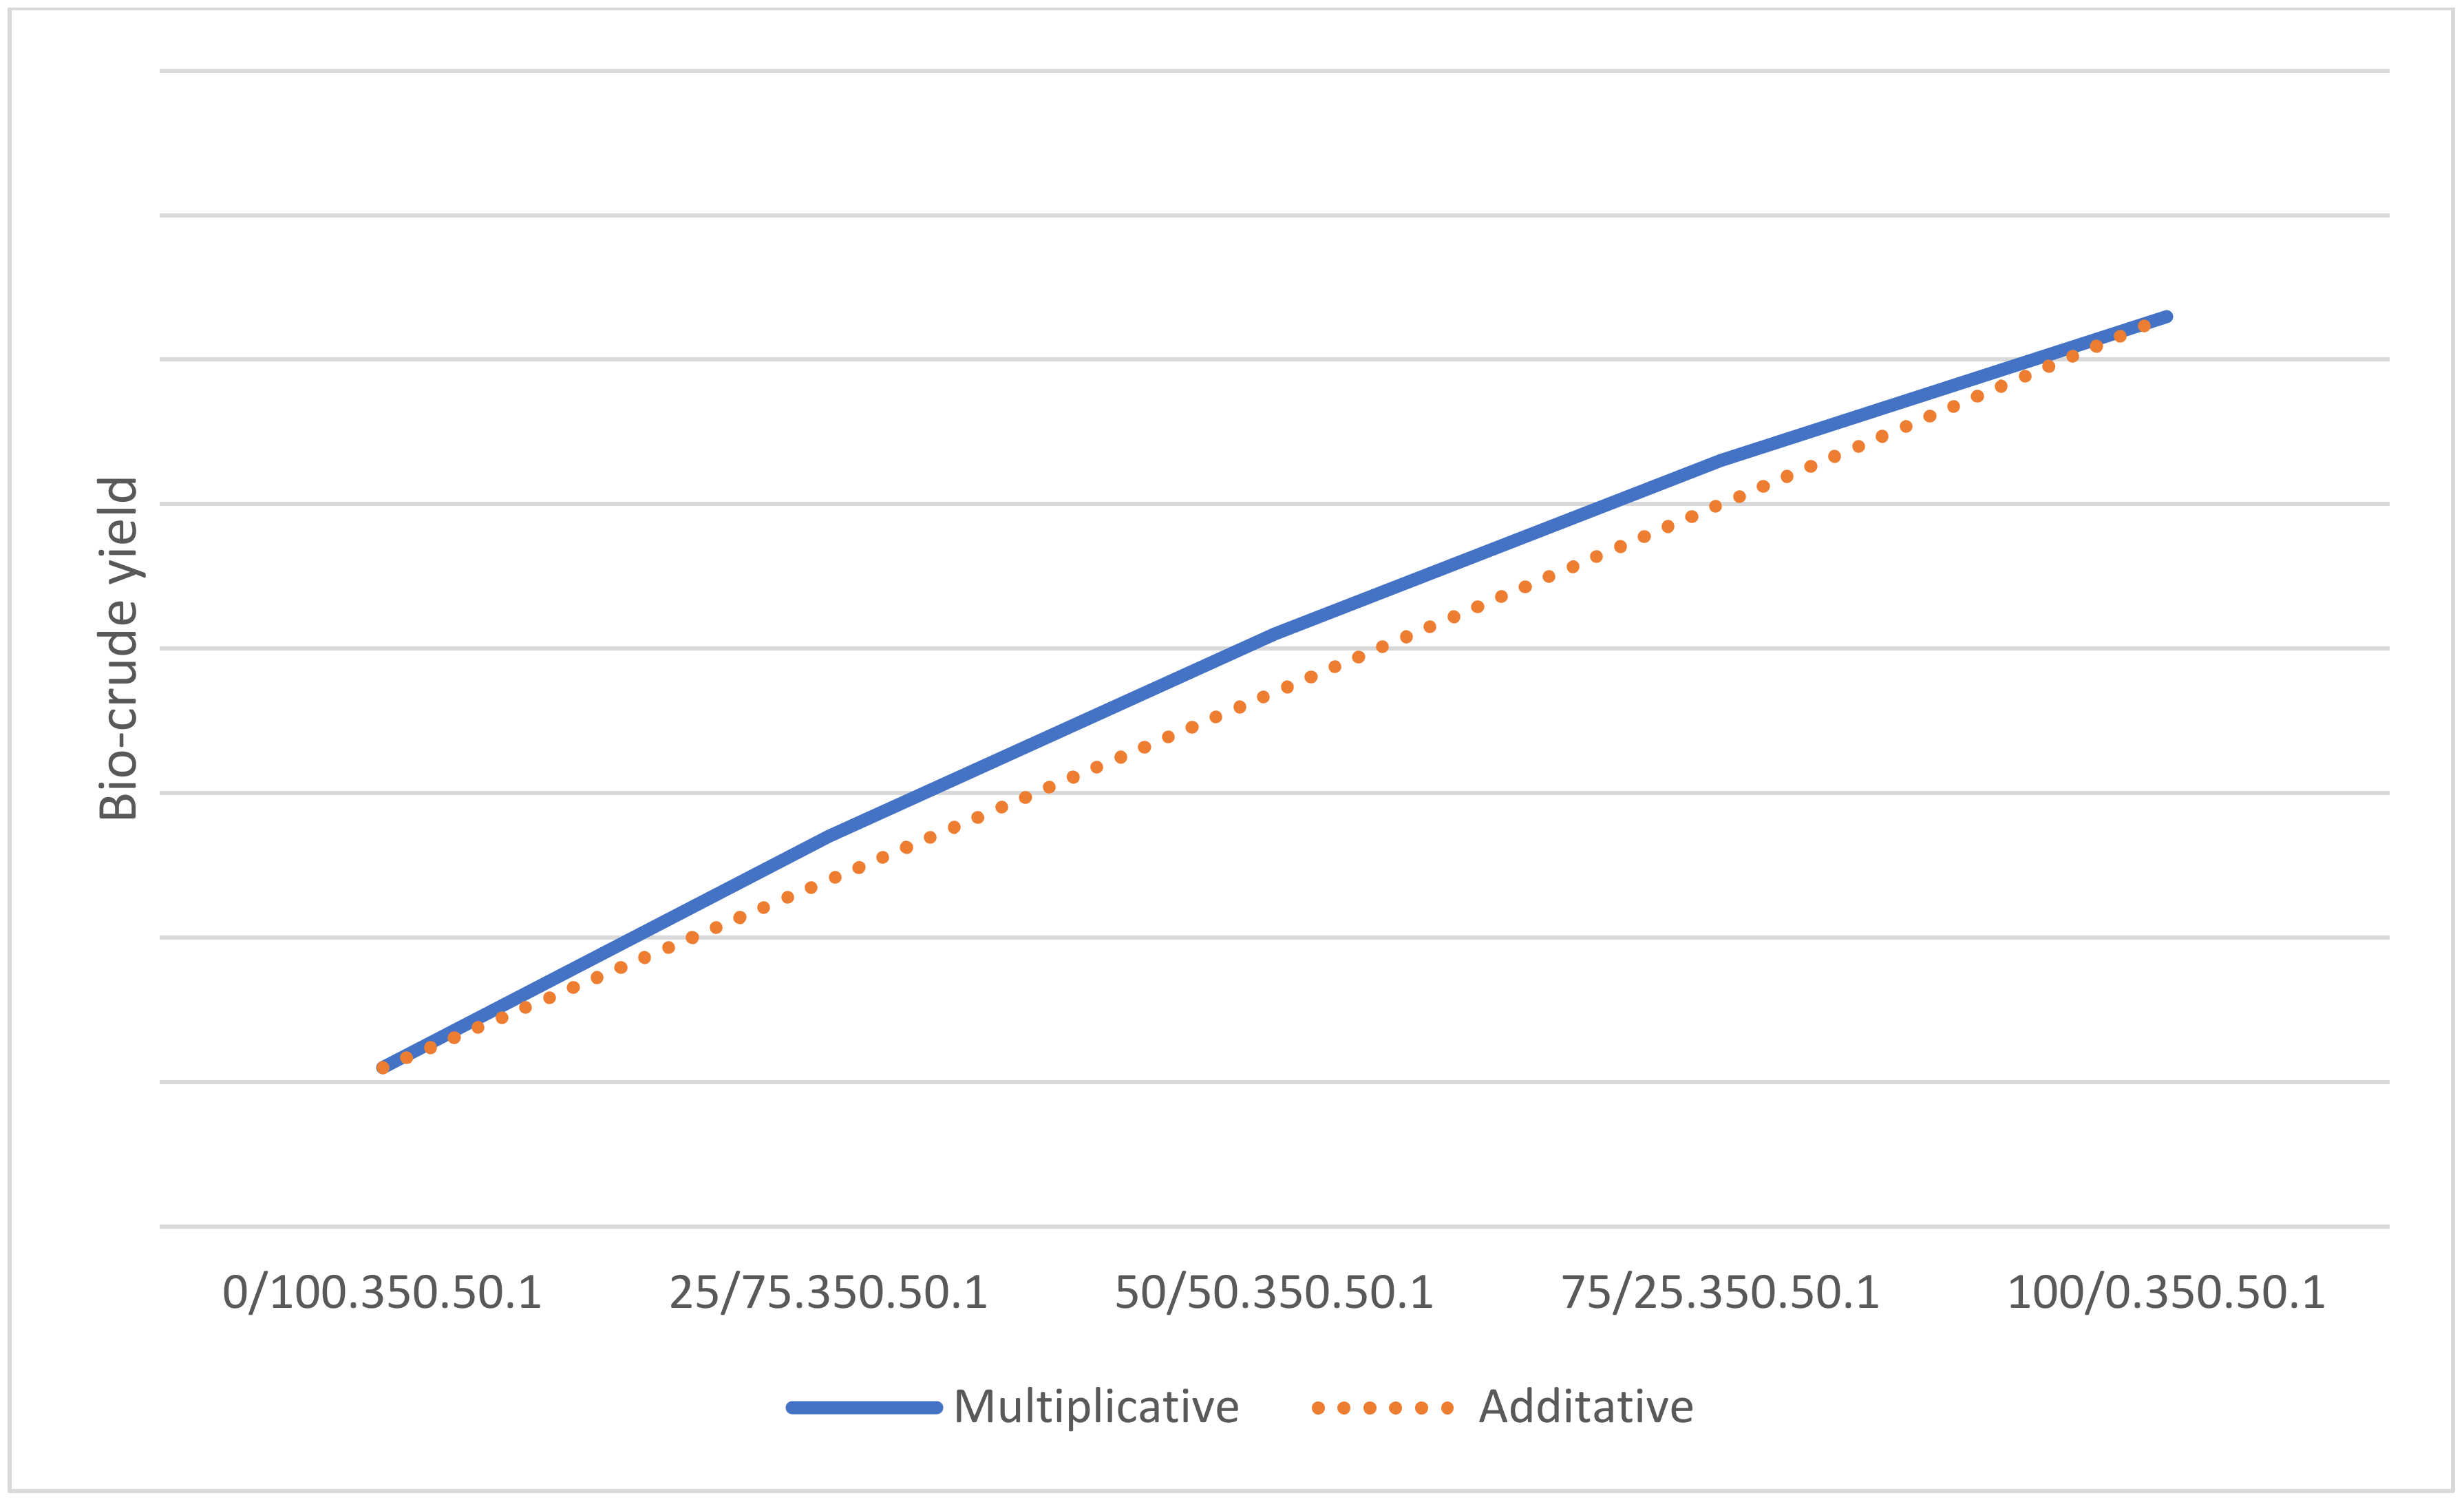
Table 2). By isolating the variable that explained the mixture ratio of the feedstocks and observing its effects within the context of the previously identified optimal levels, a more detailed understanding of its contribution to the overall response is obtained, and a potential curvature in the response could be elucidated. This approach offers the most effective means to demonstrate the multiplicative effect resulting from the mixture of feedstocks and ascertain whether this effect is synergistic or antagonistic.

2.7. Multivariate Data Analysis

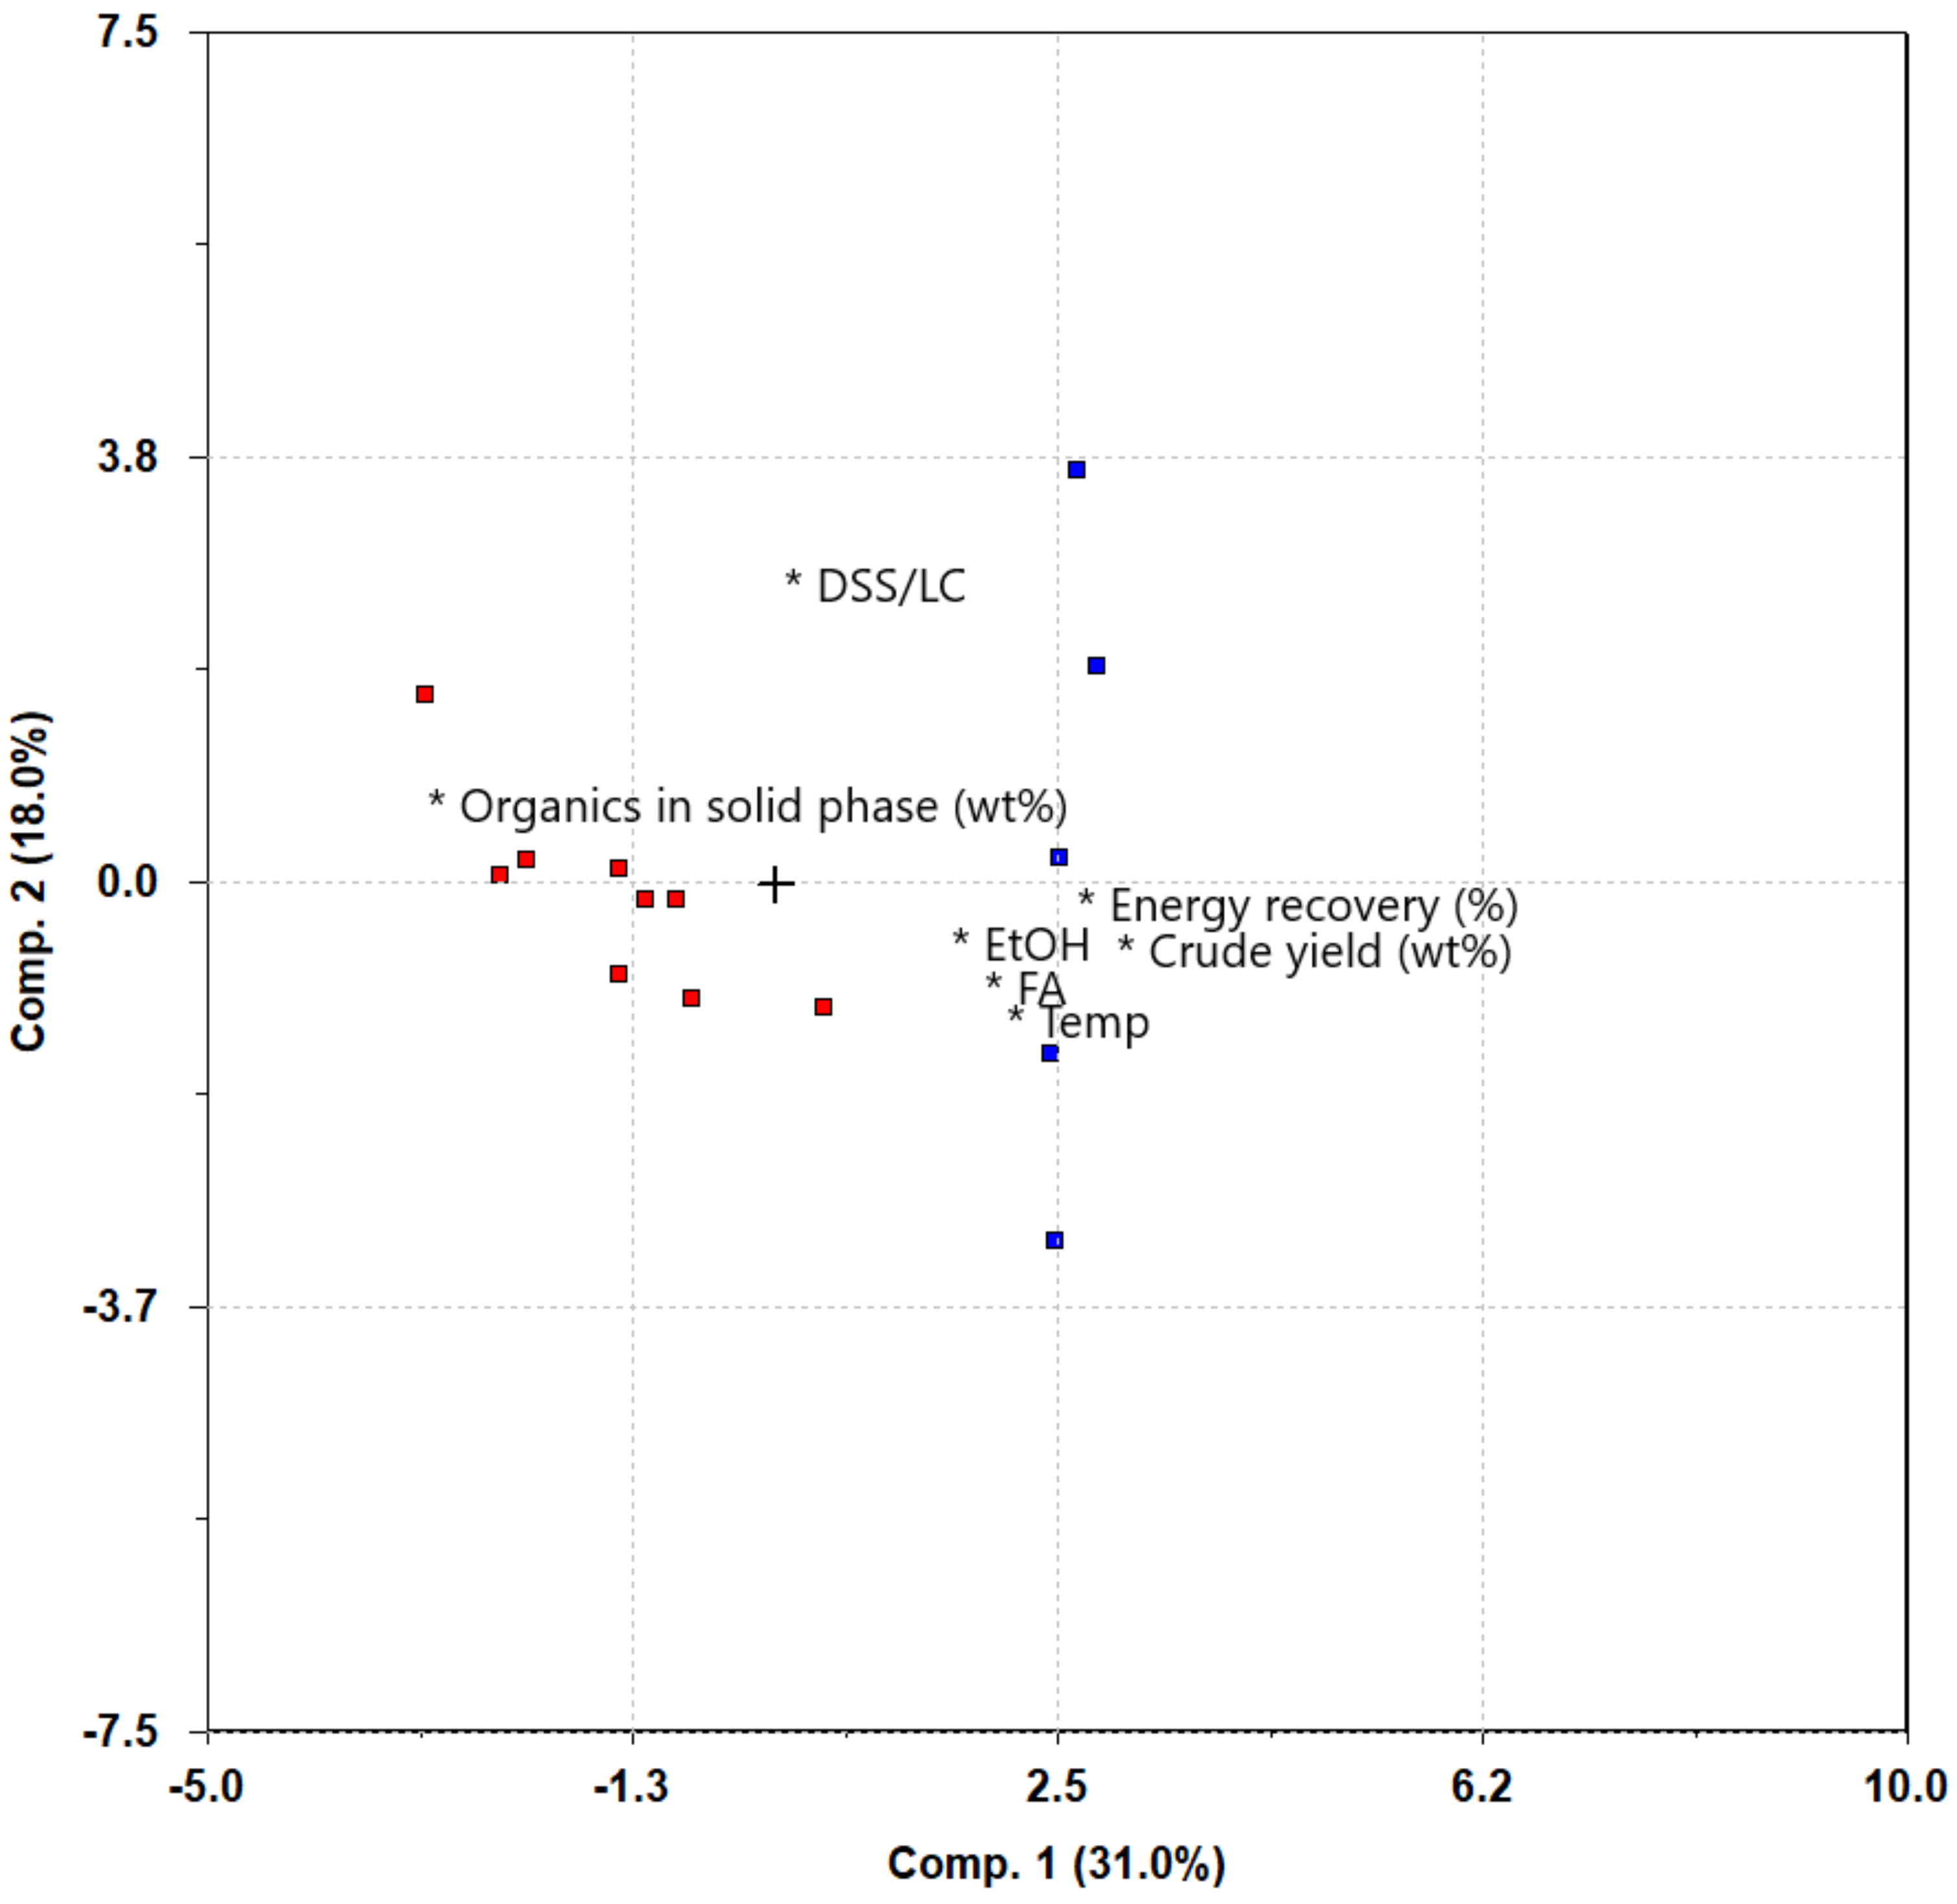
To examine the outcomes of the experimental design, principal component analysis (PCA) was conducted using Sirius 11.0 software, resulting in the generation of a biplot. The biplot visually represents the correlations between different factors. In the biplot, factors that correlate positively are positioned on the same side of the origin, as indicated by a plus sign in the results [17]. Conversely, factors that correlate negatively are positioned on opposite sides of the origin. Factors positioned at 90° angles from each other through the origin are considered uncorrelated. The distance of a factor from its origin reflects its impact on, or sensitivity to, other factors. The further away a factor is from its origin, the greater its influence or susceptibility to other factors.
In addition to PCA, the partial least squares (PLS) method was employed using Sirius 11.0 software. This approach quantifies the influence of each factor on the target outcome. The statistical significance of a PLS model was assessed through key metrics, including R2 (coefficient of determination), RMSECV (Root Mean Square Error of Cross-Validation), and the number of PLS components employed. R2 indicates the proportion of variance in the dependent variable that the model explains, with higher values suggesting a more robust model fit. RMSECV quantifies the accuracy of predictions, representing the average error between actual and predicted values, and lower values indicate better predictive performance. The number of PLS components used in the model influences its complexity. Increasing the number of components may lead to overfitting, where the model performs well on the training data but poorly on new data. Therefore, a balanced approach is required to select an optimal number of components that capture the essential variance without introducing excessive complexity [18].
A statistically significant PLS model exhibits high R2 values, low RMSECV values, and an appropriate number of PLS components. These factors collectively ensure the model’s ability to effectively represent the underlying relationships in the data, providing reliable predictions and meaningful insights.

3. Results and Discussion

3.1. Yields

The yields of bio-crude and organics on the solid residue are shown in Figure 2. Replicates indicate uncertainties of 3–5 wt% of the bio-crude yields. It is worth noting that the uncertainty would have been higher if the experiments included DSS from different batches. The bio-crude yields are in the range of 26.8–58.9 wt%. The best experiment shows that mixtures with more DSS and high levels of process conditions (350 °C, 1 mL FA, and 50 wt% EtOH) increase the bio-crude yield, while the lowest bio-crude yield was obtained with low-value process conditions (280 °C, 0 mL FA, and 10 wt% EtOH).
The total solid residue will be highly dependent on the initial content of inorganics in the feedstock. Initial analysis of the feedstock conducted by Bergen Vann showed that the DSS contains 39 wt% inorganics. This high value will make the solid residue highly dependent on the initial DSS concentration, resulting in a value with little informational content for use in optimization. This makes it challenging to accurately quantify the conversion efficiency. Therefore, the focus was limited to assessing the organic content in solid residue as a more reliable indicator of the extent of conversion. This was calculated by subtracting the total solid weight after conversion from 39% of the initial DSS weight.
The organics in the solid residue range from 3.7 to 33.7 wt% of the organic content in the feedstock. The organics in the solid residue follow the opposite trend, as the organic content exceeds the bio-crude yield in the least successful experiment. The center point experiments reveal that FA contributes to lower values for organic content in solid residue. Gas yields are not presented in Figure 2, as the gas yield was only correlated with the presence of FA. Bengoechea et al. [19] have provided evidence of a direct correlation between gas yields and the addition of FA. This association can be attributed to the fact that the principal constituents of the gas, namely H2, CO2, and CO, are decomposition products that contribute to the overall gas production. In previous studies by Hegdahl et al. [8] with similar process conditions, DSS showed a yield of 57.6 wt%. The results from this study align with the findings of this work, as the experiment run with pure DSS resulted in a bio-crude yield of 52.5 wt%. The experiment with pure LC resulted in a bio-crude yield of 48.3 wt%. In contrast, a study by Feng et al. [20] showed a maximum yield of 58 wt% using spruce bark.

3.2. Elemental Analysis

Incorporating elemental analysis data in conjunction with bio-crude yield allows for a more comprehensive understanding of the overall performance and energy potential of the hydrothermal liquefaction process. While bio-crude yield provides valuable information about the quantity of the product obtained, elemental analysis offers deeper insights into its quality and energy content. This information enables us to calculate essential parameters such as the higher heating value (HHV) and energy recovery, which are critical in assessing the potential of the bio-crude. In Figure 3, it is evident that the elemental ratios and heating values do not exhibit significant variations across the experiments, ranging from 29.3 to 35.6 MJ/kg. The similarity in these elemental ratios suggests that the higher heating value (HHV) of the bio-crude remains relatively consistent in each experiment. Since the HHV is relatively constant across the experiments, the proportion of energy recovered in the bio-crude is primarily determined by the amount of bio-crude obtained. Hence, a higher bio-crude yield directly translates to a higher energy recovery. This correlation between energy recovery and bio-crude yield is also evident when comparing Figure 2 and Figure 3. The energy recovery calculations do not include FA, as previous research within our research group indicates that the incorporation of FA degradation products into the bio-crudes is minimal. The work of Yu et al. [21] also suggests that FA decomposes into gases under hydrothermal conditions and can be recovered from the gas phase. Energy utilization from unreacted ethanol can be envisioned by recycling the aqueous/ethanol reaction medium in a continuous system.
The energy recovery achieved in the bio-crude relative to the feedstock ranges from 41 to 103%, following the same trend as the bio-crude yield, where the best results are from experiments with high levels of all variables and the poorest results from experiments with low levels. This performance is especially noteworthy considering that the energy remaining in the gas, solid, and dissolved products was not considered due to a lack of detailed analysis of the aqueous and gas phases. In comparison, Li et al. [22] reported an energy recovery of up to 75.4% in their bio-crude, underscoring the superior performance achieved by incorporating FA in our study. Although a complete energy balance is not feasible due to the absence of quantification of EtOH and elemental analysis of organic compounds in the aqueous and gas phases, it is reasonable to expect that the overall energy recovery in our system surpasses 100% in many of the experiments. This suggests that thermal and chemical energy is stored in the bio-crude, likely resulting from endothermic reactions involving hydrogen incorporation from the FA and water present in the reaction medium. Such an effect has already been reported by Prestigiacomo et al. [23], using sewage sludge as feedstock for HTL.

3.3. Multivariate Data Analysis

To gain further insight into the correlations within the dataset, a biplot (Figure 4) generated by PCA was employed for visualization. The biplot reveals compelling findings regarding the interplay between various factors in relation to crude yield. The experiments included in the fractional factorial design (colored red) made it evident that maintaining high levels of temperature, EtOH, and FA is crucial for achieving maximum crude yield, as their points in the plot lie near the point for bio-crude yield. The organic content in the solid residue seems to be directly anticorrelated to the crude yield, as it lies on the opposite side of the origin. This can be expected as the organics in the solid residue are still in the solid phase. As explained by the evenly distributed HHV among the experiments, the bio-crude yield and energy recovery are almost identical, and their points in the biplot are very close. This aligns well with previous findings, as the HHVs are stable across all experiments. For the additional experiments conducted to elucidate the effect of feedstock ratio (colored blue), an interesting pattern emerged. The experiment conducted with a 50/50 ratio and all other levels at high reaction condition levels exhibited the highest correlation with bio-crude yield, and the correlations diminished as the ratios deviated from the 50/50 mark. This is the first sign of a synergistic effect between the feedstocks. In order to further elucidate this effect, a PLS regression was applied to look at the quantitative relationships between the variables and their impact on the process outcome.
To comprehensively explore the effects of the variables, including cross-terms and quadratic terms, a PLS regression was performed (Figure 5). The objective was to develop a predictive model for the crude yield. The PLS regression model demonstrated a remarkably good fit, with an R2 value of 0.943. This indicates that the model effectively captures and explains a significant portion of the variance in the respective response variables. The PLS model was constructed using two PLS components covering 94.25% of the total variance, resulting in a root mean square error of cross-validation (RMSECV) of 6.58 for the prediction of crude yield. This relatively low RMSECV value further validates the predictive capability of the model, indicating its reliability in estimating the performance of the HTL process. In essence, this means that the factors chosen in this experimental design encapsulate most of the variance in the bio-crude yield and are the most important factors for determining the bio-crude yield.
The regression coefficients of the PLS regression equation depicted in Figure 6 offer valuable insights into the factors influencing the bio-crude yield in the HTL process. The main factor that covers the mixture ratio emerged as a positive coefficient, suggesting that DSS provides a higher bio-crude yield than LC when isolating the feedstocks. This is confirmed by examining the results of these specific experiments. As observed in the biplot, maintaining the other main factors, such as temperature, FA, and EtOH, at high levels is crucial for optimizing bio-crude yield, but byproducts formed from EtOH and FA, as well as economic factors, should be considered.
Examining the cross-terms, two key interactions stand out. Firstly, the cross-term of temperature and FA (2 × 4) demonstrates a positive coefficient, indicating that these factors should be aligned or maintained at similar levels to enhance the bio-crude yield. Secondly, the cross-term of feedstock ratio and FA (1 × 4) exhibits a negative coefficient, suggesting that FA exerts a greater influence on LC than on DSS. These findings shed light on the complex interplay between variables and emphasize the importance of considering these cross-terms in process optimization.
The quadratic term for DSS/LC shows a slightly negative coefficient for bio-crude yield. This negative coefficient indicates a curvature in the response surface, implying that the bio-crude yield obtained from the different ratios is not linear. The bio-crude yield surpasses the anticipated levels that would be projected under a linear correlation assumption. This outcome also suggests the existence of a synergistic effect as a consequence of combination reactions between compounds in the different feedstocks. The margin of error on this coefficient is rather high, but it suggests that it is more plausible for this quadratic term to be negative than positive. If the reaction conditions are maintained at high levels, the regression equation can be used to plot the mixture ratio against bio-crude yield, as shown in Figure 7. This helps illustrate how the bio-crude yield is predicted as the mixture changes. This will not be a linear relationship because of the quadratic term. Chen et al. [24] and Madsen et al. [25] suggest a synergistic effect because of the presence of NH4 from the protein in the DSS, as an alkaline environment has been shown to catalyze the conversion of lignocellulosic biomass into bio-crude. No pH measurements were made in this study.

3.4. Compound Elucidation Using GC–MS

To illuminate the interaction effects of the compounds in the different feedstocks, GC–MS analysis is utilized. Our findings align with prior studies on individual feedstocks [8], revealing that bio-crudes produced from LC are enriched in phenolic compounds derived from lignin, along with lighter aliphatic alcohols originating from carbohydrates. In contrast, DSS exhibits a lower proportion of phenolic compounds and instead prominently features lipid-derived compounds and sterols as dominant peaks in the chromatogram. When these feedstocks are combined, the resulting chromatogram predominantly mirrors the combination of the individual feedstock chromatograms. However, novel peaks emerged within the combined feedstocks that were not discernible in either of the individual feedstock chromatograms. These distinctive peaks are associated with specific phenolic compounds (structures shown in Figure 8 and structure names described in Table 3). Studies on sewage sludge combined with LC by Leng et al. [4] also show that some unique phenols are produced by combining feedstocks as well as some lighter esters.

3.5. Comparison with Published Data

No previous studies have explored co-HTL involving DSS. As DSS, a byproduct of biogas fermentation of sewage sludge, represents waste material from a process already yielding valuable products, direct comparisons are challenging due to the absence of studies on HTL with DSS. The most direct comparison is the work of Hegdahl et al., as discussed previously, where DSS were converted to bio-crudes in an HTL process using EtOH and FA. However, this was not co-HTL. As a relevant approximation, we compare bio-crude production from regular sewage sludge to DSS. Previous studies by Hu et al. [26] and Nazari et al. [27] suggest synergistic effects when mixing biomass feedstocks. In our study, we optimized reaction conditions and conducted a comprehensive exploration of this synergistic effect using multivariate analysis. We found evidence of a synergistic effect from PCA and the negative quadratic term of the PLS regression. Nazari et al. optimized co-HTL conditions for sewage sludge and sawdust, achieving a maximum yield of 33.7 wt% at 310 degrees for 10 min. In contrast, our study achieved a higher maximum yield of 58.9 wt%, although the temperature range differed, and our reaction duration was 3 h. Furthermore, Hu et al. combined algal biomass with sawdust in an ethanol–water solvent, attaining a 58 wt% bio-crude yield with a 50/50 mix of 75 wt% ethanol at 250 degrees for 60 min. Algal biomass is lipid-rich, somewhat justifying the comparison to DSS. EtOH has been suggested as a suitable solvent by numerous studies [2,3,26,28], which aligns with the findings of this work. However, we visualize the increasing potential of EtOH as the mixture ratio skews towards DSS. This suggests that EtOH has a higher potential for lipid-rich feedstock and loses its effect as the mixture leans towards LC. The effect of FA has been studied in the works of Kleinert et al. [6] and Prestigiacomo et al. [29]. Their findings align well with the results of this work. Moreover, by varying the mixture ratio, we obtain an in-depth view of how FA affects one feedstock as opposed to the other. This work suggests that FA has more effect on LC than on DSS, as shown by a gradual change in the mixture ratios.

4. Conclusions

The best experiment from the fractional factorial design shows that mixtures with more DSS, 350 °C, formic acid present, and 50 wt% EtOH give the highest bio-crude yield of 58.9 wt%. For comparison, pure DSS and LC run at these process conditions resulted in a bio-crude yield of 52.5 wt% and 48.3 wt%, respectively. The organic content in the solid residue follows an opposite trend, where the experiment with the highest bio-crude yield also shows the lowest organic content in the solid residue of 3.7 wt%.
The elemental ratios of hydrogen, oxygen, nitrogen, and carbon do not exhibit significant variations across the experiments, with HHVs ranging from 29.3 to 35.6 MJ/kg. Since the HHV is relatively constant across the experiments, the proportion of energy recovered relative to the total energy content in the bio-crude is primarily determined by the amount of bio-crude obtained. The energy recovery achieved in the bio-crude relative to the feedstock ranges from 41 to 103%.
The PLS model was constructed using two PLS components covering 94.25% of the total variance, resulting in a root mean square error of cross-validation (RMSECV) of 6.58 for the prediction of crude yield. The regression equation reveals a synergistic effect by mixing feedstocks, as the quadratic term of the regression equation for mixture ratio shows a negative coefficient. This effect is also shown in the biplot from the principal component analysis. The experiment conducted with a 50/50 mixture ratio and all other levels at high reaction condition levels exhibited the highest correlation with bio-crude yield, and the correlations diminished as the ratios deviated from the 50/50 mark.
GC–MS data revealed novel peaks within the chromatograms of combined feedstocks that were not discernible in either of the individual feedstock chromatograms. These distinctive peaks are associated with new phenolic compounds and further show the effect of combining different feedstocks.
This research advances the field of co-HTL by demonstrating its viability in converting DSS and LC into bio-crude with an impressive yield that stands in the upper region of reported values in the available literature. In addition, this work not only contributes a valuable method for optimizing co-HTL conditions but also underscores the synergistic effects of co-processing DSS and LC, offering both high yield and consistent energy content. The implications of this study extend to advancing sustainable biofuel production through the efficient utilization of diverse biomass feedstocks, paving the way for environmentally friendly and economically viable energy solutions.

Author Contributions

K.M.H.: conceptualization, methodology, software, formal analysis, investigation, resources, data curation, project administration, writing—original draft, and writing—review and editing. T.B.: conceptualization, supervision, and writing—review and editing. All authors have read and agreed to the published version of the manuscript.

Funding

This project is funded by the Climate and Energy Transition Investment Area at the University of Bergen.

Data Availability Statement

The data used to support the findings of this study are available from the corresponding author upon request. The data are not publicly available due to the unique nature of the experimental design and the complexity of the results. The format and context of the data are best explained through direct interaction.

Acknowledgments

The authors would like to thank AT Skog and Bergen Vann for providing help in sourcing raw materials for this work. We would also like to thank the research group for providing valuable input and the Climate and Energy Transition at UiB for funding the project.

Conflicts of Interest

The authors declare no conflicts of interest.

References

  1. Osman, A.; Mehta, N.; Elgarahy, A.; Al-Hinai, A.; Al-Muhtaseb, A.; Rooney, D. Conversion of biomass to biofuels and life cycle assessment: A review. Environ. Chem. Lett. 2021, 19, 4075–4118. [Google Scholar] [CrossRef]
  2. Akhtar, J.; Amin, N.A.S. A review on process conditions for optimum bio-oil yield in hydrothermal liquefaction of biomass. Renew. Sustain. Energy Rev. 2011, 15, 1615–1624. [Google Scholar] [CrossRef]
  3. Cheng, S.; Wilks, C.; Yuan, Z.; Leitch, M.; Xu, C. Hydrothermal degradation of alkali lignin to bio-phenolic compounds in sub/supercritical ethanol and water–ethanol co-solvent. Polym. Degrad. Stab. 2012, 97, 839–848. [Google Scholar] [CrossRef]
  4. Leng, L.; Li, J.; Yuan, X.; Li, J.; Han, P.; Hong, Y.; Wei, F.; Zhou, W. Beneficial synergistic effect on bio-oil production from co-liquefaction of sewage sludge and lignocellulosic biomass. Bioresour. Technol. 2018, 251, 49–56. [Google Scholar] [CrossRef] [PubMed]
  5. Huang, H.-J.; Yuan, X.-Z. Recent progress in the direct liquefaction of typical biomass. Prog. Energy Combust. Sci. 2015, 49, 59–80. [Google Scholar] [CrossRef]
  6. Kleinert, M.; Barth, T. Towards a Lignincellulosic Biorefinery: Direct One-Step Conversion of Lignin to Hydrogen-Enriched Biofuel. Energy Fuels 2008, 22, 1371–1379. [Google Scholar] [CrossRef]
  7. Liu, C.; Kong, L.; Wang, Y.; Dai, L. Catalytic hydrothermal liquefaction of spirulina to bio-oil in the presence of formic acid over palladium-based catalysts. Algal Res. 2018, 33, 156–164. [Google Scholar] [CrossRef]
  8. Hegdahl, S.; Løhre, C.; Barth, T. Hydrothermal liquefaction of sewage sludge anaerobic digestate for bio-oil production: Screening the effects of temperature, residence time and KOH catalyst. Waste Manag. Res. 2023, 41, 977–986. [Google Scholar] [CrossRef]
  9. Li, Q.; Yuan, X.; Hu, X.; Meers, E.; Ong, H.C.; Chen, W.-H.; Duan, P.; Zhang, S.; Lee, K.B.; Ok, Y.S. Co-liquefaction of mixed biomass feedstocks for bio-oil production: A critical review. Renew. Sustain. Energy Rev. 2022, 154, 111814. [Google Scholar] [CrossRef]
  10. Seiple, T.E.; Skaggs, R.L.; Fillmore, L.; Coleman, A.M. Municipal wastewater sludge as a renewable, cost-effective feedstock for transportation biofuels using hydrothermal liquefaction. J. Environ. Manag. 2020, 270, 110852. [Google Scholar] [CrossRef]
  11. Mohan, D.; Pittman, C.U., Jr.; Steele, P.H. Pyrolysis of wood/biomass for bio-oil: A Critical Review. Energy Fuels 2006, 20, 848–889. [Google Scholar] [CrossRef]
  12. Available online: https://www.bergen.kommune.no/innbyggerhjelpen/vann-vei-og-trafikk/vann-og-avlop/avlop-og-avlopshandtering/biogass (accessed on 1 August 2023).
  13. Rowell, R.M.; Pettersen, R.; Mandla, T.A. Cell Wall Chemistry. In Handbook of Wood Chemistry and Wood Composites; CRC Press: Boca Raton, FL, USA, 2012. [Google Scholar]
  14. Channiwala, S.A.; Parikh, P.P. A unified correlation for estimating HHV of solid, liquid and gaseous fuels. Fuel 2002, 81, 1051–1063. [Google Scholar] [CrossRef]
  15. Alper, K.; Tekin, K.; Karagöz, S. Hydrothermal Liquefaction of Lignocellulosic Biomass Using Potassium Fluoride-Doped Alumina. Energy Fuels 2019, 33, 3248–3256. [Google Scholar] [CrossRef]
  16. Xu, W.; Miller, S.J.; Agrawal, P.K.; Jones, C.W. Depolymerization and Hydrodeoxygenation of Switchgrass Lignin with Formic Acid. ChemSusChem 2012, 5, 667–675. [Google Scholar] [CrossRef] [PubMed]
  17. Carlson, R. Design and Optimization in Organic Synthesis; Elsevier: Amsterdam, The Netherlands, 1992. [Google Scholar]
  18. Jolliffe, I.T.; Cadima, J. Principal component analysis: A review and recent developments. Philos. Trans. R. Soc. A Math. Phys. Eng. Sci. 2016, 374, 20150202. [Google Scholar] [CrossRef] [PubMed]
  19. Bengoechea, M.O.; Hertzberg, A.; Miletić, N.; Arias, P.L.; Barth, T. Simultaneous catalytic de-polymerization and hydrodeoxygenation of lignin in water/formic acid media with Rh/Al2O3, Ru/Al2O3 and Pd/Al2O3 as bifunctional catalysts. J. Anal. Appl. Pyrolysis 2015, 13, 713–722. [Google Scholar] [CrossRef]
  20. Feng, S.; Yuan, Z.; Leitch, M.; Xu, C.C. Hydrothermal liquefaction of barks into bio-crude–Effects of species and ash content/composition. Fuel 2014, 116, 214–220. [Google Scholar] [CrossRef]
  21. Yu, J.; Savage, P.E. Decomposition of Formic Acid under Hydrothermal Conditions. Ind. Eng. Chem. Res. 1998, 37, 2–10. [Google Scholar] [CrossRef]
  22. Li, J.; Zhang, W.; Liu, T.; Yang, L.; Li, H.; Peng, H.; Jiang, S.; Wang, X.; Leng, L. Machine learning aided bio-oil production with high energy recovery and low nitrogen content from hydrothermal liquefaction of biomass with experiment verification. Chem. Eng. J. 2021, 425, 130649. [Google Scholar] [CrossRef]
  23. Prestigiacomo, C.; Laudicina, V.A.; Siragusa, A.; Scialdone, O.; Galia, A. Hydrothermal liquefaction of waste biomass in stirred reactors: One step forward to the integral valorization of municipal sludge. Energy 2020, 201, 117606. [Google Scholar] [CrossRef]
  24. Chen, W.-T.; Zhang, Y.; Zhang, J.; Schideman, L.; Yu, G.; Zhang, P.; Minarick, M. Co-liquefaction of swine manure and mixed-culture algal biomass from a wastewater treatment system to produce bio-crude oil. Appl. Energy 2014, 128, 209–216. [Google Scholar] [CrossRef]
  25. Madsen, R.B.; Bernberg, R.Z.K.; Biller, P.; Becker, J.; Iversen, B.B.; Glasius, M. Hydrothermal co-liquefaction of biomasses–quantitative analysis of bio-crude and aqueous phase composition. Sustain. Energy Fuels 2017, 1, 789–805. [Google Scholar] [CrossRef]
  26. Hu, Y.; Feng, S.; Bassi, A.; Xu, C. Improvement in bio-crude yield and quality through co-liquefaction of algal biomass and sawdust in ethanol-water mixed solvent and recycling of the aqueous by-product as a reaction medium. Energy Convers. Manag. 2018, 171, 618–625. [Google Scholar] [CrossRef]
  27. Huang, H.J.; Yuan, X.Z.; Li, B.T.; Xiao, Y.D.; Zeng, G.M. Thermochemical liquefaction characteristics of sewage sludge in different organic solvents. J. Anal. Appl. Pyrolysis 2014, 109, 176–184. [Google Scholar] [CrossRef]
  28. Nazari, L.; Yuan, Z.; Ray, M.B.; Xu, C. Co-conversion of waste activated sludge and sawdust through hydrothermal liquefaction: Optimization of reaction parameters using response surface methodology. Appl. Energy 2017, 203, 1–10. [Google Scholar] [CrossRef]
  29. Prestigiacomo, C.; Proietto, F.; Laudicina, V.A.; Siragusa, A.; Scialdone, O.; Galia, A. Catalytic hydrothermal liquefaction of municipal sludge assisted by formic acid for the production of next-generation fuels. Energy 2021, 232, 121086. [Google Scholar] [CrossRef]
Figure 1. Flowchart of the experimental procedure.
Energies 17 00258 g001
Figure 2. Bio-crude yield and organic content in the solid residue are given as a percentage of the total organic content in the feedstock. The experiments are named as specified in Table 1.
Energies 17 00258 g002
Figure 3. Results from elemental analysis show the contents of nitrogen (N), carbon (C), hydrogen (H), oxygen (O), the higher heating value (HHV), and the energy recovery for each experiment. The value for HHV is presented in MJ/kg.
Energies 17 00258 g003
Figure 4. Biplot showing relative correlations between reaction conditions and results. Experiments in the factorial design are colored red, and the extra experiments with varying mixture ratios are colored blue. The loadings are represented by *. + marks the origin in the plot.
Energies 17 00258 g004
Figure 5. Predicted vs. measured bio-crude yield based on PLS. Experiments in the factorial design are colored red, and the extra experiments with varying mixture ratios are colored blue. The names of the experiments are given in Table 1.
Energies 17 00258 g005
Figure 6. Regression coefficients from PLS. The uncertainty bars are based on the variation not included in the partial least squares components. The first four regression coefficients are the main factors (from ×1 to ×1×2×3), while the unnamed ones are the cross- and quadratic terms of the main factors.
Energies 17 00258 g006
Figure 7. Visualization of the multiplicative effect by combining feedstocks compared with the additive effect.
Energies 17 00258 g007
Figure 8. Chromatograms of bio-crudes from LC (red), DSS (blue), and a 50/50 mixture (green). The molecular structures shown are unique for the chromatogram from the 50/50 mixture.
Energies 17 00258 g008
Table 1. Experimental conditions of the fractional factorial design. Experiment names are given as Ratio.Temp.EtOH.FA.
NamingRatioTemp. °CEtOH:WaterFA (mL)
75/25.350.50.175/2535050:501
25/75.350.50.025/7535050:500
75/25.280.50.075/2528050:500
25/75.280.50.125/7528050:501
75/25.350.10.075/2535010:900
25/75.350.10.125/7535010:901
75/25.280.10.175/2528010:901
25/75.280.10.025/7528010:900
50/50.315.30.150/5031530:701
50/50.315.30.050/5031530:700
Table 2. Experimental conditions of the additional experiments to elucidate the effects of the mixture ratios.
NamingRatioTemp. °CEtOH:WaterFA (mL)
100/0.350.50.1100/035050:501
75/25.350.50.175/2535050:501
50/50.350.50.150/5035050:501
25/75.350.50.125/7535050:501
0/100.350.50.10/10035050:501
Table 3. The unique molecular compounds in the bio-crude from the 50/50 mixture are not present in the single-feedstock bio-crudes.
Structure NameRetention Time (min)Integral (×105)
4-methylbenzene-1,2-diol16.347.6
Hydroquinone16.4316.8
2-(2-hydroxyethyl)phenol17.15, 17.2231.7, 43.0
2-(3-hydroxyphenyl)acetic acid17.885.2
2-(tert-butyl)benzene-1,4-diol18.1, 18.627.2, 8.5
ethyl-2,3,5,7-tetramethyl-1H-pyrrolo[2,3-f]quinoline-8-carboxylate18.2121.7
Disclaimer/Publisher’s Note: The statements, opinions and data contained in all publications are solely those of the individual author(s) and contributor(s) and not of MDPI and/or the editor(s). MDPI and/or the editor(s) disclaim responsibility for any injury to people or property resulting from any ideas, methods, instructions or products referred to in the content.

