Abstract
The repetitive process of shut-in and production in geothermal wells promotes thermal stress on the wellbore components, including annular cement. A cement sheath at a relatively shallow depth undergoes the most significant stress change due to the high differential temperature between the geothermal gradient and the production fluid’s temperature. Understanding the impact of cyclical thermal stresses on cement is critical for assessing the barrier integrity at a shallow depth that serves as aquifer protection. A novel large-scale setup simulating a 1.5 m-long casing-cement-casing well section was built to study the changes in cement’s sealing performance of low-enthalpy geothermal wells during production. Using this setup, a cement sheath can be cured similarly to the in situ conditions, and the annular temperature can be cycled under realistic operating conditions. The change in flow rate through the cement sheath before and after cycling is quantified through leak tests. UV dye is injected at the end of the experiment to identify the location and type of damage in the cement sheath. A hydromechanically coupled finite element model was used to estimate the stress evolution in cement during the tests. The model incorporated the impact of cement hydration and strength development during curing. The numerical results were used as a guide to ensure the test design closely mimicked in situ conditions. The results show the presence of a small microannulus immediately after curing due to hydration shrinkage. Thermal cycles reduced the permeability of the microannulus. The size of the micro-annulus was observed to be sensitive to the backpressure applied to the cement sheath, indicating the need for pressure to maintain an open microannulus. Thirty-nine thermal cycles between 80 and 20 °C did not change the permeability of the cement sheath significantly. Tensile cracks in the cement sheath were not continuous and may not be a significant pathway. The new setup allows for measuring cement’s effectiveness in withstanding in situ stress conditions when exposed to thermal cycles such as geothermal and CCS wells.
1. Introduction
Geothermal energy plays a crucial role in the global energy transition towards a more sustainable and low-carbon future. The ambition of geothermal energy in The Netherlands is to contribute 55.5 + TWh to the heat demand by 2050 [1]. By the end of 2022, there were a total of 27 geothermal production installations available in The Netherlands with depths ranging between 1600–2800 m [2] and an operating temperature of <100 °C. During the life of the well, geothermal producer wells undergo thermal cycles of heating and cooling as a result of the repetitive production and shut-in processes. These cycles cause the wellbore components to alternately expand and contract, which induces cyclic stress. Of specific concern is the annular cement, which may sustain damage in the form of cracks or microannuli due to cyclic stress. Such damage could increase the risk of creating leak pathways, compromising the cement integrity.
In the producer wells, the heating effect is particularly significant for the shallow section. During the production phase, the cement sheath is heated up from the geothermal gradient to a temperature close to the reservoir brine’s temperature. During shut-in, the temperature will return to the initial condition. It is also important to consider that the properties of the thermal expansion coefficient and thermal conductivity, differ between the components of casing, cement, and formation. The difference in the thermal conductivity results in a radial temperature profile, hence causing each component to expand and contract at a different rate.
Several experimental studies have evaluated the impact of thermal cycles on cement sheath properties. Therond et al. [3] performed a large-scale experiment investigating the change in the annular flow of a cement sheath that is subjected to cooling/heating cycles and pressure cycles in the context of water injection wells. The result shows that the cooling effect has a significant impact on the sealing of the cement sheath as it promotes the creation of microannulus at the inner and outer interface. The radial cracks from the pressure increase were found to have a negligible effect on the annular permeability. The results, however, are not relevant in the context of producer wells where the thermal load from heating is more dominant.
Goodwin and Crook [4] indirectly simulated the thermal loading of heating/cooling on cement sheath by cycling the inner casing pressure. The change in the annular permeability was measured in each cycle. Significant cement damage in the form of radial cracks was observed after the inner pressure was raised to 2.8 MPa. This pressure is equivalent to a temperature change of 100–200 °C for various casing sizes and types. However, the approach is less accurate to mimic thermal stress without involving heat transfer. Recent works by De Andrade et al. [5], Vrålstad et al. [6], and De Andrade et al. [7] used a scaled-down wellbore setup to directly simulate thermal cycles in various downhole scenarios (e.g., effects of different confining formations and casing eccentricity). The evolution of cement damage was monitored through a CT scan, and the volume of the damage was quantified. Their results suggest that the thermal heating–cooling cycle (110 °C to 40 °C) has a minor influence on the integrity of the cement sheath. A similar work by Lin et al. [8] and Kuanha et al. [9] used a large-scale setup that simulated a 0.76 m length of cement sheath between 5″ inner and 7″ outer casings. It was shown that the cement sheath was damaged from thermal cycling, likely due to plastic deformation, and the damage is more significant at higher temperature loading. These works, however, did not quantify the change in the annular permeability.
In this work, the evolution of the sealing properties of annular cement subjected to thermal loading is evaluated through laboratory investigation using a novel large-scale wellbore simulator setup. The large-scale setting was selected in order to accommodate crack growth, especially in the axial direction, and understand the impact of localized cracks on the annular permeability. We applied cycles of heating/cooling on the cement sheath, simulating the operating conditions of low-enthalpy geothermal production wells. The change in cement sheath’s effective permeability is measured before and after thermal and pressure cycles. The experiment was replicated using a finite element model to gather more insight into cement stress development and to compare and contrast the numerical results with experimental observations.
2. Materials and Methods
2.1. Laboratory Experiments
A unique large-scale experimental setup was built to replicate a ~1.2 m long cement sheath placed between a 7–5/8″ inner casing and a 9–5/8″ outer casing (Figure 1). The inner and outer diameter of the cement sheath is 194 and 242 mm, respectively. A vessel (OD: 340 mm) is placed around the outer casing to provide confinement. The entire setup is placed inside a 2 × 2 m heating enclosure to provide a stable temperature. The fluid within the 7–5/8″ inner casing can be circulated with hot and cold water for thermal cycling and can be pressurized for pressure cycling. The sealing of the cement sheath is evaluated using a leak test, which is performed by recording the flow rate at both inflow and outflow at one or more differential pressures (ΔP) and different backpressures (BP) or outlet pressures. Using Darcy’s flow equation, the equivalent effective permeability can be calculated following the equation:
where Q is the water flow rate (m3/s), μ is the water viscosity at 20 °C (Pa/s), L is the length of the cement sheath (m), A is the cross-section area of the annulus (m2), ΔP is the differential pressure (Pa), and k is the effective permeability (milliDarcy).
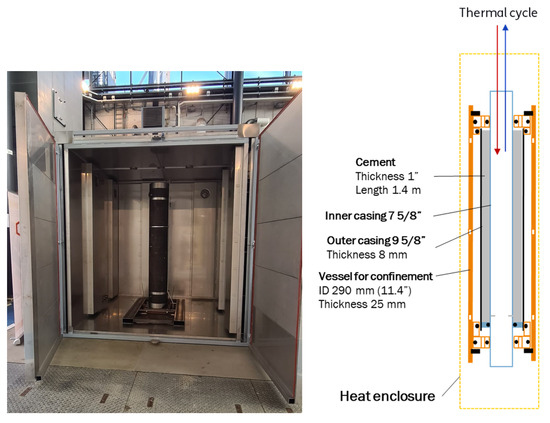
Figure 1.
(Left) Realization of the large-scale setup and (right) the schematic drawing of the setup with a description of the components.
One experiment was conducted using class-G neat cement with 44% BWOC of water. Approx. Twenty liters of a cement slurry was mixed and injected into the annulus. The slurry was then cured for 11 days under an elevated annular pressure of 5 MPa, a confined pressure of 5 MPa, and a temperature of 30 °C. During the leak test, the confined pressure was kept constant at ~4.2 MPa. The chronological steps of testing are as follows:
- An initial leak test was conducted to generate the initial effective permeability of the sample.
- Thermal (heating–cooling) cycling. The hot water injected in the inner casing had a temperature of 80 °C, while the cold water had a temperature of 20 °C. This process of alternating between hot and cold water was repeated for a certain number of cycles. Following the thermal cycles, a leak test was performed.
- Pressure cycling. The pressure cycle was performed by alternately pressurizing the inner casing to 30 MPa and releasing it back to atmospheric pressure. Afterward, a leak test was performed.
- Rhodamine B dye is injected into the cement sheath, and the location of cement damage and the form of damage are observed in the post-mortem analysis.
The realization of the testing steps is summarized in Figure 2. Following curing and initial leak testing, two thermal cycles were conducted with a low backpressure (BP) of 0.5 MPa and a high backpressure of 4 MPa. The intention of cycling at two different backpressures was to generate observation of the influence of thermal cycles at different states of microannulus opening. At high backpressure, the microannulus is expected to open at both ends of the annular cement. On the contrary, the microannulus is expected to close or partially open at the outlet at low back pressure. After pressure cycling, two leak tests were performed: one with an inner casing pressure of 30 MPa and one without inner pressure.
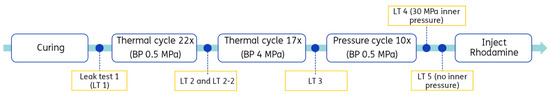
Figure 2.
Realization of testing steps and reference of the leak test (LT) from LT 1 to LT 5.
2.2. Numerical Modeling
We developed a hydromechanical model to investigate the evolution of stress in the cement sheath in the test setup. The modeling is conducted using the Abaqus finite element package. The model mimics the same geometry as the test setup presented in Figure 1. Cement is modeled as a poroelastic material. The initial pressure of the cement was assumed to be equal to the curing pressure. The hydration rate of class G cement was used to estimate the water consumption, pressure drop, and stress change in cement during curing [10,11]. After curing, the model imposes a cyclical temperature or pressure boundary condition on the inside of the inner casing. The evolution of cement stress is monitored over time to understand the impact of pressure and temperature on the stresses in cement and whether damage can be expected. Details of the modeling methodology are described in Moghadam and Loizzo [11]. Figure 3 provides a schematic of the geometry that was considered in the modeling exercise.
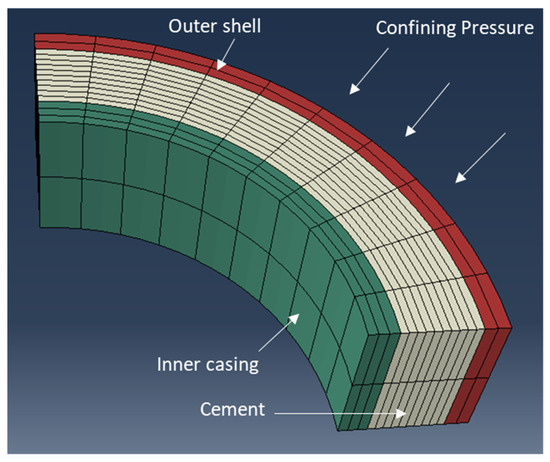
Figure 3.
The geometry of the setup in the numerical model. The model uses a plane strain assumption in the z-direction (equivalent to a 2D geometry).
3. Results
3.1. Experimental Results
The plots of flow rate vs. ΔP from all leak tests are presented in Figure 4, grouped by the BP. The slurry had shrunk by 4.1% during curing. This value is similar to existing data for neat cement [12]. The flow rate measured just after curing (LT 1) was relatively high, as shown in Figure 4a,b, equivalent to an effective of 4 mD. This indicates the potential formation of a microannulus after curing.
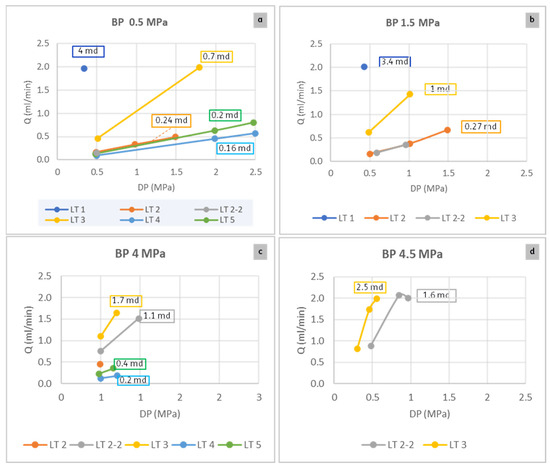
Figure 4.
Plots of leak rate vs. ΔP from all leak tests (LT 1 until LT 5) grouped by the backpressure of 0.5 MPa (a), 1.5 MPa (b), 4 MPa (c), and 4.5 MPa (d). The equivalent k-eff is shown in the text box close to the line graph with the corresponding color coding.
During the first set of thermal cycles (22 cycles), the differential pressure was kept at 0.5 MPa. The evolution of both inflow and outflow rates after every cycle of heating–cooling is shown in Figure 5. If the sample is leak-tight, the inflow and outflow rate should be zero. Since a leak was already detected in LT 1, the flow rate in the first cycle is not zero. With increasing cycles, both inflow and outflow gradually reduce, indicating a reduction in permeability. After completing the thermal cycles, the flow through the sample (LT 2) was measured. The equivalent permeability at BP of 0.5 and 1.5 MPa is ~0.2 mD, which is significantly smaller than the initial permeability. When the leak test was repeated at a higher backpressure of 4 MPa (see Figure 4c), the flow increased, and permeability was equivalent to ~1 mD. Such a significant increase could be evidence of the re-opening of microannulus.
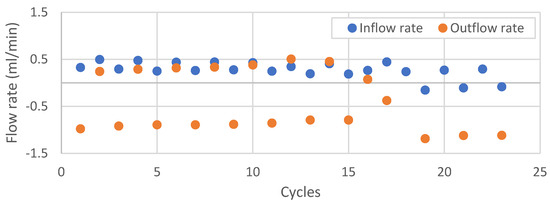
Figure 5.
Inflow and outflow rates after each cycle of thermal heating and cooling performed at backpressure of 0.5 MPa and a differential pressure of 0.5 MPa. The thermal cycle was temporarily stopped after cycle 17. The positive sign means flow into the sample, and the negative sign means flow out from the sample.
Afterward, the backpressure was kept at 4 MPa, and the second set of thermal cycles was performed. A differential pressure of 1 MPa was kept during the cycles. The flow rate after each cycle of heating–cooling is shown in Figure 6. Both inflow and outflow stayed constant at around 1.7 mL/min and −1.6 mL/min, respectively. This response is different from the thermal cycles at low backpressure. The flow through cement after this cycle (LT 3) is higher than the previous cycle (LT 2) but still less than the initial flow rate. The permeability ranges between 0.7–2.5 mD at various backpressures. The reason behind the overall decrease in permeability after the thermal cycles is unclear. This could be due to further cement hydration. However, the initial curing period at elevated temperatures should have been sufficient according to experimental measures of hydration degree [11].
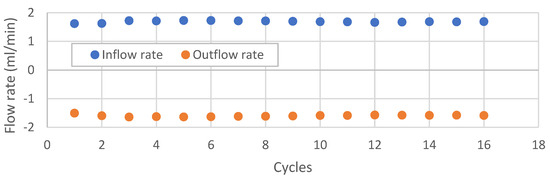
Figure 6.
Inflow and outflow rates after each cycle of thermal heating–cooling performed at a back pressure of 4 MPa and differential pressure of 1 MPa. Lost data communication in cycle 17 (omitted from graph). The positive sign means flow into the sample, and the negative sign means flow out from the sample.
The next step was pressure cycling at a low backpressure of 0.5 MPa. After cycling, the inner casing pressure was kept at 30 MPa, and the measured flow (LT 4) was relatively low, with a permeability of ~0.2 mD. The flow measurement was then repeated at 0 MPa of inner casing pressure, and the effective permeability (LT 5) slightly increased to 0.2–0.4 mD. In a previous experiment (not described here), performing a leak test at high casing pressure caused the radial cracks formed during the pressure cycle to open. This led to an increase in flow. However, this was not observed based on results from LT 4 and 5. Overall, pressure cycling was found to reduce the cement’s permeability. In Figure 4a, the flow after pressure cycles (LT 4 and 5) lies in the same range as those after the first thermal cycle (LT 2).
The post-mortem observations (Figure 7) suggest that the flow through the cement was mainly through the microannulus. The microannulus was mostly concentrated at the outer annulus. There was no clear evidence of radial cracks, which were expected to form during the pressure cycle. During the dye injection, no pressure was applied to the inner casing, which is likely causing the cracks to close and thus limiting the penetration of the dye in the crack. In addition, the dye might be restricted in penetrating micro- to nano-scale cement defects compared to water. The dye adsorption could also reduce the tracing effectivity.
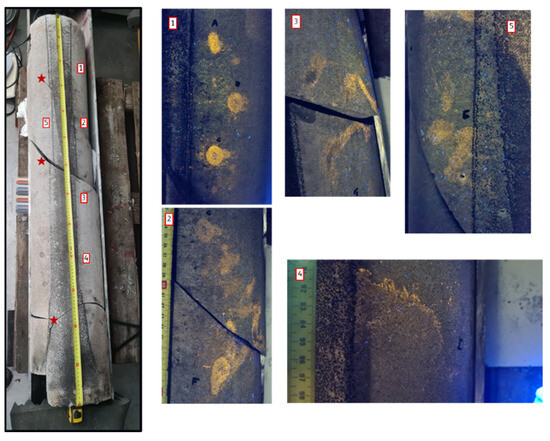
Figure 7.
Visual observations of one side of the cement sheath using the UV light at different locations from top to bottom (indices 1–5). The dye traces (yellow) indicate the leakage pathway. The big cracks pointed out by the star sign are the artificial cracks created when removing the sample.
3.2. Numerical Modeling
We use the modeling results for additional insight into experiments. Modeling provides estimates of cement stress evolution, which controls potential cement failure. Therefore, numerical results can be used to further explain experimental observations and investigate potential failure mechanisms. Figure 8 shows the results of the temperature cycle modeling. The cement’s inner and outer temperatures are plotted against time. The initial temperature of the system is 30 °C. First, the inner casing temperature is lowered to 20 °C and subsequently increased to 80 °C. The outer cement temperature changes with a delay and reaches a smaller magnitude. During the initial cooling period, an inner microannulus opens on the inner interface with a maximum aperture of 10 microns. As the system heats up, the cement expands, and the microannulus closes. When the system starts cooling down by changing the inner casing temperature to 20 °C (equivalent to cold water injection), the microannulus opens to nearly 30 microns. As the temperatures between the inner casing and cement equilibrate, the microannulus gradually closes (depending on the temperature evolution). Therefore, during the temperature cycles, a microannulus can temporarily open on the inner interface during the cooling phase. Hoop stress also changes with the temperature cycles. It becomes tensile during the cooling down period with a maximum of 5 MPa. This magnitude is above the range of cement’s tensile strength (1 to 3 MPa) and may cause radial cracks [13].
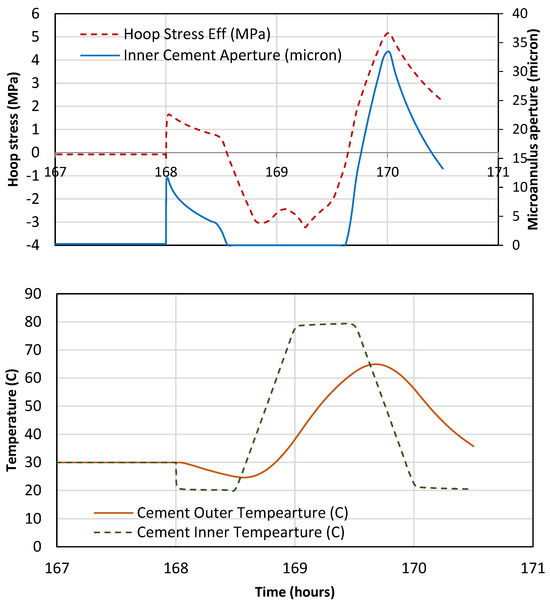
Figure 8.
Cement temperature, hoop stress, and microannulus size during the temperature cycles.
Figure 9 demonstrates the magnitude of the hoop stress in the cement sheath during a pressure cycle from 0 to 30 MPa in the inner casing. The hoop stress (tangential direction) is slightly compressive after curing (negative indicates compressive stress, and positive values indicate tensile stress). During the pressure cycle, the hoop stress increases to nearly 7 MPa of tensile stress. This value surpasses the tensile strength of class G cement, typically in the range of 1 to 3 MPa [13]. Therefore, during the pressure increase in the experiments, we expect radial cracks to open along the cement sheath. Once the pressure drops, the stress drops back to near zero; therefore, there is a possibility of the radial cracks closing. Overall, the modeling shows that in the present system, pressure cycles open radial cracks and temperature cycles open microannuli. However, both are expected to close as the cycle is over.
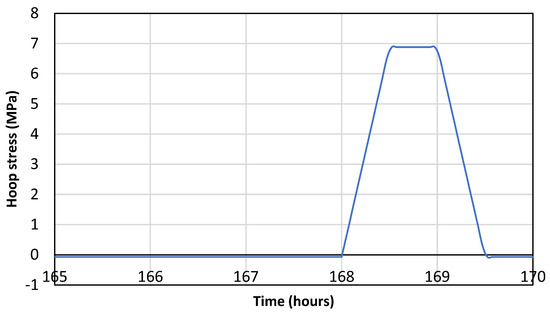
Figure 9.
The magnitude of the hoop stress (tangential direction) during a pressure cycle between 0 and 30 MPa in the inner casing as performed in the experiments.
In order to assess the cyclical stress damage, the stress path at the cement (inner side) is plotted for both the pressure and temperature cycles in Figure 10. The initial size of the yield envelope for cement is also plotted in Figure 10, along with the critical state line [14]. Both the pressure and temperature cycle paths are largely within the elastic region. This indicates no shear failure under the lab conditions. However, cyclical damage may accumulate at levels below the shear capacity. The stress path for the temperature cycles varies over a wide region. Part of this region exceeds the yield envelope on the “dry side” (to the left of the critical state line). This typically leads to dilation and shear cracks and may lead to permeability. However, no significant permeability gain was observed in the lab tests. Based on the present model, it is not clear whether the cyclical damage accumulates or plateaus when a high number of cycles occur.
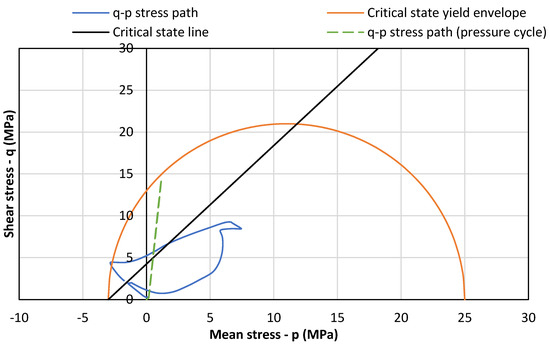
Figure 10.
The stress path in the cement sheath during the pressure and temperature cycles, along with the initial size of the yield envelope from Soustelle et al. (2023) [14]. In this plot, negative indicates tensile stress.
4. Discussion
As cement cures, its pore pressure drops due to hydration reactions, which leads to a change in its stress conditions. In our experiments, the top and bottom of the cement sheath are exposed to water during curing. This leads to water flowing into the cement matrix during curing, which minimizes the pressure drop in cement at both ends of the sample and helps retain the radial stress. Therefore, we anticipate high (total) radial stress at either end of the sample compared to the middle of the cement sheath. The drop in the radial stress is expected to cause the creation of a microannulus as the total stress in the sample drops below the water pressure at the top of the cement. The stress drop has been observed to be higher on the outer interface, which indicates a higher probability of an outer microannulus [11].
In the current experiment, the leakage results from LT 1 show an initial microannulus with an equivalent permeability of 4 mD. This is likely due to the hydration shrinkage of cement and the subsequent pore pressure drop. The post-mortem observation confirms a microannulus at the outer interface. The current experiment also shows that the microannulus size or permeability is also a strong function of the back pressure. Higher backpressure provides the force to push apart the cement and casing interfaces at the microannulus. This indicates that the mere debonding of the cement interface microannulus is not sufficient for leakage to occur. Fluid pressure in the microannulus is also required to keep it open to flow.
Overall, thermal cycles were found to reduce the microannulus size and cement permeability. The mechanism for this is unclear. According to Wolterbeek and Hangx [15], the thermal expansion of cement is likely close to 1.3 × 10⁻⁵ 1/K. This means that the thermal expansion of cement is higher than that of casing. Therefore, as the temperature increases, the cement will expand more than steel. This differential expansion can close the microannulus and even compress the cement. Once the temperature drops, the cement may not return to its initial volume, and some inelastic strains may occur, which would explain the reduction in permeability observed here. We should note that overall, the permeability of the microannulus in this work is fairly low throughout the entire experiment.
The backpressure could provide another explanation. The temperature cycles at a backpressure of 0.5 MPa decrease the equivalent permeability of the system. However, as the backpressure is raised to 4 MPa and the second set of temperature cycling is performed, the flow rate recovers slightly but still less than the initial permeability. The thermal response of an open microannulus with higher fluid pressure is different from that of a closed microannulus. At low backpressure, the microannulus gradually closes with more thermal cycles, as indicated by the flow response in Figure 5. On the other hand, at high backpressure, the microannulus was kept open during the thermal cycles (Figure 6).
The numerical model considers the middle of the cement sheath, ignoring the impact of water pressure at either end of the sample (plane strain). During curing, the pore pressure of cement drops to zero. This reduces the outer interface stress from the initial slurry pressure of 5 to 0.4 MPa (compressive). In reality, the fluid pressure above the cement sheath (5 MPa) will be enough to open the interface. This explains why immediately after curing, a microannulus is already present (likely on the outer interface). During the temperature cycles, the microannulus closes when the cement is heated, but the cooling part of the cycle opens a microannulus on the inner interface. This opening is only temporary and closes as the temperature between the casing and cement equilibrates. The closing of the microannulus during heating and the temporary opening of the microannulus during cooling could not be captured in the experiment. Instead, the steady-state flow was measured after completing the temperature cycles (LT 2 and 3) and not during. The hoop stress values during the temperature cycles in the present experiments can exceed 5 MPa (tensile). This value is higher than the tensile strength of cement. Therefore, the likelihood of sustained damage due to this may be present but did not yield significant continuous damage in the leak tests.
The stress path during the thermal cycles shows a wide range of shear and mean stress. At higher temperatures, the cement compresses, reaching a mean pressure of 7 MPa and shear stress of 9 MPa (Figure 10). This is mostly within the elastic regime. However, during the cooling period, the mean pressure and shear stress reaches −2.5 MPa and 5 MPa, respectively. This point just crosses the yield envelope on the dry side, which points to a dilatative (brittle) failure of cement and should increase permeability. However, as the permeability in the cement sheath did not show a marked increase, we conclude that the damage is likely not well-connected after 39 cycles in this experiment. Kuanhai et al. [11] conducted cyclical experiments on cement under both pressure and temperature conditions and observed permeability generation. However, the range of temperature and pressure in their work was much more extreme, between 30 and 150 °C and 0 to 70 MPa, respectively. The cement sheath length was also half the size of the present setup (0.76 m).
During pressure cycles, the inner casing pressure is raised to 30 MPa. The numerical model indicates hoop stress of 7 MPa (tensile). This value is firmly above the tensile strength of cement and should cause radial tensile cracks. The experimental results show that the cement permeability after pressure cycles remains low, and it is close to the permeability after the first set of thermal cycles (LT 2). In the leak test with 30 MPa casing pressure (LT 4), the crack is deliberately kept open, and yet the permeability stays low. This indicates that the tensile cracks are likely not continuous and have a low overall permeability. When the leak test is repeated with 0 MPa casing pressure (LT 5), the permeability slightly increases. Reducing the casing pressure allows for a bigger microannulus opening. In addition, the pressure cycles further close the gap that originated from thermal cycles at high backpressure (LT 3). Since the pressure cycles are conducted at low backpressure of 0.5 MPa, the increase in casing pressure may squeeze the water out of the microannulus.
In the present experiments, the cement’s permeability from microannulus flow only increased for the case of thermal cycles at higher backpressure, though still not as high as the initial permeability. This indicates that the impact of backpressure may be significant. The effect of backpressure in the field case is akin to the annular casing pressure, assuming the path of the microannuli extends to the wellhead. This means that maintaining a low annular casing pressure can reduce the size of the microannulus and the resulting leakage. In the case of sustained casing pressure, as the pressure increases, the microannulus opens further, which could exacerbate the leakage issue.
5. Conclusions
In this paper, we conducted a large-scale experiment representing a 1.2-m-long cement sheath between two casings to simulate thermal heating–cooling cycles and pressure cycles. The results show a complex picture in terms of cement’s permeability evolution. The cement sheath shows an initial permeability of 4 mD immediately after curing, which indicates a small microannulus. Temperature cycles are found to reduce the size of the microannulus and, in turn, the permeability. In addition, the impact of the thermal cycles seems to be dependent on the back pressure. Higher backpressure overall shows a higher permeability by widening the gap between the casing and cement. The gap also stayed open from high back pressure during the thermal cycle. This simulation of backpressure is similar to the sustained casing pressure at the wellhead. High casing annular pressure at the surface could open the microannulus further and lead to higher leakage rates.
The combination of numerical modeling and experiments adds further insight to the analysis. The numerical results show a high likelihood of tensile cracks during the pressure tests. However, cement’s permeability from the experiment does not increase, which points to a lack of connectivity and permeability in tensile cracks. This is evidence suggesting that well leakage is driven by microannuli rather than tensile cracks. The temperature cycles also show a stress path that should cause dilatative failure during cooling. However, under the mild conditions of the experiments and after 39 thermal cycles, no significant permeability was generated. This indicates that under low-temperature geothermal conditions, cyclical cement damage may be minimal.
Author Contributions
Conceptualization, A.N.C. and A.M.; methodology, A.N.C. and A.M.; software, A.N.C. and A.M.; validation, A.N.C. and A.M.; formal analysis, A.N.C. and A.M.; investigation, A.N.C. and A.M.; data curation, A.N.C. and A.M.; writing—original draft preparation, A.N.C. and A.M.; writing—review and editing, A.N.C. and A.M.; visualization, A.N.C. and A.M.; supervision, A.M.; project administration, A.N.C. and A.M. All authors have read and agreed to the published version of the manuscript.
Funding
This research was funded by the Geothermica project “Sustainable Geothermal Well Cements for Challenging Thermo-Mechanical Conditions (TEST-CEM)”, number 2003184001. The project was subsidized through the Cofund GEOTHERMICA by the DoE (the USA), RVO NL (The Netherlands), and the Research Council of Norway.
Data Availability Statement
The data presented in this study are available on request from the corresponding author.
Acknowledgments
Contributions from our partners Equinor (Norway), SINTEF (Norway), EBN (The Netherlands), Imerys (France), and CURISTEC (France) are greatly acknowledged. We would like to thank Vincent Soustelle, Tatiana Pyatina, and Marcel Naumann for the fruitful scientific and technical discussion.
Conflicts of Interest
The authors declare no conflicts of interest.
References
- Geothermie; DAGO; Warmtenetwerk; EBN. Master Plan Geothermal Energy in The Netherlands: A Broad Foundation for Sustainable Heat Supply. 2018. Available online: https://geothermie.nl/images/bestanden/Masterplan_Aardwarmte_in_Nederland_ENG.pdf (accessed on 6 November 2023).
- NLOG. Natural Resources and Geothermal Energy in The Netherlands: Annual Review 2022. 2023. Available online: https://www.nlog.nl/sites/default/files/2023-09/annual_review_2022_-_natural_resources_and_geothermal_energy_in_the_netherlands.pdf (accessed on 6 November 2023).
- Therond, E.; Bois, A.-P.; Whaley, K.; Murillo, R. Large-Scale Testing and Modeling for Cement Zonal Isolation in Water-Injection Wells. SPE Drill. Complet. 2017, 32, 290–300. [Google Scholar] [CrossRef]
- Goodwin, K.J.; Crook, R.J. Cement Sheath Stress Failure. SPE Drill. Eng. 1992, 7, 291–296. [Google Scholar] [CrossRef]
- De Andrade, J.; Sangesland, S.; Skorpa, R.; Todorovic, J.; Vrålstad, T. Experimental Laboratory Setup for Visualization and Quantification of Cement-Sheath Integrity. SPE Drill. Complet. 2016, 31, 317–326. [Google Scholar] [CrossRef]
- Vrålstad, T.; Skorpa, R.; Opedal, N.; De Andrade, J. Effect of Thermal Cycling on Cement Sheath Integrity: Realistic Experimental Tests and Simulation of Resulting Leakages. In Proceedings of the SPE Thermal Well Integrity and Design Symposium, Banff, AB, Canada, 23–25 November 2015; p. D011S001R002. [Google Scholar]
- De Andrade, J.; Torsæter, M.; Todorovic, J.; Opedal, N.; Stroisz, A.; Vrålstad, T. Influence of Casing Centralization on Cement Sheath Integrity During Thermal Cycling. In Proceedings of the IADC/SPE Drilling Conference and Exhibition, Fort Worth, TX, USA, 4–6 March 2014; p. SPE-168012-MS. [Google Scholar]
- Lin, Y.; Deng, K.; Yi, H.; Zeng, D.; Tang, L.; Wei, Q. Integrity tests of cement sheath for shale gas wells under strong alternating thermal loads. Nat. Gas Ind. B 2020, 7, 671–679. [Google Scholar] [CrossRef]
- Kuanhai, D.; Yue, Y.; Yi, H.; Zhonghui, L.; Yuanhua, L. Experimental study on the integrity of casing-cement sheath in shale gas wells under pressure and temperature cycle loading. J. Pet. Sci. Eng. 2020, 195, 107548. [Google Scholar] [CrossRef]
- Moghadam, A.; Corina, A.N. Modelling Stress Evolution in Cement Plugs During Hydration. In Proceedings of the 56th U.S. Rock Mechanics/Geomechanics Symposium, Santa Fe, NM, USA, 26–29 June 2022; p. ARMA-2022-0966. [Google Scholar]
- Moghadam, A.; Loizzo, M. Cement Integrity Assessment Using a Hydration-Coupled Thermo-Mechanical Model. In Proceedings of the SPE Offshore Europe Conference & Exhibition, Aberdeen, UK, 5–8 September 2023; p. D021S008R004. [Google Scholar]
- Reddy, B.R.; Xu, Y.; Ravi, K.; Gray, D.; Pattillo, P.D. Cement-Shrinkage Measurement in Oilwell Cementing—A Comparative Study of Laboratory Methods and Procedures. SPE Drill. Complet. 2009, 24, 104–114. [Google Scholar] [CrossRef]
- Teodoriu, C.; Amani, M.; Yuan, Z.; Schubert, J.; Kosinowski, C. Investigation of the mechanical properties of Class G cement and their effect on well integrity. Int. J. Eng. 2013, 3, 2305–8269. [Google Scholar]
- Soustelle, V.; Moghadam, A.; Corina, A.N. Modified Cam-Clay Model Parameters for Well-Cement. In Proceedings of the SPE EuropEC—Europe Energy Conference featured at the 84th EAGE Annual Conference & Exhibition, Vienna, Austria, 5–8 June 2023; p. D022S003R005. [Google Scholar]
- Wolterbeek, T.K.T.; Hangx, S.J.T. The thermal properties of set Portland cements—A literature review in the context of CO2 injection well integrity. Int. J. Greenh. Gas Control 2023, 126, 103909. [Google Scholar] [CrossRef]
Disclaimer/Publisher’s Note: The statements, opinions and data contained in all publications are solely those of the individual author(s) and contributor(s) and not of MDPI and/or the editor(s). MDPI and/or the editor(s) disclaim responsibility for any injury to people or property resulting from any ideas, methods, instructions or products referred to in the content. |
© 2024 by the authors. Licensee MDPI, Basel, Switzerland. This article is an open access article distributed under the terms and conditions of the Creative Commons Attribution (CC BY) license (https://creativecommons.org/licenses/by/4.0/).