Abstract
Climate change mitigation, adaptation to intensifying hurricanes, and decarbonization challenges in developing countries emphasize the urgent need for resilient high-voltage grids to facilitate the expansion of renewables. This research explores the technical feasibility of extending the U.S.–Caribbean Super Grid to include the Virgin Islands, Guadeloupe, Martinique, Trinidad and Tobago, Guyana, Suriname, French Guyana, and the northeastern part of Brazil in South America. This proposed extension aims to capitalize on the recent introduction of a new generation of wind turbines certified for operation under strong hurricane forces. The research utilizes modeling and simulation techniques to evaluate the performance of the proposed extension. A method for modeling and estimating spatiotemporal wind power profiles is applied, and the results demonstrate a reduction in maximum wind power variability within the U.S.–Caribbean Super Grid. Depending on the hurricane trajectory, the variability is reduced from 56.6% to less than 43.2%. This reduction takes effect by distributing peak surplus wind power alongside the proposed U.S.–Caribbean–South America Super Grid (UCASG). The research concludes by acknowledging the merits and limitations of the study and discussing potential directions for future research in this field.
1. Introduction
1.1. Background
The expansion of wind power capacity is a prominent energy strategy worldwide to mitigate greenhouse gas emissions and address climate change [1,2]. However, the deployment of wind turbines in regions susceptible to extreme wind forces, such as tropical cyclone-prone areas, has been constrained due to the risk of severe structural damage caused by hurricanes. Consequently, researchers focused on assessing the impact of hurricanes on wind turbines and overhead transmission lines’ integrity [3,4]. Conventional turbines were associated with fragility curves, failure rates, power outages, and losses following hurricane events [5]. Both pre- and post-disaster strategies, mostly at the distribution level, are developed to increase the resilience of power systems under hurricanes [6].
Around 2021, several manufacturers announced the certification of a new generation of wind turbines capable of withstanding hurricanes or typhoons and operating at high cutout speeds [7,8]. After this technological advancement, investigations refocused from damage assessment to more wind power assessment, with turbines designed to withstand hurricanes in combination with large-scale submarine power transmission schemes [7]. In 2023, Itiki et al. developed a spatiotemporal method to estimate the wind power profile of turbines under hurricane conditions and applied this method to a proposed distribution of hurricane-proof turbines in the Caribbean islands, considering various hurricane trajectories. Itiki et al. demonstrated that interconnecting the local grids of the Caribbean islands with the U.S. power grid could reduce local power variability in the Caribbean region by allowing the drainage of surplus peak power to the contiguous U.S. power grid [7].
Expanding beyond the original concept of the U.S.–Caribbean Super Grid, this research proposes an extension of the grid from the U.S. Virgin Islands to the southern islands of the Caribbean (Anguilla, Montserrat, Guadeloupe, Dominica, Martinique, St. Lucia, St. Vincent and the Grenadines, Grenada, and Trinidad and Tobago) and the northern countries of South America (Guyana, Suriname, French Guyana, and Brazil). For simplicity, the Super Grid with this proposed South American extension, termed the U.S.–Caribbean–South American Super Grid, is abbreviated as UCASG. The northeastern part of Brazil boasts strong winds, accounting for 85% of Brazil’s wind power capacity in 2018 [9,10]. Moreover, Brazil lies outside the Atlantic hurricane corridor, according to the hurricane track system of the National Oceanic and Atmospheric Administration (NOAA) [7,11]. This research focuses on the potential benefits of interconnecting the Caribbean region with Brazil’s wind capacity, which is located outside the hurricane corridor.
1.2. Literature Review
In 2019, Muhs and Parvania investigated the impact of hurricane winds on the probability of failure on inland distribution lines. Their focus was on the assessment of damage to distribution lines using 1000 synthetic-generated hurricane scenarios over Houston for 24 h. The percentage of failure in ten distribution lines was estimated [3]. A similar approach was used by Fan et al. in 2023 while assessing the risk reliability of overhead transmission lines under extreme typhoon winds [12]. In 2020, Ghorbanzadeh et al. investigated the impact of hurricane Michael (2018) on the number of power outages reported by residents in the city of Tallahassee [13]. Statistical analysis and maps were used to characterize the outage impact, associating the cause of failure with overhead lines [13]. In contrast, the interconnectivity scheme proposed in this research is for submarine cables, which are not vulnerable to damage caused by hurricane winds.
Accurate wind speed prediction is critical for the expansion of large-scale wind power capacity [14]. In 2020, Zhu et al., while proposing a deep learning method for wind speed forecasting in non-extreme weather, classified the existing methods of wind speed prediction with spatiotemporal correlation into four categories (physical, statistical, probabilistic, and through artificial intelligence) and outlined the physical method as having good performance over longer horizons (from several hours to dozens of hours) despite huge computational burdens and low resolution [14].
In 2020, Yang et al. investigated the power smoothing effect using a dataset-driven set pair analysis algorithm and aggregating several wind farms in China [15]. Despite observing an increasing smoothing effect with higher aggregation of wind power capacity, the investigation was not focused on wind power during hurricanes.
In 2021, Wu et al. proposed a global interconnection of high-voltage power grids on all continents of the world [16]. His study found low power variability in his proposal with hybridization of wind, PV solar, and hydropower but was focused on non-extreme weather events.
1.3. Research Gap and Motivation
In 2023, Itiki et al. proposed a conceptual design for the Caribbean Super Grid, interconnecting Florida, the Bahamas, Cuba, Haiti, Jamaica, the Dominican Republic, Puerto Rico, and the U.S. Virgin Islands [7]. They concluded that the aggregated wind power variability of the Caribbean Super Grid, when impacted by a Category 5 hurricane, would be greatly smoothed with a single interconnection to the contiguous U.S. power grid. However, despite the significant reduction in power variability caused by extreme hurricane forces, a variability of 16.3% is still undesirable for power grid operation. This variability, characterized by strong hurricane wind regimes with power peaks and valleys, would require substantial investments in energy storage. Also, Itiki et al., in 2023, did not provide a solution for the developing countries located in the remaining southern islands of the Caribbean, some of them extremely dependent on fossil fuels for electricity [7].
In 2022, the interconnectivity between the U.S. and South America without integration with the Caribbean was proposed by Hua et al. [1]. However, the extension has never been deeply investigated, considering hurricanes and integration to serve the Caribbean, to the best of the authors knowledge.
1.4. Challenge
To address such a persistent issue, this research proposes an extension of the original Caribbean Super Grid to South America. The major challenge in this research is the collection of sparsely distributed data about existing fossil-based power generation capacity on a multitude of small islands in this southern part of the Caribbean. The future wind power capacity for this region should be designed to phase out the same magnitude of the existing fossil-based power capacity, which is assumed to be sized to serve the existing population demand. The application of the spatiotemporal method for the estimation of wind power profile under hurricanes, to the best of the author’s knowledge, has not been applied in the southern part of the Caribbean.
1.5. Contribution
The contribution of this research is to comprehensively investigate the potential reduction in power variability under the impact of a Category 5 hurricane. The study aims to demonstrate the benefits of interconnecting the Caribbean region with both North and South America, which are expected to have a smoothing effect on peak power surplus under hurricane winds. A future extension of the Caribbean Super Grid would greatly benefit the expansion of renewable wind power capacity with low power variability. This would facilitate the mitigation of greenhouse gas emissions and fossil fuel dependence in this region.
The modeling and simulations are designed to showcase this potential power smoothing effect.
1.6. Paper Organization
The remainder of this paper is organized as follows. Section 2 describes the materials and the spatiotemporal method for estimation of wind power profiles, including modeling of hurricane wind speed, hurricane trajectory, turbine power curves, and the distribution of power generation capacity along the Caribbean Super Grid and South America. Section 3 presents the results of the simulation and analysis of wind power profile variability, and assessment of sustainability. Section 4 presents the discussions on the implications of the work and the topics for future research. Finally, Section 5 draws the conclusions.
2. Materials and Spatiotemporal Method
The materials needed for this study include specific technical publications that played a vital role in establishing accurate input parameters for the modeling process. Modeling of hurricane winds, hurricane trajectories, wind turbine performance, Super Grid interconnection, and establishment of pre-hurricane wind speed conditions are vital steps to proceed with the simulations using the algorithm for estimation of the wind power profile under hurricane conditions.
The method for estimating wind power profiles under hurricanes computes the aggregation of the power profiles of all wind turbines connected to the Super Grid. The transit of power within the Super Grid is a necessary condition for this aggregation. For this reason, the submarine cable needs to first be proven mechanically feasible to be installed in the seabed.
This section shows the criteria to prove the feasibility of the cabling installation on the seabed. It later presents the models, equations, and input parameters employed in the algorithm to estimate the wind power profile within the UCASG under hurricane conditions.
2.1. Technical Feasibility of the Proposed Extension
The technical feasibility of cable installation on the proposed route can be assessed through a bathymetric survey. The South Caribbean region, along the proposed extension route to South America, has water depths not exceeding 2 km [17]. This route adheres to the maximum water depth criterion of 3 km for the feasibility of subsea cabling installation, as observed in similar submarine interconnector projects [7].
2.2. Method for Estimation of Wind Power under Hurricanes
The spatiotemporal method for estimating wind power profiles under hurricanes generates two basic pieces of information: a map showing the user-defined trajectory of the hurricane and the wind turbine allocation; and a wind power profile curve of all simulated turbines. This curve supports the analysis of power variability, aiming to demonstrate the benefits of Super Grids in smoothing power variability. In this research, the method was evolved to also provide first-hand estimates of the potential economic savings achieved through the reduction in fossil fuel power dispatch and the total reduction in carbon dioxide emissions with the implementation of a functional UCASG and hurricane-proof turbines to harvest a Category 5 hurricane passing through two trajectories over the Caribbean.
2.3. Modeling of Hurricane Wind Speed and Shape
Accurate modeling of hurricanes necessitates the processing and storage of various parameters, as presented in Table 1.

Table 1.
Hurricane parameters.
The wind speed of a hurricane () can be estimated by a parametric equation formulated by Holland [18]:
where the parameters and variables are indicated in Table 1. It should be noted that this equation is static in time. The wind speed magnitude felt by the turbine depends on how distant () the eye of the hurricane is from the location of the turbine and the angle of attack () of the hurricane in relation to the turbine. Every hour, the hurricane eye moves, and this distance and angle are updated, and a new instantaneous speed magnitude is attributed to the turbine. The remaining parameters are governed by hurricane physics and are mostly obtained from NOAA [11]. is converted into wind speed at 90-m hub height by [7]: .
According to the National Hurricane Center (NHC), a significant number of hurricanes originate in the Atlantic Ocean, traverse the Caribbean Sea, gain strength over the warm waters of the Gulf of Mexico, and subsequently make landfall in the southern states of the U.S. [7,11]. To capture realistic hurricane conditions, the coordinates of the hurricane eye are associated with a time-dependent translational trajectory, introducing spatiotemporal characteristics into hurricane modeling.
2.4. Modeling of Hurricane Trajectory
The modeling of the hurricane trajectory in space is achieved using a second-order polynomial (parabola) and equations describing the motion of the hurricane eye at a constant translational speed [7]:
where is the spatiotemporal hurricane parabolic trajectory model, in the function of parameters , indicated in Table 2.
Table 2.
Trajectory parameters.
The coefficients ( are calculated by [7]:
The hurricane trajectory at a fixed 1 h step can be iteratively calculated using (7). Assuming knowledge of the translational speed of the hurricane eye from forecasting and considering that the hurricane’s position moves at a fixed angle step , corresponding to a one hour period, the latitude after a fixed angle step can be approximated as [7]:
where , is the angle step of 1 h on the surface of the Earth, and is the latitude of the parabola at time k.
Table 3 provides the parabola coefficients for each trajectory presented in (3)–(6). These coefficients are selected to ensure that the hurricane follows a path across the Caribbean Sea and Gulf of Mexico and makes landfall in the southern states of the U.S., covering most trajectories reported by NOAA [7,11].
Table 3.
Parabola coefficients.
To obtain the parabola coefficients, it is necessary to follow a sequence of five steps:
- (step 1)
- Obtain a map with historical trajectories of hurricanes tracked by NOAA [7,11];
- (step 2)
- By visual inspection of the map, locate the two coordinates of the most western and eastern trajectories of a hurricane initiating over the North Atlantic. The western coordinate point will be assigned to synthetic trajectory #1 and the eastern coordinate point to trajectory #10;
- (step 3)
- Divide the latitudes of points #1 and #10 by 9 to obtain the latitude angle step. This latitude angle step should be added to the latitude of point #1 to estimate the latitudes of trajectory #2 to #9 by successive increments of the latitude angle step. Similarly, calculate the longitude of trajectories #2 to #9 by successive increments of longitude steps. This procedure defines the origin coordinates of the hurricane trajectories in the North Atlantic;
- (step 4)
- By visual inspection of the same map, most of the hurricane’s trajectories have a parabola vertex between Texas and Florida at latitude 30 degrees. Locate the most western and eastern points of historical hurricane trajectories and assign them to vertex points #1 and #10. Calculate the longitude angle step by dividing the angle difference by 9. Obtain the vertex coordinates of parabolic trajectory #2 to #9 by successive increments of the same longitude angle step. This procedure determines the destination vertex coordinates of all ten trajectories;
- (step 5)
- Having the origin and vertex coordinates of parabolic trajectories #1 to #10, using Equation (3) and the equations relating the parabola vertex indicated in (4)–(6), it is possible to find the coefficients a, b, and c of the parabola indicated in Equation (3). These coefficients are indicated in Table 3.
Synthetized trajectories #1 to #10 must visually cover the trajectories band of historical hurricanes from the map made available by NOAA [7,11].
The hurricane model aims at obtaining the wind speed profile of each turbine. A wind turbine model is required to convert a wind speed profile to a power profile.
2.5. Modeling of Wind Turbines
Wind turbines are modeled by their characteristic curve of power versus speed and static parameters [19]:
where is the turbine characteristic model in the function of parameters , as indicated in Table 4. The model M can be defined by a set of equations in [19] or be directly provided by manufacturers through a power performance curve [7].
Table 4.
Wind turbine parameters.
The first three parameters are the positional coordinates of the wind turbine, which are needed to calculate the distance between the turbine and the eye of the hurricane. The last two parameters of Table 4 relate to the electromechanical conversion of wind speed energy into power obtained from wind turbine manufacturers [7].
To complete the power generation subsystem of the Super Grid, it is essential to establish the collective parameters for wind turbines after defining the individual parameters. The spatial distribution and capacity allocation of wind turbines are determined based on their proportionality to the existing fossil fuel power capacity that needs to be replaced. The allocation is performed on a country- or territory-based basis.
Table 5 presents the fossil fuel capacity across the original Caribbean Super Grid, including the U.S. and British Virgin Islands, as defined by Itiki et al. [7].
Table 5.
Fossil fuel capacity over the original Caribbean Super Grid, including the U.S. and British Virgin Islands.
This research focuses on the extension of the Caribbean Super Grid from the British Virgin Islands to the southern islands of the Caribbean and South America. The existing fossil power capacity that needs to be displaced in this new extension is presented in Table 5 and Table 6.
Table 6.
Population, power capacity, and fossil fuel dependence of the Caribbean and South America.
The allocation of wind turbines within the original U.S.–Caribbean SG is determined based on the collective distribution required to replace the fossil fuel capacity outlined in Table 5. This power distribution is the basis for the original topology of the U.S.–Caribbean SG investigated by Itiki et al. [7]. It is observed that the Caribbean countries and territories are extremely highly dependent on fossil fuels, with serious implications for global efforts to cut greenhouse gas emissions. But this is not the only problem with such islands. Another major problem is the high power variability that would emerge with the expansion of wind power capacity on these hurricane-prone islands.
Table 6 shows the additional countries and territories under the coverage of the newly proposed extension of the U.S.–Caribbean SG to South America. Except for Suriname, French Guyana, and Brazil, most of the other countries and territories are also highly dependent on fossil fuels. However, the proposed power grid integration of the U.S.–Caribbean SG to South America aims at reducing even more the overall wind power variability under hurricanes, eliminating the bottleneck for the expansion of wind power capacity in such a region. The distribution of wind turbines for the reduced-scale simulation follows a criterion based on the proportional allocation of installed power capacity in gigawatts. Accordingly, for simulation purposes, the islands of Guadeloupe, Martinique, and Trinidad and Tobago are equipped with one, one, and two turbines, respectively.
The allocation of wind turbines within the extended part of the UCASG, including South America, is determined based on the collective distribution required to replace the fossil fuel capacity outlined in Table 6.
In Suriname, the average wind speed at a height of 30 m experiences seasonal variations, ranging from 8 m/s to 3.5 m/s. During the hurricane season, spanning from 1 June to 30 November, the wind speed fluctuates between 3.5 m/s and 6.5 m/s, with an average of 5 m/s at 30 m height [23]. To simulate wind turbines at a height of 120 m, the average wind speed of 5 m/s at 30 m height can be extrapolated to 5.58 m/s using the logarithm law presented in [9]. Considering the proximity of Guyana and French Guiana to Suriname, wind turbines in these regions are also associated with the pre-hurricane wind speed in Suriname (5.58 m/s). Therefore, one wind turbine is allocated to each of these countries and territories for simulation purposes.
In Brazil, the offshore northeastern coastal area, bounded by latitude 3.36 and −8.73 and longitude −50.61 and −34.44, and with water depths less than 50 m, exhibits an annual average wind speed ranging from 8.19 m/s to 10.36 m/s. At a turbine height of 100 m, the average wind speed is 9.27 m/s [9]. To simulate wind turbines at a height of 120 m, the average wind speed of 9.27 m/s at 100 m can be extrapolated to 9.40 m/s using the logarithm law presented in [9]. This average wind speed is used to represent normal pre-hurricane conditions for offshore wind turbines in northeastern Brazil during simulation. Given the projected wind power capacity of 21 GW in Brazil by 2024 [9], twenty-one turbines are allocated for simulation purposes in Brazil. This proposed Super Grid can be projected to be operationally ready for operation in a couple of years. The wind power capacity was projected to be 21 GW, in reasonable consistency with a constant annual increase of 2.9 GW in the next 7 or more years.
According to ANEEL, the Brazilian Electricity Regulatory Agency, the northeastern states of Brazil currently have a backlog of around 25 GW of wind power capacity in the construction and pre-construction phases [24]. This corroborates the magnitude and consistency of the assumed capacity for simulations in this research.
Figure 1 shows the proposed submarine route of the proposed extension of the U.S.–Caribbean Super Grid to South America. The reason to evaluate the technical feasibility of interconnecting local power grids by submarine cables not exceeding 3 km of water depth is that the algorithm for estimation of wind power profiles executes the aggregation of the power profiles of all turbines. If the local grids are disconnected between themselves, the local power variability cannot be balanced in the entire Super Grid, and each local grid should manage the power variability individually, typically by energy storage or local load management, without resorting to exporting local surplus power to other areas of the Super Grid. This research simulates two aggregation scenarios: (a) with the U.S. power grid interconnected with the Virgin Islands, and (b) with the U.S. power grid interconnected with Brazil.
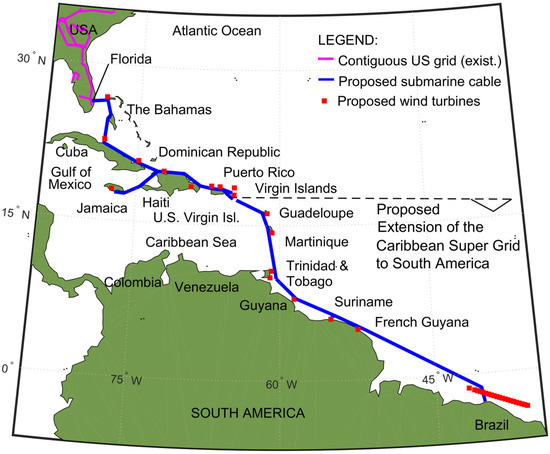
Figure 1.
U.S.–Caribbean Super Grid with a proposed extension to South America.
2.6. Assessment of Sustainable Hurricane Energy
The energy harvested by wind turbines during the hurricane is calculated by [25]:
where is the estimation of the aggregated power profile of the UCASG, is the power in pre-hurricane conditions, and is total hours. The generated energy accounted for by the hurricane excludes the energy that would otherwise be harvested if there were no hurricanes, i.e., in pre-hurricane conditions. This peak energy harvested from the hurricane, assuming the existence of a functional UCASG, can be utilized to reduce the dispatch of fossil-fire generation along the Super Grid. The amount of savings due to the reduction in fossil fuel costs can be calculated by [26]:
where is the energy harvested by wind turbines during the hurricane and LCOE is the levelized cost of energy with the reduction in dispatchable fossil-fired generation. For instance, the LCOE of an open-cycle power plant was typically 175 USD per megawatt-hour in 2019 [27].
The environmental benefit of the reduction in carbon emissions can be estimated by [28]:
where is the energy harvested by wind turbines during the hurricane and is the carbon dioxide emissions rate from a dispatchable fossil-fired generation. For instance, on average, an open-cycle power plant using natural gas emits approximately 0.8335 tons of carbon dioxide per MWh of electricity generated [29].
2.7. Algorithm for Estimation of Wind Power Profile in Super Grids
The algorithm utilized in this study was originally developed by Itiki et al. in 2023 [7]. It was initially presented in the form of a flowchart. This algorithm has been adapted for the specific case study and is represented as a pseudocode depicted in Algorithm 1. The pseudocode has been customized to estimate the wind power profile in the U.S.–Caribbean Super Grid under hurricane conditions, both with and without the extension to South America. The pseudocode implementation takes input parameters and executes the equations and models discussed in previous subsections.
| Algorithm 1 Pseudocode for Wind Power Profile |
| Set all input data for modeling of: |
| • Hurricanes speed and shape (central pressure, and maximum radius) |
| • Hurricane trajectories (origin and vertex of parabola) |
| • Turbines (rated power, power vs wind curve) |
| Select case-study scenario: |
| • Hurricane category (category 5) |
| • Hurricane trajectory (#1 and 7) |
| • Interconnection of Caribbean with South America (with or without) |
| Loop 1: Move hurricane each hour over Caribbeans |
| For i: = 1 to 336 hours (14 days) |
| Loop 2: Track all turbines for each hurricane-step |
| For j: = 1 to number_of_turbines |
| • Move hurricane’s eye 1-hour step on parabola trajectory. |
| • Calculate distance d between hurricane eye and turbine j. |
| • Calculate angle between hurricane front and turbine location. |
| • Obtain the wind speed on turbine location. |
| • Store the sum of wind speed of all turbines in each hour. |
| • Obtain and store the instantaneous turbine power profile. |
| • Store the sum of power profile of all turbines in each hour. |
| End of Loop 2 |
| End of Loop 1 |
| Calculate Energy of Hurricane [MWh] |
| Calculate reduction of cost of fossil energy [$] |
| Calculate CO2 emissions [tons] |
| Plot results: |
| • map of hurricane trajectory |
| • power profile of all turbines. |
The processing phase involves aggregating the power contributions of each wind turbine and considering the entire 14 days duration of the hurricane trajectory in a one hour time step. The algorithm has been implemented in MATLAB, utilizing two main loops: a time loop and a turbine loop. Several other secondary loops are needed for the actual implementation [7]. The main loops enable a comprehensive calculation of the power profile contributed by each turbine throughout the entire duration of the hurricane trajectory.
This proposed pseudocode contains novel improvements that are not present in the original algorithm developed by Itiki et al. in 2023 [7]. The improvements result from the implementation of (9)–(11), notably the assessment of energy harvested from the hurricane forces, the cost reduction in fossil-fired power generation, and the estimation of carbon dioxide.
Such improvements aim at quantifying the aspects of sustainability of wind power capacity expansion enabled by hurricane-proof turbines and supported by the proposed UCASG.
3. Results
The power profile estimation in the U.S.–Caribbean Super Grid is conducted under four scenarios, considering the absence or presence of interconnection with South America, along with two alternative trajectories (#1 and 7). Among these trajectories, trajectory 1 is specifically chosen due to its proximity to the South American coast, which presents the potential for generating peak power in the turbines of Guyana, Suriname, or French Guyana. This simulation does not alter the quantity and location of turbines in the U.S. contiguous power grid, Virgin Islands, or upstream latitude.
The simulations are carried out assuming that the Caribbean Super Grid is connected to the U.S., i.e., in Figure 1, the U.S. power grid is connected to the Bahamas, down to Puerto Rico and the U.S. Virgin Islands (scenarios 1 and 2). In scenarios 3 and 4, in Figure 1, a submarine cable also extends from the U.S. Virgin Islands down to South America, reaching Brazil.
3.1. Scenario 1
Figure 2 illustrates hurricane trajectory 1, which moves towards the Caribbean Sea, the Gulf of Mexico, and the contiguous U.S. The allocation of turbines in red remains consistent with the initial proposal of the U.S.–Caribbean Super Grid, comprising 75 turbines in the contiguous U.S. and 10 turbines in the northern countries of the Caribbean Super Grid [7]. Turbine allocation in South America is not yet included in this figure as there is no interconnection enabling power exchange with South America in this scenario. The hurricane simulation without turbines in South America is a base reference for comparability with the power profile with the extension to South America.

Figure 2.
U.S.–Caribbean Super Grid in trajectory #1 without extension to South America.
Figure 3 illustrates the estimated power profile injected into the U.S.–Caribbean Super Grid by wind turbines impacted by the hurricane. Prior to the hurricane’s impact, the wind power level was estimated to be 198 MW. Notably, the power profile of a hurricane exhibits two peaks. The first peak occurs at 120 h with a magnitude of 240 MW, while the second peak manifests at 260 h, reaching a power level of 557 MW.
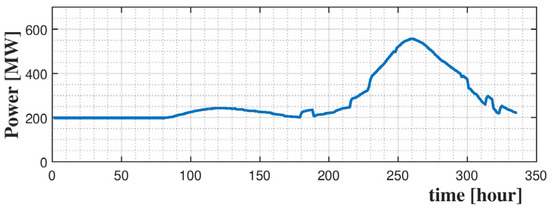
Figure 3.
Estimated power profile in hurricane trajectory 1 without Super Grid extension to South America.
These peaks correspond to the passage of the hurricane over the Caribbean region and, subsequently, over the U.S. Midwest.
3.2. Scenario 2
Figure 4 illustrates hurricane trajectory 7, which moves over several Caribbean islands, the western coast of Florida, and the Southeastern U.S. states. Trajectory 7 is relevant because it produces strong interaction with the proximity of turbines in the Caribbean Islands chain. In 2023, Itiki et al. defined a band of ten hurricane parabolic trajectories covering most historical trajectories of hurricanes over the Caribbean, the Gulf of Mexico, and the contiguous U.S. territory reported by NOAA [7]. This scenario is also a base reference for comparability with the Super Grid extension to South America.
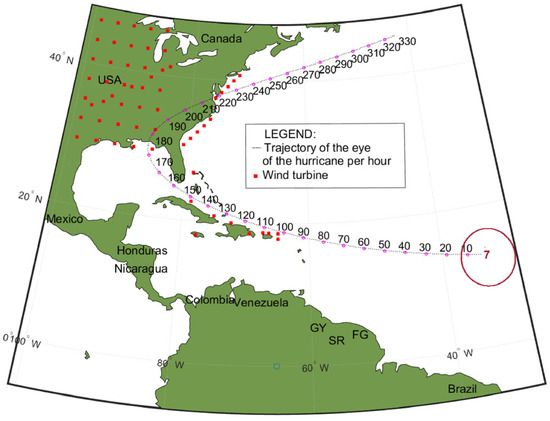
Figure 4.
U.S.–Caribbean Super Grid in trajectory #7 without extension to South America.
Figure 5 depicts the power conditions prior to the hurricane event, with a constant power level of 198 MW until time 80 h. Subsequently, the hurricane winds begin to intensify in the turbines, leading to a local maximum power of 245 MW at time 110 h in the Caribbeans. As the hurricane progresses, the power further increases, reaching a local peak of 456 MW at 200 h after making landfall in West Florida. Power production continues along the East Coast of the U.S. during this period.

Figure 5.
Estimated power profile in hurricane trajectory 7 without Super Grid extension to South America.
3.3. Scenario 3
Figure 6 shows wind turbines allocated in three islands of the Southern part of the Caribbean chain, three turbines in the northern part of South America (Guyana, Suriname, and French Guyana), and 21 turbines in the northeastern part of Brazil, corresponding to the extension of the Caribbean U.S.–Caribbean Super Grid to South America.
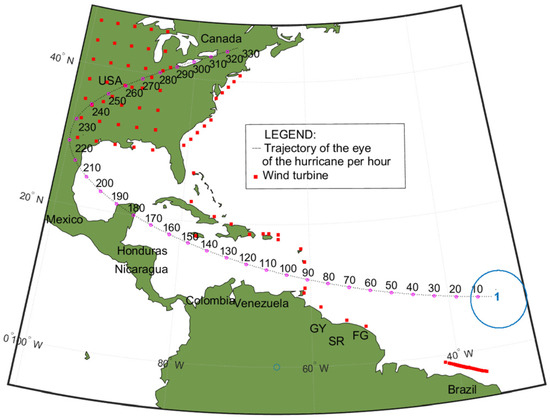
Figure 6.
U.S.–Caribbean Super Grid in trajectory #1 with extension to South America.
Figure 7 shows the power profile of trajectory 1. The wind turbines located in the northern part of South America, specifically in Guyana, Suriname, and French Guyana, contribute to the early ramp-up of wind power.
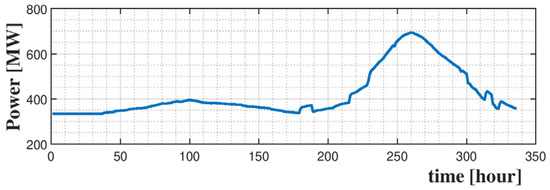
Figure 7.
Estimated power profile in hurricane trajectory 1 crossing the UCASG.
Starting at 335 MW, the power generation begins to ramp-up at time 35 h and gradually increases, reaching a local peak of 400 MW at time 100 h over the Caribbean region. As the hurricane eye approaches Jamaica, there is a local increase in wind power at time 185 h. Afterward, as the hurricane progresses towards Texas, the power ramps-up once again, reaching a local peak of 693 MW at time 260 h in the U.S. Midwest.
3.4. Scenario 4
Figure 8 shows the map of wind turbines in the Caribbean and South America. In this scenario, trajectory 7 is not much in proximity to the wind turbines allocated to South America. This fact has relevant implications for the power profile estimation, as revealed in the subsequent figure.
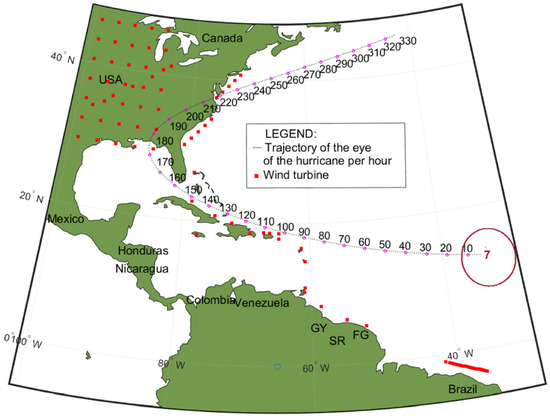
Figure 8.
Wind turbine spatial distribution and hurricane trajectory #7 crossing the UCASG.
Figure 9 illustrates the power profile during different stages of the hurricane. Initially, during pre-hurricane conditions, the power profile remained constant at 335 MW until 60 h. Subsequently, it reaches a local peak of 370 MW at a time of 95 h. After the hurricane reaches Florida at time 185 h, the power profile experiences another ramp-up, reaching a peak of 590 MW at time 200 h. As the hurricane progresses further into the North Atlantic, the power profile gradually diminishes.
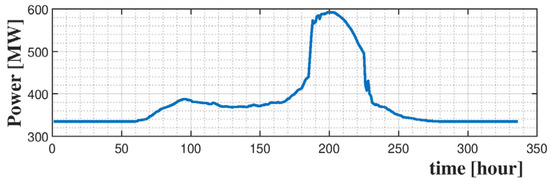
Figure 9.
Estimated power profile in hurricane trajectory 7 crossing the UCASG.
The findings from the simulations encompassing four scenarios demonstrate the power generation capabilities of the U.S.–Caribbean Super Grid under different conditions. In pre-hurricane conditions, the Super Grid produces a total power output of 198 MW. However, with the inclusion of an extension to South America, the power generation capacity is enhanced, resulting in a total output of 335 MW.
This increase in power is primarily attributed to the additional wind turbines installed in the southern islands of the Caribbean (four turbines) and the northern and northeastern coasts of South America (three plus twenty-one turbines).
Significantly, the turbines located on the northern coast of Brazil (21 turbines) contribute substantially to the overall power increase observed during pre-hurricane conditions. These turbines are strategically positioned away from the typical influence of hurricanes, allowing for consistent and reliable power generation. Moreover, in certain trajectories, such as trajectory 1, the turbines in the southern islands of the Caribbean and the northern regions of South America produce an early ramp-up in the power profile, further augmenting the power generation capabilities of the Super Grid.
A comparative analysis gives more insights into the power variability of the Super Grid extension to South America.
3.5. Comparative Analysis between Scenarios
The analysis of the power variability of UCASG is carried out with the same relative indicators defined in [7] to allow comparability of results.
The power variability between the maximum and minimum values is calculated by [7]:
where and are the maximum and minimum values in the power profile curve. The minimum power values, denoted as , are considered in the context of pre-hurricane conditions, as no power levels below this threshold are observed in the simulated scenarios.
Table 7 compares the power variability for the proposed UCASG with and without the extension to South America. The table is divided into two groups of rows, representing the local peak in the Caribbean region and the U.S. Midwest.
Table 7.
Comparative analysis between U.S.–Caribbean Super Grid with and without extension in scenarios #1 to #4.
The offshore wind turbines allocated on the Northeastern Brazilian coast add power capacity to the UCASG, increasing pre-hurricane power levels and smoothing overall percentual power variability. This is possible because the Northeastern Brazilian coast is not normally hit by hurricanes.
This research has important implications for power system design. The reduction in power variability may lead to a decreased need for energy storage, with transmission systems designed to withstand the extra power generated by hurricane-proof turbines. Moreover, for transmission grid operators, the Super Grid can better withstand the peak wind power surplus. The power peak observed in the Caribbean region can be transferred to both the U.S. power grid and the extended South American grid. Notably, the power peak generated by the hurricane in the U.S. Midwest can be directed not only to the Caribbean region but also to South America.
Additionally, the surplus energy generated by hurricane-proof turbines can be utilized to reduce the dispatch of fossil-fired power plants, thereby contributing to a decrease in fuel consumption and greenhouse gas emissions, particularly during the hurricane season.
Table 8 shows the quantification of the reduction in natural gas turbine power cost and carbon emissions in a Super Grid simulated on a reduced scale, where each 10 MW turbine represents 1 GW capacity. For this reason, when extrapolating Table 8 to full-scale, the absolute values on it should be multiplied by a scale factor of 100.
Table 8.
Comparative analysis of the reduction in cost and carbon emissions under Category 5 hurricanes in scenarios #1 to #4.
A Category 5 hurricane has the capacity to generate an estimated 15.40 to 28.9 GWh of energy when harnessed by a UCASG on a reduced scale, utilizing only 113 wind turbines, each with a capacity of 10 MW. When the Super Grid and wind capacity are scaled up to 113 GW, the hurricane can significantly reduce the need for dispatchable operation of gas-fired power plants, effectively saving around 2890 GWh of energy. This reduction not only leads to a substantial decrease in natural gas consumption, amounting to up to USD 510 million in savings but also results in a remarkable decrease in carbon dioxide emissions by 2411 tons for a hurricane in trajectory 1. For a hurricane in trajectory 7 over the Caribbean, the potential savings in full-scale are USD 270 million and an emission reduction of 1282 tons of carbon dioxide. The potential to achieve a significant reduction in greenhouse gas emissions through sustainable means is in alignment with the goals outlined in the Paris Agreement. It is crucial for countries to engage in collaborative efforts and prioritize actions aimed at limiting the global temperature increase to below 1.5 degrees Celsius by effectively reducing greenhouse gas emissions [30]. This urgency is further underscored by the fact that most Caribbean islands currently exhibit a high level of dependence on fossil fuels, exceeding 73%, as shown in Table 5 and Table 6. Therefore, addressing this issue becomes even more relevant and pressing in the contemporaneous context of climate change and global warming [1].
4. Discussion
The contributions and limitations of this research are summarized in this section.
4.1. Contributions of This Work
Beyond the improvements on the previous version of the spatiotemporal method in reference [7], this research investigates the extension of the Caribbean Super Grid from the Virgin Islands to South America, covering 13 countries or territories. Table 6 shows that most of these islands of the South Caribbean face staggering fossil fuel dependence exceeding 90%, threatening the energy security of an additional 4.4 million inhabitants (not even accounting for Brazil). The contribution of this work is certainly extremely relevant from the point of view of someone living in such countries or territories, experiencing routinely dozens of hurricanes every year, depending on fossil fuels, and having no easy means to stop releasing huge amounts of carbon dioxide into the atmosphere to have electricity. The future transition to decarbonization and economic prosperity of these additional countries and islands depends on getting renewable power variability down. These social, economic, and environmental issues are a technical problem for the 13 additional countries and territories addressed by this work.
This research comes with important technical contributions over the previous reference [7] since it estimates CO2 emissions that could be potentially mitigated during hurricane events by using the peak surplus power delivered by hurricane-proof turbines. Hurricane events occur several times every year, potentially increasing the magnitude of the impact of this research. Also, the improved element of the spatiotemporal method comes with an additional algorithm to quantify the potential economic opportunity brought by hurricanes that the previous version of the method in reference [7] was not capable of calculating.
Differently from the previous reference [7], which focused exclusively on the spatiotemporal method presentation, the research includes a proposed extension of the Caribbean Super Grid to the South Caribbean and South America, addressing topics that go beyond electrical power system techniques. This research navigates topics such as energy and the environment, sustainable transition, energy economics, and policy. The quantification of opportunity for carbon dioxide mitigation and the economic return embedded in the algorithm is a critical element for energy policies and budgeting in these additional 13 countries and territories of the South Caribbean and South America.
The multi-year construction of the proposed Super Grid may stimulate a huge investment in both onshore and offshore wind power projects on the northeastern coast of Brazil. The merit of the proposed extension of the Caribbean Super Grid to South America is to provide more energy security among South America and Caribbean countries, opening opportunities for international cooperation.
4.2. Limitations and Topics for Future Research
This spatiotemporal algorithm for wind power estimation under hurricanes does not aim at substituting power flow algorithms. It does not incorporate demand, energy storage, or other sources of energy. This spatiotemporal algorithm focuses exclusively on wind power under specific extreme weather conditions (hurricanes) and assumes all other power subsystems are operating under normal conditions of supply and demand. The spatiotemporal algorithm implemented in MATLAB coding using command lines with control loops has its merits in capturing the physical phenomenon of 14 days of hurricane movement impacting large blocks of wind turbines. In this regard, it captures long-distance dynamics and a multi-hour profile estimation that normal steady-state power flow and microsecond dynamic stability studies do not contemplate. The integration of this spatiotemporal power profile estimation algorithm with a time-series power flow algorithm is a hot topic for future research.
Future research directions may also include the simulation of all ten trajectories of hurricanes, allowing full coverage of the entire hurricane corridor, and an investigation into the negative correlation between PV solar and wind power profiles under hurricanes.
This research is in the initial stages of an investigation of technical feasibility. The proposed extension of the Caribbean Super Grid should be economically feasible in non-hurricane conditions. The economic analysis, estimation of the levelized cost of energy, assessment of environmental impact, the geopolitical risks of grid integration, the governance of the international Super Grid, and the overall implications for the economic development and prosperity of the Caribbean countries are topics for future investigation.
5. Conclusions
This research investigated the technical feasibility of extending the U.S.–Caribbean Super Grid to South America to leverage hurricane-proof wind turbines and reduce wind power variability in hurricane-prone areas.
The results demonstrated that the UCASG has the potential to reduce wind power variability during hurricanes. Depending on the hurricane trajectory, the variability was reduced from 19.18% to 9.46% in the Caribbean and from 56.58% to less than 43.22% in the U.S. Midwest. In other words, the proposed UCASG would function similarly to a large-scale energy storage system, mitigating power variability by peak shaving and valley filling. The reduction in power variability in the Caribbean is credited to the interconnection with additional wind power capacity in South America. Wind turbines in South America produce stable power because they are outside the hurricane corridor and are capable of partially absorbing the Caribbean hurricane power surge.
The introduction of new features in the spatiotemporal method has enhanced the ability to evaluate the sustainability of hurricane harvesting in terms of potential natural gas savings and carbon dioxide reduction for power utility companies.
In conclusion, this research contributes to knowledge and scientific novelty by proposing the extension of the U.S.–Caribbean Super Grid to South America, assessing its technical feasibility, demonstrating the potential reduction in wind power variability, and quantifying economic and environmental opportunities. The findings support the development of a resilient and interconnected energy infrastructure in hurricane-prone regions, enabling the expansion of wind power capacity and promoting sustainable energy strategies. The techno-economic, environmental, and geopolitical feasibility of the proposed UCASG in non-hurricane conditions is a potential topic for investigation in future studies.
Author Contributions
Conceptualization, R.I., M.M. and S.G.D.S.; methodology, R.I.; software, R.I.; validation, M.M. and S.G.D.S.; formal analysis, R.I.; investigation, R.I.; resources, M.M. and S.G.D.S.; data curation, R.I.; writing—original draft preparation, R.I.; writing—review and editing, R.I., M.M. and S.G.D.S.; visualization, M.M.; supervision, M.M. and S.G.D.S.; project administration, M.M.; funding acquisition R.I. All authors have read and agreed to the published version of the manuscript.
Funding
This research received no external funding.
Data Availability Statement
Data are contained within the article.
Conflicts of Interest
The authors declare no conflicts of interest.
References
- Hua, H.; Qin, Z.; Dong, N.; Qin, Y.; Ye, M.; Wang, Z.; Chen, X.; Cao, J. Data-Driven Dynamical Control for Bottom-up Energy Internet System. IEEE Trans. Sustain. Energy 2022, 13, 315–327. [Google Scholar] [CrossRef]
- Relva, S.G.; da Silva, V.O.; Gimenes, A.L.V.; Udaeta, M.E.M.; Ashworth, P.; Peyerl, D. Enhancing developing countries’ transition to a low-carbon electricity sector. Energy 2021, 220, 119659. [Google Scholar] [CrossRef]
- Muhs, J.W.; Parvania, M. Stochastic Spatio-Temporal Hurricane Impact Analysis for Power Grid Resilience Studies. In Proceedings of the 2019 IEEE Power & Energy Society Innovative Smart Grid Technologies Conference (ISGT), Washington, DC, USA, 18–21 February 2019; pp. 1–5. [Google Scholar] [CrossRef]
- Watson, E.B.; Etemadi, A.H. Modeling Electrical Grid Resilience Under Hurricane Wind Conditions With Increased Solar and Wind Power Generation. IEEE Trans. Power Syst. 2020, 35, 929–937. [Google Scholar] [CrossRef]
- Kwasinski, A. Effects of Hurricane Maria on Renewable Energy Systems in Puerto Rico. In Proceedings of the 2018 7th International Conference on Renewable Energy Research and Applications (ICRERA), Paris, France, 14–17 October 2018; pp. 383–390. [Google Scholar] [CrossRef]
- Papari, B.; Edrington, C.S.; Ghadamyari, M.; Ansari, M.; Ozkan, G.; Chowdhury, B. Metrics Analysis Framework of Control and Management System for Resilient Connected Community Microgrids. IEEE Trans. Sustain. Energy 2022, 13, 704–714. [Google Scholar] [CrossRef]
- Itiki, R.; Manjrekar, M.; Di Santo, S.G.; Itiki, C. Method for spatiotemporal wind power generation profile under hurricanes: U.S.-Caribbean super grid proposition. Renew. Sustain. Energy Rev. 2023, 173, 113082. [Google Scholar] [CrossRef]
- Chen, Y.T.; Knüpfer, K.; Esteban, M.; Shibayama, T. Analysis of the impact of offshore wind power on the Japanese energy grid. AIMS Energy 2023, 11, 110–134. [Google Scholar] [CrossRef]
- Silva, A.R.; Pimenta, F.M.; Assireu, A.T.; Spyrides, M.H.C. Complementarity of Brazil’s hydro and offshore wind power. Renew. Sustain. Energy Rev. 2016, 56, 413–427. [Google Scholar] [CrossRef]
- Paula, M.; Marilaine, C.; Nuno, F.J.; Wallace, C. Predicting Long-Term Wind Speed in Wind Farms of Northeast Brazil: A Comparative Analysis Through Machine Learning Models. IEEE Lat. Am. Trans. 2020, 18, 2011–2018. [Google Scholar] [CrossRef]
- U.S. Department of Commerce. National Weather Service, North Atlantic Hurricane Tracking Chart 2020. Available online: https://www.nhc.noaa.gov/data/tracks/tracks-at-2020.png (accessed on 8 October 2023).
- Fan, R.; Zeng, W.; Ming, Z.; Zhang, W.; Huang, R.; Liu, J. Risk Reliability Assessment of Transmission Lines under Multiple Natural Disasters in Modern Power Systems. Energies 2023, 16, 6548. [Google Scholar] [CrossRef]
- Ghorbanzadeh, M.; Koloushani, M.; Ulak, M.B.; Ozguven, E.E.; Jouneghani, R.A. Statistical and Spatial Analysis of Hurricane-induced Roadway Closures and Power Outages. Energies 2020, 13, 1098. [Google Scholar] [CrossRef]
- Zhu, Q.; Chen, J.; Shi, D.; Zhu, L.; Bai, X.; Duan, X.; Liu, Y. Learning Temporal and Spatial Correlations Jointly: A Unified Framework for Wind Speed Prediction. IEEE Trans. Sustain. Energy 2020, 11, 509–523. [Google Scholar] [CrossRef]
- Yang, M.; Zhang, L.; Cui, Y.; Zhou, Y.; Chen, Y.; Yan, G. Investigating the Wind Power Smoothing Effect Using Set Pair Analysis. IEEE Trans. Sustain. Energy 2020, 11, 1161–1172. [Google Scholar] [CrossRef]
- Wu, C.; Zhang, X.-P.; Sterling, M.J.H. Global Electricity Interconnection With 100% Renewable Energy Generation. IEEE Access 2021, 9, 113169–113186. [Google Scholar] [CrossRef]
- Chacón-Barrantes, S.; López-Venegas, A.; Sánchez-Escobar, R.; Luque-Vergara, N. A Collaborative Effort Between Caribbean States for Tsunami Numerical Modeling: Case Study CaribeWave15. Pure Appl. Geophys. 2018, 175, 1405–1428. [Google Scholar] [CrossRef]
- Holland, G.J. An Analytic Model of the Wind and Pressure Profiles in Hurricanes. Mon. Weather. Rev. 1980, 108, 1212–1218. [Google Scholar] [CrossRef]
- Naderi, E.; Pourakbari-Kasmaei, M.; Lehtonen, M. Transmission expansion planning integrated with wind farms: A review, comparative study, and a novel profound search approach. Int. J. Electr. Power Energy Syst. 2020, 115, 105460. [Google Scholar] [CrossRef]
- U.S. Department of Energy. Anguilla Energy Snapshot, National Renewable Energy Laboratory. May 2020. Available online: https://www.energy.gov/eere/articles/anguilla-island-energy-snapshot-2020 (accessed on 8 October 2023).
- Central Intelligence Agency. The World Factbook—Explore All Countries. Available online: https://www.cia.gov/the-world-factbook/countries/ (accessed on 8 October 2023).
- Rakotoson, V.; Praene, J.P. A life cycle assessment approach to the electricity generation of French overseas territories. J. Clean. Prod. 2017, 168, 755–763. [Google Scholar] [CrossRef]
- Sterl, S.; Donk, P.; Willems, P.; Thiery, W. Turbines of the Caribbean: Decarbonising Suriname’s electricity mix through hydro-supported integration of wind power. Renew. Sustain. Energy Rev. 2020, 134, 110352. [Google Scholar] [CrossRef]
- Agencia National de Energia Eletrica, Matrix Eletrica Brasileira (Brazilian Energy Matrix). Available online: https://app.powerbi.com/view?r=eyJrIjoiNjc4OGYyYjQtYWM2ZC00YjllLWJlYmEtYzdkNTQ1MTc1NjM2IiwidCI6IjQwZDZmOWI4LWVjYTctNDZhMi05MmQ0LWVhNGU5YzAxNzBlMSIsImMiOjR9 (accessed on 24 November 2023).
- Chapman, S.J. Electric Machinery Fundamentals; McGraw-Hill: New York, NY, USA, 2004. [Google Scholar]
- Aldersey-Williams, J.; Rubert, T. Levelised cost of energy—A theoretical justification and critical assessment. Energy Policy 2019, 124, 169–179. [Google Scholar] [CrossRef]
- Shafiullah, M.; Ahmed, S.D.; Al-Sulaiman, F.A. Grid Integration Challenges and Solution Strategies for Solar PV Systems: A Review. IEEE Access 2022, 10, 52233–52257. [Google Scholar] [CrossRef]
- Mletzko, J.; Ehlers, S.; Kather, A. Comparison of Natural Gas Combined Cycle Power Plants with Post Combustion and Oxyfuel Technology at Different CO2 Capture Rates. Energy Procedia 2016, 86, 2–11. [Google Scholar] [CrossRef]
- Kaloti, S.; Kamal, F.; Al Mamun, A.; Chowdhury, B. Is Achieving Net-Zero Carbon Emissions Possible for Electric Utilities with Current Technology? In Proceedings of the 2021 North American Power Symposium (NAPS), College Station, TX, USA, 14–16 November 2021; pp. 1–6. [Google Scholar] [CrossRef]
- Zhang, Y.; Cheng, V.; Mallapragada, D.S.; Song, J.; He, G. A Model-Adaptive Clustering-Based Time Aggregation Method for Low-Carbon Energy System Optimization. IEEE Trans. Sustain. Energy 2023, 14, 55–64. [Google Scholar] [CrossRef]


Disclaimer/Publisher’s Note: The statements, opinions and data contained in all publications are solely those of the individual author(s) and contributor(s) and not of MDPI and/or the editor(s). MDPI and/or the editor(s) disclaim responsibility for any injury to people or property resulting from any ideas, methods, instructions or products referred to in the content. |
© 2024 by the authors. Licensee MDPI, Basel, Switzerland. This article is an open access article distributed under the terms and conditions of the Creative Commons Attribution (CC BY) license (https://creativecommons.org/licenses/by/4.0/).