Article

Multi-Scale Characterization of Porosity and Cracks in Silicon Carbide Cladding after Transient Reactor Test Facility Irradiation

1
Idaho National Laboratory, Idaho Falls, ID 83415, USA
2
General Atomics, San Diego, CA 92121, USA
3
Ultra Safe Nuclear Corporation, Seattle, WA 98199, USA
4
Los Alamos National Laboratory, Los Alamos, NM 87545, USA
*
Authors to whom correspondence should be addressed.
Energies 2024, 17(1), 197; https://doi.org/10.3390/en17010197
Submission received: 25 October 2023 / Revised: 4 December 2023 / Accepted: 6 December 2023 / Published: 29 December 2023

Abstract

:
Silicon carbide (SiC) ceramic matrix composite (CMC) cladding is currently being pursued as one of the leading candidates for accident-tolerant fuel (ATF) cladding for light water reactor applications. The morphology of fabrication defects, including the size and shape of voids, is one of the key challenges that impacts cladding performance and guarantees reactor safety. Therefore, quantification of defects’ size, location, distribution, and leak paths is critical to determining SiC CMC in-core performance. This research aims to provide quantitative insight into the defect’s distribution under multi-scale characterization at different length scales before and after different Transient Reactor Test Facility (TREAT) irradiation tests. A non-destructive multi-scale evaluation of irradiated SiC will help to assess critical microstructural defects from production and/or experimental testing to better understand and predict overall cladding performance. X-ray computed tomography (XCT), a non-destructive, data-rich characterization technique, is combined with lower length scale electronic microscopic characterization, which provides microscale morphology and structural characterization. This paper discusses a fully automatic workflow to detect and analyze SiC-SiC defects using image processing techniques on 3D X-ray images. Following the XCT data analysis, advanced characterizations from focused ion beam (FIB) and transmission electron microscopy (TEM) were conducted to verify the findings from the XCT data, especially quantitative results from local nano-scale TEM 3D tomography data, which were utilized to complement the 3D XCT results. In this work, three SiC samples (two irradiated and one unirradiated) provided by General Atomics are investigated. The irradiated samples were irradiated in a way that was expected to induce cracking, and indeed, the automated workflow developed in this work was able to successfully identify and characterize the defects formation in the irradiated samples while detecting no observed cracking in the unirradiated sample. These results demonstrate the value of automated XCT tools to better understand the damage and damage propagation in SiC-SiC structures for nuclear applications.

1. Introduction

Accident-tolerant fuels (ATF) are being developed to improve the tolerance of fuel to severe accident conditions such as loss-of-coolant accidents (LOCA) or reactivity-initiated accidents (RIA) [1]. In nuclear reactors, cladding is the thin-walled tube that forms the outer jacket of a nuclear fuel rod. It is the critical barrier between the fuel and the reactor coolant and provides structural support to the fuel while retaining fission products. Much research has been conducted to design different potential fuel systems to meet the desirable attributes of ATF systems, including zirconium (Zr) alloy cladding with improved high temperature oxidation resistance and/or strength, non-Zr cladding with high strength and oxidation resistance, and alternative fuel forms [2]. To understand the effects of a new alternative chromium (Cr)-coated Zr alloy cladding material on thermal neutron parameters, Alrwashdeh et al. focused on the neutronics evaluation and comparison between zircaloy- and chromium-coated fuel-cladding systems by performing various assemblies and two-dimensional reactor cores for both Zr-U and Zr-Cr-U fuel-cladding systems under different coating thicknesses [3]. However, the performance of fuel systems based on Zr alloy cladding has already been highly optimized over decades, and further performance improvements have been investigated. Dramatic improvements in accident tolerance were unlikely to be achieved by incremental changes in Zr alloy cladding [2].
Silicon carbide fiber, a silicon carbide matrix (SiC-SiC) composite material, consisting of a woven layer of nuclear-grade SiC fibers overcoated by chemical vapor infiltration (CVI), is being investigated as one of the cladding material candidates for ATF because of its outstanding physical and chemical properties [4]. SiC ceramic matrix composites (CMCs) have excellent high-temperature oxidation properties, superior irradiation resistance, inherent low activation, and other superior physical/chemical properties [5,6]. However, SiC exhibits nonlinear damaging mechanical behavior governed by microcracking within the material under different conditions, such as the stress state induced during irradiation, pellet cladding mechanical interaction (PCMI) failure under RIA, or other transient conditions in which micro-cracks can develop, thus creating a challenge to maintaining hermeticity [7,8,9,10,11,12].
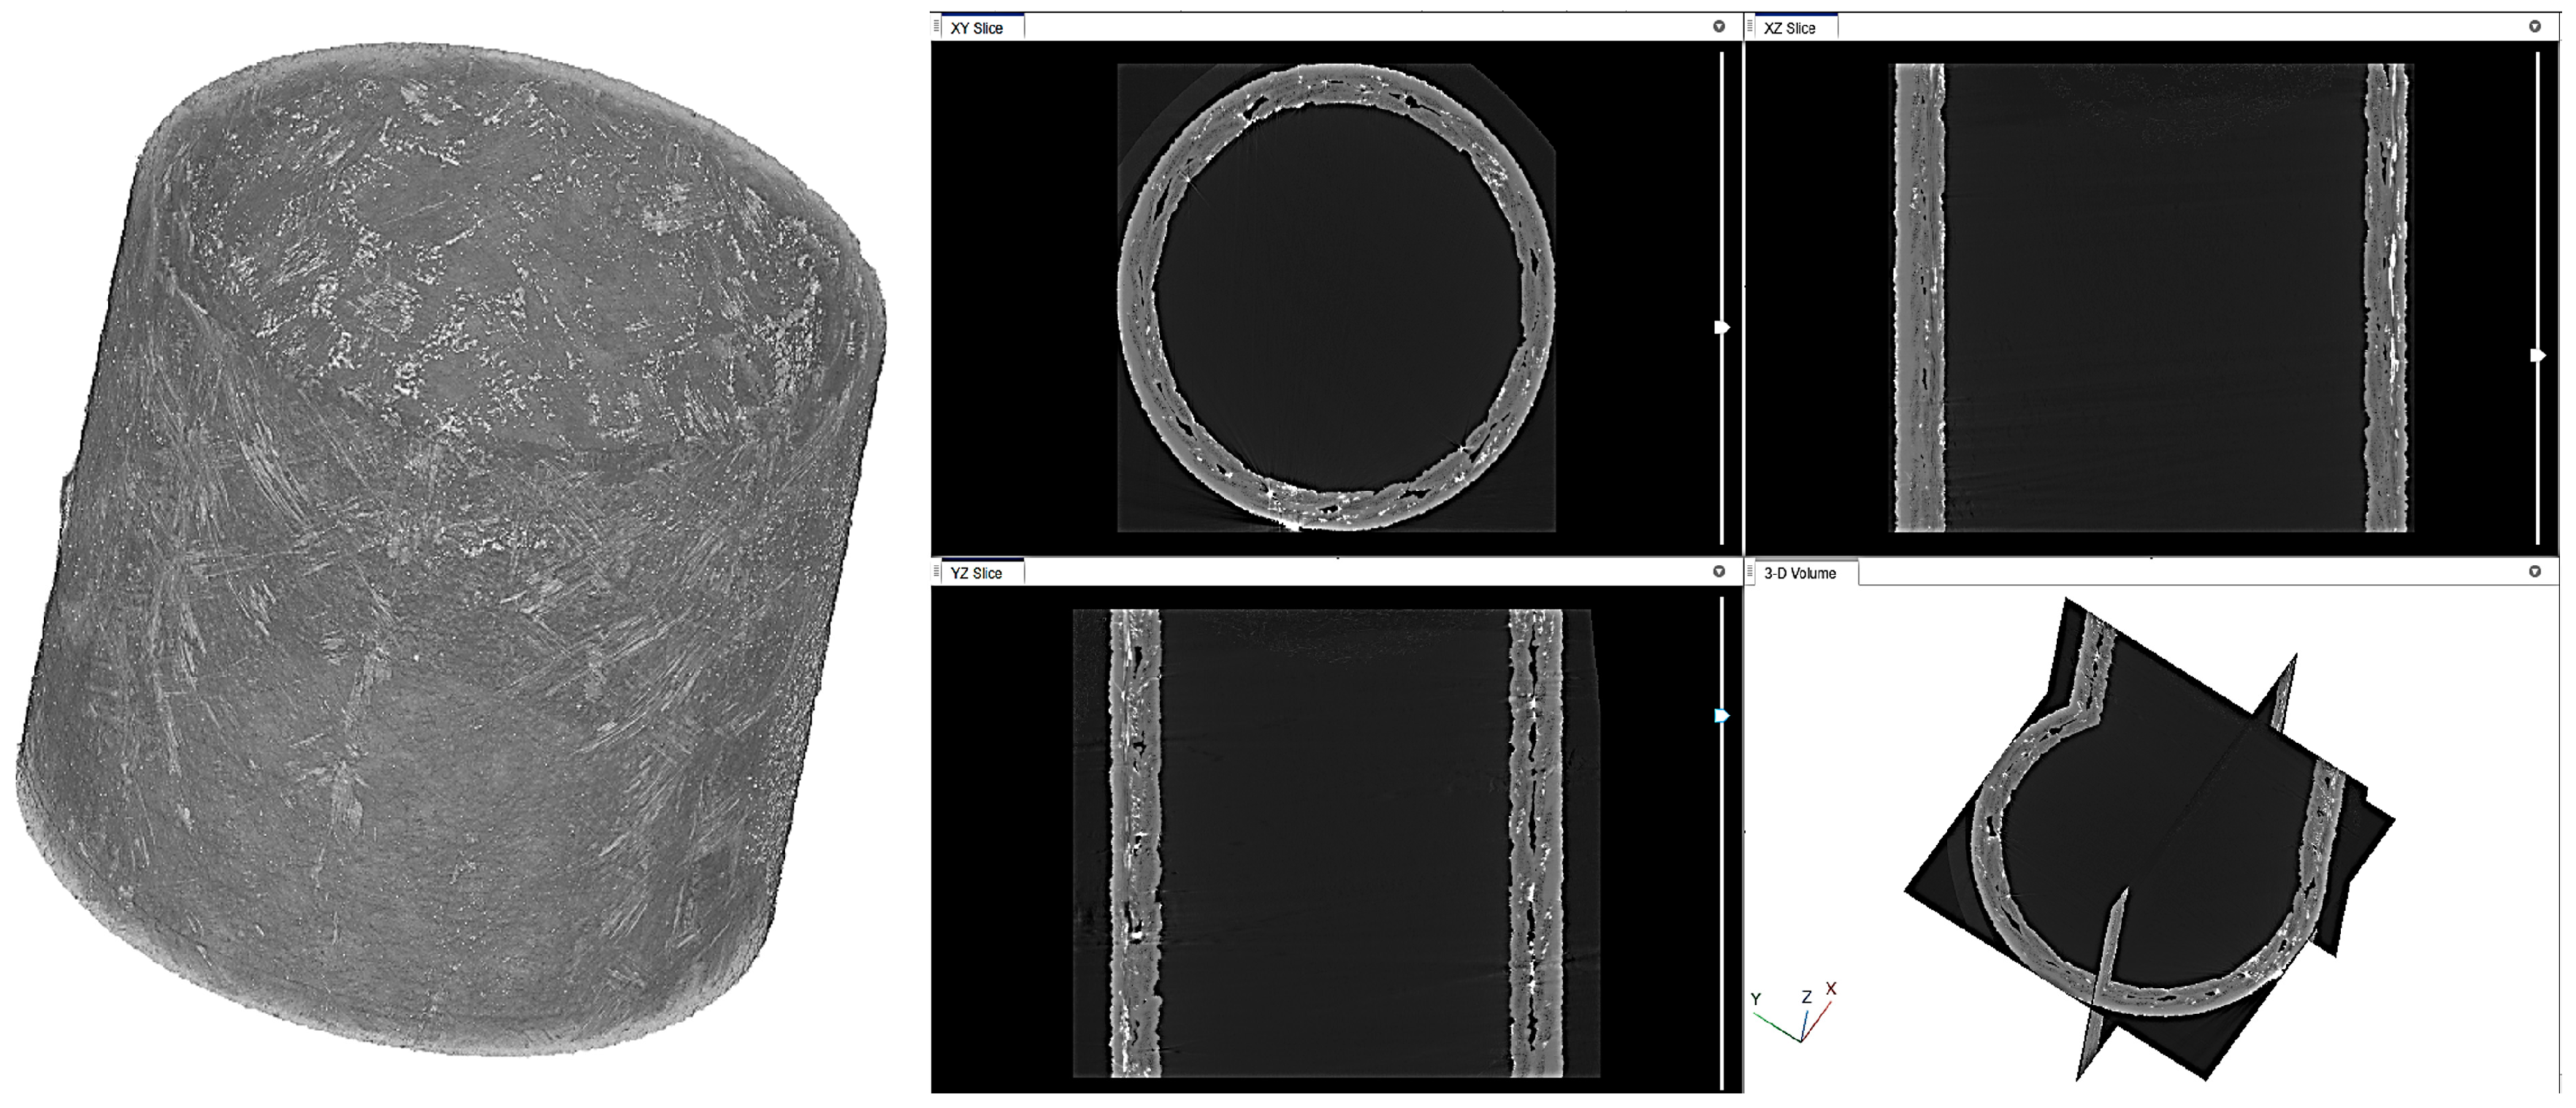
To design an optimal SiC structure, it is essential to understand the relationship between the damage mechanisms and the microstructure of the SiC CMC material. Microcracking is one of the key challenges that impacts cladding performance and guarantees reactor safety. Therefore, quantitative evaluation of crack formation and leak paths is critical to determining SiC CMC in-core performance. Microcracks are numerous microstructural features on the material surfaces and subsurface that spread over the cladding at different scales, as shown in Figure 1a–c. Currently, destructive 3D analysis like 3D thinning scanning electron microscopy (SEM) and transmission electron microscopy (TEM) is the best method for obtaining micro-crack data from samples. To obtain 3D SEM data, the sample is thinned by the high-energy focused ion beam (FIB), which is destructive, and the effect of the beam is accounted for during further performance evaluations. 3D TEM can provide much more accurate quantitative analysis by producing higher resolution than SEM and XCT. However, TEM characterization only works on a very small sample of a few microns. This highlights the need for improved non-destructive evaluation techniques optimized for micro-crack evaluation and its understanding. To address this challenge, the Material Fuel Complex (MFC) of Idaho National Laboratory (INL) has developed post-irradiation examination capabilities to collect non-destructive, 3D microstructural data using a ZEISS Xradia 520 Versa X-ray microscope (Figure 1d). This system is used to acquire a wide range of microstructural data over a wide length scale (102–10−2 cm) and can capture both the surface and interior material structure in 3D [13]. This is accomplished by taking hundreds of X-ray images of a sample of interest as a function of sample rotation. Then, the 3D reconstruction process constructs 3D images in a composed stack of material cross-section 2D radiographs. These high-resolution 3D models are then used to explore the sample’s architecture and microstructure, allowing for better determination of the sample’s condition and an improved understanding of how the material performs [13,14,15]. Coupled with in situ micro-XCT, Croom et al. investigated the three-dimensional damage and stress redistribution mechanisms of braided SiC-SiC composites [16]. Singh et al. utilized XCT to confirm the existing cracks, which were detected using resonant ultrasound spectroscopy [17]. Yuan et al. have analyzed the toughening mechanism in the deformation and fracture processes using in situ, real-time 3D XCT data at room temperature and 1200 °C [18]. Significant findings, including crack deflection, micro-cracking behaviors, etc., were obtained about toughening mechanisms under different conditions in this study. However, accurate and quantitative analysis of the microcrack and micropores on the SiC-SiC tube is still lacking.
In this paper, a fully automatic workflow was developed to detect and analyze defects using image processing techniques on 3D X-ray images. Porosity analysis from multi-scale, including engineering scale XCT data. and advanced microstructure characterization from scanning electron microscopy (SEM) and transmission electron microscopy (TEM) instruments, was used to verify the conclusions.

2. Methods

2.1. Experimental Data

Idaho National Laboratory (INL) is the leading national laboratory in the United States for research and development on nuclear fuel. This research spans multiple fuel forms and post-irradiation characterization. Modern experiment instruments were employed to perform transient irradiation testing of advanced fuels, including ATFs, at the TREAT facility, along with the irradiated samples that were used in this work. The materials and irradiation parameters of two irradiated fuel rodlets (SETH-H and SETH-I) with SiC-SiC cladding are shown in Table 1. SETH-H was noted as SETH-H, and SETH-I was noted as SETH-I in the previous study [19,20]. The SiC tubes of the two samples have inner and outer diameters of 8.001 ± 0.076 and 9.652 ± 0.076 mm, respectively. The melt temperature for SiC is ~2818 K (~2445 °C) [21,22]. The two irradiated samples illustrated the thermal mechanical responses of SiC cladding at high temperatures in transient conditions. SETH-H received a higher energy deposition when compared to SETH-I. To evaluate pellet-cladding mechanical interaction, SETH-I was designed with a smaller pellet/cladding gap with the intent of using the thermal expansion of the fuel to provide a rapid strain displacement load on the cladding [19,20]. The stress direction of the two samples is the hoop direction since 0% axial strain replacement was measured [19]. Pre- and post-transient dimensional measurements showed that the rodlet of SETH-H had a maximum positive diametral strain displacement of ~0.55% near the upper region, while SETH-I had a higher strain displacement of ~0.65%. Both strains were beyond 0.32%, a strain level predicted in Kamerman et al. [20], which would be adequate to initiate cracks in the outer surface of the cladding and allow for crack propagation through the cladding wall. Visual inspection revealed that the two irradiated samples maintained rod-like geometries at high temperatures, and optical microscopy of the sample revealed larger pores in the fuels. The fresh sample is a General Atomics SiC-SiC cladding material without fuel.

2.2. Engineering-Scale Characterization

Non-destructive 3D imaging was performed using the ZEISS Xradia 520 Versa X-ray microscope (Carl Zeiss X-ray Microscopy Inc., Dublin, CA, USA) at INL’s Irradiated Materials Characterization Laboratory (IMCL) of Materials and Fuels Complex (MFC). The Nordson DAGE tungsten X-ray source (Aylesbury, UK) was operated with a proprietary high-energy filter, 110.9 kVp accelerating voltage, and 111.7 µA target current. The XCT scanning parameters, such as the linear and rotation stages, source and detector positions, camera acquisition, and X-ray source, were set using Scout-and-Scan Control System software (version 14.0.16046). All projection radiographs were acquired over 360 degrees of sample rotation, and each radiograph had an average of 20 image frames. The frame size was 3024 by 3064 pixels. During the data collection, corresponding algorithms were provided by the instrumental software from ZEISS Xradia 520 VersaX-ray microscope and employed to correct the sample-/stage-drift, alignment, and reduce the ring artifact. The collected raw data and reconstructed data were saved as 16-bit Tag Image File Format (TIFF) images. The total imaging time was ~4 h for each sample with ~35 GB of raw data and another ~35 GB of reconstructed images. The reconstructed 3D view of SETH-H is shown in Figure 2. Additional details are listed in Table 2.
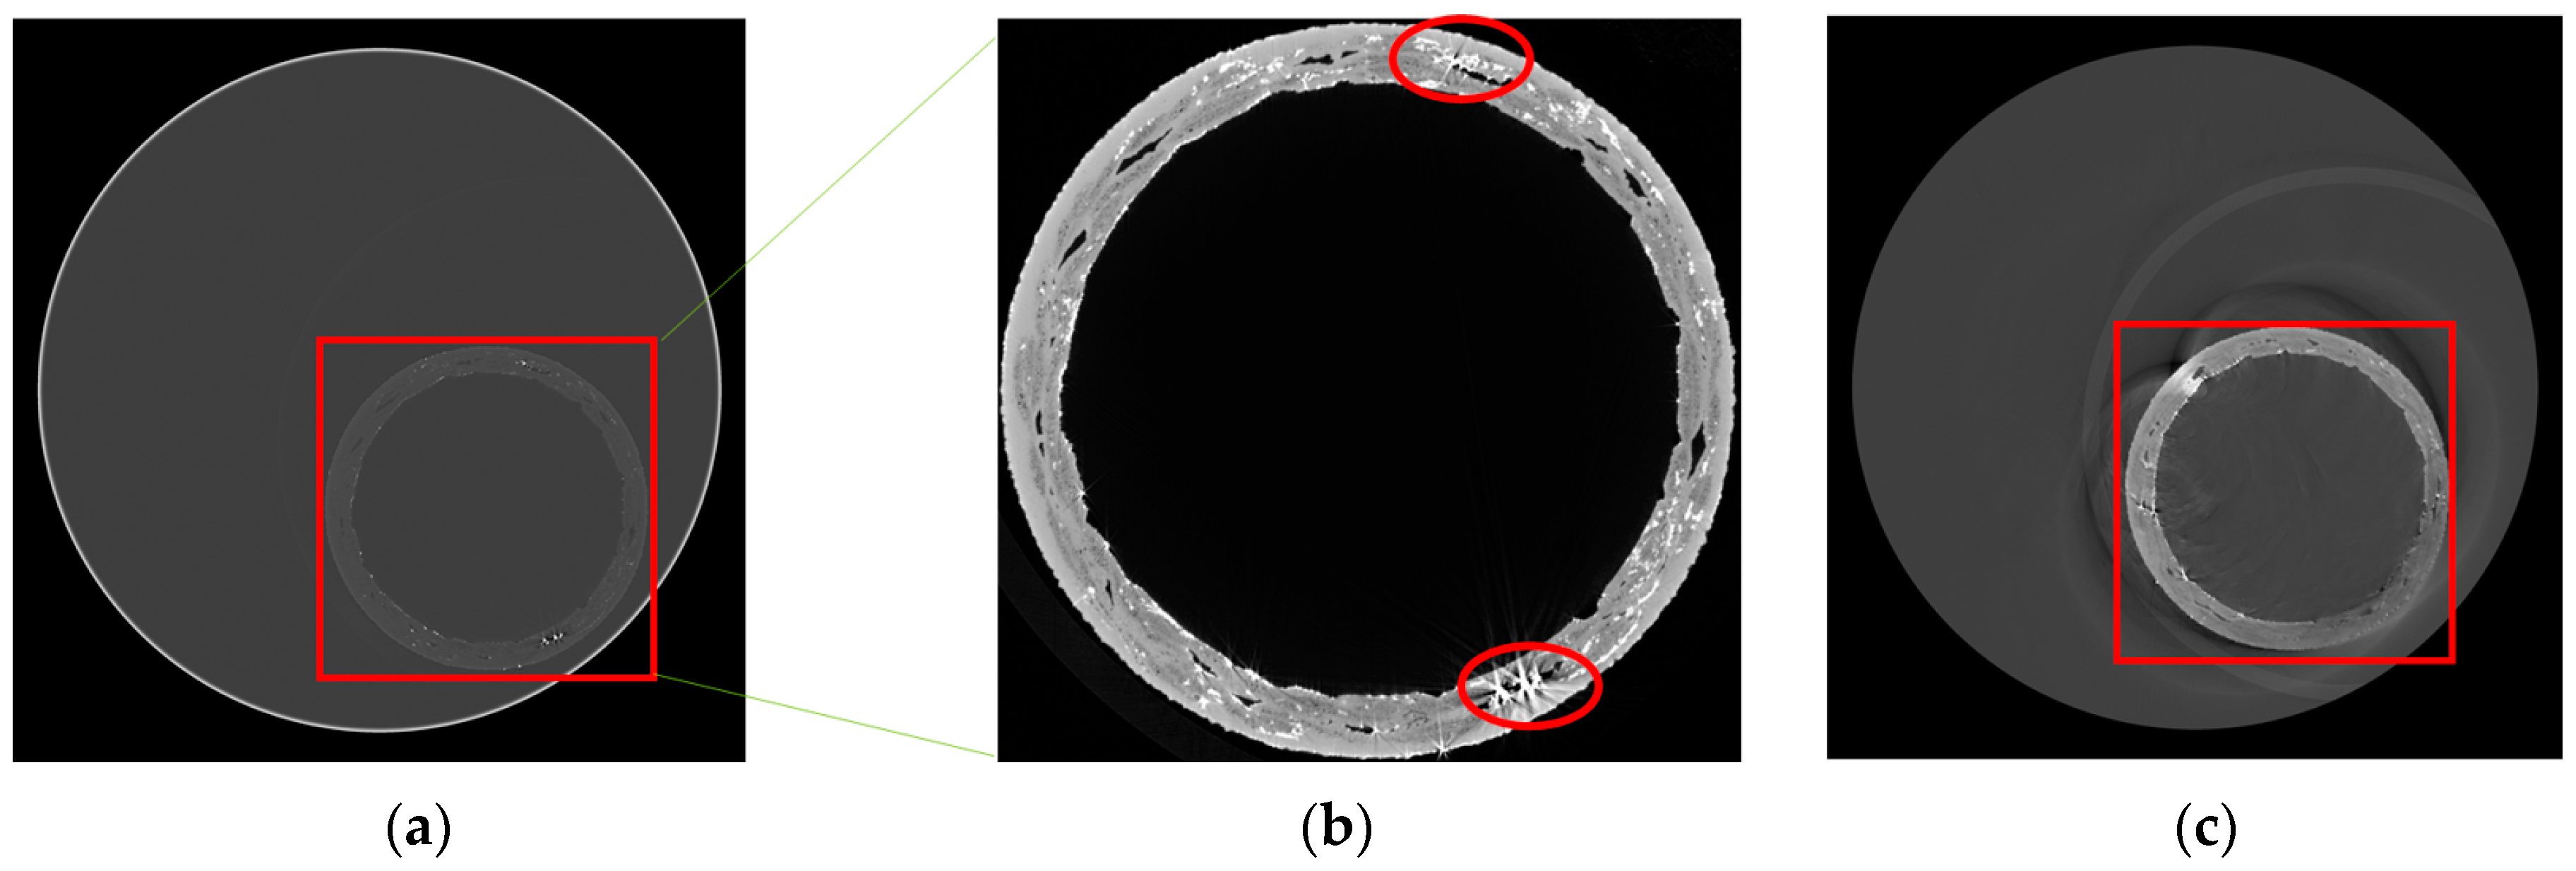
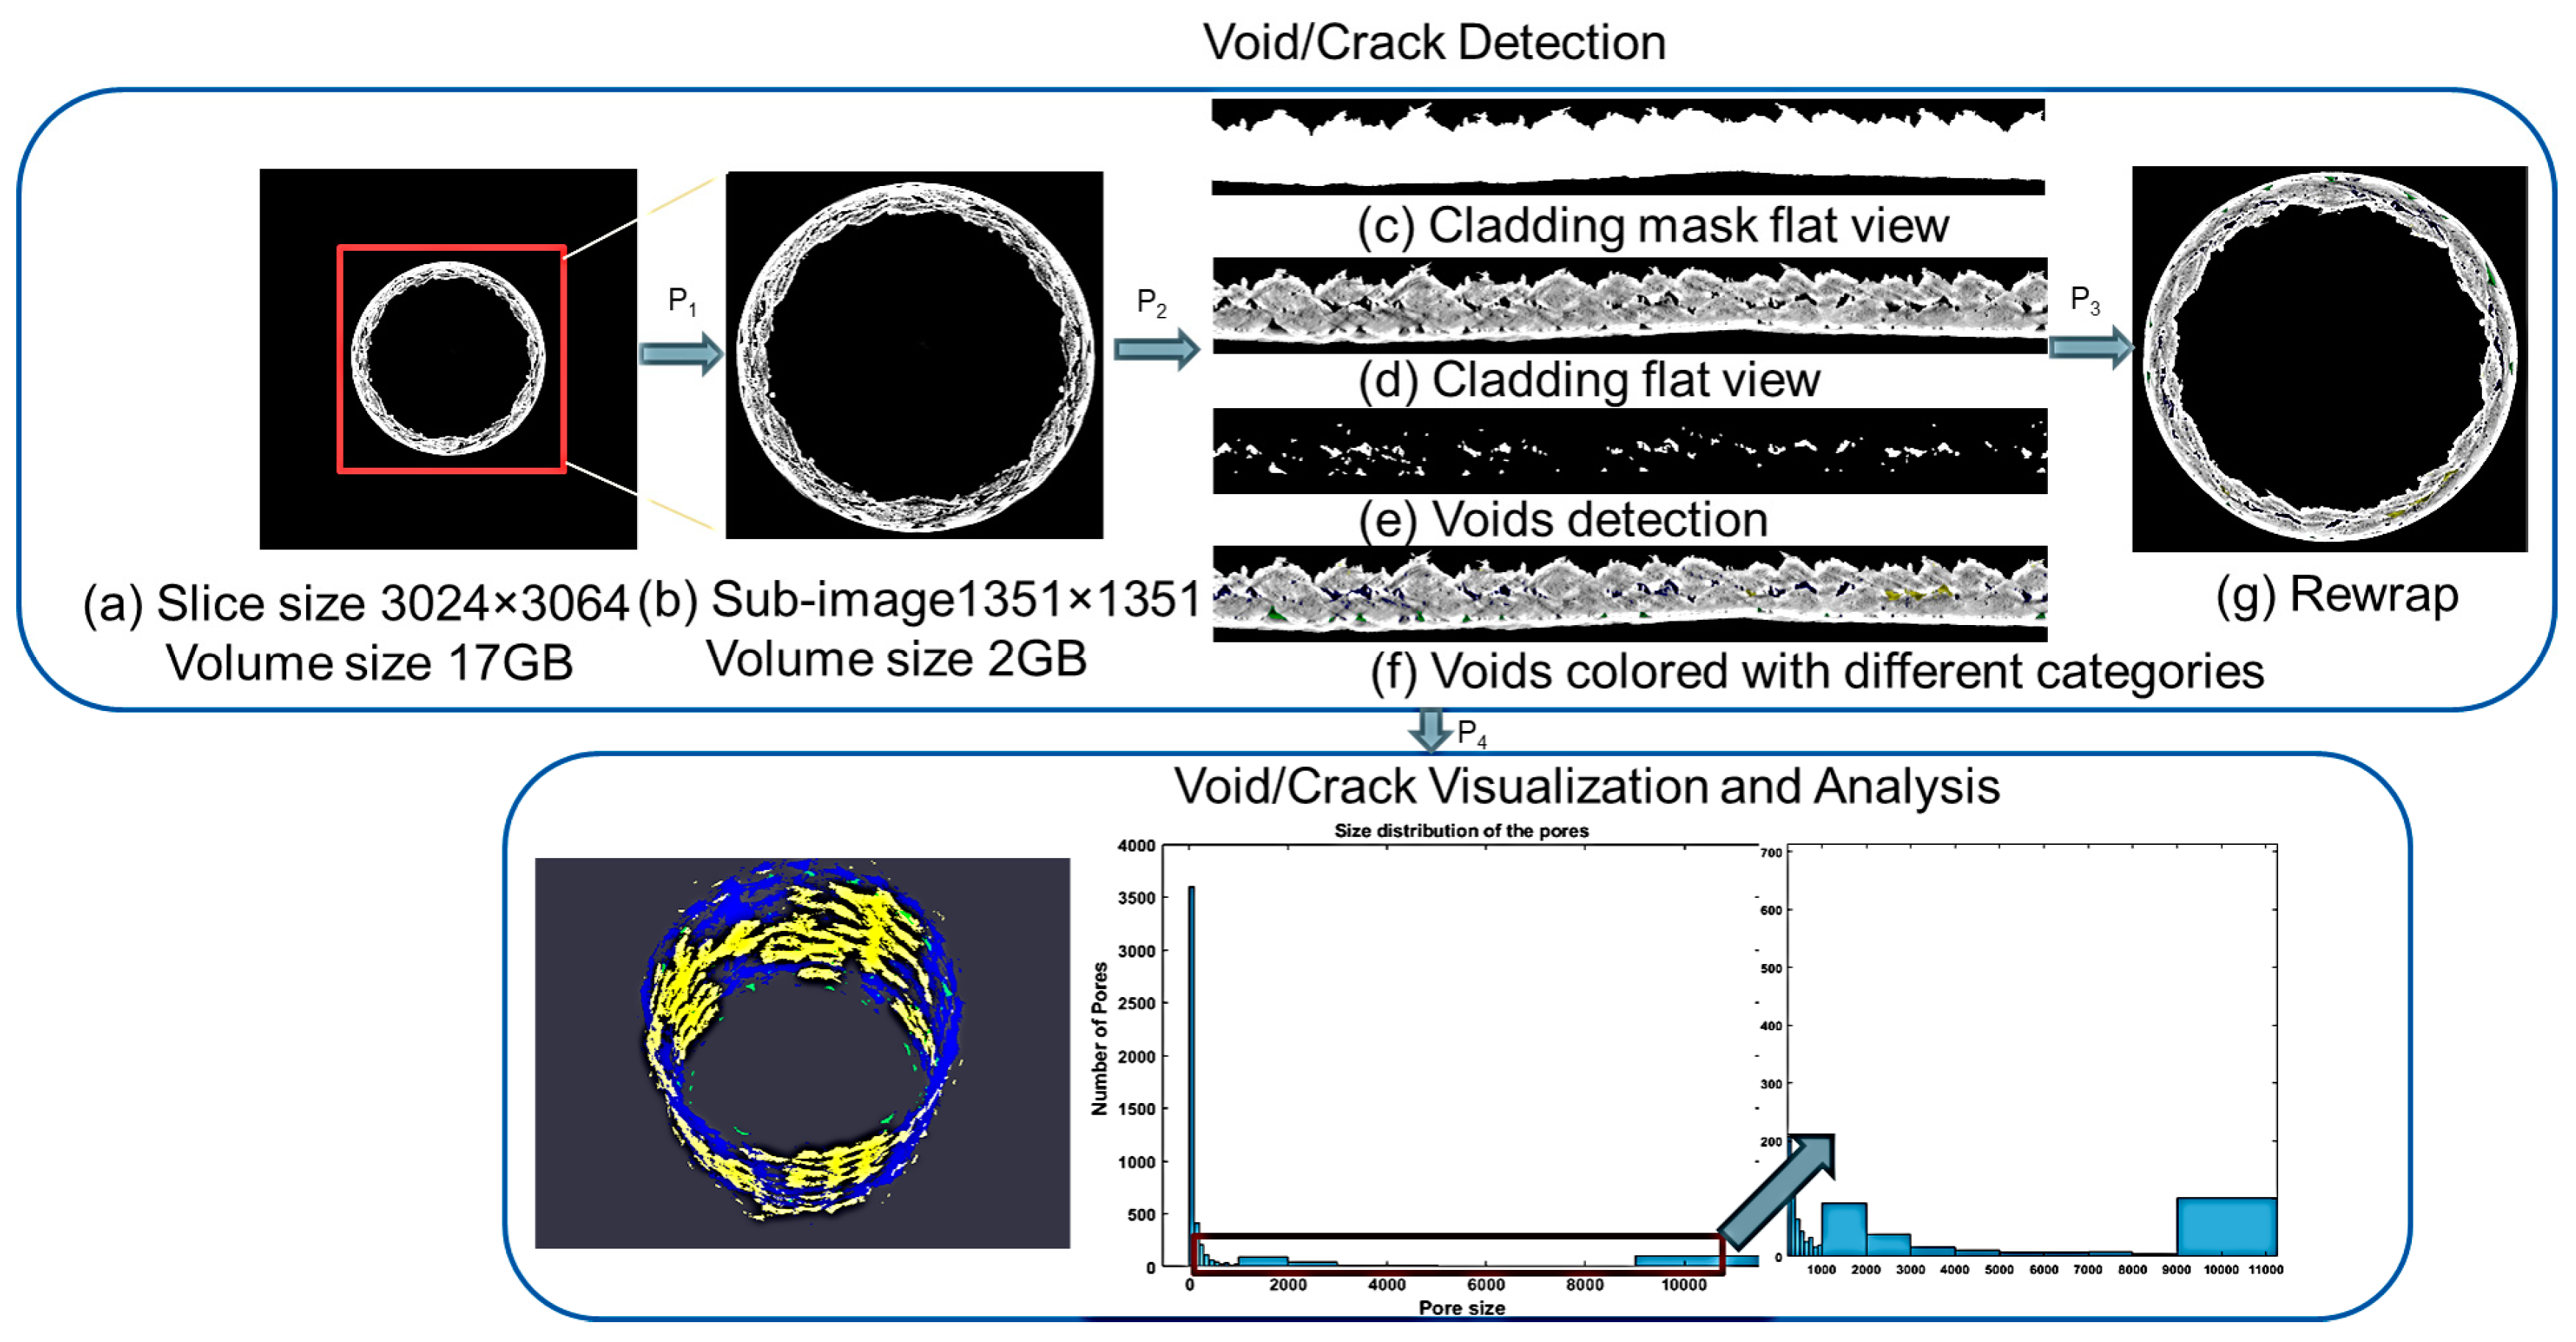
Although 3D X-ray rendering provided high-resolution and non-destructive data, slices of 3D X-ray show rotating and drifting during reconstruction, which affected the defects’ 3D structure. As shown in Figure 3a,c, the cladding circular centers of slice #410 and slice #1156 from the same sample are (1973, 1916) and (2038, 1962), respectively. Moreover, high-density artifacts were brought into the 3D images (Figure 3b), which impacted the detection of pores. Additionally, the material centers vary in different samples. A workflow was proposed to detect the voids automatically (Figure 4). Void/crack detection, visualization, and analysis were the three major components, including four processing blocks, noted as P1 to P4. P1 spatially aligned the cylindrical axis orthogonal to the volumetric Z-axis and extracted the smallest possible volume of interest within a Cartesian coordinate system. P2 was applied to unwrap the material by transforming the volume from a Cartesian coordinate to a polar coordinate system. P3 detected and labeled the voids/cracks using image segmentation approaches. P4 generated the connected structures of 3D-visualized voids/cracks and statistical results. Throughout this work, the voids/cracks were also referred to as porosity. SiC samples provided by General Atomics have been evaluated in TREAT and evaluated using the proposed workflow.

2.3. Microstructure Characterization

The low-magnification scanning electron microscope (SEM) characterization of SETH-H from a previous study [19] indicated that there were 14 radial cracks and 3 circumferential cracks in the transverse section, and there were 2 radial cracks and 3 axial cracks in the longitudinal section. The cracks were found interconnected through the cladding thickness at the cross-section. Optical microscopy of SETH-I revealed more radial and circumferential cracks in the SiC cladding than in SETH-H [19]. On the sample surface, 31 radial cracks and 10 circumferential cracks in the transverse section and 15 radial and 0 axial cracks in the longitudinal section were observed. At least six of the cracks were found to propagate through the wall thickness of the cladding. Many large pores ranging in size from ~300 to ~400 µm were found. Interconnected cracks appeared, along with branching cracks emanating from the main crack. Moreover, a crack network was observed on the inner surface, which may be from the fabrication process. A leaking test is performed on a fresh sample to ensure that no penetration path exists. Moreover, XCT was performed on a fresh sample and demonstrated that there was no penetration path in the sample. Further SEM investigations of SETH-H and SETH-I revealed more branching cracks and widespread microcracks.
In this study, higher resolution characterization was conducted using a dual-beam FEI Helios Plasma Focused Ion Beam (PFIB) on cross-sections of SETH-H and SETH-I. Besides, a TEM sample was lifted out of SETH-H, and the corresponding TEM 3D tomograph data were produced for microstructure characterization. Section 3.3 presents the results.

3. Results and Discussion

3.1. Defects Detection on XCT Data

As shown in Figure 4, the process of P1 was to align the volume and extract the cladding circulars, while that of P2 was to detect defects. In the P1 process, an algorithm was applied to align the cylindrical axis to the volumetric Z-axis [23]. In the P2 process, a global threshold segmentation method [24] was utilized to detect the defects in X-ray images. The value of each pixel in an image is named in intensity in the image, and the brighter regions indicate higher intensity. The cladding appears much brighter than in the other regions. The threshold method set the pixel value to 1 if the pixel intensity was greater than an adaptive threshold of T0; otherwise, it was set to 0.
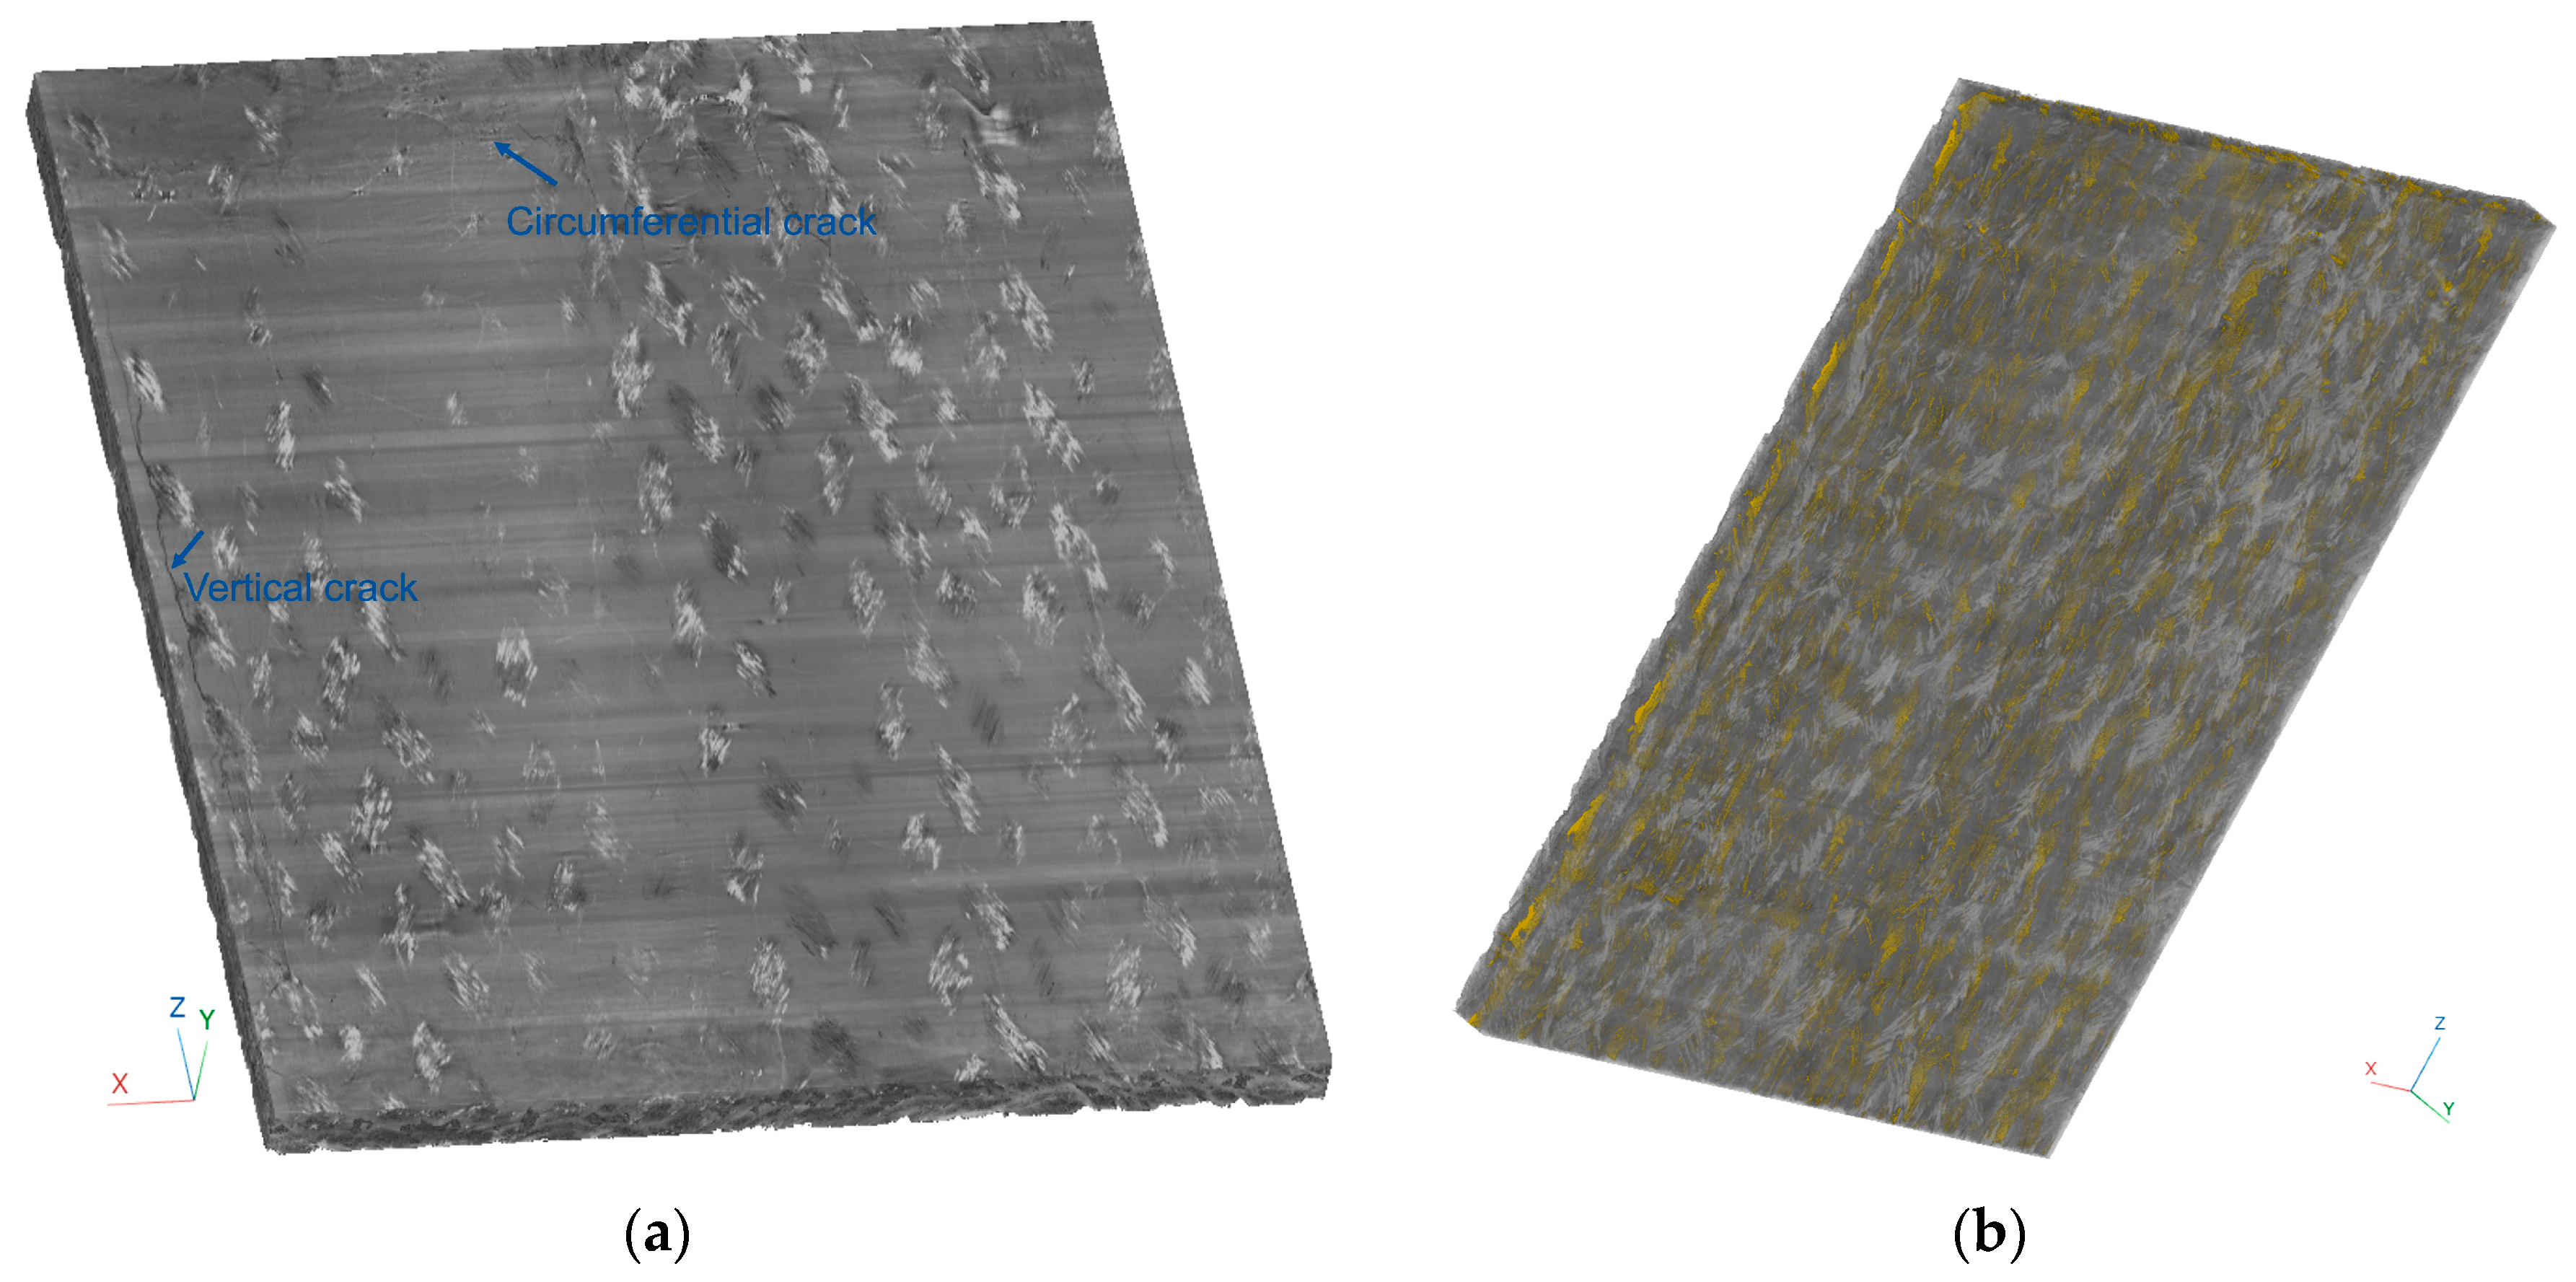
After detecting the cladding annular, the Cartesian coordinate system was transformed into the polar system to reduce the computational complexity. After transformation, the voids in the cladding regions were detected (Figure 5b). The voids appeared darker than the other regions in the cladding. Noise was removed, and the voids were detected using the adaptive threshold segmentation method [24] after adjusting the contrast of the image. However, the shadows, as marked in the red circles in Figure 5a,b, resulted from the high-density metal during X-ray scanning [25,26]. The shadows were inhomogeneous with and surrounded the voids and were not easily distinguished from the intensities, which resulted in misdetection by the threshold segmentation method. To solve the problem, the intensities’ standard derivation for each connected object was calculated, and if the standard derivation was greater than d1, an adaptive local threshold value in the connected void was generated, and the pixels with intensities greater than the value were removed (Figure 5c). The 3D rendering results of void detection for SETH-H and SETH-I are shown in Figure 6 and Figure 7.

3.2. Visualization and Analysis Discussion of Defects and Voids on XCT Data

The voids and cracks contribute to affecting strain [27,28]. The rapid thermal expansion of the fuel pellet contacting the cladding and the heat transfer to the cladding caused a thermal stress gradient across the cladding wall, resulting in cracks in SETH-H and SETH-I, which can be estimated by outer diameter (OD) measurement. In the previous study [19], five pre-TREAT OD measurements from five locations of the fuel rods in SETH-H and SETH-I were generated using a model Calypso of coordinate measuring machines (CMMs) from manufacturer Zeiss, and 15 manual post-TREAT measurements were also obtained [19]. In this study, slice-based OD measurements from the XCT data of the three samples were calculated using an automatic script with experts’ confirmation. The average, standard deviation, and minimum and maximum measurements are shown in Table 3. Though the X-ray CT samples are small sections from the fuel rod, the measurements from the X-ray CT data indicate the wide range of differences (~0.2 mm on irradiated samples, 0.08 mm on fresh samples) in OD. However, the difference between minimum and maximum measurements of pre- and post-TREAT obtained from the previous study was much narrower (~0.05 mm), and the average pre-TREAT and manual post-TREAT measurements were larger than the X-ray CT data, which may be caused by measuring random locations and manual uncertainty; the OD data were not comparable.
For further discussion, we define cracks as different from voids in solid materials. The crack is defined as the linear magnitude of either one or two dimensions of this absence (its length and/or width) greatly exceeding the linear magnitude of its third dimension. In this study, the void was defined as a crack when the aspect ratio, which is the ratio between the major axis’ length and the minor axis’ length of the object, is greater than 5. Moreover, multiple types of cracks were defined based on their major length: long cracks (typically larger than 10 mm), short cracks (short cracks are generally through-thickness flaws, no smaller than 50 µm), and small cracks (less than 50 µm, no smaller than 10 µm) [29]. Microcracks were small, linear cracks that took the form of planar ellipses, typically with major axes less than 10 μm. The microcracks did not immediately have a detrimental effect on the material. However, environmental contaminants could be absorbed into the material in greater quantities than into uncracked material.
Moreover, to investigate the leaking paths, we defined four types of voids based on the voids’ locations in the cladding: the voids inside the cladding, the voids adjacent to the outer boundary, the voids adjacent to the inner boundary, and the voids connected to the inner and outer boundaries, noted as c1–c4, respectively. The 3D structural information of the voids was generated by the built-in function regionprops3 in MATLAB 2022b [30,31].
The overall number of voids and cracks in the three samples is shown in Table 4. The void portion in Table 4 was calculated using the following equation:
P o r o s i t y = V i c l a d d i n g   v o l u m e
V P i = V i V i   ,   i   i s   t h e   c o r r e s p o n d i n g   v o i d / c r a c k   c a t e g o r y
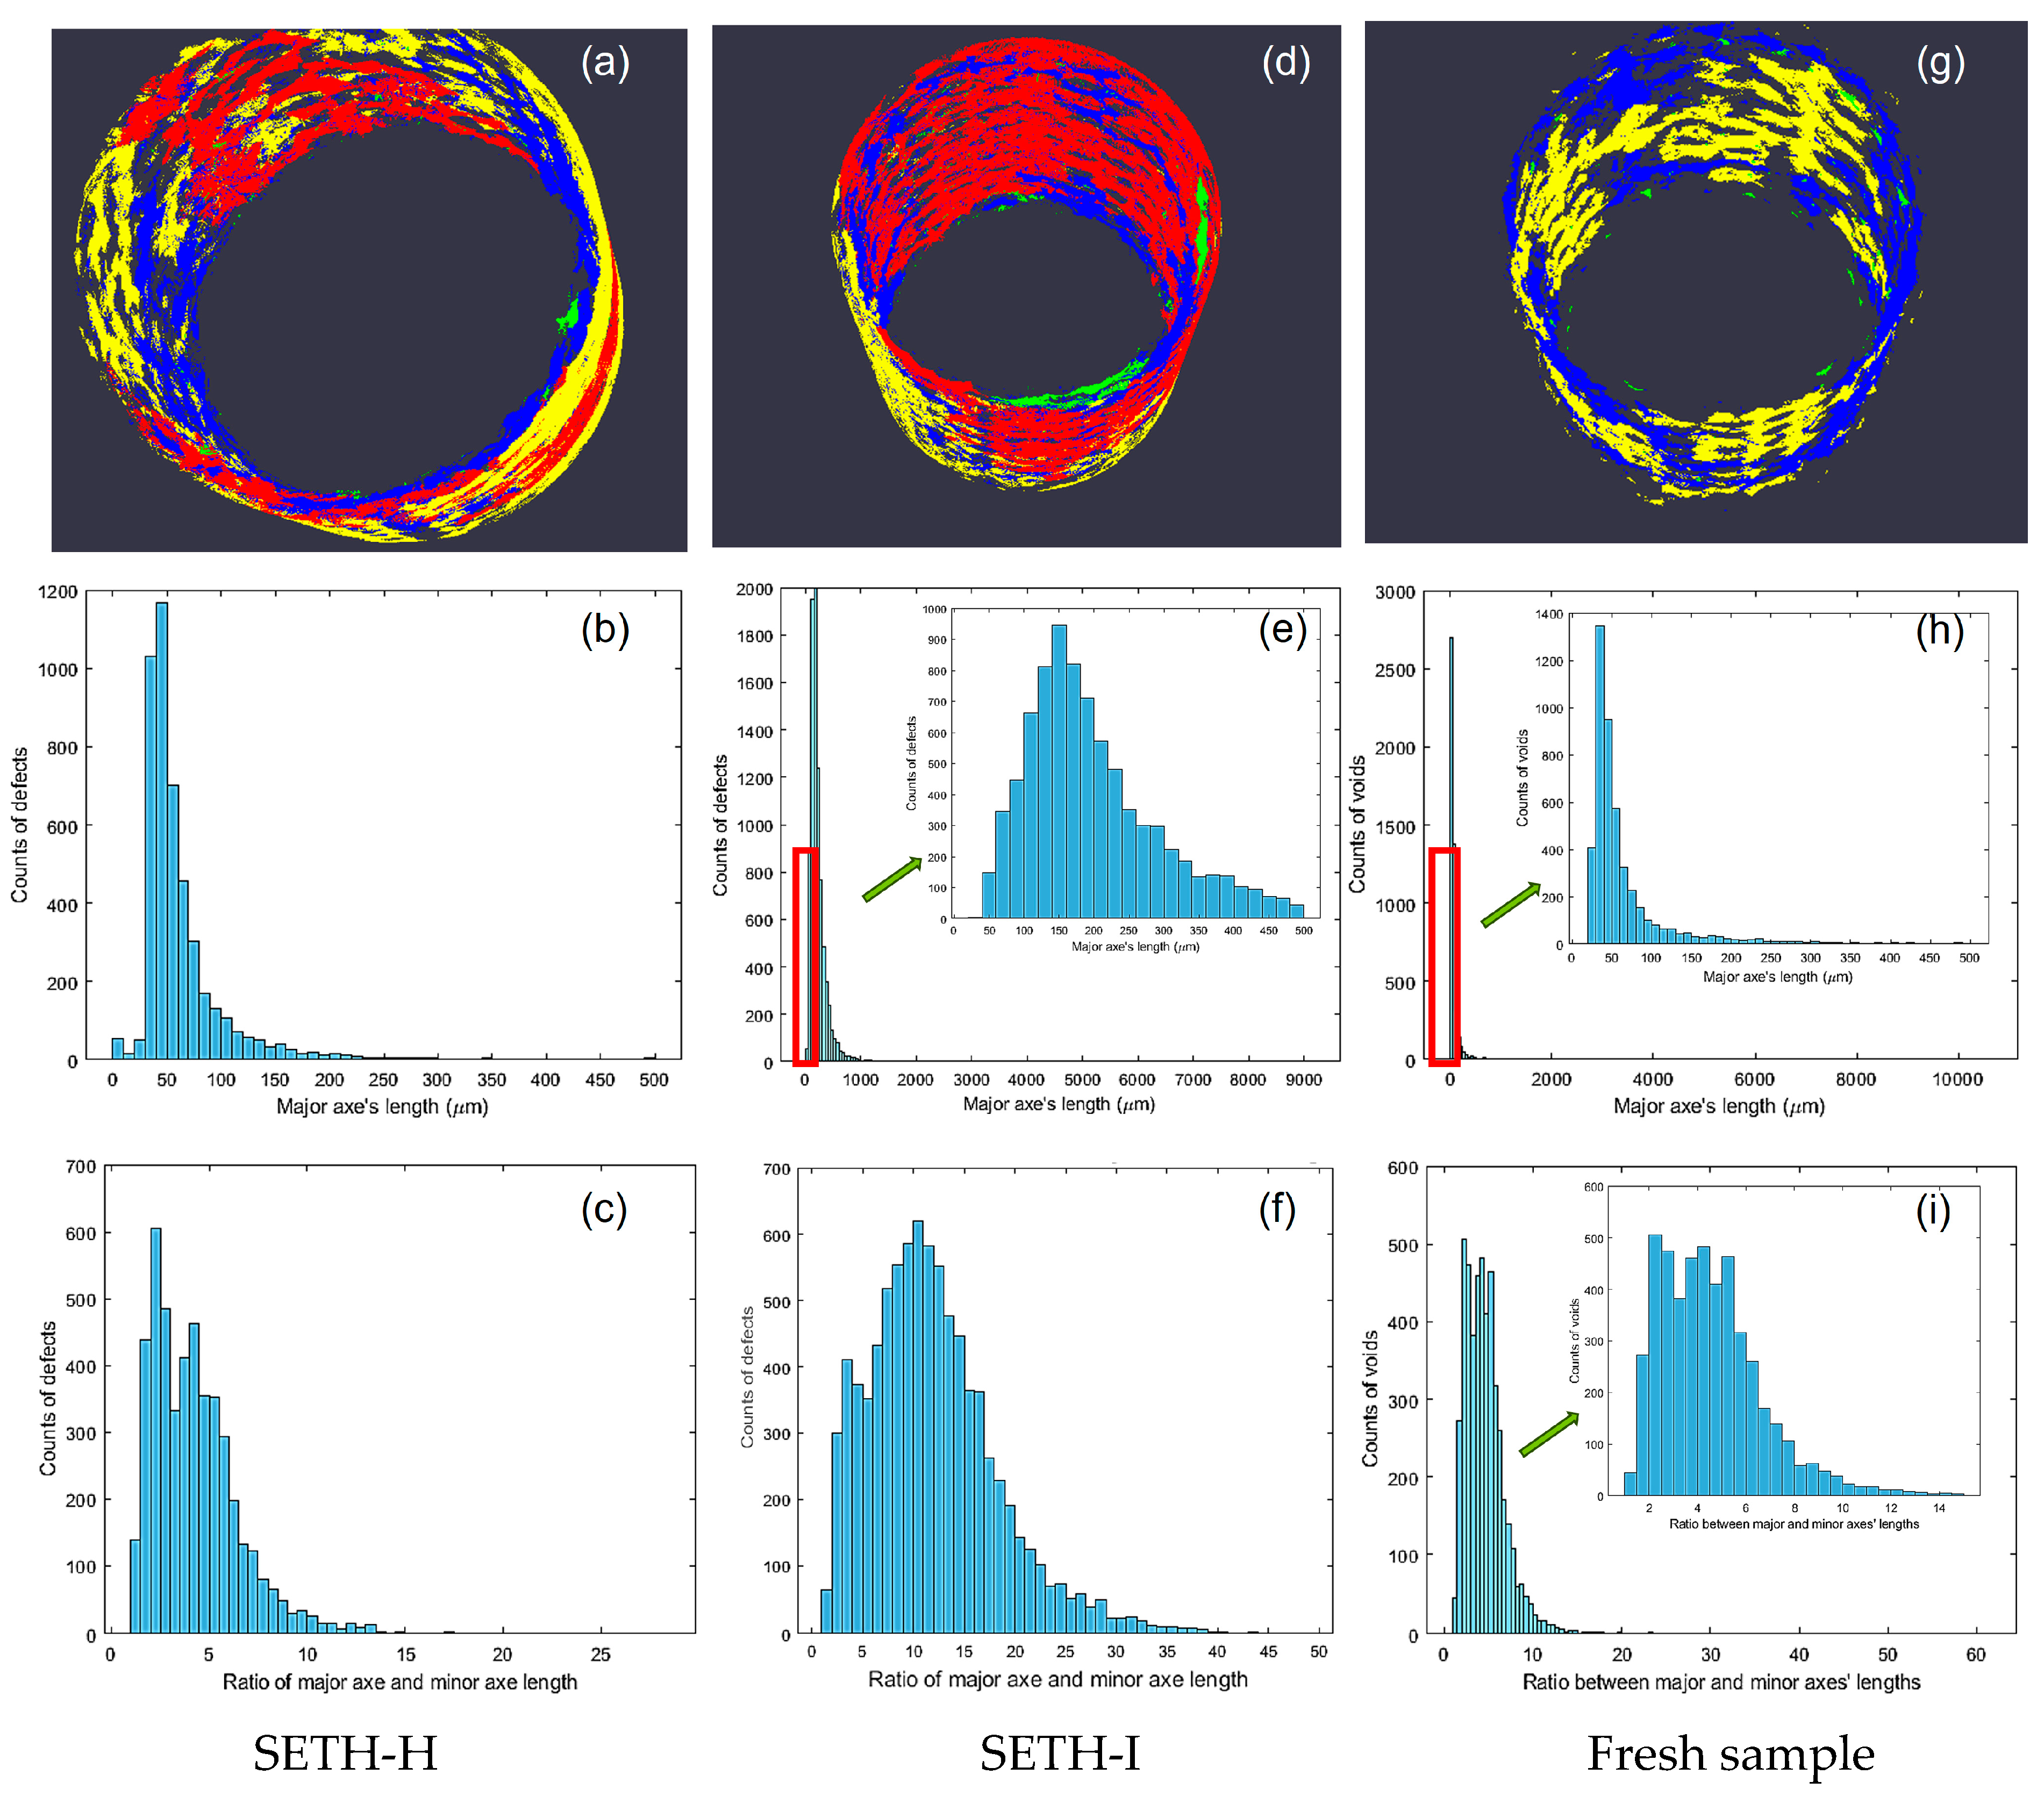
V i calculates the number of voxels in all voids/cracks. V i is the number of voxels in the void/crack category i . SETH-H had the greatest number of voids, but SETH-I had the highest porosity ratio. SETH-H and SETH-I contained nearly or over twice the number of voids as in the fresh sample. As shown in column c4 in Table 4, no voids that crossed the inner and exterior boundaries of cladding were detected in the fresh sample, while SETH-H was found to have the greatest number of voids and SETH-I had the largest void. From the aspect of voids’ locations, nearly all the voids (>99%) of the fresh sample were touching the inner boundary of the cladding (c1). The majority of voids in SETH-H and SETH-I were crossing the inner and exterior boundaries of the cladding (c4) and touching the inside cladding (c2), which matched the characterization observation in the previous study [19]. The properties of the voids c4 generated are shown in Table 5, including the volume size of the voids and the major axis length. The major axis length is the length of the major axes of the ellipsoid that have the same normalized second central moments as the region, as a 1-by-3 vector. The data in Table 5 revealed that all of the voids had longer lengths in the vertical direction, especially the voids of SETH-I. SETH-I had a smaller number of voids in type c4, but each void was larger than the voids in SETH-H. Additionally, the porosity of the voids based on size range and types of cracks were investigated in Table 4. In the fresh sample, there were no voids with a size greater than 1 mm3. The voids with sizes between 0.001 mm3 and 1 mm3 dominated the three samples. Based on the definitions of different types of cracks, only SETH-I had long cracks, and short cracks contributed the most porosity in the three samples. Moreover, ~90% of the voids were cracks, which means the aspect ratio is greater than 5. Figure 8 shows the detailed statistical results of voids from the three samples, coupled with the visual results. The majority of maximum axes’ lengths of the voids from SETH-H and the fresh sample were near 50 µm, while that of SETH-I’s was greater than 100 µm. The distributions of aspect ratios showed that the highest frequency ratio of SETH-I was more than 10, while that was around 5 in SETH-H and the fresh sample. It was demonstrated that narrower voids/cracks existed in SETH-I than in the other two samples. The manufacturing process induced more uniform voids with a lower aspect ratio. The high stress induced by irradiation is directional (hoop direction) on the cladding, thus causing the formation of higher aspect ratio voids and/or cracks, as shown in Figure 8. Due to the resolution limitation of XCT, no microcracks could be observed or detected from the XCT data.

3.3. Analysis Discussion of PFIB and TEM Characterization

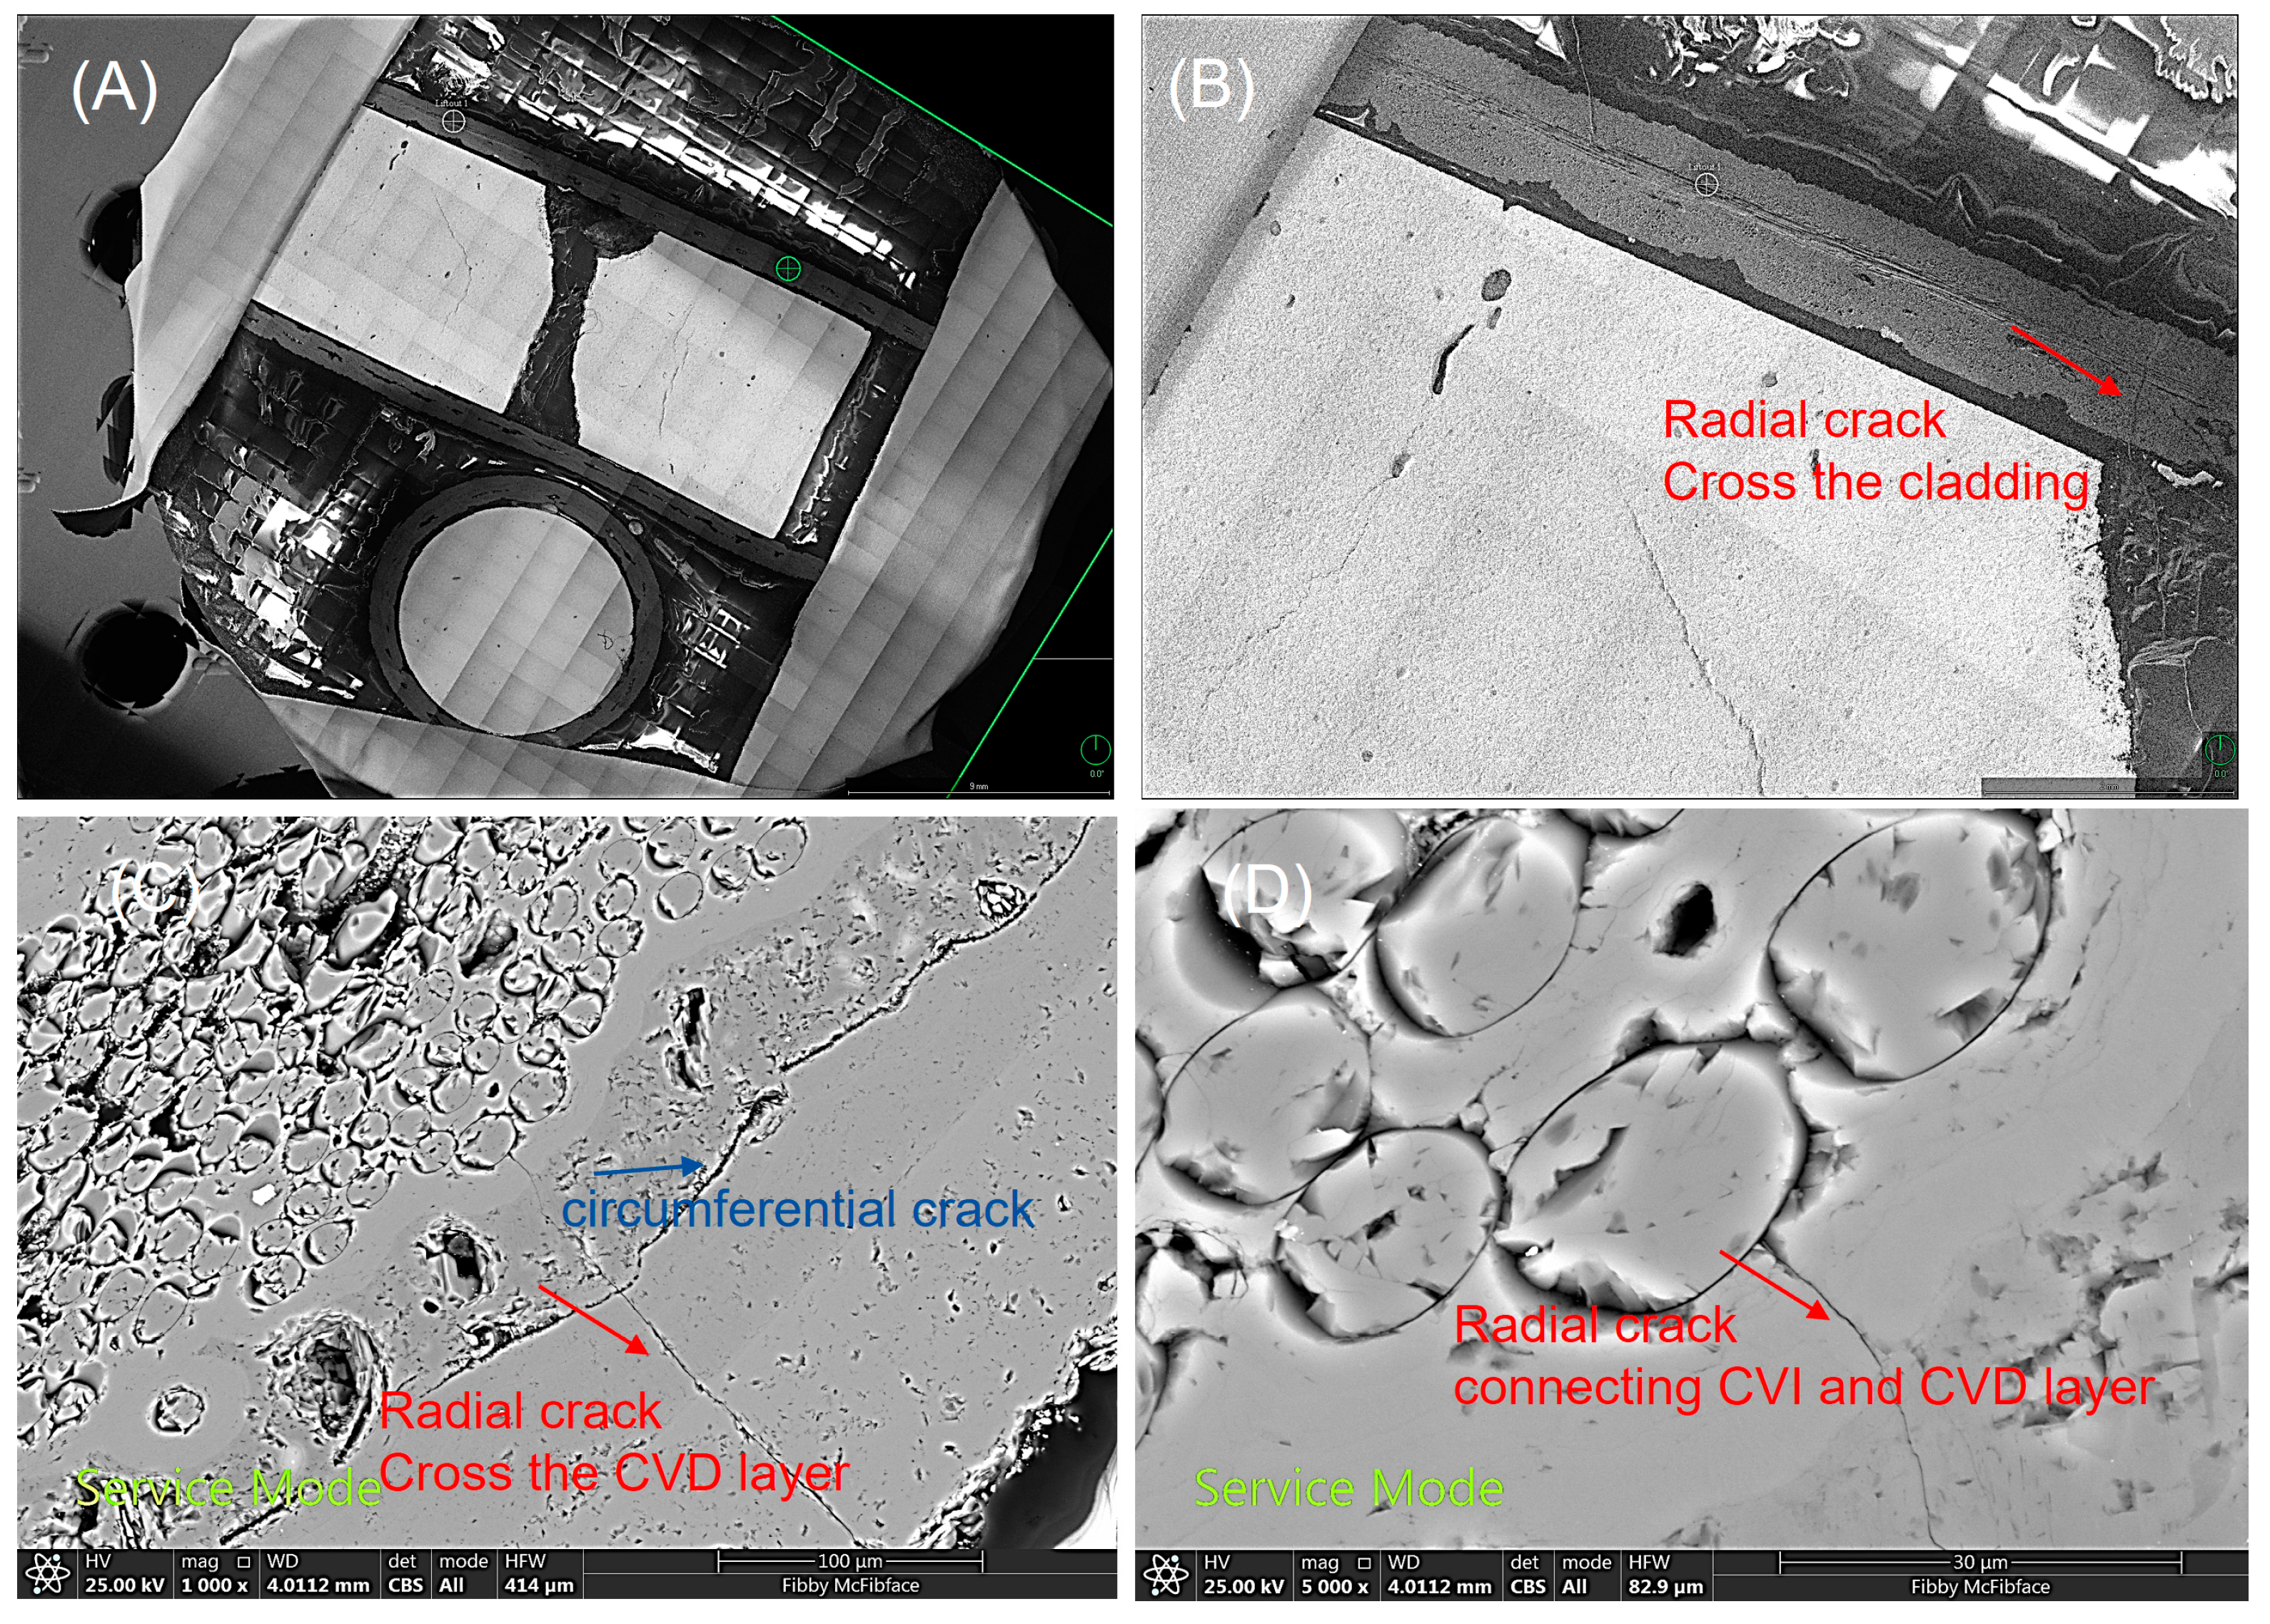
As shown in Figure 9 and Figure 10, multi-scale BSE images were collected to confirm the leaking paths on SETH-H and SETH-I from PFIB. Moreover, radial cracks, circumferential cracks, and secondary cracks were observed in the two samples. All the findings from the sample surface matched the X-ray 3D results.
To confirm the porosity and with the help of the new 3D scanning transmission electron microscopy (STEM) tomography capability of IMCL, we lifted out a TEM sample (3.26 µm × 3.26 µm × 0.32 µm) from SETH-H, as shown in Figure 11, and generated 3D STEM data by using Avizo software on Thermo Scientific 9.3.0. The 3D STEM data were collected from an in-situ TEM sample tilted −50 degrees to 50 degrees. After acquiring the images, aligning and reconstruction steps were performed to obtain the 3D tomography data. The defects were detected using image-processing techniques. The results are shown in Figure 12. Figure 12 shows the rendering result of the defects. The volume porosity fraction was 5.83 vol% in the studied sample. The size of the primary crack was 4.34 µm × 2.41 µm × 0.29 µm as a small crack with a porosity of 5.8%. The secondary crack was observed in the sample. In the future, in-situ loading tests will be conducted on the sample to gain in-depth knowledge of crack propagation.

4. Conclusions

This was the first study to illustrate the 3D X-ray non-destructive capability of defects and cracks in SiC-SiC CMC cladding after the TREAT experiment at INL. The degree of cracking was proportional to the transient strain experienced by the SiC-SiC CMC cladding in the TREAT experiments. The statistics of the defects and characteristics could inform the mechanical responses of SiC-SiC cladding in envisioned accident scenarios to guide manufacturing processing and improve cladding performance.
This work was performed with a multi-scale characterization process of SiC-SiC porosity and crack analysis, including the 3D X-ray global scale, FIB/TEM local cross-sectional micro-scale, and local nano-scale TEM 3D tomography. This work demonstrated the applicability of X-ray tomographic imaging capability in rapidly supporting post-irradiation examinations of non-fuel components, including 3D visualization of voids and cracks and analysis that revealed the overall porosity conditions, locations, and structures of the voids and cracks. Critical quantitative global information about the material could be obtained to evaluate its condition and performance and eventually assist the decision-maker in determining its lifespan. The experimental results demonstrated that SETH-H (lower strain) and SETH-I (higher strain) have cracks that establish a continuous path between the interior and exterior surfaces of the annulus, breaking the desired hermiticity of the material, and no such cracks were observed in the fresh sample (fresh material). These results demonstrate the applicability of X-ray tomographic imaging capability in rapidly supporting post-irradiation examinations of non-fuel components using X-ray tomography with advanced visualization methods and automated defect analysis. The workflow can be applied to other similar 3D X-ray data analysis tasks.
The X-ray CT can provide image quality with length scales of 10 cm to 10−2 cm; however, cracks or pores smaller than 35 µm2 (5 pixels) cannot be detected using this capability. Thus, this study proposed a strategy to bridge multi-scale characterization results using 3D tomography STEM to validate 3D X-ray CT results and provide more confident qualitative information. This is the first work to fuse multi-scale characterization data of defects and cracks in SiC-SiC CMC cladding after transient safety testing at INL. In the future, more advanced analyses will be performed using SEM, STEM, and element energy loss spectroscopy (EELs) data to reveal the formation mechanisms for cracking.

Author Contributions

Methodology, F.X. and P.X.; Validation, F.X., P.X., J.L.S., S.G. and J.G.; Formal analysis, F.X., P.X., J.L.S., S.G. and J.G.; Investigation, P.X. and J.L.S.; Resources, T.Y., M.D.M.II, S.G., J.G., J.J.K. and N.L.C.; Data curation, M.D.M.II and N.L.C.; Writing—original draft, F.X. and T.Y.; Writing—review & editing, F.X., T.Y., P.X., J.L.S., M.D.M.II, S.G, J.G., J.J.K. and N.L.C.; Project administration, P.X.; Funding acquisition, P.X. All authors have read and agreed to the published version of the manuscript.

Funding

This research was funded by Department of Energy (DOE) Nuclear Energy with contract number DE-AC07-05ID14517. And The APC was funded by the Department of Energy. This research is being performed using funding received from the Advanced Fuel Campaign. The studied samples are provided by General Atomics. This research made use of the resources of the High Performance Computing Center at Idaho National Laboratory, which is supported by the Office of Nuclear Energy of the U.S. Department of Energy and the Nuclear Science User Facilities under Contract No. DE-AC07-05ID14517.

Data Availability Statement

The data that support the findings of this study are available from the corresponding author upon reasonable request.

Acknowledgments

We thank Fei Teng, Daniel J. Murray and Cameron B. Howard for proving technical support for sample PFIB and TEM preparation, Emily M. Hoadley as edit reviewer for this manuscript. We are so grateful that William C. Chuirazzi helped with the TEM 3D tomography.

Conflicts of Interest

Authors Sean Gonderman and Jack Gaza were employed by the General Atomics. Author Joshua J. Kane was employed by the Ultra Safe Nuclear Corporation. The remaining authors declare that the research was conducted in the absence of any commercial or financial relationships that could be construed as a potential conflict of interest.

References

  1. United States Department of Energy. Development of Light Water Reactor Fuels with Enhanced Accident Tolerance; Report to Congress; United States Department of Energy: Washington, DC, USA, 2015. Available online: https://www.energy.gov/sites/prod/files/2015/06/f23/Report%20to%20Congress%20-%20Accident%20Tolerant%20Fuels.pdf (accessed on 14 November 2020).
  2. Zinkle, S.J.; Terrani, K.A.; Gehin, J.C.; Ott, L.J.; Snead, L.L. Accident tolerant fuels for LWRs: A perspective. J. Nucl. Mater. 2014, 448, 374–379. [Google Scholar] [CrossRef]
  3. Alrwashdeh, M.; Alameri, S.A. Chromium-Coated Zirconium Cladding Neutronics Impact for APR-1400 Reactor Core. Energies 2022, 15, 8008. [Google Scholar] [CrossRef]
  4. Yueh, K.; Terrani, K.A. Silicon carbide composite for light water reactor fuel assembly applications. J. Nucl. Mater. 2014, 448, 380–388. [Google Scholar] [CrossRef]
  5. Katoh, Y.; Snead, L.L.; Henager, C.H.; Hasegawa, A.; Kohyama, A.; Riccardi, B.; Hegeman, H. Current status and critical issues for development of SiC composites for fusion applications. J. Nucl. Mater. 2007, 367–370, 659–671. [Google Scholar] [CrossRef]
  6. Deck, C.P.; Jacobsen, G.M.; Sheeder, J.; Gutierrez, O.; Zhang, J.; Stone, J.; Khalifa, H.E.; Back, C.A. Characterization of SiC-SiC composites for accident tolerant fuel cladding. J. Nucl. Mater. 2015, 466, 667–681. [Google Scholar] [CrossRef]
  7. Doyle, P.J.; Ang, C.; Snead, L.; Katoh, Y.; Terrani, K.; Raiman, S.S. Hydrothermal corrosion of first-generation dual-purpose coatings on silicon carbide for accident-tolerant fuel cladding. J. Nucl. Mater. 2021, 544, 152695. [Google Scholar] [CrossRef]
  8. Koyanagi, T.; Katoh, Y.; Nozawa, T. Design and strategy or next-generation silicon carbide composites for nuclear energy. J. Nucl. Mater. 2020, 540, 152375. [Google Scholar] [CrossRef]
  9. Petrie, C.M.; Koyanagi, T.; McDuffee, J.L.; Deck, C.P.; Katoh, Y.; Terrani, K.A. Experimental design and analysis for irradiation of SiC/SiC composite tubes under a prototypic high heat flux. J. Nucl. Mater. 2017, 491, 94–104. [Google Scholar] [CrossRef]
  10. Stone, J.G.; Schleicher, R.; Deck, C.P.; Jacobsen, G.M.; Khalifa, H.E.; Back, C.A. Stress analysis and probabilistic assessment of multi-layer SiC-based accident tolerant nuclear fuel cladding. J. Nucl. Mater. 2015, 466, 682–697. [Google Scholar] [CrossRef]
  11. Li, W.; Shirvan, K. U3Si2-SiC fuel performance analysis in BISON during normal operation. Ann. Nucl. Energy 2019, 132, 34–45. [Google Scholar] [CrossRef]
  12. He, Y.; Shirvan, K.; Wu, Y.; Su, G.H. Fuel performance optimization of U3Si2-SiC design during normal, power ramp and RIA conditions. Nucl. Eng. Des. 2019, 353, 110276. [Google Scholar] [CrossRef]
  13. Cordes, N.; Kane, J.; Craft, A. 3D X-ray Microscopy of Nuclear Energy Materials. Microsc. Microanal. 2020, 26, 872. [Google Scholar] [CrossRef]
  14. Chen, Y.T.; Lo, T.N.; Chu, Y.S.; Yi, J.; Liu, C.J.; Wang, J.Y.; Wang, C.L.; Chiu, C.W.; Hua, T.E.; Hwu, Y.; et al. Full-field hard X-ray microscopy below 30 nm: A challenging nanofabrication achievement. Nanotechnology 2008, 19, 395302. [Google Scholar] [CrossRef]
  15. Helmreich, G.W.; Richardson, D.; Venkatakrishnan, S.; Ziabari, A. Method for measurement of TRISO kernel and layer volumes by X-ray computed tomography. J. Nucl. Mater. 2020, 539, 152255. [Google Scholar] [CrossRef]
  16. Croom, B.P.; Xu, P.; Lahoda, E.J.; Deck, C.P.; Li, X. Quantifying the three-dimensional damage and stress redistribution mechanisms of braided SiC/SiC composites by in situ volumetric digital image correlation. Scr. Mater. 2017, 130, 238–241. [Google Scholar] [CrossRef]
  17. Singh, G.; Koyanagi, T.; Petrie, C.; Deck, C.; Terrani, K.; Arregui-Mena, J.D.; Katoh, Y. Elastic moduli reduction in SiC-SiC tubular specimen after high heat flux neutron irradiation measured by resonant ultrasound spectroscopy. J. Nucl. Mater. 2019, 523, 391–401. [Google Scholar] [CrossRef]
  18. Yuan, G.; Forna-Kreutzer, J.P.; Xu, P.; Gonderman, S.; Deck, C.; Olson, L.; Lahoda, E.; Ritchie, R.O.; Liu, D. In situ high-temperature 3D imaging of the damage evolution in a SiC nuclear fuel cladding material. Mater. Des. 2023, 227, 111784. [Google Scholar] [CrossRef]
  19. Schulthess, J.; Kamerman, D.; Winston, A.; Pomo, A.; Trowbridge, T.; Pu, X.; Woolstenhulme, N.; Imholte, D.; Jensen, C.; Wachs, D. Post-transient examination of performance of uranium silicide fuel and silicon-carbide composite cladding under reactivity-initiated accident conditions. J. Nucl. Mater. 2022, 560, 153520. [Google Scholar] [CrossRef]
  20. Kamerman, D.; Woolstenhulme, N.; Imholte, D.; Fleming, A.; Jensen, C.; Folsom, C.; Woolum, C.; Tritthart, K.; Schulthess, J.; Wachs, D. Transient testing of uranium silicide fuel in zircaloy and silicon carbide cladding. Ann. Nucl. Energy 2021, 160, 108410. [Google Scholar] [CrossRef]
  21. Snead, L.L.; Katoh, Y.; Connery, S. Swelling of SiC at intermediate and high irradiation temperatures. J. Nucl. Mater. 2007, 367–370, 677–684. [Google Scholar] [CrossRef]
  22. Olesinski, R.W.; Abbaschian, G.J. The C-Si (Carbon-Silicon) System. Bull. Alloy Phase Syst. 1984, 5, 486. [Google Scholar] [CrossRef]
  23. Kane, J.J.; Marshall, D.W.; Cordes, N.L.; Chuirazzi, W.C.; Kombaiah, B.; van Rooyen, I.; Stempien, J.D. 3D analysis of TRISO fuel compacts via X-ray computed tomography. J. Nucl. Mater. 2022, 565, 153745. [Google Scholar] [CrossRef]
  24. Gonzalez, R.C.; Woods, R.E. Thresholding. In Digital Image Processing; Pearson Education: London, UK, 2002; pp. 595–611. [Google Scholar]
  25. Zhao, S.; Robeltson, D.D.; Wang, G.; Whiting, B.; Bae, K.T. X-ray CT metal artifact reduction using wavelets: An application for imaging total hip prostheses. IEEE Trans. Med. Imaging 2000, 19, 1238–1247. [Google Scholar] [CrossRef] [PubMed]
  26. Hur, J.; Kim, D.; Shin, Y.G.; Lee, H. Metal artifact reduction method based on a constrained beam-hardening estimator for polychromatic X-ray CT. Phys. Med. Biol. 2021, 66, 065025. [Google Scholar] [CrossRef]
  27. Evans, A.G.; Zok, F.W. The physics and mechanics of fibre-reinforced brittle matrix composites. J. Mater. Sci. 1994, 29, 3857–3896. [Google Scholar] [CrossRef]
  28. Saucedo-Mora, L.; Lowe, T.; Zhao, S.; Lee, P.D.; Mummery, P.M.; Marrow, T.J. In situ observation of mechanical damage within a SiC-SiC ceramic matrix composite. J. Nucl. Mater. 2016, 481, 13–23. [Google Scholar] [CrossRef]
  29. Ritchie, R. Re: How to Define a Crack? 2020. Available online: https://www.researchgate.net/post/How_to_define_a_crack/5fb0372b481ded5a4637961c/citation/download (accessed on 14 November 2020).
  30. Lehmann, G.; Legland, D. Efficient N-Dimensional Surface Estimation Using Crofton Formula and Run-Length Encoding. Insight J. 2012. Available online: https://insight-journal.org/browse/publication/852 (accessed on 14 November 2020). [CrossRef]
  31. Shoemake, K. Graphics Gems IV; Paul, S.H., Ed.; Morgan Kaufmann: Burlington, MA, USA, 1994; pp. 222–229. [Google Scholar]
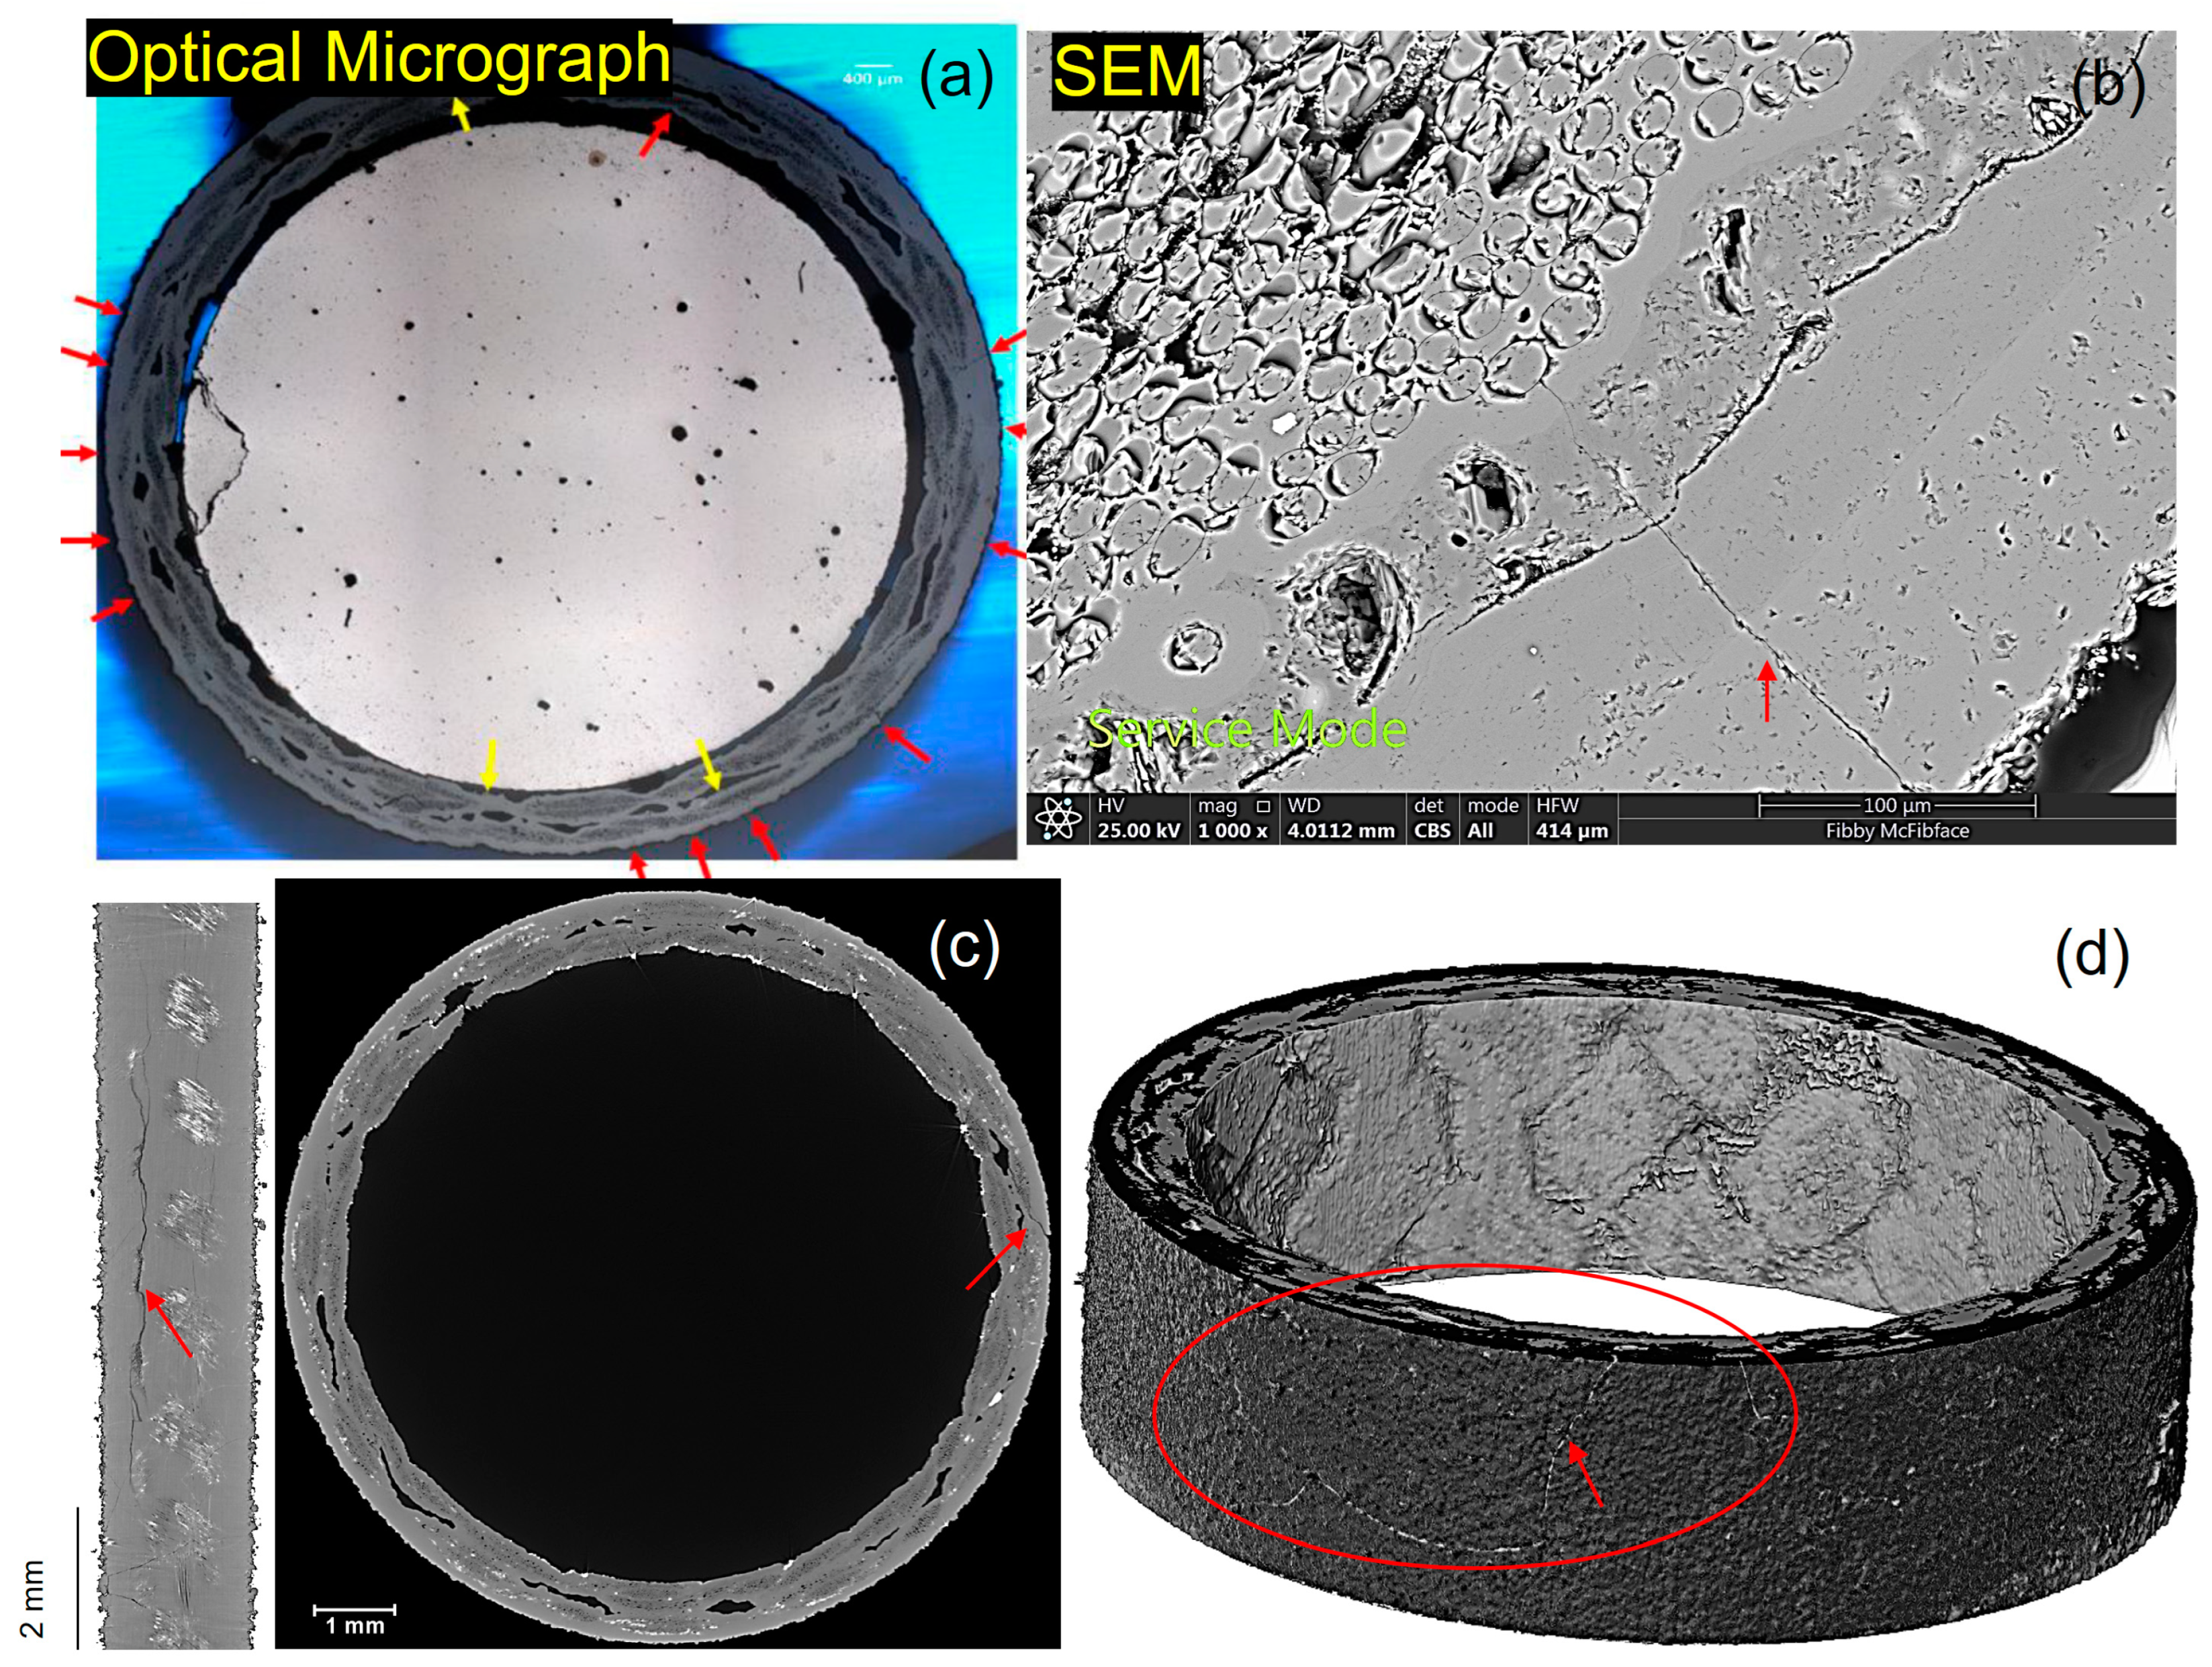
Figure 1. (a) Optical micrograph of a fuel cross-section of SETH-H [19] with crack locations identified by the red and yellow arrows; (b) high-resolution SEM image of the local fuel cladding region of SETH-H [19] with crack locations identified by the red arrow; (c) 2D cross-sectional images in the vertical (left) and horizontal (right) orientations, showing a vertical subsurface crack (red arrows) in the SiC-SiC cladding; (d) 3D volume renderings derived from the X-ray tomograms of irradiated, defueled SiC-SiC cladding. The red arrow and circle illustrated the cracks on the surface.
Energies 17 00197 g001
Figure 2. 3D View of SETH-H.
Energies 17 00197 g002
Figure 3. Existing challenges: (a) Slice #1156 (3024 × 3064), (b) Cladding circular part (1351 × 1351), and (c) Slice #410. The red circle in (b) illustrated the artifacts effects during X-ray scanning.
Energies 17 00197 g003
Figure 4. The proposed workflow: (a) an image from a fresh sample with a field of view representing 3024 × 3064 with a resolution of 6 µm/pixel; (b) a sub-image containing material annulus; (cf) a spatially transformed coordinate system of the fresh sample showing from top to bottom a binary segmentation of the annulus, original grayscale reconstruction, segmented voids, and color-coded pore classifications. In (f), green denotes the voids/cracks connected directly to the outer surface of the annulus, blue identifies closed voids/cracks that do not touch the inner or outer surface of the annulus, yellow identifies voids/cracks touching the inner surface of the annulus, and red identifies voids/cracks touching the inner and outer surfaces, which matched the voids categories c1–c3 in Section 3.2. (g) Rewrapped image frame with corresponding classifications from (f).
Energies 17 00197 g004
Figure 5. Defects detection. The artifact detected as pores in figure (b) as the red circle was removed after the post-process.
Energies 17 00197 g005
Figure 6. 3D rendering result of SETH-H.
Energies 17 00197 g006
Figure 7. 3D rendering flat views of SETH-I: (a) original flat view of SETH-I and (b) voids of SETH-I.
Energies 17 00197 g007
Figure 8. Voids structure in SETH-H, SETH-I, and fresh sample and the corresponding aspect ratio distributions. (a,d,g) are the 3D voids’ structure of the three samples. (b,e,h) are showing the major axes’ length distribution of the voids in the three samples. (c,f,i) are showing the aspect ratio distribution of the voids in the three samples.
Energies 17 00197 g008
Figure 9. Defects verification from the FIB characterization of SETH-H. (A) is the vertical and cross-sectional views of the SETH-H in FIB instrument. (B) is the higher magnification of vertical view of the sample with marking radial crack cross the cladding. (C) shows 1000× magnification of the sample with marking circumferential crack and radial crack on CVD layer. (D) illustrates the radial crack connecting CVI and CVD layers under 5000× magnification of field of view.
Energies 17 00197 g009
Figure 10. Defects verification from the FIB characterization of SETH-I. (A) shows the radial crack crossing the CVD layer under 500× magnification of SETH-I. (B) illustrates the cracks and secondary cracks on the CVI layer under 5000× magnification of field of view.
Energies 17 00197 g010
Figure 11. TEM sample lift out. (AD) Focused ion beam-based site-specific in-plane TEM sample lift and thinning (EG).
Energies 17 00197 g011
Figure 12. TEM sample SETH-H 3D tomography.
Energies 17 00197 g012
Table 1. Irradiation information for the three samples [19].
SampleFuel Clad Pellet Clad Gap (µm)Rodlet Energy Deposited (J/g)Pulse Width (ms)Peak Fuel T (C)Peak Clad T (C)Objective
SETH-HNE-U3Si2SiC805289520501133–1156PCI/fuel melting
SETH-INE-U3Si2SiC503301001440831–840PCMI
FreshNE-U3Si2SiC Fresh sample
Table 2. 3D X-ray data information for three samples.
SampleSource to the Rotation Axis (RA) (mm)Detector to the RA (mm)Pixel Size (μm)Number of ProjectionsCone Angle# of Slices
1−26.0461245.44077.1762450114.93341932
2−26.0461245.43927.1763450114.90401932
3−21.0601234.23746.1704240115.80311932
Table 3. OD measurements.
SamplesMeasurements from X-ray CT DataPre-TREAT Measurements from CMMs [19]Post-TREAT Manual Measurements
Average OD (mm)Standard Deviation of ODMinimum OD (mm)Maximum OD (mm)Average OD (mm)Standard Deviation of ODMinimum OD (mm)Maximum OD (mm)Average OD (mm)Standard Deviation of ODMinimum OD (mm)Maximum OD (mm)
SETH-H9.590.049.549.759.670.019.669.679.710.019.689.73
SETH-I9.640.019.599.789.670.019.679.699.710.029.709.75
Fresh9.470.029.419.49
Table 4. Overall statistics of voids and cracks.
SampleCladding Size (mm3)# of VoidsPorosityVoid Portion in c1Void Portion in c2Void Portion in c3Void Portion in c4# of Voids of Type c4
SETH-H55.3997,4465.73%26%40%1%33%8
SETH-I92.9884,3336.96%23%11%2%63%2
Fresh85.2348283.01%99%1%0%00
SampleVoids’ Size < 10,000 µm3Voids’ Size < 0.001 mm3Voids’ Size ≤ 1 mm3Voids Size > 1 mm3Void Portion of Long CrackVoid Portion of Short CrackVoid Portion of Small CrackNon-Crack Voids
SETH-H0.65%5.69%72.49%21.17%091.21%08.79%
SETH-I0.07%10.03%53.22%39.75%39.75%49.85%0.003%10.40%
Fresh0.41%1.69%94.89%0.00%083.68%1.06%15.26%
Table 5. Voids’ details of type c4 in SETH-H and SETH-I.
Sample# of c4 Type VoidsVolume Size (mm3)Principle Axis Length (mm)
SETH-H10.041.410.810.43
20.123.191.280.54
30.285.502.710.37
40.041.760.600.48
50.325.113.210.56
60.010.690.550.43
70.163.252.790.26
80.082.880.860.40
SETH-I13.2317.386.970.72
20.8713.513.660.63
Disclaimer/Publisher’s Note: The statements, opinions and data contained in all publications are solely those of the individual author(s) and contributor(s) and not of MDPI and/or the editor(s). MDPI and/or the editor(s) disclaim responsibility for any injury to people or property resulting from any ideas, methods, instructions or products referred to in the content.