Abstract
The pressure drop characteristics of subcooled water were experimentally investigated in a circular cooling channel with and without a twisted tape (TT) under high heat fluxes, which was designed for the water-cooling structure of the divertor target in a tokamak device. The working medium was deionized water, and the main parameters were mass flux G = 3000–8000 kg·m−2·s−1, inlet pressure of the test section p = 3, 4.2, 5 MPa, equivalent one-side heating flux qe = 5~10 MW·m−2. The off-center circular channel is electrically heated to simulate the unilateral radiation heating on the divertor target by high-temperature plasma. The pressure drop experiment of vertical upward circular cooling channels under high and unilateral heat flux is carried out. The influences of the TT and system parameters such as qe, G, and p on the pressure drop of the test section (Δp) were discussed in detail. In the single-phase (SP) flow region, Δp is mainly affected by the TT, G, and qe. The pressure drop with a TT is significantly higher than that without a TT, a higher G and a lower qe lead to a greater Δp. In the subcooled boiling (SB) flow region, Δp is correlated with the TT, qe, G, and p: the influence of the TT and G decreases, while the influence of p increases. The higher the qe, the higher the G, and the lower the p, the larger the Δp. The results show that almost all of the SP pressure drop correlations for heated circular channels overestimate the experimental pressure drop coefficient ratio for a given viscosity ratio. According to the test results, a new correlation of SP pressure drop under high and unilateral heat fluxes has been proposed, the average error (AE) and root mean square error (RMSE) of which are 0.26% and 3.17%, respectively.
1. Introduction
Faced with the increasingly severe energy situation, many countries in the world have joined the development of controlled nuclear fusion technology. In tokamak devices, the divertor is impacted by a large amount of high-temperature plasma and plays an important role in heat dissipation and impurity removal. Taking the China Fusion Engineering Test Reactor (CFETR) as an example, the inner and outer targets of the diverter have the highest heat flux, and the unilateral radiant heat flux can reach 10 MW·m−2 [1,2]. In order to take more heat away from the target, the cooling water is required to have a high mass flux. At the same time, it is necessary to design the cooling structure to enhance the heat transfer and increase the critical heat flux (CHF). The scheme of having a TT built into the cooling channel has received a lot of attention [3,4,5,6,7,8,9]. Under the extreme parameters of the diverter, the coolant in the cooling channel of the target is often in the SB state. How the pressure drop characteristics are different from the conventional working conditions is an important engineering problem to study.
Baxi [2] made a comparative study on heat transfer and pressure drop characteristics of two enhanced heat transfer structures, the twisted tapes (TT) insert and the hypervapotron (HV), proposed the CHF correlations and pressure drop correlations of the two structures, respectively, and preliminarily discussed the application prospects, advantages, and disadvantages of the two structures in the ITER divertor. It lays a foundation for further research in this direction.
Cioncolini et al. [10] conducted an experimental study on the flow pressure drop of subcooled boiling and saturated boiling in a threaded pipe with a small diameter, and the working conditions cover the pressure q = 0.05~0.44 MW·m−2, p = 0.12~0.66 MPa, G = 290~690 kg·m−2·s−1. The author evaluated the Tarasova correlation [11] and Owens-Schrock correlation [12] with experimental data, but the results showed that the above two correlations were not applicable to the experimental working conditions.
Dormer and Bergles [13,14] conducted an experimental study on the subcooled boiling pressure drop of a horizontal circular tube with an inner diameter of 1.57~4.57 mm under q = 0~17.35 MW·m−2, G = 0~15,000 kg·m−2·s−1 and p = 0.2~0.55 MPa. The corresponding friction pressure drop correlation is fitted out.
Inasaka et al. [15] conducted an experimental study on the SB pressure drop under normal pressures in a narrow channel. The inner diameter of the pipes was 1 mm and 3 mm, the length of the pipes was 10~100 mm, and the G = 7000~20,000 kg∙m−2·s−1. They compared the pressure drop characteristic curve with the experimental data obtained by Dormer and Bergles [13,14], and the comparison results of pipe fittings with an inner diameter of 1 mm and 3 mm were quite different.
Hoffman and Wang [16] developed a semi-empirical model for predicting the pressure drop of SB flow, which includes the pressure drop gradient in the SP region, the partial SB region, and the fully developed SB region. The Davis-Anderson correlation [17] was used for calculating the onset of nucleate boiling (ONB), while the Saha-Zuber correlation [18] was used for calculating the bubble departure point.
Yan Jianguo et al. [19] conducted an experimental study on the pressure drop characteristics of a uniformly heated circular tube with an outer diameter of 12 mm and a wall thickness of 1.5 mm under q = 0~12.5 MW·m−2, mass flux G = 6000~10,000 kg·m−2·s−1 and p = 3~5 MPa. The results show that the flow pressure drop increases with the increase in G and q, but decreases with the increase in p. According to the experimental data, a dimensionless frictional pressure drop correlation under high heat flux is fitted, and the accuracy is within ±20%.
To sum up, previous experimental studies on the pressure drop of subcooled flow in circular channels mainly focused on the conventional channels under conventional heat flux and the microchannels with high heat flux, and the q is uniformly distributed in the circumferential direction. However, the conventional size cooling channel under high and non-uniform heating fluxes and high mass fluxes is rarely involved, and the experimental study of a TT insert for comparison is even rarer. Therefore, in this paper, based on the cooling channel of the divertor target in CFETR, the unilateral radiant heat flux of the target is simulated by the method of off-center electric heating, so as to carry out the experimental study of flow pressure drop. The purpose is to obtain the pressure drop characteristics under non-uniform high heat flux and analyze the effects of system parameters and a TT insert on the pressure drop. By comparing the experimental data with the empirical correlation, a new pressure drop correlation is proposed and its error is analyzed. The research results will provide some theoretical basis and data support for the design of the cooling structure of divertor targets in fusion reactors such as CFETR.
2. Experimental Descriptions
2.1. Test Loop
Figure 1 shows the main components of the experimental loop. The high-pressure piston pump provides the driving head for the whole loop, and a part of the deionized water is driven to return to the water storage tank through the filter, and its flow rate is controlled by the bypass valve. The other part of the water enters the main line, flows into the shell side of the heat exchanger through the mass flow meter, and carries out sufficient heat exchange with the high-temperature working medium flowing out of the experimental section in the tube side. The heated working medium enters the preheating section and is further heated to the given temperature, and then flows through the experimental section, the heat exchanger, and the condenser in turn. After being cooled to near room temperature, the water is measured by the flow meter and returned to the storage tank.
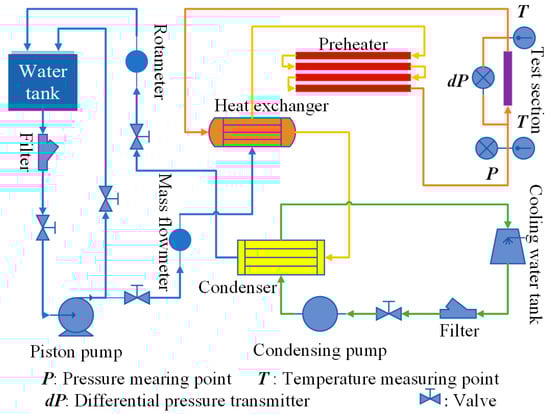
Figure 1.
Schematic of the test loop.
Figure 2 shows the photos of part of the equipment in the test loop. The flow control system is shown in Figure 2a. To adjust the p and G with the bypass valve, the experimenters can monitor each system parameter in real time through the display synchronized with the main control room. The copper braid connected with the transformer is fixed on the copper electrode by bolts, so as to realize the two-point electric heating. The transformer is shown in Figure 2b. The fluid temperature, pressure, and pressure drop of inlet and outlet are measured by T-sheathed thermocouples and pressure and pressure difference transmitters, respectively. The photo of pressure and pressure difference transmitter is shown in Figure 2c. After processing by data acquisition board, all measurement signals are displayed and collected by data acquisition program in industrial computer.
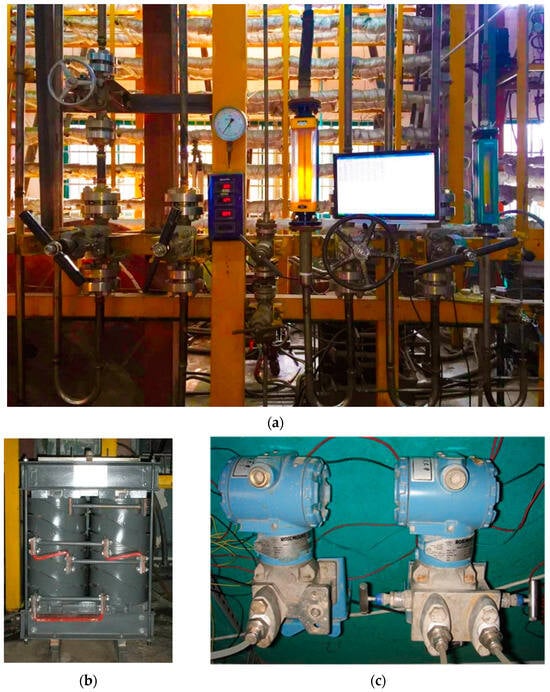
Figure 2.
Photos of part of the equipment in the test loop. (a) Flow control system. (b) Transformer. (c) Pressure and pressure difference transmitter.
2.2. Experimental Section
To simulate the unilateral radiation heating of the divertor target by high-temperature plasma, it is necessary to obtain a high circumferential non-uniform heat flux in the cooling channel. The traditional heating methods such as silicon carbon rods and particle guns have some shortcomings such as limited heating power and easy to be affected by the arrangement of thermocouples. In this experiment, a circumferential non-uniform heat flux was obtained by biasing the cooling channel to one side and electrically heating the whole test section. Numerical simulation results were obtained by ANSYS CFX16.0to select the material and bias size of the experimental section. In the early design of CFETR, the material of the cooling channel of the divertor target is tungsten. In Figure 3a, black points show the circumferential heat flux when the tungsten cooling channel is located in the center under unilateral radiation heating under p = 4.2 MPa, G = 4000 kg·m−2·s−1 and qe =10 MW·m−2, while red points show the circumferential heat flux of the pure nickel cooling channel by electrically heated under the same working condition. It can be seen that under the condition of unilateral radiation heating, the local heat flux at the top of the cooling section reaches 10.6 MW·m−2, while the local heat flux at the bottom is only 0.9 MW·m−2. In the case of one-side electric heating, the heat flux at the top of the cooling section is 7.7 MW·m−2, and the heat flux at the bottom is 1.7 MW·m−2. After comparing with the simulation results of other materials, it is found that when the material is pure nickel, the circumferential distribution of heat flux in the cooling channel is closest to the situation of unilateral radiation, so Ni6 is chosen to be the material of the test section. Before starting the formal test, in order to verify the rationality of the selected scheme, the measured circumferential outer wall temperature of the experimental section was compared with the numerical simulation results, as shown in Figure 3b. It can be seen that the highest temperature and the lowest temperature in the test values are close to the simulated values, respectively, and the circumferential distribution of the measured outer wall temperature has the same trend as the simulated results. Therefore, we consider that this test scheme is reasonable.
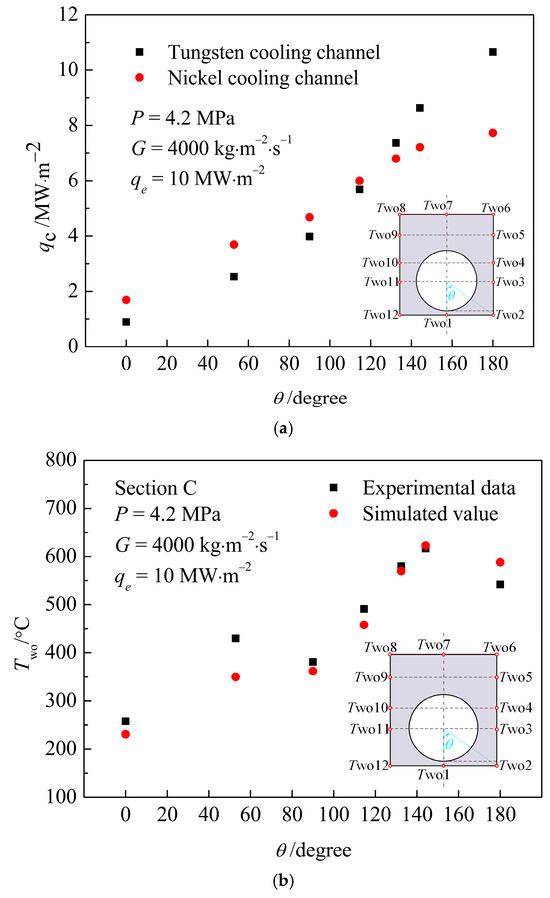
Figure 3.
Design and verification of cross-section dimensions of experimental section. (a) Circumferential heat flux distribution for two solid domains. (b) Comparison of experimental and simulated values of circumferential outer wall temperature.
The photo of overall appearance of the experimental section is shown in Figure 4a. The two ends of the cuboid are inserted into the copper electrode and fixed by silver welding. The photos of the cross section and the twisted tapes (TT) are shown in Figure 4b,c, respectively. In the center of the circular channel, a TT with width WTT = 8 mm, thickness 0.3 mm, and distortion ratio y = 2 is built, and its material is 321 stainless steel. Where y is defined as the ratio of bond pitch LTT to WTT.
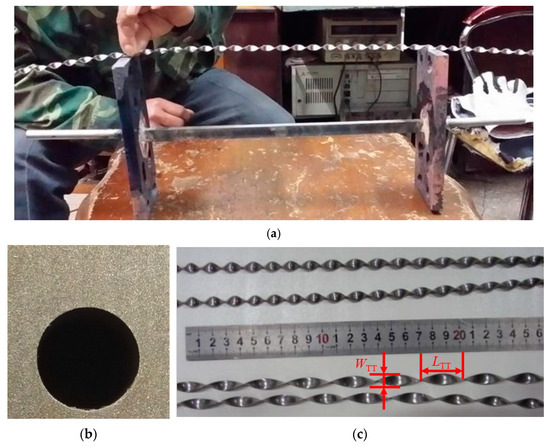
Figure 4.
Photos of the experimental section and twisted tapes. (a) The overall appearance of the experimental section. (b) The cross-section. (c) The twisted tapes.
The axial locations of the temperature measuring points on the outer wall are shown in Figure 5a. A total of 60 nickel–chromium/nickel–silicon thermocouples were arranged on 5 selected sections to measure the outer wall temperature. The cross-section size and thermocouples distribution are shown in Figure 5b, in which the red circles are temperature measuring positions. A cuboid with a cross-section size of 15 × 14 mm2 is cut through an off-center circular hole with a diameter of 9 mm along the flow direction. The center of the cross-section is 5.3 mm away from the outer surface of the thin wall. Due to the thickness difference of the metal part around the cooling channel, the Joule heat generated on the thick-wall side of the test section will be much larger than that on the thin-wall side. The test section is installed vertically, its effective heating length is 360 mm, the deionized water flows from the bottom up, and the sizes of the stability sections for inlet and outlet are 450 mm and 270 mm, respectively.
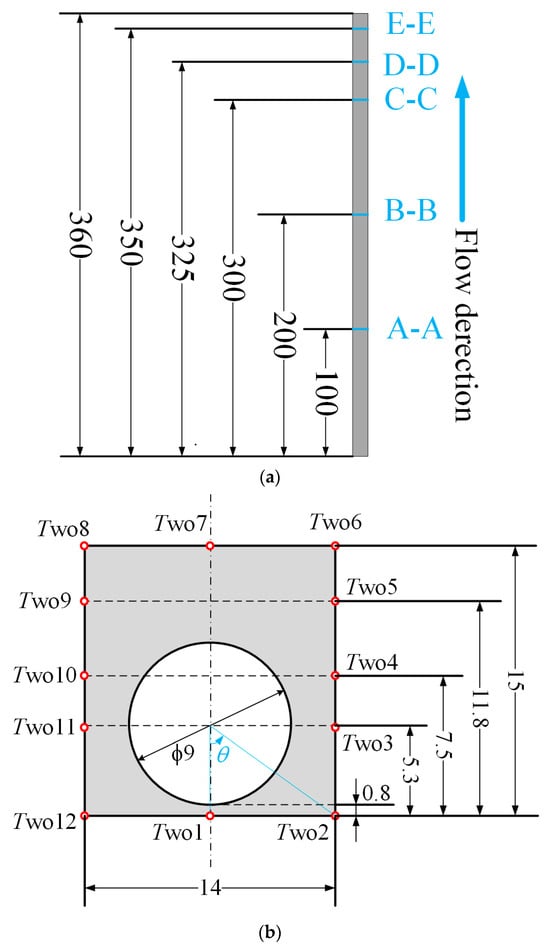
Figure 5.
The experimental section size (mm) and thermocouples distribution. (a) The axial locations of the temperature measuring points on the outer wall. (b) The cross-section size and thermocouples distribution.
The model, range, and accuracy of the instrument selected for the main measurement parameters are shown in Table 1.

Table 1.
Main measuring instruments.
2.3. Data Reduction
The raw data measured in the experiment need to be processed according to the following formula in order to obtain intuitive results for display and analysis.
The mean heat flux of the cooling channel q is calculated as
where Qeff is the effective heating power, A is the heating area of the cooling channel, k is the thermal efficiency, U and I are the voltage and current of the test section, respectively. Leff is the effective heating length. In the test, k = 95%, Leff = 360 mm.
The equivalent unilateral radiant heat flux of the test section is
where Ae is the equivalent radiation area of the experimental section, and the width of the experimental section W = 14 mm.
The mass flux is defined as
where M is the mass flux, D = 9 mm is the diameter for cross-section of the cooling channel, δ and WTT are the thickness and width of the TT, respectively.
The two measuring points of the differential pressure transmitter are located not far away from the two ends of the experimental section, the measured value of the pressure drop is represented by Δpmea, which is calculated as
where Δp is the pressure drop of the experimental section, representing the sum of friction pressure drop, acceleration pressure drop and local pressure drop generated by the TT; Δpg is the pressure drop due to gravity; Δpf,in is the friction pressure drop from the measuring point near the entrance of the experimental section to the inlet section (referred to as the inlet adiabatic section); Δpf,out is the pressure drop from the measuring point near the outlet of the test section to the exit section (referred to as the outlet adiabatic section). They are calculated as follows:
where ρl is the density of the working medium (single-phase water), Lin is the length of the entrance adiabatic section, Leff is the effective heated length of the experimental section, and Lout is the length of the exit adiabatic section.
In the formula, the pressure drop coefficient of entrance and exit adiabatic section fad,in, fad,out is calculated by Filonenko correlation, namely:
The hydraulic diameter is calculated as
Pressure drop coefficient of the experimental section is defined as
where ρ is the average density of the bulk fluid in the experimental section.
The average relative error is defined as
In error analysis, the root mean square error is calculated as:
where N is the number of data points, αcal,i and αexp,i are the calculated and experimental values of the i th data point, respectively.
2.4. Heat Balance Experiment
Although the experimental section is wrapped with thermal insulation cotton to reduce heat dissipation, a small amount of heat loss is still inevitable. In order to obtain more accurate experimental results, it is necessary to conduct a thermal balance experiment to evaluate the thermal efficiency k of the experimental section. The calculation formula is as follows:
In the formula, Hout and Hin are the enthalpy values of the fluid at the outlet and inlet, respectively, and Q is the total heating power of the experimental section. According to the experimental data under the heated single-phase flow condition, the thermal efficiency k = 95% can be obtained.
2.5. Uncertainty Analysis
The calculation method of uncertainty proposed by Cole and Steele in reference [20] is as follows:
where Y is the dependent variable, that is, the experimental parameter to be analyzed; Xi is the independent variable, that is, the direct measurement in the experiment. Y can be calculated by Xi.
In this way, the uncertainty analysis of the main test parameters was carried out, and the results were summarized in Table 2.
Table 2.
Uncertainties of the main test parameters.
3. Effect of System Parameters
3.1. Typical Working Conditions
Figure 6 shows the comparison of pressure drop curves of the test section with and without a TT under qe = 7.5 MW·m−2, p = 4.2 MPa, and G = 4000 kg·m−2·s−1. It can be observed that with the increase in inlet bulk temperature Tb,in, both pressure drop curves show a trend of slightly decreasing at first and then gradually increasing, and the slope of rise also increases with the increase in Tb,in. In order to facilitate analysis, the lowest point of the pressure drop curve can be approximated as the onset of nucleate boiling (ONB) [21], and the bulk temperature corresponding to this point is called Tb,ONB. The region where Tb,in ≤ Tb,ONB is defined the SP flow region. In this region, the viscosity of the fluid decreases with the increase in Tb,in, so Δp is slightly reduced. When Tb,in > Tb,ONB, the working medium enters the partial boiling (PB) flow region. In this region, steam bubbles begin to emerge from the position near the thick-wall side of the outlet. With the further increase in Tb,in, the number of steam bubbles increases, and the position where the steam bubbles begin to emerge gradually moves toward the inlet. When the increasing effect of the bubble is offset by the decreasing effect of the viscosity on the Δp, the pressure drop curve reaches its lowest point. As Tb,in continues to increase, the Δp begins to rise, and the subcooled boiling becomes more and more intense until it enters the fully developed subcooled boiling (FDB) region, where the slope of the pressure drop curve increases significantly.
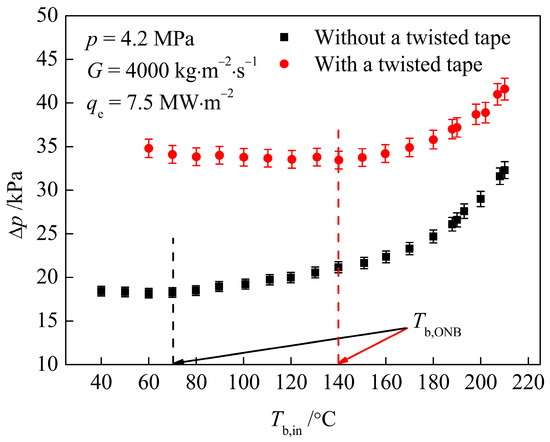
Figure 6.
Comparison of pressure drop curves with and without a TT under typical working conditions.
Comparing the two curves, it can be observed that due to the difference in local pressure drop, the Δp with a TT is significantly higher than that without a TT. The test section without a TT enters the PB region at about Tb,in = 70 °C, while the test section with a TT enters the PB region at about Tb,in = 140 °C. This is because the vortex flow brought by the TT greatly enhances the heat transfer and significantly delays the ONB.
3.2. Effect of Pressure
Figure 7 shows how the Δp with a TT changes with Tb,in under the working conditions of G = 4000 kg·m−2·s−1, qe = 10 MW·m−2, p = 3, 4.2, 5 MPa. It can be seen that when Tb,in ≤ 90 °C, the difference of Δp under different system pressures is small, and the three pressure drop curves all decrease slightly with the increase in Tb,in. When Tb,in increases further, the pressure drop curve of p = 3 MPa starts to rise, and the slope increases gradually with the increase in Tb,in. When Tb,in = 110 °C and Tb,in = 120 °C, the pressure drop curves of p = 4.2 MPa and p = 5 MPa also start to rise, and the slopes also increase gradually. At the same Tb,in, a higher p leads to a lower Δp. This is because when Tb,in ≤ 90 °C, the three pressure drop curves are all in the SP region, and the influence of system pressure on the SP pressure drop is small. Under the same qe and G, the lower the pressure, the earlier the SB region will be entered. And under the same Tb,in, the lower the pressure, the more intense the subcooled boiling, the more bubbles produced, and the larger the Δp.
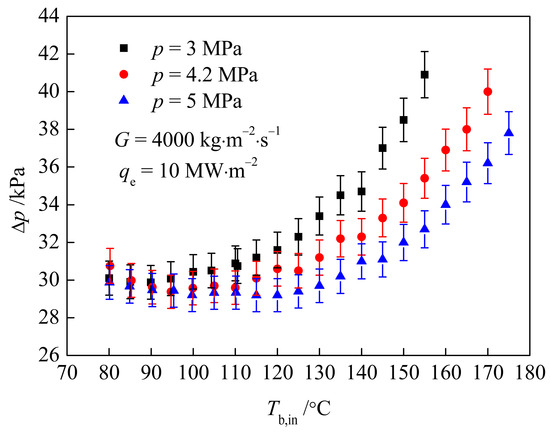
Figure 7.
Effect of system pressure on pressure drop of the test section.
3.3. Effect of Mass Flux
Under the working condition of qe = 7.5 MW·m−2, G = 3000~5000 kg·m−2·s−1, and p = 4.2 MPa, the Δp curve of the experimental section with a TT varies with Tb,in, as shown in Figure 8. It can be observed that under the same Tb,in, a higher G leads to a greater Δp. When Tb,in = 100 °C, the pressure drop curve of G = 3000 kg·m−2·s−1 begins to rise, and its slope gradually increases with the increase in Tb,in. When Tb,in = 120 °C, the pressure drop curves under G = 4000 kg·m−2·s−1 also began to rise, and the slope gradually increased. The Δp is monotonically increasing with Tb,in at G = 5000 kg·m−2·s−1, and the slope gradually increased, too. This is because when Tb,in is low, the working medium under the three working conditions is in an SP state, and G is the decisive factor of Δp. With the increase in Tb,in, the Δp curve of G = 3000 kg·m−2·s−1 first enters the PB region, and the bubbles lead to the increase in Δp. As Tb,in continues to increase, the pressure drop curves under G = 4000 kg·m−2·s−1 and G = 5000 kg·m−2·s−1 also enter the PB region.
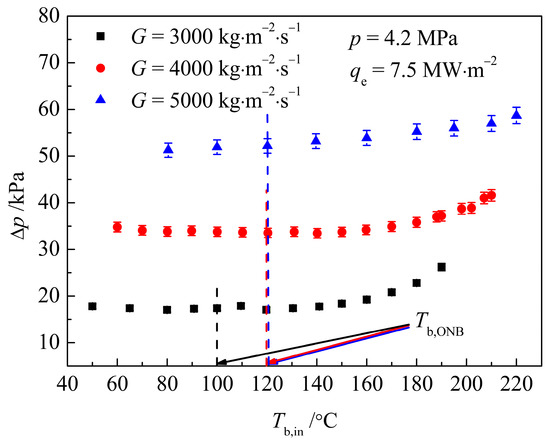
Figure 8.
Effect of mass flux on pressure drop of the test section.
3.4. Effect of Heat Flux
Figure 9 shows the variation curve of the Δp with a TT with Tb,in under the working condition of qe = 5, 7.5, 10 MW·m−2, p = 4.2 MPa, and G = 4000 kg·m−2·s−1. As can be observed from the figure, at a lower Tb,in, the three pressure drop curves slightly decrease with the increase in Tb,in, and the lower the qe, the larger the Δp. When Tb,in = 95 °C, the pressure drop curve under qe = 10 MW∙m−2 first starts to rise, and the slope increases with the increase in Tb,in, until it exceeds the Δp value under the other two qe successively. The pressure drop curves of qe = 7.5 MW∙m−2 and qe = 5 MW∙m−2 began to rise at Tb,in = 120 °C and Tb,in = 140 °C, respectively, and the slope also gradually increased. At Tb,in = 190 °C, the Δp at qe = 7.5 MW∙m−2 began to exceed the Δp at qe = 5 MW∙m−2. At a high Tb,in, the higher qe leads to a greater Δp. This is because at a low Tb,in, the three pressure drop curves are all located in the SP region. At this time, the smaller the qe, the greater the fluid viscosity near the wall, and the greater the Δp. The three pressure drop curves enter the subcooled boiling region at Tb,in = 95 °C, 120 °C, and 140 °C, respectively, according to the order of qe from large to small. When Tb,in > 180 °C, under the same Tb,in, the higher the qe, the more intense the subcooled boiling, the more bubbles produced, so the larger the Δp.
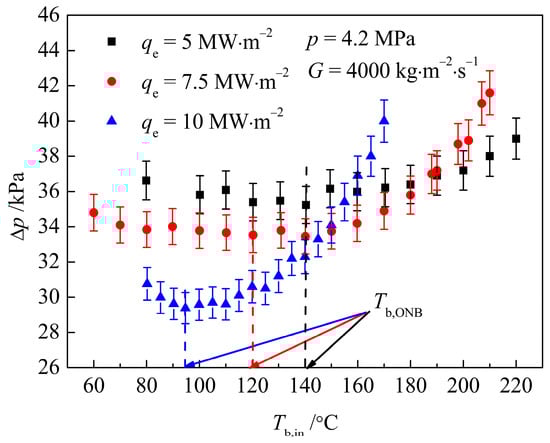
Figure 9.
Effect of heat flux on pressure drop of the experimental section.
4. Evaluation of Pressure Drop Correlations
The SP adiabatic flow and heated flow under common experimental conditions have been investigated in detail. Theoretical models have been developed and some empirical pressure drop correlations have been proposed, most of which can be expressed in the following form:
where (f/fad) is the ratio of pressure drop coefficient under the heated condition to that under adiabatic condition, (ρw/ρb) is the ratio of the fluid density under wall condition to that under bulk condition, and (ηw/ηb) is the ratio of fluid viscosity under wall condition to that under bulk condition, respectively. Among these correlations, the empirical constants m and n are different under different experimental conditions.
In engineering applications, for single-phase flow of subcritical fluids, the influence of the density gradient caused by the temperature gradient on the flow pressure drop is much smaller than that of the viscosity gradient, so most of the correlations will ignore the influence of the density gradient, that is, m = 0. For the flow of supercritical fluids, especially near the quasi-critical region, the effect of the density gradient on Δp is considerable and cannot be ignored.
Some correlations for SP adiabatic flow and SP heated flow pressure drop under conventional conditions are shown in Table 3. The fluid temperature gradient under high heat flux is also large due to a large heat transfer temperature difference (ΔT = Tw − Tb). In addition to the non-uniformity of circumferential heat flux caused by off-center electric heating, the effect of the density gradient and viscosity gradient caused by the superposition of the two factors on the flow pressure drop is complicated, and it is necessary to evaluate and analyze specifically.
Table 3.
Pressure drop correlations for SP heated flow.
Figure 10 shows the comparison between the experimental values of (f/fad) without a TT in this test and calculated values using the SP pressure drop correlations in Table 3. It can be observed that most of the correlations overestimate the (f/fad) at a given viscosity ratio. Only the Owens-Schrock correlation predicted the experimental results relatively well, but it also overestimated most experimental results. This is mainly due to the different range of test conditions applicable to each correlation. As shown in Table 3, in the application range of Owens-Schrock correlation, the pressure is lower than the pressure range of this test, and the heat flux and mass flux are closer to those in this test. However, the range of working conditions applicable to other correlations is quite different from that in this test. In addition, most of the correlations in Table 3 were proposed under the condition that the channel is uniformly heated, while the test data are obtained under the circumferential non-uniform heat fluxes, which may also have a certain impact on the result.
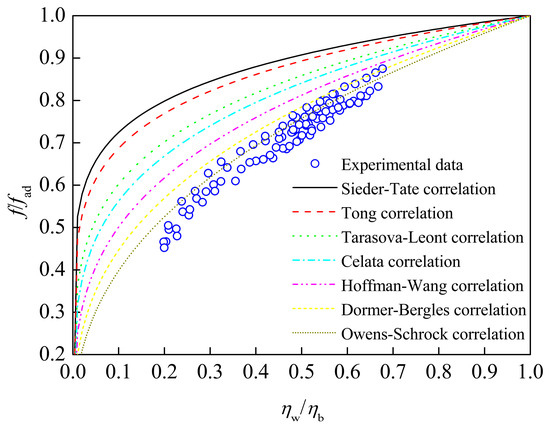
Figure 10.
Comparison of experimental data with calculated values of single-phase pressure drop correlations.
Since the experiment was conducted under high heat fluxes and high mass fluxes, the influence of q and G on the ratio of the pressure drop coefficient is considered. In order to facilitate dimensionless, the reference mass flux G0 = 1000 kg·m−2·s−1 and the reference heat flux q0 = 1 MW·m−2 are taken. Let the mass flux G = j·G0, heat flux q = k·q0, .
By fitting the n value according to the experimental data, C1 = 0.45 and C2 = 0.1 can be obtained. The resulting correlation is:
Figure 11a,b, respectively, show the relative error E between the predicted value and experimental value of the SP pressure drop coefficient by SP pressure drop correlations. It can be observed that in Figure 11a, the prediction effect of Owens-Schrock correlation and Dormer-Bergles correlation is reasonable. All the predicted values of Owens-Schrock correlation fall within the error range of −5% to 20%, and most of the predicted errors for the Dormer-Bergles correlation fall in the range of 0 to 20%. The predicted values of Tarasova-Leont correlation mostly fall in the error range of 0 to 40%, while the Sider-Tate correlation was less effective. In Figure 11b, the predicted errors of Tong association are relatively large, and most of the predicted values of Celata correlation and Hoffman-Wang correlation are in the error range of 0 to 40%, while the predicted performance of the new correlation represented by expression (16) is the best, most of the data points are in the error range of −5% to 10%, and the average error (AE) and root mean square error (RMSE) are 0.26% and 3.17%, respectively. It is worth noting that although the form of the new pressure drop correlation proposed in this paper is simple, the influences of high heat flux and high mass flux have been included in the calculation of the exponential term n. In the calculation of the viscosity ratio (ηw/ηb), the influence of system pressure and inlet fluid temperature is also included.
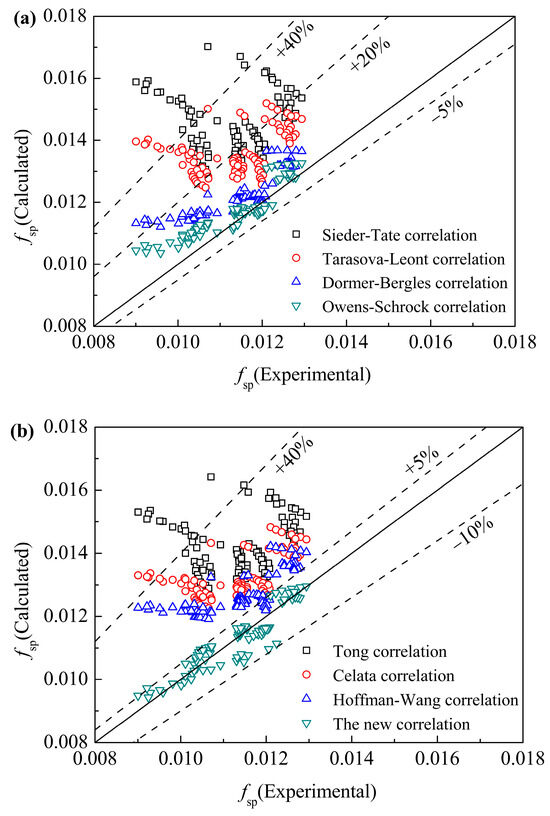
Figure 11.
Relative errors between the experimental values and calculated values of the single-phase pressure drop correlations. (a) Sieder-Tate correlation, Tarasova-Leont correlation, Dormer-Bergles correlation and Owens-Schrock correlation. (b) Tong correlation, Celata correlation, Hoffman-Wang correlation and the new correlation.
Figure 12a,b show the variation of prediction errors of each single-phase pressure drop correlation with the heat transfer temperature difference ΔT of the experimental section. The results show that the prediction errors of most correlations increase with the increasing ΔT, but the prediction errors of the new correlation proposed in this paper are relatively evenly distributed under different ΔT.
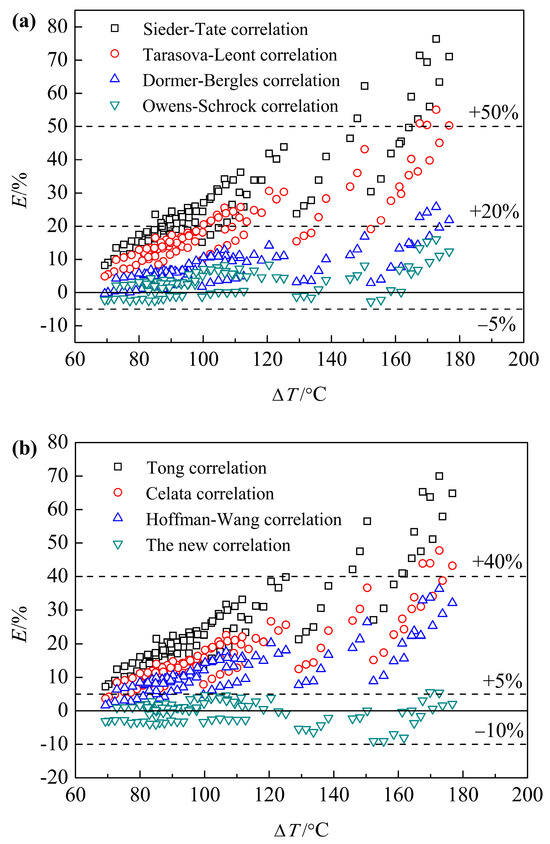
Figure 12.
The relative error distribution of single-phase pressure drop correlations. (a) Sieder-Tate correlation, Tarasova-Leont correlation, Dormer-Bergles correlation and Owens-Schrock correlation. (b) Tong correlation, Celata correlation, Hoffman-Wang correlation and the new correlation.
Table 4 shows the AEs and RMSEs of the SP pressure drop correlations in heated circular channels. It can be observed that the new correlation proposed in this paper has the best predictive performance.
Table 4.
Prediction errors of typical single-phase pressure drop correlations.
5. Conclusions
Aiming at the water-cooling structure of the divertor target in China Fusion Engineering Experimental Reactor (CFETR), experimental studies of SP and SB flow in test sections with and without a twisted tape have been carried out under the conditions of high mass flux, non-uniform high heat flux, and high subcooling degree. The pressure drop characteristics under different system parameters are analyzed, and the following conclusions can be drawn:
- (1)
- According to the analysis of pressure drop in the test section under typical working conditions, the pressure drop curve can be divided into two parts: SP flow region and SB (including PB and FDB) flow region. In the SP region, Δp decreases slightly with the increasing Tb,in. In the SB flow region, the pressure drop curve began to rise, and the slope increased with the increasing bulk temperature. The Δp increased significantly at a high Tb,in.
- (2)
- The factors affecting Δp are analyzed in detail. The results show that inlet pressure and bulk temperature have little effect on Δp in SP region. The mass flux is the main factor that determines Δp. A higher G leads to a larger Δp. The higher the qe, the smaller the Δp. In the SB flow region, the Δp mainly depends on the intensity of nuclear boiling. The lower p, the higher qe and Tb,in lead to a stronger nuclear boiling, then cause more bubbles produced, and a larger Δp.
- (3)
- A series of SP flow pressure drop correlations have been evaluated with experimental data and error analysis was carried out: most of them could not predict the pressure drop well under the experimental conditions. Based on the test data, the SP pressure drop correlation suitable for high mass flux and non-uniform high heat flux conditions was fitted. The new correlation has a good agreement with the experimental results, the AE and RMSE are 0.26% and 3.17%, respectively.
The above results can provide a theoretical basis for the design of the water-cooling structure of the divertor target in CFETR and other fusion reactors, and can also provide a reference for other flow pressure drop problems under high and non-uniform heat fluxes.
Author Contributions
Conceptualization, G.Z.; Methodology, G.Z.; ANSYS CFX16.0 G.M.; Validation, G.M.; Formal analysis, Q.B.; Investigation, G.Z.; Data curation, G.M.; Writing—original draft, G.Z.; Writing—review & editing, Q.B.; Supervision, S.T.; Project administration, S.T. All authors have read and agreed to the published version of the manuscript.
Funding
The work is financially supported by the Key Scientific Research Project of the Universities of Henan Province in China (No. 24A490001) and the Science and Technology Project of Henan Province in China (No. 232102320226).
Data Availability Statement
Data are contained within the article.
Conflicts of Interest
The authors declare no conflict of interest.
Nomenclature
| A | area (m2) |
| Af | flow area (m2) |
| Dh | hydraulic diameter (m) |
| f | friction factor (-) |
| G | mass flux (kg·m−2·s−1) |
| h | heat transfer coefficient (kw·m−2·K−1) |
| H | enthalpy (kJ·kg−1) |
| I | current (A) |
| k | thermal efficiency (%) |
| L | length (m) |
| Lh | heated length of tube (m) |
| M | mass flow (kg·m−2·s−1) |
| p | pressure (MPa) |
| Δp | pressure drop (MPa) |
| Pw | wetting perimeter (m) |
| q | heat flux (kW·m−2) |
| Q | power (kW) |
| T | temperature (°C) |
| ΔT | heat transfer temperature difference (°C) |
| U | voltage drop (V) |
| W | width (m) |
| density (kg·m−3) | |
| η | viscosity (Pa·s) |
| Subscripts | |
| ad | adiabatic |
| b | bulk |
| c | circumferential |
| cal | calculated |
| e | equivalent |
| eff | effective |
| exp | experimental |
| FDB | fully developed boiling |
| g | gravity |
| in | inlet of the test section |
| out | outlet of the test section |
| sp | single phase |
| TT | twist tape |
| w | wall |
References
- Raffary, A.R.; Schlosser, J.; Akiba, M.; Araki, M.; Chiocchio, S.; Driemeyer, D.; Escourbiac, F.; Grigoriev, S.; Merola, M.; Tivey, R.; et al. Critical heat flux analysis and R&D for design of the ITER divertor. Fusion Eng. Des. 1999, 45, 377–407. [Google Scholar]
- Baxi, C.B. Comparsion of swirl tube and hypervapotron for cooling of ITER divertor. In Proceedings of the 16th International Symposium on Fusion Engineering, Champaign, IL, USA, 30 September–5 October 1995; Volume 1, pp. 186–189. [Google Scholar]
- Tabatabaeikia, S.; Mohammand, H.A.; Nik-Ghazali, N.; Shahizare, B. Heat transfer enhancement by using different types of inserts. Adances Mech. Eng. 2014, 24, 623–632. [Google Scholar] [CrossRef]
- Eiamsa-Ard, S.; Somkleang, P.; Nuntadusit, C.; Thianpong, C. Heat transfer enhancement in tube by inserting uniform/non-uniform twisted-tapes with alternate axes: Effect of rotated-axis length. Appl. Them. Eng. 2013, 54, 289–309. [Google Scholar] [CrossRef]
- He, Y.; Liu, L.; Li, P.; Ma, L. Experimental study on heat transfer enhancement characteristics of tube with cross hollow twisted tape inserts. Appl. Them. Eng. 2018, 131, 743–749. [Google Scholar] [CrossRef]
- Sharma, K.V.; Syam, S.L.; Sarma, P.K. Estimation of heat transfer coefficient and friction factor in the transfition flow with low volume concentration of Al2O3 nanofluid in a circular tube and with twisted tape insert. Int. Common. Heat Mass 2009, 36, 503–507. [Google Scholar] [CrossRef]
- Akhavan-Behahabadi, M.A.; Ravi Kumar Mohammadpour, A.; Jamali-Aathiani, M. Effect of twisted tape insert on heat transfer and pressure drop in horizontal evaporators for the flow of R-134a. Int. J. Heat Mass Transf. 2009, 32, 922–930. [Google Scholar]
- Hejazi, V.; Akavan-Behabadi, M.A.; Afahari, A. Experimental investigation of twisted tape inserts performance on condensation heat transfer enhancement and pressure drop. Int. Common. Heat Mass 2010, 37, 1376–1387. [Google Scholar] [CrossRef]
- Bas, H.; Ozceyhan, V. Heat transfer enhancement in a tube with twisted tape inserts placed seprarately from the tube wall. Exp. Therm. Fluid Sci. 2012, 41, 51–58. [Google Scholar] [CrossRef]
- Cioncolini, A.; Santini, L.; Ricotti, M.E. Subcooled and saturated water flow boiling pressure drop in small diameter helical coils at low pressure. Exp. Therm. Fluid Sci. 2008, 32, 1301–1312. [Google Scholar] [CrossRef]
- Tarasova, N.V.; Leontiev, A.; Hlopushin, V.I.; Orlov, V.M. Pressure drop of boiling subcooled water and steam-water mixture flowing in heated channels. In Proceedings of the International Heat Transfer Conference 3, Chicago, IL, USA, 7–12 August 1966. [Google Scholar]
- Owens, W.L.; Schrock, V.E. Local Pressure Gradients for Subcooled Boiling of Water in Vertical Tubes; ASME Paper 60-WA-249; ASME: New York, NY, USA, 1960. [Google Scholar]
- Domer, T.J.; Bergles, A.E. Pressure Drop with Surface Boiling in Small-Diameter Tubes; MIT Report No. 8767-31; MIT Libraries: Cambridge, MA, USA, 1964. [Google Scholar]
- Bergles, A.E.; Dormer, T., Jr. Subcooled boiling pressure drop with water at low pressure. Int. J. Heat Mass Transf. 1969, 12, 459–470. [Google Scholar] [CrossRef]
- Inasaka, F.; Nariai, H.; Shimura, T. Pressure drop of subcooled flow boiling in narrow tube. Trans. Jpn. Soc. Mech. Eng. Ser. B 1987, 53, 3093–3099. [Google Scholar] [CrossRef]
- Hoffmanm, A.; Wongc, F. Prediction of pressure drops in forced convection subcooled boiling water flows. Int. J. Heat Mass Transf. 1992, 35, 3291–3299. [Google Scholar] [CrossRef]
- Davise, J.; Andersong, H. The incipience of nucleate boiling in forced convection flow. AIChE J. 1966, 12, 774–780. [Google Scholar] [CrossRef]
- Saha, P.; Zuber, N. Point of net vapor generation and vapor void fraction in subcooled boiling. In Proceedings of the International Heat Transfer Conference 5, Tokyo, Japan, 3–7 September 1974; pp. 175–179. [Google Scholar]
- Yan, J.; Guo, P.; Bi, Q.; Liu, Z.; Zhang, Q.; Yang, Z. Pressure drop for highly subcooled water flow boiling under high heat and mass fluxes. Appl. Therm. Eng. 2017, 124, 1061–1074. [Google Scholar] [CrossRef]
- Coleman, H.W.; Steele, W.G. Engineering application of experimental uncertainty analysis. AIAA J. 1995, 33, 1888–1896. [Google Scholar] [CrossRef]
- Piero, C.E.A.A.G.; Maurizio, C.U.O.; Andrea, M.A.I.N. Experimental evaluation of the onset of subcooled flow boiling at high liquid velocity and subcooling. Int. J. Heat Mass Transf. 1997, 40, 2879–2885. [Google Scholar]
- Sieder, E.N.; Tate, G.E. Heat transfer and pressure drop of liquids in tubes. Ind. Eng. Chem. 1936, 28, 1429–1435. [Google Scholar] [CrossRef]
- Tong, W.; Bergles, A.E.; Jensen, M.K. Pressure drop with highly subcooled flow boiling in small-diameter tubes. Exp. Therm. Fluid Sci. 1997, 15, 202–212. [Google Scholar] [CrossRef]
Disclaimer/Publisher’s Note: The statements, opinions and data contained in all publications are solely those of the individual author(s) and contributor(s) and not of MDPI and/or the editor(s). MDPI and/or the editor(s) disclaim responsibility for any injury to people or property resulting from any ideas, methods, instructions or products referred to in the content. |
© 2023 by the authors. Licensee MDPI, Basel, Switzerland. This article is an open access article distributed under the terms and conditions of the Creative Commons Attribution (CC BY) license (https://creativecommons.org/licenses/by/4.0/).