1. Introduction
Ongoing research in the field of hydrogen fuel cells is currently focused on the development of technologies aimed at reducing cost for expensive materials such as catalyst layers and extending the lifespan of fuel cell stack components, of which the membrane–electrode assemblies (MEAs) are the most critical ones. The implementation of low-cost and high-volume manufacturing processes is also crucial in order to make fuel cell systems cost-competitive with traditional technologies. Additionally, effective temperature management within a fuel cell stack is a key aspect that contributes to further improvements in this technology [
1].
Thermal management plays a critical role in the performance and durability of fuel cells. Temperature gradients can lead to thermal stresses on the components of the fuel cell, resulting in their accelerated degradation over time and a decrease in the overall efficiency of the system [
2]. Technical issues such as slow reaction rates and low power values are also associated with inadequate temperature control [
3]. Therefore, it is essential to operate the fuel cell within optimal and homogeneous temperature ranges.
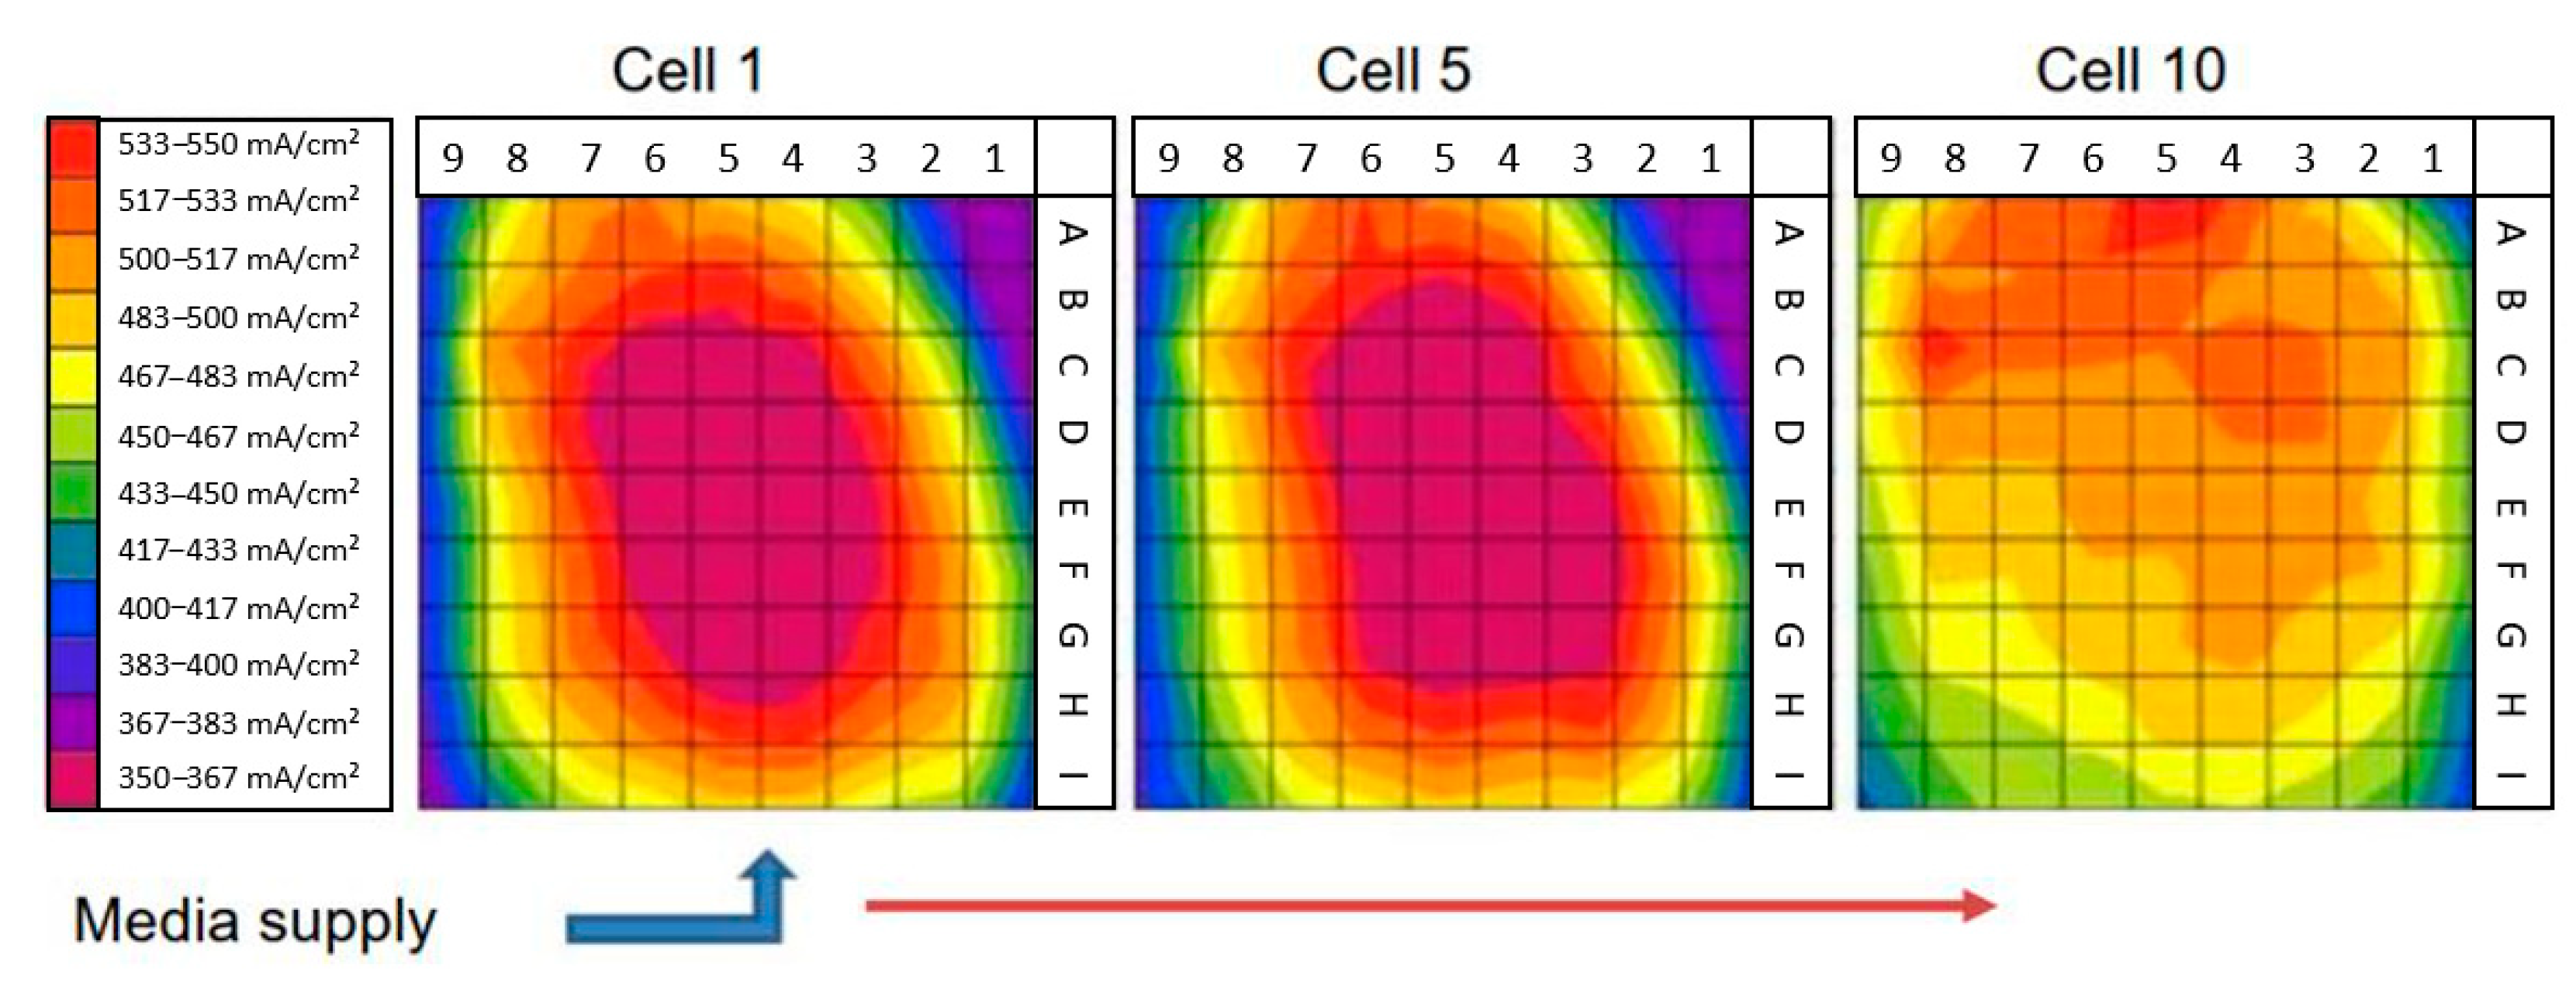
Figure 1 shows that this is of great importance for reliable operation by visualizing the current density distribution of three different cells within a 10-cell stack of a water-cooled PEM fuel cell. The entire media supply of the stack is located on one side of the stack, close to the first cell.
It can be clearly seen that the individual cells within the stack produce very inhomogeneous current densities, and that this phenomenon is also reflected on the cell surface of the individual cells measured. This uneven distribution is very disadvantageous for the operation and longevity of the fuel cell, as it can lead to the formation of local hotspots that place increased stress on the cell and can lead to the failure of the cell or the stack. The measurements shown in
Figure 1 were recorded using a so-called segmented bipolar plate, which was also developed at DLR [
5]. The segmented bipolar plate takes on the same functions and tasks as a conventional bipolar plate, but has a network of sensors inside for parameter recording [
4,
5]. It provides a very high-resolution parameter measurement, but is very complex, inflexible, and expensive. Kang et al. also presented a method in [
6] for detecting voltage losses within the cell in different areas on the cell surface, but used electrical sensors that were susceptible to disturbances within the cell.
Traditionally, thermoelectric sensors have been employed for temperature measurement in fuel cells. While these sensors offer acceptable accuracy, their limited spatial resolution prevents the precise detection of local temperature variations. Moreover, they are susceptible to electromagnetic interference and require complex wiring. The integration of such thermocouples also affects the operation and performance of the cell, as the geometry and dimensions of the sensors are very unfavorable for this application. For example, they impair the gas flow and distribution on the surface and thus generate a distorted operating behavior. In recent years, the integration of fiber optic sensors has emerged as a promising alternative for temperature measurement in different types of technical systems. Fiber optic sensors are based on the principle of light conductivity in glass fibers and offer several advantages over conventional sensors. They are immune to electromagnetic interference, provide high accuracy, and significantly improve spatial resolution [
7,
8]. This technology is now to be investigated for use in a fuel cell to examine the spatially resolved temperature on the cell surface.
The aim of this study is to validate the functionality of fiber sensor technology integrated into a cell of a fuel cell stack, which performs spatially resolved temperature measurements on the active surface during operation.
Section 2 briefly describes the basics and functional principle of fiber sensor technology to define the technical requirements and boundary conditions for fiber integration.
Section 3 focuses on general requirements for sensor integration into fuel cells and the specific characteristics of fuel cells regarding sensor integration, with particular attention given to the bipolar plate.
Section 4 describes the methodological approach for fiber integration. Pre-tests, including pressure tests and pressure-loss tests, are conducted. Subsequently, the adhesion of fiber sensors is examined, and the final layout and integration of the fibers are determined. The results of these investigations are presented in
Section 5. Both quantitative and qualitative results are presented to evaluate the performance of the integrated fibers. Finally,
Section 6 provides a discussion of the results. The potential influencing factors and limitations of this study are discussed, as well as possible approaches for future research projects.
2. Optical Fibers as Measurement Systems
Optical fibers are compact and lightweight, making them suitable for integration into structures or systems with minimal intrusion. This allows for measurements in areas where other systems such as cameras may not have access or where higher intrusion gauges are not feasible. When the structure or system undergoes a physical change, the fiber also experiences the same change and can be measured accordingly. The use of optical fibers for signal transmission and measurement has evolved since their emergence in the 1970s [
9,
10]. This improvement is achieved via modifications in the measurement setup [
11,
12] or signal processing techniques [
13]. The Optical Frequency Domain Reflectometry (OFDR) technique, introduced by Eickhoff et al. in 1981 [
14], builds upon the Optical Time Domain Reflectometry (OTDR) method presented by Personick in 1977 [
15].
Since 2017, Luna Inc. (Roanoke, VA, USA) has developed a high-definition fiber optic sensing device based on OFDR. This device is currently employed at the DLR-Institute of Vehicle Concepts for temperature and strain measurements.
2.1. Measurement Theory
To measure physical changes such as temperature or strain in an optical fiber sensor, light is transmitted through the sensor and the reflected signal is recorded and processed. A unique signature signal of the fiber in its initial state is saved as a reference signal or fingerprint. When the sensor experiences a physical change, the reflected signal also changes. This measurement signal is then compared to the reference signal, allowing for quantification of the physical changes via signal processing.
The fiber sensor consists of a silica (glass) core and a polyimide coat with a diameter of up to 155 µm. Each fiber sensor possesses unique characteristics due to imperfections within the fiber, leading to variations in the refractive index. As there is no mirror at the end of the fiber, most of the optical signal exits after traversing the fiber. The main portion of the reflected light, known as Rayleigh backscattering, results from random fluctuations in the refractive index within the fiber core, alongside Fresnel and Brillouin effects.
Optical Frequency Domain Reflectometry (OFDR) is based on Rayleigh backscattering. It utilizes a Mach–Zehnder interferometry setup (
Figure 2a), where light from a tunable laser source is divided into a reference arm and a measurement arm containing the optical fiber sensor. These signals are then recombined, superposed, polarized, and detected by a PIN Photodiode. To enhance signal processing and improve measurement quality and spatial resolution, an additional trigger interferometer can be incorporated.
A tunable laser is used as the light source, emitting linear frequency sweeps into the system. When combined with signal superposition by the interferometer (
Figure 2b), beating signals are generated. These beating signals are then analyzed to demodulate the shift in physical parameters and determine their location. By performing a Fast Fourier Transform (FFT) on the beating signal, the frequencies of the backscatter points within the fiber can be obtained in the frequency domain. The frequency spectrum, representing the fiber length, is divided into segments of equal width, which correspond to the gauge length within the fiber and determine spatial resolution. Changing the gauge length affects both measurement uncertainty and rate.
A change in temperature or strain causes a shift in frequency. The magnitude of this shift is calculated for each segment by transforming the signal from the frequency domain back to the time domain using inverse FFT, enabling the application of a cross-correlation algorithm. The signal processing steps are illustrated in
Figure 3.
The shift is directly proportional to the physical change in the fiber. The temperature or strain coefficients vary in different types of fiber. The coefficients have typical values of 0.55 × 10
−6 °C
−1 for temperature and 0.787 for strain [
10].
2.2. Specifications
The OFDR measurement system utilized in this study is the Luna ODiSI system. It has the capability to simultaneously measure two optical fiber sensors with gauge length options of 0.65, 1.3, 2.6, or 5.2 mm. The system offers a maximum spatial resolution of 1538 measurement points per meter at a measurement rate of 62.5 Hz. The maximum measurement rate of the system is 250 Hz. By reducing the spatial resolution, the measurement rate can be increased to 125 or 250 Hz for a maximum fiber sensing length of 2.5 m. These values are suitable for single fiber measurements. However, when measuring two fibers simultaneously, the measurement rate is halved. It is important to note that the sensor length can exceed 2.5 m. With this setup, a maximum measurable fiber length of 20 m can be achieved, resulting in a reduced measurement rate of 12.5 or 25 Hz.
Optional modules are available to extend the measurement length up to 100 m; however, this further decreases the measurement rate and spatial resolution. For example, when measuring a 100 m fiber, the smallest possible gauge pitch is 2.6 mm with a maximum measurement rate of 10 Hz.
Temperature and strain are measured concurrently using this setup; however, it is not possible to differentiate between the percentage of elongation caused by mechanical strain versus temperature changes. The temperature measurement range is −40 to 200 °C with a resolution of 0.1 °C and an uncertainty of 2.2 °C. Strains up to 1.5% or 15,000 ε can be measured with a resolution of 1 µε, an uncertainty of 5 µε, and an accuracy of 25 µε [
16]. To solely measure mechanically induced strain, the test setup must maintain a constant temperature. Conversely, to solely measure temperature, the test setup must be free from mechanically induced strain. In such cases, a straight capillary tube surrounding the fiber can decouple the sensing fiber from strain.
2.3. Technical Challanges
The use of the Luna ODiSI presents several technical challenges that need to be considered when used for integration into fuel cells. Firstly, optical fibers are fragile due to their small diameter and there is a risk of fiber rupture during manufacturing or the handling of components [
17]. Additionally, the strain or temperature measurement is applicable only within a certain elastic range of the fiber, which is ±15,000 µε or −40 to 200 °C in this case. Exceeding these boundaries can result in signal dropouts, unrealistic peaks, and inaccurate measurements.
Furthermore, if the bending radius of the fiber is too small, it induces high tension and compression on the outer sides of the fiber. This leads to changes in the refractive index that prohibit continuous Rayleigh backscattering and can affect the accuracy of measurements.
Another challenge arises from the fact that OFDR measures temperature and strain simultaneously. Changes in the measurement signal due to temperature can influence the measurement of strain, and vice versa [
10]. Therefore, when the fiber is mechanically constrained, further analysis is required to evaluate its influence on temperature measurements and compensate for it analytically, as demonstrated in this study.
3. Basics of the Fuel Cell for Fiber Integration
To ensure the precision, dependability, and endurance of a measurement method, it is essential to consider the technical specifications of fiber integration. These specifications encompass various factors, including:
Additionally, the unique characteristics of the fuel cell stack, such as operating temperature, pressure, and humidity levels, must be considered during concept development and implementation. This section provides a comprehensive overview of the technical specifications, design, and geometries relevant to the integration and development of the fiber.
The identification of the main parameters that may impact the cell’s performance is crucial for an effective integration approach. These parameters define the boundaries within which development must occur and determine which components will be affected.
Table 1 below outlines the primary conditioning domains that must be considered throughout the development process.
By adhering to these boundaries, the new feature can be integrated within an appropriate range without compromising the fuel cell stack’s performance. For instance, gas leakage in the stack can affect generated voltage and overall power delivery. Furthermore, introducing new components to the MEA may disrupt reactant distribution and damage porous media, thereby impacting both MEA performance and mechanical stability. On the other hand, integrating the fiber sensor with the fuel cell stack should not interfere with normal operation or be susceptible to damage from operating parameters. Therefore, subsequent sections will discuss the main parameters of the fiber sensor and fuel cell stack operating conditions.
3.1. Fuel Cell for Sensor Integration
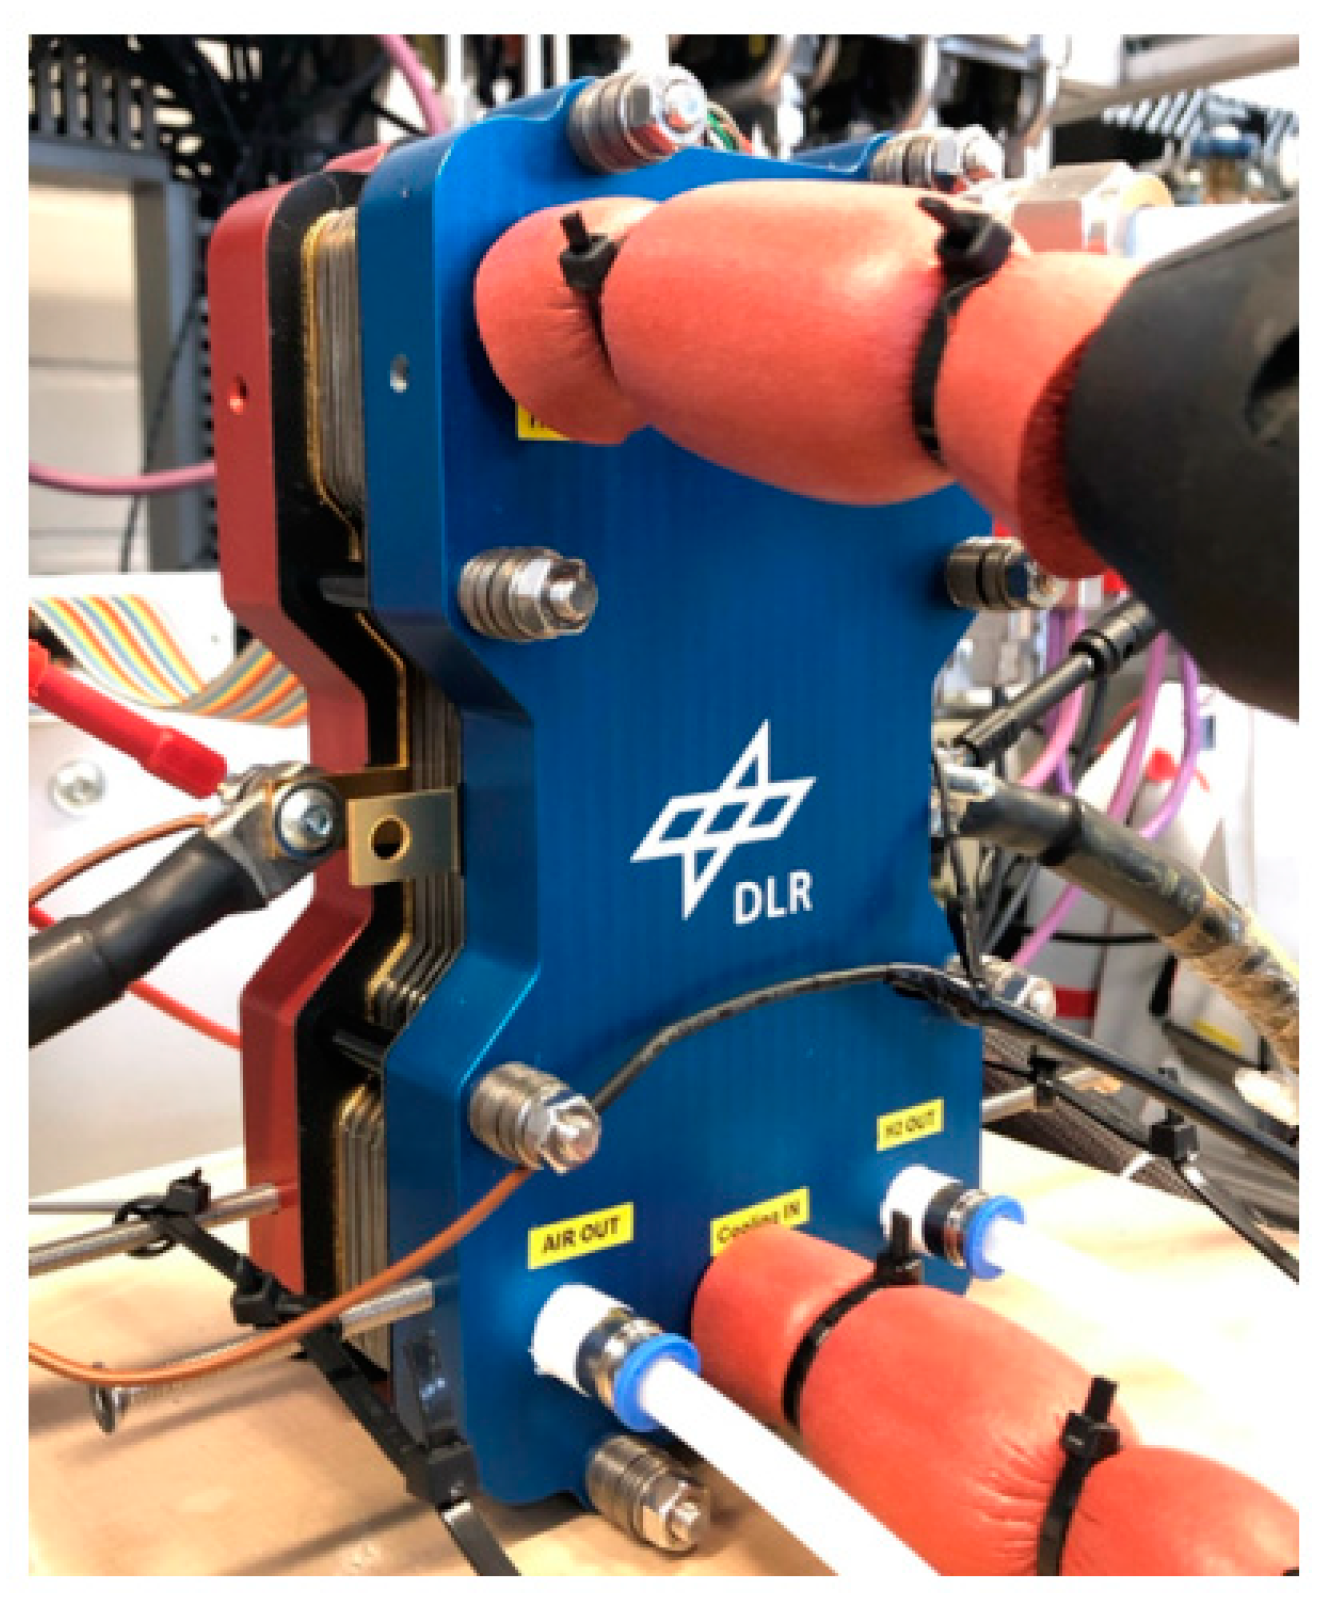
This section provides a description of the specific fuel cell stack utilized at DLR, focusing on its components, parameters, and design. The fuel cell used for sensor integration is developed in the DLR internal TM Project FC-REX for hydrogen-powered cargo pedelecs within the EU Interreg Project FCCP (Fuel Cell Cargo Pedelec, GA: Interreg NEW596). This compact water-cooled fuel cell stack is specifically designed for light electromobility, is capable of achieving long durability even under harsh operating conditions and providing significantly more power than modern batteries, and allowing for a cold start even at temperatures as low as −20 °C in freezing conditions [
18].
Figure 4 shows the integrated fuel cell stack on the test bench.
Table 2 presents the main parameters of the stack and highlights important specifications. It should be noted that the specified maximum operating temperature of 120 °C should only be present for a very short period of time due to the risk of membrane decomposition.
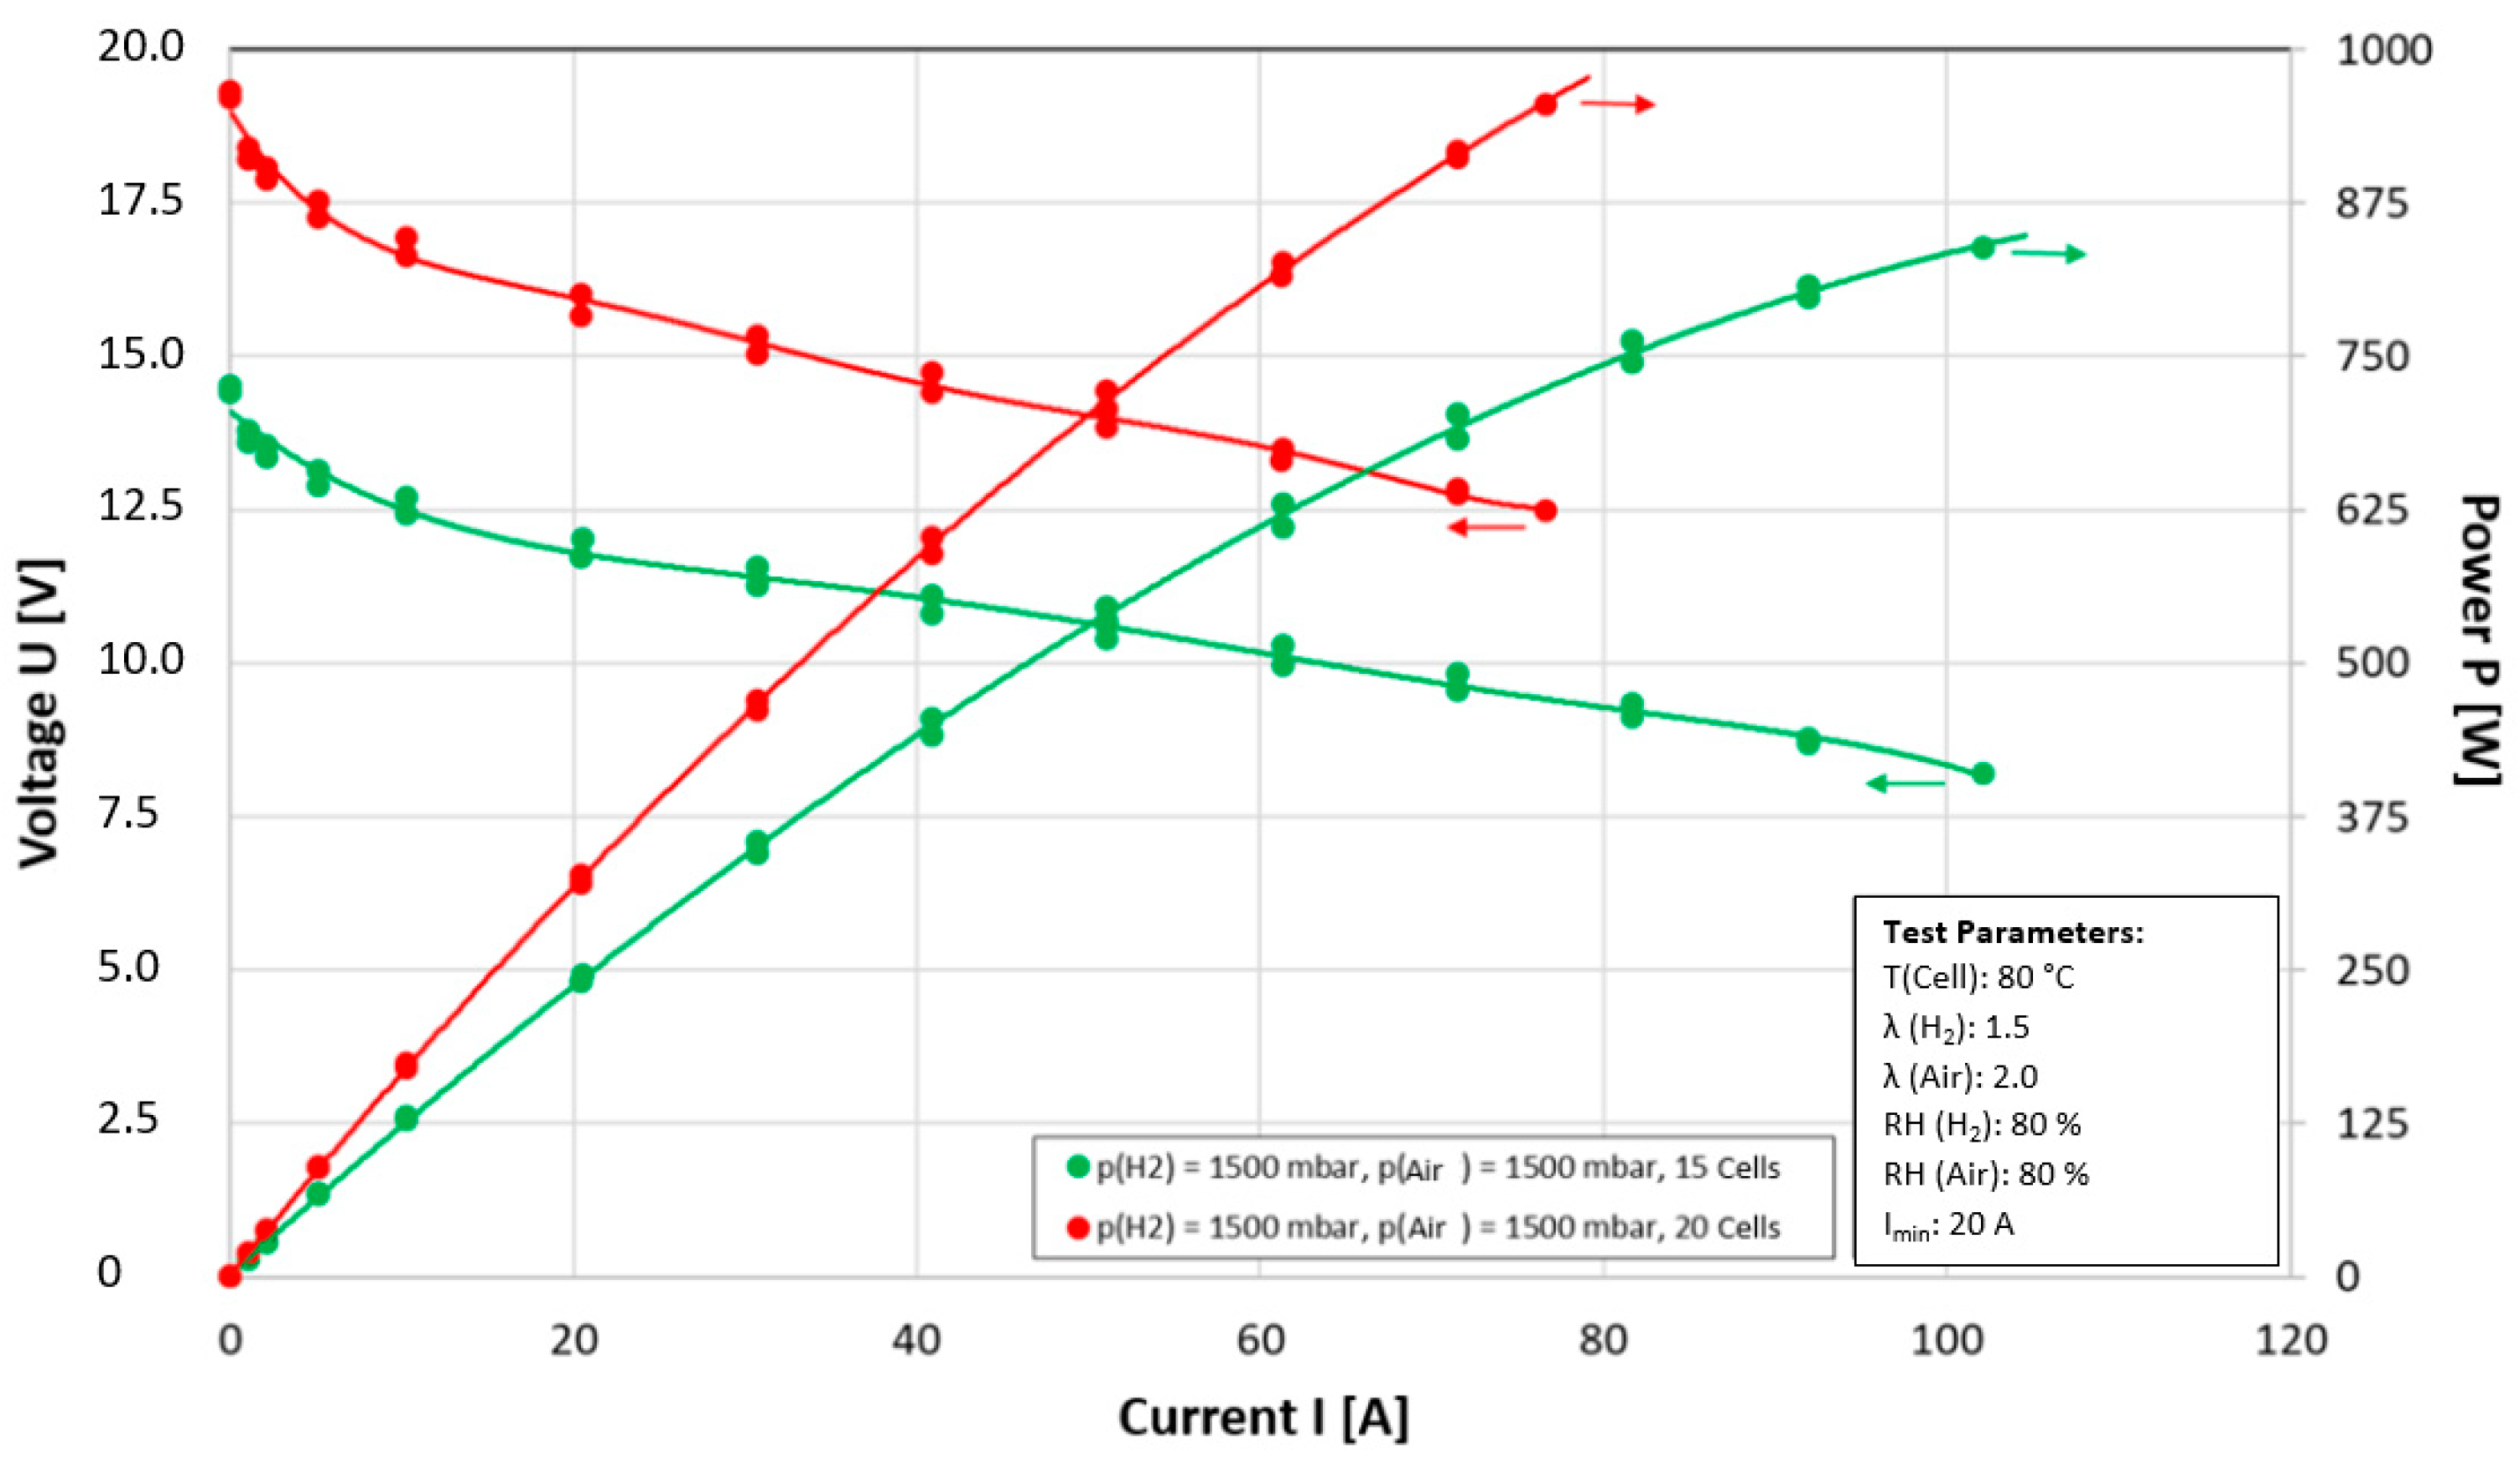
Plotting the voltage–current–power (V-I-P) relationship reveals how the system behaves under varying load conditions. As an example,
Figure 5 illustrates the V-I-P plot for a stack with 20 cells and another with 15 cells, showcasing the key performance characteristics.
Comparing the operational behavior of these two stacks is essential for understanding how the number of cells affects overall performance and efficiency in fuel cell systems. Therefore, the integration of fiber sensor technology for monitoring the temperature within the fuel cell stack will provide valuable insights into how the number of cells influences temperature distribution and gradients within the stack. This is also supported by a repeated look at
Figure 1, which shows the current density distribution only up to the tenth cell. In contrast, the polarization curves of the DLR stack from
Figure 5 do not indicate a change of average cell performance on the number of cells. This information can guide further optimization and improvement of fuel cell technology, particularly in terms of thermal management.
3.2. Characteristics of the Fuel Cell Bipolar Plate for Fiber Integration
The bipolar plate (BPP) is a crucial component in the integration of optical fiber sensors into the fuel cell stack. Its design and composition have a significant impact on the overall performance and efficiency of the stack, including thermal management and mechanical stability.
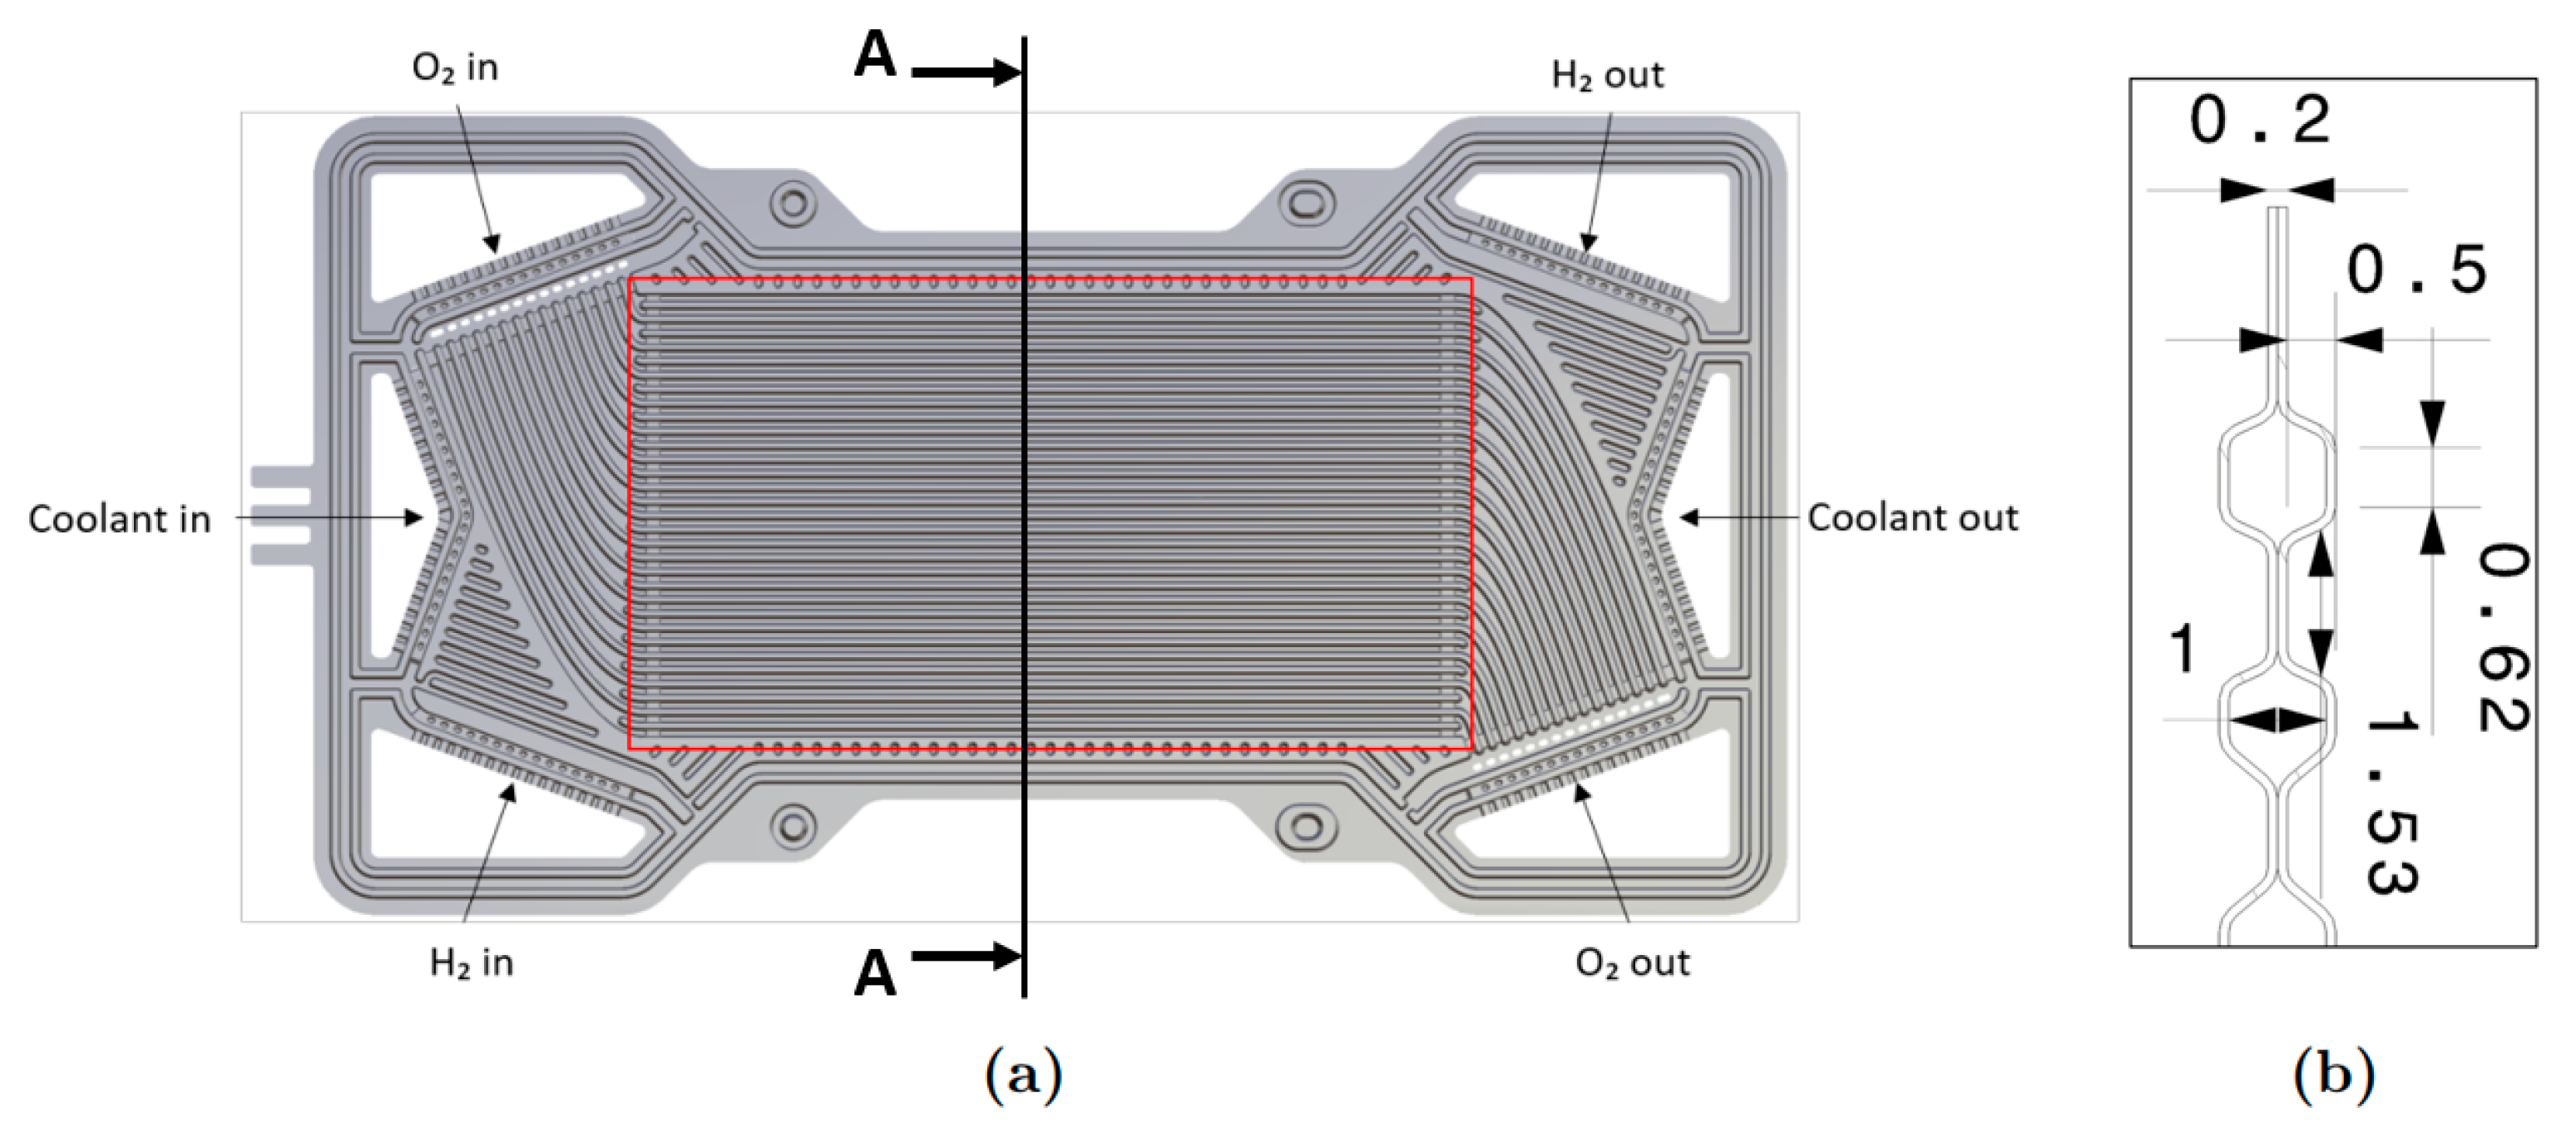
In this paper, the focus is on the specific design of the BPP utilized at DLR for the introduced fuel cell stack in
Section 3.2, as shown in
Figure 6. One of the primary considerations is the shape and geometry of the flow channels, as they determine how measurement instruments can be embedded without affecting their performance or altering the design. The flow channels also indicate important conditions:
Figure 6.
BPP design of the fuel cell. (a) Principal structure, active area depicted inside red rectangle. (b) Section A-A [mm] (cross-section of flow channels).
Figure 6.
BPP design of the fuel cell. (a) Principal structure, active area depicted inside red rectangle. (b) Section A-A [mm] (cross-section of flow channels).
To ensure successful fiber integration, it is necessary to securely embed and protect the fiber sensor while providing adequate temperature readings in areas of interest. This requires careful consideration of material and thickness choices, as well as the geometry and dimensions of the flow channels.
The performance and efficiency of a fuel cell are directly influenced by various dimensions of the BPP, including its thickness, surface area, cross-sectional area of the flow channels, and the location of reactant inlets and outlets. The water management of the cell is also very important and imposes additional requirements on the BPP, along with temperature, as described by Manke et al. in [
21] or Yan et al. in [
22]. The path and width of each flow channel are particularly critical for the concept and layer studied for fiber instrumentation.
Figure 6b provides specific measurements for the gas flow channels, such as ridge height (0.5 mm), flow channel maximum width (1.53 mm), ridge width (0.62 mm), total thickness (0.2 mm), and cooling channel height (1.0 mm). An additional dimension which is important for fiber integration is the overall thickness of the BPP (1.2 mm).
Accurate sensor readings require a proper fit between the sensor and the BPP, which can be limited by their respective dimensions, potentially affecting the functionality of the fuel cell stack. The small cross-sectional area of the flow channels and the need to measure membrane temperature require careful consideration, as even a small component installed in the cell can significantly impact performance or generate inaccurate readings.
The material chosen for the BPP also plays a crucial role in sensor performance and instrumentation. In this BPP, stainless steel grade 316L-1.4404 is utilized due to its high corrosion resistance, thickness, durability, and low electrical resistance. The specific properties of this material can be seen in [
23].
This steel has a thermal conductivity of 15 °W/mK at 20 °C and is in a normal range, facilitating heat dissipation during electrochemical reactions. The modulus of elasticity is only negatively affected at high temperatures exceeding the operating range of the fuel cell stack. Additionally, the specific thermal capacity of the BPP helps maintain a stable operating temperature [
23]. Finally, the low electrical resistivity of the plate enables efficient electron flow without significant power losses.
As a result of the analysis of the material properties of the bipolar plate, the fiber integration can be carried out without any problems, since, e.g., the expansion under the influence of temperature, which negatively affects the positioning and the measurement accuracy of the fiber, is relatively low compared to other types of metals used for BPP.
4. Methodological Approach for Fiber Integration
The successful integration of a fiber sensor into a fuel cell stack is dependent on several factors and technical considerations. These considerations encompass the compatibility of the fiber sensor with the stack’s operational environment, the design and dimensions of the BPP, the fiber’s ability to withstand temperature and chemical exposure, its capability for stable signal transmission, and the presence of mechanical strains in the fiber. The objective of this section is to investigate the behavior of the fiber sensor and establish the necessary boundary conditions and technical considerations for ensuring its optimal performance.
To achieve this, various pre-tests are conducted, which are enumerated and elaborated upon using torque testing as an illustrative example. Furthermore, a fixation and installation method for the fiber is devised to ensure its secure positioning within the fuel cell stack.
4.1. Pre-Tests for Fiber Integration
Pre-testing plays a crucial role in understanding the behavior of the fiber sensor and the fuel cell stack, both individually and in combination, with the objective of determining an appropriate integration approach. To comprehensively assess and analyze the behavior and interaction of each component within the proposed concept—namely, the fiber sensor, the installation layer within the cell, and the measurement system—a comprehensive set of tests (
Table 3) has been devised. These tests aim to encompass all relevant characteristics of each component, facilitating their incorporation into the final integration concept.
In the following section, an example of a pressure test conducted to analyze the influence of mechanical pressure load is presented.
4.1.1. Pressure Test–Tightening Torque Test
The pressure/tightening torque test is a crucial step in evaluating the interaction between the fiber and the fuel cell stack. This test aims to determine the optimal contact and behavior between the fiber and the stack, which directly impacts the fiber’s temperature measurement performance. Its significance lies in identifying potential integration issues, such as transverse compressive forces, inadequate sealing, data loss, and possible damage to the fiber or cell components.
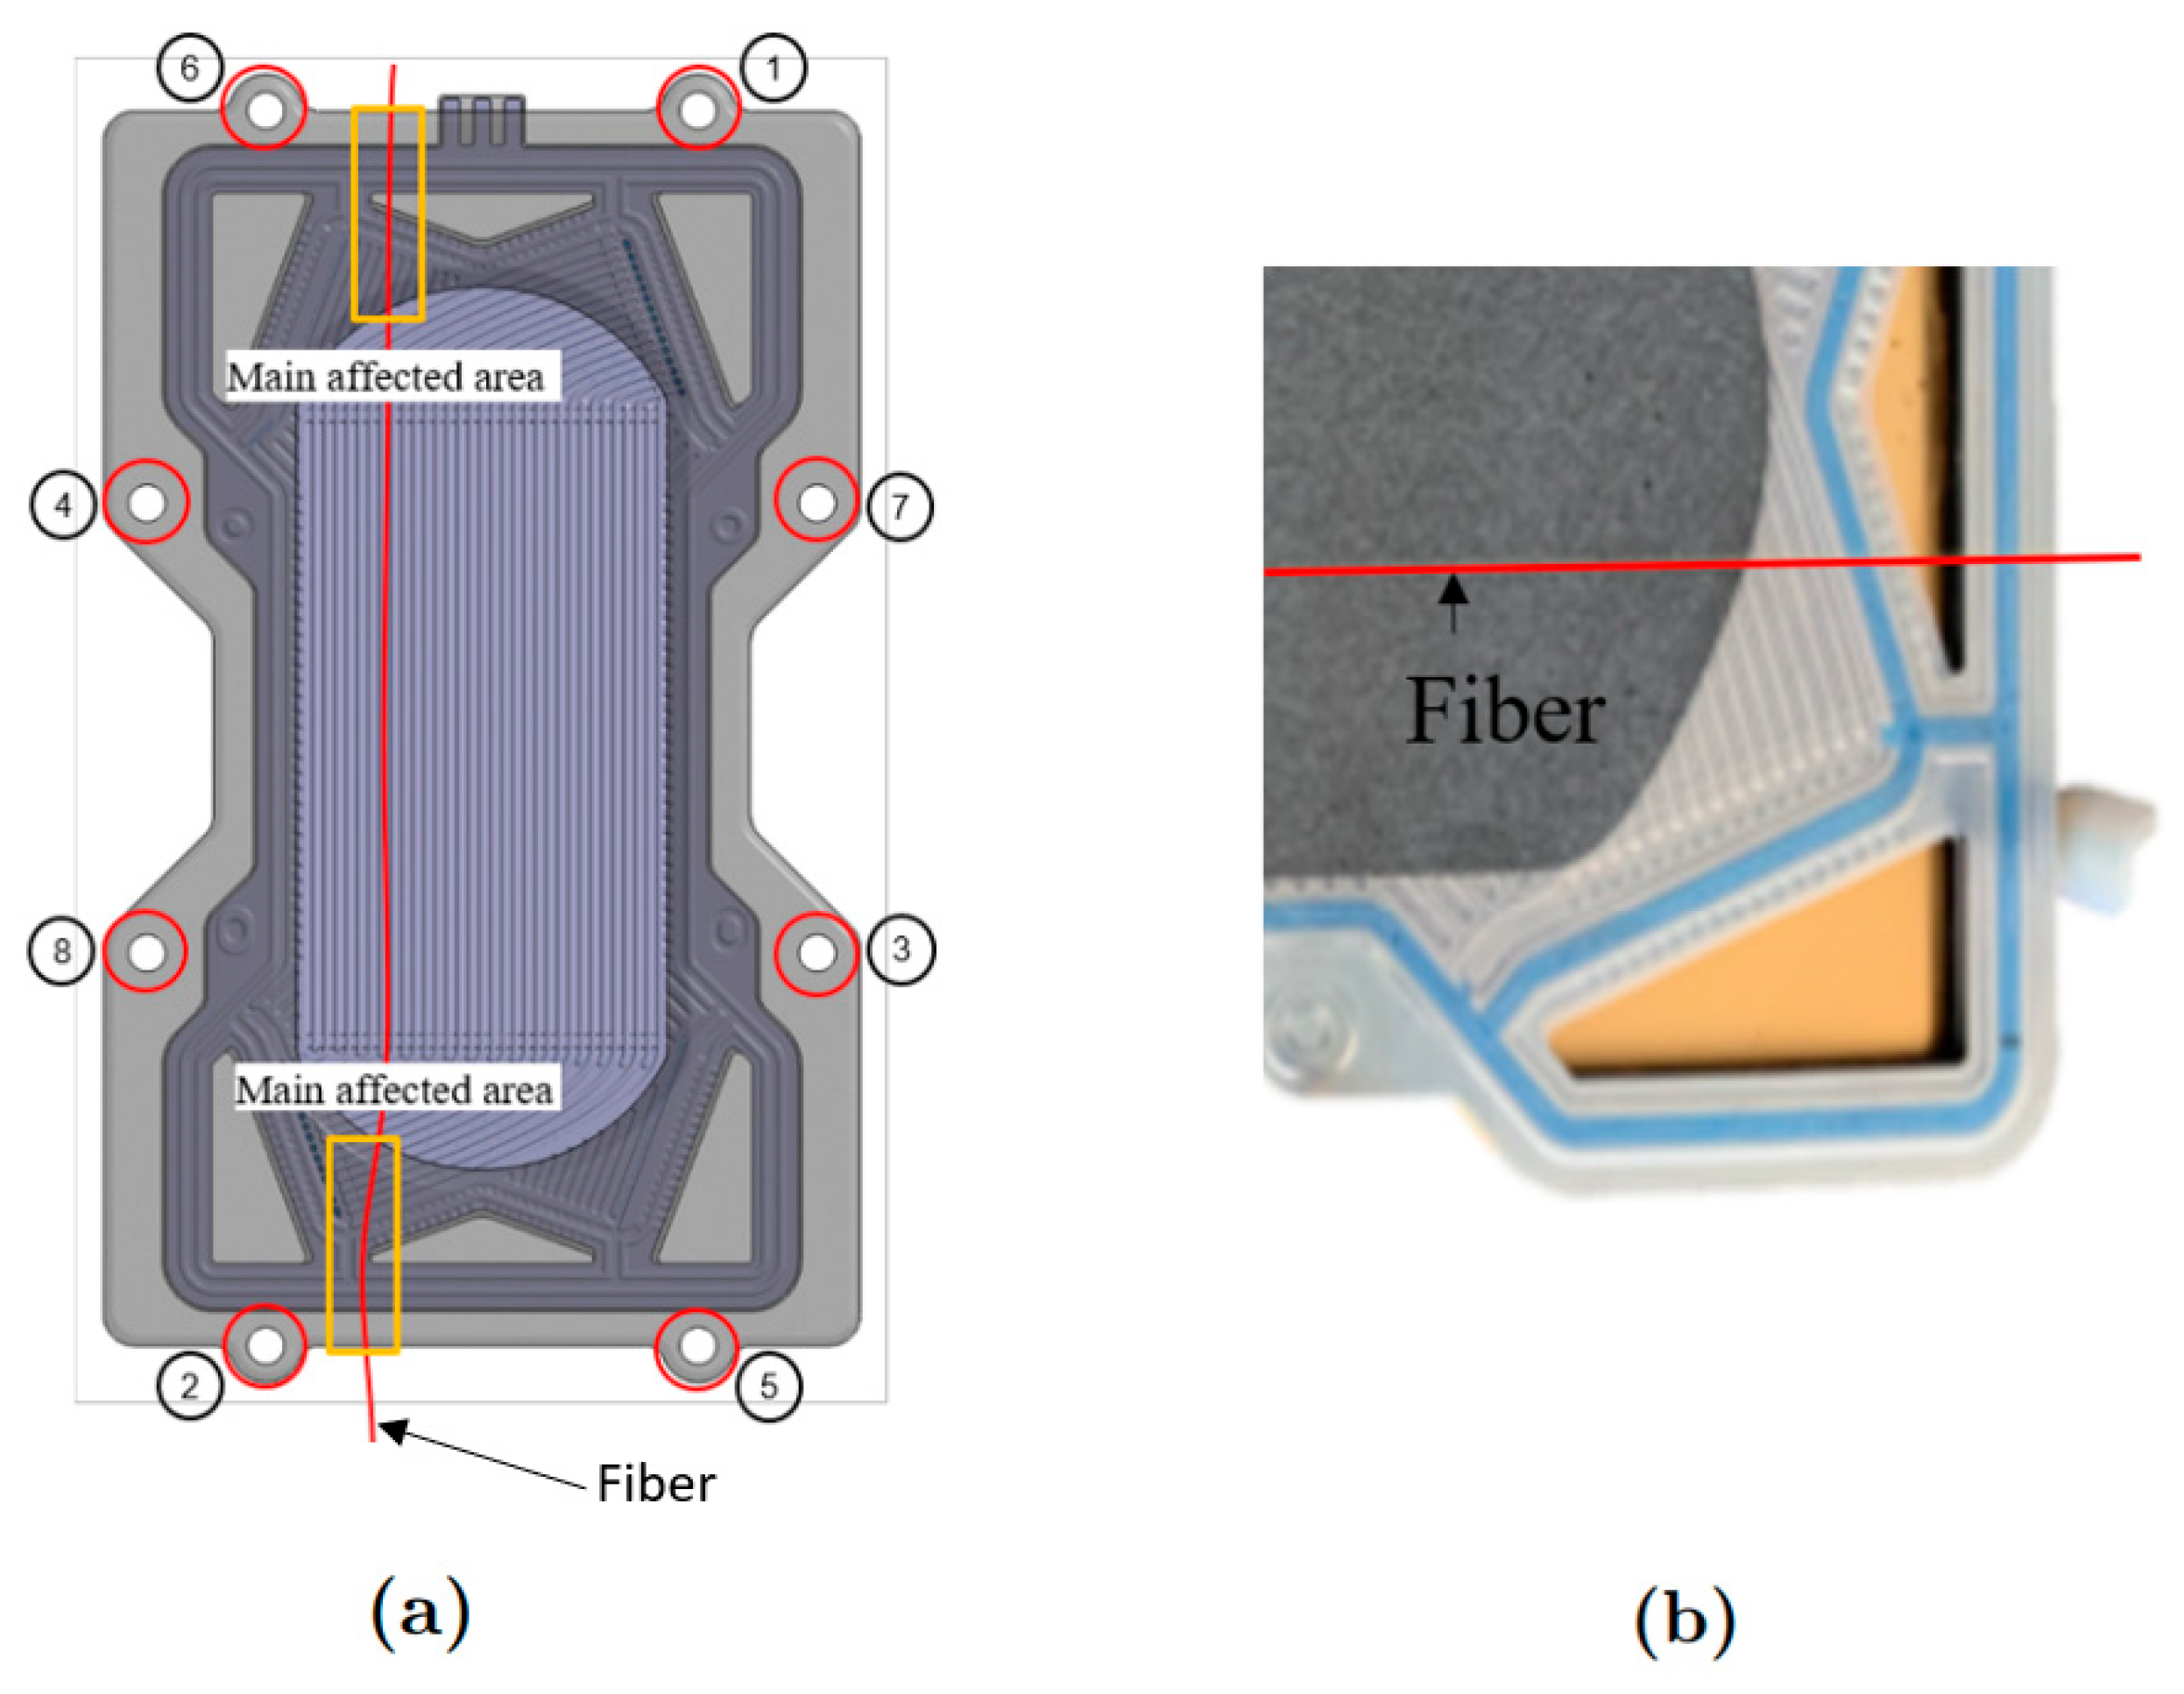
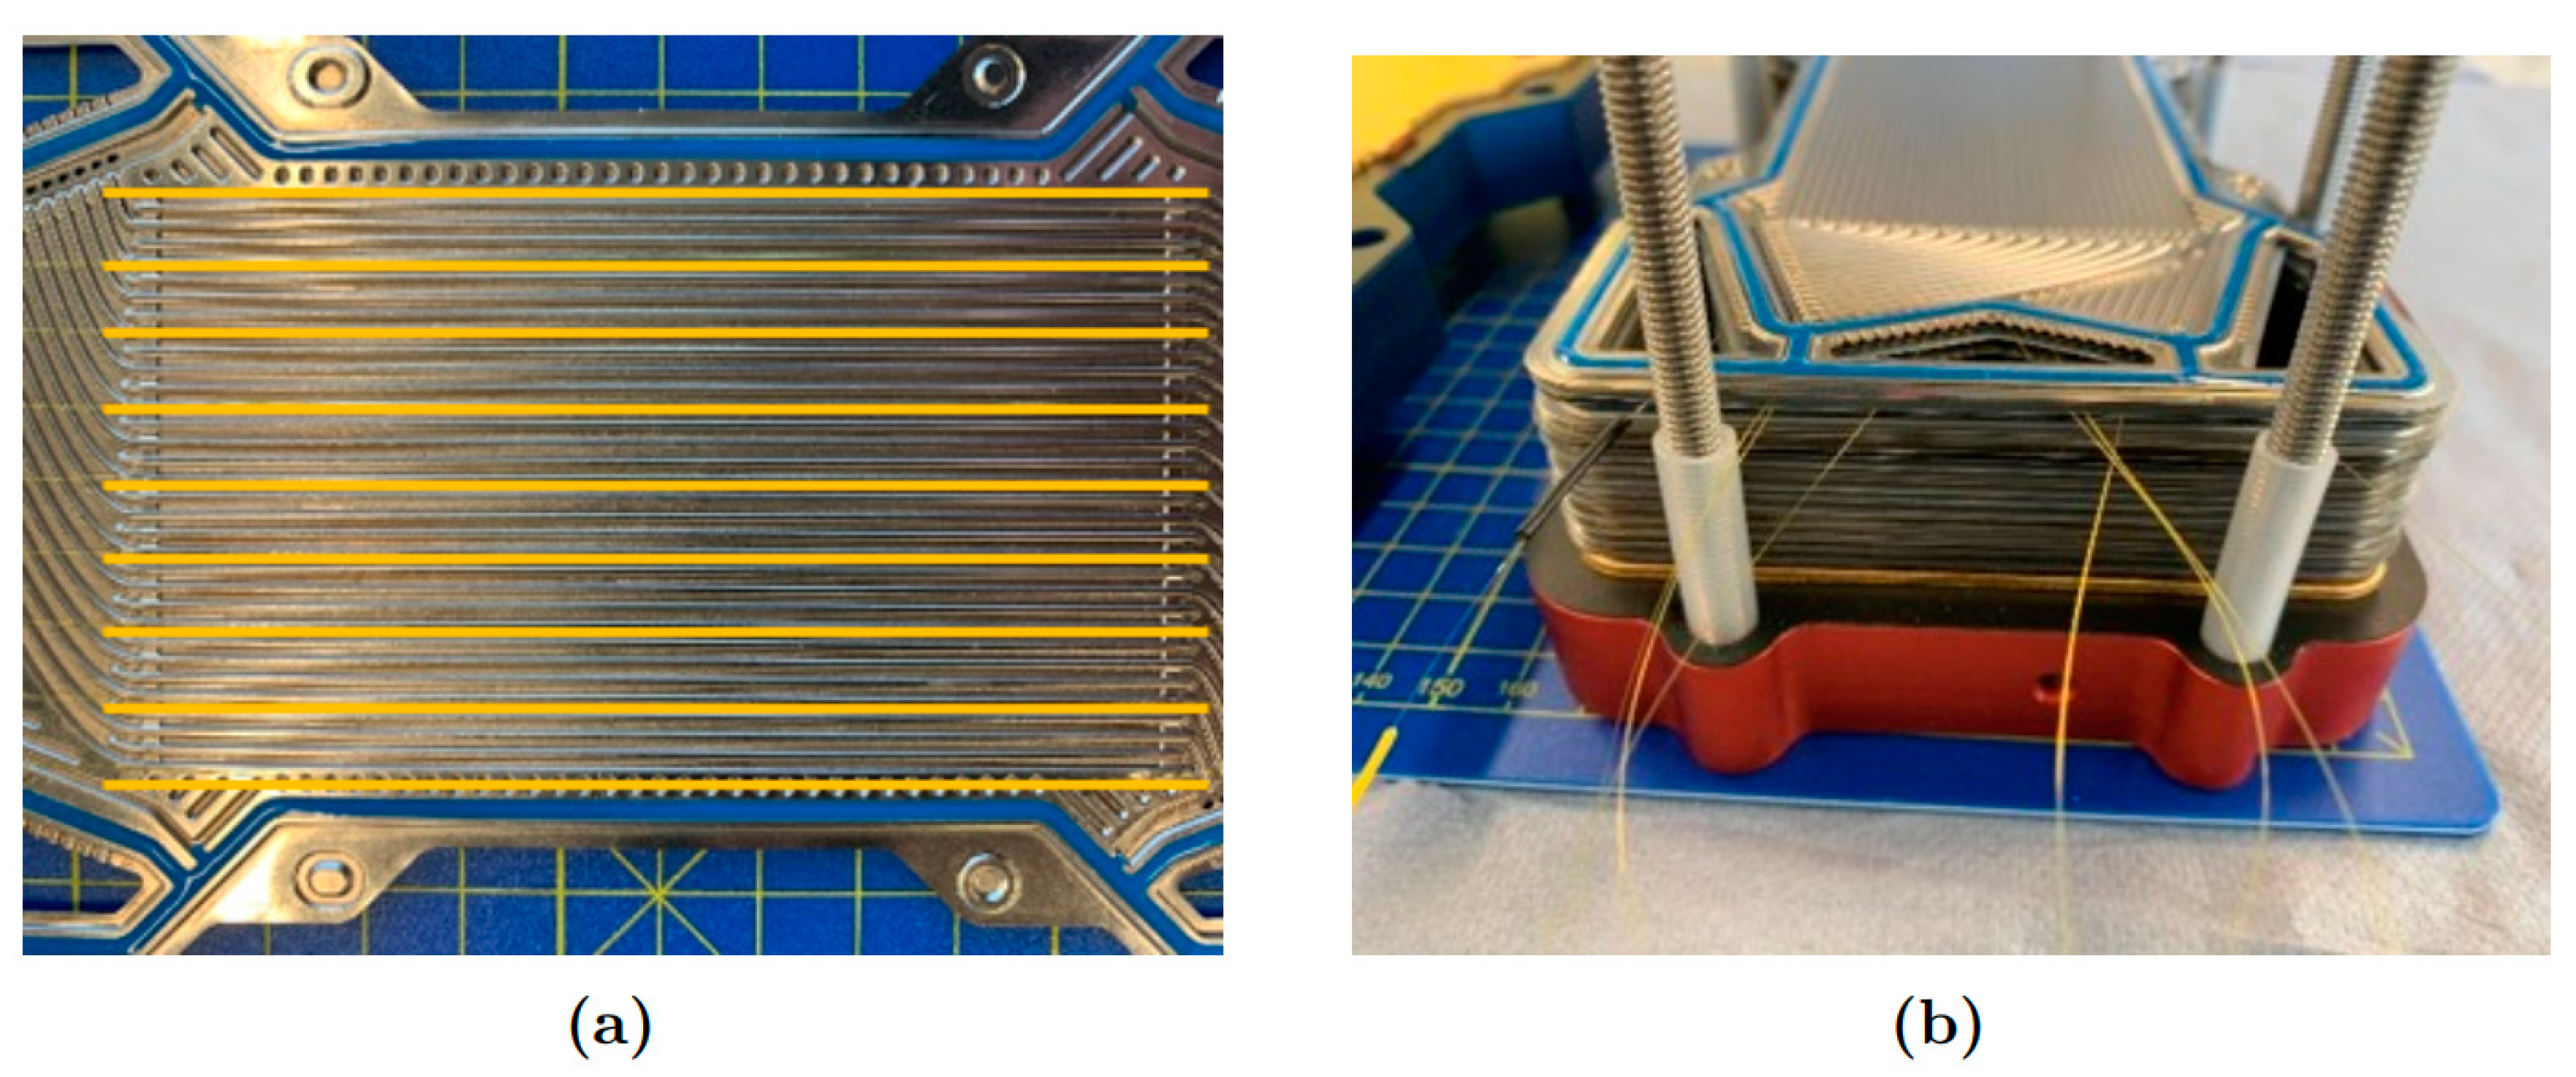
When designing the experimental setup, the fragility of the fiber due to its small diameter and brittle properties must be considered. To investigate the relationship between applied force from torquing the stack and the fiber’s response, the fiber was tested under actual cell components. The setup involved arranging the fiber vertically across the MEA area on the BPP (
Figure 7b), with an open-end plate placed on top (
Figure 7a). The use of an open-end plate allowed for the observation of pressure changes as the fiber approached the tightening region and detection of any non-uniform pressure in the central area. This approach provided further insight into fiber behavior near the tightening region and identification of potential irregularities in pressure.
The torque range used in the experiment was determined based on typical torques employed in fuel cell stack setups at operating gas pressures. The DLR-institute of Technical Thermodynamics advised a torque of 2.0 Nm as the most suitable for the stack, considering proper pressure on the sealing gasket, leakage tests, and GDL compression. Each test involved applying the specified torque value to each screw in the fuel cell stack (visualized using numbers 1–8 in
Figure 7a) using a torque wrench. Temperature readings were recorded for each respective torque value at ambient temperature for a duration of 1 min per torque value.
The sequence for tightening the screws (indicated by white circles around the stack in
Figure 7a) was determined based on previous tests conducted on the GDL and the required level of humidification across the active area.
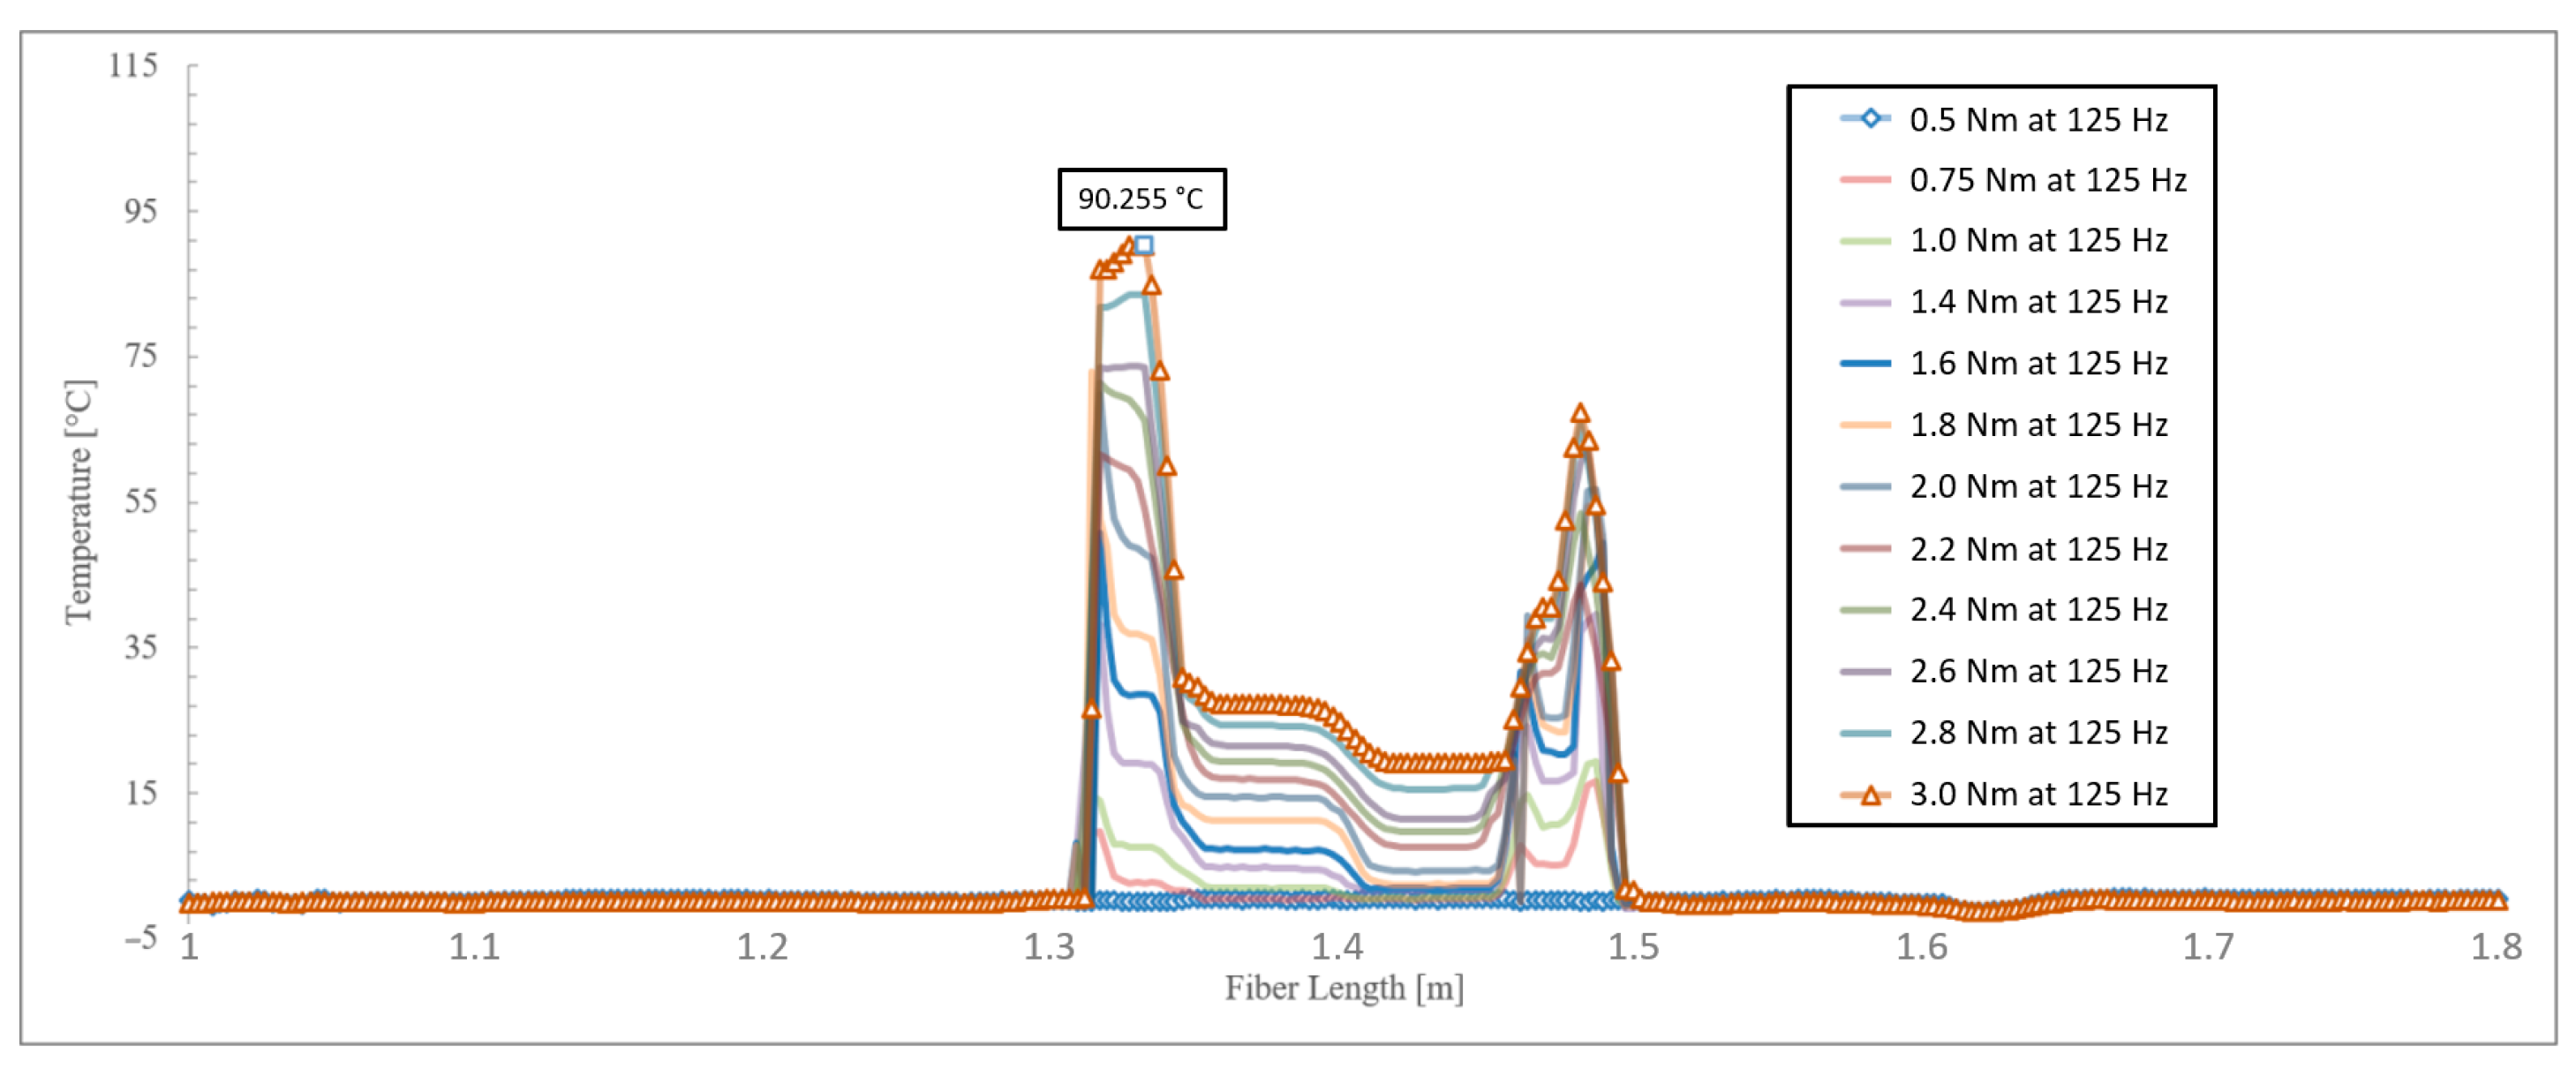
Figure 8 presents temperature readings from the tightening torque tests performed. The test was conducted with temperature measurement tared in the software at the beginning of the test and set at a sampling rate of 125 Hz. The tightening torque of the bracing screws was gradually increased from 0.5 Nm up to 3.0 Nm following a prescribed sequence. The recorded temperature values along the entire fiber length of 180 cm at specific tightening torques are shown. The results indicate that lower torque values (0.5 Nm) have minimal impact on temperature readings. However, using lower torque values results in inadequate sealing of the stack, leading to pressure loss within the reaction area and negatively affecting fuel cell stack performance.
For torque values exceeding 0.75 Nm, there was a noticeable increase in temperature distribution. Two peaks with high-temperature values are observed, corresponding to areas affected by pressure near the screws and open-end plate. The temperature readings primarily focus on the active area of the membrane, inferred to be located between these two peaks based on fiber length. This region is crucial as it is where temperature variations are most likely to occur due to the operational behavior of reactants.
This experiment confirms that mechanical strains in the form of compressive forces applied to the fiber result in erroneous temperature-offset readings. Multiple tests revealed that when the tightening torque exceeded 1.4 Nm, data loss occurred at measuring points located in the main affected zone near the tightening area. To address this issue, spatial average windows were utilized to complete the curve steepness on both peaks shown in
Figure 8.
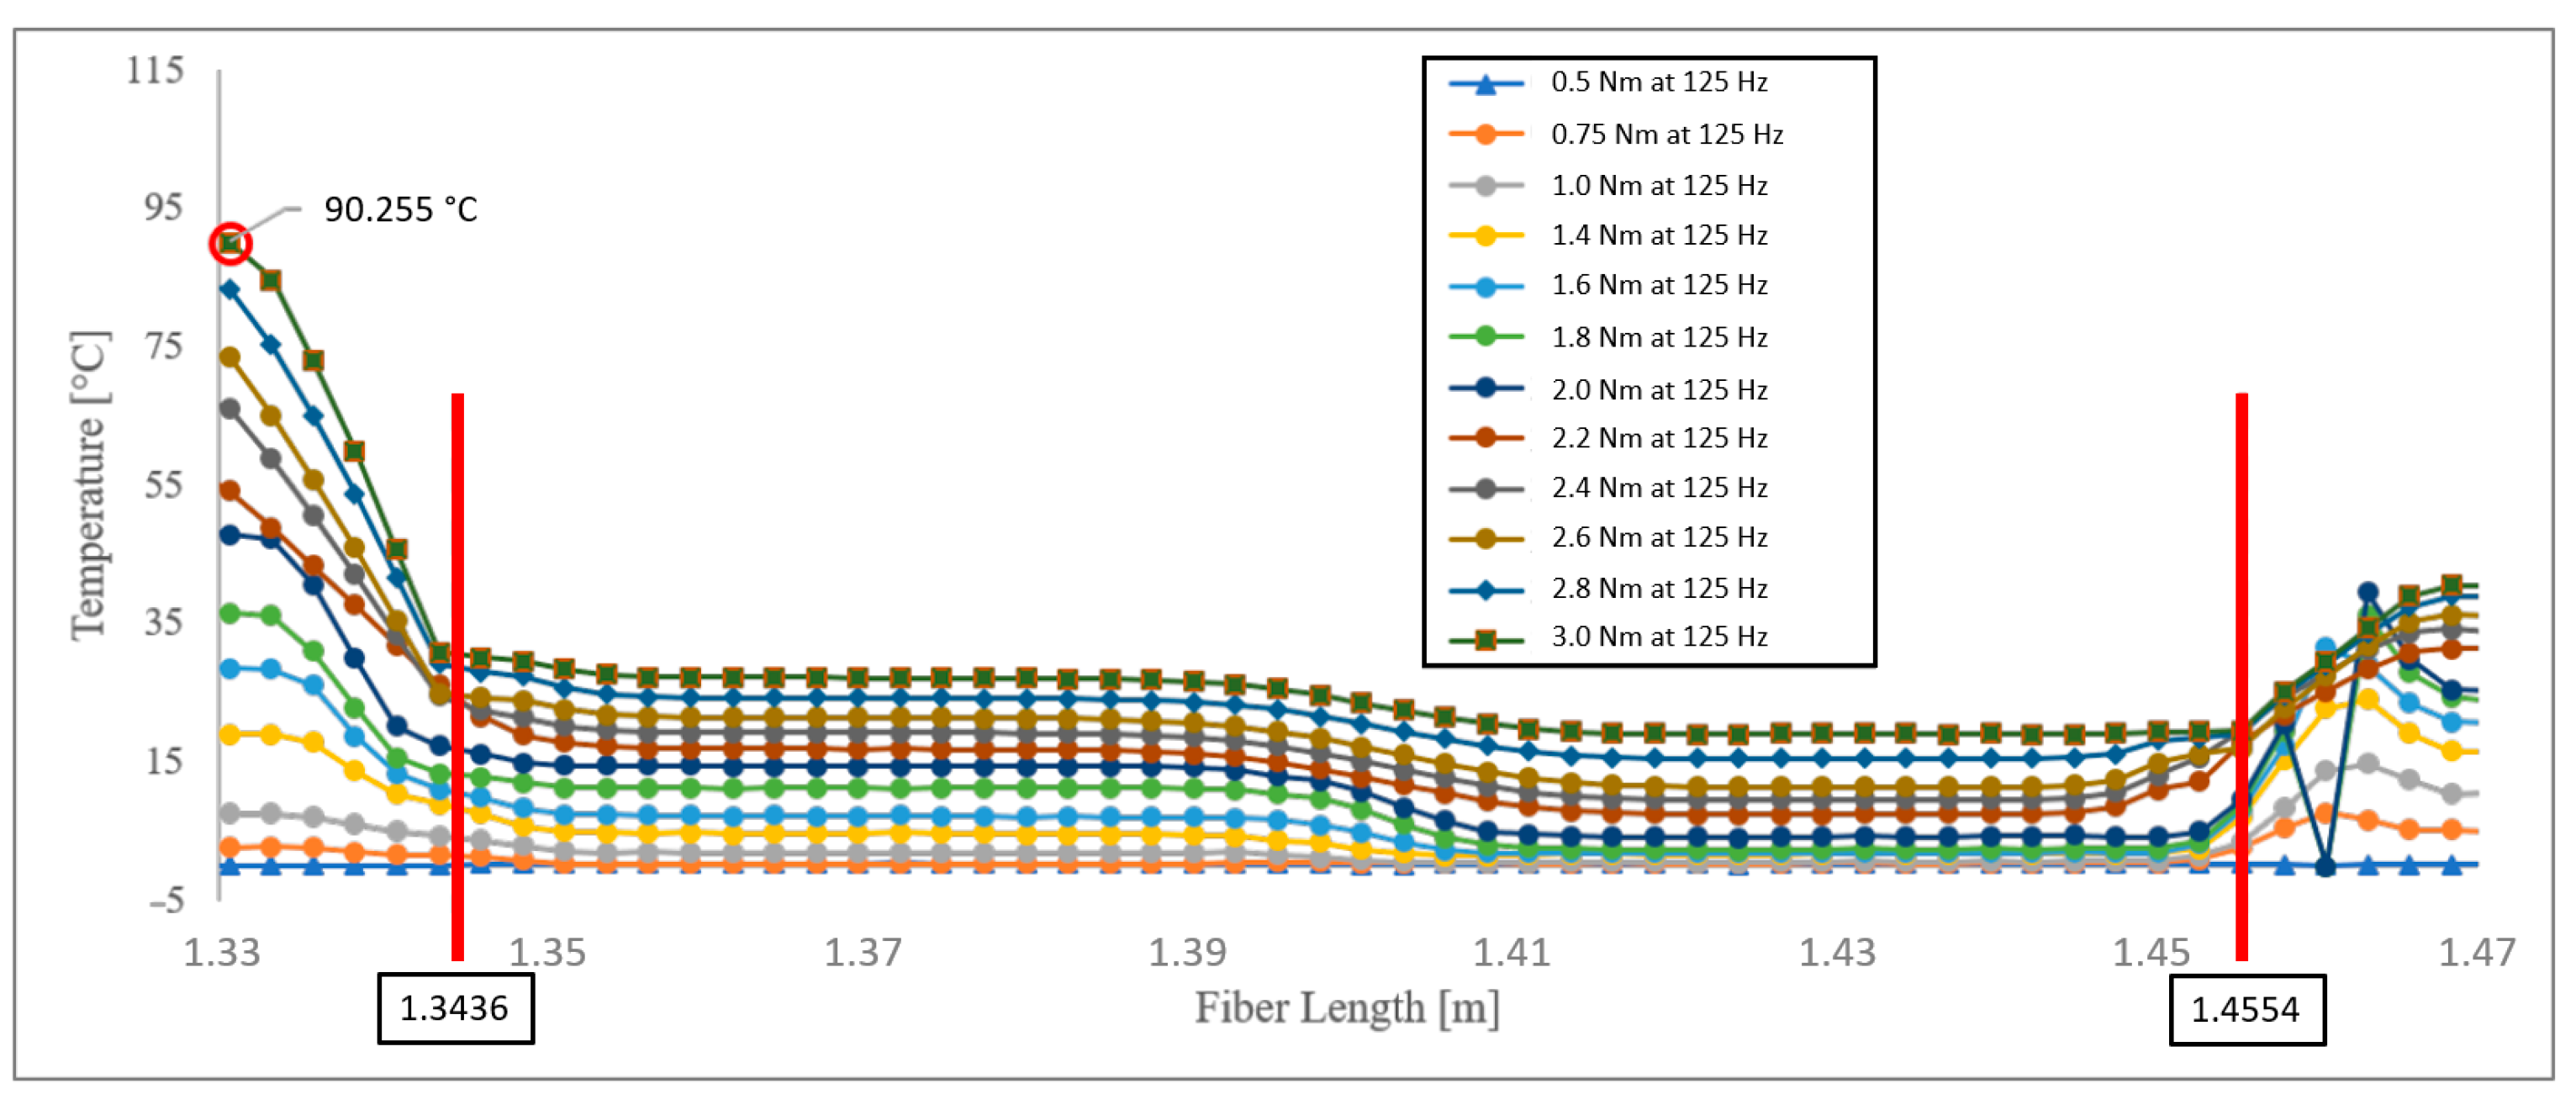
The data also reveal a polynomial relationship between increasing torque and temperature, with the measurement system detecting the highest temperature values in the main affected areas. Along the fiber length in the active area of the fuel cell (
Figure 9), a better correlation between torque and temperature increment can be observed. However, slight deviations in readings were observed due to the fiber sensor not being fixed or attached to the surface of the bipolar plate, GDL, or any other fuel cell components. These deviations could be attributed to a misaligned fiber sensor and uneven pressure distribution on the fiber if it was positioned on the flow channel ridge or within the flow channel (fiber position: 1.41 m).
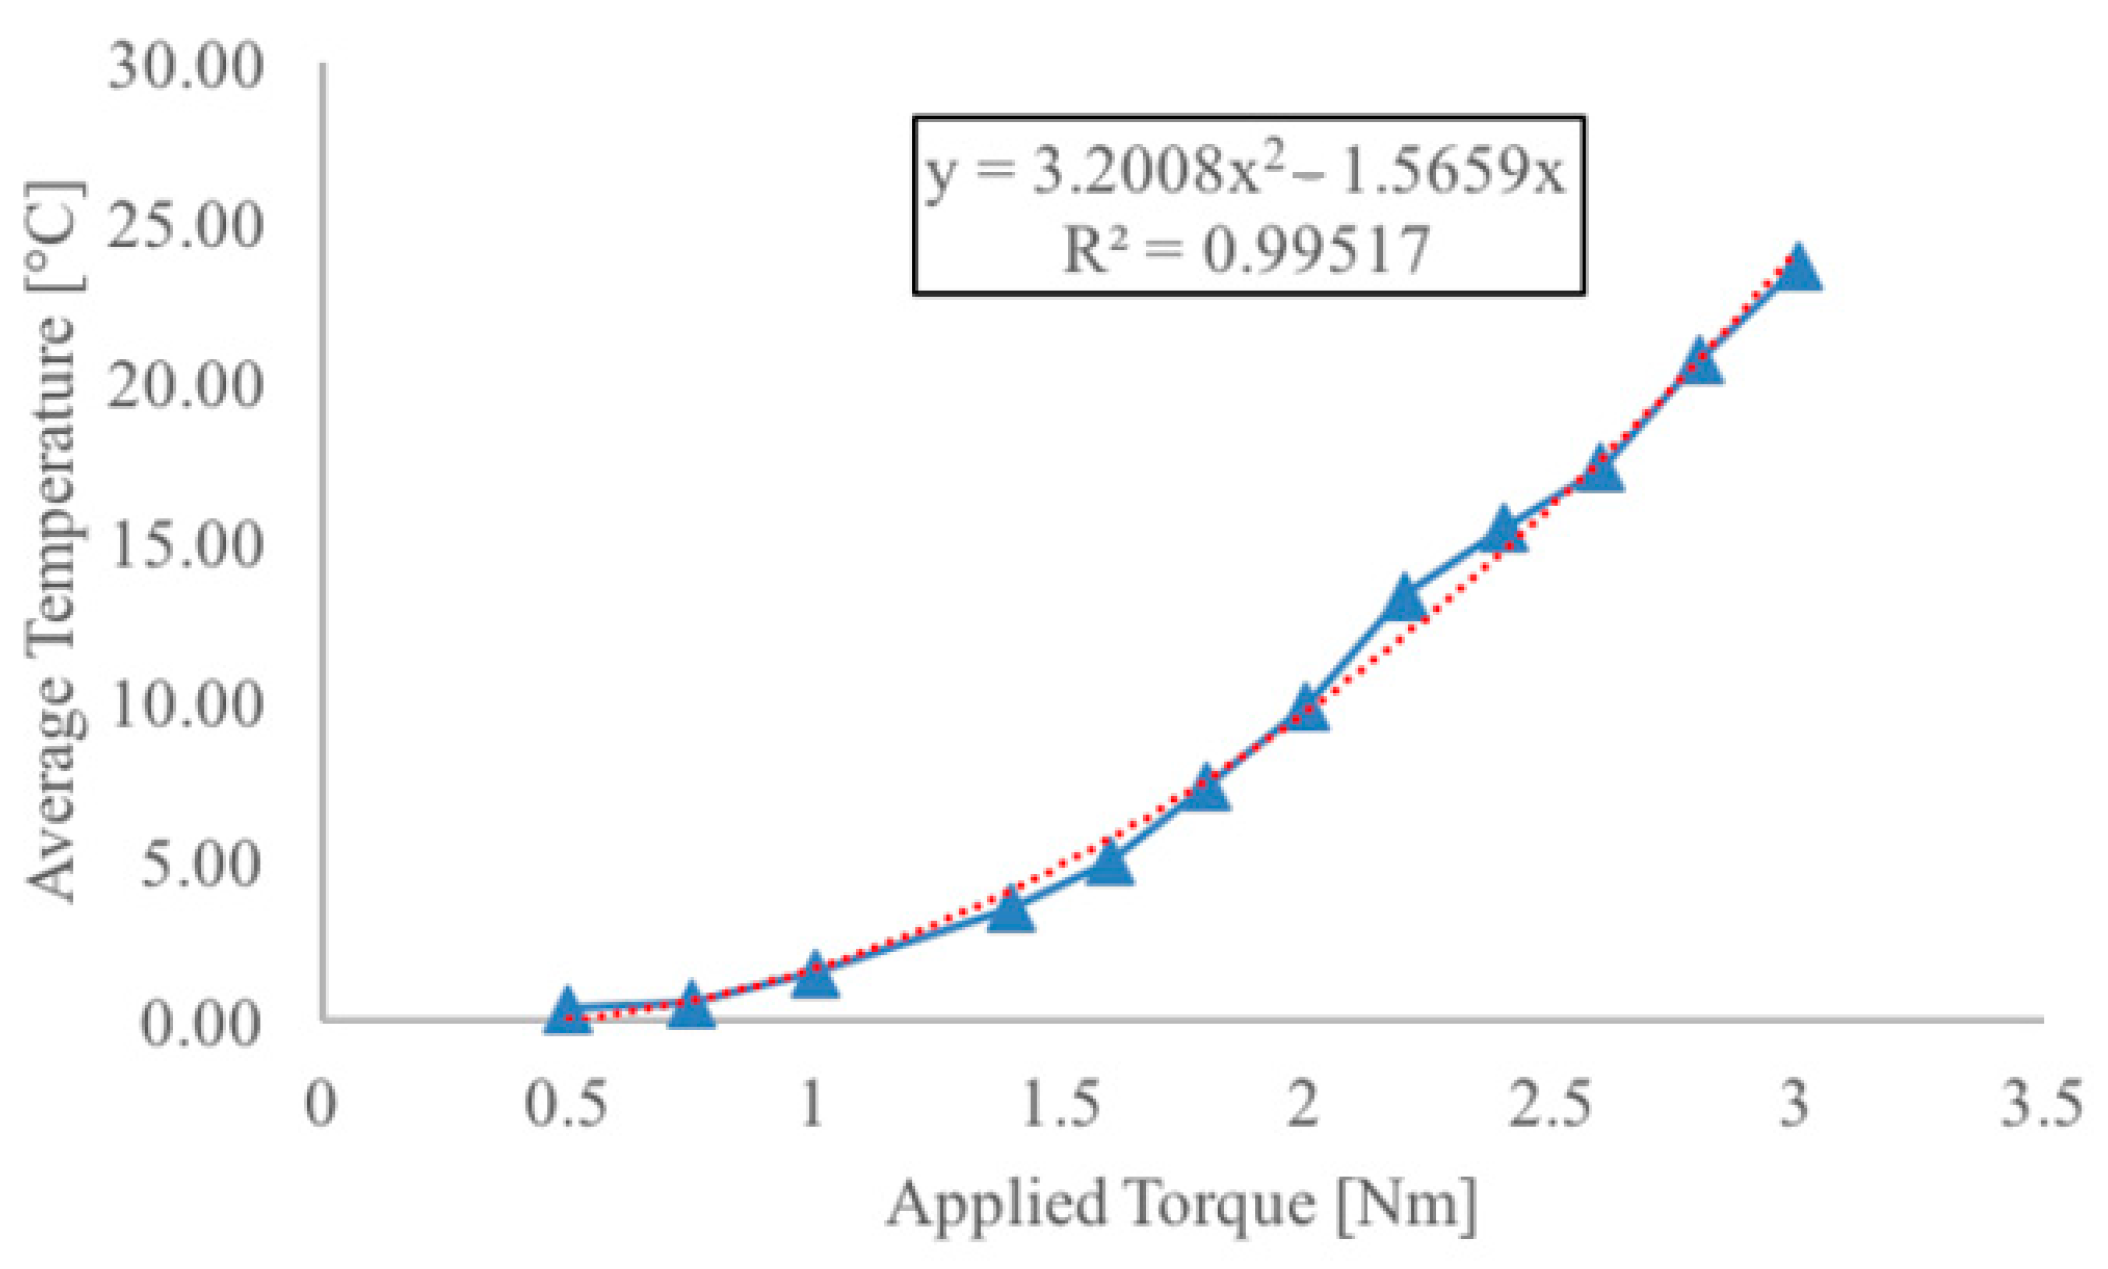
The experimental data demonstrate a strong correlation between the applied torque and the average temperature measured across the active area, accurately represented by a second-order polynomial function (
Figure 10).
In summary, torque values exceeding 0.75 Nm introduce a false temperature offset on the fiber, exhibiting behavior that approaches a second-order polynomial as torque increases. Data from measuring points in the main affected zone become unreliable after applying a torque of 1.4 Nm. However, by implementing a spatial average window every five measuring points with a gauge pitch of 2.6 mm, the curve shape can be accurately completed. The data can be effectively approximated using a second-order polynomial function with an R² value of 0.99. Additionally, measurements remain stable throughout 1 min tests. These findings are crucial for confirming the reliability and practicality of the proposed concept.
4.1.2. Pressure-Loss Test
To validate the safety and performance aspects of fuel cells operating with hydrogen, a pressure-loss test is conducted. In this test, the stack is exposed to an inert gas for a defined duration, and the resulting pressure drop is measured. The 20-cell stack with integrated fiber used in this study exhibits a pressure loss of less than 11 mbar under typical operating gas pressure with a holding time of 10 min. An increased pressure drop compared to the stack without fibers could not be detected with the measurement technique used.
The measurement results indicate that the presence of an integrated fiber does not lead to higher pressure losses compared to fuel cells without fiber. This simplifies the integration process of the fiber into the system, as no additional measures for adapted sealing concepts are required. Consequently, the integration of the fiber can be achieved with minimal technical and financial effort. However, if special cell geometries in certain system models necessitate such measures, the integration concepts must be adjusted accordingly.
It is expected that the probability of increased pressure losses will rise with higher operating pressures in the stack. The fact that fuel cells in mobile applications currently operate at pressures up to 2.5 bar further emphasizes their relevance. Various sealing concepts of varying complexity have already been developed for this purpose. For instance, one concept involves a complete carrier layer to hold and secure the fiber in place.
4.2. Fiber Sensor Adhesion
As depicted in
Figure 9, incorrect placement of the fiber can lead to inaccurate readings or temperature gradients across the active area, which may be mistakenly interpreted as hotspots. When integrating an optical fiber sensor into a fuel cell stack, careful consideration must be given to selecting an appropriate material that fulfills the following criteria:
safeguarding the sensor;
creating a stable environment;
enabling accurate temperature sensing;
avoiding damage to fuel cell components during integration;
preventing modifications to fuel cell components.
Based on the previous investigation outlined in
Section 3.2 and findings presented in [
24], stainless steel grade 316L 1.4404 has been identified as a suitable material for securely fixing the sensor in place. Furthermore, via the examination of positive results from various scientific sources [
25,
26,
27,
28,
29,
30], it has been determined that using an adhesive is the most appropriate approach for securing the fiber sensor without requiring modifications or impairments to existing components.
To select the most suitable adhesive, five different types were investigated: UV curable acrylics, structural adhesives, epoxies, silicones, and cyanoacrylates. Several conditioning parameters were considered, including:
Cyanoacrylates were found to have insufficient long-term chemical resistance and poor high-temperature resistance. Most instant adhesives have temperature range values up to 85 °C, and their initial strength decreases at temperatures above 80 °C with exposure times longer than 5 h. Based on the investigated factors and their prevalence in scientific papers related to fiber optic instrumentation, epoxies emerged as the most suitable option. Epoxies offer a high glass transition temperature, low shrinkage properties, excellent chemical resistance, and provide suitable protection against mechanical stress.
The initial selection criteria for the adhesive were based on the operating temperature range of the fuel cell. The magnitude of clamping pressure applied during adhesive application is critical, as excessive pressure can distort the cross-sectional profile of the 0.1 mm bipolar plate channels. Additionally, factors such as fiber layout, potential damage or breakage, and the development of mechanical stress must be considered to ensure accurate measurements.
Based on epoxy performance data provided by manufacturers, clamping pressures ranging from 34 to 140 kN/m2 can be disregarded. A desirable characteristic of the chosen epoxy adhesive is a high maximum elongation value, allowing it to withstand high pressures without damage or fracture.
4.3. Final Fiber Layout and Integration
The integration process of the fiber into the plate involved carefully installing the fiber onto the BPP. This step required precise positioning and alignment to ensure accurate temperature measurements. The shape and geometry of the flow channels on the BPP were taken into consideration during this process to avoid any interference or obstruction caused by the fiber installation.
To capture a highly resolved temperature distribution within the cell, it is necessary to place the fiber in a suitable layout. It is attached to the surface of the BPP as shown in
Figure 11b on either the cathode or anode side and guided multiple times in a looped layout (
Figure 11a) along the sides of the cell. This is necessary due to the limited bending radius of the fiber. The number of loop guides depends on the compromise between temperature resolution and the integration effort of the fiber into the cell. The temperatures are spatially resolved by the fiber in close proximity to the bipolar plate. The fiber is located between the bipolar plate and GDL. Due to the architecture of the cell, especially the inseparable 7-layer composite around the MEA, it is not possible, at least with this cell, to directly measure the temperatures at the electrodes. To ensure that the fiber does not negatively affect the performance and gas distribution of the cell, it is attached and fixed on the ridges of the flow field.
In the final prototype concept, a complete stack was instrumented with a fiber sensor that was adhered to the BPP using epoxy, which was identified and evaluated before. For ease of installation and handling, the fiber was positioned every four channels within the BPP, as shown in
Figure 12a. After positioning on the cathode side, the end plate was included to complete the assembly, as depicted in
Figure 12b.
The purpose of this instrumentation is to observe and understand the behavior of the fiber under normal operating conditions prior to fuel cell operation. The fiber was successfully instrumented onto the surface of the third BPP cathode side of a cell and incorporated into the stack without critical complications. This process followed the procedure and parameters established during the methodical approach and pre-test phase.
To investigate the temperature behavior on the cathode side of the final fiber assembly in a 20-cell composite stack with screws tightened to 2.0 Nm each, the stack was operated at an operating temperature of 70 °C at a stable operating point. The results of these validation tests are described in more detail in the following
Section 5.
5. Results
The test duration was 60 min in total, encompassing the start of the stack, the heating phase, the subsequent stable operating point, and the cooling phase. Throughout the entire test period, the measuring system provided continuous and uninterrupted temperature measurements. This allowed for observation of not only the temperature at the operating point but also the warm-up and cool-down phases of the stack.
Figure 13 shows an example from the temperature profile of a specific point in time of the measured temperatures of the last four fiber sections integrated into the stack 10 min after reaching the operating temperature.
The figure clearly shows all four of the total nine distinct fiber lines adhered to the BPP, which are easily identifiable due to added mechanical strain (see
Figure 8). Several important findings were obtained from this test.
Firstly, it was observed that during the warm-up phase, the temperature lines of the fiber exhibited more instability, likely due to a lack of spatial average windows. In contrast, a more stable temperature wave was observed at 70 °C, attributed to the use of 3 gauge spatial average windows to mitigate unstable behavior in areas with missing data. The variations in measurement patterns can be attributed to both possible misalignment of the fiber during assembly and its location within the stack.
As temperature increased, readings tended to be higher in mechanically strained areas, as expected. Notably, all nine fiber sections on the BPP exhibited stable and linear behavior along their positions on the parallel channel. As determined from pre-tests described in
Section 4.1, the temperature profile of the fiber during stack operation consists of sections with low-temperature plateaus (ambient temperature outside the cell) and areas with high-temperature variations (inside the cell). The slight increase and decrease in temperature in these areas can be attributed to the gradual heating of coolant in the BPP in the flow direction. The steepness of these measurements is a result of the loop-type arrangement of the fiber, while peaks between each parallel channel indicate the position of epoxy adhesive and the contact points of gasket and fiber.
6. Discussion
Fiber optic sensors for temperature measurement in fuel cells offer several advantages compared to conventional thermocouples. They enable precise and accurate measurements with high resolution and a fast response time. Fiber optic sensors are immune to electromagnetic interference and provide high long-term stability. Additionally, they are flexible and can be manufactured in various shapes and sizes.
The objective of this study was to integrate a 155 µm polyimide-coated low-bend-loss fiber sensor technology between a 7-layer MEA and a stainless-steel BPP for temperature control within a fuel cell. The integration process involved defining the requirements and boundary conditions, conceptual design, pre-testing, and ultimately implementing a physical prototype with the added sensor feature.
Several important findings were identified during the study. It was determined that the optimal bending range for the fiber sensor was between 16 and 18 mm, resulting in measurement alterations not exceeding ±0.5 °C. Torque values exceeding 0.75 Nm led to an increase in temperature distribution following a second-order polynomial behavior. Tightening torques above 1.4 Nm caused data transmission loss from gauges in the main affected pressured zone, which could be mitigated by using spatial average windows every five gauges with a gauge pitch of 2.6 mm.
The study demonstrated a robust correlation between mechanically induced strain variables and second-order polynomial behavior. Additionally, special adhesives showed promise for embedding fiber sensors into the BPP due to their chemical resistance and strong adhesive properties. When instrumented with adhesive, fiber sensors provided stable readings on the active area, nearly doubling their reliability. Furthermore, the fiber was able to detect pressure differences based on its position within the BPP in an already-tightened stack.
Theoretical calculations suggest that tensile forces higher than 30 N should be avoided during sensor installation to prevent damage to the fiber. The integration of the fiber sensor into the BPP was successfully achieved, with the development of a functional component that allowed for controlled bending radius and application of epoxy adhesive. The final assembly of the stack was completed without encountering any critical complications.
A fully installed prototype was presented as the final outcome, and pre-tests at different temperatures were conducted to validate the measurement device’s response. The final validation test demonstrated the capability of measuring temperature gradients within the fuel cell stack.
In order to improve the effectiveness of the concept presented, further research and optimization efforts are necessary. It is crucial to investigate the effects of encapsulation and adhesive methods, different fiber types, and various operating parameters on fuel cell performance. The optimal encapsulations/coatings and bonding techniques are still elusive concepts that require intensive investigation. This study has simplified some calculations to reflect the complexity of the research. However, future investigations should focus on exploring the physical and mechanical properties of the newly instrumented feature. Additionally, simulation models can be used to support experimental measurements by accurately representing pressure and gas velocity parameters in cells with integrated fibers. CFD simulations are currently in the model setup phase. The initial plan is to simulate the modified flow velocities and gas pressures with the integrated fiber, followed by conducting the significantly more complex temperature simulation. The accurate modeling of geometry and critical pressure points, especially in the sub-seal area, is essential to prevent improper unsealing caused by fiber components. The next stage of this research should involve comparing simulation results with physical testing to critically assess the flow behavior with the added feature. The incorporation of both electrodes into the computational model to simulate a complete cell and the inclusion of chemical reactions will provide comprehensive insights. Furthermore, it is important to assess the physical temperature monitoring and response of the fiber inside the stack based on findings from complete-cell simulations and heat-transfer analysis. Additionally, a 2D and 3D visualization of the temperature values is planned, which will be coupled with the CAD model of the bipolar plate to obtain temperature profiles analogous to the current density distributions shown in
Figure 1.
The consideration of pending physical tests is crucial for studying the effectiveness of the concept and identifying potential areas for optimization. The lack of sufficient research in this area suggests potential for future studies. This thesis has made substantial contributions to the field by establishing a foundation for further exploration of this concept approach.


