Article

Characterization of Uganda’s Main Agri-Food Value Chain Wastes for Gasification

by
Peter Wilberforce Olupot
1,
Tadeo Mibulo
1,* and
Jacintha Gumoteyo Nayebare
2
1
Department of Mechanical Engineering, Makerere University, Kampala P.O. Box 7062, Uganda
2
Department of Geo-Informatics, Kyambogo University, Kampala P.O. Box 01, Uganda
*
Author to whom correspondence should be addressed.
Energies 2024, 17(1), 164; https://doi.org/10.3390/en17010164
Submission received: 24 October 2023 / Revised: 25 November 2023 / Accepted: 27 November 2023 / Published: 28 December 2023

Abstract

:
Agricultural residues are a source of energy derived through various conversion processes. They are gaining attention as a solution to limited energy access in developing countries in which a majority of the population depends on agriculture for a living at a time when global population growth is outpacing the depreciation of conventional energy sources. This study characterized residues generated along the main agri-food value chains in Uganda for gasification by reviewing relevant literature and through field measurements and laboratory experiments. Maize, beans, cassava, banana, coffee, and sugarcane are the most important value chains, occupying 5.73 million hectares, and accounting for 40% of the country’s total area under cultivation. In terms of biomass residues, banana, maize, and sugarcane are the most feasible options, producing 4.18, 2.2, and 0.6 metric tons of biomass waste per ton, respectively. The bulk densities vary from 65.5 to 160 kg/m3, moisture content from 6.67 to 22.5%, and heating values from 12.6 to 16.74 MJ/kg for all residues. In terms of principal elements, oxygen has the highest proportion of 38.76–57.25% followed by carbon, 33.46–47.9%, and hydrogen 6%. The lignocellulosic composition is 23.46–41.38% hemicellulose, 9.9–55% cellulose, and 5.77–35% lignin. The three value chains have the potential to generate 172.2 PJ annually, which is enough to offset 50% of the cooking energy demands for Uganda. The main disadvantage of this is the low bulk density, which raises production costs and reduces conversion efficiency. Bulk density can be improved by densification through the compaction of residues. Given their composition and current utilization, maize stover, banana leaves, banana pseudo stems, and sugarcane tops are promising gasification feedstocks.

1. Introduction

Access to modern and reliable energy sources is a prerequisite for improving living standards and promoting economic development. The correlation between the Human Development Index and energy consumption per capita shows that countries with access to energy are more developed [1]. Approximately 580 million people in Sub-Saharan Africa (SSA) in 2019 lacked access to electricity [2]. Up to 890 million people in SSA use traditional fuels including wood and charcoal as the main source of fuel purposely for cooking. Despite the large share of traditional biomass in the primary energy matrix, the majority is combusted inefficiently. This, coupled with population growth, results in increased demands for more biomass, especially from the forest, leading to deforestation. The use of conventional biomass for cooking causes indoor air pollution, lung ailments, injuries, and in severe cases, even death, especially in poorly ventilated facilities [3].
The United Nations General Assembly adopted the 2030 Agenda for Sustainable Development and its Sustainable Development Goals (SDGs) in 2015, which include a dedicated and stand-alone goal on energy, SDG 7 [4]. SDG 7 specifically aims at securing modern, affordable, and sustainable energy for all, thereby increasing the share of renewable energy (RE) in the global energy mix. According to IEA et al. [2], Uganda is lagging behind the goals set towards achieving the 2030 Agenda. In 2020, the percentage of those who had access to electricity for the urban and rural populations of Uganda was 69.8 and 32.8% respectively. This is relatively low compared to SSA, which has 48, 78, and 28% access for the whole, urban, and rural population. It is also low when compared to the global figures of 91.97 and 83% for urban and rural populations, respectively [2].
Agriculture provides a livelihood to 72% of the population and contributes to about 24% of the national GDP of Uganda [5]. The most important agricultural value chains include maize, beans, cassava, banana, coffee, and sugarcane. These account for nearly 40% of the country’s total area dedicated to cultivation [6]. The highest volumes of biomass residues are generated along the different value chains. The produced biomass waste is left in the fields after harvesting with a few being used as animal feeds. Typically, banana peels, rejected bananas, sugarcane tops, and maize stover are used in applications such as animal feeds, and sugarcane bagasse is utilized by the three big processing factories in the country for the cogeneration of electricity. The utilization of biomass waste through energy conversions can thus be considered one of the most appropriate options for Uganda’s clean energy sector venture.
Gasification is a thermochemical process involving the conversion of biomass through high-temperature partial oxidation into gaseous fuels with a usable heating value. The oxidation agents commonly used include oxygen, air, or steam. The produced gas, which is referred to as producer gas or syngas, has many applications. The biomass gasification of agri-food wastes is one of the best waste-to-energy conversion methods, offering an intriguing alternative to fossil fuels, particularly for distributed power generation and off-grid applications including the electrification of rural and remote areas [7]. Biomass gasification systems generate biochar as a solid residue. Biochar is applied in many different fields ranging from environmental protection to agricultural production [8]. For example, biochar is applied in environmental protection through the removal of pollutants and heavy metals. Biochar is also applied in agricultural production to enhance crop yields through the improvement of soil structure. Promoting the production of bioenergy from agricultural waste using gasification technology can help achieve SDG 7. Biomass gasification plants have been applied to produce green energy for distributed generation in remote areas, particularly in Africa, where grid extension is often expensive [9]. In order to supply biomass for future gasification plants to satisfy energy needs in Uganda, this study set out to characterize the potential wastes produced along the main agri-food value chains.

2. Methodology

A review of the relevant literature specific to Uganda was conducted, as well as field visits for the country’s main agri-food value chains. Peer-reviewed scientific papers, conference proceedings, scientific reports, and book chapters were used to select the literature. During the search for literature, terms including gasification, biomass residues, value chain, and agriculture were utilized as search terms. Field visits were carried out to verify some of the information in the literature as well as to determine the biomass residues for the value chains. The information retrieved from the literature included the volume of residues produced per value chain, residue-to-product ratio, proximate analysis parameters, ultimate analysis parameters, lignocellulosic compositions, and calorific value. A ranking of the agri-food value chains was performed based on the total annual quantities of the biomass generated.
The bulky density for different residues was calculated using Equation (1).
ρ b = m b V b
where ρb = calculated bulk density of the briquette (g/cm3), mb = measured mass of the residues, and Vb = measured residue volume (cm3). The volume of each residue was determined using a 250 mL can, and, after, its mass was determined using a digital weighing scale (OHAUS digital scale pan model PA114 (USA) serial number B45138480).
The energy potential of agri-food value chain residues was calculated using Equation (2) according to Singh et al. [10].
E A = CT i × ( RPR ) i × ( 1 - ( H 2 O ) i ) × LHV i
where EA (Joules) is the annual gross energy potential of agricultural residues at 100% efficiency, CTi is the average annual production of crop i for the past recorded five years 2015–2019, (RPR)i is the residue-to-product ratio of crop i, (H2O)i is the moisture composition of crop i, and LHVi is the lower heating value of a given crop residue.

3. Results and Discussion

3.1. Agriculture in Uganda

Based on the area cultivated, the most important agricultural value chains include maize, beans, cassava, bananas, and coffee. The sugarcane value chain produces a significant annual harvest of sugarcane biomass waste despite its lower total cultivated annual land area of only 81,361 ha [6]. Because of its production potential and, consequently, its huge biomass potential, sugarcane has been included among the most important crops in the country. The six most important agricultural value chains account for nearly 40% of the country’s total area dedicated to cultivation. The share of each of the six value chains’ surface area (ha) is shown in Table 1. Agriculture occupied 106,662 km2 of Uganda’s total land area in 2019, accounting for 44.2% of the total land area [5]. Grasslands, open water, forests, bushland, wetlands, and built-up areas account for 21, 16, 8, 7, 3, and 1%, respectively. Agricultural production is primarily subsistence, with approximately 72% of the population engaged in subsistence farming on small farms averaging 2 ha in size [11]. The sector also contributes 24% to the country’s GDP and generates nearly 38% of export profits [5].

3.2. Biomass Residues from the Main Agri-Food Value Chains in Uganda

Table 2 is a summary of the biomass wastes/byproducts generated from each of the most important crop value chains. It is evident from Table 2 that the potential biomass waste from some of the crop value chains is relatively higher than that obtainable from their counterparts, even when cultivated on a considerably lower total annual surface area and/or produced in smaller amounts. With a total cultivated annual surface area of 1,200,000 ha, the bean value chain ranks second highest but only generates 2,821,500 MT of biomass waste compared to the 3,293,570 MT generated from the sugarcane value chain, which ranks as one of the lowest in terms of total annual cultivated surface area. In view of this observation, the three most important crop value chains are the banana, maize, and sugarcane value chains. These are described in the subsequent sections.

3.2.1. Maize

According to UBOS [5], the average maize production of maize in Uganda over five years (2015–2020) was approximately 3.212 million metric tons (MT). Results from the Ugandan Annual Agricultural Survey (AAS) for 2018 indicate that the total production of maize in Uganda was estimated to be 4.56 million metric tons, from an estimated planted area of about 1.854 million hectares [12]. The production trend showed an increase in maize production by about six times from 739,000 MT in the UNHS 1999/2000 compared with 4.56 million MT in the AAS 2020 survey.
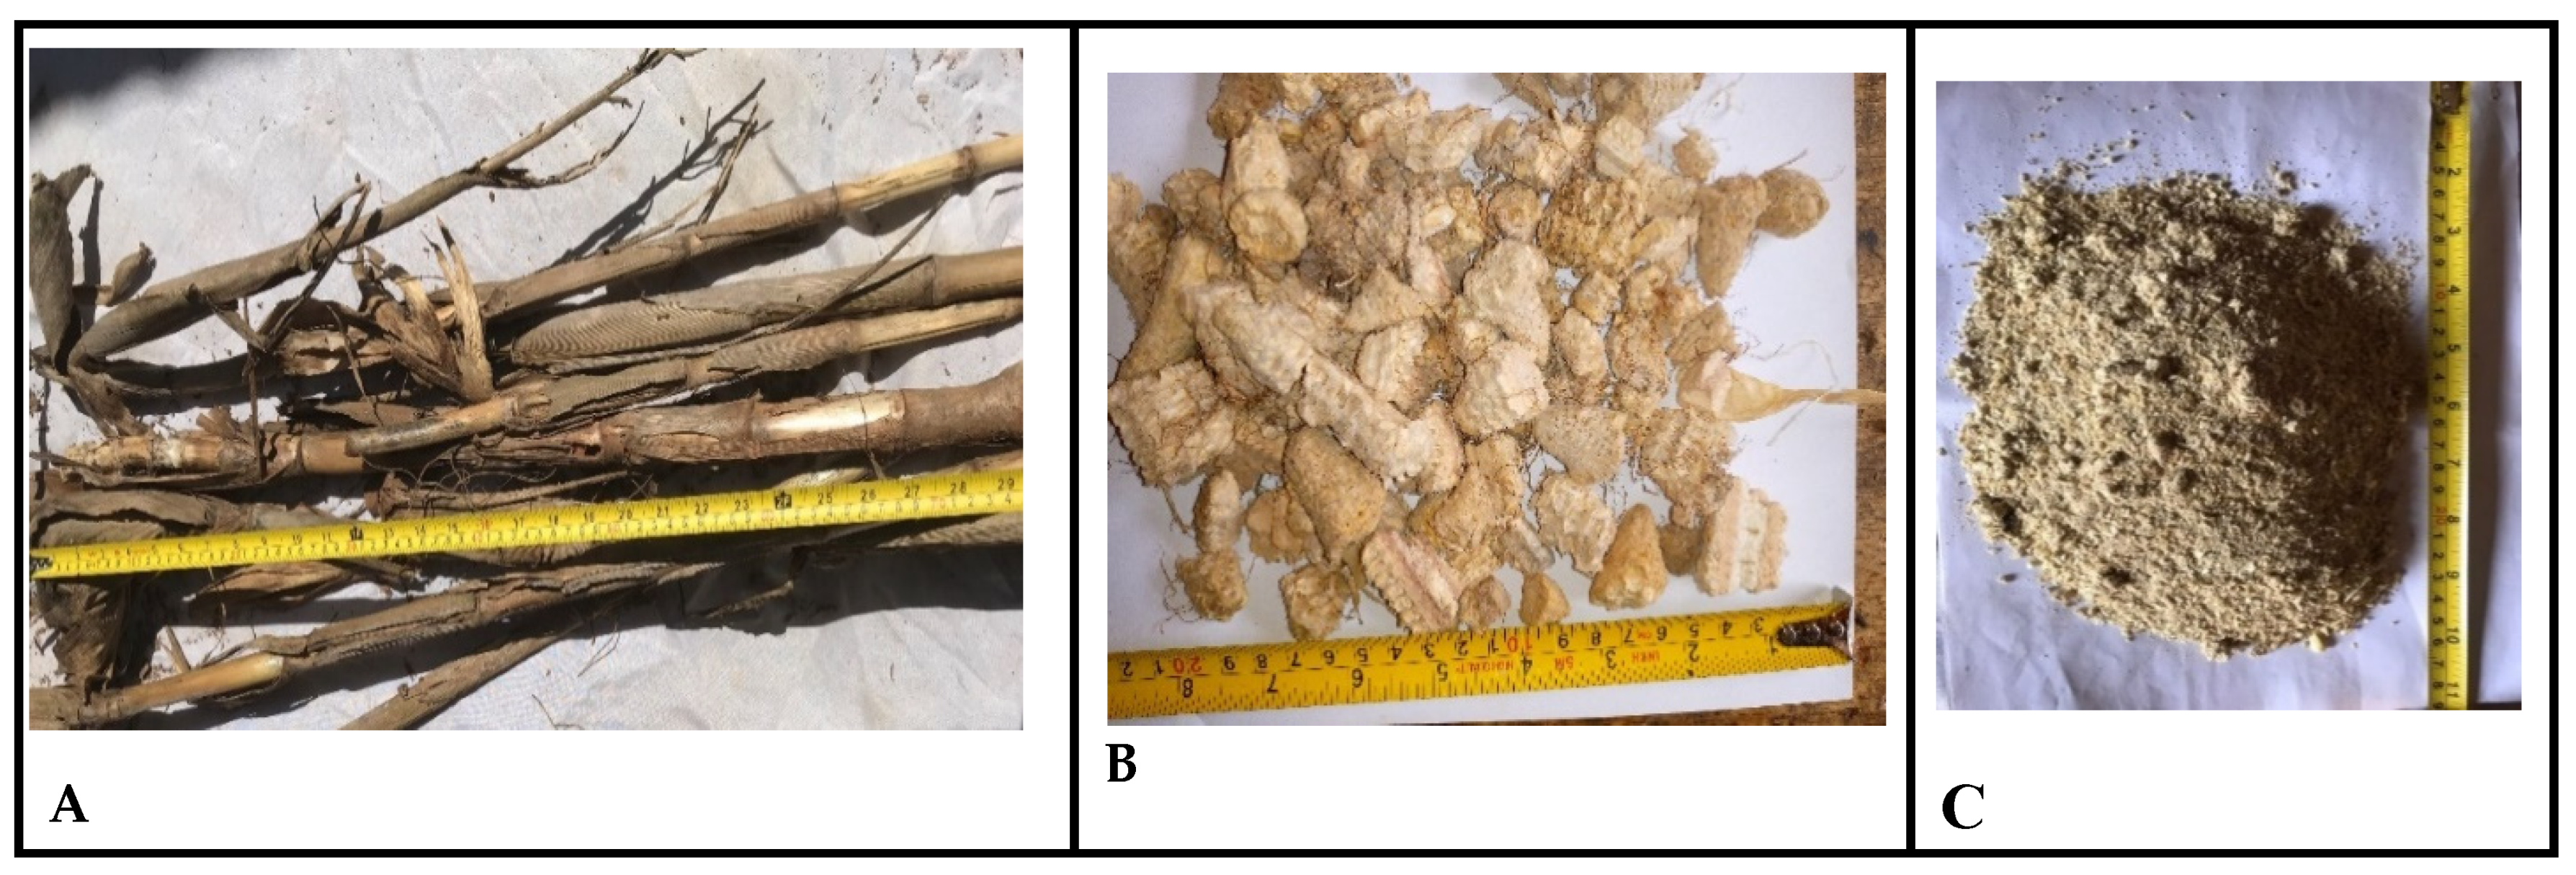
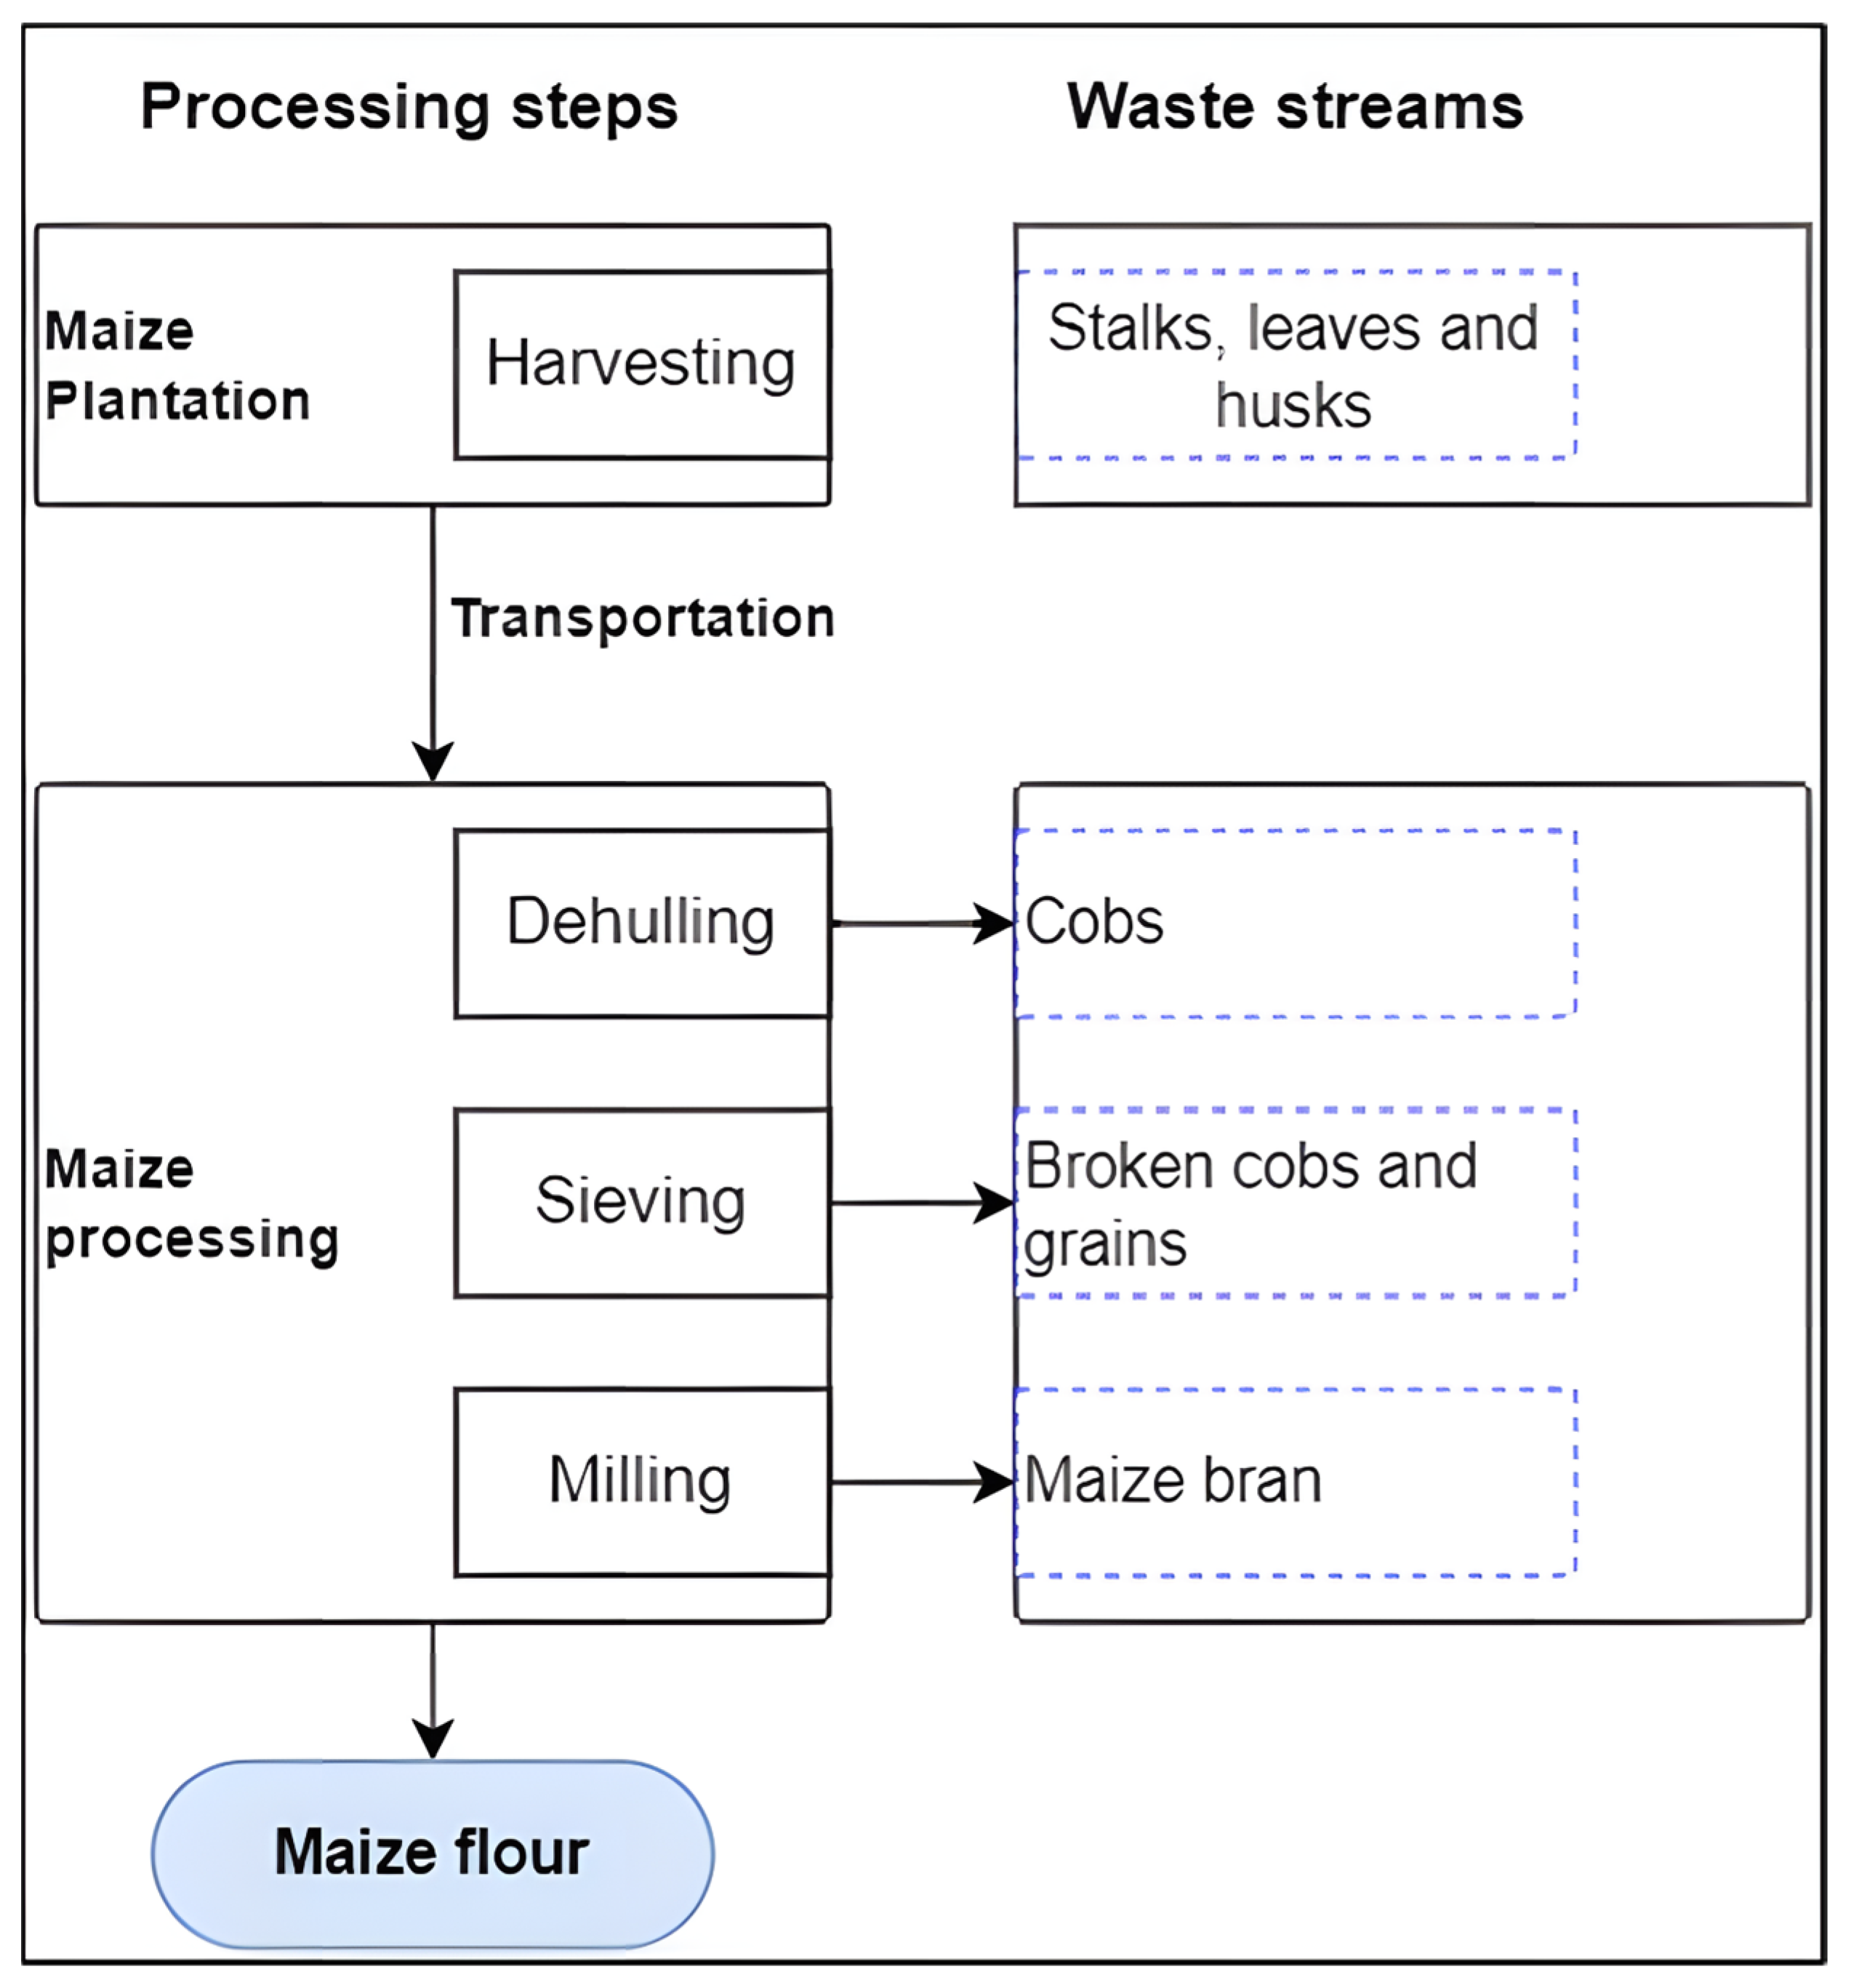
The main biomass wastes and the points of respective waste generation along the maize value chain are illustrated in Figure 1. The wastes include maize cobs and stover, with the latter comprising stalks, leaves, and husks (Figure 2). The cob has a residue-to-product ratio of 0.27, whereas the stover has a ratio of 2.0, making it the most significant waste from maize [13]. The maize stalks, husks, and cobs are employed on agricultural fields as mulch. They are also often used as a fuel source for households, whereas the raw stalks and husks are, at times, fed to animals [14]. In areas where fuelwood scarcity is not a problem, the maize stalks and husks are merely burnt in open space to clear the field for the next planting season. Farmers and/or traders often shell their maize to separate it from its cob prior to milling producing cobs, chuff, and broken maize in the process of sorting and/or sieving. During the milling process, there are also byproducts generated including maize bran and flour dust. Maize bran is rich in fiber like other cereal brans; hence, it is widely used as animal and chicken feed [14].

3.2.2. Banana

According to UBOS [5], a total of 8,326,000 tons of bananas from 668,000 ha were produced in 2019. This annual production represents a 28% increase from the total production of 2018 (6,494,057 tons). Banana is grown mainly in Western, Central, and parts of Eastern Uganda. In the harvest periods from 2015 to 2019, banana production increased by 80%, increasing its influence in the global market by 2%. The successful implementation of several government initiatives has contributed to Uganda’s rising yields. In 2015, the Ministry of Agriculture, Animal Industry, and Fisheries launched a five-year project, ‘Reducing vulnerability of banana-producing communities to climate change through banana value-added activities–Enhancing food security and employment generation’ [15]. This helped in the development of a sustainable banana industry by providing disease-free, banana-planting materials, demonstrating the use of banana waste for biogas and compost for soil fertility, and introducing new agricultural practices to improve field and plantation nutrient retention. In 2018, a two-year project, ‘Improving banana agronomy practices for small scale farmers in East Africa’, under the National Agricultural Research Organization (NARO) and other partners, was conducted [16]. This taught extension workers and farmers more about better site selection when growing crops, as well as enhanced land preparation, appropriate spacing, mulching, improved varieties, water and soil conservation, and pest and disease control management, among others.
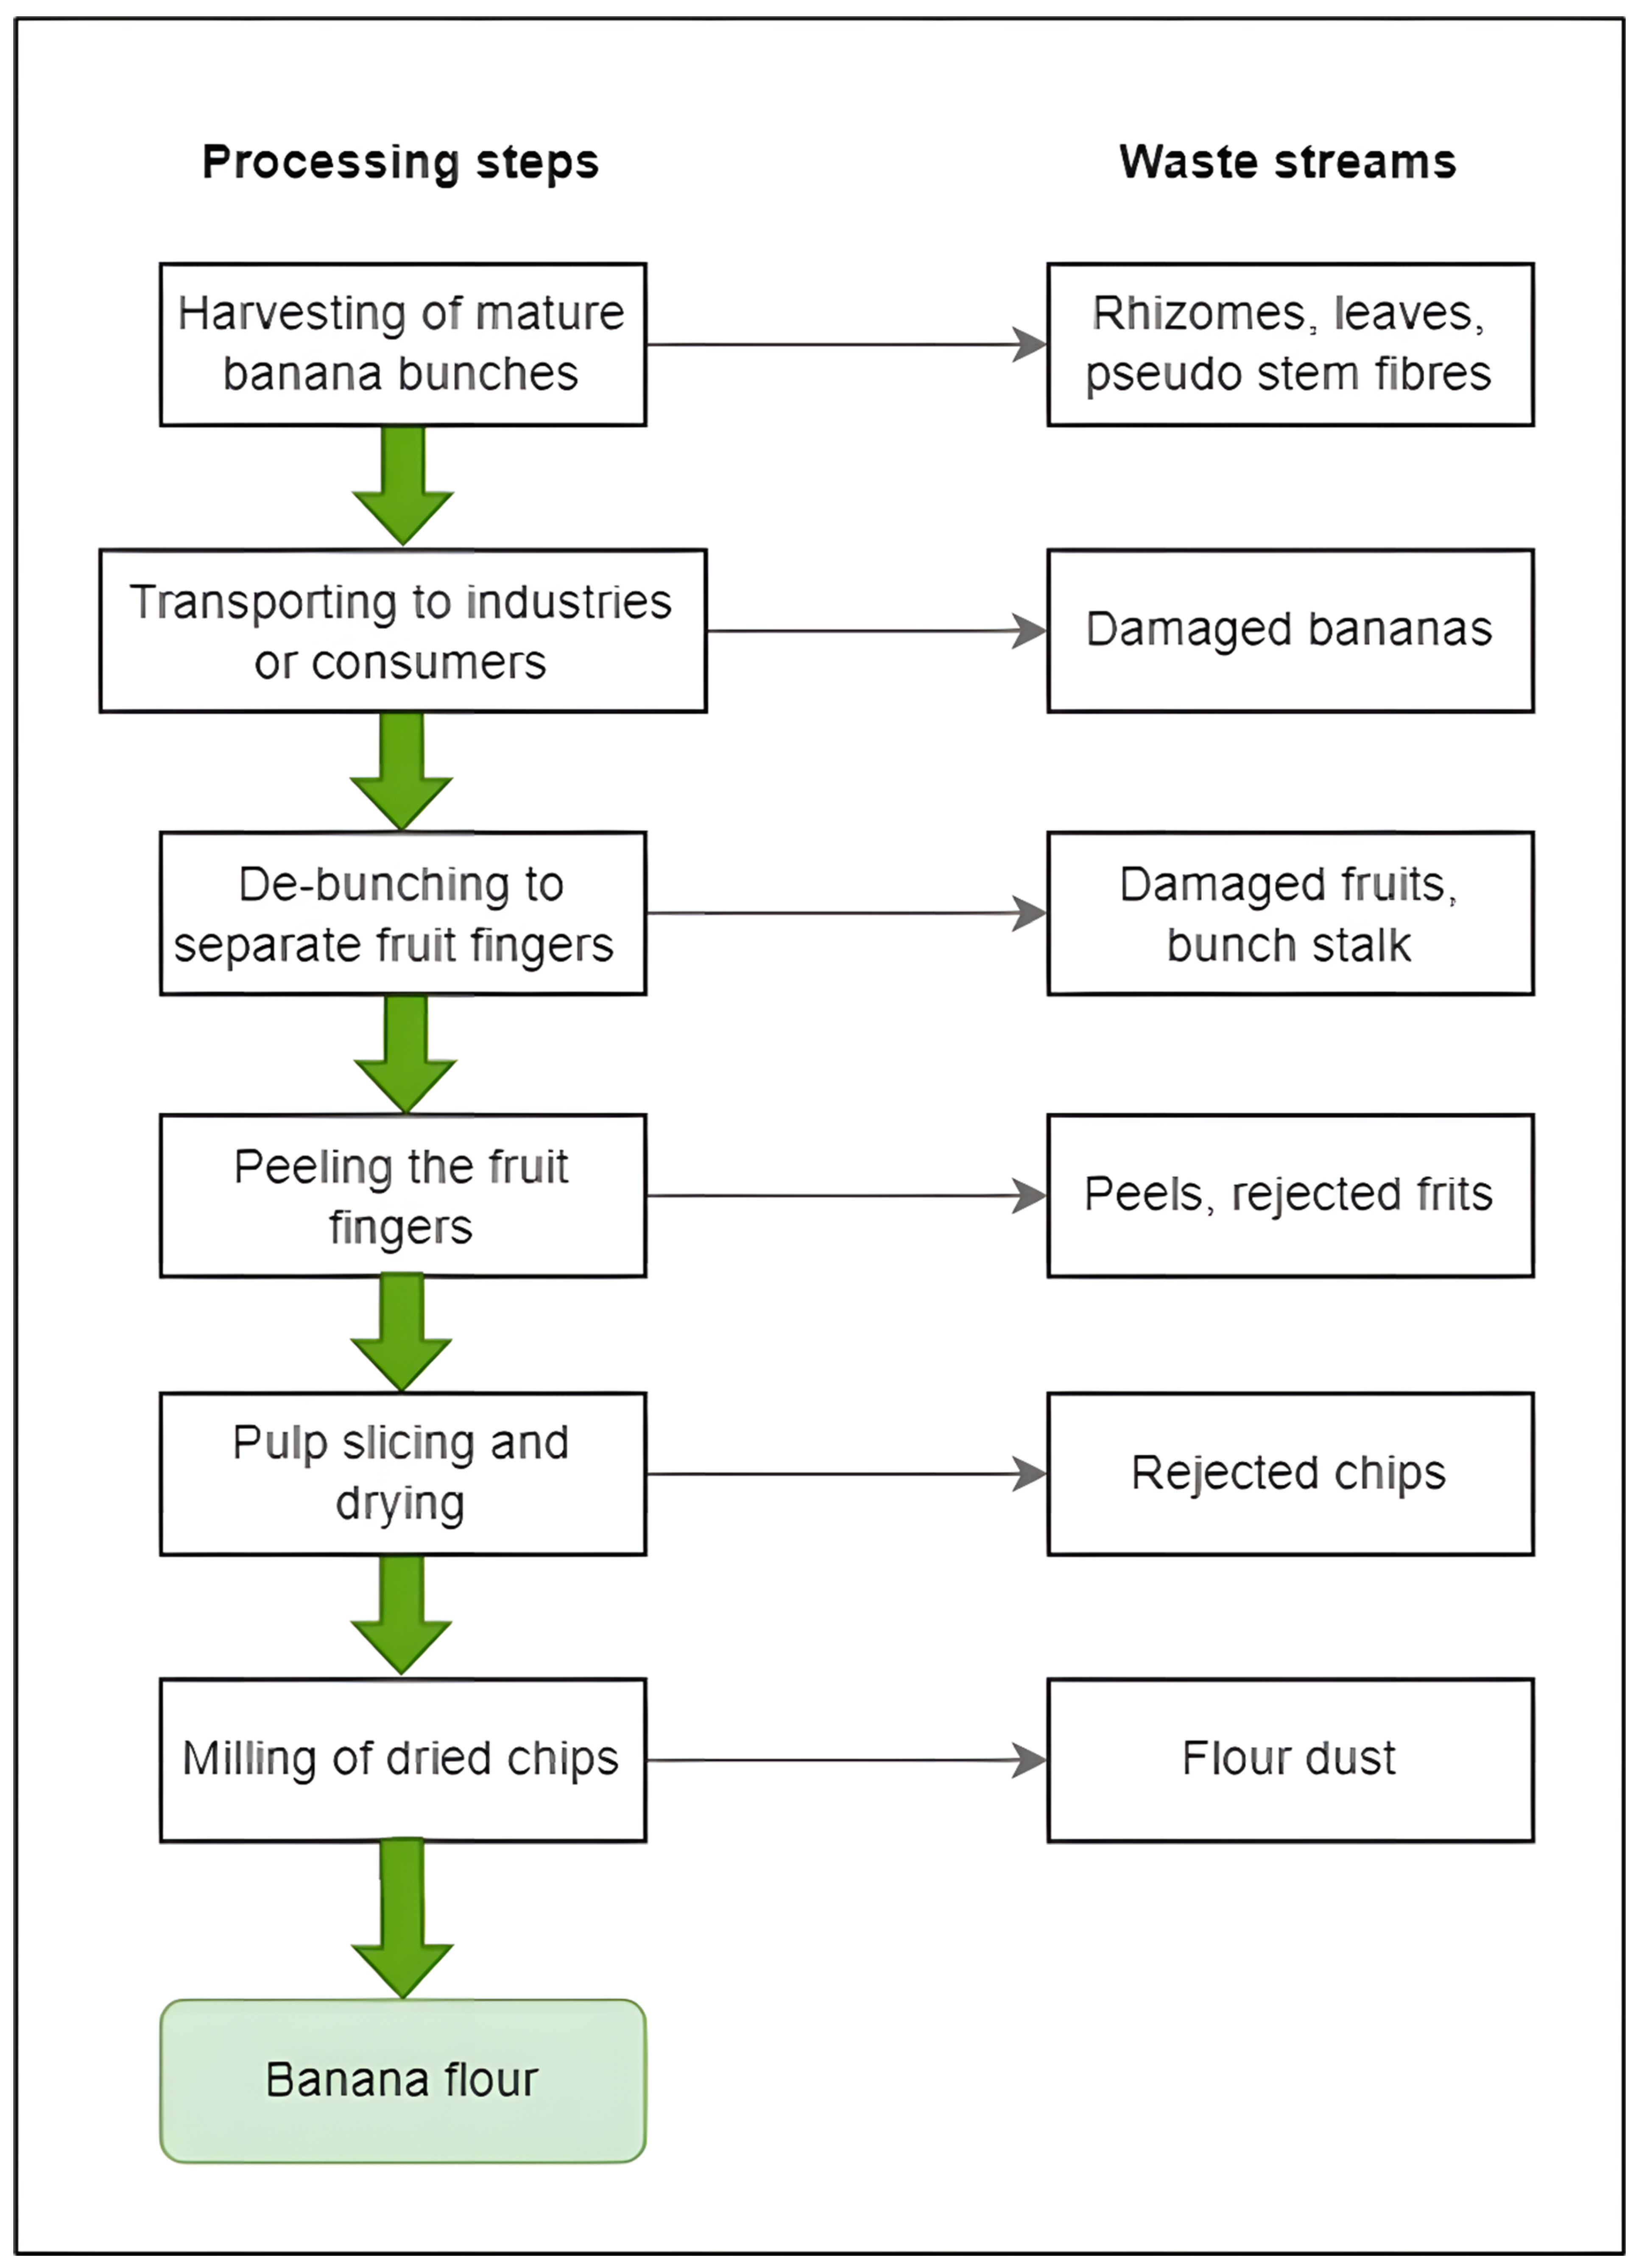
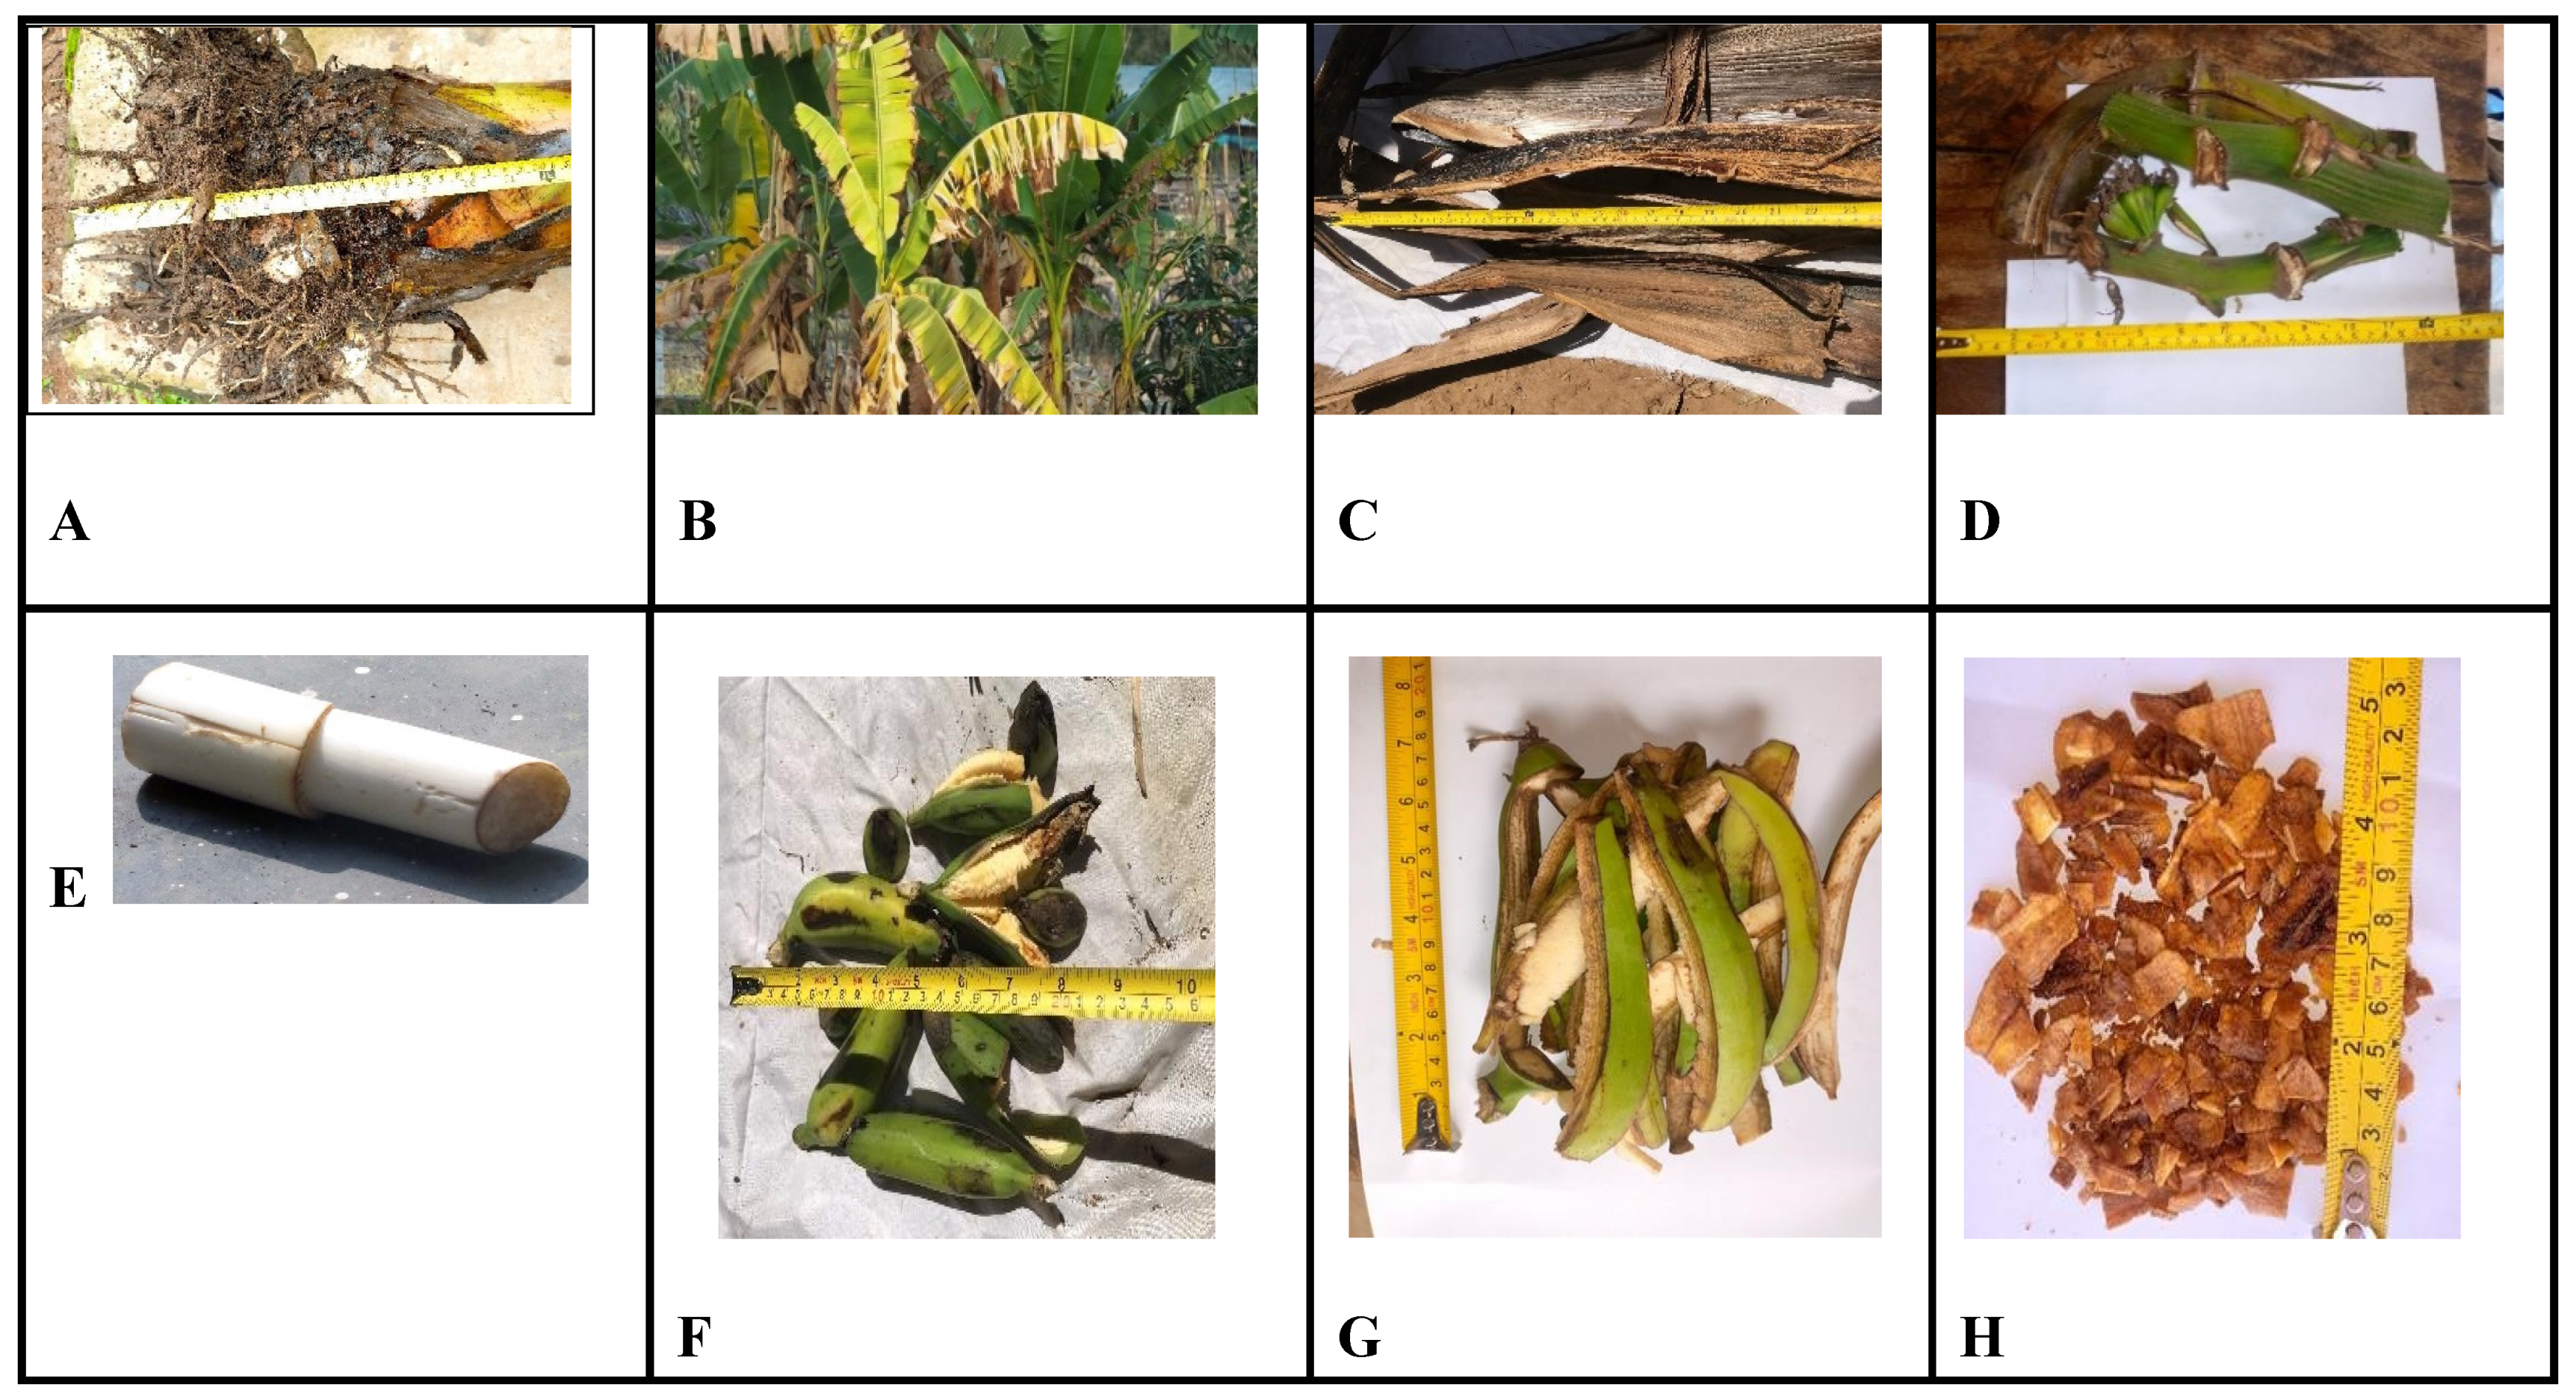
The banana value chain in Uganda typically generates nine types of wastes including (i) pseudo stems, (ii) pseudo stem fibers, (iii) leaves, (iv) rhizome, (v) fruit bunch stem/or stalk, (vi) banana peels, (vii) rejected fruits, (viii) rejected chips, and (ix) flour dust, as illustrated in Figure 3. Figure 4 shows the pictures of each of these wastes. The pseudo stems, fibers, leaves, and rhizomes are generated and left in the field during harvesting time. In most cases, these biomass wastes remain in the field after the fruit bunches are cut off. The remaining wastes, including the fruit bunch stalk, banana peels, and rejected fruits, are generated during the processing of bananas. Essentially, for every ton of bananas harvested, about 4.18 MT of lignocellulosic biomass wastes are generated, including 3.0 MT of pseudo stem, 0.48 MT of leaves, 0.44 MT of banana peels, 0.16 MT of stalks, and 0.10 MT of rotten fruits [17].
The rhizome is the root part that remains in the ground after cutting off the pseudo stem. The pseudo stem is the part of the banana plant that transports nutrients from the soil to the fruits. When dried, it turns to fibers. Typically, fibers have a density of 750–950 kg/m3, length from 2000 to 5000 mm, and diameter from 0.080 to 0.250 mm [18]. Banana leaves are the large, wide, elongated, and slightly rounded parts of the banana plant responsible for trapping sunlight. They are, on average, 2 and 0.5 m in length and width, respectively. Each banana plant can have between 8 and 12 leaves.
The rhizomes and pseudo stems are normally decomposed in the garden or heaped and burnt to curb the risk of spreading banana bacterial wilt by banana waste obtained from infected banana plants. Pseudo stems and leaves are also used for mulching the plantations, as well as for composting purposes. Fresh pseudo stems and leaves are utilized as livestock feed. Their low protein and high fiber levels, low digestibility, and the presence of anti-nutrients like tannin and alkaloids are the main limitations to their usage as the only source of feed for animals. As a result, numerous research methods have been used to improve their feeding value, including crushing, microbial degradation, enzyme treatment, and combining with other agricultural wastes [19]. Alternative uses of the pseudo stems, fibers, and leaves are being sought, for instance, in house construction, banana silk extraction, energy production, and manufacture of paper, ropes, table mats, and handbags, as well as in food preparation at a household level and in restaurants and hotels, among others [20].
Banana fruit bunches are de-bunched upon arrival at the industry or home, separating the fruit fingers from the fruit bunch stalk. The stalks are usually openly dumped or left to dry and subsequently utilized as fuel for households. Rejected fruits/fingers are fruit residues deemed unusable during banana processing. They are usually partially rotten and contaminated with soil or diseased. The rejected fruits are used to feed domestic animals and are sometimes employed as a feedstock for biogas production. However, in situations where the rejected fruits do not have immediate application, the fruits are merely openly dumped.
Banana peels are the outer cover for the banana fingers that are removed to expose the pulp. For every ton of fingers processed, about 500 kg of peels is generated [21]. These are, in most cases, used as animal feed. However, since they are produced in large quantities than can be consumed, some of them end up rotting and are subsequently dumped. Rejected chips are chopped into pulp pieces rejected along the processing chain usually due to contamination. Rejected chips are characterized by low moisture content (<15%) and ease of handling and transport as a result of their particle size < 20 mm.

3.2.3. Sugarcane

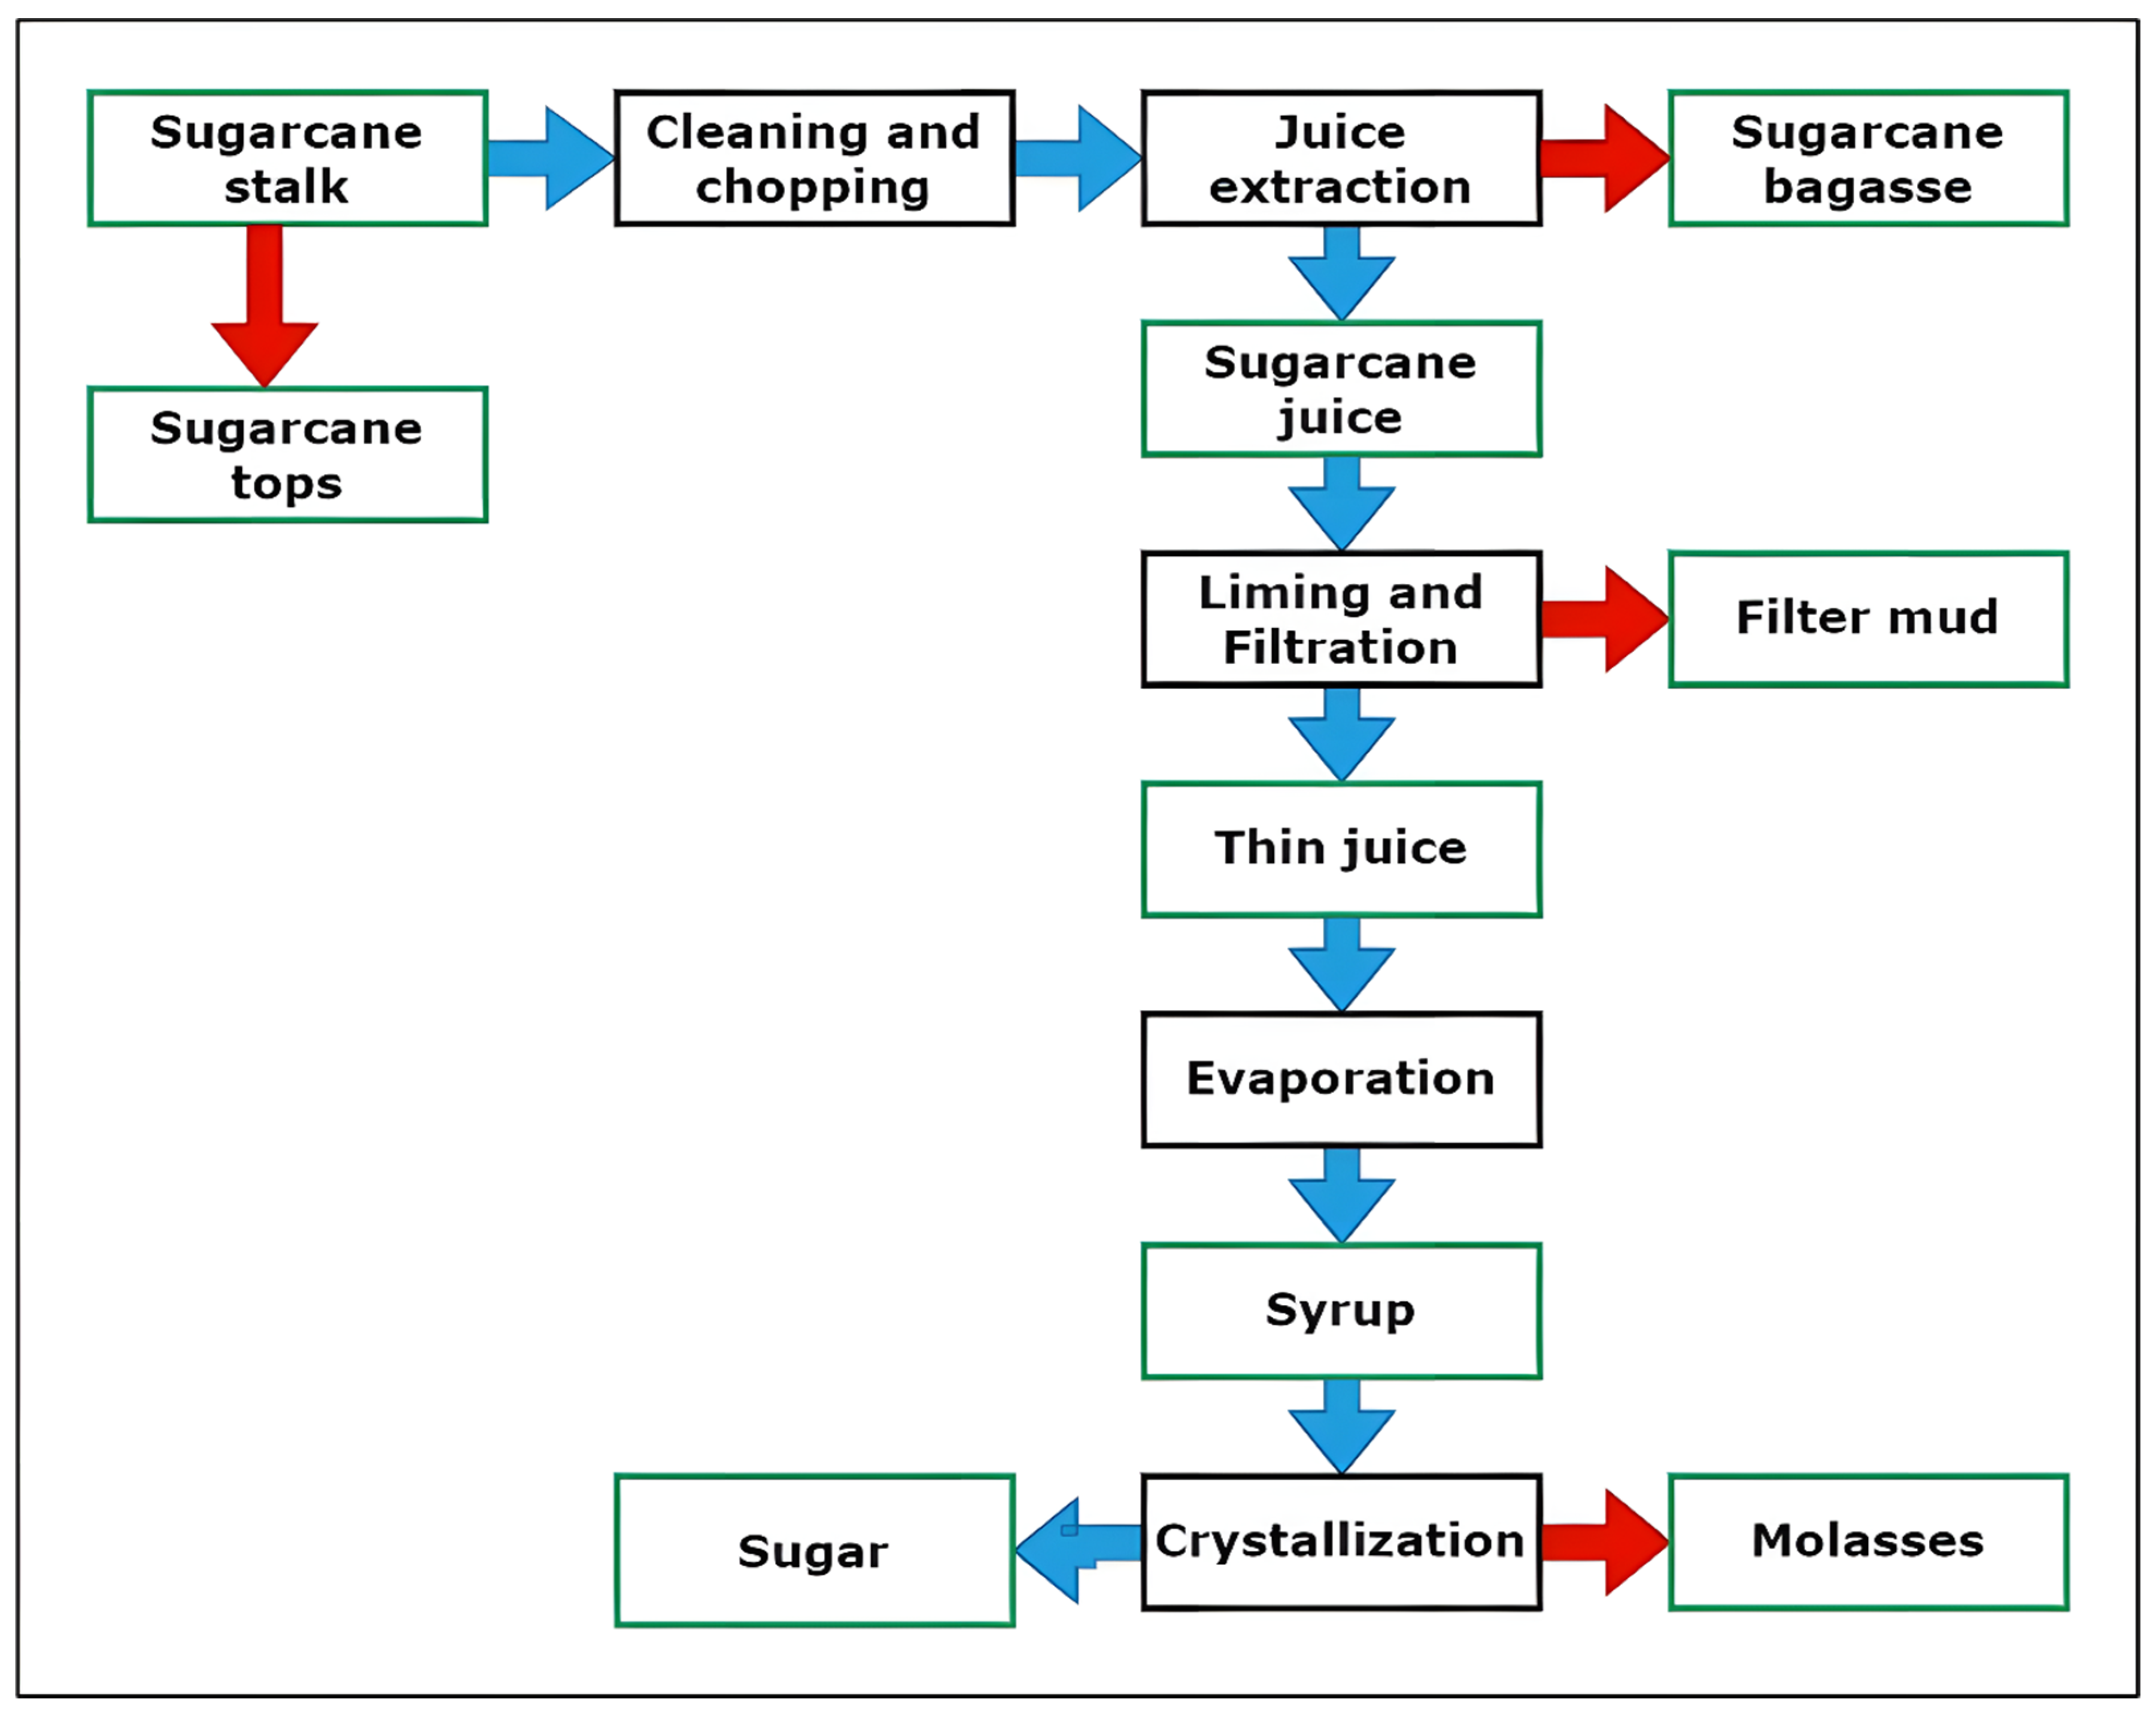
Uganda’s sugarcane production increased from 1.72 million tons in 1971 to 5.34 million tons in 2021, growing at an average annual rate of 3.76% [6] and becoming the largest producer of granular brown sugar in the East African community. This was attributed to the crop’s many end applications, rising pricing, and expanding global and regional consumption/demand. The sugarcane value chain generates four major biomass wastes/byproducts, including sugarcane tops, bagasse, fly ash, filter mud, and molasses, which are generated at different stages of the value chain (Figure 5). Figure 6 illustrates the various wastes generated along the sugarcane value chain.
The sugarcane’s top is a major waste material of the sugarcane industry, which is normally left in the field without immediate application after harvest. It consists of the green leaves, the leaf sheath bundle, and a variable amount of immature cane. The yield of sugarcane tops varies considerably with variety, age at harvest, growing conditions, and management practices [22]. Sugarcane tops account for about 32% of the weight of the cane [13]. Sugarcane leaves are used as animal feed [23]. The leaves are chopped into smaller pieces and then mixed with molasses to feed goats. Farmers utilize them as mulch, while, in some rural areas, it is used as a fuel source for cooking food at a household level. However, some farmers burn the sugarcane tops openly. Open burning is known to cause air pollution and affects human health [24,25]. Open burning in agricultural production fields increases soil temperature, decreases soil water content and bulk density, and, consequently, leads to soil compaction, higher surface water runoff, and soil erosion [26].
Sugarcane bagasse is a fibrous material generated from the milling process of sugarcane with the aim of extracting sugar. For every ton of sugarcane processed, 0.25 tons of bagasse is generated [13]. Bagasse is burnt in boilers to produce high-pressure steam which is used to turn the factory mill turbines in the cogeneration of electricity [27]. The resulting ash is used as a fertilizer and/or binder in brick production [28]. However, the effectiveness of sugarcane bagasse ash in enhancing sugarcane yields is still doubted, and, as such, the application of ash in sugarcane plantations has instead been treated as merely a disposal option for the residue. Several sugarcane factories including Kakira Sugar Limited, Kinyara Sugar Limited, Sugar Cooperation of Uganda Limited (SCOUL), Mayuge Sugar Industries Limited, and Sugar and Allied Industries Limited (SAIL) Kaliro in Uganda use bagasse to produce heat and electricity in sugar mills (cogeneration); however, only three are licensed to supply to the national grid with a total installed capacity of 96.2 MW [29]. Bagasse can also be used for a variety of other purposes such as in paper making, as cattle feed, and in the manufacturing of disposable food containers [26]. The surplus bagasse is then applied to the fields and/or openly burnt.
Press mud, or a filter cake, is generated from the filtration and clarification processes of sugarcane juice. For each ton of ground sugarcane, 0.01 to 0.07 tons of press mud is generated [26]. Though the press mud exhibits huge potential in various applications, its application in the country is mainly limited to the fertilization of agricultural fields.
Molasses is a byproduct of sugarcane extraction. During the processing of sugarcane, 35–45 kg of molasses is generated as a byproduct from 1 ton of cane biomass [30]. It is a viscous liquid with numerous potential applications at both domestic and industrial levels, including cattle feed, edible syrup, fertilizer, boiler fuel, road surfacing, and alcohol production, among others. Molasses, in Uganda, is utilized in the production of bioethanol with biogas and manure as byproducts of the process [27]. It is also utilized in briquette production as a binder.
3.3. Characteristics of the Main Agri-Food Value Chain Wastes in Uganda

There are several kinds of waste generated along banana, maize, and sugarcane value chains; however, this review considered only those with the highest residue-to-product ratios. These include pseudo stems, banana peels, and banana leaves for the banana value chain; stover and cobs for the maize value chain; and sugarcane tops and bagasse for the sugarcane value chain. For biomass gasification, the key characteristics of significance are bulk density, particle size, and calorific value. The following subsections provide the results of these characteristics and other inherent biomass characteristics that are associated with the main agri-food value chain waste materials in Uganda.

3.3.1. Bulk Density

The bulk densities for the biomass feedstocks vary from 65.5 to 160 kg/m3 (Table 3). Bulk density is an indicator of residence time in the gasifier that, ultimately, determines the conversion efficiency of the gasification process [31]. Fuels with a high bulk density are advantageous because they represent a high energy-for-volume value. For a given refueling time, these fuels require less bunker room. Because lower-density biomass burns through the reactor’s fuel supply more quickly, gasification should be performed with replenishment as the reactor’s biomass is used up [32]. Low bulk-density materials also create feeding difficulties in gasification systems as materials with a low bulk density do not allow for gravity feed inside the gasifier, a condition that leads to poor combustion conditions within gasification systems, resulting in reduced efficiency [33]. These problems are solved to some extent by densification through the compaction of residues into high-density feedstock. Pelleting, briquetting, and extrusion processing are methods commonly used to achieve densification [34]. Densification increases biomass density by up to four times, resulting in a lower transportation cost, smaller required storage area, and less fine particle formation [35]. A more uniform and stable size and shape make biomass pellets usable for the production of fuel and energy processes such as gasification, combustion, and pyrolysis. Densification improves biomass handling and transportation efficiencies throughout the supply chain until the feeding phase in a biorefinery [36].
Efficient and economic biomass-to-energy conversion is heavily influenced by the economics and consistency of biomass supplies from the field to the biorefinery. The cost of feedstock production, handling, transportation, and pre-processing accounts for 40–60% of the total cost of bioenergy production, while the cost of transportation only accounts for 13–28% of the total costs [37]. One major factor that affects the delivery cost, collection and transportation, and storage of biomass is bulk density. Bulk density also affects the design and operation of energy conversion systems and heat transfer equipment [38].
Bulk density depends on a number of factors including composition, particle size, shape, particle orientation, particle size distribution, moisture content, and the specific density of the individual particles of the biomass material [31]. Particle size distribution and size are two important factors that affect the bulk physical properties of feedstocks. Larger-sized feedstock requires a longer time to complete gasification, and the flow of feedstock obstruction can occur. The irregularity of the size and shapes of agricultural residues generates low-quality producer gas, especially when these materials are used directly or without any pre-processing. Gas yield and gas composition are related to the heating rate. Smaller sizes of feedstock particles mean a larger surface area for contact and reaction with the gasifying medium [31]. A larger contact area also results in a faster heating rate; thus, more gases and less char and condensation are produced.

3.3.2. Proximate Analysis

Proximate analysis provides the fuel properties in terms of the weight percentages of moisture, volatile matter, fixed carbon, and the ash content of the material. Table 4 presents the results of the proximate analysis of the three main agri-food value chains in Uganda. A high moisture content lowers the efficiency of thermal conversion, syngas quality, and syngas higher heating value (HHV); moreover, conversion emissions increase [39]. The moisture stored in the biomass feedstocks requires about 2300 kJ/kg to vaporize and 1500 kJ/kg to raise its temperature to 700 °C during pyrolysis [32]. The process becomes less efficient as a result of these efforts, which use the energy from the combustion zone. The moisture content for all the considered biomass is low (6.67–22.5%), falling below the recommended value of less than 30% for gasification processes [40]. However, moisture content in the range of 10–20% is generally required for conventional gasification technologies, keeping bed temperatures moderately stable [39]. Instead, feedstocks with a high moisture content can be utilized in the supercritical water gasification (SCWG) process, whereby water is used as a reaction medium. This method allows for the gasification of wet biomass without first drying the material, saving on the high processing costs related to the drying process [41].
Banana waste has a relatively high volatile matter (83.05–89.43%) compared to maize waste (56–78%) and sugarcane waste (62.7–72.08%). As a result, banana waste will require very little heat for the gasification process, contributing to an increase in calorific content. However, sugarcane and maize waste are also advantageous during gasification since low volatile matter leads to reduced tar production, which causes problems in internal combustion engines normally used in power generation thermochemical reactions [42].
Biomass fuels with an ash content above 6% result in increased slagging tendencies [43]. Slagging can result in excessive tar development and/or reactor obstruction, which interferes with the gasifier’s ability to operate without interruption. While maize waste has an ash level of 3.39–5.6% and sugarcane bagasse has an ash content of 2.5%; banana wastes and sugarcane tops have high ash contents of 9% and 9%, respectively (Table 3). Banana wastes and sugarcane tops can be burned in a downdraft gasifier below 1000 °C to help reduce the slagging effect [44].
Table 4. Proximate analysis on dry basis (db) of the biomass waste for the maize, banana, and sugarcane value chains in Uganda.
BiomassMoisture Content (%db)Ash Content (%db)Volatile Matter (%db)Fixed Carbon (%db)References
Maize cobs13.6–15.03.39–5.256–7818.8–20.7[45,46]
Maize stover12.55.666.215.7[47]
Pseudo stems7.989.3689.431.21[17]
Banana leaves6.679.0583.357.60[17]
Banana peels11.569.2888.022.70[17]
Sugarcane tops7.059.6972.0818.23[48]
Sugarcane bagasse22.52.562.712.2[49]

3.3.3. Ultimate Analysis

The ultimate analysis provides the proportions of carbon, hydrogen, oxygen, nitrogen, and sulfur of the biomass feedstock. Carbon, hydrogen, and oxygen represent the principal elements determining the biomass fuels’ effectiveness and are the fundamental components of any solid biomass fuel material. Table 5 shows that oxygen has the highest proportion (38.76–57.25%), followed by carbon (33.46–47.9%) and hydrogen (~6%), of the considered biomass waste in this study. The composition of these three elements plays an essential role in solid biomass conversion in the thermochemical processes of combustion, gasification, and pyrolysis. They affect, specifically, the gas quality, liquid biofuel quality, and emission gases. Hydrogen is one of the final products of gasification; therefore, its impact during the gasification process is important [50]. Oxygen is responsible for the reactivity and ignition stability of biomass when used as fuel in thermochemical conversion systems such as gasification [51]. The oxygen is comprised of alcohol and carboxylic acid groups, the main components of which are cellulose, lignin, and hemicellulose. However, high oxygen content tends to lower the calorific value. It is, therefore, important to first de-oxidize the biomass through torrefaction in order to increase the heating value [36]. Nitrogen and sulfur contribute to the pollution of the environment by producing NOx and SO2 when combusted in air; therefore, lower levels are preferred [52].

3.3.4. Calorific Value

The heating values for all considered biomasses range from 12.6 to 16.74 MJ/kg as illustrated in Table 6, which is comparable to the heating value of coal. This is attributed to the high oxygen composition that is typical of all biomass materials. Feedstocks with high heating values are desirable [17,32,52]. A high-heating value material leads to improved functionality and reduces the amount of energy used by the feedstock conveyor in power plants [42]. The calorific value is one important parameter that determines the thermal conversion efficiency of any biomass material. The low heating value, or net calorific value, is the net energy content of a given biomass obtained by combusting a specified quantity and returning the temperature of the combustion products to 150 °C, assuming the latent heat of vaporization is not considered. The high heating value, or gross calorific value, considers the latent heat of vaporization since the combustion products return to room temperature. The low energy density of biomass like maize cobs and pseudo stems leads to a high cost in transportation per unit energy and more storage space requirements, thus making material logistics expensive [37,38]. System efficiency is also affected by low energy-density materials; hence, more fuel would be required to obtain the same amount of energy [37].

3.3.5. Lignocellulosic Components

The lignocellulosic composition for biomass feedstock for the main agri-food value chains in Uganda is given in Table 7. The percentage of hemicellulose ranges from 23.46 to 41.38%, cellulose 9.9 to 55%, and lignin 5.77 to 35%. High cellulose and hemicellulose content make the gasification process fast and yield high tar and gas with low char. Lignin has the same effect at relatively much wider temperature ranges largely due to the dealkylation of the side chain of the alkylphenols in the lignin structure [54]. Lignin also provides other functions in plants including acting as glue. Due to its thermosetting characteristics at working temperatures of 414 °C, it also helps in the formation of pellets or briquettes without binders [55]. The presence of lignin, which serves as a bulking and rigidifying agent in lignocellulosic plant material, allows for adhesion in the structure of that material. The adhesive properties of thermally softened lignin are responsible for the strength characteristics of briquettes made from lignocellulosic biomass materials. Banana pseudo stems, banana peels, and sugarcane tops have an exceptionally low lignin content.
Lignocellulosic biomass is a potential feedstock for the sustainable production of bioenergy and value-added products. The natural resistance of this material to be broken down, however, is a significant barrier to its use. Current technologies require pre-treatments with severe conditions to disrupt the plant cell wall structures and remove their main components [56]. Pre-treatment is an important process for effective waste-to-energy recovery [57]. The process of lignocellulosic pre-treatments improves a number of properties in favor of the gasification process, including calorific value, ash content, size distribution, particle shape, moisture content, bulk and particle densities, compressibility, and compact ratio [57]. Pre-treatment methods including washing/leaching, steam explosion, hydrothermal carbonization, torrefaction, and densification methods such as pelletizing and briquetting are used to improve the aforementioned properties. Torrefaction is a pre-treatment process that helps improve the physical characteristics of the material [36]. During torrefaction, a number of lignin-active sites are opened up, breaking down the hemicellulose matrix to form unsaturated compounds with better binding properties, consequently improving the binding ability of the feedstock [36].
Table 7. Lignocellulosic composition of the biomass feedstock of the main agri-food value chains in Uganda.
BiomassHemicellulose (%)Cellulose (%)Lignin (%)References
Maize cobs25–3545–5520–30[58]
Maize stover25.4736.2321.83[47]
Pseudo stems25.3638.485.77[17]
Banana leaves23.4635.5810.58[17]
Banana peels41.389.98.9[17]
Sugarcane tops36.6841.416.39[59]
Sugarcane bagasse25–3540–5015–35[60]

3.4. Energy Potential of Maize, Banana, and Sugarcane Value Chain Biomass Waste in Uganda

The energy potential of crop residues for the main agri-food value chains in Uganda is given in Table 8. The results show that maize stover, pseudo stems, and sugarcane tops have the highest energy potentials of 93.9, 33.7, and 13.7 PJ per year, respectively. The values estimated in this study are relatively high compared to the study of Okello et al. [13] because of the increasing crop production reported in the last ten years. The total energy potential for all three value chains considered is 172.2 PJ per year. This energy can be utilized to meet 58.7% of the cooking demands for the entire country, which can help offset some of the effects resulting from using firewood and charcoal. Uganda households’ projected demand for charcoal and firewood for cooking in 2020 was 2.1 and 17.01 million metric tons, respectively [61]. Considering the average calorific values for charcoal and firewood in Uganda are 26.25 and 14 MJ/kg, respectively [62,63], the total biomass energy demand for cooking in 2020 was 293.3 PJ. The energy potential presented is assumed to be a gross value at 100% efficiency when all the residues are utilized. However, currently, some of the residues are being utilized for other purposes, and the actual implementation potential is determined by a number of factors including economic, social, environmental, institutional, and policy incentives. The implementable potential is further influenced by logistical issues, infrastructure and technology limitations, and the availability of skilled personnel.

4. Gasification in Uganda

In Uganda, gasification technology is not widely used or known; however, previous research has indicated that small-scale wood gasifiers could be economically and socially viable energy systems for generating electricity in rural areas [9]. The typical cases where these technologies have been successfully used include (1) Muziizi Tea Estate, at which a gasification unit using wood as feedstock with an 87 kW average power output was used; although, it was rated at 200 kW, indicating a low operating efficiency [66]; (2) a 10 kW unit in Mukono also using wood as feedstock [67]. The only operating unit using biomass waste is found in the Bukurungo Trading Center, Kamwenge District of Western Uganda. This power plant uses local crop residue to generate clean energy for over 500 households and an agro-processing facility of 75 kVA [68]. Another 20 MW gasification plant construction in the Northern district of Gulu will be completed in the year 2024. The biomass plant is projected to produce electricity for agro-processing, heat for drying agro-produce, and biochar for organic fertilizer in a cost-effective manner. Olupot et al. [52] demonstrated that a gasifier generator system of 250 kW, when operated for 8 h a day, for 350 days in a year, requires 5.8 metric tons of rice husk per day to produce 700 MWh/year, which saves USD 98,000 in electricity production compared to when a diesel plant is used. Gasification technology, therefore, can be a good alternative for utilizing large amounts of agricultural waste for electricity generation in Uganda.

5. Conclusions

Due to rising energy demands, depreciating conventional fossil resources, and an increasing population, agricultural residues are gaining attention for their use in energy production. This review investigated the various agri-food value chains in Uganda for the potential generation of waste for use in bioenergy production using gasification. Maize, beans, cassava, banana, coffee, and sugarcane are the most important value chains, occupying 5.73 million hectares and accounting for roughly 40% of the country’s total area under agriculture. In terms of potential biomass residues, bananas, maize, and sugarcane produce 4.18, 2.2, and 0.6 metric tons of biomass waste per ton, respectively. The bulk density, proximate analysis, ultimate analysis, calorific value, and lignocellulosic components of biomass waste have been presented. The heating values for all the considered biomasses ranged from 12.6 to 16.74 MJ/kg. These are low compared to the heating value of coal. This is attributed to the high oxygen composition, which varies from 38.76 to 57.25%, which is typical of all biomass materials with a low bulk density that varies from 65.5 to 160 kg/m3. The low energy density of biomass led to the high cost of transportation per unit of energy, as well as more storage space requirements, thus making material logistics expensive. These problems are solved to some extent using densification through the compaction of residues. The three value chains have the potential to generate 172.2 PJ per year, which is enough to offset 50% of Uganda’s cooking energy requirement. Based on their composition and present utilization, maize stover, banana leaves, banana pseudo stems, and sugarcane tops are attractive gasification feedstocks.

Author Contributions

Conceptualization, P.W.O., T.M. and J.G.N.; Methodology, P.W.O., T.M. and J.G.N.; Validation, P.W.O.; Formal analysis, T.M. and J.G.N.; Investigation, T.M. and J.G.N.; Data curation, P.W.O., T.M. and J.G.N.; Writing—original draft, T.M.; Writing—review & editing, P.W.O., T.M. and J.G.N.; Visualization, T.M. and J.G.N.; Supervision, P.W.O. and J.G.N.; Project administration, P.W.O. All authors have read and agreed to the published version of the manuscript.

Funding

This work was supported by the project entitled “Renewable energies for Africa: Effective valorisation of agri-food wastes (REFFECT AFRICA)”. This project has received funding from the European Union’s Horizon 2020 Research and Innovation program under grant agreement number 101036900.

Data Availability Statement

All the data generated in this research have been included in this paper.

Conflicts of Interest

The authors declare that they have no known competing financial interests or personal relationships that could have appeared to influence the work reported in this paper.

References

  1. dos Santos, H.T.M.; Balestieri, J.A.P. Spatial analysis of sustainable development goals: A correlation between socioeconomic variables and electricity use. Renew. Sustain. Energy Rev. 2018, 97, 367–376. [Google Scholar] [CrossRef]
  2. IEA; IRENA; UNSD; World Bank; WHO. Tracking SDG7—The Energy Progress Report 2022, Washington DC. 2022. Available online: https://sdgs.un.org/publications/tracking-sdg7-energy-progress-report-2022-47726 (accessed on 30 November 2022).
  3. Mocumbi, A.O.; Stewart, S.; Patel, S.; Al-delaimy, W.K. Cardiovascular Effects of Indoor Air Pollution from Solid Fuel: Relevance to Sub-Saharan Africa. Curr. Environ. Health Rep. 2019, 6, 116–126. [Google Scholar] [CrossRef] [PubMed]
  4. United Nations. Sustainable Develeopment Goals, about Sustain. Dev. Goals. 2015. Available online: https://www.un.org/sustainabledevelopment/sustainable-development-goals/ (accessed on 28 September 2022).
  5. UBOS. Uganda Bureau of Statistics 2021 Statistical Abstract, Kampala, Uganda. 2021. Available online: http://library.health.go.ug/publications/statistics/ubos-statistical-abstract-2021 (accessed on 30 November 2022).
  6. FAO. FAOSTAT Statistical Database. 2022. Available online: https://www.fao.org/faostat/en/#data/QCL (accessed on 7 July 2022).
  7. Odoi-Yorke, F.; Osei, L.K.; Gyamfi, E.; Adaramola, M.S. Assessment of crop residues for off-grid rural electrification options in Ghana. Sci. Afr. 2022, 18, e01435. [Google Scholar] [CrossRef]
  8. Siming, Y.; Yong, O.S.; Chen, S.S.; Tsang, D.C.; Kwon, E.E.; Lee, J.; Wang, C.H. A critical review on sustainable biochar system through gasification: Energy and environmental applications. Bioresour. Technol. 2017, 246, 242–253. [Google Scholar] [CrossRef]
  9. You, S.; Tong, H.; Armin-Hoiland, J.; Tong, Y.W.; Wang, C.H. Techno-economic and greenhouse gas savings assessment of decentralized biomass gasification for electrifying the rural areas of Indonesia. Appl. Energy 2017, 208, 495–510. [Google Scholar] [CrossRef]
  10. Singh, J.; Panesar, B.S.; Sharma, S.K. Energy potential through agricultural biomass using geographical information system-A case study of Punjab. Biomass Bioenergy 2008, 32, 301–307. [Google Scholar] [CrossRef]
  11. UBOS. Uganda National Household Survey 2019/2020, Kampala, Uganda. 2021. Available online: https://www.ubos.org/wp-content/uploads/publications/09_2021Uganda-National-Survey-Report-2019-2020.pdf (accessed on 30 November 2022).
  12. UBOS. Annual Agricultural Survey 2018 Statistical Release, Kampala; UBOS: Kampala, Uganda, 2020.
  13. Okello, C.; Pindozzi, S.; Faugno, S.; Boccia, L. Bioenergy potential of agricultural and forest residues in Uganda. Biomass Bioenergy 2013, 56, 515–525. [Google Scholar] [CrossRef]
  14. Mugerwa, S.; Kabirizi, J.; Zziwa, E.; Lukwago, G. Utilization of crop residues and agro-industrial by-products in livestock feeds and feeding systems of Uganda. Int. J. Biosci. 2012, 2, 82–89. [Google Scholar]
  15. MAAIF. Transformation of Subsistence Banana Growing into Commercial Production for Export and Improved Livelihoods. 2019. Available online: https://www.agriculture.go.ug/2019/04/16/transformation-of-subsistence-banana-growing-into-commercial-production-for-export-and-improved-livelihoods/ (accessed on 13 July 2022).
  16. CABI. Improving Banana Agronomy Practices for Small Scale Farmers in East Africa. 2021. Available online: https://www.cabi.org/projects/improving-banana-agronomy-practices-for-small-scale-farmers-in-east-africa/ (accessed on 20 March 2023).
  17. Kabenge, I.; Omulo, G.; Banadda, N.; Seay, J.; Zziwa, A.; Kiggundu, N. Characterization of Banana Peels Wastes as Potential Slow Pyrolysis Feedstock. J. Sustain. Dev. 2018, 11, 14. [Google Scholar] [CrossRef]
  18. Bharathi, S.V.; Vinodhkumar, S.; Saravanan, M. Strength characteristics of banana and sisal fiber reinforced composites. IOP Conf. Ser. Mater. Sci. Eng. 2020, 1055, 012024. [Google Scholar] [CrossRef]
  19. Okoli, I.C. Banana and Plantain Wastes 3: Use of Pseudo-Stem and Leaves as Animal Feed, Research Tropica. 2020. Available online: https://researchtropica.com/banana-and-plantain-wastes-3/#:~:text=Banana (accessed on 4 January 2023).
  20. Gumisiriza, R.; Hawumba, J.F.; Okure, M.; Hensel, O. Biomass waste-to-energy valorisation technologies: A review case for banana processing in Uganda. Biotechnol. Biofuels 2017, 10, 11. [Google Scholar] [CrossRef]
  21. Gumisiriza, R.; Hawumba, J.F.; Balyeidhusa, A.S.P.; Okure, M.; Hensele, O. Processing of East African Highland Green Bananas: Waste Generation and Characterization as a Potential Feedstock for Biogas Production in Uganda. Am. Sci. Res. J. Eng. Technol. Sci. 2019, 53, 215–236. [Google Scholar]
  22. OECD. Revised Consensus Document on Compositional Considerations for New Varieties of Potato (Solanum tuberosum): Key Food and Feed Nutrients, Toxicants, Allergens, Anti-Nutrients and Other Plant Metabolites. Series on the Safety of Novel Foods and Feeds. 2020. Available online: https://www.oecd.org/officialdocuments/publicdisplaydocumentpdf/?cote=env/jm/mono(2020)37&doclanguage=en (accessed on 15 January 2023).
  23. Saraye, G. Evaluating Bagasse-Based Ration as a Sole Feed for Goats. Univ. Maurit. Res. J. 2009, 15, 65–76. [Google Scholar]
  24. Pham-Thi Hong, P.; Trung-Dung, N.; Pham-Thi Mai, T.; Chau-Thuy, P.; Tham-Trinh, T.; Nguyen Thanh, D. Impact of rice straw open burning on local air quality in the Mekong Delta of Vietnam. Atmos. Pollut. Res. 2021, 12, 101225. [Google Scholar]
  25. Okedere, O.B.; Olalekan, A.P.; Fakinle, B.S.; Elehinafe, F.B.; Odunlami, O.; Sonibare, J. Urban air pollution from the open burning of municipal solid waste. Environ. Qual. Manag. 2019, 28, 67–74. [Google Scholar] [CrossRef]
  26. Bhatnagar, A.; Kesari, K.K.; Shurpali, N. Multidisciplinary Approaches to Handling Wastes in Sugar Industries. Water. Air. Soil Pollut. 2016, 227, 11. [Google Scholar] [CrossRef]
  27. Nakamya, M.; Romstad, E. Ethanol for an agriculture-based developing economy: A computable general equilibrium assessment for Uganda. Energy Sustain. Dev. 2020, 59, 160–169. [Google Scholar] [CrossRef]
  28. Sales, A.; Lima, S.A. Use of Brazilian sugarcane bagasse ash in concrete as sand replacement. Waste Manag. 2010, 30, 1114–1122. [Google Scholar] [CrossRef] [PubMed]
  29. ERA. Energy Generated by the Bagasse Power Plants. 2021. Available online: https://www.era.go.ug/index.php/stats/generation-statistics/energy-generated-bagasse-power-plants (accessed on 20 March 2023).
  30. Jamir, L.; Kumar, V.; Kaur, J.; Kumar, S.; Singh, H. Composition, valorization and therapeutical potential of molasses: A critical review. Environ. Technol. Rev. 2021, 10, 131–142. [Google Scholar] [CrossRef]
  31. Lubwama, M. Technical Assessment of the Functional and Operational Performance of a Fixed Bed Biomass Gasifier Using Agricultural Residues; KTH Royal Institute of Technology: Stockholm, Sweden, 2010. [Google Scholar]
  32. de Oliveira, J.L.; da Silva, N.J.; Pereira, E.G.; Filho, D.O.; Carvalho, D.R. Characterization and mapping of waste from coffee and eucalyptus production in Brazil for thermochemical conversion of energy via gasification. Renew. Sustain. Energy Rev. 2013, 21, 52–58. [Google Scholar] [CrossRef]
  33. Anukam, A.; Mamphweli, S.; Reddy, P.; Meyer, E.; Okoh, O. Pre-processing of sugarcane bagasse for gasification in a downdraft biomass gasifier system: A comprehensive review. Renew. Sustain. Energy Rev. 2016, 66, 775–801. [Google Scholar] [CrossRef]
  34. Tumuluru, J.S.; Wright, C.T.; Kenny, K.L.; Hess, J.R. A Review on Biomass Densification Technologies for Energy Application. 2010. Available online: https://sswm.info/sites/default/files/reference_attachments/Tumuluru%20et%20al.%202010%20A%20review%20on%20biomass%20densification_0.pdf (accessed on 16 April 2023).
  35. Gilbert, P.; Ryu, C.; Sharifi, V.; Swithenbank, J. Effect of process parameters on pelletisation of herbaceous crops. Fuel 2009, 88, 1491–1497. [Google Scholar] [CrossRef]
  36. Tumuluru, J.S.; Sokhansanj, S.; Hess, J.R.; Wright, C.T.; Boardman, R.D. A review on biomass torrefaction process and product properties for energy applications. Ind. Biotechnol. 2011, 7, 384–401. [Google Scholar] [CrossRef]
  37. Miao, Z.; Phillips, J.W.; Grift, T.E.; Mathanker, S.K. Measurement of Mechanical Compressive Properties and Densification Energy Requirement of Miscanthus × giganteus and Switchgrass. Bioenergy Res. 2015, 8, 152–164. [Google Scholar] [CrossRef]
  38. IRENA. Solid Biomass Supply for Heat and Power: Technology Brief, Internation Energy Agency, Abu Dhabi. 2018. Available online: https://www.irena.org/publications/2019/Jan/Solid-Biomass-Supply-for-Heat-and-Power (accessed on 30 November 2022).
  39. Molino, A.; Larocca, V.; Chianese, S.; Musmarra, D. Biofuels production by biomass gasification: A review. Energies 2018, 11, 811. [Google Scholar] [CrossRef]
  40. Brammer, J.G.; Bridgwater, A.V. The influence of feedstock drying on the performance and economics of a biomass gasifier—Engine CHP system. Biomass Bioenergy 2002, 22, 271–281. [Google Scholar] [CrossRef]
  41. Yakaboylu, O.; Harinck, J.; Smit, K.G.; de Jong, W. Supercritical water gasification of biomass: A literature and technology overview. Energies 2015, 8, 859–894. [Google Scholar] [CrossRef]
  42. Khan, A.A.; de Jong, W.; Jansens, P.J.; Spliethoff, H. Biomass combustion in fluidized bed boilers: Potential problems and remedies. Fuel Process. Technol. 2009, 90, 21–50. [Google Scholar] [CrossRef]
  43. FAO. Wood Gas as Engine Fuel; FAO: Rome, Italy, 1988. [Google Scholar]
  44. Basu, P. Biomass Gasification, Pyrolysis and Torrefaction: Practical Design and Theory, 2nd ed.; Academic Press: Cambridge, MA, USA, 2018. [Google Scholar]
  45. Menya, E.; Olwa, J.; Hagström, P.; Okure, M. Assessment of pollution levels resulting from biomass gasification. J. Environ. Chem. Eng. 2014, 2, 1228–1235. [Google Scholar] [CrossRef]
  46. Wabwire, A.; Okure, M. Performance Characterisation of a Husk Powered System for Rural Electrification in Uganda. Ph.D. Thesis, Makerere University, Kampala, Uganda, 2012. [Google Scholar] [CrossRef]
  47. Munu, N.; Banadda, N.; Kiggundu, N.; Zziwa, A.; Kabenge, I.; Seay, J.; Kambugu, R.; Wanyama, J.; Schmidt, A. Transforming corn stover to useful transport fuel blends in resource-limited settings. Energy Rep. 2021, 7, 1256–1266. [Google Scholar] [CrossRef]
  48. Conag, A.T.; Earl, J.; Luis, R.V.; Alchris, K.C.; Go, W. Predictive HHV Model for Raw and Torrefied Sugarcane Residues. Waste Biomass Valorization 2019, 10, 1929–1943. [Google Scholar] [CrossRef]
  49. Lubwama, M.; Yiga, V.A. Development of groundnut shells and bagasse briquettes as sustainable fuel sources for domestic cooking applications in Uganda. Renew. Energy 2017, 111, 532–542. [Google Scholar] [CrossRef]
  50. Kumar, A.; Jones, D.D.; Hanna, M.A. Thermochemical biomass gasification: A review of the current status of the technology. Energies 2009, 2, 556–581. [Google Scholar] [CrossRef]
  51. Hedayati, A.; Soleimanisalim, A.H.; Mattisson, T.; Lyngfelt, A. Thermochemical conversion of biomass volatiles via chemical looping: Comparison of ilmenite and steel converter waste materials as oxygen carriers. Fuel 2022, 313, 122638. [Google Scholar] [CrossRef]
  52. Olupot, P.W.; Candia, A.; Menya, E.; Walozi, R. Characterization of rice husk varieties in Uganda for biofuels and their techno-economic feasibility in gasification. Chem. Eng. Res. Des. 2016, 107, 63–72. [Google Scholar] [CrossRef]
  53. Rafiq, M.K.; Bachmann, R.T.; Rafiq, M.T.; Shang, Z.; Joseph, S.; Long, R.L. Influence of pyrolysis temperature on physico-chemical properties of corn stover (Zea mays L.) biochar and feasibility for carbon capture and energy balance. PLoS ONE 2016, 11, e0156894. [Google Scholar] [CrossRef]
  54. Pasangulapati, V.; Ramachandriya, K.D.; Kumar, A.; Wilkins, M.R.; Jones, C.L.; Huhnke, R.L. Effects of cellulose, hemicellulose and lignin on thermochemical conversion characteristics of the selected biomass. Bioresour. Technol. 2012, 114, 663–669. [Google Scholar] [CrossRef]
  55. Stewart, D. Lignin as a base material for materials applications: Chemistry, application and economics. Ind. Crops Prod. 2008, 27, 202–207. [Google Scholar] [CrossRef]
  56. Ballesteros, L.F.; Michelin, M.; Vicente, A.A.; Teixeira, J.A.; Cerqueira, M.Â. Lignocellulosic Materials: Sources and Processing Technologies. In Lignocellulosic Materials and Their Use in Bio-Based Packaging; Springer: Cham, Switzerland, 2018; pp. 13–33. ISBN 9783319929408. [Google Scholar]
  57. Tumuluru, J.S.; Hess, J.R.; Boardman, R.D.; Wright, C.T.; Westover, T.L. Formulation, Pretreatment, and Densification Options to Improve Biomass Specifications for Co-Firing High Percentages with Coal. Ind. Biotechnol. 2012, 8, 113–133. [Google Scholar] [CrossRef]
  58. Menon, V.; Rao, M. Trends in bioconversion of lignocellulose: Biofuels, platform chemicals & biorefinery concept. Prog. Energy Combust. Sci. 2012, 38, 522–550. [Google Scholar] [CrossRef]
  59. Khempila, J.; Kongto, P.; Meena, P. Comparative study of solid biofuels derived from sugarcane leaves with two different thermochemical conversion methods: Wet and dry torrefaction. Bioenergy Res. 2022, 15, 1265–1280. [Google Scholar] [CrossRef]
  60. Hailing, P.; Simms-Borre, P. Overview of lignocellulosic feedstock conversion into ethanol focus on sugarcane bagasse. Int. Sugar J. 2008, 110, 191–194. [Google Scholar]
  61. MEMD. National Charcoal Survey for Uganda 2015. Final Report. 2016. Available online: https://pfccparliament.go.ug/wp-content/uploads/2019/04/NationalCharcoalSurvey_FINAL.pdf (accessed on 15 December 2022).
  62. Lubwama, M.; Yiga, V.A.; Ssempijja, I.; Lubwama, H.N. Thermal and mechanical characteristics of local firewood species and resulting charcoal produced by slow pyrolysis. Biomass Convers. Biorefinery 2021, 13, 6689–6704. [Google Scholar] [CrossRef]
  63. Tumutegyereize, P.; Mugenyi, R.; Ketlogetswe, C.; Gandure, J. A comparative performance analysis of carbonized briquettes and charcoal fuels in Kampala-urban, Uganda. Energy Sustain. Dev. 2016, 31, 91–96. [Google Scholar] [CrossRef]
  64. Clarke, W.P.; Radnidge, P.; Lai, T.E.; Jensen, P.D.; Hardin, M.T. Digestion of waste bananas to generate energy in Australia. Waste Manag. 2008, 28, 527–533. [Google Scholar] [CrossRef] [PubMed]
  65. Perera, K.K.C.K.; Rathnasiri, P.G.; Senarath, S.A.S.; Sugathapala, A.G.T.; Bhattacharya, S.C.; Abdul Salam, P. Assessment of sustainable energy potential of non-plantation biomass resources in Sri Lanka. Biomass Bioenergy 2005, 29, 199–213. [Google Scholar] [CrossRef]
  66. Mangoyana, R.B.; Smith, T.F. Decentralised bioenergy systems: A review of opportunities and threats. Energy Policy 2011, 39, 1286–1295. [Google Scholar] [CrossRef]
  67. Buchholz, T.; Da Silva, I.; Furtado, J. Power from wood gasifiers in Uganda: A 250 kW and 10 kW case study. Proc. Inst. Civ. Eng. Energy 2012, 165, 181–196. [Google Scholar] [CrossRef]
  68. EEP. Clean Energy Agro Hubs in Uganda—PAMOJA CLEANTECH. 2019. Available online: https://eepafrica.org/pamojacleantech-casestudy/ (accessed on 11 September 2022).
Figure 1. Biomass waste streams in the maize agri-food value chain.
Energies 17 00164 g001
Figure 2. Maize agri-food value chain waste: (A) maize stover (stalk and husk), (B) maize cobs, and (C) maize bran.
Energies 17 00164 g002
Figure 3. Biomass waste streams along the banana agri-food value chain.
Energies 17 00164 g003
Figure 4. Banana agri-food value chain waste: (A) rhizome, (B) leaves, (C) fibers, (D) fruit bunce stalk, (E) pseudo stem core, (F) rejected fingers, (G) peels, (H) rejected chips.
Energies 17 00164 g004
Figure 5. Waste streams along the sugarcane agri-food value chain. (Red arrows point to waste stream, while blue arrows point to desired product).
Energies 17 00164 g005
Figure 6. Sugarcane value chain waste: (A) tops, (B) bagasse, (C) mud, (D) molasses.
Energies 17 00164 g006
Table 1. Top crops in Uganda of proportions of total annual surface cultivated in 2019 [6].
CropTotal Surface (ha)% Share
Maize2,500,00017.34
Beans1,200,0008.32
Cassava941,0006.53
Banana579,0004.02
Coffee428,0002.97
Sugarcane81,3610.56
Rest of crops8,685,63960.25
Total14,415,000100.00
Table 2. Quantity of principal residues generated from each crop value chain.
Crop Value ChainAnnual Crop Production (‘000 MT)Residue TypeResidue to Product RatioQuantity of Residues (‘000 MT)
Maize5000.00 aCobs0.271350.0
Stover2.0010,000.0
Beans627.00 aTrash4.52821.5
Cassava6983.00 aStems and peels0.42793.2
Banana8326.00 aPseudo stems3.024,978.0
Leaves0.483996.5
Peels0.443663.4
Coffee465.00 aHusks1.0465.0
Rice255.00 aStraw0.45114.75
Husks0.2358.65
Sugarcane5778.19 bBagasse0.251444.55
Tops0.321849.02
Source: a implies [5], b implies FAOSTAT.
Table 3. Bulk density for different agri-food value chain biomass wastes.
BiomassBulk Density (Kg/m3)References
Maize cobs160This study
Maize stover120This study
Banana pseudo stems100This study
Banana leaves100This study
Banana peels100This study
Sugarcane tops120This study
Sugarcane bagasse65.6[31]
Table 5. Ultimate analysis for biomass feedstock for the main agri-food value chains in Uganda.
BiomassC (%)H (%)S (%)N (%)O (%)References
Maize cobs46.576.410.10.9646.06[45]
Maize stover34.96.221.060.5657.25[47]
Pseudo stems33.466.440.040.8049.94[17,21]
Banana leaves38.576.440.0032.4543.49[17,21]
Banana peels35.656.190.0021.9445.94[17,21]
Sugarcane tops44.516.140.160.6538.76[48]
Sugarcane bagasse47.95.63.40.242.9[49]
Table 6. Lower heating value (LHV) and higher heating value (HHV) for biomass waste of the main agri-food value chains in Uganda.
BiomassLHV (MJ/kg)HHV (MJ/Kg)References
Maize cobs12.617[13]
Maize stover16.7418.18[53]
Pseudo stems13.615.0[17]
Banana leaves16.217.6[17]
Banana peels14.816.2[17]
Sugarcane tops15.8-[13]
Sugarcane bagasse15.416–19.8[48]
Table 8. Theoretical energy potential of residues for the main agri-food value chains in Uganda.
CropAnnual Crop Production (‘000 MT) aType of ResidueResidue to Product Ratio bQuantity of Residues (‘000 MT)Water Mass Fraction (%) c,dLower Heating Value, LHV (MJ/kg)Energy Potential (PJ/year)
Maize3212Stover2642412.516.793.9
Cob0.27867.2414.312.69.4
Banana5500Pseudo stems3165008513.633.7
Leaves0.4826408516.26.4
Peels0.4424208514.85.4
Sugarcane5400Tops0.3217285015.813.7
Bagasse0.2513505015.410.4
a [5,6], b [13,17], c [13,64,65], d moisture content of the residues as received.
Disclaimer/Publisher’s Note: The statements, opinions and data contained in all publications are solely those of the individual author(s) and contributor(s) and not of MDPI and/or the editor(s). MDPI and/or the editor(s) disclaim responsibility for any injury to people or property resulting from any ideas, methods, instructions or products referred to in the content.