Abstract
In this study, the co-combustion of coal and biomass, and the tri-combustion of coal, biomass, and oil sludge in a 130 t h−1 circulating fluidized bed (CFB) boiler are investigated via the computational particle fluid dynamics (CPFD) approach. Furthermore, the effect of biomass feeding position is also comprehensively evaluated. The results show that for the co-combustion of coal and biomass, the O2 mole fraction at the furnace outlet rises from 0.0541 to 0.0640 as the biomass blending ratio enhances from 40% to 100%, while the CO2 mole fraction reduces from 0.1357 to 0.1267. The mole fraction of NOx and SO2 at the furnace outlet decreases from 4.5867 × 10⁻⁵ to 3.9096 × 10⁻⁵ and 2.8253 × 10⁻⁴ to 4.6635 × 10⁻⁵, respectively. For the tri-combustion of three fuels, the average NOx mole fraction initially grows quickly and then declines gradually, ranging from 4.1173 × 10⁻⁵ to 4.2556 × 10⁻⁵. The mole fraction of SO2 at the furnace outlet increases from 3.5176 × 10⁻⁴ to 4.7043 × 10⁻⁴ when the ratio of oil sludge rises from 10% to 20%. The uniformity of temperature and gas components distribution is “new inlet > secondary air inlet > feed inlet”. As for the three inlet positions, the mole fractions of NOx at the furnace outlet are between 3.9096 × 10⁻⁵ and 5.1537 × 10⁻⁵, while those for SO2 are between 2.5978 × 10⁻⁴ and 2.5278 × 10⁻⁴.
1. Introduction
The consumption of fossil energy continues to increase with the sustained economic growth and increased industrial demand [1,2]. The extensive utilization of fossil energy leads to problems such as environmental pollution and the greenhouse effect, which have become key issues that need to be solved urgently [3,4]. China is a large coal-consuming country. To reduce the impact of excessive coal utilization on the environment and alleviate the pressure brought on by the energy crisis, utilizing renewable energy to partially replace coal has become an important direction of current research [5]. Among the many renewable energy sources, biomass, as environmentally friendly, renewable, and widely sourced, has received widespread attention in recent years [6,7].
Currently, the predominant method of utilizing biomass is thermochemical conversion (including pyrolysis, gasification, and combustion), in which direct combustion accounts for 97% of the total biomass energy generation [8,9,10]. However, the direct combustion of biomass results in many problems such as ash deposition, slagging, and rusting, which could be effectively alleviated by the co-combustion of biomass and coal [11]. Many researchers [12,13,14] have carried out investigation on the co-combustion characteristics of coal and biomass. Yang et al. [13] discussed the combustion and NOx emission characteristics during the co-combustion of biomass and coal. The results showed that co-combustion coal with biomass could effectively reduce pollutant emissions, but it also caused a decrement in the temperature in the furnace. Zhou et al. [12] applied the double Euler method to conduct a numerical simulation on a circulating fluidized bed (CFB) boiler, and verified the accuracy of the selected model. According to numerous research findings [15,16], they found that the co-combustion of coal and biomass could reduce the emissions of gas phase pollutants like NOx from the fluidized bed. The existing research mainly focuses on power plant boilers. However, the effect of blending biomass on the combustion characteristics of CFB boiler remains to be further discussed.
In the production process of oil fields, it is inevitable to produce oil sludge, which consists of water, oil, and sediment, among other constituents [17]. Oil sludge is rich in petroleum hydrocarbons, which will cause serious pollution to the environment and even endanger human health. In addition, oilfield sludge has been identified as hazardous waste by most countries and must be disposed of [18]. Among various disposal technologies for oil sludge, incineration has received extensive attention because it could achieve harmless disposal and utilize the heat energy in sludge [19]. However, oil sludge has a high water content and is difficult to ignite. Therefore, oil sludge is usually blended with other fuels for incineration [18]. To fully utilize the oil sludge resource, some coal could be partially substituted by CFB boilers to co-dispose oil sludge. In addition, the cost of treating oil sludge could be avoided and the secondary pollution brought on by its disposal could be efficiently managed by the current flue gas treatment system. Oil sludge could be properly and effectively disposed of, and biomass resources might be fully utilized via the tri-combustion of coal, biomass, and oil sludge in a CFB boiler.
The Euler–Euler approach, as a continuum model for the interaction force of a fluid and a solid, was adopted in the majority of earlier investigations [20,21]. However, it is unable to account for movement process such as particle collisions and the impact of particle size distribution, which are fundamentally distinct from the process itself. As a way to solve this problem, the computational particle fluid dynamics (CPFD) method is gradually becoming the center of attention of researchers [22]. Compared with traditional computational fluid dynamics (CFD), the CPFD method could model particles with diverse particle size distributions as well as the background of a massive number of particles in the engineering industry, which provides an efficient technological method for simulating CFB boilers employed in industrial settings [23]. Recently, some researchers [24,25,26,27,28] have applied the CPFD method to conduct various numerical simulations. Their main focus was on the simulation of the reaction process in coal gasification, combustion process, and other related concerns. Unfortunately, few studies have been performed on numerical simulations of coal and biomass co-combustion using the CPFD method. In addition, to our knowledge, no research has employed the CPFD method to study the tri-combustion characteristics of coal, biomass, and oil sludge. Given that the CFB boiler is key equipment in the oil field production process, it faces tremendous pressure to reduce CO2 emissions and protect the environment. Furthermore, the traditional CFD method has great limitations in simulating the combustion characteristics in the CFB boiler. Therefore, the study on applying the CPFD method to simulate the combustion characteristics of blended fuels of coal, biomass, and oil sludge in CFB boilers is an urgent need.
To evaluate the combustion characteristics of blended fuels of coal, biomass, and oil sludge in a 130 t h−1 CFB boiler, the CPFD numerical simulation approach is employed in this work. The co-combustion of coal and biomass, tri-combustion of coal, biomass, and oil sludge, and the effect of biomass feeding position are explored in depth. This study could serve as guidance for the combustion of blended fuels of coal, biomass, and oil sludge in CFB boilers.
2. CPFD Methods
In this study, the combustion of blended fuels of coal, biomass, and oil sludge in a CFB boiler is simulated utilizing Barracuda 17.4, employing the CPFD approach, which applies the multiphase particle in-cell (MP-PIC) method to calculate the coupling of continuous fluid and high-density particles in three-dimensional space.
2.1. Mathematical Models
2.1.1. Governing Equations
The gas phase is processed via the Eulerian method. Based on the Navier–Stokes equation, the turbulence adopts the large eddy simulation (LES) method [29]. For the particle phase, the Lagrangian method is employed to describe it. During simulation calculations, the solid and the gas phases are coupled. The main governing equations are listed in Table 1 [30,31,32,33].

Table 1.
Main governing equations of gas and particle phase.
2.1.2. Chemical Reaction Models
To simplify the calculation, a one-step reaction kinetic equation is employed to describe the combustion process of volatile gases released from three fuels [34,35,36,37]. The combustion reaction models of relevant components are shown in Table 2. Furthermore, it is assumed that the coke consists solely of carbon, with no other elements present, and that the N and S in the fuels are completely volatilized. The composition and content of the coal volatiles are calculated based on the prediction model proposed by Maffei et al. [38]. Meanwhile, it is assumed that the composition and content of the oil sludge volatiles are consistent with those of coal. Additionally, the content of gaseous pollutants is determined through ultimate analysis. The composition and content of biomass volatiles are obtained from experimental data provided by Kong et al. [39,40,41].

Table 2.
Combustion reaction kinetic model.
2.1.3. NOx Models
According to previous studies [42,43], thermal NOx and fast NOx in CFB boilers could be ignored due to the furnace temperature typically being below 1000 °C, and the anoxic combustion occurs in the dense phase region. A suitably simplified NOx mechanism is adopted to describe NOx generation, assuming that all N and S in the coal and biomass are contained in volatiles. The relevant NOx models are listed in Table 3 [24,25,26,37].

Table 3.
NOx formation and reduction kinetic model.
2.2. Computational Geometry and Mesh
2.2.1. Boiler Structure and Geometry
The computational geometry for this study is a CFB boiler with a capacity of 130 t h−1. As depicted in Figure 1, the boiler system in investigation is engineered with a solitary drum structure, underpinned by a natural circulation mechanism. It incorporates an adiabatic cyclone for gas–solid separation to reduce heat loss. The convection heating surface is meticulously arrayed within the convection flue of shaft to optimize thermal exchange. Pertaining to its performance characteristics, the boiler is rated with a saturated steam pressure of 9.81 MPa and a saturated steam temperature is 310 °C. Moreover, it operates with a thermal efficiency that exceeds 90%. The symmetrical half of the boiler is applied as the computing domain to simplify and speed up the calculations.
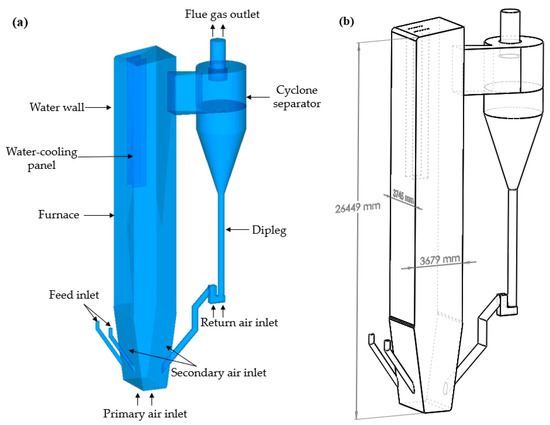
Figure 1.
Geometric model of CFB boiler (a) Boundary conditions (b) Dimensions.
2.2.2. Meshing and Validation
In this study, the Cartesian meshing technique is applied to generate a high-quality grid. To reduce the difficulty of grid generation and computational cost, the complex structures are appropriately simplified. To capture the fine structure, the mesh of the fine structure is refined. Figure 2 illustrates the meshing.
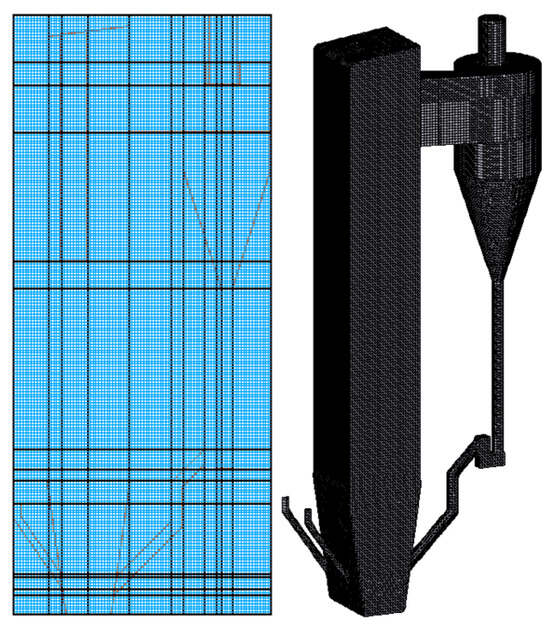
Figure 2.
Computational grid.
To confirm the effect of the grid on the calculation results, the average temperatures of the cross-section of height direction alone the furnace are compared under the 491,000, 689,000, and 885,000 grids in this study. As shown in Figure 3, the results indicate that the average temperature varies significantly when 491,000 grids are employed. The cross-section average temperature tends to remain stable as the grids number rises from 689,000 to 885,000, demonstrating that the computation accuracy is comparable. Therefore, 689,000 grids are chosen for ensuring simulation accuracy and simultaneously minimizing computational expense and time.
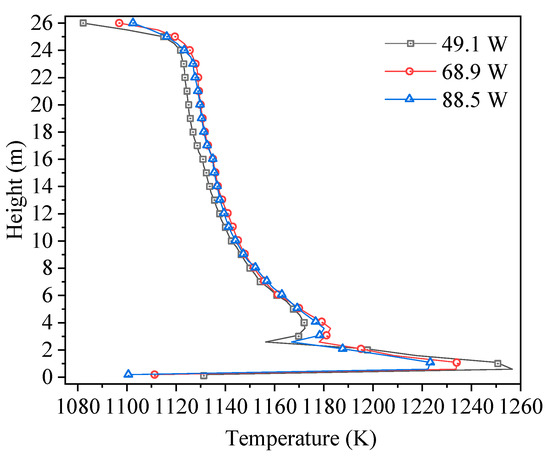
Figure 3.
Average temperature distribution versus the furnace height for various meshes.
2.2.3. Model Validation
To verify the accuracy of the model, the simulation results are compared with the measured data. As shown in Table 4, the numerical simulation results are in good agreement with the measured data. The relative errors of bed temperature, bed pressure, and furnace outlet flue gas temperature are of less than 1.13%, 2.69%, and 0.84%, respectively. Therefore, the simulation results could be considered credible.

Table 4.
Comparison of simulation results with measured data.
2.3. Materials Property and Simulation Conditions
2.3.1. Fuels and Bed Material
In this study, coal, biomass, and oil sludge are selected for analysis (collected from Karamay, Xinjiang Province, China). These three fuels have low calorific values of 19.28, 16.12, and 7.99 MJ/kg, respectively. The results of the ultimate and proximate analyses of the three fuels are shown in Table 5.

Table 5.
Ultimate and proximate analyses of coal, biomass, and oil sludge (wt %, as received basis).
The main components of the bed material are sand and ash. The bed material is viewed in the simulation as a single, inert entity. The maximum particle size of bed material should not be more than 3 mm, and the mass proportion of less than 100 mm should not be more than 25%. The biomass particle size complies with the following standards: less than 5 mm in diameter, less than 10 mm in cross-sectional dimension, and less than 30 mm in length. Less than 5% of them have a mass percentage of less than 10 mm in diameter and length. The particle size distribution of coal/oil sludge is shown in Figure 4.
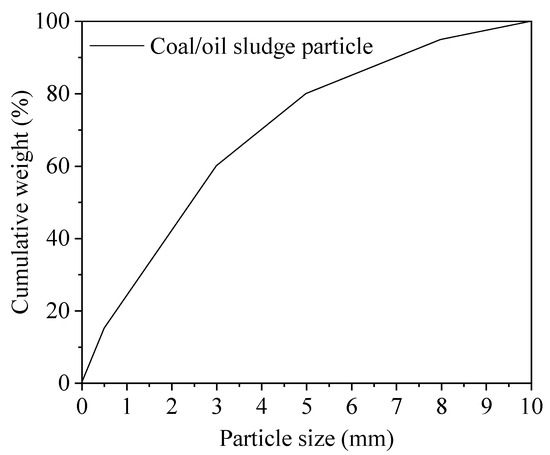
Figure 4.
Particle size distribution of coal/oil sludge.
2.3.2. Simulation Conditions
Before the simulation, the state of fluid state and its particle makeup are specified in the computational domain. The flow of gas is parallel to the surface. Based on industry data, the gas parameters are additionally provided. A specific number is chosen for the boundary pressure at the top outflow of cyclone. The thermal wall is employed to characterize the remaining constraints. The surface of the cyclone separator and the conical portion of the furnace bottom are believed to be adiabatic walls. There is a radiative emissivity of 0.7 for the wall. The simulation lasts 30 s with the standard scenario of using coal as fuel. Table 6 provides a summary of the main simulation parameters and base case operational circumstances.

Table 6.
Operating conditions and simulation settings.
3. Results and Discussion
3.1. Co-Combustion of Coal and Biomass
To investigate the effect of blending ratio on co-combustion characteristics of coal and biomass. The blending ratios of biomass are selected as 40%, 50%, 60%, 80%, and 100%, respectively. To ensure constant boiler output, the total amount of fuel is calculated based on the weighted average low calorific value of the mixed fuel. The air amount calculation process is as follows: Firstly, the theoretical air amount is calculated according to the ultimate analysis of the three fuels. Then, according to the field operation data, the excess air coefficient is selected to be 1.28, so that the actual air amount could be calculated. Finally, according to the air amount ratio in the actual operation process, the air amount of primary air, secondary air and return air is obtained. Table 7 lists the simulation parameters for different cases.

Table 7.
Simulation parameters for different cases.
3.1.1. Flow Characteristics
Taking case 2 as an example, Figure 5 illustrates the variation in flow pattern with time from 0 to 30 s. Within 0–10 s, the particles gradually fluidize, and the bed rises, with some particles entering the cyclone separator to participate in circulation. After 18 s, the flow pattern of the particles gradually stabilizes, which is similar to the results of Shen et al. [36]. To reduce the impact of particle migration on the results, 20–30 s are selected for time average statistical analysis.
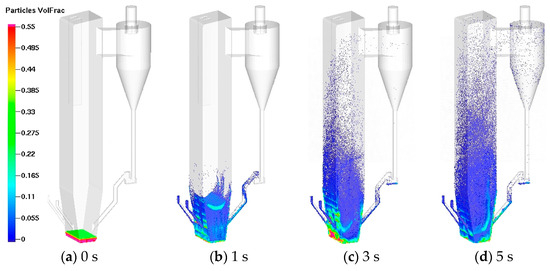
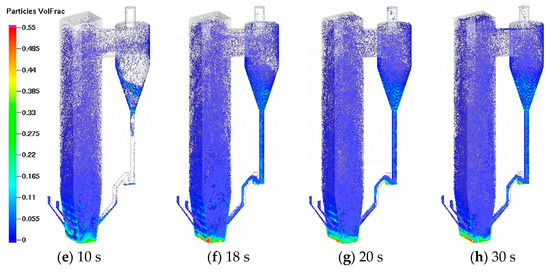
Figure 5.
Variation in flow pattern with time.
3.1.2. Combustion Characteristics
The distribution of the average temperature of the furnace in various cases is shown in Figure 6. It can be seen from the figure that the furnace temperature distribution is basically the same under different biomass blending ratios. Because of the combustion of fuel and the circulation of a large amount of high-temperature materials from the cyclone separator, the furnace temperature rises sharply. The furnace temperature achieves its maximum at approximately 0.5 m from the bottom. The introduction of a large amount of low-temperature air at the secondary air inlet reduces the furnace temperature. The water-cooled walls arranged along the height of the furnace absorb a large amount of heat, causing the temperature of the furnace to gradually drop. As the biomass blending ratio increases, the furnace temperature gradually decreases, which may be related to the lower calorific value of the material and the larger particle size. The furnace outlet flue temperature decreases from 1122.2 to 1114.2 K as the biomass blending ratio goes from 40% to 100%.
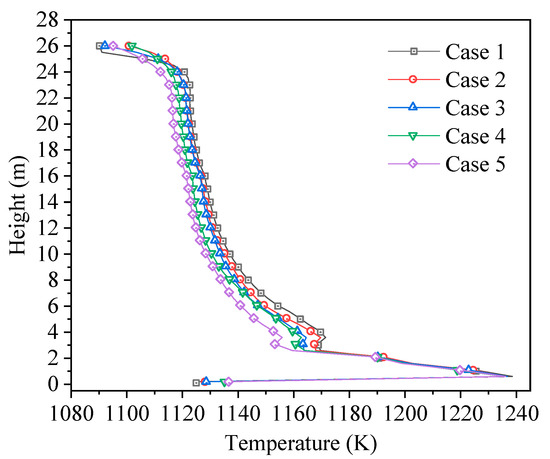
Figure 6.
Average temperature distribution along furnace height for various cases.
3.1.3. Gas Emission
Figure 7 shows the gas component distribution along the height direction of the furnace under different cases. It can be seen from the figure that the average mole fraction of O2 first decreases rapidly along the height direction of the furnace, indicating that the fuel particles burn rapidly, increase at the secondary air inlet, and then gradually decrease overall. Table 8 illustrates the temperature and main gas mole fractions of furnace outlet under cases 1 to 5. An upward adjustment of the biomass blending ratio from 40% to 100% correlates with a rise in the mole fraction of O2 at the furnace outlet, ascending from 0.0541 to 0.0640. Concurrently, there is an observed decrement in the mole fraction of CO2, which diminishes from 0.1357 to 0.1267. Upon introduction of the heterogeneous fuel into the furnace, an intense combustion reaction is initiated, precipitating a localized deficit of O2 and, consequently, the incomplete oxidation of a fraction of the fuel. The NOx distribution changes along the furnace height direction in different cases are almost the same, increasing rapidly at first and then gradually decreasing. N-containing volatiles release a large amount of NOx through violent combustion; so, the NOx mole fraction increases rapidly. Subsequently, NOx is reduced to N2 by coke and CO, and the mole fraction gradually decreases. As the biomass blending ratio increases from 40% to 100%, the NOx mole fraction at the furnace outlet decreases from 4.5867 × 10⁻⁵ to 3.9096 × 10⁻⁵. The SO2 mole fraction drops from 2.8253 × 10⁻⁴ to 4.6635 × 10⁻⁵, which corresponds to the ultimate analysis results of coal and biomass (see Table 5).
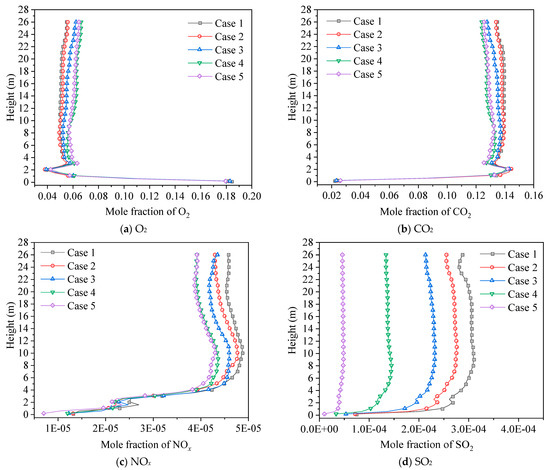
Figure 7.
Gas mole fractions distribution along furnace height for various cases.

Table 8.
Temperature and main gas mole fractions of furnace outlet under cases 1 to 5.
3.2. Tri-Combustion of Coal, Biomass, and Oil Sludge
Five distinct blending ratios are selected to examine the tri-combustion characteristics of coal, biomass, and oil sludge. As mentioned before, the total fuel feeding amount is determined by the low calorific value of the three fuels. The excess air coefficient is 1.28. The simulation parameters for several cases are listed in Table 9.

Table 9.
Simulation parameters for various cases.
3.2.1. Furnace Temperature Distributions
The distribution of the average temperature of the furnace section along the furnace height direction under various cases is shown in Figure 8. Similar to the co-combustion of coal and biomass, the furnace temperature change trends in different calculation examples are essentially the same. The furnace temperature initially increases rapidly, decreases at the secondary air inlet, then increases slightly, and finally decreases gradually along the height direction of the furnace. The increase in the blending ratio of sludge and biomass reduces the average temperature of the furnace. The furnace outlet flue gas temperature ranges from 1117.9 to 1120.4 K under different cases.
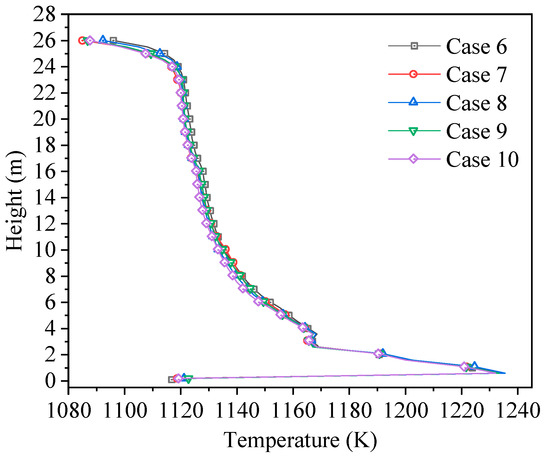
Figure 8.
Average temperature distribution along furnace height under different excess air ratios.
3.2.2. Gas Emission
The distribution of the average mole fraction of gas components along the furnace height direction for different cases is illustrated in Figure 9. It is obvious that the average mole fraction of O2 decreases rapidly initially, increases at the secondary air inlet, and then decreases slowly, which indicates that the fuel particles combust rapidly at the bottom of the furnace. Table 10 shows the temperature and main gas mole fractions of furnace outlet under cases 6 to 10. An augmented biomass proportion is associated with a diminished requisite for O2. As the biomass blending ratio is escalated from 35% to 50%, there is a discernible increment in the molar fraction of O2 at the furnace outlet, which intensifies from 0.0606 to 0.0667. The average mole fraction of CO2 shows an opposite trend to that of O2. When the blended fuel enters the dense phase zone, it burns violently, resulting in a local lack of oxygen and incomplete combustion of part of the fuel. Therefore, optimization of the secondary air could be considered to ensure complete combustion of the blended fuels.
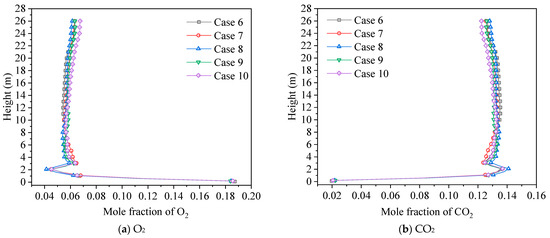
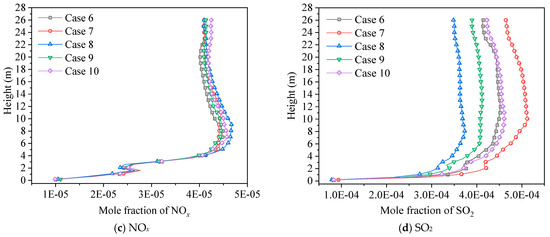
Figure 9.
Gas mole fractions distribution along furnace height for various excess air ratios.

Table 10.
Temperature and main gas mole fractions of furnace outlet under cases 6 to 10.
The changes in the average mole fraction of NOx along the furnace height direction are almost the same in different cases, with an initial rapid increase and then a gradual decrease. The violent combustion of volatiles releases a large amount of NOx, causing its mole fraction to increase rapidly. Subsequently, NOx is reduced to N2 by coke and CO. The NOx mole fraction at the furnace outlet is between 4.1173 × 10⁻⁵ and 4.2556 × 10⁻⁵. The distribution of SO2 along the furnace height is tightly related to the blending ratio of different fuels. In general, the rise in the coal and oil sludge blending ratio promotes the increase in the average mole fraction of SO2, which corresponds to the ultimate analysis results (see Table 3). It is worth noting that when the oil sludge ratio increases from 10% to 20%, the SO2 mole fraction at the furnace outlet increases from 3.3041 × 10⁻⁴ to 4.7043 × 10⁻⁴. Therefore, attention should be paid to the removal of SO2 when blending oil sludge.
3.3. Effect of Biomass Inlet Position
To study the effect of biomass inlet position on combustion characteristics, in addition to feeding biomass from the feed inlet, two other biomass inlet positions are selected, namely the secondary air inlet and the new inlet (1 m above the secondary air inlet).
3.3.1. Furnace Temperature Distributions
Figure 10 shows the gas phase temperature distribution of the entire CFB boiler under different biomass inlet positions. It can be seen from the figure that the overall temperature trend in the furnace is similar under different inlet positions. Compared with feeding biomass fuel through the feed inlet and secondary air inlet, the temperature distribution of the biomass furnace fed from the new inlet is more uniform, which indicates that feeding biomass from the new inlet is beneficial to promoting the combustion of the blended fuel.
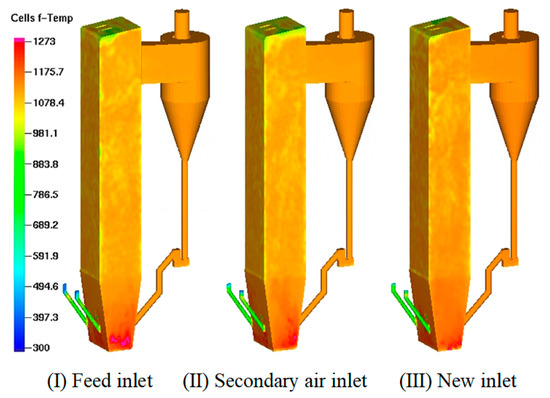
Figure 10.
Temperature distribution for different biomass inlet positions.
3.3.2. Gas Emission
Figure 11 shows the distribution of different gas components in the CFB boiler under different biomass inlet positions. It can be seen from the figure that since the total air amount remains unchanged, the distribution of O2 and CO2 in the furnace is almost the same under different biomass inlet positions. The uniformity of O2 and CO2 distribution under the three biomass inlet positions is that the new inlet has the best uniformity, followed by the secondary air inlet and the feed inlet has the worst. This phenomenon corresponds to the distribution of the temperature field (see Figure 10). Upon the introduction of biomass particulates via the feed inlet, secondary air inlet, and new inlet, the mole fractions of NOx at the furnace outlet are 3.9096 × 10⁻⁵, 4.1022 × 10⁻⁵, and 5.1537 × 10⁻⁵, respectively, while the mole fractions of SO2 are 2.5978 × 10⁻⁴, 2.5738 × 10⁻⁴, and 2.5278 × 10⁻⁴, respectively. As the reaction proceeds, the formation of NOx is limited by the increase in CO content. The increase in coke particles is also conducive to the reduction of NOx, and the content of NOx is in a dynamic fluctuation. The mole fraction of NOx at the furnace outlet increases after the biomass is fed through the new inlet, which may be related to the shortening of the reaction range in the reduction zone. Since the total amount of fuel input and air volume remain unchanged, the concentration of SO2 changes slightly.
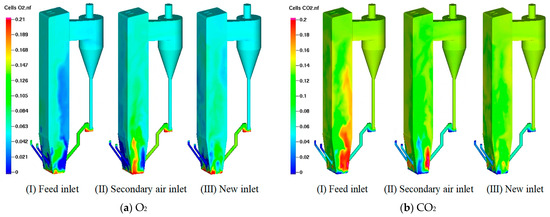
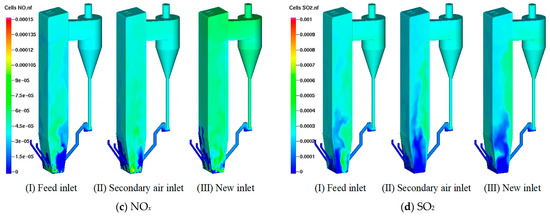
Figure 11.
Gas mole fractions distribution for different biomass inlet positions.
4. Conclusions
In this study, the CPFD method is employed to examine the combustion characteristics of coal, biomass, and oil sludge in a 130 t h−1 CFB boiler. The co-combustion of coal and biomass, tri-combustion of coal, biomass, and oil sludge, and the effect of biomass inlet position are evaluated. The conclusions that can be reached are as follows:
- (1)
- After 18 s of simulation, the flow of particles reaches a quasi-steady state. As the water wall continues to absorb heat, the temperature gradually decreases along the height of the furnace. When the biomass blending ratio rises from 40% to 100%, the O2 mole fraction at the furnace outlet increases from 0.0541 to 0.0640, while the CO2 mole fraction decreases from 0.1357 to 0.1267. The average NOx mole fraction in the furnace height direction changes similarly, growing rapidly at first and then gradually decreasing, which could be related to the reduction of NOx to N2. As the biomass blending ratio increases from 40% to 100%, the NOx mole fraction at the furnace outlet decreases from 4.5867 × 10⁻⁵ to 3.9096 × 10⁻⁵. The SO2 mole fraction drops from 2.8253 × 10⁻⁴ to 4.6635 × 10⁻⁵.
- (2)
- The change trend of furnace temperature is essentially constant in different cases. When the biomass blending ratio increases from 35% to 50%, the O2 mole fraction at the furnace outlet increases from 0.0606 to 0.0667. CO2 shows the opposite distribution pattern. The NOx mole fraction initially increases rapidly and then gradually decreases, with a range from 4.1173 × 10⁻⁵ to 4.2556 × 10⁻⁵ at the furnace outlet. The distribution of SO2 along the furnace height is tightly related to the blending ratio of different fuels. As the oil sludge blending ratio rises from 10% to 20%, the mole fraction of SO2 at the furnace outlet increases from 3.5176 × 10⁻⁴ to 4.7043 × 10⁻⁴.
- (3)
- Compared with feeding biomass fuel through the feed inlet and secondary air inlet, the temperature distribution of the biomass furnace fed from the new inlet is more uniform. The uniformity of O2 and CO2 distribution is that the new inlet has the best uniformity, followed by the secondary air inlet and the feed inlet is the worst. When biomass particles are fed from the feed inlet, secondary air inlet, and new inlet, the mole fractions of NOx at the furnace outlet are 3.9096 × 10⁻⁵, 4.1022 × 10⁻⁵, and 5.1537 × 10⁻⁵, respectively, while the mole fractions of SO2 are 2.5978 × 10⁻⁴, 2.5738 × 10⁻⁴, and 2.5278 × 10⁻⁴, respectively.
Author Contributions
Conceptualization, X.C., L.X., Y.D. and L.D.; methodology, F.H., Y.D. and L.D.; software, X.H.; validation, Y.Z. and C.D.; investigation, Y.W.; resources, M.M.; data curation, Y.W. and X.H.; writing—original draft preparation, Y.W. and X.H.; writing—review and editing, X.C., L.X., M.M., F.H., Y.Z., C.D., Y.D. and L.D.; supervision, Y.D. and L.D. All authors have read and agreed to the published version of the manuscript.
Funding
This research was funded by the Research on [key technologies of comprehensive development and utilization of renewable energy] under grant number [210099986021001001].
Data Availability Statement
The data that support the findings of this study are available from the corresponding author upon reasonable request.
Acknowledgments
This work acknowledges financial support from the Research on key technologies of comprehensive development and utilization of renewable energy. The authors also thank the staff at the Instrument Analysis Center of Xi’an Jiaotong University for their assistance with sample analysis.
Conflicts of Interest
Authors Yang Wang, Xiangyu Chen, Liping Xu, Mingwei Ma, Feng Han, Yong Zhou and Chen Du were employed by PetroChina Xinjiang Oilfield Company. The remaining authors declare that the research was conducted in the absence of any commercial or financial relationships that could be construed as a potential conflict of interest.
Nomenclature
| Function of the Reynolds number | Interpolation function | ||
| Turbulent mass diffusion | t | Time | |
| Momentum transfer coefficient | Gas phase velocity | ||
| Particle fractional force | Grid cell volume | ||
| F | Momentum exchange rate | vp | Particle velocity |
| hf | Enthalpy of the gas phase | xp | Particle spatial position |
| mp | Particle mass | Mass fraction | |
| Nu | Nusselt number | Gas phase volume fraction | |
| Np | Total number of particles | Gas phase density | |
| Number of real particles | ρp | Particle density | |
| P | Gas phase pressure | Length scale along the x, y, and z directions | |
| Qradi | Radiation heat transfer | Heat of reaction of the gas phase | |
| Qpf | Convective heat transfer | Collision damping time | |
| Qreact | Chemical reaction heat | Stress tensor of the gas phase | |
| Enthalpy diffusion term | τp | Particle normal stress | |
| q | Heat flux | Shear viscosity | |
| Heat transfer rate | Turbulent viscosity |
References
- Jia, W.; Jia, X.; Wu, L.; Guo, Y.; Yang, T.; Wang, E.; Xiao, P. Research on regional differences of the impact of clean energy development on carbon dioxide emission and economic growth. Humanit. Soc. Sci. Commun. 2022, 9, 25. [Google Scholar] [CrossRef]
- Gu, C.; Ye, X.; Cao, Q.; Guan, W.; Peng, C.; Wu, Y.; Zhai, W. System dynamics modelling of urbanization under energy constraints in China. Sci. Rep. 2020, 10, 9956. [Google Scholar] [CrossRef] [PubMed]
- Zou, C.; Ma, F.; Pan, S.; Lin, M.; Zhang, G.; Xiong, B.; Wang, Y.; Liang, Y.; Yang, Z. Earth energy evolution, human development and carbon neutral strategy. Pet. Explor. Dev. 2022, 49, 468–488. [Google Scholar] [CrossRef]
- Zhang, C.; Wang, F.; Wei, H.; Zhang, D.; Miu, C.; Pi, Q.; Luo, R.; Gu, Q. The Integrated Development Practices of Oil, Gas and New Energy in Tarim Oilfield Company toward Carbon Peaking and Carbon Neutrality Goals. Xinjiang Oil Gas 2022, 18, 16–20. [Google Scholar]
- Owusu, P.A.; Asumadu-Sarkodie, S.; Dubey, S. A review of renewable energy sources, sustainability issues and climate change mitigation. Cogent Eng. 2016, 3, 1167990. [Google Scholar] [CrossRef]
- Jana, K.; De, S. Biomass integrated gasification combined cogeneration with or without CO2 capture—A comparative thermodynamic study. Renew. Energy 2014, 72, 243–252. [Google Scholar] [CrossRef]
- Ahmad, A.A.; Zawawi, N.A.; Kasim, F.H.; Inayat, A.; Khasri, A. Assessing the gasification performance of biomass: A review on biomass gasification process conditions, optimization and economic evaluation. Renew. Sustain. Energy Rev. 2016, 53, 1333–1347. [Google Scholar] [CrossRef]
- Demirbas, A. Potential applications of renewable energy sources, biomass combustion problems in boiler power systems and combustion related environmental issues. Prog. Energy Combust. Sci. 2005, 31, 171–192. [Google Scholar] [CrossRef]
- Chen, W.-H.; Lin, B.-J.; Lin, Y.-Y.; Chu, Y.-S.; Ubando, A.T.; Show, P.L.; Ong, H.C.; Chang, J.-S.; Ho, S.-H.; Culaba, A.B.; et al. Progress in biomass torrefaction: Principles, applications and challenges. Prog. Energy Combust. Sci. 2021, 82, 100887. [Google Scholar] [CrossRef]
- Bridgwater, A.V.; Toft, A.J.; Brammer, J.G. A techno-economic comparison of power production by biomass fast pyrolysis with gasification and combustion. Renew. Sustain. Energy Rev. 2002, 6, 181–246. [Google Scholar] [CrossRef]
- Zheng, Y.; Jensen, P.A.; Jensen, A.D.; Sander, B.; Junker, H. Ash transformation during co-firing coal and straw. Fuel 2007, 86, 1008–1020. [Google Scholar] [CrossRef]
- Zhou, W.; Zhao, C.; Duan, L.; Chen, X.; Liu, D. A simulation study of coal combustion under O2/CO2 and O2/RFG atmospheres in circulating fluidized bed. Chem. Eng. J. 2013, 223, 816–823. [Google Scholar] [CrossRef]
- Yang, X.; Luo, Z.; Liu, X.; Yu, C.; Li, Y.a.; Ma, Y. Experimental and numerical investigation of the combustion characteristics and NO emission behaviour during the co-combustion of biomass and coal. Fuel 2021, 287, 119383. [Google Scholar] [CrossRef]
- Karampinis, E.; Nikolopoulos, N.; Nikolopoulos, A.; Grammelis, P.; Kakaras, E. Numerical investigation Greek lignite/cardoon co-firing in a tangentially fired furnace. Appl. Energy 2012, 97, 514–524. [Google Scholar] [CrossRef]
- Guo, F.; Zhong, Z. Co-combustion of anthracite coal and wood pellets: Thermodynamic analysis, combustion efficiency, pollutant emissions and ash slagging. Environ. Pollut. 2018, 239, 21–29. [Google Scholar] [CrossRef] [PubMed]
- Varol, M.; Symonds, R.; Anthony, E.J.; Lu, D.; Jia, L.; Tan, Y. Emissions from co-firing lignite and biomass in an oxy-fired CFBC. Fuel Process. Technol. 2018, 173, 126–133. [Google Scholar] [CrossRef]
- Mazlova, E.A.; Meshcheryakov, S.V. Ecological characteristics of oil sludges. Chem. Technol. Fuels Oils 1999, 35, 49–53. [Google Scholar] [CrossRef]
- Zhao, C.; Li, Y.; Gan, Z.; Nie, M. Method of smoldering combustion for refinery oil sludge treatment. J. Hazard. Mater. 2021, 409, 124995. [Google Scholar] [CrossRef]
- Liu, J.; Jiang, X.; Zhou, L.; Wang, H.; Han, X. Co-firing of oil sludge with coal–water slurry in an industrial internal circulating fluidized bed boiler. J. Hazard. Mater. 2009, 167, 817–823. [Google Scholar] [CrossRef]
- Milićević, A.; Belošević, S.; Crnomarković, N.; Tomanović, I.; Stojanović, A.; Tucaković, D.; Lei, D.; Che, D. Numerical study of co-firing lignite and agricultural biomass in utility boiler under variable operation conditions. Int. J. Heat Mass Transf. 2021, 181, 121728. [Google Scholar] [CrossRef]
- Smith, J.D.; Suo-Antilla, A.; Sreedharan, V. Transient LES based CFD modeling of coal-biomass co-firing combustion. Fuel Process. Technol. 2019, 193, 187–196. [Google Scholar] [CrossRef]
- Loha, C.; Chattopadhyay, H.; Chatterjee, P.K. Three dimensional kinetic modeling of fluidized bed biomass gasification. Chem. Eng. Sci. 2014, 109, 53–64. [Google Scholar] [CrossRef]
- Abbasi, A.; Ege, P.E.; de Lasa, H.I. CPFD simulation of a fast fluidized bed steam coal gasifier feeding section. Chem. Eng. Sci. 2011, 174, 341–350. [Google Scholar] [CrossRef]
- Chang, J.; Ma, X.; Wang, X.; Li, X. CPFD modeling of hydrodynamics, combustion and NOx emissions in an industrial CFB boiler. Particuology 2023, 81, 174–188. [Google Scholar] [CrossRef]
- Chen, X.; Ma, J.; Tian, X.; Wan, J.; Zhao, H. CPFD simulation and optimization of a 50 kWth dual circulating fluidized bed reactor for chemical looping combustion of coal. Int. J. Greenh. Gas Control 2019, 90, 102800. [Google Scholar] [CrossRef]
- Liu, H.; Sun, H.; Bi, Y.; Jia, C.; Zhang, L.; Li, Y.; Qin, H.; Wang, Q. Effect of secondary air on NO emission in a 440 t/h circulating fluidized bed boiler based on CPFD method. Particuology 2023, 83, 18–31. [Google Scholar] [CrossRef]
- Ding, H.; Ouyang, Z.; Su, K.; Zhang, J. Investigation of gas-solid flow characteristics in a novel internal fluidized bed combustor by experiment and CPFD simulation. Adv. Powder Technol. 2023, 34, 103962. [Google Scholar] [CrossRef]
- Yan, J.; Lu, X.; Xue, R.; Lu, J.; Zheng, Y.; Zhang, Y.; Liu, Z. Validation and application of CPFD model in simulating gas-solid flow and combustion of a supercritical CFB boiler with improved inlet boundary conditions. Fuel Process. Technol. 2020, 208, 106512. [Google Scholar] [CrossRef]
- Yang, S.; Fan, F.; Wei, Y.; Hu, J.; Wang, H.; Wu, S. Three-dimensional MP-PIC simulation of the steam gasification of biomass in a spouted bed gasifier. Energy Convers. Manag. 2020, 210, 112689. [Google Scholar] [CrossRef]
- Snider, D.M.; Clark, S.M.; O’Rourke, P.J. Eulerian–Lagrangian method for three-dimensional thermal reacting flow with application to coal gasifiers. Chem. Eng. Sci. 2011, 66, 1285–1295. [Google Scholar] [CrossRef]
- Yang, S.; Zhou, T.; Wei, Y.; Hu, J.; Wang, H. Influence of size-induced segregation on the biomass gasification in bubbling fluidized bed with continuous lognormal particle size distribution. Energy Convers. Manag. 2019, 198, 111848. [Google Scholar] [CrossRef]
- Harris, S.E.; Crighton, D.G. Solitons, solitary waves, and voidage disturbances in gas-fluidized beds. J. Fluid Mech. 2006, 266, 243–276. [Google Scholar] [CrossRef]
- Chang, J.; Ma, X.; Wang, X.; Li, X. Computational particle fluid dynamics modeling and design of in-situ catalytic deNOx in an industrial CFB boiler. Chem. Eng. Sci. 2023, 270, 118502. [Google Scholar] [CrossRef]
- Xu, L.; Cheng, L.; Ji, J.; Wang, Q.; Fang, M. A comprehensive CFD combustion model for supercritical CFB boilers. Particuology 2019, 43, 29–37. [Google Scholar] [CrossRef]
- Snider, D.M. An Incompressible Three-Dimensional Multiphase Particle-in-Cell Model for Dense Particle Flows. J. Comput. Phys. 2001, 170, 523–549. [Google Scholar] [CrossRef]
- Shen, X.; Li, J.; Jia, L.; Wang, Y.; Guo, B.; Qiao, X.; Yang, H.; Zhang, M.; Jin, Y. Numerical simulation of NO and SO2 emission dynamic characteristics during thermal start-up of CFB boiler. Part. Sci. Technol. 2022, 41, 53–63. [Google Scholar] [CrossRef]
- Ji, J.; Cheng, L.; Wei, Y.; Wang, J.; Gao, X.; Fang, M.; Wang, Q. Predictions of NOx/N2O emissions from an ultra-supercritical CFB boiler using a 2-D comprehensive CFD combustion model. Particuology 2020, 49, 77–87. [Google Scholar] [CrossRef]
- Maffei, T.; Frassoldati, A.; Cuoci, A.; Ranzi, E.; Faravelli, T. Predictive one step kinetic model of coal pyrolysis for CFD applications. Proc. Combust. Inst. 2013, 34, 2401–2410. [Google Scholar] [CrossRef]
- Syamlal, M.; Bissett, L.A. METC Gasifier Advanced Simulation (MGAS) Model; U.S. Department of Energy: Washington, DC, USA, 1992. [Google Scholar] [CrossRef]
- Wu, Y.; Liu, D.; Ma, J.; Chen, X. Three-Dimensional Eulerian–Eulerian Simulation of Coal Combustion under Air Atmosphere in a Circulating Fluidized Bed Combustor. Energy Fuels 2017, 31, 7952–7966. [Google Scholar] [CrossRef]
- Kong, D.; Wang, S.; Luo, K.; Hu, C.; Li, D.; Fan, J. Three-dimensional simulation of biomass gasification in a full-loop pilot-scale dual fluidized bed with complex geometric structure. Renew. Energy 2020, 157, 466–481. [Google Scholar] [CrossRef]
- Xie, J.; Zhong, W.; Jin, B.; Shao, Y.; Liu, H. Three-Dimensional Eulerian–Eulerian Modeling of Gaseous Pollutant Emissions from Circulating Fluidized-Bed Combustors. Energy Fuels 2014, 28, 5523–5533. [Google Scholar] [CrossRef]
- Zhou, W.; Zhao, C.S.; Duan, L.B.; Chen, X.P.; Liang, C. Two-dimensional computational fluid dynamics simulation of nitrogen and sulfur oxides emissions in a circulating fluidized bed combustor. Chem. Eng. J. 2011, 173, 564–573. [Google Scholar] [CrossRef]
Disclaimer/Publisher’s Note: The statements, opinions and data contained in all publications are solely those of the individual author(s) and contributor(s) and not of MDPI and/or the editor(s). MDPI and/or the editor(s) disclaim responsibility for any injury to people or property resulting from any ideas, methods, instructions or products referred to in the content. |
© 2023 by the authors. Licensee MDPI, Basel, Switzerland. This article is an open access article distributed under the terms and conditions of the Creative Commons Attribution (CC BY) license (https://creativecommons.org/licenses/by/4.0/).