The Significance of Considering Battery Service-Lifetime for Correctly Sizing Hybrid PV–Diesel Energy Systems


Abstract
:1. Introduction
1.1. Backgrond
1.2. Literature Survey
1.3. Research Contributions
1.4. Paper Outline
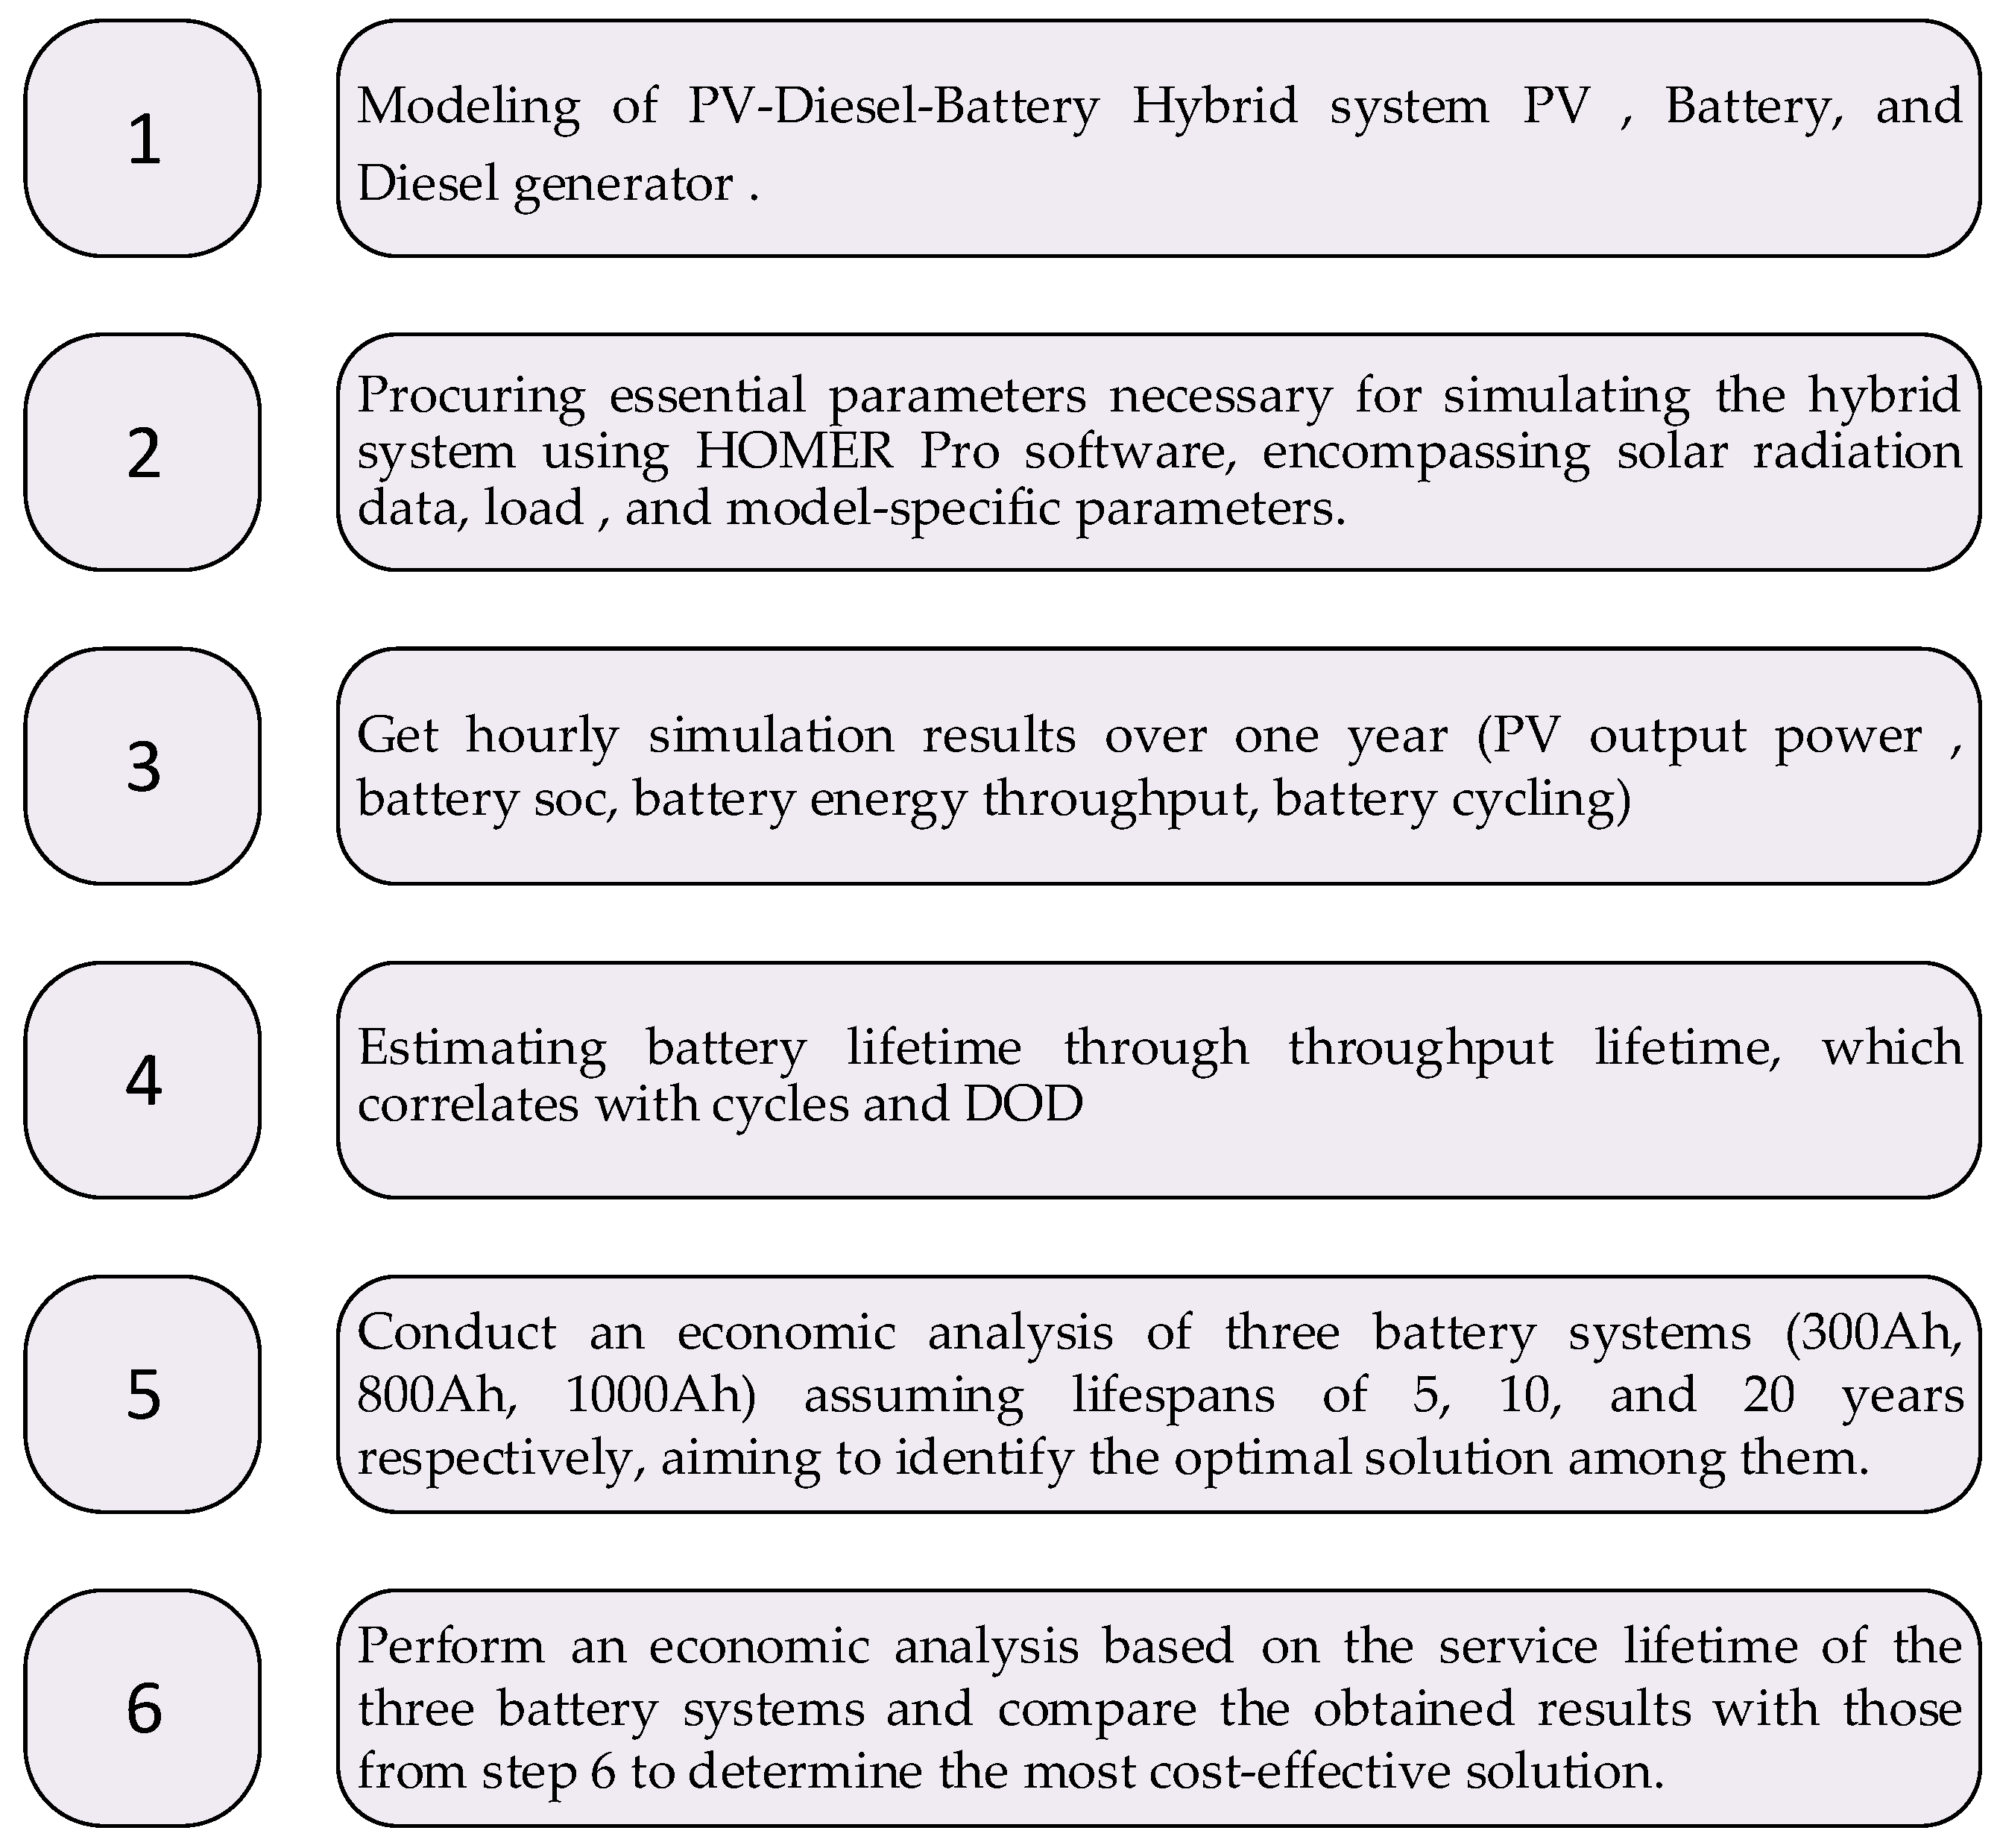
2. Methodology
3. Mathematical Modeling of System Components
3.1. PV Output Power Estimation
3.2. Diesel Generator Output Power
3.3. Battery System Models
4. Economic Factors and Lifetime Components
4.1. PV Panel Cost and Lifetime
4.2. Diesel Generator Costs and Lifetime
4.3. Battery System Cost and Lifetime
4.4. Economic Factors
4.4.1. Net Present Cost
4.4.2. Annual Cost
4.4.3. Cost of Energy
5. Case Study
5.1. Daily Load Curve
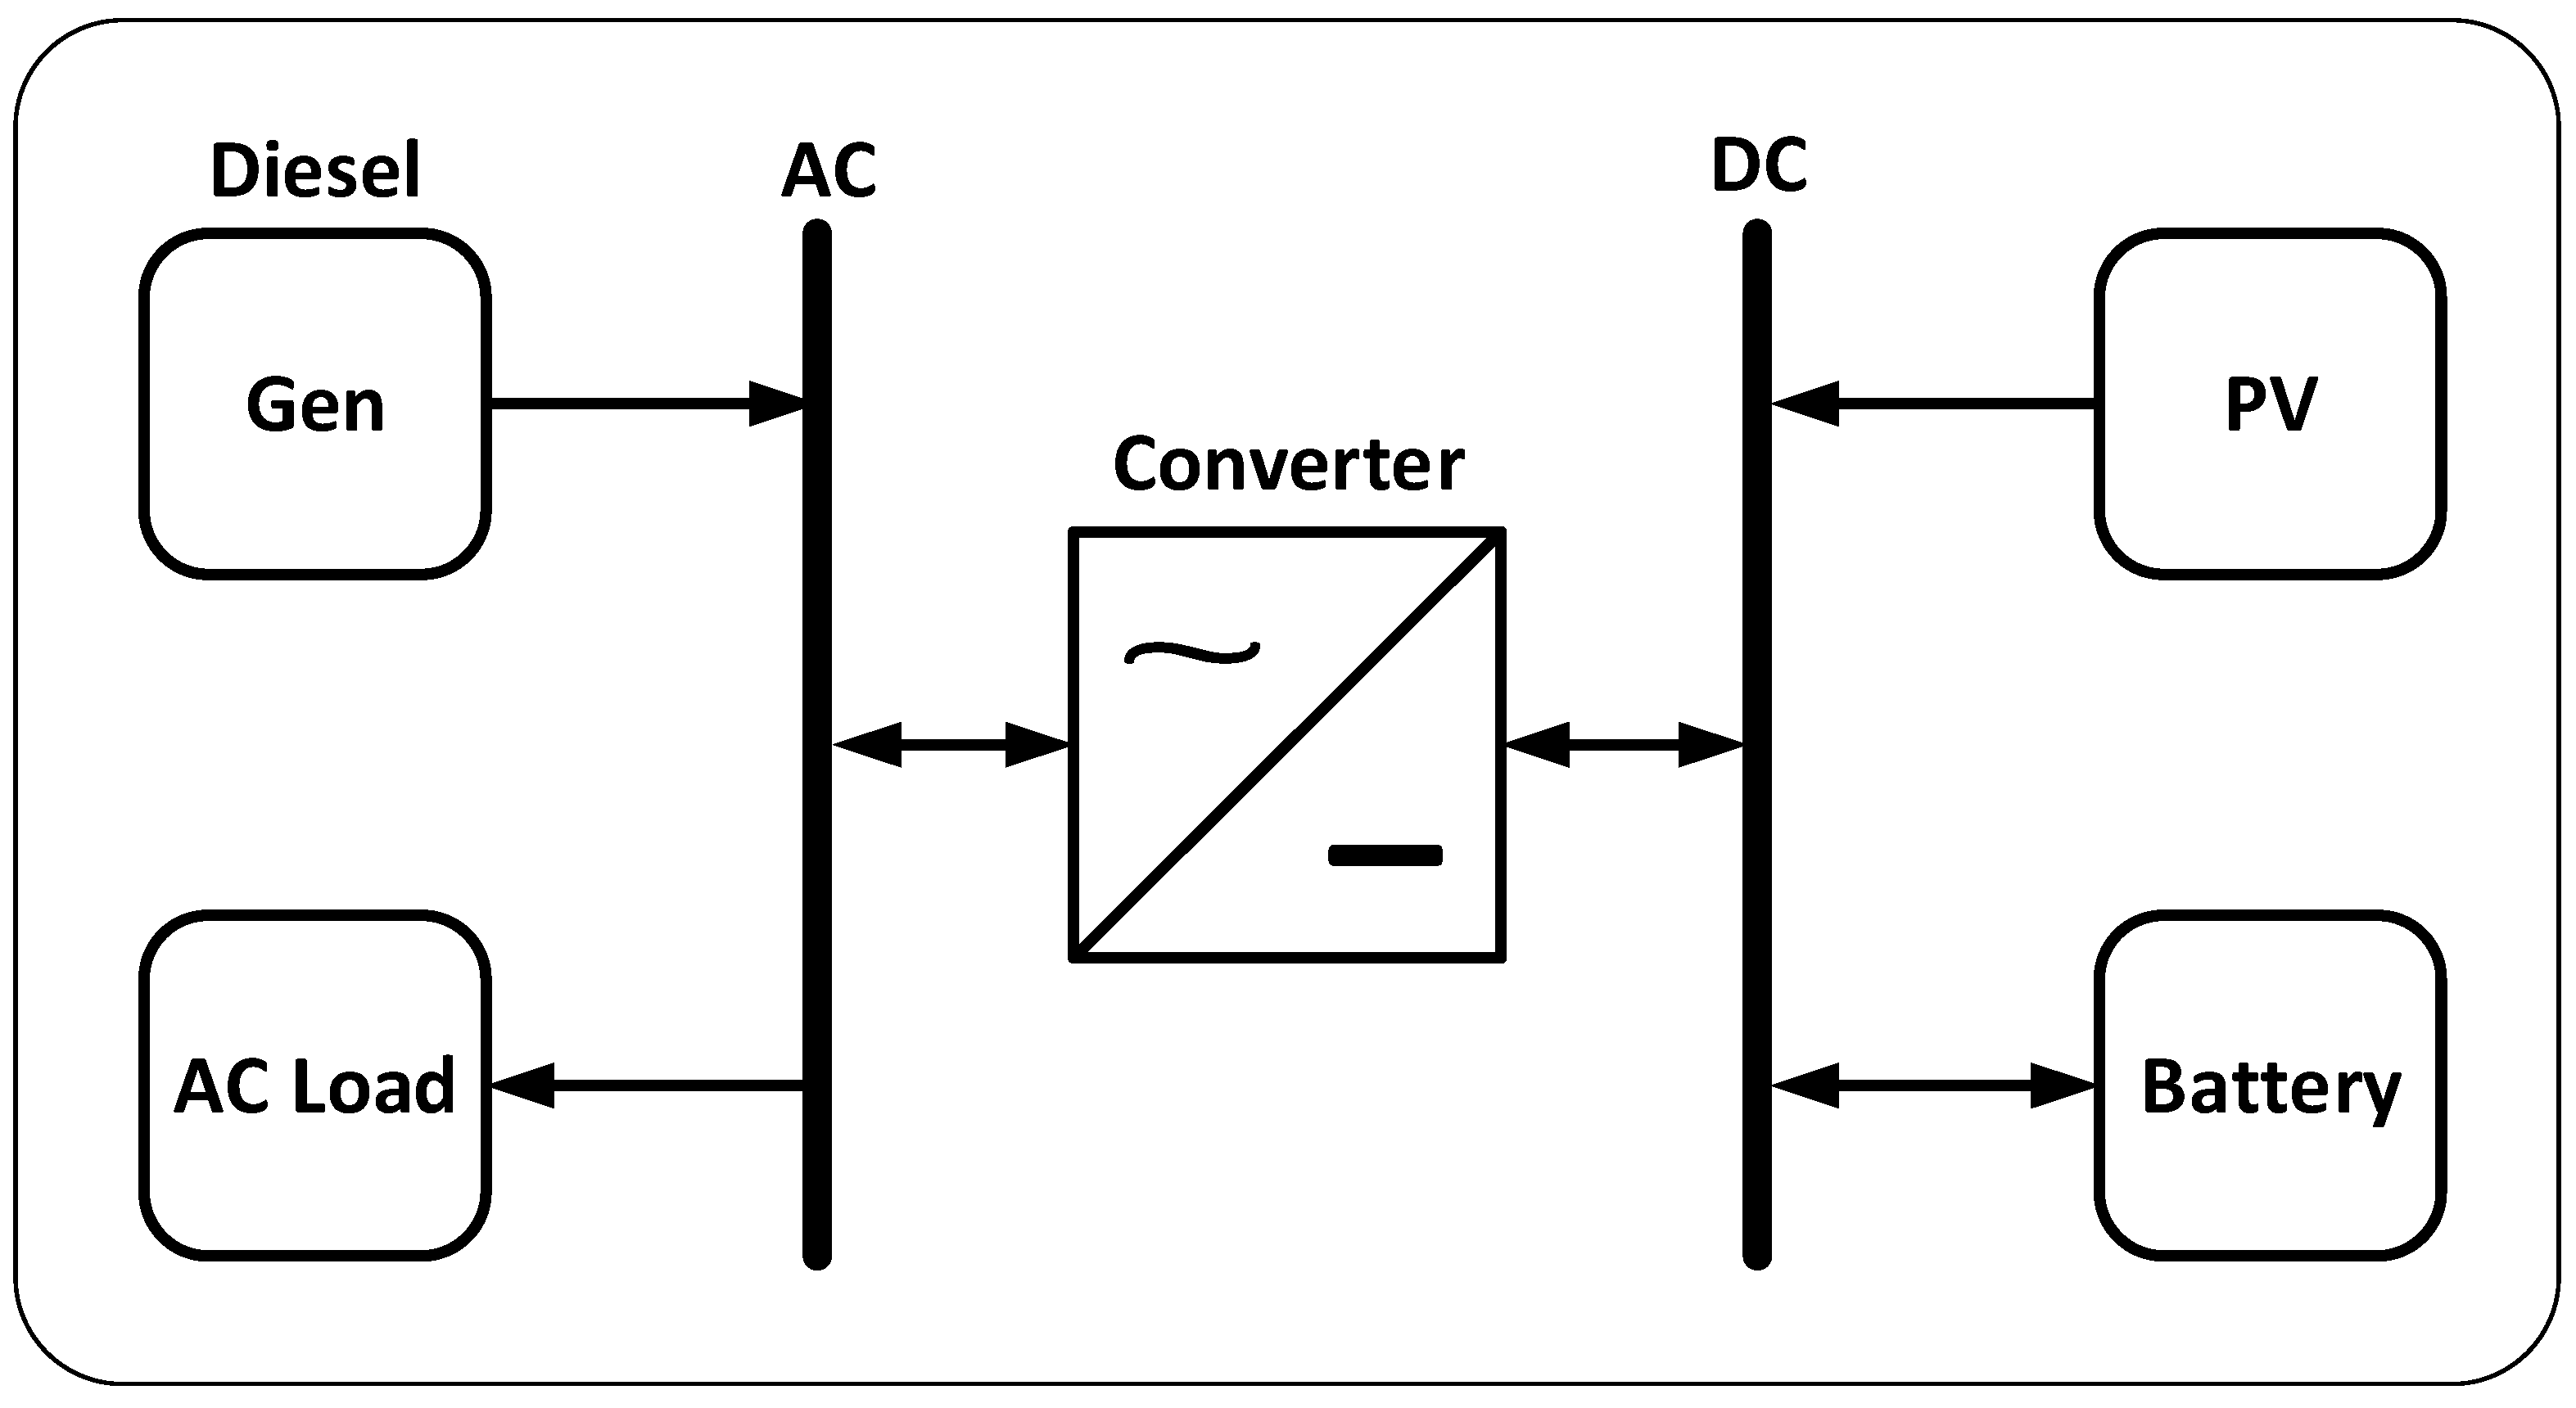
5.2. System Configuration
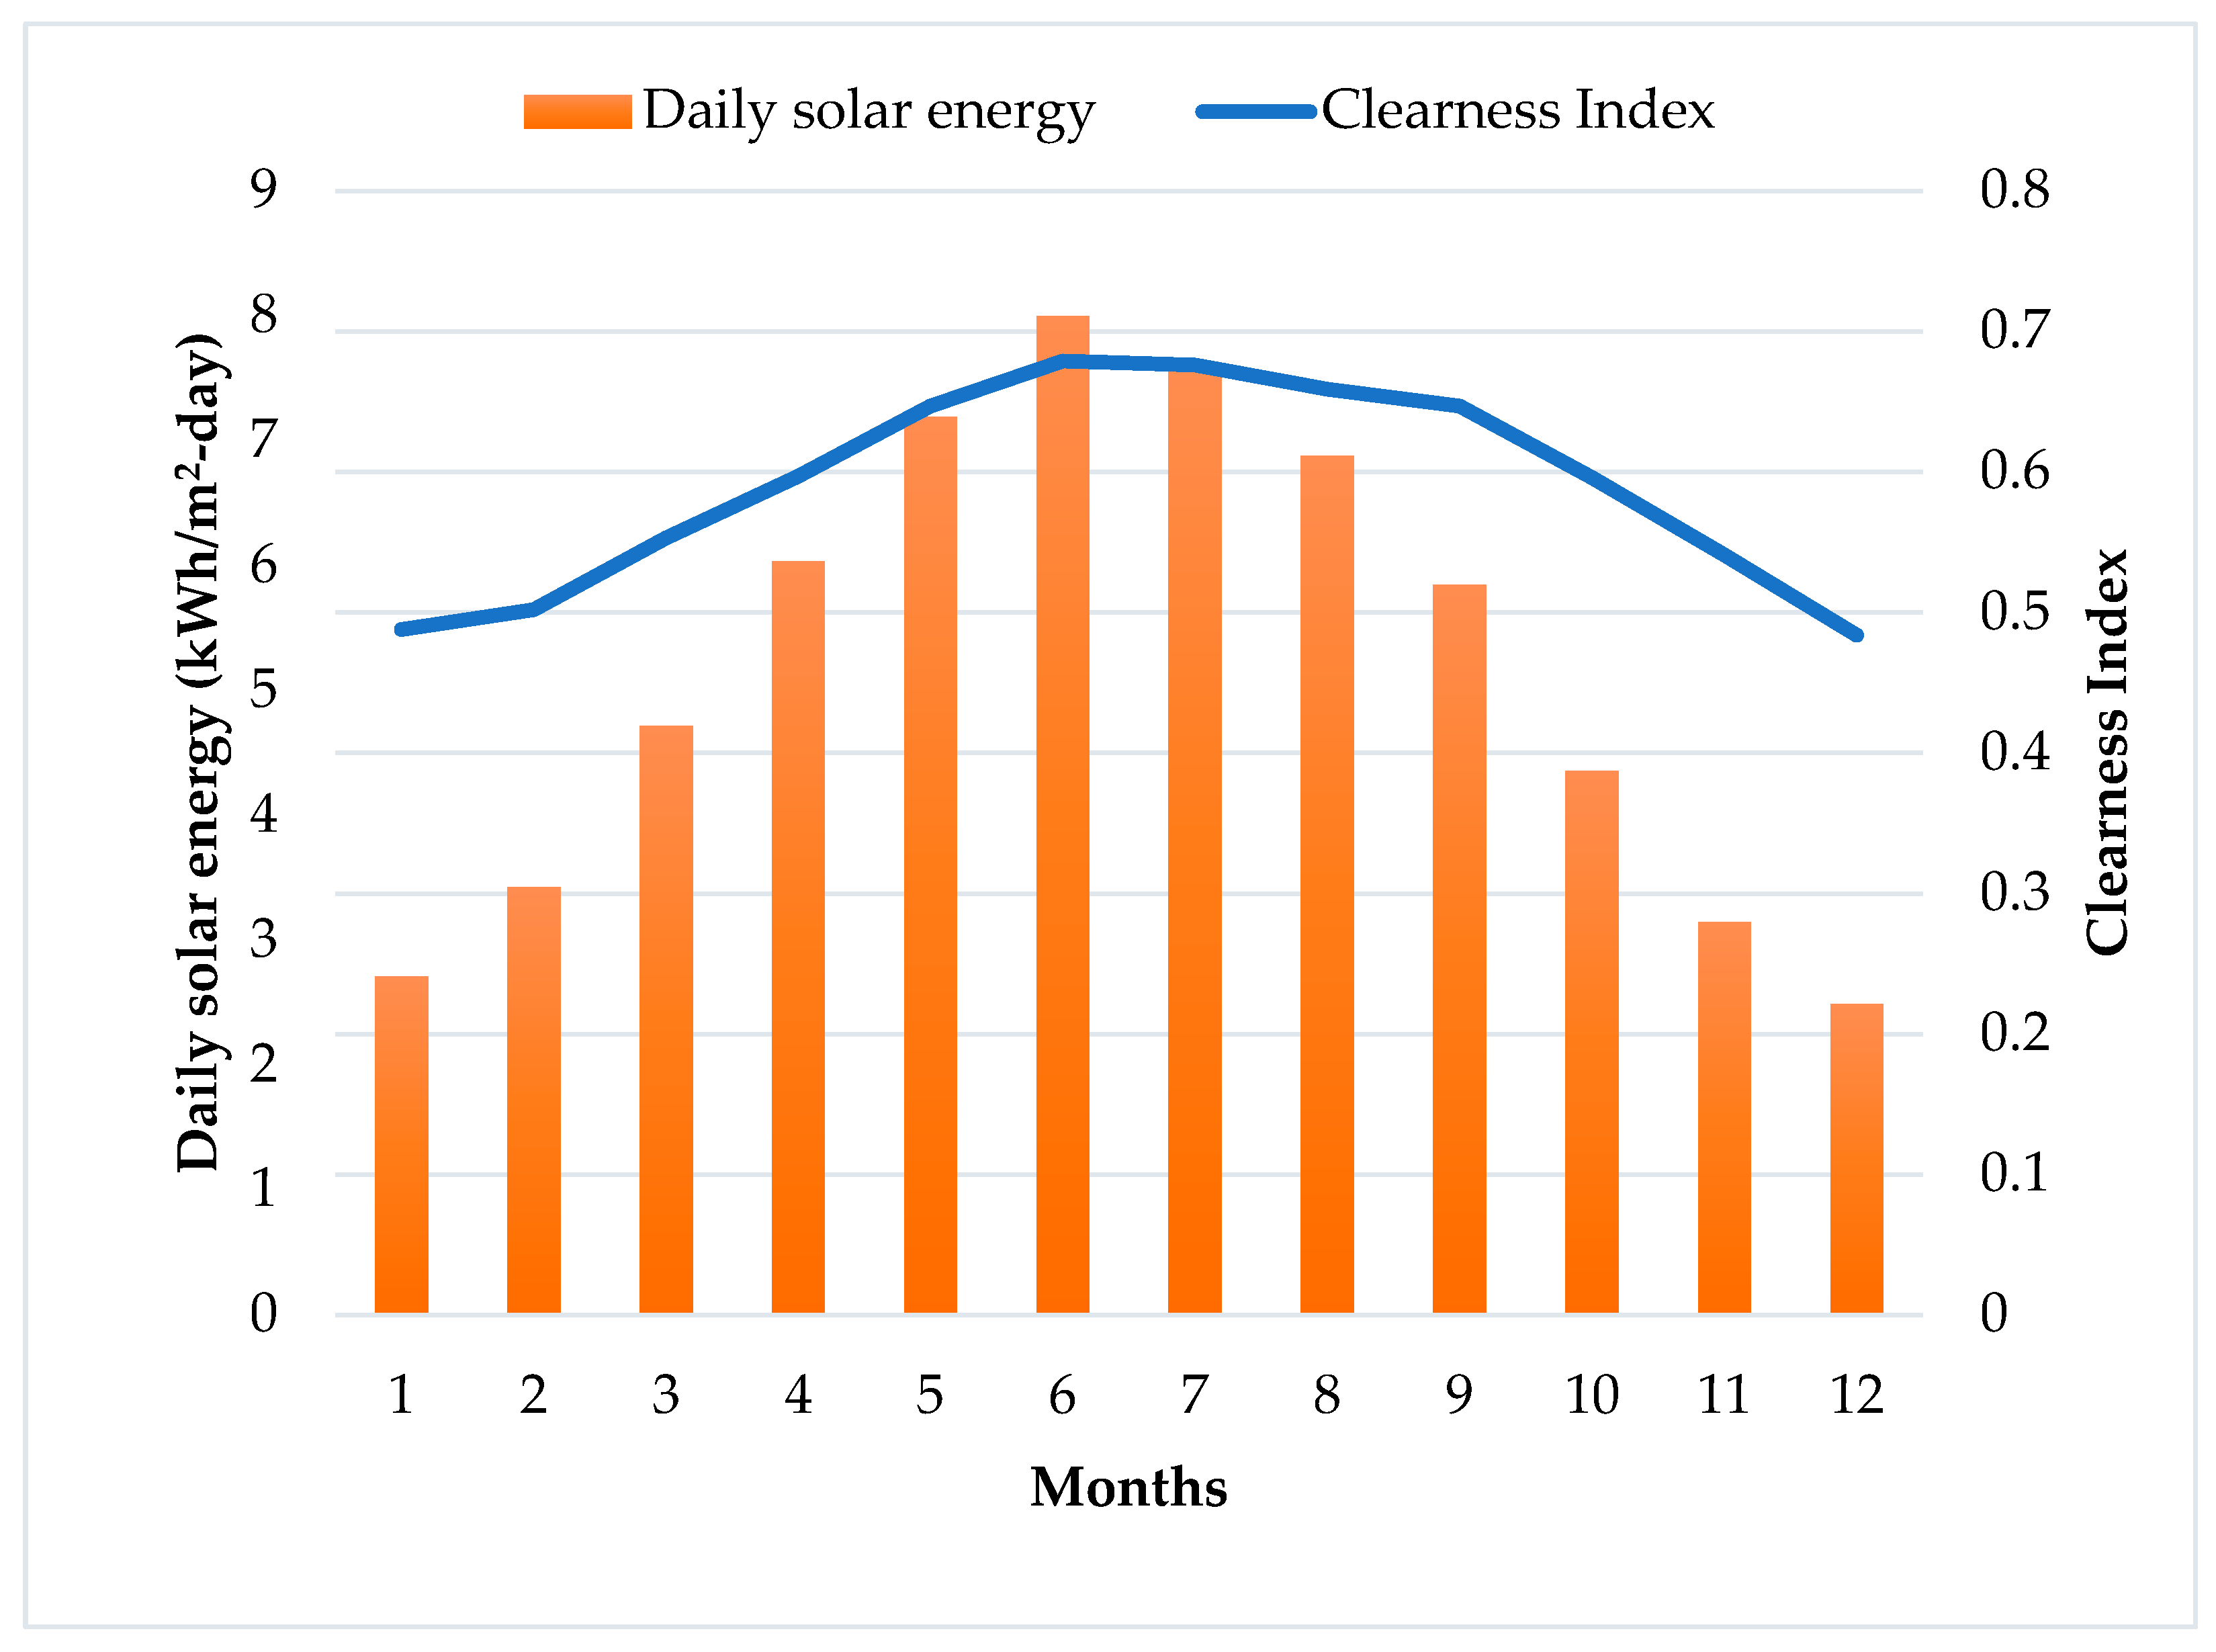
5.3. Solar Energy Potential
5.4. PV Generator Sizing
5.5. Genset and Power Converter Sizing
5.6. Battery Sizing
5.7. Simulation Parameters
6. Simulation Results
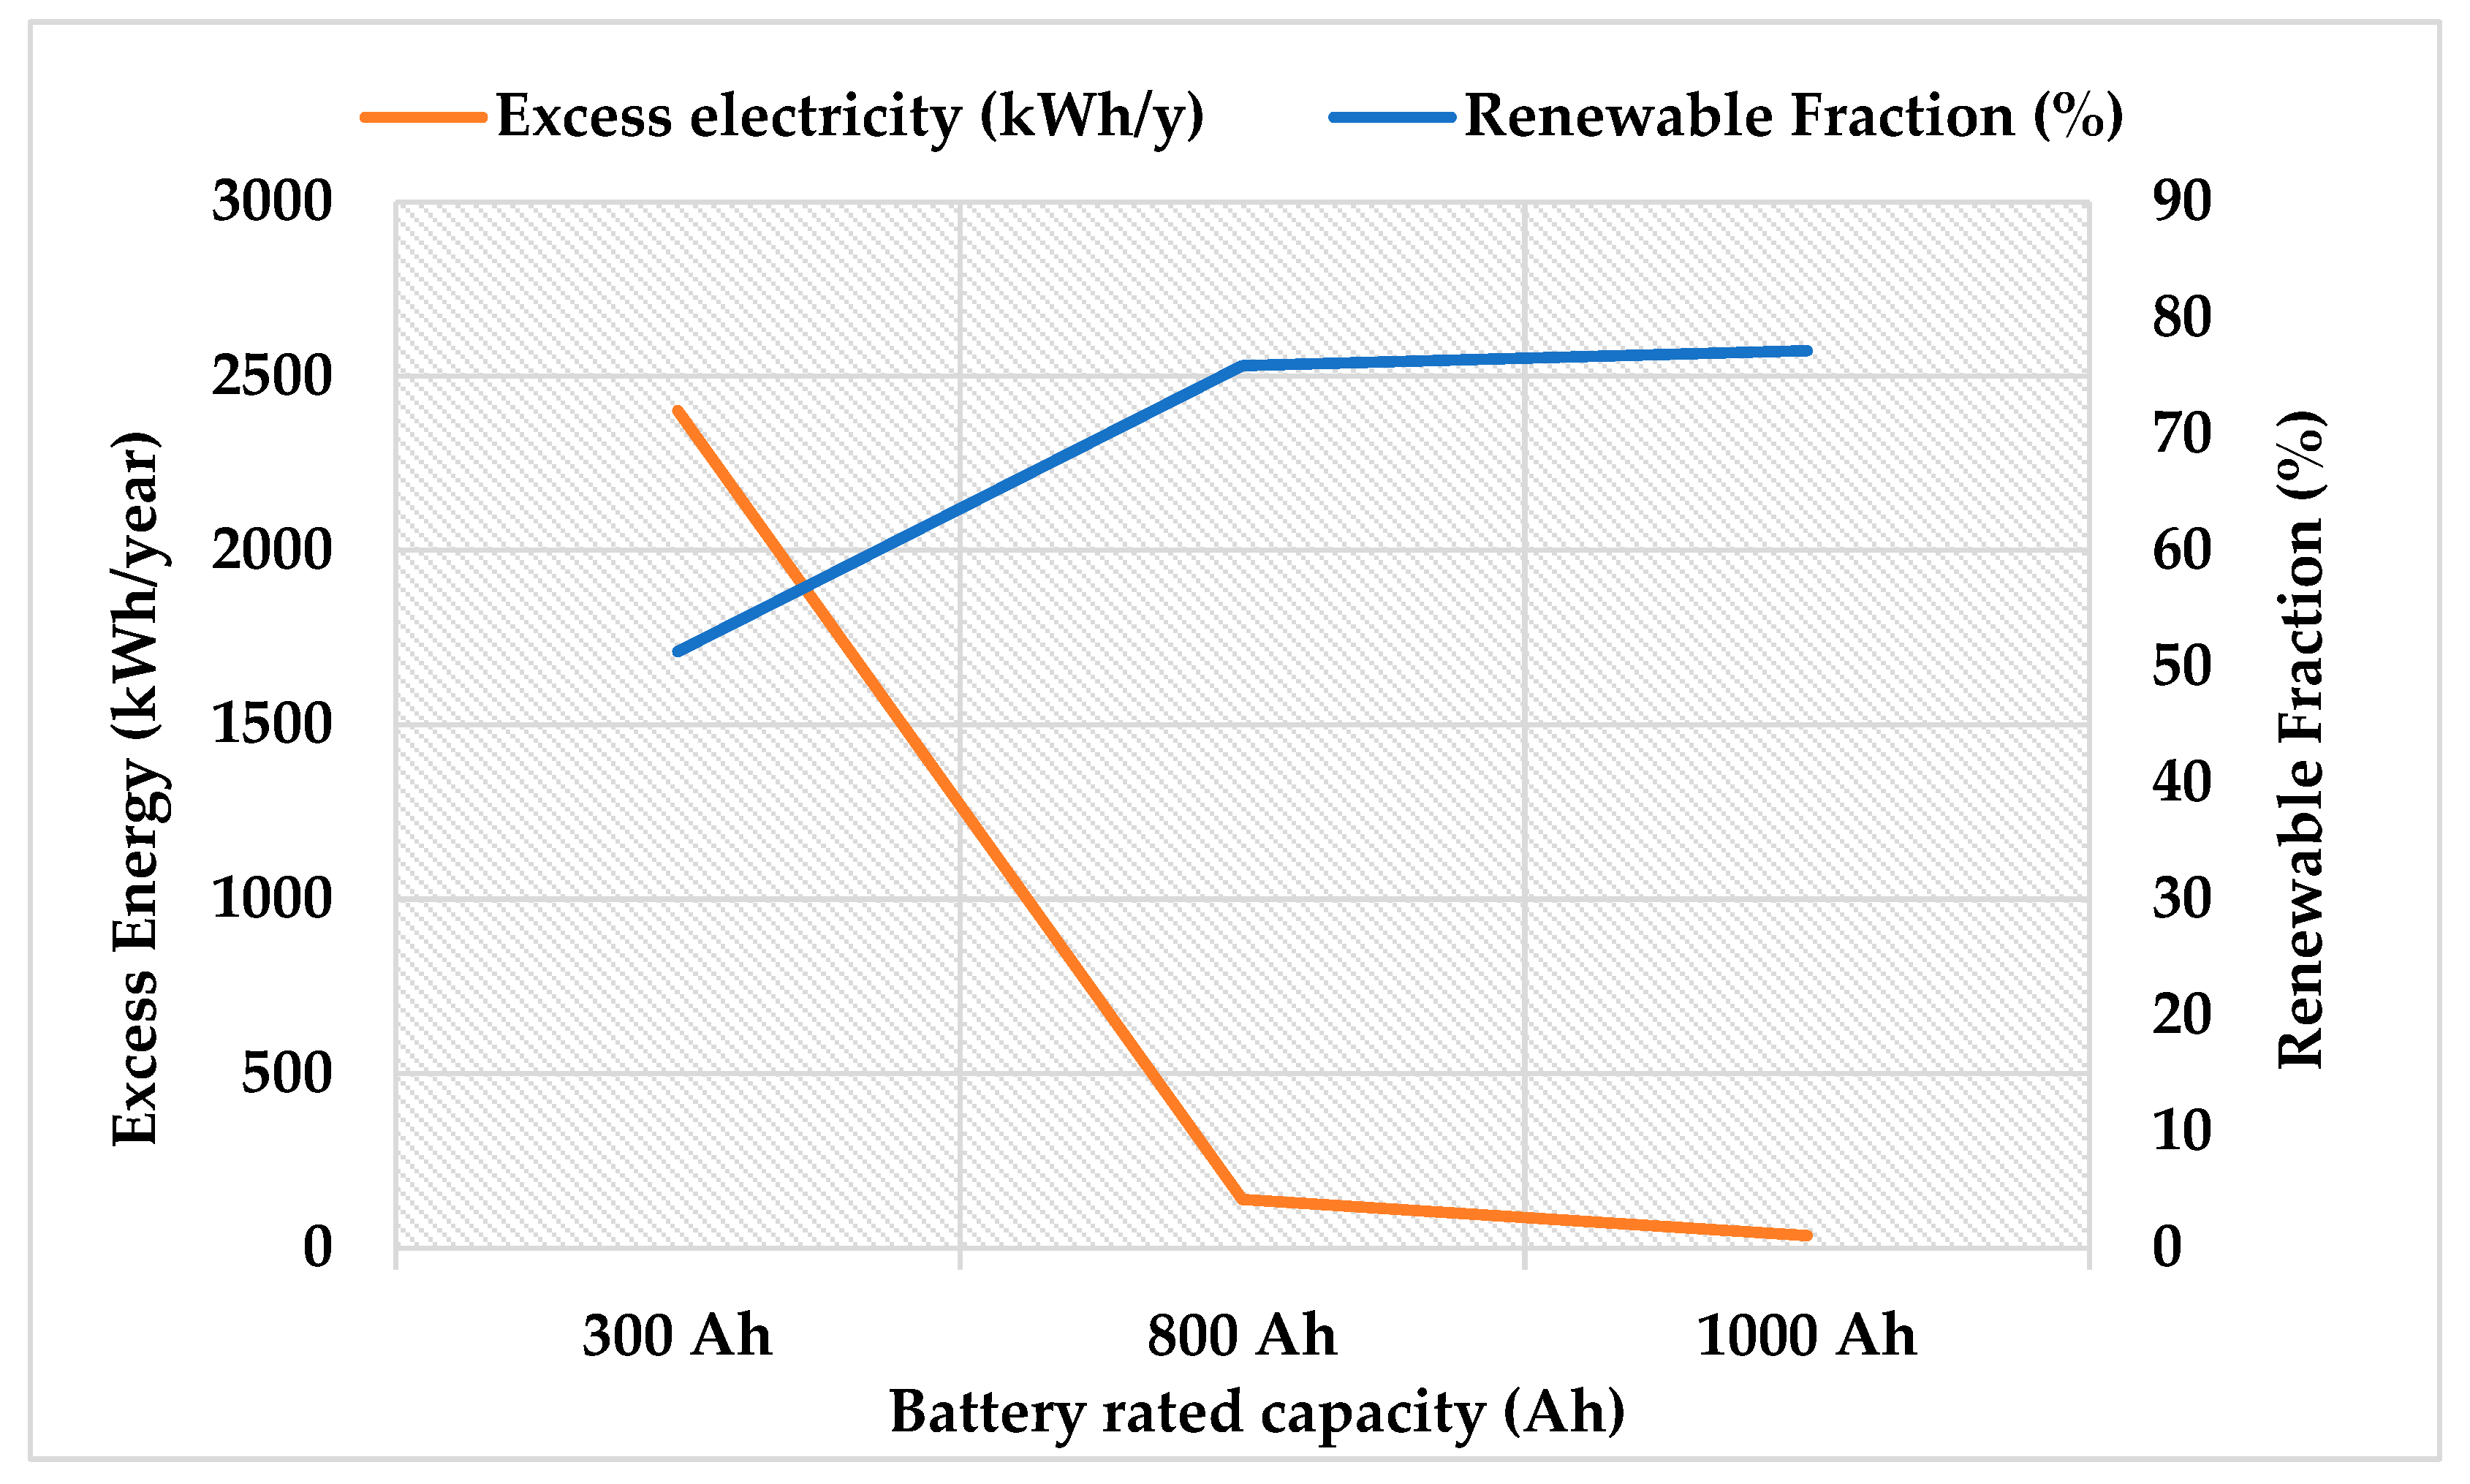
6.1. Impacts of Battery Sizing on Hybrid System
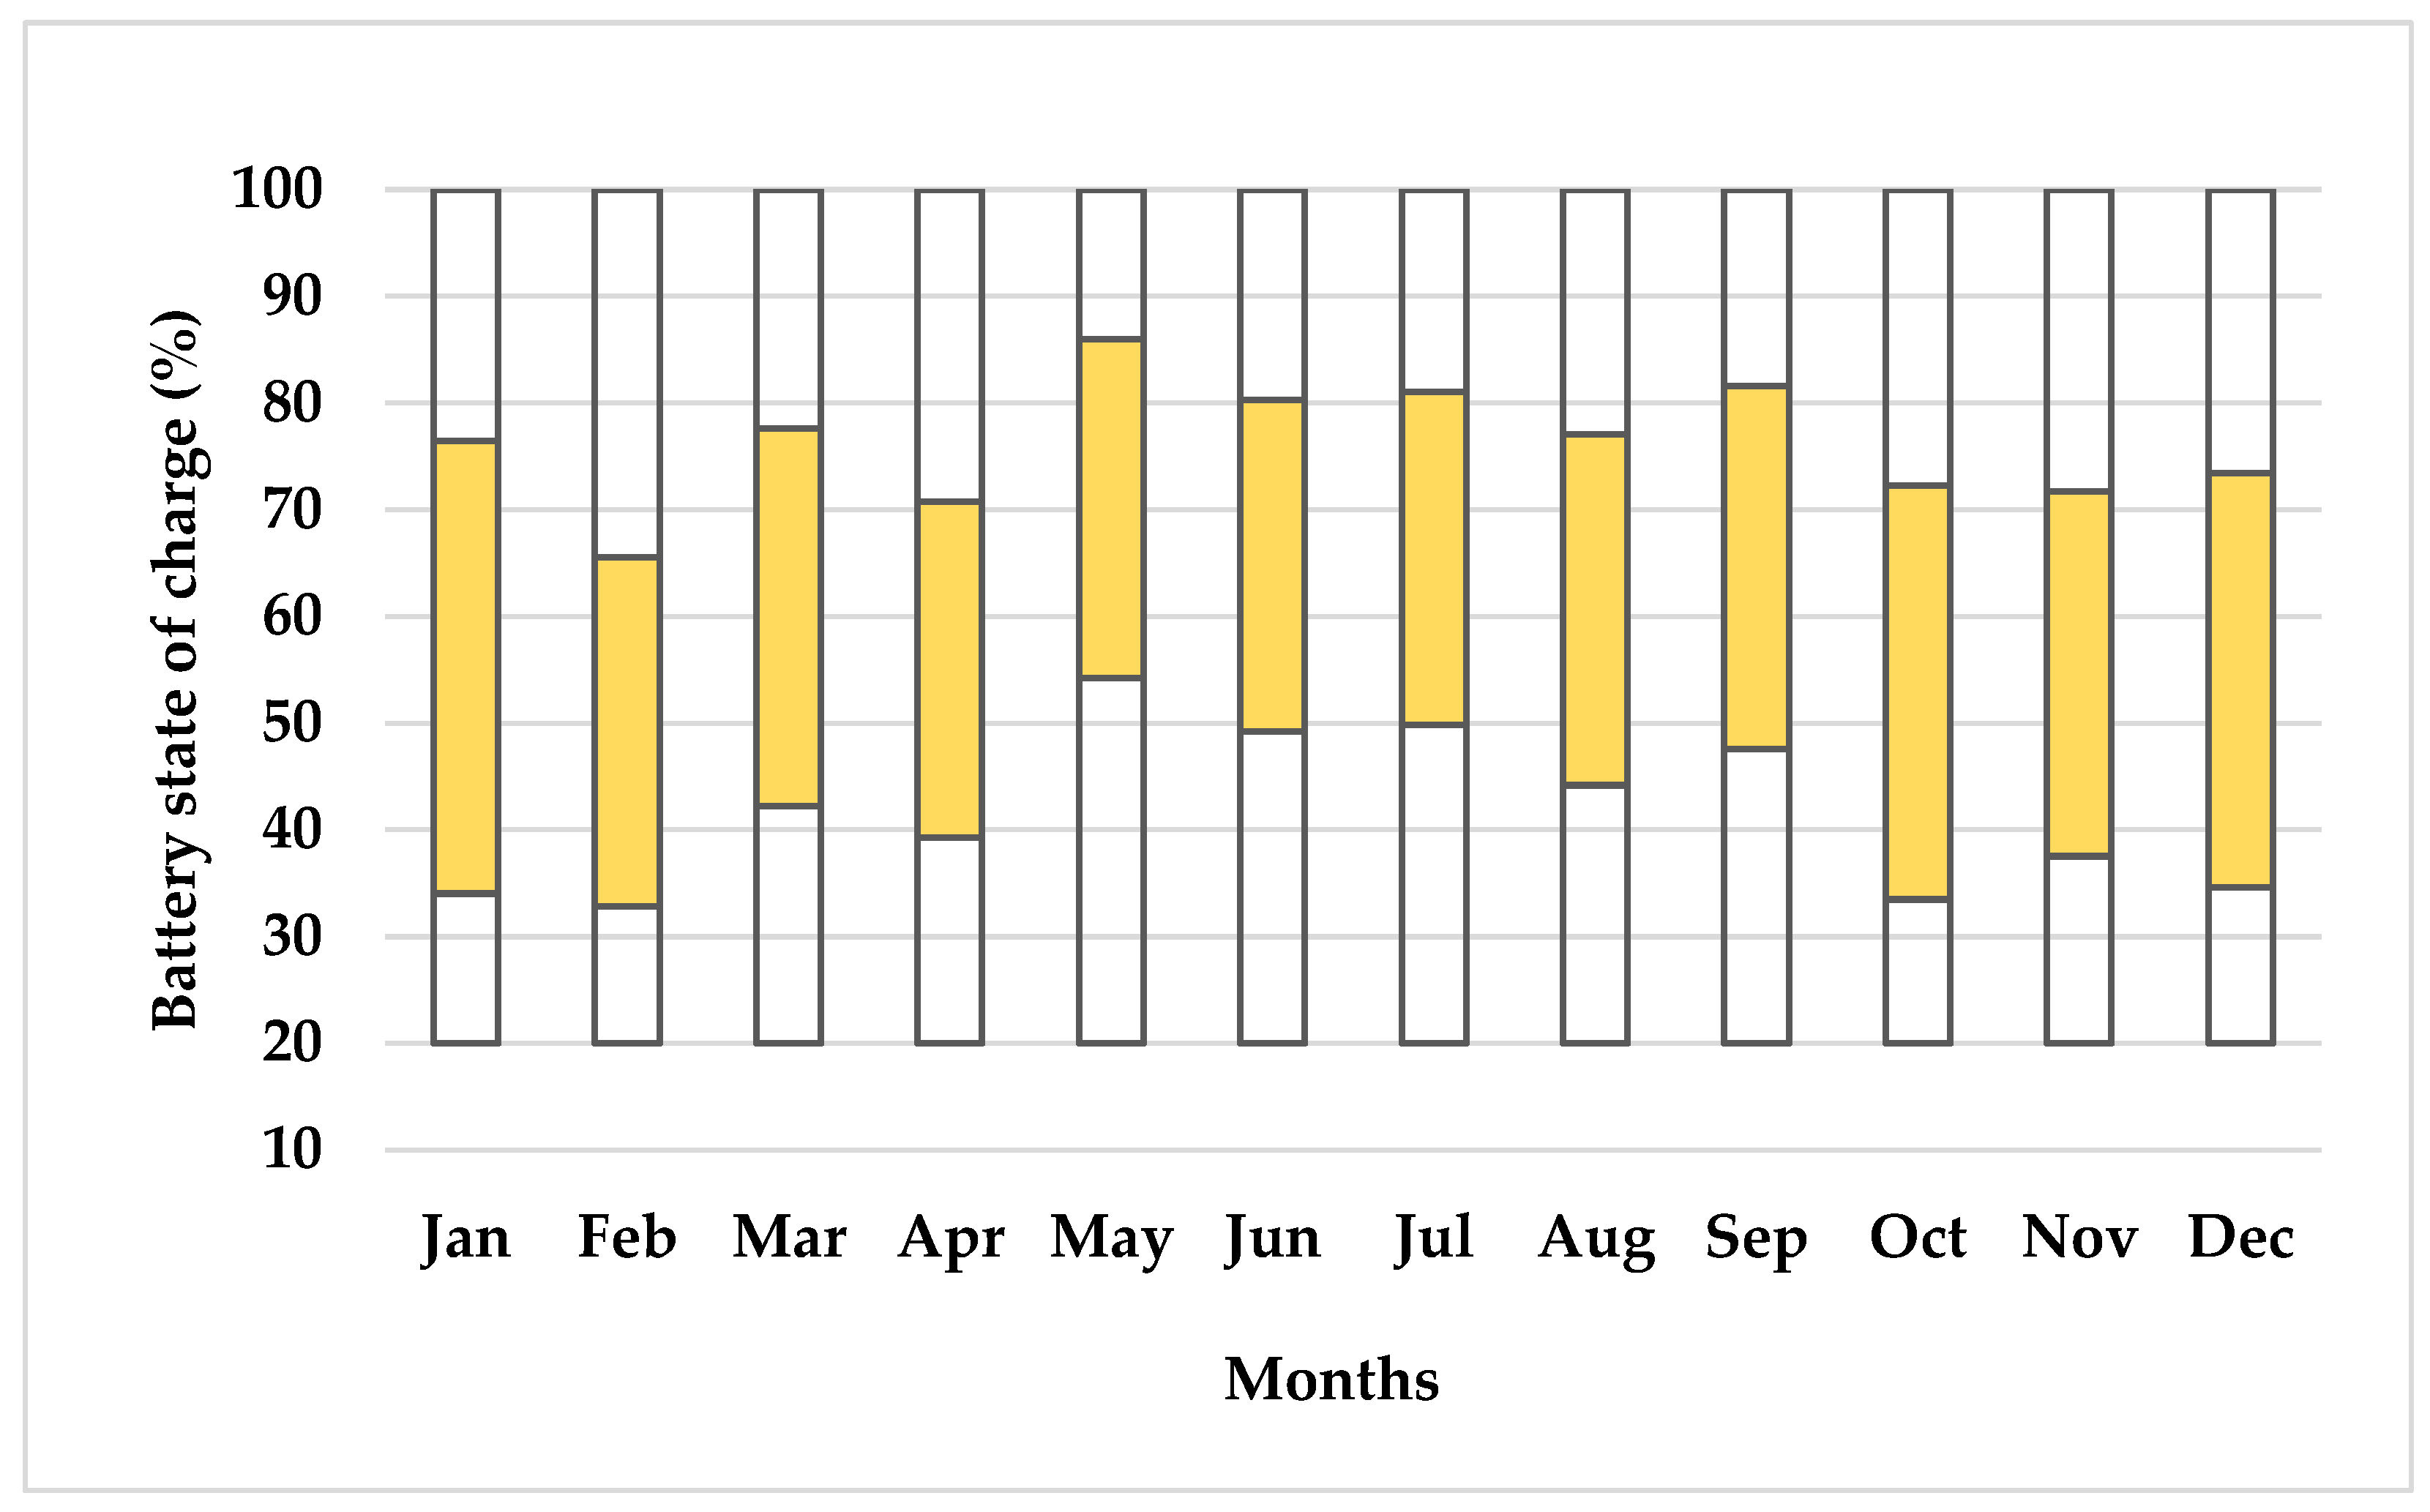
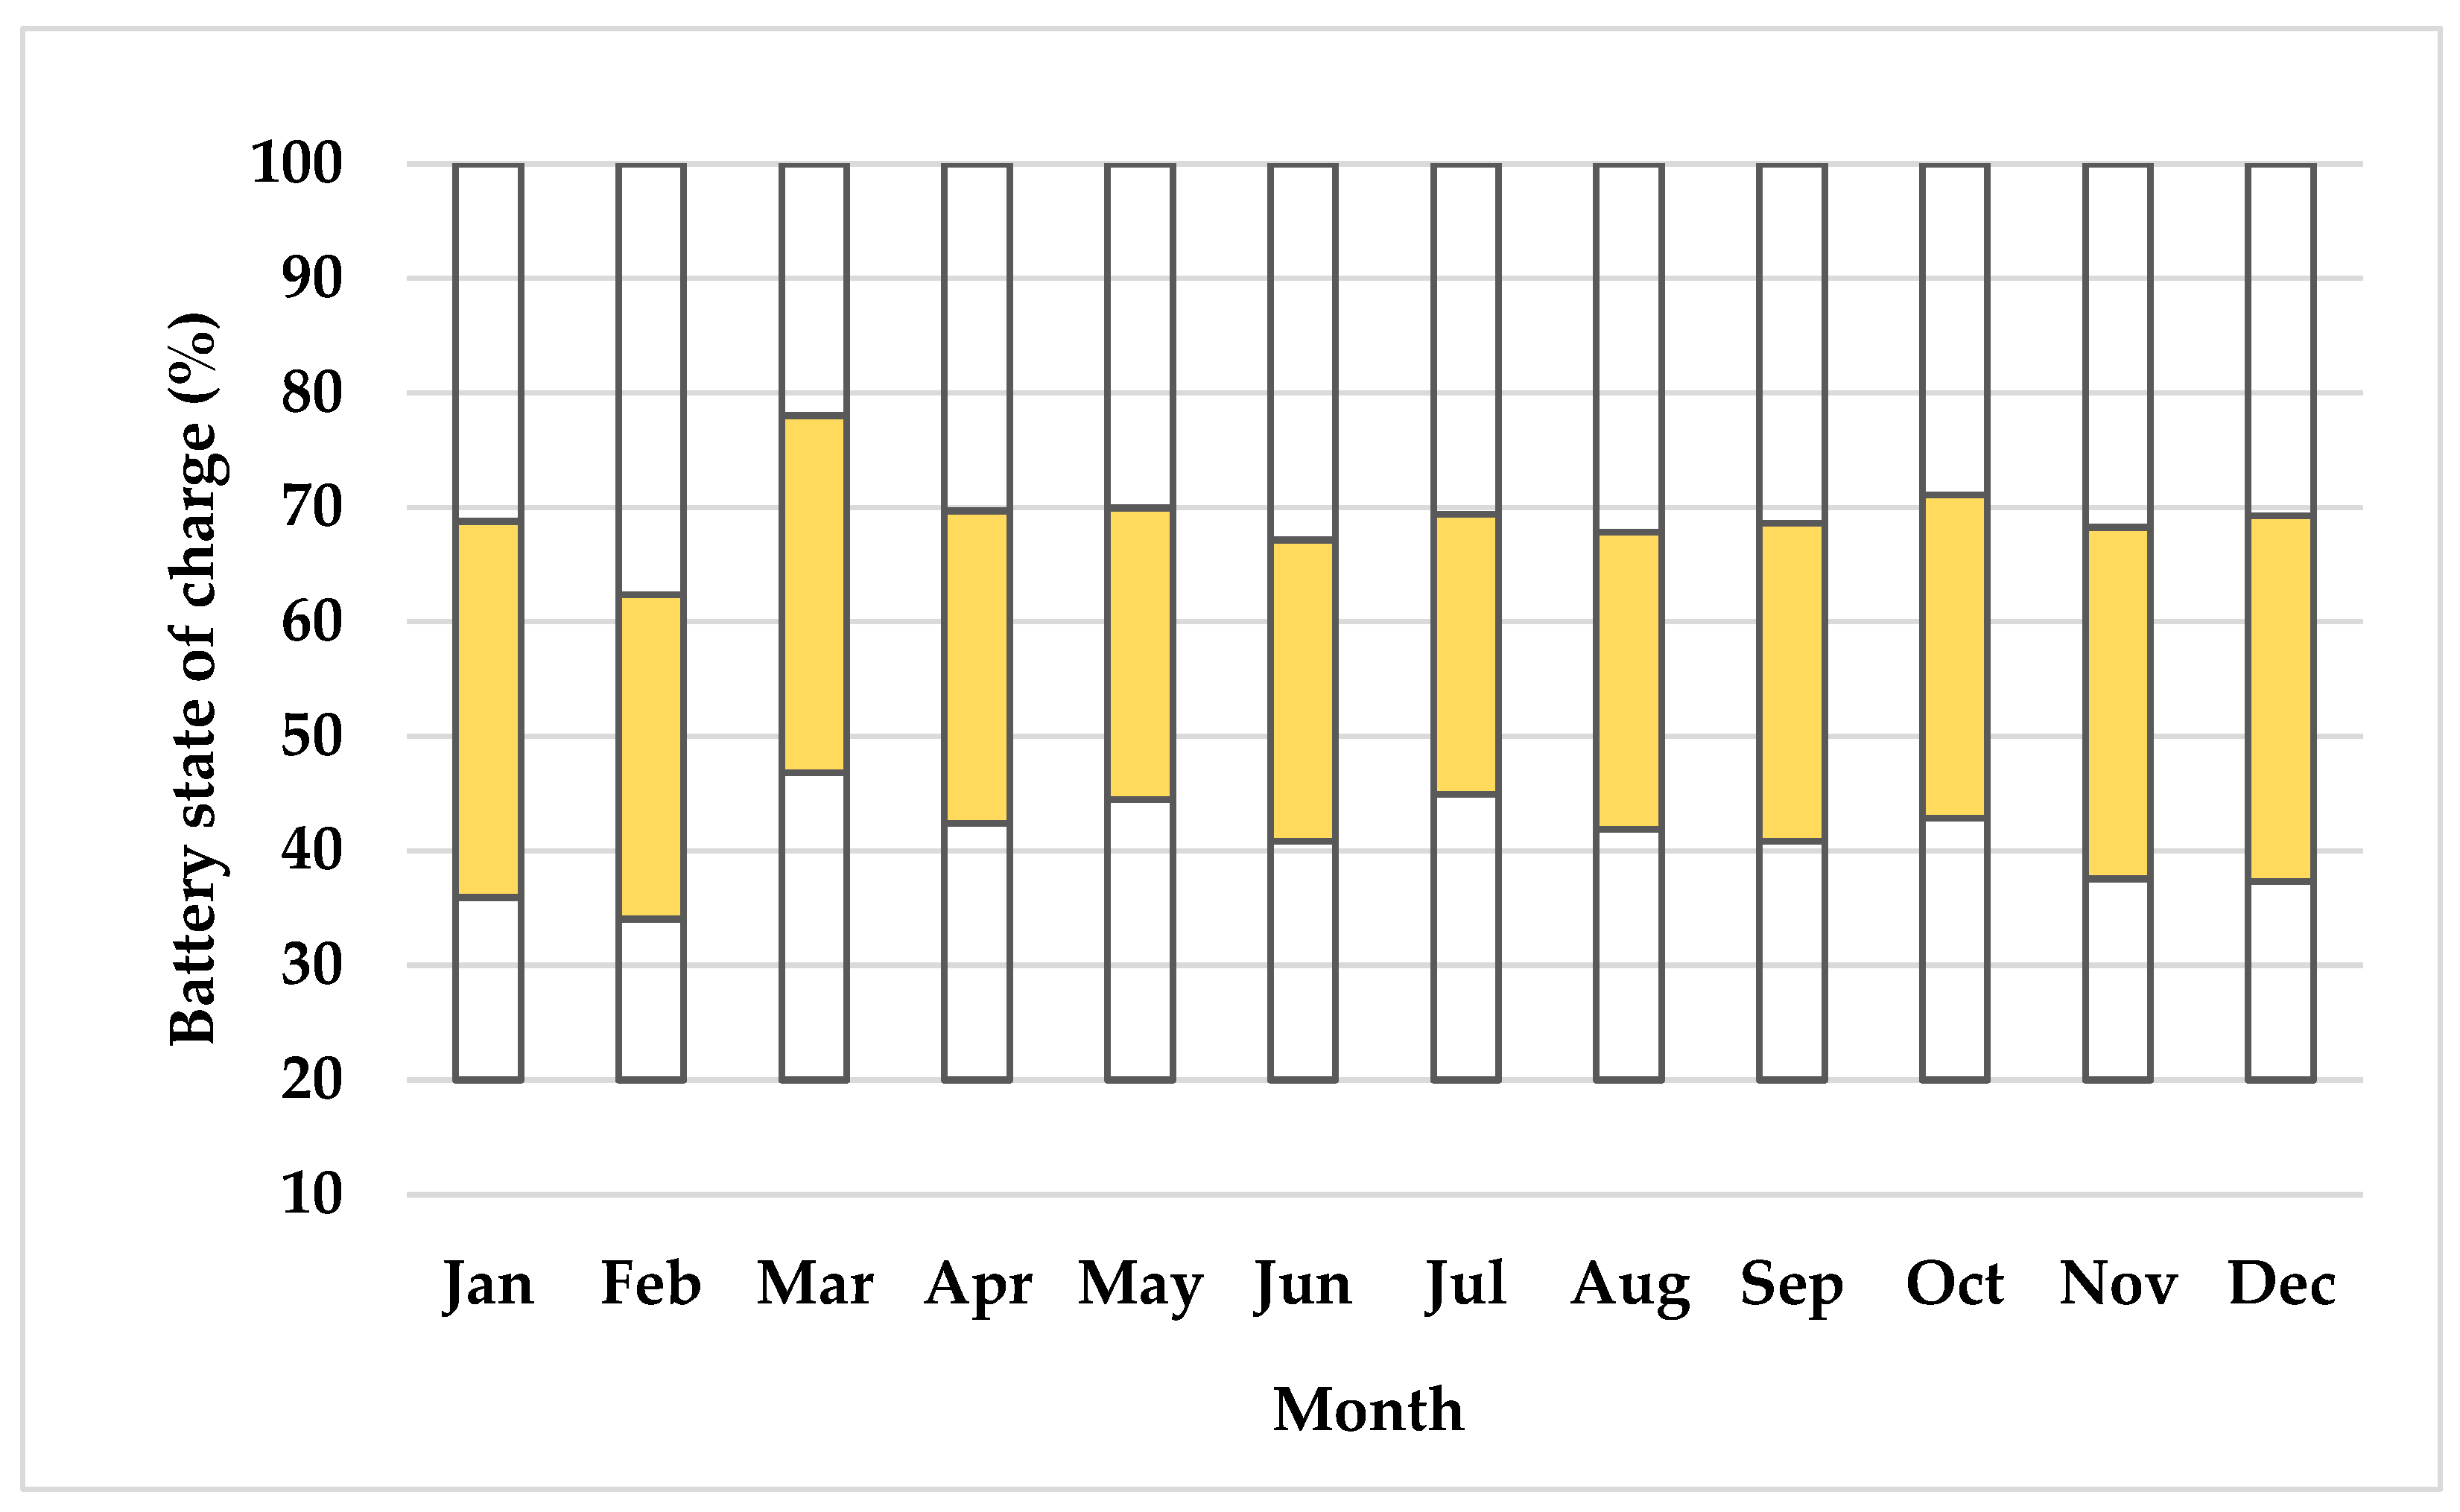
6.2. Battery Cycling Evaluation
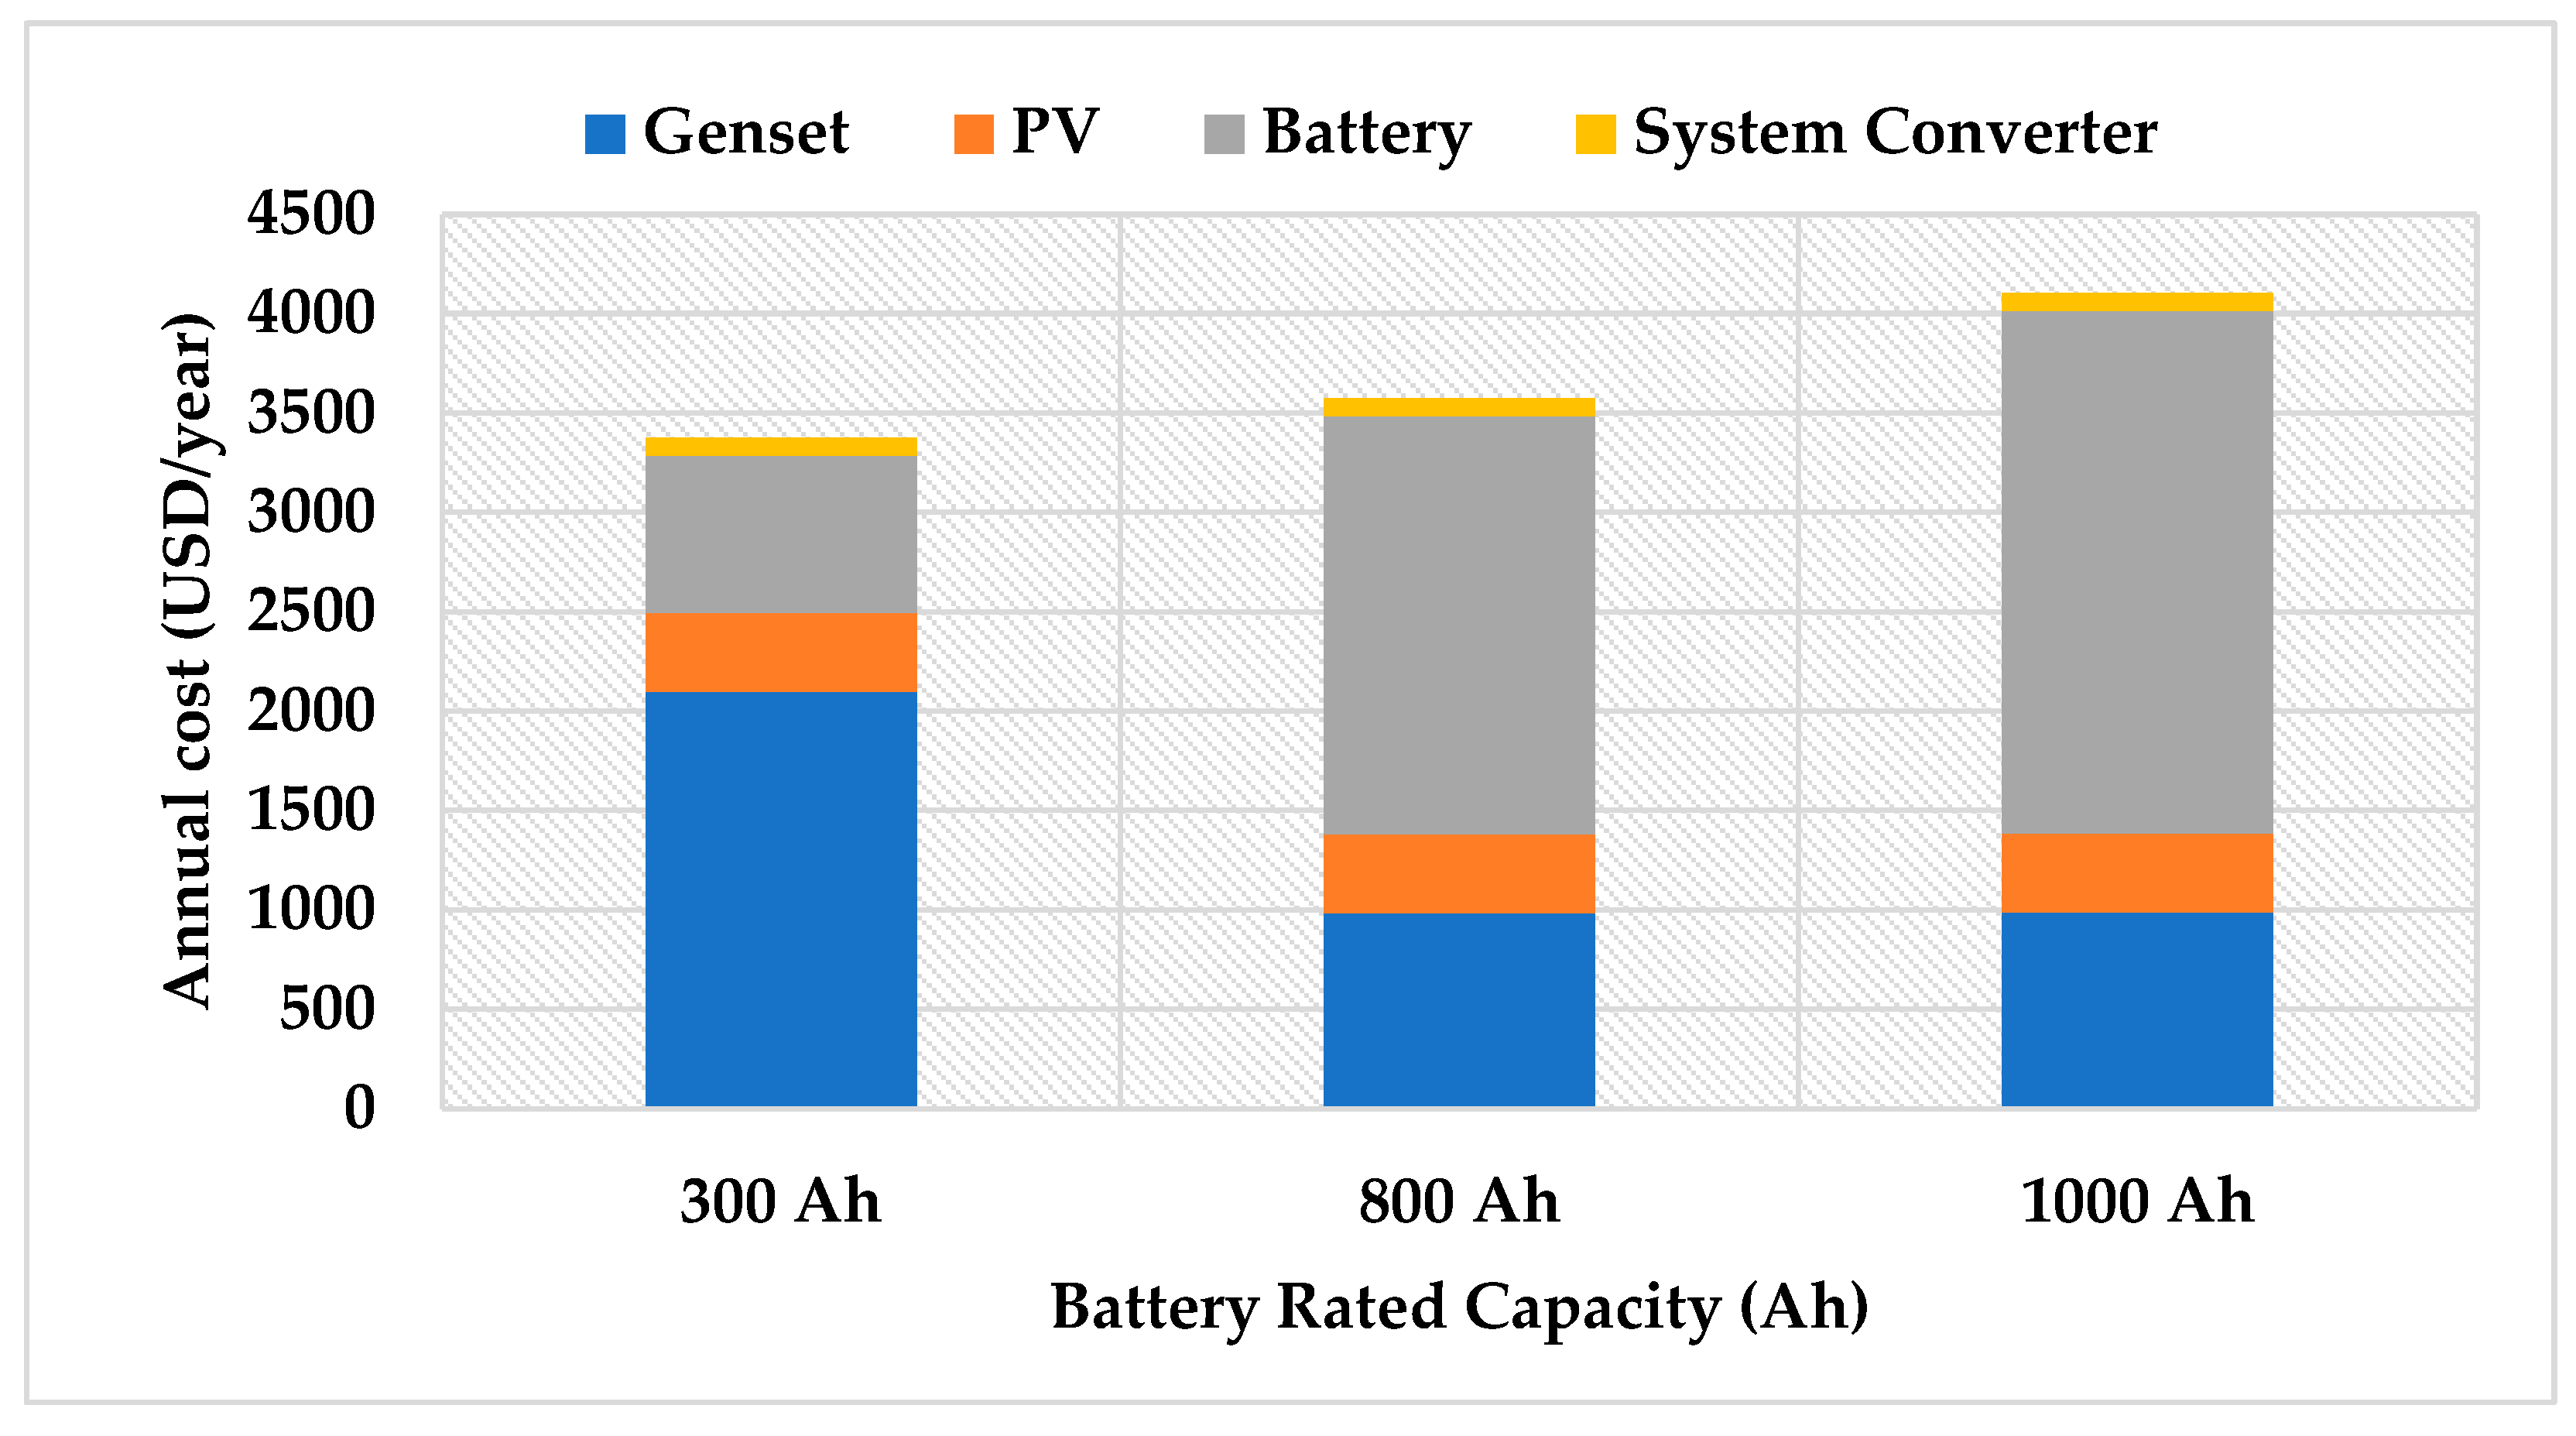
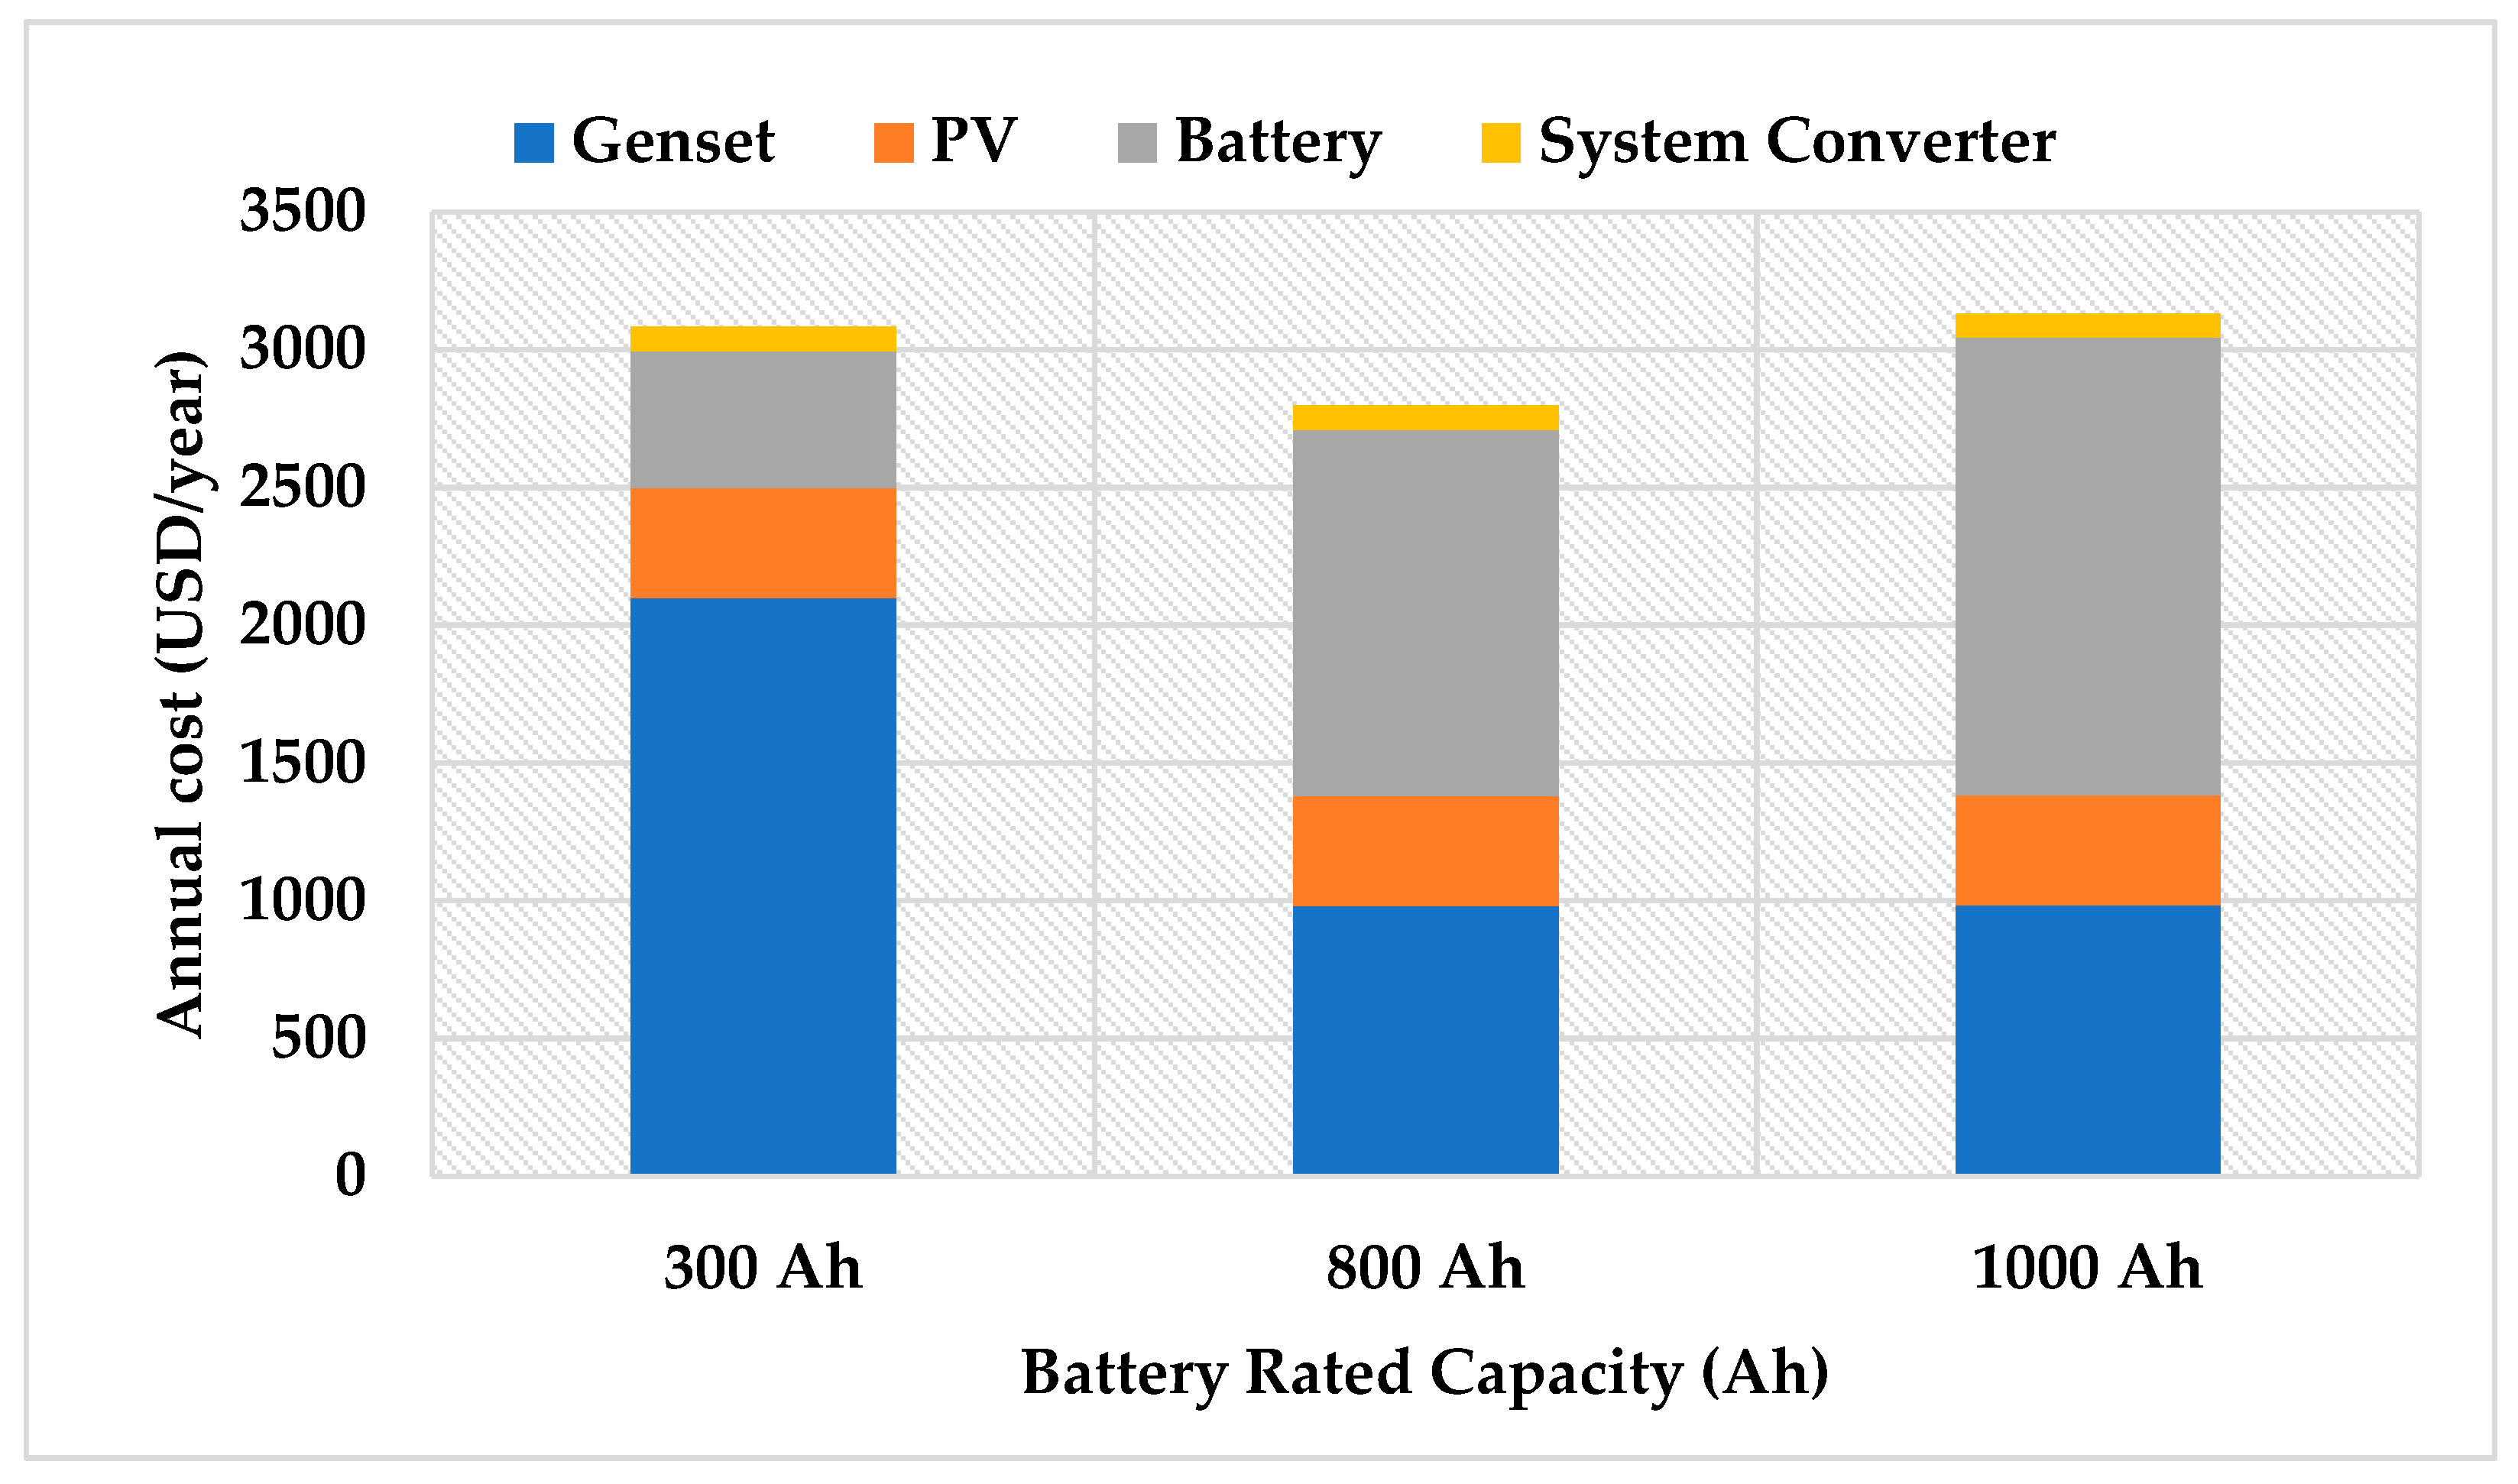
6.3. Economic Analysis Considering Assumed Battery Lifetime
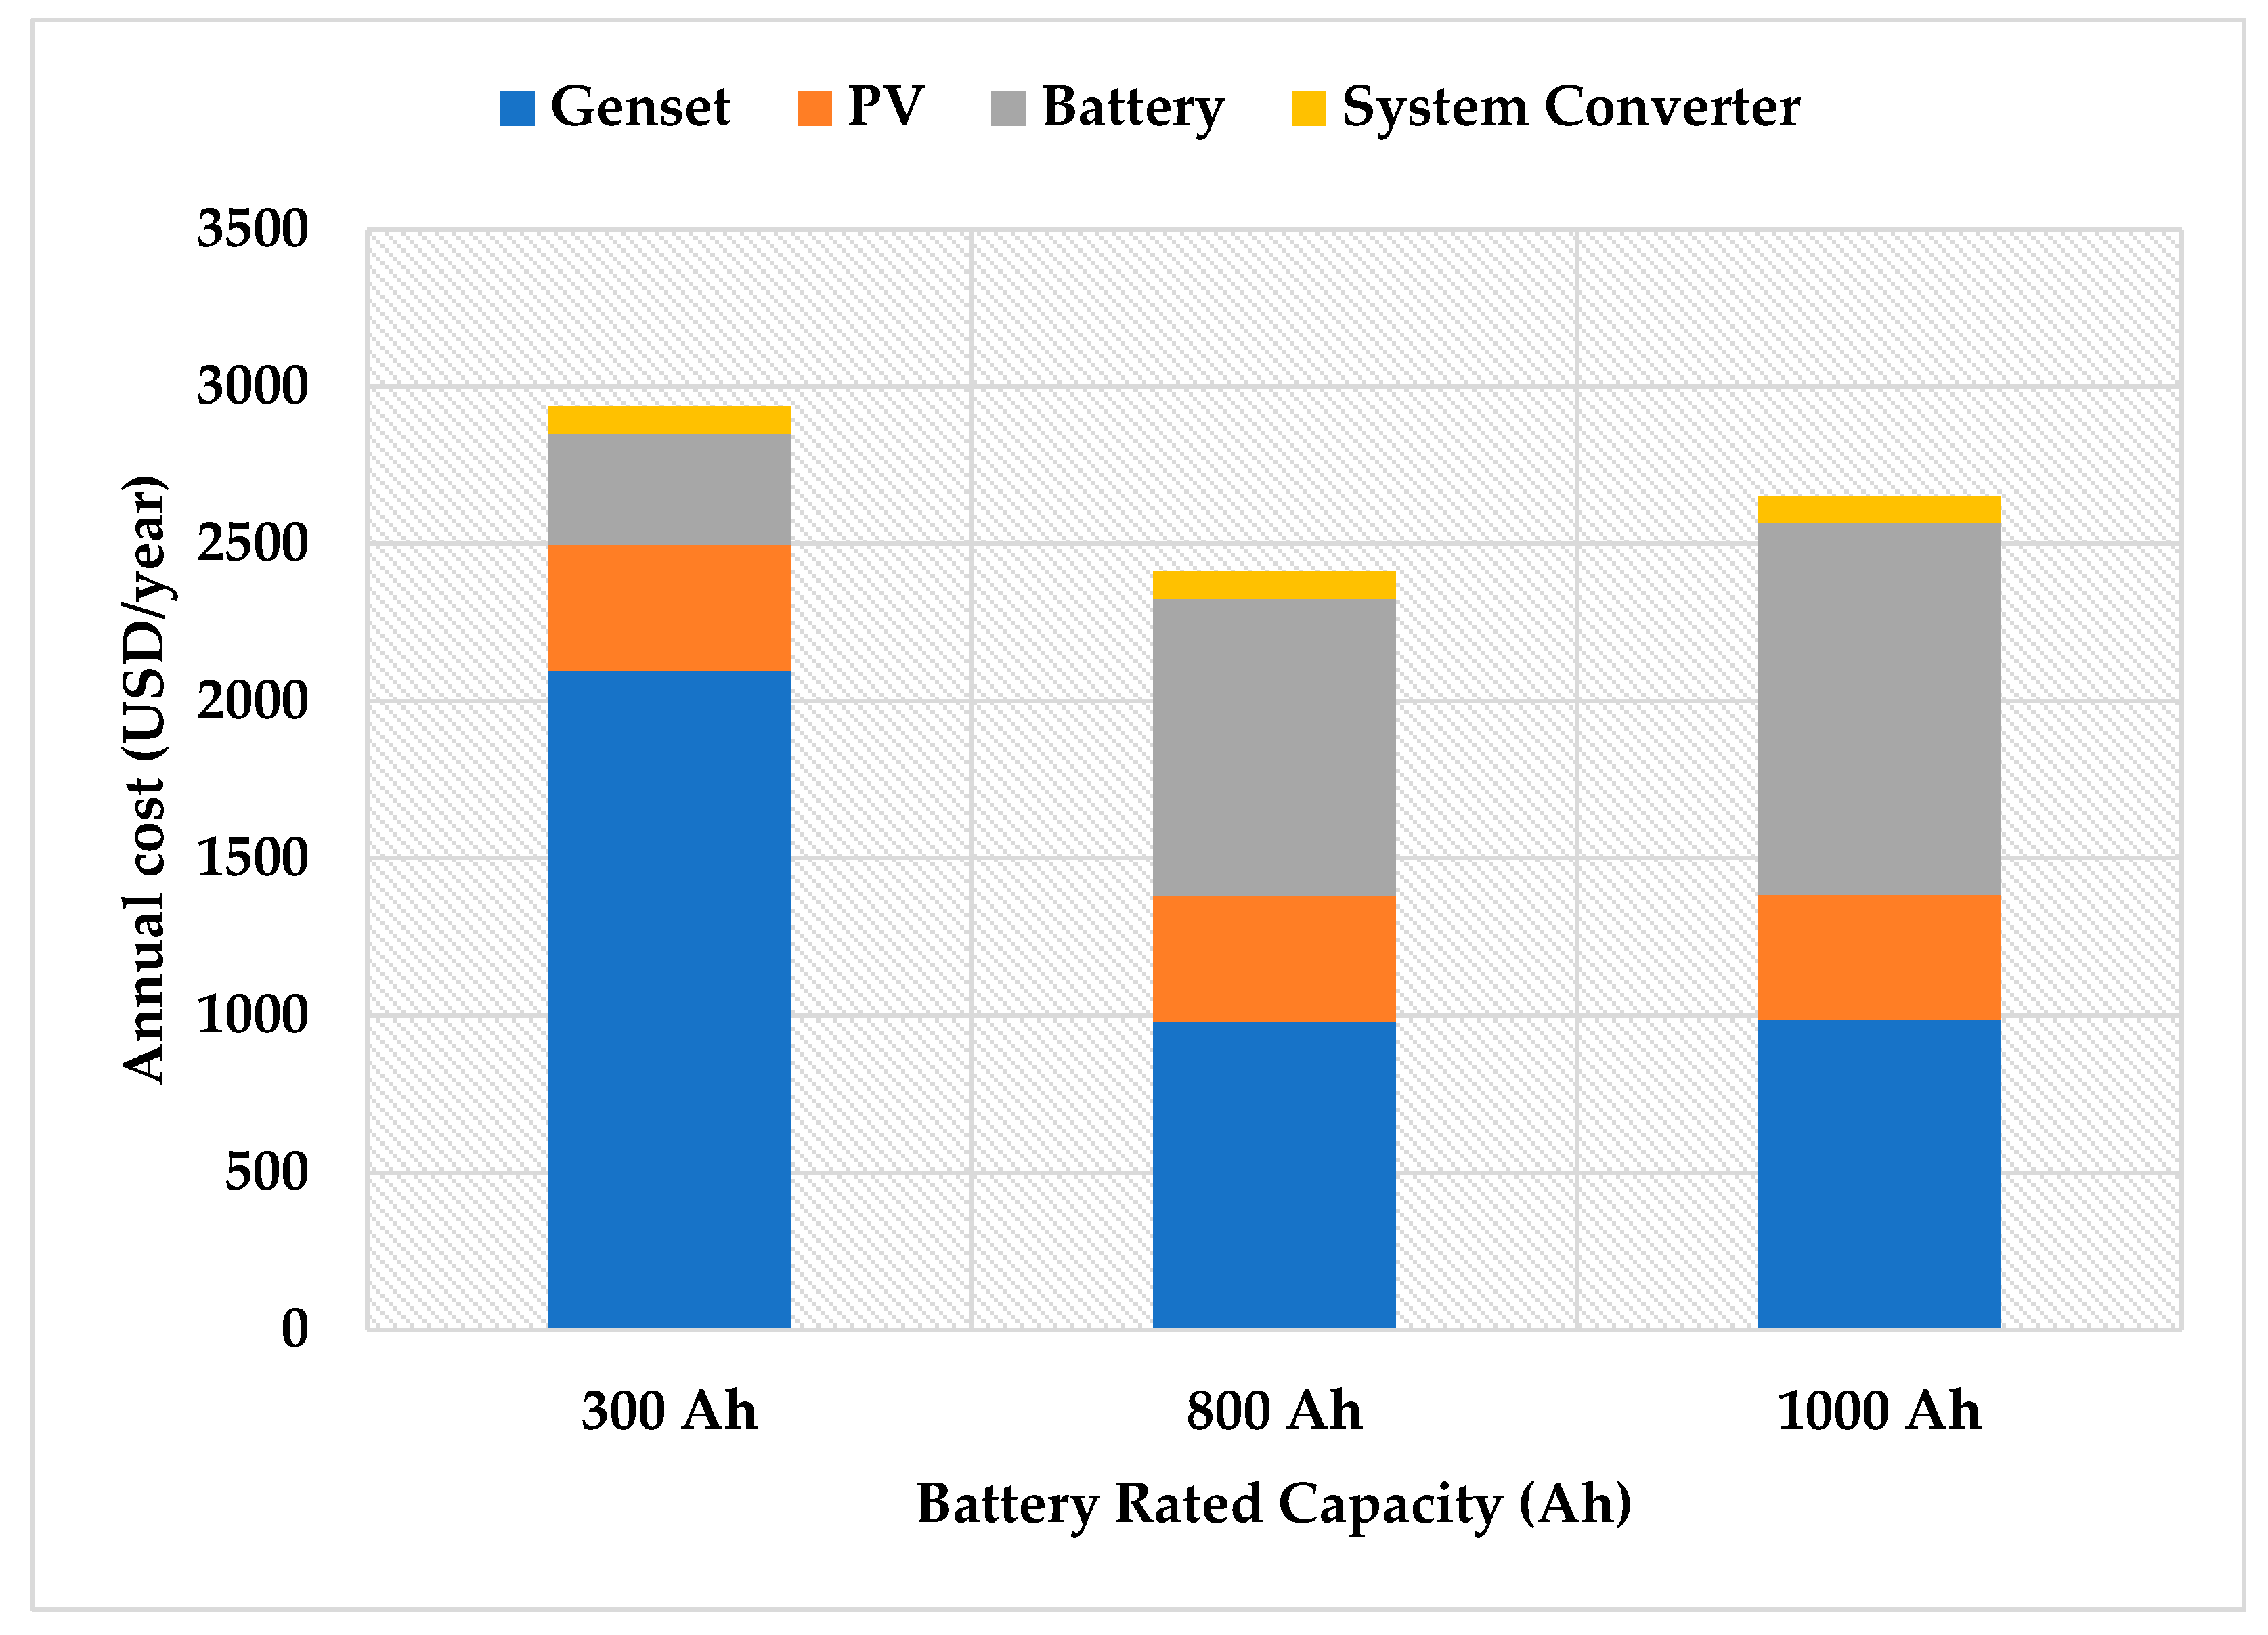
6.4. Economic Analysis Considering Battery Service Lifetime
7. Conclusions and Future Work
Funding
Data Availability Statement
Conflicts of Interest
References
- Emad, D.; El-Hameed, M.A.; El-Fergany, A.A. Optimal techno-economic design of hybrid PV/wind system comprising battery energy storage: Case study for a remote area. Energy Convers. Manag. 2021, 249, 114847. [Google Scholar] [CrossRef]
- Odou, O.D.T.; Bhandari, R.; Adamou, R. Hybrid off-grid renewable power system for sustainable rural electrification in Benin. Renew. Energy 2020, 145, 1266–1279. [Google Scholar] [CrossRef]
- Falama, R.Z.; Saidi, A.S.; Soulouknga, M.H.; Salah, C.B. A techno-economic comparative study of renewable energy systems based different storage devices. Energy 2023, 266, 126411. [Google Scholar] [CrossRef]
- León Gómez, J.C.; De León Aldaco, S.E.; Aguayo Alquicira, J. A Review of Hybrid Renewable Energy Systems: Architectures, Battery Systems, and Optimization Techniques. Eng 2023, 4, 1446–1467. [Google Scholar] [CrossRef]
- Ennemiri, N.; Berrada, A.; Emrani, A.; Abdelmajid, J.; El Mrabet, R. Optimization of an off-grid PV/biogas/battery hybrid energy system for electrification: A case study in a commercial platform in Morocco. Energy Convers. Manag. X 2024, 21, 100508. [Google Scholar] [CrossRef]
- Kelly, E.; Medjo Nouadje, B.A.; Tonsie Djiela, R.H.; Kapen, P.T.; Tchuen, G.; Tchinda, R. Off grid PV/Diesel/Wind/Batteries energy system options for the electrification of isolated regions of Chad. Heliyon 2023, 9, e13906. [Google Scholar] [CrossRef] [PubMed]
- Sakipour, R.; Abdi, H. Optimizing Battery Energy Storage System Data in the Presence of Wind Power Plants: A Comparative Study on Evolutionary Algorithms. Sustainability 2020, 12, 10257. [Google Scholar] [CrossRef]
- Mahesh, A.; Sushnigdha, G. Optimal sizing of photovoltaic/wind/battery hybrid renewable energy system including electric vehicles using improved search space reduction algorithm. J. Energy Storage 2022, 56, 105866. [Google Scholar] [CrossRef]
- Al Afif, R.; Ayed, Y.; Maaitah, O.N. Feasibility and optimal sizing analysis of hybrid renewable energy systems: A case study of Al-Karak, Jordan. Renew. Energy 2023, 204, 229–249. [Google Scholar] [CrossRef]
- Halabi, L.M.; Mekhilef, S.; Olatomiwa, L.; Hazelton, J. Performance analysis of hybrid PV/diesel/battery system using HOMER: A case study Sabah, Malaysia. Energy Convers. Manag. 2017, 144, 322–339. [Google Scholar] [CrossRef]
- Khan, F.A.; Pal, N.; Saeed, S.H.; Yadav, A. Techno-economic and feasibility assessment of standalone solar Photovoltaic/Wind hybrid energy system for various storage techniques and different rural locations in India. Energy Convers. Manag. 2022, 270, 116217. [Google Scholar] [CrossRef]
- Wassie, Y.T.; Ahlgren, E.O. Performance and reliability analysis of an off-grid PV mini-grid system in rural tropical Africa: A case study in southern Ethiopia. Dev. Eng. 2023, 8, 100106. [Google Scholar] [CrossRef]
- El-Sattar, H.A.; Kamel, S.; Hassan, M.H.; Jurado, F. An effective optimization strategy for design of standalone hybrid renewable energy systems. Energy 2022, 260, 124901. [Google Scholar] [CrossRef]
- Wali, S.B.; Hannan, M.A.; Ker, P.J.; Rahman, M.S.A.; Tiong, S.K.; Begum, R.A.; Mahlia, T.I. Techno-economic assessment of a hybrid renewable energy storage system for rural community towards achieving sustainable development goals. Energy Strategy Rev. 2023, 50, 101217. [Google Scholar] [CrossRef]
- Le, T.S.; Nguyen, T.N.; Bui, D.K.; Ngo, T.D. Optimal sizing of renewable energy storage: A techno-economic analysis of hydrogen, battery and hybrid systems considering degradation and seasonal storage. Appl. Energy 2023, 336, 120817. [Google Scholar] [CrossRef]
- Kerboua, A.; Hacene, F.B.; Goosen, M.F.A.; Ribeiro, L.F. Development of technical economic analysis for optimal sizing of a hybrid power system: A case study of an industrial site in Tlemcen Algeria. Results Eng. 2022, 16, 100675. [Google Scholar] [CrossRef]
- Muskan; Kaur Channi, H. Optimal designing of PV-diesel generator-based system using HOMER software. Mater. Today Proc. 2023, in press. [Google Scholar] [CrossRef]
- Agyekum, E.B.; Nutakor, C. Feasibility study and economic analysis of stand-alone hybrid energy system for southern Ghana. Sustain. Energy Technol. Assess. 2020, 39, 100695. [Google Scholar] [CrossRef]
- Salameh, T.; Ghenai, C.; Merabet, A.; Alkasrawi, M. Techno-economical optimization of an integrated stand-alone hybrid solar PV tracking and diesel generator power system in Khorfakkan, United Arab Emirates. Energy 2020, 190, 116475. [Google Scholar] [CrossRef]
- Khan, F.A.; Pal, N.; Saeed, S.H.; Yadav, A. Modelling and techno-economic analysis of standalone SPV/Wind hybrid renewable energy system with lead-acid battery technology for rural applications. J. Energy Storage 2022, 55, 105742. [Google Scholar] [CrossRef]
- Omar, M.A.; Mahmoud, M.M. Improvement Approach for Matching PV-array and Inverter of Grid Connected PV Systems Verified by a Case Study. Int. J. Renew. Energy Dev. 2021, 4, 687–697. [Google Scholar] [CrossRef]
- Omar, M.A.; Mahmoud, M.M. Design and Simulation of a PV System Operating in Grid-Connected and Stand-Alone Modes for Areas of Daily Grid Blackouts. Int. J. Photoenergy 2019, 17, 1–9. [Google Scholar] [CrossRef]
- Gabbar, H.A.; Siddique, A.B. Technical and economic evaluation of nuclear powered hybrid renewable energy system for fast charging station. Energy Convers. Manag. X 2023, 17, 100342. [Google Scholar] [CrossRef]
- Ajlan, A.; Tan, C.W.; Abdilahi, A.M. Assessment of environmental and economic perspectives for renewable-based hybrid power system in Yemen. Renew. Sustain. Energy Rev. 2017, 75, 559–570. [Google Scholar] [CrossRef]
- Ullah, I.; Safdar, M.; Zheng, J.; Severino, A.; Jamal, A. Employing Bibliometric Analysis to Identify the Current State of the Art and Future Prospects of Electric Vehicles. Energies 2023, 5, 2344. [Google Scholar] [CrossRef]
- Ullah, I.; Zheng, J.; Jamal, A.; Zahid, M.; Almoshageh, M.; Safdar, M. Electric vehicles charging infrastructure planning: A review. Int. J. Green Energy 2023, 21, 1–19. [Google Scholar] [CrossRef]
- Jamal, H.; Khan, F.; Lim, H.; Kim, J.H. Restraining Lithium Dendrite Formation in All-Solid-State Li Metal Batteries Via Surface Modification of Ceramic Filler. Sustain. Mater. Technol. 2022, 35, e00548. [Google Scholar] [CrossRef]
- Jahangir, M.H.; Mousavi, S.A.; Vaziri Rad, M.A. A techno-economic comparison of a photovoltaic/thermal organic Rankine cycle with several renewable hybrid systems for a residential area in Rayen, Iran. Energy Convers. Manag. 2019, 195, 244–261. [Google Scholar] [CrossRef]
- Liu, C.; Wang, X.; Wu, X.; Guo, J. Economic scheduling model of microgrid considering the lifetime of batteries. IET Gener. Transm. Distrib. 2017, 11, 759–767. [Google Scholar] [CrossRef]
- Baruah, A.; Basu, M. Modelling of an off-grid roof-top residential photovoltaic nano grid system for an urban locality in India. Energy Sustain. Dev. 2023, 74, 471–498. [Google Scholar] [CrossRef]
- Omar, M.A.; Mahmoud, M.M. Grid connected PV- home systems in Palestine: A review on technical performance, effects and economic feasibility. Renew. Sustain. Energy Rev. 2018, 82, 2490–2497. [Google Scholar] [CrossRef]
- Omar, M.A. Economic evaluation of residential grid connected PV Systems based on Net-Metering and Feed-in-Tariff schemes in Palestine. Int. J. Renew. Energy Res. 2018, 8, 2106–2115. [Google Scholar] [CrossRef]
- Zhao, H.; Zhong, M.; Li, L.; Safdar, M.; Zhang, Z. A Comprehensive Evaluation Method for Planning and Design of Self-Sufficient Wind Power Energy Systems at Ports. Sustainability 2023, 15, 16189. [Google Scholar] [CrossRef]
- Babu, M.K.; Ray, P. Sensitivity analysis, optimal design, cost and energy efficiency study of a hybrid forecast model using HOMER pro. J. Eng. Res. 2023, 11, 100033. [Google Scholar] [CrossRef]


| Authors | Research Title | Technology | Lifetime (Years) |
|---|---|---|---|
| Mahesh et al. [8] | Optimal sizing of PV/wind/battery hybrid renewable energy system including electric vehicles using improved search space reduction algorithm. | Lead acid | 10 |
| Al Afif et al. [9] | Feasibility and optimal sizing analysis of hybrid renewable energy systems: A case study of Al-Karak, Jordan. | Lead acid | 20 |
| Halabi et al. [10] | Performance analysis of hybrid PV/diesel/battery system using HOMER: A case study Sabah, Malaysia. | Lead acid | 7 |
| Khan et al. [11] | Techno-economic and feasibility assessment of standalone solar Photovoltaic/Wind hybrid energy system for various storage techniques and different rural locations in India. | Lead acid | 5 |
| Wassie et al. [12] | Performance and reliability analysis of an off-grid PV mini-grid system in rural tropical Africa: A case study in southern Ethiopia. | lithium-ion | 10 |
| Abd El-Sattar et al. [13] | An effective optimization strategy for design of standalone hybrid renewable energy systems. | Lead acid | 25 |
| Wali et al. [14] | Techno-economic assessment of a hybrid renewable energy storage system for rural community towards achieving sustainable development goals. | Lead acid | 15 |
| Le TS et al. [15] | Optimal sizing of renewable energy storage: A techno-economic analysis of hydrogen, battery and hybrid systems considering degradation and seasonal storage. Applied Energy. | Lead acid | 12 |
| Kerboua et al. [16] | Development of technical economic analysis for optimal sizing of a hybrid power system: A case study of an industrial site in Tlemcen, Algeria. | Lead acid | 6 |
| Channi et al. [17] | Optimal designing of PV–diesel generator-based system using HOMER software. | Lithium ion | 15 |
| Agyekum et al. [18] | Feasibility study and economic analysis of stand-alone hybrid energy system for southern Ghana. | Lead acid | 20 |
| Salameh et al. [19] | Techno-economical optimization of an integrated stand-alone hybrid solar PV tracking and diesel generator power system in Khorfakkan, United Arab Emirates. | Lead acid | 10 |
| Khan et al. [20] | Modelling and techno-economic analysis of standalone SPV/Wind hybrid renewable energy system with lead–acid battery technology for rural applications. | Lead acid | 5 |
| Parameter | Value | Unit |
|---|---|---|
| Energy demand | 24 | kWh/day |
| PV rated power | 4.76 | kWp |
| PV initial cost | 800 | USD/kWp |
| PV replacement cost | 700 | USD/kWp |
| PV life time | 20 | Years |
| Converter cost | 300 | USD/kW |
| Converter efficiency | 95 | % |
| Converter lifetime | 20 | Year |
| Generator cost | 500 | USD/kW |
| Generator replacement | 500 | USD/kW |
| Fuel cost | 1.3 | USD/liter |
| Fuel curve intercept | 0.15 | Liter/hr |
| Fuel curve slope | 0.236 | Liter/hr/kW |
| Project lifetime | 20 | Years |
| Interest rate | 6 | % |
| Capacity (Ah) | Initial Cost (USD) | Replacement Cost (USD) | Maintenance Cost (USD) |
|---|---|---|---|
| 300 | 120 | 120 | 6 |
| 800 | 320 | 320 | 16 |
| 1000 | 400 | 400 | 20 |
| Battery Capacity | PV Energy (kWh/y) | DG Energy (kWh/y) | Renewable Fraction (%) | Fuel/Year (L/y) | Excess Energy (kWh/y) |
|---|---|---|---|---|---|
| 300 Ah | 8073 | 4266 | 51.3 | 1293 | 2401 |
| 800 Ah | 8073 | 2115 | 75.9 | 622 | 139 |
| 1000 Ah | 8073 | 1997 | 77.2 | 585 | 36.1 |
| Battery Energy (kWh) | Throughput Life (kWh) | Annual Throughput (kWh/year) | Service Life (Year) |
|---|---|---|---|
| 0.712 × 24 = 17.08 | 21,862.4 | 4453 | 4.90 |
| 1.92 × 24 = 46.08 | 58,982.4 | 5381 | 10.96 |
| 2.39 × 24 = 57.36 | 73,420.8 | 5380 | 13.64 |
| Battery Rated Capacity (Ah) | Assumed Battery Lifetime | ||
|---|---|---|---|
| (5 Years) | (10 Years) | (20 Years) | |
| 300 Ah | USD 46,169 | USD 42,176 | USD 40,216 |
| 800 Ah | USD 48,912 | USD 38,263 | USD 33,036 |
| 1000 Ah | USD 56,158 | USD 42,847 | USD 36,312 |
| Battery Rated Capacity (Ah) | 5 Years | 10 Years | 20 Years |
|---|---|---|---|
| 300 Ah | USD 3374 | USD 3082 | USD 2939 |
| 800 Ah | USD 3574 | USD 2796 | USD 2414 |
| 1000 Ah | USD 4104 | USD 3131 | USD 2653 |
| Battery Capacity (Ah) | COE (USD/kWh) | Annual Cost (USD/year) | NPC (USD) |
|---|---|---|---|
| 300 Ah | 0.387 | 3386.29 | 46,342 |
| 800 Ah | 0.312 | 2736.56 | 37,450 |
| 1000 Ah | 0.33 | 2895.04 | 39,619 |
Disclaimer/Publisher’s Note: The statements, opinions and data contained in all publications are solely those of the individual author(s) and contributor(s) and not of MDPI and/or the editor(s). MDPI and/or the editor(s) disclaim responsibility for any injury to people or property resulting from any ideas, methods, instructions or products referred to in the content. |
© 2023 by the author. Licensee MDPI, Basel, Switzerland. This article is an open access article distributed under the terms and conditions of the Creative Commons Attribution (CC BY) license (https://creativecommons.org/licenses/by/4.0/).
Share and Cite
Omar, M.A. The Significance of Considering Battery Service-Lifetime for Correctly Sizing Hybrid PV–Diesel Energy Systems. Energies 2024, 17, 103. https://doi.org/10.3390/en17010103
Omar MA. The Significance of Considering Battery Service-Lifetime for Correctly Sizing Hybrid PV–Diesel Energy Systems. Energies. 2024; 17(1):103. https://doi.org/10.3390/en17010103
Chicago/Turabian StyleOmar, Moien A. 2024. "The Significance of Considering Battery Service-Lifetime for Correctly Sizing Hybrid PV–Diesel Energy Systems" Energies 17, no. 1: 103. https://doi.org/10.3390/en17010103
APA StyleOmar, M. A. (2024). The Significance of Considering Battery Service-Lifetime for Correctly Sizing Hybrid PV–Diesel Energy Systems. Energies, 17(1), 103. https://doi.org/10.3390/en17010103