Article

Thermal Performance Optimization Simulation Study of a Passive Solar House with a Light Steel Structure and Phase Change Walls

Department of Military Installations, Army Logistics Academy of PLA, Chongqing 401331, China
*
Author to whom correspondence should be addressed.
Energies 2023, 16(9), 3725; https://doi.org/10.3390/en16093725
Submission received: 22 February 2023 / Revised: 24 April 2023 / Accepted: 25 April 2023 / Published: 26 April 2023
(This article belongs to the Special Issue Energy Efficiency through Building Simulation)

Abstract

:
Phase change materials are used in passive solar house construction with light steel structure walls, which can overcome the problems of weak heat storage capacity and poor utilization of solar heat and effectively solve the thermal defects of light steel structure walls. Based on this, on the basis of preliminary experimental research, this study further carried out theoretical analysis and simulation research on the thermal performance of a light steel structure passive solar house (Trombe form) with PCM walls. Through the heat balance analysis of heat transfer in the heat collecting partition wall, the theoretical calculation formula of the phase change temperature of the PCM was obtained, and it verified theoretically that the phase change temperature value should be 1–3 °C higher than the target indoor air temperature. The evaluation index “accumulated daily indoor temperature offset value” was proposed for evaluating the effect of phase change materials on the indoor temperature of the passive solar house, and “EnergyPlus” software was used to study the influence of the phase change temperature, the amount of material, and the thickness of the insulation layer on the indoor air temperature in a natural day. The results showed that there was a coupling relationship among the performance and between of the thickness of the PCM layer and the phase change temperature. Under typical diurnal climate conditions in the northern Tibetan Plateau of China, the optimal combination of the phase change temperature and the layer thickness was 17 °C and 15 mm, respectively. Especially at a certain temperature, excessive increases in the thickness of the phase transition layer could not improve the indoor thermal environment. For this transition temperature, there exists an optimal transition layer thickness. For a Trombe solar house, the thickness of the insulation layer has an independent impact on indoor temperature compared to other factors, which has an economic value, such as 50 mm in this case. In general, this paper studied the relationship between several important parameters of the phase change wall of a solar house by using numerical simulation methods and quantitatively calculated the optimal parameters under typical meteorological conditions, thus providing a feasible simulation design method for similar engineering applications.

1. Introduction

The vast Qinghai–Tibet Plateau has a unique geographical and climatic environment. In the long winter, the plateau area is unusually cold and lacking in oxygen, which poses a great challenge to human survival. However, due to the needs of national defense, the military is often stationed or temporarily deployed in the plateau desert. The Qinghai–Tibet Plateau is difficult to access, and traditional fossil fuels are scarce and expensive. Because the plateau is rich in solar energy, many scholars have carried out research on the utilization of solar energy in this area [1,2,3]. The key to solar heat utilization is to overcome its periodicity and instability. Therefore, scholars have carried out research on the application of phase change materials (PCMs) in solar heat storage [4,5,6,7]. These studies have shown that energy storage with PCMs is an effective way to utilize renewable energy, and PCMs with suitable physical properties have been continuously developed [8,9]. Some scholars have focused on how to combine PCMs with solar utilization in buildings to achieve energy savings or reduce the stress risk of the internal thermal environment in extreme climates [10,11,12,13,14,15]. As can be seen in these studies, the introduction of PCMs in building structures or heating and air conditioning systems is an important direction of application.
On the other hand, a light steel structure building, as a kind of prefabricated building, has the advantages of modular prefabrication, light weight, convenient transportation, and easy assembly and disassembly, which is especially conducive to the rapid deployment of small forces in the remote and desolate plateau area. However, those buildings usually have poor thermal performance and high heating energy consumption in winter. In order to reduce the energy consumption of lightweight prefabricated buildings, researchers have carried out architectural designs and practices [16,17]. Combining a light steel structure with solar energy utilization, engineers developed a kind of light steel passive solar room with PCM walls. Teddy Gresse et al. carried out research on the application of phase change materials to a solar room or prefabricated temporary house [18,19,20]. Ben Khedher N used numerical simulation methods to study the thermal behavior of a phase change heat storage room and an energy storage system using solid–liquid PCM [21,22]. These studies have shown that the problem of solar discontinuity and the problem of poor thermal performance of light steel construction can be solved by introducing PCM into envelopes so as to improve the thermal comfort of the solar room towards the goal of zero energy consumption [23,24].
Based on this, the paper carried out a simulation study on how a lightweight phase change wall of a passive solar room (Trombe form) improves the indoor thermal environment in winter. Firstly, a physical model of the passive solar room (Trombe form) with a light phase change wall was built in the simulation software, and the correctness of the model was verified through an actual comparison experiment. The accuracy of the simulation was then verified by comparing the simulation results with the measured data. Then, an evaluation index of the effect of the phase change wall on the indoor temperature of the passive solar room was proposed, and the optimal phase change temperature was determined by the analysis of the thermal equilibrium equation in the solar chamber. The researchers used two-factor coupling analysis of the phase transition temperature and layer thickness to determine the best layer thickness. We also simulated the influence of the insulation layer thickness on the indoor temperature fluctuation. The technical path for optimizing the design parameters of the lightweight phase change wall passive solar room was obtained finally.

2. Model Establishment and Validation

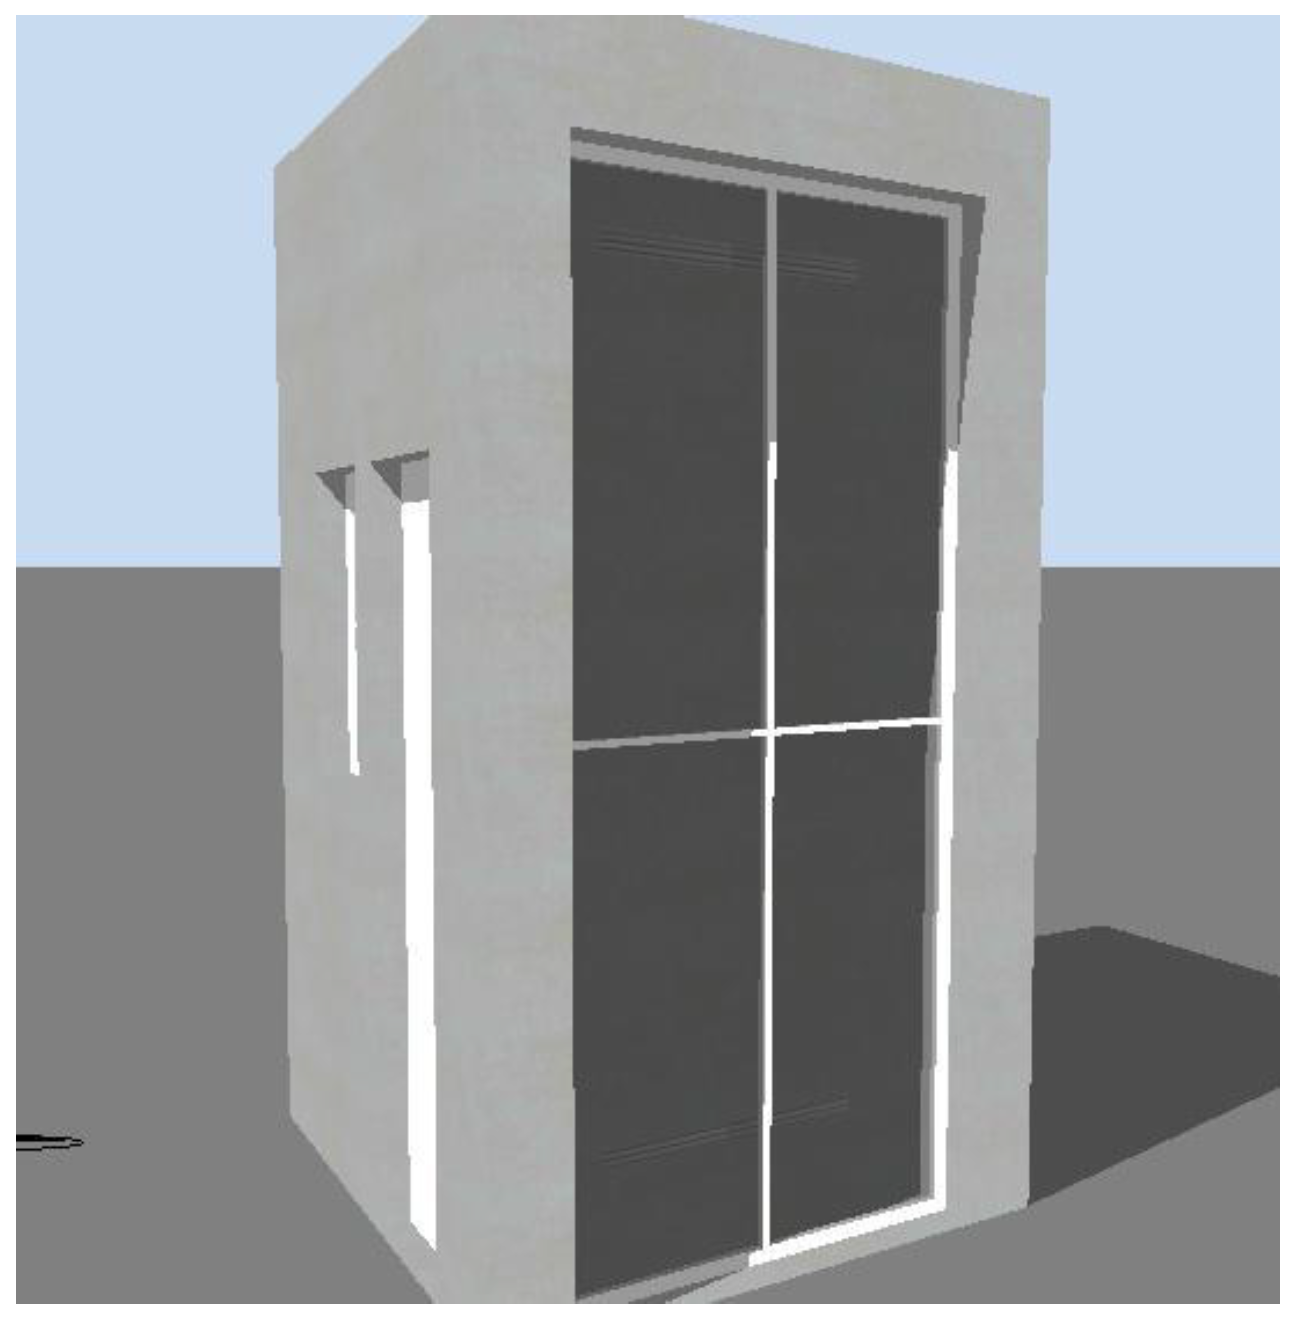
2.1. Building Modelling

Figure 1 shows the basic structure of the passive solar room (Trombe form) with a PCM light wall. The south facade of the solar room is a heat collecting surface, which is composed of transparent glass, an air layer, and a heat collecting–heat storage wall. The heat collection–heat storage wall is composed of a heat absorption coating color steel plate, a thermal insulation layer, a phase change layer, and a color steel plate, respectively, from the outside to the inside. The other envelopes of the solar room (including the roof and the ground) have the same structure as the heat collection–heat storage wall, and the only difference is that there is no heat-absorbing coating on the outer surface. During the day, sunlight shines through the glass to the outer surface of the heat collection wall to heat it up, and the hot surface heats the air in the air layer through convection. During the day, the heat collecting surface coated with heat absorbing material absorbs solar radiation, the surface temperature rises, and the hot surface heats the air in the air layer through convection. At this time, vents are opened in the upper and lower parts of the wall, so the hot air in the air layer enters the heating room from the upper vent through the “chimney effect”, and the colder air in the room enters the air layer through the lower vents, thus forming a continuous air circulation heating process. When the indoor air temperature is higher than the melting temperature, the phase change material begins to store heat and prevent the indoor temperature from becoming too high. At night, the upper and lower vents are closed, and with the decrease of the indoor air temperature, the heat accumulated in the phase change material is slowly released into the room, playing a role in heating.
The simulated passive solar house (Trombe form) with a phase change material light wall is presented in Figure 2.
The specific geometric parameters of the solar room model are as follows:
The three dimensions (length, width, and height) of the building model are 2.0 m × 1.6 m × 2.0 m, respectively. The south-facing envelope is the main heat collecting surface, using the ventilation wall structure. Specifically, the outside of the ventilation wall structure is a glass curtain wall, the inside is a dark heat storage wall, and the middle is an air sandwich with a thickness of 50 mm. As shown in Figure 1, the ventilation holes (two upper and lower holes) are opened in the glass curtain wall 0.25 m away from the roof and the ground, respectively, and the size is 0.6 m × 0.3 m.
The west wall has an outer door (1.5 m × 0.6 m) and an outer window (0.5 m × 1.0 m). The window is in the form of a single-layer window frame and has double glazing. There is an outer window on the east wall, which is exactly the same size and form as the west outer window.

2.2. PCM Preparation and Heat Collection Wall Parameters

2.2.1. PCM Preparation

Self-shaping phase change materials have the characteristics of no packaging, a more mature preparation process, and lower cost, which makes phase change materials more convenient for use in the building envelope. The research team used the sol–gel method to prepare silica/fatty acid composite phase change materials with ethyl orthosilicate (TEOS), anhydrous ethanol, distilled water, and fatty acids as raw materials. The fatty acid components included capric acid (C10), lauric acid (C12), and myristic acid (C14). According to different proportions of fatty acid components, phase change materials were prepared at 12–13 °C, 14–16 °C, 19–21 °C, and 24–26 °C. They were numbered as 13# PCM, 15# PCM, 20# PCM, and 25# PCM, respectively. The thermal conductivity, mass ratio of each component, and other physical properties of the phase change materials are shown in Table 1. The latent heat of phase change ranged from 60 J/g to 70 J/g.

2.2.2. Heat Collection Wall Parameters

According to the heating design parameters, we used 15# PCM in the actual experiment with a phase change temperature range of 14–16 °C and a latent heat range of 60–65 J/g. PCMs were processed into plates with a surface density of 5 kg/m2 and were composite on the inside of the wall. Finally, the materials and thermal parameters of the PCM walls are shown in Table 2.
The other specific parameters of the PCM walls were set as follows:
(1)
The azimuth angle of the south-facing wall was 0°;
(2)
Wall height, H = 3.0 m;
(3)
Wall width, W = 2.0 m;
(4)
Thickness of the heat storage wall, x = 0.11 m;
(5)
Solar radiation absorption rate on the surface of the heat collecting wall, a = 0.9;
(6)
Solar radiation emit rate on the surface of the heat collecting wall, em = 0.9;
(7)
The emissivity of the glass cover, eg = 0.9;
(8)
Transmission rate of the glass cover layer, τ = 0.8;
(9)
The thickness of the air interlayer layer, D = 0.05 m;
(10)
Size of the upper vent, A = 0.3 m × 0.06 m = 0.018 m2;
(11)
Spacing of air vents, h = 2.5 m;
(12)
A single layer of the glass cover layer was used.

2.3. Convection Heat Transfer Coefficient and Sky Background Temperature

In high altitude areas, the convection heat transfer coefficients of the heat collection surface and the internal and external surfaces of the envelope structure mainly decrease with the decrease of the air density. The convection heat transfer coefficients used in the simulation were determined by the measured surface temperature, wind speed, and relevant empirical formulas [25,26,27]. Similarly, due to the long-wave radiation heat transfer between the envelope and the sky, we could obtain the background temperature of the sky during the simulation period through meteorological data and empirical formulas [28].

2.4. Modelling Verification

EnergyPlus Software is widely used for simulation calculations of building indoor heat and humidity environments, and it has the advantages of high simulation accuracy and good applicability in phase change wall building simulations [29,30,31,32]. The passive solar house (Trombe) simulation model is shown in Figure 3.
The mathematical model of a building thermal process simulation based on EnergyPlus software usually consists of two parts: one is to establish a mathematical physical model describing the dynamic heat transfer process of building envelope; the second is to establish the indoor air heat balance equation describing the dynamic heat transfer process of the whole room. Considering the heat transfer characteristics of the phase change wall, the following assumptions were made to simplify the calculation:
(1)
Heat transfer was considered only in the direction of the wall thickness;
(2)
The phase change material in the solid and liquid regions were considered according to the constant physical properties;
(3)
The natural convection during melting and the supercooling effect during solidification were ignored;
(4)
The heat capacity of glass was ignored when calculating the heat transfer of glass;
(5)
The influence of indoor equipment on the indoor temperature was ignored in the calculation of room heat balance.

2.4.1. Boundary Conditions

(1)
The boundary conditions of the inner and outer surfaces of the wall were as follows:
h W , i n T i n T W , i n + q r , i n = k W T x x = L
h W , o u t T o u t T W , o u t + q r , o u t = k W T x x = 0
where qr,in and qr,out are indoor and external radiant heat flow, respectively; qr,in mainly refers to the mutual radiation of indoor heat sources such as lighting, human heat dissipation, and the inner surface of the enclosure structure, while qr,out refers to solar radiation, sky long-wave radiation, and earth long-wave radiation. The surface convective heat transfer coefficient was selected according to the above.
The boundary conditions of the south wall were as follows:
Interior   side :   λ s A s T s i x x = l = j ( T j T s i ) / R j s i + S s i + h i T i n T s i
Outdoor   side :   λ s A s T s o x x = 0 = h r , s o A s ( T s o T s k y ) + h s o a A s ( T s T o a ) + S s o
where λ is the thermal conductivity of the wall; subscript s represents the south wall; A is the surface area of the south wall; h r , s o is the radiant heat transfer coefficient between the south wall and the sky; h s o a is the convective heat transfer coefficient between the exterior surface of the south wall and the outdoor air; T s k y is the sky temperature. R j s i is the radiant thermal resistance between surfaces, and S s o is the solar radiation absorbed by each node. The boundary conditions of walls, roofs, and floors in other directions were similar.
(2)
The air outlet of the passive solar house (Trombe) was mainly located at the upper part of the wall. The boundary velocity u and temperature T of the air supply outlet were the field-measured data.
(3)
The underground heat transfer part of the building is a complicated three-dimensional heat transfer process. In order to simplify the calculation, it was simplified into a one-dimensional heat transfer process. Firstly, the steady-state heat transfer resistance of the ground was calculated by the traditional zonal method. Then, according to the principle of equal total thermal resistance, the thickness of the floor structure layer, the insulation layer, and soil layer was taken, and the outdoor monthly average temperature at the outer boundary of soil layer was taken.

2.4.2. Initial Conditions

In order to study the dynamic thermal performance of the light wall with phase change, the fluctuation of indoor and outdoor air temperature and surface radiation must be given first. In a passive solar house without an auxiliary heat source, the indoor temperature fluctuates throughout the day in a period of 24 h and approximately presents simple harmonic changes. Therefore, in order to simplify the analysis, according to the indoor temperature change during the 15# PCM test, the maximum indoor temperature was set at 25 °C, the minimum temperature was 5 °C, the temperature change amplitude was determined to be 15.0, and the maximum temperature occurred at 14:00; then the initial indoor temperature was calculated as follows:
T i n = 12 + 15.0 cos π τ 14 12

2.4.3. Verification

In order to verify the accuracy of the numerical simulation model, the researchers built two passive solar rooms of the same size in Trombe form in Xining city as the measured buildings in the early stage. One was an ordinary experimental room for comparison, and the other was a PCM experimental room with phase change material in the envelope structure. These two solar rooms had exactly the same 3D dimensions and geometric characteristics as the simulation model (Figure 4).
We used the measured outdoor meteorological parameters as the boundary conditions to simulate the indoor temperature in the software, compare the model simulation data with the test data, and carry out the validity verification of the model. Figure 5 is a comparison diagram of the simulated and testing values of the indoor temperature in the passive solar room.
As can be seen in Figure 5, the peak moment of the simulated calculation curve was slightly delayed compared to that of the measured curve. Especially between 10:30 and 13:00, the simulated indoor temperature was lower than the measured value. The existence of an air gap formed the contact thermal resistance, which affected the phase-change material’s ability to absorb the heat of indoor air in time and made the measured indoor temperature higher than the ideal condition. After 18:00, the simulated indoor temperature was slightly higher than the measured temperature. After analysis, one of the causes of the deviation was determined to be the large temperature difference between indoors and outdoors at night, as well as the increase in outdoor wind speed, which increased the infiltration of cold air through the gaps in doors and windows. In addition, the measurement accuracy of the instrument itself, and the failure of the computational model to accurately reflect some random factors in the experiment would have led to some error. These random factors included the air leakage coefficient of the building and the changes of glass characteristics caused by different solar incidence angles. Although there was some deviation, after comparison, it was found that the simulated value of the indoor air temperature in the solar room agreed well with the test value, and the change trend of the simulated value was basically consistent with the measured value. This shows that the model and the software could simulate the heat transfer process of the solar room phase change well and predict the indoor air temperature of the solar room accurately.

3. Evaluation Index of Indoor Temperature Fluctuation and the Optimal Phase Change Temperature

3.1. Evaluation Index of Indoor Temperature Fluctuation

In order to evaluate the role of the phase change temperature, the phase change layer thickness, the thermal insulation layer thickness, and other factors in improving indoor thermal performance, the “accumulative daily indoor temperature offset value” ( I EX ) was proposed as the index to identify the influence of the PCM on the thermal performance and the indoor temperature fluctuation. The proposal of this index was based on both the heat-storage and discharge characteristics of PCM and the energy utilization mechanism of the passive solar house, as presented in Formula (6):
I EX = Δ T = t = i j ( T d a y T ¯ i n d o o r ) 2 + t = j + 1 i 1 ( T n i g h t T ¯ i n d o o r ) 2
T ¯ i n d o o r —hourly average indoor temperature in °C;
Tday—indoor design temperature for heating in daytime;
Tnight—indoor design temperature for heating at night;
t—time;
i—the moment in the morning when PCM begins heat storage;
j—the moment at nightfall when PCM ends heat storage.
The first item on the right side of the equation is the accumulative deviation between the indoor temperature and the design temperature in the heat storage process of PCM (from i to j). This heat storage process contains main heat storage process from time i to the moment when solar radiation disappears and the subsequent secondary heat storage process until time j. Note that even when solar radiation disappears, the PCM will continue to store heat for a while due to high indoor temperatures.
On the whole, the smaller the first value is on the right side, the more the light steel phase change heat storage wall fully utilizes the solar energy. At the same time, the design of the solar room also provides the heat required for the heat absorption of the PCM. Secondly, the smaller the value of the first item is on the right side, the greater the variation of the indoor temperature is controlled, and the indoor temperature is at a reasonable level. In other words, according to the design requirements, the amount of PCM, phase change temperature, insulation material thickness, and other influencing factors are more reasonable, the PCM heat storage is more sufficient, and the passive solar house PCM wall has a good degree of solar radiation heat utilization.
The second term on the right side of the equation represents the process of solidification and heat release of the PCM from time j + 1 to i − 1. The smaller the value, the better the heat release effect of the light steel phase change wall at night. The PCM wall releases the heat stored during the daytime, reduces the deviation between the actual indoor temperature and the design temperature, and ensures indoor thermal comfort at night.
The square and open square in Formula (6) are designed to ensure that the data do not cancel each other during the operation process. Based on the above analysis, under the outdoor meteorological parameters with a 24 h fluctuation period, a small value of IEX indicates that the heat storage of the PCM is basically equal to the heat release, and the efficiency of the phase change material is fully utilized. At this time, the phase change temperature, material thickness, and solar room structure parameters are reasonable. In the formula, indoor temperature, Tday and Tnight, can be valued according to different scenarios, as well as different periods of the day and specification requirements.
This paper mainly focuses on the thermal performance and optimization design of distributed mobile rooms and passive solar houses with phase change light walls. For this kind of application scenario, referring to the relevant specifications of field housing space and environmental parameter limits, the indoor temperature that prevents freezing at night (Tnight) is 5 °C, and the indoor temperature that meets the minimum thermal comfort requirements of personnel during the daytime (Tday) is 16 °C. At this point, Formula (6) can be embodied into Formula (7), and the paper will carry out the analysis of the influencing factors according to this evaluation index.
I EX = Δ T = t = 9 21 ( 16 T ¯ i n d o o r ) 2 + t = 22 8 ( 5 T ¯ i n d o o r ) 2

3.2. Theoretical Analysis of the Optimal Phase Transition Temperature

According to the working process of the phase change heat storage wall, the phase change temperature should be determined by considering the local solar radiation level and design indoor air temperature. The appropriate phase change temperature allows the phase change material to achieve thermal equilibrium in a heat storage and release period. In other words, the phase change wall fully absorbs the solar radiant heat during the day and releases the heat stored in the room at night to maintain the appropriate indoor air temperature. The purpose of phase change temperature optimization is to find this adapted phase change temperature.
The phase change materials, as the heat storage function layer, are laid on the inner side of the outer wall and on both sides of the southward heat collection wall. Therefore, the middle of the heat collecting wall can be considered as an adiabatic state. In order to simplify the calculation, ignoring the heat storage of the insulation layer and the steel plate, the heat balance equation of the inner half of the heat collection wall can be obtained [33]:
ρ P C M L P C M d H d τ = h i n T i n T m + q r
In Equation (3),
ρPCM—density of the phase change materials in kg/m3.
LPCM—thickness of inner PCM layer in m.
H—the enthalpy of the phase change materials (J/kg·K);
τ—time in s;
hin—convection heat exchange coefficient of the inner surface in W/(m2·K);
Tin—indoor air temperature in °C;
Tm—phase change temperature of PCM in °C;
qr—solar radiative heat received on the inner surface (mainly through windows) in W/m2.
The heat absorption of the phase change material in a 24 h cycle is
Q 1 = h i n A 0 P T i n T m + d τ + 0 P q r d τ
The above ”+” means integrating when TinTm > 0.
The heat release of the phase change material in a 24 h cycle is
Q 2 = h i n A 0 P T m T i n + d τ
Under periodically varying boundary conditions, the ideal case is that the heat stored by the phase change material during the day is equal to the heat released at night, i.e.,
  Q 1 = Q 2  
After a full periodicity, the specific enthalpy of the phase change material is unchanged. We found the derivative of time from both sides of Equation (6) to obtain the calculation formula of the optimal phase change temperature as
T m , o p t = T i n ¯ + 1 2 A h i n q r ¯
In Formula (12), q r ¯ = P q r d τ P , P is a full cycle, that is, 24 h.
Formula (12) shows that the optimal phase change temperature of the phase change material is equal to the average indoor temperature plus the equivalent radiation temperature of the inner surface. Referring to the concept of outdoor air comprehensive temperature, Formula (12) can be defined as the integrated temperature of the inner surface of the phase change wall. This formula explains the results of previous numerical simulations of phase change wall rooms, that is, the optimal phase change temperature is 1–3 °C higher than the average indoor temperature [34,35].
According to China’s national standard “Code for Design of Heating Ventilation and Air Regulation in Civil Buildings”, combined with the characteristics and uses of solar rooms, the interior design temperature of the solar room was selected as 16 °C, and the optimal phase change temperature was determined to be 17 °C.

4. Optimization Analysis of Phase Change Wall Based on Indoor Temperature Deviation

4.1. Simulated Conditions

The specific simulation working conditions are shown as follows:
(1)
Range of PCM layer thickness: 5 mm to 40 mm.
(2)
According to the binary and ternary blending theory, the research group formulated seven phase change materials with different phase change temperature intervals. From low to high, the phase change temperature interval was divided into the following: 12 °C to 13 °C, 14 to 15 °C, 16 to 17 °C, 18 to 19 °C, 20 to 21 °C, 22 to 23 °C, and 24 to 25 °C.
(3)
According to the experimental measurements, some physical parameters of the formulated phase change materials were obtained, in which the latent heat of the PCMs was between 60 J/g and 80 J/g, the heat capacity of the phase change materials with different phase change temperatures varied by at most 3000 J/kg, and the density was in the range of 1050–1100 kg/m3. The physical indexes of the above phase change materials were used as simulation parameters of the input software.
(4)
The insulation material was EPS insulation board, and its thermal conductivity was 0.48 W/m °C. The thickness of the insulation layer increased from 20 mm to 100 mm with a step size of 10 mm, and a 50 mm initial simulation thickness was selected.
(5)
The measured meteorological data of Xining city, Qinghai Province, China in January were used as the simulated meteorological parameters.

4.2. Two-Factor Coupling Analysis of PCM Temperature and PCM Layer Thickness

The amount of heat stored in the phase change layer is closely related to the phase change temperature and the thickness of the phase change material layer. Therefore, we conducted a two-factor simulation analysis of the phase transition temperature and layer thickness to determine how the phase transition temperature and layer thickness jointly affect the indoor temperature fluctuation.
Table 3 shows the two-factor simulation results of the phase change temperature and the phase change layer thickness. The value of the phase transition temperature is shown as an example below.
In Table 3, we show the results of IEX values less than 34 in italics; that is, these values show that the indoor temperature fluctuation was small, and the corresponding phase change parameters were reasonably configured. It can be observed that at the phase change temperature of 17 °C, the IEX values corresponded to the smallest or near the minimum. The simulation coincides with the theoretical analysis of the optimal phase change temperature in Section 3.
With the rise of the phase transition temperature, the corresponding optimal phase change layer thickness showed a decreasing trend. For example, when the phase change temperature was 15 °C, the corresponding optimal phase change layer thickness was 15 mm, while when the phase change temperature was 25 °C, the corresponding optimal phase change layer thickness was 11 mm. The reason for this trend is that with the increase of the phase change temperature, the phase change latent heat also increased, so the amount of phase change material needed was reduced. Another significant trend is that when the phase transition layer thickness was greater than 15 mm, the IEX values increased rapidly at all phase transition temperatures. This means that with the increase of the amount of phase change materials, the room temperature fluctuation intensified, and the indoor thermal environment became harsh. The following focuses on the causes of this problem and determines the optimal phase transition thickness.
According to a relevant paper [36], the time required for the heat to penetrate into the phase transition material can be estimated by Formula (13) as follows:
τ p = ( L / 2 ) 2 α
In Formula (13), α is thermal diffusivity, L is the thickness of the phase change material layer, and τp is the transient heat infiltration time.
According to this formula, in the heat storage–heat release process of 24 h, when the thickness of the PCM layer is thin, the corresponding transient heat infiltration time (τp) is also shorter, and τp increases with the thickness of the PCM layer (L), while the heat storage increases accordingly. Conversely, when a thicker PCM layer is used, the time required for the heat to fully penetrate into the PCM layer is longer than the effective heat storage time provided by the natural solar radiation. At this point, some of the central phase change materials cannot effectively store heat but will weaken the process of heat release at night. According to the above analysis, there must be an optimal thickness (Lopti). Theoretically, the transient heat infiltration time (τp) corresponding to the optimal thickness is exactly equal to the sum of the sunshine time and the length of time that the indoor air temperature is above the phase transition temperature after sunset. At this point, the thickness of the phase change material can be used to reach the maximum heat storage.
Figure 6 shows the relationship curve of the “accumulative daily indoor temperature offset value (IEX)” and the thickness of the PCM layer when the phase change temperature was set at 17 °C. From the figure, the optimal thickness was 15 mm.

4.3. Impact Analysis of Thermal Insulation Thickness

Keeping the other simulation conditions unchanged, we set the insulation layer thickness in the model starting from 20 mm and increased it by 10 mm until 100 mm. Then, we conducted a simulation analysis of the effect of the insulation layer thickness on the “accumulative daily indoor temperature offset value (IEX)”. The simulation results are shown in Table 4 and Figure 7. The third row in Table 4 indicates the change of IEX with the unit thickness of the insulation layer.
From Figure 7, we can intuitively obtain the influence law of the change of the insulation layer thickness on the “accumulative daily indoor temperature offset value (IEX)”. At the beginning, IEX decreases with the increase of the insulation material thickness. IEX reaches the lowest value when the insulation layer thickness increases to 50 mm. After that, with the increase of the thickness of the insulation material, the value of IEX increases instead. After analysis, we believe that when the insulation layer is thin, the insulation effect is poor, and the heat loss of the solar room through the envelope at night increases, thus causing an increase in the value of IEX. The thicker insulation layer, on the other hand, will further prevent the penetration of the solar radiation heat absorbed by the outer surface of the envelope into the phase change layer (although this portion of heat is very small), thus slightly reducing the heat storage and eventually causing IEX to become slightly larger. According to the above analysis, 50 mm is selected as the best insulation layer thickness from the perspective of actual effect and construction cost.

5. Conclusions

In areas with abundant solar radiation in winter, phase change materials are applied to the envelope structure of passive solar rooms, which can effectively use the solar radiation heat for indoor heating and maintain the indoor temperature throughout the day. This technology has an important application value for improving the indoor thermal environment of such buildings in remote areas with difficult energy supply, and for improving the work and life quality of personnel. Based on the study, the following conclusions can be drawn to guide the design application of this technology.
(1)
According to the thermal characteristics of a light steel structure solar room and the heat storage and heat release characteristics of phase change materials, the experiment and simulation study were conducted on the passive solar room using a phase change wall as the envelope structure (Trombe form). The research group put forward the concept of “accumulative daily indoor temperature offset value (IEX)” as an evaluation index to represent the influence of the phase change wall on the thermal performance of the solar room and indoor temperature fluctuation.
(2)
For the light passive solar room (Trombe form) with PCM walls, the phase change temperature can be determined according to the indoor design temperature plus 1–3 °C, and the cumulative deviation between the indoor air temperature and the design temperature is the minimum. After the phase transition temperature is determined, there is also a corresponding optimal PCM layer thickness, and the thickness of the phase change layer should not exceed 15 mm. In addition, the cumulative deviation will be affected by the following factors: the shape coefficient, the ratio of the heat collecting wall area to solar room volume, and the ratio of the window area to the wall area. When these building parameters differ greatly from the model in the paper, the method in the paper should be used to determine the reasonable phase change temperature and layer thickness rather than simply applying the specific values in the above conclusion.
(3)
Under certain outdoor climate conditions, for the light phase change wall passive solar room (Trombe form), the thickness of the insulation layer of the envelope structure has an optimized value. From the perspective of the actual effect, construction costs, and construction convenience, a reasonable insulation layer thickness can be determined by the relationship curve of insulation material thickness and IEX.
Through the simulation analysis, the optimization technical scheme of a light phase change wall passive solar house in the Xining area was obtained. By selecting the corresponding phase change temperature and thickness of PCM with “IEX” less than 34 in Table 3, it can be concluded that the suitable phase change temperature range is 15–23 °C, and the layer thickness of the PCM should be about 10–15 mm. Moreover, according to the simulation results of Table 4, it can be determined that the thickness of the thermal insulation material should be 50–100 mm. Based on the above optimization simulation results, the optimal phase change temperature was determined to be 17 °C, the thickness of the phase change material was 15 mm, and the thickness of insulation material was 50 mm.

Author Contributions

Conceptualization and formal analysis, C.Z. and L.C.; Testing on site, S.L. and H.Z.; Simulation, G.H. and F.G.; Project administration, S.L.; Writing—original draft, L.C.; Writing—review and editing, N.X. and S.H. All authors have read and agreed to the published version of the manuscript.

Funding

This research was funded by the Science and Technology Research Program of Chongqing Municipal Education Commission grant number KJZD-K202112902, the Project of Chongqing Natural Science Foundation grant number cst2020jcyj-msxmX0372, and the Graduate Joint training Base of Army Logistics Academy and Chongqing Midea General Refrigeration Equipment Co., Ltd. grant number Chongqing Educational Development (2019) no. 12.

Data Availability Statement

No new data were created or analyzed in this study. Data sharing is not applicable to this article.

Conflicts of Interest

The authors declare no conflict of interest.

References

  1. Fang, Y.; Wei, Y. Climate change adaptation on the Qinghai–Tibetan Plateau: The importance of solar energy utilization for rural household. Renew. Sustain. Energy Rev. 2013, 18, 508–518. [Google Scholar] [CrossRef]
  2. Zhang, R.; Wang, D.; Liu, Y.; Chen, Y.; Fan, J.; Song, C.; Wang, Y. Economic optimization of auxiliary heat source for centralized solar district heating system in Tibetan Plateau, China. Energy Convers. Manag. 2021, 243, 114385. [Google Scholar] [CrossRef]
  3. Yu, T.; Liu, B.; Lei, B.; Yuan, Y.; Bi, H.; Zhang, Z. Thermal performance of a heating system combining solar air collector with hollow ventilated interior wall in residential buildings on Tibetan Plateau. Energy 2019, 182, 93–109. [Google Scholar] [CrossRef]
  4. Gürbüz, H.; Demirtürk, S.; Akçay, H.; Topalcı, Ü. Experimental investigation on electrical power and thermal energy storage performance of a solar hybrid PV/T-PCM energy conversion system. J. Build. Eng. 2023, 69, 106271. [Google Scholar] [CrossRef]
  5. Vigneswaran, V.S.; Kumaresan, G.; Dinakar, B.V.; Kamal, K.K.; Velraj, R. Augmenting the productivity of solar still using multiple PCMs as heat energy storage. J. Energy Storage 2019, 26, 101019. [Google Scholar] [CrossRef]
  6. Raul, A.; Jain, M.; Gaikwad, S.; Saha, S.K. Modelling and experimental study of latent heat thermal energy storage with encapsulated PCMs for solar thermal applications. Appl. Therm. Eng. 2018, 143, 415–428. [Google Scholar] [CrossRef]
  7. Gu, H.; Chen, Y.; Yao, X.; Huang, L.; Zou, D. Review on heat pump (HP) coupled with phase change material (PCM) for thermal energy storage. Chem. Eng. J. 2023, 455, 140701. [Google Scholar] [CrossRef]
  8. Nazir, H.; Batool, M.; Osorio, F.J.B.; Isaza-Ruiz, M.; Xu, X.; Vignarooban, K.; Phelan, P.; Inamuddin; Kannan, A.M. Recent developments in phase change materials for energy storage applications: A review. Int. J. Heat Mass Transf. 2019, 129, 491–523. [Google Scholar] [CrossRef]
  9. Ahmed, S.F.; Khalid, M.; Rashmi, W.; Chan, A.; Shahbaz, K. Recent progress in solar thermal energy storage using nanomaterials, Renew. Sustain. Energy Rev. 2017, 67, 450–460. [Google Scholar] [CrossRef]
  10. Parfait Tatsidjodoung, Nolwenn Le Pierrès, Lingai Luo, A review of potential materials for thermal energy storage in building applications, Renew. Sustain. Energy Rev. 2013, 18, 327–349. [CrossRef]
  11. Kenisarin, M.; Mahkamov, K. Passive thermal control in residential buildings using phase change materials, Renew. Sustain. Energy Rev. 2016, 55, 371–398. [Google Scholar] [CrossRef]
  12. Rodriguez-Ubinas, E.; Ruiz-Valero, L.; Vega, S.; Neila, J. Applications of phase change material in highly energy-efficient houses. Energy Build. 2012, 50, 49–62. [Google Scholar] [CrossRef]
  13. Sharifi, N.P.; Shaikh, A.A.N.; Sakulich, A.R. Application of phase change materials in gypsum boards to meet building energy conservation goals. Energy Build. 2017, 138, 455–467. [Google Scholar] [CrossRef]
  14. Ma, Z.; Lin, W.; Sohel, M.I. Nano-enhanced phase change materials for improved building performance, Renew. Sustain. Energy Rev. 2016, 58, 1256–1268. [Google Scholar] [CrossRef]
  15. Hatamleh, R.I.; Abu-Hamdeh, N.H.; Bantan, R.A.R. Integration of a solar air heater to a building equipped with PCM to reduce the energy demand. J. Build. Eng. 2022, 48, 103948. [Google Scholar] [CrossRef]
  16. Wang, J.; Han, X.; Mao, J.; Li, W. Design and practice of prefabricated zero energy building in cold plateau area. Energy Build. 2021, 251, 111332. [Google Scholar] [CrossRef]
  17. Jiang, W.; Zhang, K.; Ma, L.; Liu, B.; Li, Q.; Li, D.; Qi, H.; Liu, Y. Energy-saving retrofits of prefabricated house roof in severe cold area. Energy 2022, 254, 124455. [Google Scholar] [CrossRef]
  18. Gresse, T.; Merlier, L.; Roux, J.-J.; Kuznik, F. Three-dimensional and high-resolution building energy simulation applied to phase change materials in a passive solar room. Energy Build. 2022, 274, 112418. [Google Scholar] [CrossRef]
  19. Jiang, F.; Wang, X.; Zhang, Y. A new method to estimate optimal phase change material characteristics in a passive solar room. Energy Convers. Manag. 2011, 52, 2437–2441. [Google Scholar] [CrossRef]
  20. Ye, R.; Wang, J.; Jiang, H.; Xie, N. Numerical study on thermal comfort and energy-saving potential of a prefabricated temporary house integrated with composite phase change materials. Energy Build. 2022, 268, 112169. [Google Scholar] [CrossRef]
  21. Ben Khedher, N. Numerical Study of the Thermal Behavior of a Composite Phase Change Material (PCM) Room. Eng. Technol. Appl. Sci. Res. 2018, 8, 2663–2667. [Google Scholar] [CrossRef]
  22. Khedher, N.B.; Nasrallah, S.B. Three-Dimensional Simulation of a Porous Thermal Energy Storage System Using Solid-Liquid Phase Change Material. J. Porous Media 2011, 14, 777–790. [Google Scholar] [CrossRef]
  23. Ramakrishnan, S.; Wang, X.; Sanjayan, J.; Wilson, J. Thermal performance of buildings integrated with phase change materials to reduce heat stress risks during extreme heatwave events. Appl. Energy 2017, 194, 410–421. [Google Scholar] [CrossRef]
  24. Amin, M.; Putra, N.; Kosasih, E.A.; Prawiro, E.; Luanto, R.A.; Mahlia, T.M.I. Thermal properties of beeswax/graphene phase change material as energy storage for building applications. Appl. Therm. Eng. 2017, 112, 273–280. [Google Scholar] [CrossRef]
  25. Zhang, X.; Ren, Z.; Mei, F. Heat Transfer Theory, 4th ed.; China Architecture Publishing & Media Co., Ltd.: Beijing, China, 2003. [Google Scholar]
  26. Chen, Q. The Foundation of Architectural Thermophysics; Xi’an Jiaotong University Press: Xi’an, China, 1991. [Google Scholar]
  27. Hagisima, A.; Field, T.J. measurements for estimating the convective heat transfer coefficient at building surfaces. Build. Environ. 2003, 38, 873–881. [Google Scholar] [CrossRef]
  28. Zhou, Y. Atmospheric Thermal Radiation and Effective Sky Temperature on the Tibetan Plateau. J. Sol. Energy 1984, 5, 232–241. [Google Scholar]
  29. Al-Janabi, A.; Kavgic, M. Application and sensitivity analysis of the phase change material hysteresis method in EnergyPlus: A case study. Appl. Therm. Eng. 2019, 162, 114222. [Google Scholar] [CrossRef]
  30. Marin, P.; Saffari, M.; de Gracia, A.; Zhu, X.; Farid, M.M.; Cabeza, L.F.; Ushak, S. Energy savings due to the use of PCM for relocatable lightweight buildings passive heating and cooling in different weather conditions. Energy Build 2016, 129, 274–283. [Google Scholar] [CrossRef]
  31. Devaux, P.; Farid, M.M. Benefits of PCM underfloor heating with PCM wallboards for space heating in winter. Appl. Energy 2017, 191, 593–602. [Google Scholar] [CrossRef]
  32. Memarian, S.; Mohammad, B.; Fayaz, R.; Asadi, S. Energy & Buildings Single and combined phase change materials: Their effect on seasonal transition period. Energy Build. 2018, 169, 453–472. [Google Scholar]
  33. Wei, X.W. Research on Direct Benefit Solar Energy Heating in Remote Areas of Southwest Tibet. Ph.D. Thesis, Tsinghua University, Beijing, China, 2010. (In Chinese). [Google Scholar]
  34. Zhang, Y.P.; Xu, X.; Di, H.F.; Lin, K.; Yang, R. Experimental Study on the Thermal Performance of the Shape-Stabilized Phase Change Material Floor Used in Passive Solar Buildings. J. Sol. Energy Eng. Trans. ASME 2006, 128, 255. [Google Scholar] [CrossRef]
  35. Peippo, K.; Kauranen, P.; Lund, P.D. A multicomponent PCM wall optimized for passive solar heating. Energy Build. 1991, 17, 259–270. [Google Scholar] [CrossRef]
  36. Bejan, A. Convection Heat Transfer, 4th ed.; John Wiley and Sons Press: Hoboken, NJ, USA, 2013. [Google Scholar]
Figure 1. Structural diagram of a passive solar room (Trombe) with a PCM light wall.
Energies 16 03725 g001
Figure 2. Schematic of the house dimensions and frame.
Energies 16 03725 g002
Figure 3. Simulation model of passive solar room.
Energies 16 03725 g003
Figure 4. Passive solar rooms for actual testing.
Energies 16 03725 g004
Figure 5. Simulated values and test values of indoor air temperature in the passive solar room of the light phase change wall.
Energies 16 03725 g005
Figure 6. Variety curves of IEX and phase change thickness.
Energies 16 03725 g006
Figure 7. Variety curves of IEX with the insulation material thickness.
Energies 16 03725 g007
Table 1. Thermal properties of PCM.
NumberConductivity (W/m·K)Density (kg/m3)Component Mass (g)PCT (°C)
Capric AcidLauric AcidMyristic Acid
13#0.3110501201004512–13 °C
15#0.3111001201004714–16 °C
20#0.3311501201005019–21 °C
25#0.3411001101005024–26 °C
Table 2. Wall composition materials and thermal parameters.
ParametersUnitOuter Steel PlateEPS PlatePCMInner Steel Plate
Conductivityw/(m·K)49.90.0420.3149.9
Thicknessmm0.5100100.5
Thermal resistancem2·K/w0.000012.380.0330.00001
Heat storage coefficientw/m2·K112.20.3624.82112.2
Heat inertness index-0.0010.860.820.001
Table 3. “Accumulated daily indoor temperature offset value” of different values of phase-change temperature and thickness—IEX (°C).
Thickness
mm
Phase Change Temperature (°C)
13151720212325
554.0753.1954.0453.9453.4854.8553.44
743.8445.1843.0444.3544.5843.5843.18
937.5536.8535.1436.8834.9536.0735.28
1034.0034.6433.7133.1935.5133.5235.18
1134.1334.3233.8233.4434.5634.7732.88
1332.8932.5732.8134.6732.4532.8234.08
1534.2431.8931.3734.2634.5534.2834.73
1752.2052.5849.0853.6252.2351.5351.81
1952.4052.3550.0852.4650.2151.1950.76
2053.7853.5851.3351.0650.8353.7753.28
2152.5252.7951.7454.5452.4551.4252.53
2561.2761.4060.6161.8861.9461.9961.05
3062.5263.3262.1462.8864.3662.8462.69
4073.3574.8571.0871.7271.1870.7868.74
Italics/bolds in the table is considered to be superior (i.e., IEX is less than 34).
Table 4. Accumulative daily indoor temperature offset value (IEX) for different insulation layer thickness.
Thermal Insulation Thickness (h, mm)2030405060708090100
IEX (°C) 33.3532.0632.1931.3731.7333.8635.6334.6536.57
|∆IEX/∆h| 0.0340.040.030.010.070.050.030.05
Disclaimer/Publisher’s Note: The statements, opinions and data contained in all publications are solely those of the individual author(s) and contributor(s) and not of MDPI and/or the editor(s). MDPI and/or the editor(s) disclaim responsibility for any injury to people or property resulting from any ideas, methods, instructions or products referred to in the content.

