Abstract
The energy stored in fossil fuels is released through combustion and is a fundamental process in the production of cement. The negative aspect of this combustion is the emission of greenhouse gases and dust. This paper presents the results of a study conducted within a cement plant in Ożarów (south-eastern Poland). The chemical properties (selected elements) in the needles of Scots pine (Pinus sylvestris L.) were determined. The needle surface was scanned using a scanning electron microscope (SEM) and was characterised in terms of chemical composition through energy dispersive spectroscopy (EDS). The concentrations of selected analytes in the biennial needles formed the following descending sequence: Fe > Al > Mn > Zn > Cu > Pb > Cr > Ni. SEM/EDS microphotographs showed the presence of particles of varying shape, size and chemical composition indicative of anthropogenic origin.
1. Introduction
Ambient air quality is a serious problem in many parts of the world [1]. It has both an environmental and a social aspect. It translates into reduced living conditions and is a limiting factor for further development [2,3]. Local and remote emissions can be transported over considerable distances, causing regional risks of drastically poor air quality [4]. Harmful gases and dusts, together with hazardous organic compounds in above-normal quantities, are one of the main problems in the human habitation area [5,6]. A carrier of many pollutants, including toxic metals, are particles of anthropogenic origin, including the particularly troublesome PM2.5 [7]. Due to its small size, this dust penetrates the lower respiratory tract, where it is accumulated or dissolved in biological fluids and then transported throughout the body by the bloodstream. As a result of this process, it can be the cause of the exacerbation of many conditions, such as asthma, acute respiratory reactions, weakened lung function, etc. [8]. According to Eurostat, Poland is among the top countries emitting dust into the atmosphere—around 343,000 tonnes in 2019 [9]. This is the result of the solid fuel combustion-based energy branches of the national economy. Mineral processing, including cement production, is a significant area in this respect, supplying around 11,500 tonnes of dust to the atmosphere annually. In areas of mineral extraction and the production of building materials, there has been a local transformation of the geographical environment (relief, water relations, land cover, etc.). Industrial emissions, especially of carbon dioxide, contribute to global transformations, including climate change. Due to the presence of a cement plant and a mine, in Ożarów (Central Europe, SE Poland), an average of about 100 tonnes of dust, 2200 tonnes of SO2 and 1.2 million tonnes of CO2 are released into the atmosphere annually from cement production (Figure 1).
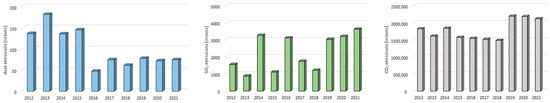
Figure 1.
Volume of cement dust and SO2 and CO2 emissions from the Ożarów Cement S.A. in the years 2012–2021 (data from the Provincial Inspectorate of Environmental Protection in Kielce).
An additional environmental burden in the study area is the Mo-BRUK S.A. industrial incineration plant. The annual average dust emissions from the incineration plant in the 2012–2021 period was 1.53 tonnes, alongside 1.55 tonnes of SO2 and approximately 16,600 tonnes of CO2.
The plant has adopted measures to contain atmospheric pollutants, and the purpose of this work was to verify whether, and how, measures are proving to be efficient and to evaluate the environmental impact of the emissions. A bioindication study based on the indicator properties (sensitivity to pollution, common occurrence, long life cycle, evergreenness, a low tolerance to toxic factors) of Scots pine (Pinus sylvestris L.) needles collected around the plant and mine was carried out.
2. Materials and Methods
2.1. Study Area
According to the physico-geographical division of Poland [10], the study area is located in the macro-region of the Kielce Uplands, covering the eastern part of the Iłża Foreland mesoregion in the south-eastern part of Poland (Figure 2).
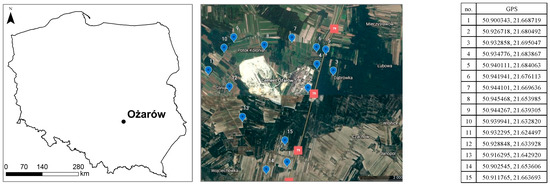
Figure 2.
Location of the study area (based on Google Map).
Cement Ożarów S.A. produces a wide range of clinker-based cements, using the dry method in a rotary kiln. Waste treatment is carried out in parallel using the clinker firing process. It supplies around 2.7 million tonnes of cement annually, which is about 15% of the national production [11]. The location of a rock-based industry is favourable due to shallow subsurface limestone with varying degrees of marliness, as well as marl and clay formations. These constitute the main deposit of Upper Jurassic limestone and marls of the mining field “Gliniany-Duranów”, exploited for the nearby cement plant. Cement Ożarów S.A is part of the international group CRH, based in Ireland. The Mo-Bruk S.A. plant (adjacent to the cement plant) has a thermal conversion facility for sorted municipal waste and industrial and hazardous waste. The heat produced by the incinerator is used in the cement plant to replace the heat obtained by burning coal [12].
2.2. Enivironmental Aspect of Production
The basic technological fuel is coal (with a moisture content not exceeding 6%). The alternative fuel (alternative fuel—AF) is waste, utilized in amounts of up to 10 Mg/h through the multi-channel burner of the rotary kiln. From the point of view of waste incineration, a significant advantage of the cement kiln is the high temperature and short time required for the flow of combustion products through the rotary kiln system—up to several seconds. In the temperature zone above 1200 °C, the residence time of the gases is about 10 s. The oxygen content in the flue gases is in the order of 2–3%. High gas mixing efficiency, especially in the combustion zone, and excellent heat and mass transfer due to the presence of a dispersed solid phase in the gas stream are also important features for ensuring the good mixing of the fuel with the oxidant. The cement kiln is a thermally stable device due to its high heat capacity, which prevents the temperature from changing within a short time. In the case of a cement kiln, there is no ash problem, because the residue after combustion is part of the fired clinker—the mineral components of the ash react in the sintering zone with the raw material and the cement dusts are returned back to the kiln. In accordance with the assumptions of the technological process, the kiln installations in operation guarantee full return of kiln dust from the dedusting installations to the raw meal. The energy obtained from waste incineration does not exceed 40% of the nominal thermal power of the installation.
2.3. Pine Needles Sampling
Samples of needles of Scots pine, showing confirmed indicator traits [13,14] were taken in October 2020 from the limestone mining and cement production area in Ożarów (Ożarów S.A. cement plant, CRH Group, Świętokrzyskie Voivodeship). The control sample was taken from a forested area, the “Bory Tucholskie” National Park (53°49′57.6528 N 17°35′04.8816 E), from an area with no identified anthropogenic pressure (approximately 500 km north-west of the study area). Material for analysis was taken from trees at a height of approximately 3–5 m above sea level, from each direction, at a rate of approximately 200 g for each point. The sample was a mixed and averaged sample, collected from three even-aged trees at each designated point. The breast height of each tree was approximately 50 cm. Needles were taken from the whorl, beginning at the top, from the most exposed areas possible. Each time, a sample of annual and biennial needles was retained for further analysis.
2.4. Laboratory Analysis
After the needle samples were transported to the laboratory, they were dried. After drying at 65 °C for 24 h, the samples were ground in an IKA A-11 basic organic matter mill. A mixture of nitric acid (V) and hydrogen peroxide at a ratio of 2.5:1 was used to wet decompose the samples in 0.1 g weights placed in polytetrafluoroethylene (PTFE) vessels. The material thus prepared was exposed to 1400 W microwaves and 200 °C for 40 min using an Anton Paar Multiwave 3000 mineraliser. The mineralised material was chemically analysed for selected metals (Pb, Cr, Cu, Mn, Ni, Zn, Fe and Al) using an ICP-MS-TOF OptiMass 9500 mass spectrometer (GBC Scientific Equipment, Melbourne, Australia). The result was the average of the three measurements. Certified reference material ERM-CA713 produced by the Institute for Reference Materials and Measurements, Belgium, was used for the quality control of the results obtained. Concentration maps were plotted in Surfer, ver. 16 (Golden Software, LLC, Golden, CO, USA), and calculations and statistical analyses were performed using Statistica, ver. 13.3. (Tibco Software, Inc., Palo Alto, CA, USA).
2.5. SEM/EDS
Scanning electron microscopy (SEM) images were taken using a TM3000 microscope (Hitachi, Tokyo, Japan) with a 15 kV accelerating voltage at the Institute of Chemistry and Inorganic Technology, Krakow University of Technology. The energy dispersive spectroscopy (EDS) analysis of the surface of the underside of the pine needles allowed the determination of the elemental composition (qualitative analysis) and the percentage of micronutrients (quantitative analysis) of the deposited particles. The specificity of this analytical method should be taken into account when interpreting the results of EDS analysis. The graphic images resulting from this analysis were created in parallel with the SEM image formation of the surface of the sample under investigation. Information on the surface composition and distribution of individual elements is the result of the measurements of the intensity and energy of X-rays, which are the result of the excitation of electron cores of elements on or near the surface of the material under investigation. It is important to remember that the electrons used to create the SEM image (and, incidentally, to obtain EDS data) penetrate the material to different depths, depending on the matrix type, but no more than a few micrometres. In addition, from the raw X-spectrum data assigned to each pixel of the SEM image, quantitative data can be obtained to compare the mass (or molar) proportions of elements in the near-surface layer of the scanned area. For this purpose, the area delimited by a circle was selected for this analysis, inside which the resulting X-ray intensity data for each wavelength was integrated. The data were then converted into elemental quantities (all detected or selected, as indicated by the operator) after integration, and the results were further normalised so that the sum of the shares was 100%. When interpreting the quantitative results obtained in this way, the nature of the material to be tested and the morphology and sources of the individual sample components, as well as the nature of the EDS method itself, must be taken into account.
3. Results
The needles utilized were characterised by a light green colour. An intense green colour was present in the samples collected from the western area, while much lighter ones were collected from the eastern area. Needle length varied considerably and ranged from 35–72 mm with an average of 58 mm. Compared to needles collected in the reference area (Bory Tucholskie National Park—length ranged from 55–87 mm, with an average of 74 mm), they were shorter by an average of 21.6%. Macroscopic analysis using a Nikkon optical microscope (Tokyo, Japan) with a DS-Fi1 camera allowed the imaging of nine rows of stomata on the surface of the needles, better visible on the reference sample (Figure 3). In addition, morphological changes were observed within the surface of the needles subjected to pressure, consisting of the bending of the lateral edges and a change in colour from green to yellow. In addition, foreign particles of brown and black colour were found (Figure 3b,c).
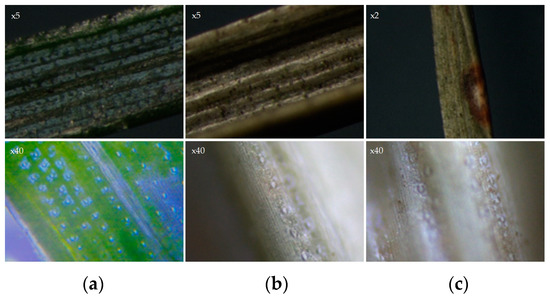
Figure 3.
Optical magnification image of pine needle surfaces from Bory Tucholskie (a) and Ożarów (b,c).
Chemical composition analysis showed the highest concentrations for iron, aluminium and manganese in both sampled needle types. Iron and aluminium, due to their prevalence, will be treated following Garret and Grunsky [15] as a geogenic pollutant and manganese will be treated as a component of plant tissues [16]. Special attention was given to other elements (Cr, Cu, Ni, Pb, Zn) with anthropogenic origin and toxic effects. Using cluster analysis, three groups of point locations were selected: those with the highest concentrations in the eastern part of the study area (points 2 and 4), medium concentrations from the southern and northern parts (1, 7, 9–13) and the lowest concentrations, characteristic of the area most distant from the plant (3, 5, 6, 8, 14–15) (Figure 4 and Figure 5).
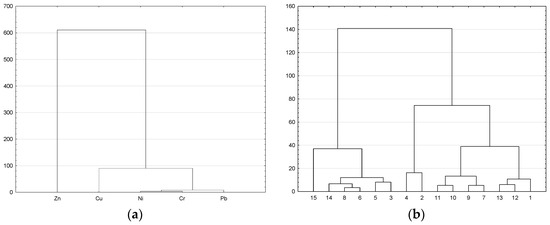
Figure 4.
Cluster analysis (Ward’s method and Manhattan urban distance), agglomeration for chemical composition (b) including measurement points (a).
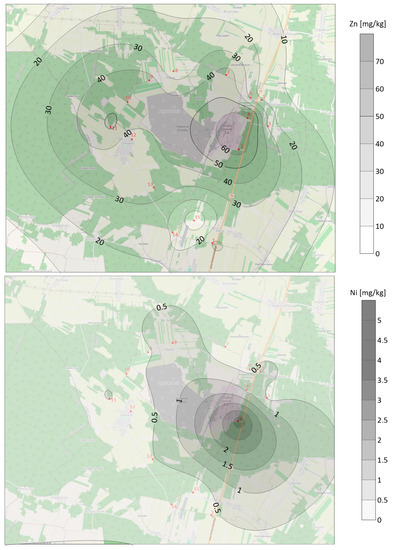
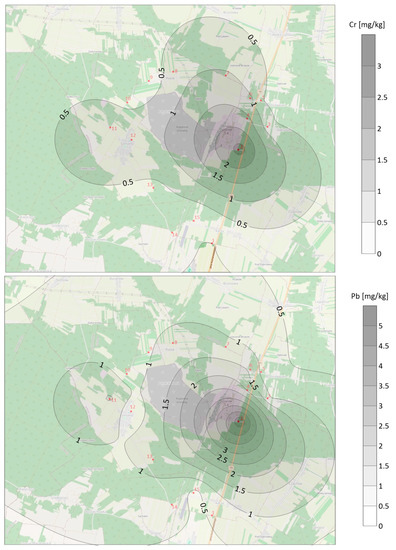
Figure 5.
Spatial depiction of Zn, Cr, Ni and Pb concentrations.
The concentrations of lead, chromium, copper, zinc, aluminium and iron for annual needles were highest at point 2, which similar for biennial needles, except for copper (point 9) and zinc (point 4). The highest concentrations of manganese and nickel were found at points 1 and 7 for annual needles and at points 1 and 2 for biennial needles, respectively (Figure 6 and Table 1).
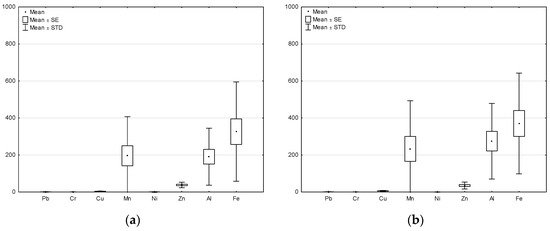
Figure 6.
Variation in concentration of selected elements (mg/kg DM): (a) annual needles and (b) biennial needles.

Table 1.
Chemical composition of selected elements. Values below the detection limit are marked as “n.d.” (not detected).
Using principal component analysis for the pine needle chemical composition results, two main components, PC1 and PC2, were distinguished (Figure 7, Table 2). Together, they generated 82% of the variability in the samples in question. They take into account the considerations arising from the coexisting cement industry, waste incineration plants and the associated vehicular traffic in the area, as well as National Road 79 (PC1 and PC2).
Figure 7.
Graphical representation of the relationship between the components PC1 and PC2 (a); scatter plot (b).
Table 2.
PCA analysis results.
The components PC1 and PC2, representing the impact of the cement works and incineration plant, generated 82% of the total variance. The PC1 component showed a high weighting (≤−0.9) for Pb, Cr, Ni and Fe (Table 2). In contrast, the second component (PC2 ≤ 0.7) shapes 22% of the total variance with the highest weighting for Mn and Cu, whose emissions are also associated with road transport.
SEM analysis allowed the visualisation of the underside of the annual assimilation organs of Scots pine, taken from point 6 (Figure 8). The images taken showed 12 rows of stomata with a significant degree of foreign material impregnation. The identified particles were characterised by a large variation in size and shape. Inside the stomata (22.8 µm wide), spherical structures of 2.5–3.8 µm were found. In addition to these, sharp-edged particles with sizes of 3.1–6.05 µm were abundantly represented, also forming larger conglomerates (Figure 8c).
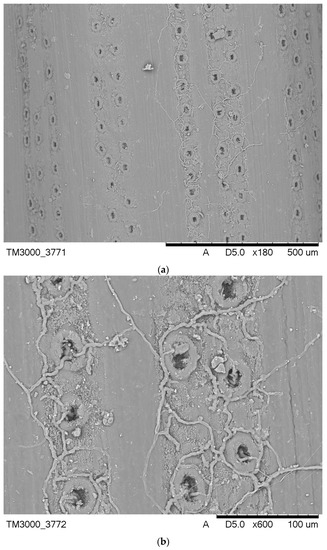
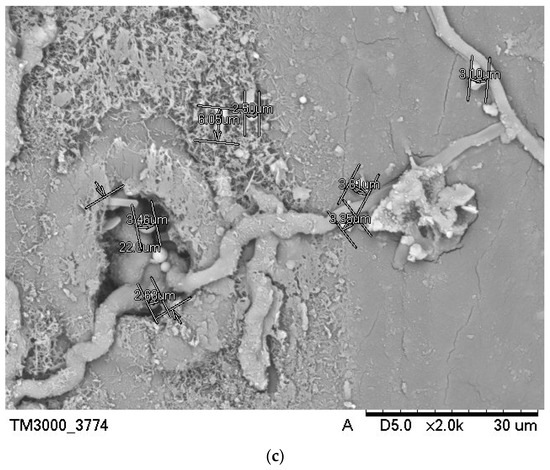
Figure 8.
SEM microphotograph of the undersurface of pine needles at (a) ×180, (b) ×600 and (c) ×2000 magnification.
To identify the elemental composition, EDS analysis was carried out within the plugged stomata—the area marked with a yellow circle (Figure 9).
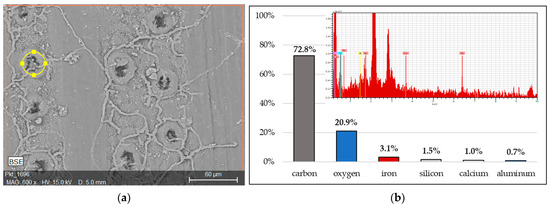
Figure 9.
EDS analysis: (a) field localization—orange frame and (b) X-ray intensity for each wavelength with a percentage of detected elements—yellow circle.
Elements were found in the analysed area, forming a descending sequence of C > O > Fe > Si > Ca > Al. Given the nature of the sample, the interpretations of the test results indicative of environmental (including anthropogenic) conditions include iron, silicon, calcium and aluminium (oxygen and carbon from the needle’s organic matter). The control sample (SEM/EDS) showed no particles typical of the cement industry seen in the samples from Ożarów (Figure 8 and Figure 9). The surface of the needle was heavily impregnated with mycelium. Regarding chemical composition, there is a predominance of oxygen over silicon and aluminium (Figure 10).
Figure 10.
SEM microphotograph of the undersurface of control pine needles at (a) ×150 and (b) ×800 magnification. EDS analysis: (c) field localization—orange frame and (d) X-ray intensity for each wavelength with a percentage of detected elements—yellow circle.
4. Discussion
The chemical composition of the tested needles showed elements of anthropogenic origin with toxic effects, namely lead, chromium, nickel, zinc and copper. Their carriers are cement dust (primary and secondary), dust from incinerators and other dust that moves freely in the atmosphere [17]. It should be stated that the countermeasures taken were effective in reducing heavy metal emissions. The concentrations of the analysed elements around the Ożarów cement plant were significantly lower than the concentrations found in the reference sample and several times lower compared to pine needles collected in the north-western part of Poland in an unpolluted environment [18] (Table 3). Cement dust, which is the carrier of most of the harmful elements shown through the chemical analysis of sampled needles, has been the subject of studies in the Białe Zagłębie area of Poland [19] and Opole [20]. Elements forming similar descending sequences were found in their composition. Depending on the extent of the determinations, the sequence was Al > Fe > Mg > Zn > Mn > Sr > Pb > Ni > Cr > Cu > Co > Cd for Białe Zagłębie and Fe > Zn > Mn > Pb > Cu > Cr > Ni > Tl > Cd > Hg for the study in Opole. Dust, due to its size and deposition conditions, was deposited to varying degrees in the area around the emission source, modifying the chemical composition of the soil. Studies carried out in Ożarów by PIG [21] showed the following ranges of concentration values in the near-surface 0–20 cm soil layer: Cr (1–7 mg/kg, Zn (12–98 mg/kg), Cu (3–10 mg/kg) and Pb (3–25 mg/kg). The average values for Poland are, respectively: Cr (4 mg/kg), Zn (29 mg/kg), Cu (4 mg/kg) and Pb (12 mg/kg). This is primarily influenced by distance, land use and terrain, as well as location relative to the prevailing wind direction. Studies conducted have confirmed a reduction in the emission of harmful metals into the environment, compared to studies conducted in Ożarów a decade earlier [22]. Within 10 years, the concentration of lead contained in needles from Ożarów has been clearly reduced from 17.8 mg/kg to 1.27 mg/kg (a 14-fold lower Pb content). A much lower reduction of harmful emissions was found in the case of copper and zinc (on average, 1.3 times lower content compared to those found in the Świercz study [22]). The needle reaction and concentrations of most of the analytes recorded at Ożarów were similar to those found in the White Basin area in the south-western part of the Świętokrzyskie Mountains [23,24]. Significantly higher concentrations of lead, copper and zinc were seen in studies of pine needles exposed to metallurgical industry pressure [25] and zinc and lead smelters [26].
Table 3.
Comparison of the results of biennial pine needle surveys taken in cement pressure areas around the world (distance approx. 1 km from the emitter).
The SEM/EDS images visualised particles of anthropogenic origin of varying size and shape. They cover the surfaces of the assimilatory organs unevenly and fill the stomata. The chemical composition of the imaged particles makes it possible to group them according to the classification [30], such as mineral (irregular shape and varied size; composed of Ca, Al, Si and Fe), coal ash (spherical particles composed of Al and Si) and industrial cement (larger limestone conglomerates). The study of alkali dust [31] allowed a separation among the SEM/EDS imaged particles: concentric particles and spherules. They had Al–Si (from coal combustion) and Fe in their composition, which is characteristic of pollution from the cement industry. The size of the spherules (those from Ożarów with a diameter of about 2.5–3.8 µm) allows them to be transported in the atmosphere over considerable distances. Similar conclusions were drawn by Sensuła [32], where Fe, Mg, Al, Si, S, K and Ti were identified in the area of influence of a coal-fired power plant. Apart from the spherules, the Ożarów needle images showed the presence of larger structures of around 20 µm. According to Magiera [31] these are particles with a characteristic octahedral grain shape formed from iron ferrites. They are created during the technological process of cement production, where the dust is enriched through ferromagnetics. In the control sample, significantly lower concentrations of metals (except manganese) were found. No dust particles were identified on the surface of the needles. The habitat conditions allowed mycelium to flourish.
5. Conclusions
The high-temperature transformations of fossil fuels cause multidirectional environmental consequences. The cement plant in Ożarów has significantly reduced dust and SO2 emissions associated with production (CO2 emissions have remained at a stable level for several years). Persistent levels of anthropogenic pressure have been diagnosed using living organisms.
The needles of the Scots pine used in the study confirmed their diagnostic properties in a study of an area subjected to heavy industrial pressure. Both the chemical compositions and the SEM images of the bio-indicators were significantly modified compared to studies conducted in uncontaminated areas.
SEM/EDS analysis showed the presence of particles with a respirable dust fraction representing a direct threat to human health and life. The chemical composition and shape of the particles deposited within the stomata indicate the presence of contaminants from the cement industry as well as from fuel combustion products.
The presence of these particles in the stomata may limit gas exchange and contribute to the degradation of the pine forest stand, with the Scots pine being predominant, as demonstrated by the SEM microphotographs of interlocked stomata.
Author Contributions
Conceptualization, M.S.; methodology, M.S., W.Ż., R.K. and K.M.; software, M.S.; validation, M.S., W.Ż. and R.K.; formal analysis, M.S., W.Ż., R.K. and K.M.; investigation, M.S.; resources, M.S.; data curation, M.S.; writing—original draft preparation, M.S.; writing—review and editing, M.S., W.Ż. and R.K.; visualization, M.S.; supervision, M.S.; project administration, M.S.; funding acquisition, M.S. All authors have read and agreed to the published version of the manuscript.
Funding
This research was funded by Jan Kochanowski University of Kielce, grant number SUPS.RN.23.005.
Data Availability Statement
The data presented in this study are available on request from the corresponding author.
Acknowledgments
We thank the Bory Tucholskie National Park staff for taking reference samples in the field.
Conflicts of Interest
The authors declare no conflict of interest.
References
- Egerstrom, N.; Rojas-Rueda, D.; Martuzzi, M.; Jalaludin, B.; Nieuwenhuijsen, M.; So, R.; Lim, Y.-H.; Loft, S.; Jovanovic Andersen, Z.; Cole-Huntere, T. Health and economic benefits of WHO air quality guidelines, Western Pacific Region. Bull. World Health Organ. 2023, 101, 130–139. [Google Scholar] [CrossRef]
- OECD. OECD Environmental Outlook to 2050. The Consequences of Inaction; Gurria, A., Ed.; Organisation for Economic Co-Operation and Development: Paris, France, 2012. [Google Scholar] [CrossRef]
- UNECE. Trends in Ecosystem and Health Responses to Long-Range Transported Atmospheric Pollutants; De Witt, H.A., Hettelingh, J.P., Harmens, H., Eds.; Report No. 6946; NIVA: Oslo, Norway, 2015; Available online: https://unece.org/DAM/env/documents/2016/AIR/Publications/Trends_in_ecosystem_and_health_responses_to_long-range_transported_atmospheric_pollutants.pdf (accessed on 28 March 2023).
- Tanaka, T.Y.; Chiba, M. A numerical study of the contributions of dust source regions to the global dust budget. Glob. Planet Chang. 2006, 52, 88–104. [Google Scholar] [CrossRef]
- EEA 2022: Air Quality in Europe 2022. Available online: https://www.eea.europa.eu/publications/air-quality-in-europe-2022 (accessed on 28 March 2023).
- Rybiński, P.; Syrek, B.; Szwed, M.; Bradło, D.; Żukowski, W.; Marzec, A.; Śliwka-Kaszyńska, M. Influence of Thermal Decomposition of Wood and Wood-Based Materials on the State of the Atmospheric Air. Emissions of Toxic Compounds and Greenhouse Gases. Energies 2021, 14, 3247. [Google Scholar] [CrossRef]
- Wang, Z.; Zhang, X.; Chen, Z.; Zhang, Y. Mercury concentrations in size-fractionated airborne particles at urban and suburban sites in Beijing, China. Atmos. Environ. 2006, 40, 2194–2201. [Google Scholar] [CrossRef]
- Stanek, L.W.; Sacks, J.D.; Dutton, S.J.; Dubois, J.-J.B. Attributing health effects to apportioned components and sources of particulate matter: An evaluation of collective results. Atmos. Environ. 2011, 45, 5655–5663. [Google Scholar] [CrossRef]
- SP. Statistics Poland, Environment 2021; Domańska, W., Ed.; Statistics Poland, Spatial and Environmental Surveys Department: Warsaw, Poland, 2021. Available online: https://stat.gov.pl/statystyka-miedzynarodowa/porownania-miedzynarodowe/podstawowe-wskazniki/stan-i-ochrona-srodowiska/ (accessed on 28 March 2023).
- Solon, J.; Borzyszkowski, J.; Bidłasik, M.; Richling, A.; Badora, K.; Balon, J.; Brzezinska-Wojcik, T.; Chabudziński, L.; Dobrowolski, L.; Grzegorczyk, I.; et al. Physico-Geographical mesoregions of Poland: Verification and adjustment of boundaries on the basis of contemporary spatial data. Geogr. Pol. 2018, 91, 143–170. [Google Scholar] [CrossRef]
- CEMBUREAU. Annual Report 2020; The European Cement Association: Brussels, Belgium, 2020; Available online: https://cembureau.eu/media/m2ugw54y/cembureau-2020-activity-report.pdf (accessed on 28 March 2023).
- MOŚV. Marshal Office of the Świętokrzyskie Voivodeship; Integrated Permit for Thermal Disposal of Waste: Kielce, Poland, 2017; Available online: https://bip.sejmik.kielce.pl/568-wydane-pozwolenia-zintegrowane/dodruku/1/0.html (accessed on 28 March 2023).
- Chudzińska, E.; Pawlaczyk, E.M.; Celiński, K.; Diatta, J. Response of Scots pine (Pinus sylvestris L.) to stress induced by different types of pollutants—Testing the fluctuating asymmetry. Water Environ. J. 2014, 28, 533–539. [Google Scholar] [CrossRef]
- Nieminen, T.M.; Derome, J.; Saarsalmi, A. The applicability of needle chemistry for diagnosing heavy metal toxicity to trees. Water Air Soil Pollut. 2004, 157, 269–279. [Google Scholar] [CrossRef]
- Garrett, R.G.; Grunsky, E.C. Presentations and recommendations from the workshop on the role of geochemical data in environmental and human health risk assessment. In Geological Survey of Canada; Rencz, A.N., Kettles, I.M., Eds.; Open File 6645; Natural Resources Canada: Halifax, NS, Canada, 2011; pp. 1–24. [Google Scholar] [CrossRef]
- Kabata-Pendias, A.; Pendias, H. Trace Elements in Soils and Plants, 3rd ed.; CRC Press: Boca Raton, FL, USA, 2001. [Google Scholar]
- Sanderson, P.; Delgado-Saborit, J.M.; Harrison, R.M. A review of chemical and physical characterization of atmospheric metallic nanoparticles. Atmos. Environ. 2014, 94, 353–365. [Google Scholar] [CrossRef]
- Skonieczna, J.; Małek, S.; Polowy, K.; Węgiel, A. Element content of Scots pine (Pinus sylvestris L.) stands of different densities. Drewno 2014, 57, 77–87. [Google Scholar] [CrossRef]
- Szwed, M.; Żukowski, W.; Kozłowski, R. The Presence of selected elements in the microscopic image of pine needles as an effect of cement and lime pressure within the region of Białe Zagłębie (Central Europe). Toxics 2021, 9, 15. [Google Scholar] [CrossRef]
- Gołuchowska, B.; Strzyszcz, Z.; Kusza, G. Magnetic susceptibility and heavy metal content in dust from the lime plant and the cement plant in Opole voivodeship. Arch. Environ. Prot. 2012, 38, 71–80. [Google Scholar] [CrossRef]
- PIG. Objaśnienia do Mapy Geośrodowiskowej Polski 1:50,000; Nowak, M., Kozłowska, O., Pasieczna, A., Tomassi-Morawiec, H., Eds.; PIG: Warsaw, Poland, 2006. Available online: http://bazadata.pgi.gov.pl/data/mgsp/txt/mgsp0819.pdf (accessed on 28 March 2023).
- Świercz, A.; Smorzewska, E.; Bogdanowicz, M. State of scots pine needles’ epicuticular waxes and content of microelements in bioindication. Ecol. Chem. Eng. A 2014, 21, 367–375. [Google Scholar] [CrossRef]
- Kozłowski, R.; Szwed, M.; Żukowski, W. Pine needles as bioindicator of pollution by trace elements from cement-limestone industry in central-eastern Poland. Carpath. J. Earth Environ. 2019, 14, 541–549. [Google Scholar] [CrossRef]
- Kozłowski, R.; Szwed, M.; Żelezik, M. Environmental aspect of the cement manufacturing in the Świętokrzyskie Mountains (southeastern Poland). Minerals 2021, 11, 277. [Google Scholar] [CrossRef]
- Pająk, M.; Halecki, W.; Gąsiorek, M. Accumulative response of Scots pine (Pinus sylvestris L.) and silver birch (Betula pendula Roth) to heavy metals enhanced by Pb-Zn ore mining and processing plants: Explicitly spatial considerations of ordinary kriging based on a GIS approach. Chemosphere 2017, 168, 851–859. [Google Scholar] [CrossRef]
- Tatuśko-Krygier, N.; Diatta, J.; Chudzińska, E.; Waraczewska, Z.; Gawroński, D.; Youssef, N. Bioactive levels of Zn, Pb, Cu, Cd and Mg, Fe in pollution sensitive and tolerant Scots pines needles—Is survival mineral-dependent? Ecol. Indic. 2022, 146, 109751. [Google Scholar] [CrossRef]
- Tervahattu, H.; Lodenius, M.; Tulisalo, E. Effects of the reduction of cement plant pollution on the foliar and bark chemical composition of Scots pine. Boreal Environ. Res. 2001, 6, 251–259. Available online: http://www.borenv.net/BER/archive/pdfs/ber6/ber6-251s.pdf (accessed on 28 March 2023).
- Ivanov, Y.; Kartashov, A.; Ivanova, A.; Ivanov, V.; Marchenko, S.; Nartov, D.; Kuznetsov, V. Long-term impact of cement plant emissions on the elemental composition of both soils and pine stands and on the formation of Scots pine seeds. Environ. Pollut. 2018, 243, 1383–1393. [Google Scholar] [CrossRef]
- Baczewska, A.H.; Dmuchowski, W.; Gworek, B.; Dąbrowski, P.; Brągoszewska, P. Porównanie metod bioindykacyjnych w ocenie stopnia zanieczyszczenia środowiska metalami ciężkimi w Warszawie. Przem. Chem. 2016, 95, 334–338. [Google Scholar] [CrossRef]
- Maňkovská, B.; Godzik, B.; Badea, O.; Shparyk, Y.; Moravčík, P. Chemical and morphological characteristics of key tree species of the Carpathian Mountains. Environ. Pollut. 2004, 130, 41–54. [Google Scholar] [CrossRef]
- Magiera, T.; Gołuchowska, B.; Jabłońska, M. Technogenic magnetic particles in alkaline dusts from power and cement plants. Water Air Soil Pollut. 2013, 224, 1389. [Google Scholar] [CrossRef]
- Sensuła, B.; Toroń, B.; Rocznik, J.; Sasiela, A.; Świątkowski, J.; Tomaszowska, A. Characteristics of pine needles exposed to multi-source pollution in Silesia: Radiocarbon concentration in pine needles and elemental analysis of the needles’ surface deposits. Radiocarbon 2022, 64, 1333–1344. [Google Scholar] [CrossRef]
Disclaimer/Publisher’s Note: The statements, opinions and data contained in all publications are solely those of the individual author(s) and contributor(s) and not of MDPI and/or the editor(s). MDPI and/or the editor(s) disclaim responsibility for any injury to people or property resulting from any ideas, methods, instructions or products referred to in the content. |
© 2023 by the authors. Licensee MDPI, Basel, Switzerland. This article is an open access article distributed under the terms and conditions of the Creative Commons Attribution (CC BY) license (https://creativecommons.org/licenses/by/4.0/).