Abstract
The residential sector is currently responsible for approximately 30% of the final energy consumption and 12% of direct CO2 emissions in Italy, mainly due to the heating and cooling of buildings and the use of domestic hot water. Such figures show a significant potential for reducing non-renewable primary energy utilization to comply with the decarbonization constraints of the European Union. In this context, the purpose of this work is to provide a quantitative assessment of the effect of a different number of actions (eight for energy savings, four for energy efficiency and two for the installation of renewable energy plants) that could be implemented at the national level to reduce the consumption of natural gas in the residential sector. Two typical residential buildings are dynamically simulated using Trnsys®, and the savings from energy, economic and CO2 emissions points of view are evaluated in the different climatic zones of Italy. The most effective action foresees the replacement of natural gas boilers and old air conditioners with modern heat pumps and air/air chillers as well as the installation of a controlled mechanical ventilation system with heat recovery. This solution allows for non-renewable primary energy savings of 58% and an economic savings on annual energy costs of 72%.
1. Introduction
In the European Union (EU), buildings are responsible for 36% of greenhouse gas emissions and 40% of energy use; for this reason, the revision of the Energy Performance of Buildings Directive (EPBD) [1] is ongoing at the time we are writing (March 2023). With the aim of significantly increasing the rate of renovation of inefficient buildings, reducing energy consumption and greenhouse gas emissions, the revised text provides that, from 2028, all residential buildings should be carbon neutral (from 2026 for public buildings) and use only renewable energy if economically sustainable [2].
Regarding energy performance, the proposal provides that residential buildings will have to be in class E by 2030 and class D by 2033, while non-residential and public buildings will have to reach the same classes by 2027 and 2030, respectively. Finally, from the date of transposition of the directive, new buildings and those undergoing major renovations will not be allowed to use fossil fuels in heating systems as this should be completely phased out by 2035 [2].
At the same time, in May 2022, in light of the need for the EU to overcome its dependence on energy imports from Russia, high energy prices and changing energy market conditions, the Commission proposed a second revision of the Energy Efficiency Directive (EED) (Directive (EU) 2018/2002 [3]). This revision provides a further increase, with respect to the 32.5% that was originally fixed in July 2021 as part of the package “Delivering the European Green Deal”, in the reduction targets for primary and final energy use to at least 41% and 39%, respectively, by 2030 compared to the 2007 baseline projections. The proposal also suggests, in detail, a short-term change of habits aimed at reducing the demand for gas and oil by 5%. Moreover, it encourages the member states to launch specific communication campaigns aimed at households and businesses as well as to make use of fiscal measures to promote energy savings.
Finally, the review of the renewable energy directive (RED II, Directive (EU) 2018/2001 [4]) was first presented by the UE Commission in 2021 to fit the Fit for 55 package, the plan to reduce climate change emissions by 55% by 2030 (compared to 1990 levels) and reach net zero emissions by 2050. This first revision, which proposed to bring the share of renewable energy to 40%, was overcome with a second one in May 2022 by the REPowerEU plan, with which the Commission brought the 2030 target for renewables to 45%.
1.1. Motivations of the Study
Based on previous considerations, and due to the high quota of energy use by buildings in the EU and Italy, the motivations of the present study can be found in the following:
- The international crisis due to the uncertainty of natural gas (NG) supplies especially from Russia due to the ongoing conflict in Ukraine.
- The tension regarding the international prices of gas and electricity, which, in the second quarter of 2022, reached 134 c€ Sm−3 and 41.3 c€ kWh−1, respectively, for the utilization of the average family [5].
- The Italian energy mix, both in terms of final energy uses and in terms of gross energy availability. Italy is largely dependent on natural gas as primary source, especially for the residential sector. In the first case (final uses), the residential sector is currently (2021) responsible for about 29% of final energy consumption, 33,165 out of 114,781 ktoe, of which 17,668 ktoe were supplied by natural gas [6]. In the second case (gross energy availability), 62,511 out of 153,024 ktoe were supplied by natural gas in Italy in 2021 [6]. Of the 62,511 ktoe, 22,010 ktoe were used for electricity production. As a matter of fact, 142 out of 284.7 TWh of gross electricity produced in Italy in 2021 were supplied by natural gas (49.9%), with a conversion efficiency of 55.4% [6].
1.2. Background, Scope and Novelty of the Study
The scope of the work is to provide a quantitative assessment of the effect of specific actions that could be implemented at the Italian national level for the reduction of the consumption of natural gas and, in general, non-renewable primary energy in the residential sector. The evaluation is carried out from an energy, economic and CO2 emissions point of view. As a matter of fact, this study wants to answer the following question: regarding energy saving, energy efficiency and renewable energy, which is better for the decarbonization of the residential sector in Italy?
Other authors have previously analysed this topic but mainly analysed the three aspects separately. For example, Singh Gaur et al. [7] presented a review on several aspects of heat pumps, including their role in the decarbonization of the heating sector and recent technological advances. In Italy, Ballerini et al. [8] analysed the variation in the thermal energy demand for different temperature levels of the set point of indoor air. They performed dynamic simulations for three different residential buildings and in three different climates to compare the cost of heating generation by an air-to-water heat pump and a gas boiler. In Germany, a techno-economic evaluation of different heat-generation technologies and refurbishments was carried out, and sensitivity analyses for indoor temperatures and hydrogen prices were performed. The results showed that the use of a combination of solar photovoltaic, heat pumps, electrolysers and fuel cells was more cost-effective than refurbishments [9].
More recently, Pastore et al. [10] investigated some measures to assess and quantify the energy, economic, social and environmental impacts of different strategies to reduce NG consumption in Italy. They analysed only energy efficiency solutions and not energy saving ones. Other authors [11] described how home energy upgrade projects and programs in the US have evolved in the past decade, with the aim of achieving significant energy retrofit savings greater than 30%.
Other authors analysed the energy and economic savings of specific interventions in residential buildings without comparing different types of action. In [12], an analysis of the application of an air-to-water heat pump for the recovery of heat from the exhaust air in a typical multifamily residential building was performed using Trnsys for five locations in Poland. Li et al. [13] quantified the impacts of thermal storage on the reduction of peak load by analysing a residential hot water, heating and cooling system featuring a heat pump combined with thermal energy storage for a representative Australian house.
In [14], a review of integrated heat pump systems with PV modules was presented, analysing the energy performance in function of the operating condition and the configuration of the system. The authors stated that CO2 emissions can be reduced by up to 73% for both heating and cooling purposes, which means that these systems are appropriate toward decarbonization in buildings. In another study [15], two different heating technologies, electric heat pumps and thermally driven appliances fed by renewable hydrogen, were evaluated by life cycle assessment for three buildings (old, old retrofitted and new).
In [16], a review of the combination of different renewable energy systems was presented to improve energy efficiency in building stock based on energy generation, payback durations and reduction of CO2 emissions. At the district level, Teso et al. [17] proposed a methodology to renovate a low-income district in the city of Venice using CityBES to model and evaluate four common energy conservation measures covering both the building envelope and the heat-generation boilers. They showed that the four measures together achieved 67% energy savings.
In [18], a multi-linear regression of the effect of high-reflective products on roofs was simulated as a function of heating degree days and of the local value of the climate vector. The authors applied this approach to a block of flats selected as the reference building to estimate a reduction of 9% to 25% in the annual energy demand of the building for heating and cooling as the expected impact of high reflective roof coverings. Bianco and Marmori published an interesting study [19] based on a simulation model that offered a detailed picture of the Italian building stock, which was described in terms of significant archetypes. They calculated the energy/carbon/pollutant savings obtained when specific energy efficiency measures were applied for four different scenarios, but their study did not consider cooling energy needs.
In [20], the maximization of the use of renewable energy through energy sharing between two residential houses and two office buildings in South Korea was investigated by means of simulations. Building-integrated photovoltaic and photovoltaic and thermal systems allowed 46.2% more renewable energy compared to a conventional community. Other authors proposed a study to quantify the energy efficiency of heating the home space to understand how to reduce electricity usage [21]. They found that households in the hot summer and cold winter climate zones in China could reduce their heating electricity consumption by 31% without lowering the level of indoor thermal comfort in winter.
Recently, Capelo et al. [22] published a review of existing energy policies and actions in Portugal with the aim of assessing their effectiveness to increase energy efficiency and reduce CO2 emissions in the building sector. Their study was not based on dynamic simulations and was limited to the North of Portugal. In [23], the authors presented a novel approach to study the impact on the energy use profiles and the local distribution system of a hypothetical neighbourhood-scale residential retrofit program. Based on a mixed-fuel community of 30 single-family homes in Denver, Colorado, they considered upgrading conventional energy efficiency to full electrification with and without more advanced distributed energy resource technologies and developed a methodology applicable to other regions and building typologies.
To the best knowledge of the authors, no previous studies have been performed on the comparison of the efficacy of different energy saving, energy efficiency and renewable energy actions in order to determine the most effective ones for the reduction of the non-renewable primary energy at the national Italian level for the residential heating, cooling and DHW energy needs. This is the main motivation of the present study.
2. Materials and Methods
2.1. Main Hypotheses of the Analysis
As a starting point, we considered the use of natural gas in 2021 in Italy in the following terms [6]:
- Gross domestic consumption (national production + import − export − inventory change) (9.97 kWh Sm−3 is the lower heating value (LHV) of natural gas):62,511 ktoe × 0.01163 TWh ktoe−1 × 10⁹ kWh TWh−1/9.97 kWh Sm−3 = 74.26 GSm3.
- For electricity production:22,010 ktoe × 0.01163 TWh ktoe−1 × 10⁹ kWh TWh−1/9.97 kWh Sm−3 = 26.15 GSm3.
- For general domestic use (heating + domestic hot water (DHW) + cooking):17,668 ktoe × 0.01163 TWh ktoe−1 × 10⁹ kWh TWh−1/9.97 kWh Sm−3 = 20.99 GSm3.
- For use of heating only (referring to the percentage of the domestic total for 2020, equal to 71%):0.71 × 20.99 GSm3 = 14.90 GSm3.
For the purposes of the analysis proposed here, it is necessary to divide the national consumption for domestic heating (14.90 GSm3) for the different climatic zones. Table 1 reports the main characteristics of a resort for each climatic zone for which the Test Reference Year is available [24]. This was performed on the basis of the only data that were possible to find as a basis for the calculation, that is, relating to the breakdown of the total heating consumption (including the tertiary sector) in 2021 for civil use (Table 2) [25].

Table 1.
Description of the resorts considered for the different Italian climatic zones.
Table 2.
Natural gas consumption for residential heating and DHW and electricity use for residential cooling by climatic zones (2021).
In Table 2, for summer cooling, a subdivision of the percentages between the thermal zones is assumed to be opposite to the case of heating (the percentage of heating in the mildest zone becomes that of cooling in the coldest zone, etc.). Climatic zone A was not considered, as the consumption of natural gas for heating and DHW and electricity for cooling is negligible. Additionally, there are no TRYs available for resorts in climatic zone A. For DHW, a subdivision of the percentages between the thermal zones is assumed based on reference [26].
2.2. Actions to Be Compared
Different actions to be considered alternatives to each other were implemented to evaluate the non-renewable primary energy (PEnren), the OPerative EXpenses (OPEX) and the CO2 emissions savings on an annual basis with respect to a base case (reference scenario). The specific actions considered in this study were also suggested by ENEA (the Italian National Agency for New Technologies, Energy and Sustainable Economic Development) [25]. In this document, the measures are divided into two main categories for which the effects in terms of non-renewable primary energy consumption are evaluated:
- administrative measures, which may be imposed with regulatory provisions;
- behavioural measures, somehow easy to implement, related to user behaviour.
In particular, the first ones are based on certain decrees of the Italian Minister of Ecological Transition facing the emergency for the Italian natural gas system due to the war in Ukraine, whereas the second ones consider both measures that require an initial investment by users and soft measures linked to changing daily habits. The actions considered concern three different categories:
- useful energy savings (i.e., actions that reduce the final energy demand of the building with respect to a reference scenario):
- lowering (heating season) or raising (cooling season) the set-point temperature inside the rooms by 1 °C (typically fixed, respectively, at 20 and 26 °C);
- reduction of one hour per day (in the evening) of the operation time (which depends on the climatic zone) of the heating and cooling systems;
- reduction of 15 days of the operating period of the plants (which is a function of the climatic zone);
- simultaneously a1 + a2 + a3;
- increase in the thermal insulation of the external walls;
- replacement of windows with ones with lower thermal transmittance;
- simultaneously a5 + a6;
- reduction in the consumption of natural gas for the production of DHW by reducing the time and temperature of the shower;
- increase in energy efficiency (i.e., actions that reduce the consumption of non-renewable primary energy with the same final energy demand equal to that of the reference scenario). In all these cases, the DHW is produced with an air/water heat pump with average coefficient of performance (COP) assumed equal to 3.5:
- replacement of old boilers for winter heating with modern air/water heat pumps;
- replacement of the old air conditioners for summer cooling with the aforementioned modern air/water heat pumps that operate as air conditioners;
- installation of a mechanical ventilation system with a heat recovery heat exchanger with fixed efficiency of 50%. This action decreases the demand for final energy, but it can be considered as an energy efficiency improvement action because its efficacy can be measured by a COP (ratio between the thermal energy saved and the electrical energy consumed by the fans), such as a heat pump;
- simultaneously b1 + b2 + b3;
- installation of renewable energy systems:
- installation of photovoltaic modules and evacuated tube solar collectors (PV and ETC) to satisfy the requirement of Legislative Decree 199/2021 (the renewable ratio must be at least 60% referring to heating, DHW and cooling services). It is assumed that the integration required for heating and DHW is satisfied by an air/water heat pump with an average COP of 3, while the satisfaction of the cooling load takes place via an air/air conditioner with an average energy efficiency ratio (EER) of 2.8;
- installation of photovoltaic/thermal hybrid panels (PVT) with the same criteria as in the previous point c1.
2.3. Description of the Simulation Model
2.3.1. Buildings and Thermal Loads
To evaluate the achievable savings (of final energy (actions a.) and of non-renewable primary energy (actions b. and c.)) two “typical” dwellings were considered, representative of the Italian residential building stock. They were simulated in Trnsys® [27] by type 56. In the base case (reference scenario), they are supposed to be equipped with a traditional natural gas boiler (nominal power 24 kW, average seasonal efficiency equal to 0.8) for heating and with an air/air conditioner for cooling (Table 3).
Table 3.
Monthly average values of the EER for the air/air conditioner of the base case.
The two buildings are:
- An apartment (area 80 m2) in a five-storey condominium with a parallelepiped shape. The building has garages on the ground floor, the other four floors have four apartments each (16 apartments per condominium). The ground floor has an area of 320 m2, wall dimensions of 9.33 × 2.4 m and 10 × 2.4 m and the floor in contact with the ground, whose temperature is considered variable as a function of the external air temperature. The other four floors have an area of 320 m2 and wall dimensions of 8 × 2.7 m and 10 × 2.7 m. The building is orientated with the short sides (10 m) facing west and east.
- A single-family detached house [28] with two floors (areas of 77 and 58 m2, respectively) and a total volume of 363.5 m3. The main entrance has a north orientation, and the portico is to the south; a wall of the living room is oriented west.
Both types of building have the thermal properties reported in Table 4 based on the abacus of the UNI/TS 11300-1 standard [29].
Table 4.
Thermal transmittance of the opaque and transparent surfaces of the buildings simulated in the base case and in the a5 and a6 energy savings actions.
A suitable schedule for the presence of people and other internal gains was considered. Concerning the heat gains, 1.2 + 50 kJ h−1 for the radiative part and the convective part, respectively, were considered for the household appliances and lighting. Furthermore, a presence of three seated at rest persons per single-family detached house with the scheduling reported in Figure 1a was considered. Three persons were considered for the single-family detached house, whereas, for the apartments of the condominium, a variable number (from one to four) of persons per apartment was considered (in particular, for each condominium, there were supposed to be six apartments with one inhabitant, three apartments with two inhabitants, five apartments with three inhabitants and two apartments with four inhabitants).
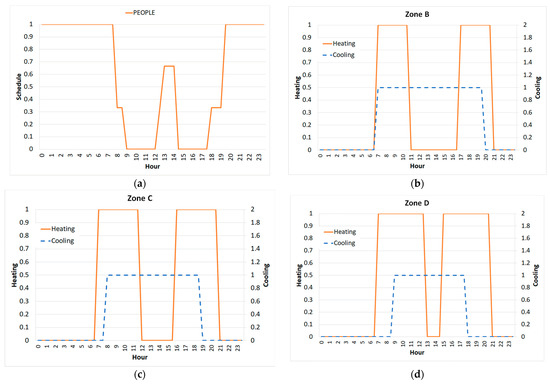
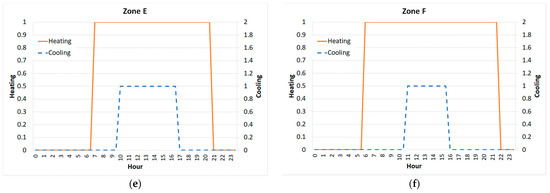
Figure 1.
Scheduling of the presence of people (a) and of the heating and cooling plant in the different climatic zones (b–f).
Dynamic simulations with Trnsys® were performed to determine the heating and cooling demand considering the following hypotheses:
- heating with a set point at 20 °C, with attenuation at 16 °C;
- cooling with a set point at 26 °C, with attenuation at 28 °C;
- infiltrations 0.5 vol h−1;
- no mechanical ventilation.
For both types of building, the heating and cooling energy needs were calculated by dynamic simulation in Trnsys® for the five locations (one for each climatic zone) reported in Table 1. For heating, the conventional switch-on periods of the systems and the number of hours per day were provided by Presidential Decree 26 August 1993 n. 412 [30]. For cooling, we assumed a duration of the periods and switching on times of the system opposite to that relating to heating, multiplied by a fixed reduction factor equal to 0.9 (Figure 1 and Table 5).
Table 5.
Operating periods and switch-on times of the heating and cooling systems for the different climatic zones.
Please note that, for climatic zone F, Presidential Decree 412/93 does not establish operating periods or switching on times for the systems, which can be switched on without limitation. However, for the purposes of this study, 16 h per day and a heating season from 5 October to 22 April were considered, in accordance with the provisions of the UNI/TS 11300-1 standard [29] to calculate the energy performance of buildings.
The energy needs for heating, cooling and DHW determined by the Trnsys® simulations (one hour time step) for the condominium are reported in Figure 2.
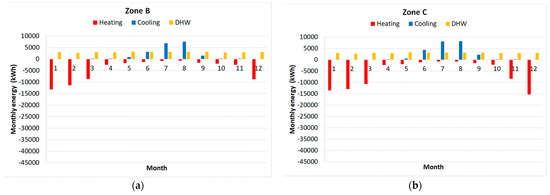
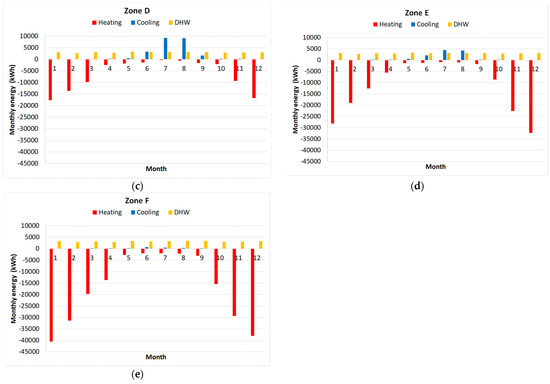
Figure 2.
Monthly energy needs for heating, cooling and DHW of the condominium for the base case for the different climatic zones (a–e).
Regarding DHW, it was expected to have a demand of 12 L min−1 for 7 min of hot water at 45 °C once a day per person (for the shower). In action a8, the hot water demand was reduced to 5 min at 43 °C.
The simulations reveal that both the apartment and the single-family detached house have a non-renewable primary energy consumption of around 100 kWh m−2 y−1, that is, they are in an energy class between C and D following the Italian building energy classification [31].
2.3.2. Simulation Models of “Energy Efficiency” and ”Renewable Energy” Plants
The performance of the heat pump and air conditioner in actions b1 and b2 (energy efficiency actions) was modelled in Trnsys® by type 954. They are reported in Figure 3 as normalized values (with respect to the rated values) of thermal/cooling capacity and COP/EER in heating and cooling operation, respectively.
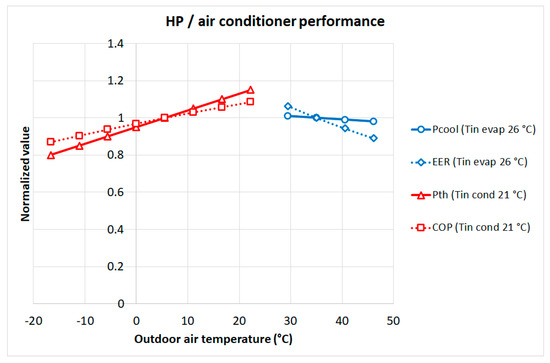
Figure 3.
Normalised values (with respect to the rated ones) of thermal/cooling capacity and COP/EER in heating and cooling operation (@ indoor air temperature of 21 and 26 °C, respectively).
The rated data for the heat pump and the “old” model air conditioner in action b1 and the “new” model air conditioner in action b2 for the condominium are reported in Table 6. The values for the single-family detached house are similar but reduced by a factor of 0.11 that considers the reduced area and the increase in the surface/volume ratio of the building with respect to the condominium.
Table 6.
Rated values of the performance of the air/air heat pump/air conditioner for the condominium.
The PV and ETC considered in action c1 are modern collectors available on the market, modelled in Trnsys® by type 94 and type 71, respectively. The unglazed PVT collector of action c2 is modelled by type 50c, which is derived from the type 1 model solar thermal collector based on the Hottel–Whillier equation. The main geometrical, constructive, electrical and thermal characteristics that determine the thermal and electrical performance of PV, ETC and PVT are reported in Table 7 and Table 8. All the collectors are intended to have a tilt of 30° and an azimuth of 0°.
Table 7.
Main parameters of PV, unglazed PVT and ETC.
Table 8.
Incident angle modifier of the evacuated tube collector.
2.3.3. Further Hypotheses of the Analysis
Based on reference [25], it was assumed that single-family detached houses on Italian territory are 30% of the total of residential buildings. Thus, the condominium dwellings are equal to:
24,135,177 (no. of total accommodations in Italy) − 0.30 × 24,135,177 (no. of single-family detached houses) =
= 16,894,624
So, the number of condominium buildings to be considered is:
16,894,624/16 = 1,055,914
In such a way, the total number of inhabitants in Italy is as follows:
based on the hypotheses previously reported. This number coincides substantially with the official value of Italians at the end of 2021 [25], so the hypotheses taken in this study can be considered correct.
3 × 0.30 × 24,135,177 + 1,055,914 × (1 × 6 + 2 × 3 + 3 × 5 + 4 × 2) = 58,678,649
The conversion factors for natural gas and electricity to renewable and non-renewable primary energy and the CO2 emission factors related to the proposed measures are shown in Table 9 [32]. The table also reports the cost of energy (NG and grid electricity) and the economic value of the avoided CO2 emissions for the determination of the annual net OPEX.
Table 9.
Values of factors and parameters used in the energy, economic and CO2 emission analyses.
3. Results and Discussion
The different actions were analysed for each climatic zone in terms of both energy (Section 3.1) and economic (Section 3.2) performance. Finally, the main results of the energy, economic and CO2 emissions analyses at the national level are reported in Section 3.3.
3.1. Energy Analysis by Climatic Zones
The first result of the dynamic simulations concerns the non-renewable primary energy consumption for the base case (reference scenario). Figure 4 reports the values divided both per climatic zone (a) and per type of energy use for residential buildings (heating, cooling and DHW) (b). The result for heating (515,118 TJ) is quite similar to the NG consumption reported in Table 2 (14,630 MSm3):
515,118 TJ/3.6 TJ GWh−1/9.79 GWh MSm−3 = 14,616 MSm3
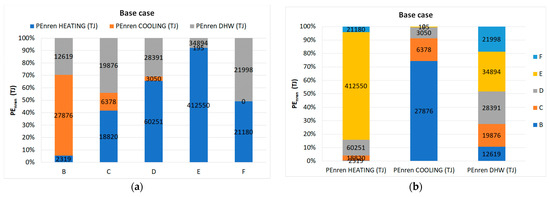
Figure 4.
Annual values of non-renewable primary energy consumption for the base case divided by climatic zone (a) and per type of utilization of energy (b).
Figure 5 reports, in the left sides and for each climatic zone (parts (a), (c), (e), (g), (i)), the annual values of NG and electricity consumption (left y-axis) and CO2 emissions (right y-axis). Looking at the overall outcome of calculations, one can appreciate factors that could be somehow unpredictable from an analytical point of view. In fact, for milder climates (zone B), the most effective actions are a1, a3 and a4, that is, respectively, reducing (during the heating season) or increasing (during the cooling season) the indoor set-point temperature by 1 °C, reducing the heating and cooling season by 15 days and both these actions. These allow for total non-renewable primary energy savings of, respectively, 22%, 23% and 38% with respect to the reference scenario (Figure 5b).
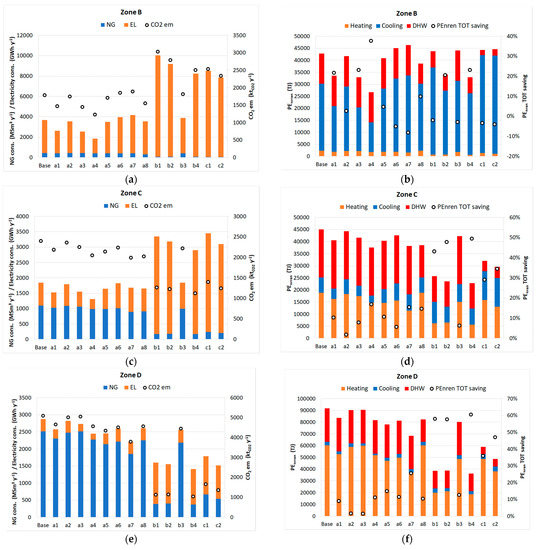
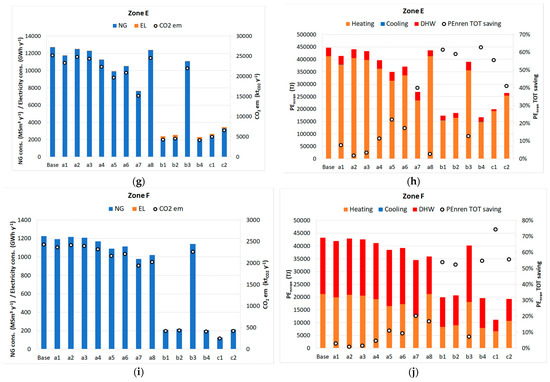
Figure 5.
Figures on the left: annual values of NG and electricity consumption (left y-axis) and CO2 emissions (right y-axis). Figures on the right: annual values of non-renewable primary energy consumption (left y-axis) and non-renewable primary energy savings with respect to the base case (right y-axis).
Action a2 (i.e., stop the heating/cooling plant one hour before) is not so effective from this point of view. Similarly, actions on the retrofitting of buildings are also not so effective: increasing the thermal insulation of walls (action a5) allows a PEnren savings of only 5%, and the replacement of windows (a6) is detrimental (negative saving). In fact, in milder climates, the savings in natural gas consumption for heating are overcompensated by the increase in electricity consumption for air conditioning during the cooling season, especially if the increase in thermal insulation of opaque and transparent surfaces of buildings is not realized together with the installation of solar radiation shading devices.
Note that reducing the time and temperature in the hot water of the shower is a very simple and effective way to reduce PEnren (action a8, saving around 10% in Figure 5b). In zone B, the energy efficiency actions b1 and b3 (that is, replacing natural gas boilers with heat pumps and installing a mechanical ventilation system with a recuperator) are not effective at all. Only substituting the old air conditioner with a more modern one can bring interesting energy savings (around 20%), even if the electricity consumption is very high due to the consumption of the heat pump for the production of DHW (Figure 5a).
Finally, in milder climates, such as zone B, installing renewable energy plants that convert solar energy to produce hot water for heating and DHW (actions c1 and c2) is not effective (PEnren is slightly negative) because the increase in the consumption of electricity from the grid due to the heat pump for DHW and the air conditioner is not fully covered by the production of PV or PVT electricity. As a matter of fact, in zone B, it would likely be better to install a solar cooling plant, as already proven by the authors [33,34,35].
Scrolling the plots from zone B to zone F, different actions seem to be more effective; energy saving strategies that are indicated for zone B are passed in terms of effectiveness by energy efficiency-based solutions and by the contribution of renewables. Looking at the right parts of Figure 5b,d,f,h,j, two major aspects are apparent in moving from milder to colder climates (that is, from the climatic zone B to F): the PEnren savings increase (they can be greater than 60%), and the actions that allow the highest PEnren are, differently from milder climates, energy efficiency (actions b) and renewable energy plants (actions c).
This is due to the increasing part of the PEnren dedicated to heating. As a matter of fact, action b1 (that is, installing a modern heating pump) appears to be the most effective action to reduce non-renewable primary energy consumption and, thus, CO2 emissions in zone E, the most diffuse zone in Italy (Figure 5g,h).
In addition, installing modern solar energy technologies, such as PV + ETC or even PVT, allows very high energy savings and the reduction of CO2 emissions, resulting in substantial savings in natural gas consumption (Figure 5g–j). It is then not possible to develop a strategy for primary energy reduction in the building sector in Italy that is uniform over the territory and different climatic areas.
3.2. Economic Analysis by Climatic Zones
The results of the energy analysis of Section 3.1 are completed by the economic analysis based on net annual OPEX (i.e., annual expenses for NG and grid electricity consumption minus the income from the avoided CO2 emissions). Such data are reported on the left y-axis of Figure 6, while, on the right y-axis, the economic savings of the different actions with respect to the base case are reported.
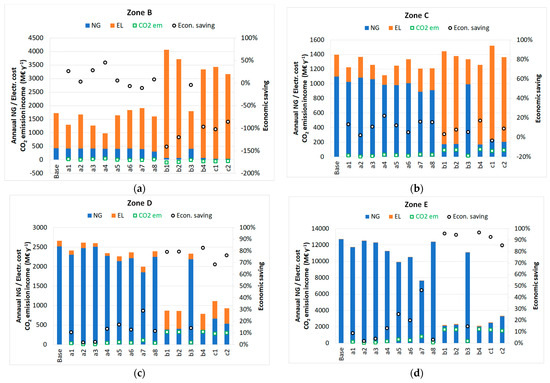
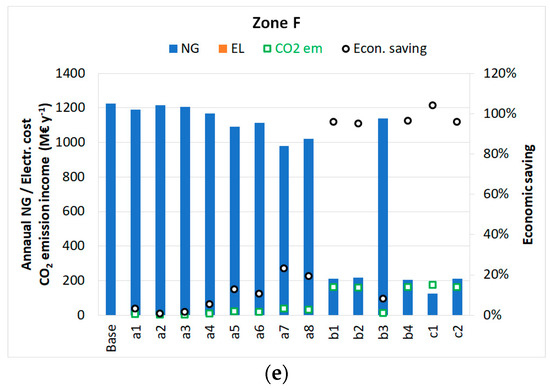
Figure 6.
Annual values of NG and electricity consumption, CO2 emissions income (left y-axis) and annual values of economic savings with respect to the base case (right y-axis) for the different climatic zones (a–e).
Energy saving strategies are often the most viable solution from the economic point of view since they require mostly behavioural actions instead of technological installations. It means that they can provide savings towards an investment that can be almost negligible. However, if the absolute value of the savings is considered, then different solutions account for different saving entities.
In milder climates (climatic zone B, Figure 6a), the most economically advantageous actions are energy saving (actions a). As in the energy analysis, actions a1, a3 and a4 allow for very high economic savings (between 26% and 45% with an annual expense between 1000 million and 1300 million €). All the other actions are not effective, with energy efficiency (actions b) and renewables (actions c) being largely negative due to the high cost of electricity from the grid for the heat pump (also for DHW) and air conditioner.
When moving to colder climates (from Figure 6a to all other parts of Figure 6), all actions are positive, as they allow for positive economic savings with respect to the reference scenario. In particular, in climatic zones E and F, the most advantageous actions are energy efficiency (the installation of a modern heat pump and air conditioner for heating, cooling and DHW; actions b) and renewable energy (actions c1 and c2). These allow for very high savings in OPEX, between 90% and 100% with respect to the base case, as a result of the savings on NG consumption.
3.3. Energy and Economic Analysis at the National Level
The foreword to this paragraph, according to what was analysed in the previous section, is that the best strategy to reduce primary energy consumption is to implement a different priority list of actions for each climatic zone; this strategy would allow for the best performance overall. However, if the strategy must be set at a national level and must be uniform on the nation’s territory, the analysis should measure the impact of each action on the whole building stock.
Based on the previous sections, Figure 7 presents the results for all climatic zones in Italy. In terms of natural gas, the action that allows the lowest consumption is b4, that is, the contemporaneous substitution of boilers and old air conditioning equipment by modern heat pumps and air conditioners and the installation of a mechanical ventilation system with heat recovery. The three energy efficiency actions allow for reduction of the NG consumption from 17,958 to 2844 MSm3 y−1. Contemporarily, there is an increase of electricity consumption from 4377 to 12,200 GWh y−1 (Figure 7a). In terms of annual non-renewable primary energy, this means a reduction from 670,400 to 278,600 TJ, that is, a savings of 58% (Figure 7b). To be clearer, the calculation examples of the base and a4 cases are reported in Table 10.
(670,400 TJ − 278,600 TJ)/670,400 TJ = 58%
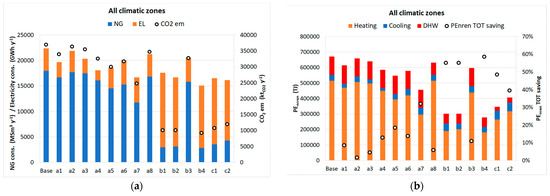
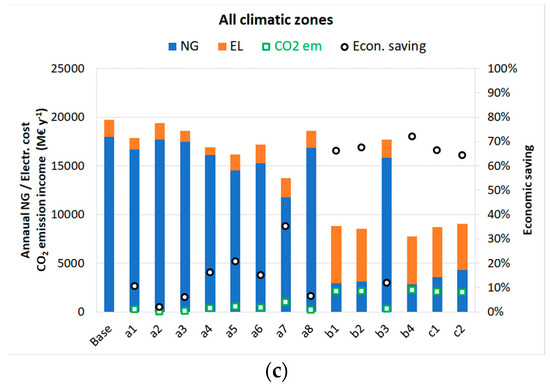
Figure 7.
Annual values of: (a) NG and electricity consumptions (left y-axis) and CO2 emissions (right y-axis); (b) non-renewable primary energy consumption (left y-axis) and savings with respect to the base case (right y-axis); and (c) economic NG and electricity consumptions and CO2 emissions incomes (left y-axis) and economic savings with respect to the base case (right y-axis).
Table 10.
Calculation examples (for the base and b4 cases) using data from Figure 5b,d,f,h,j.
This is also the best solution from the economic point of view, as the annual OPEX reduces from 19,700 million to 7730 million € (Table 11). As a matter of fact, with a massive energy efficiency action in the residential sector, it could be possible to reduce the energy bill in Italy by 72%.
(19,700 M€ − 5500 M€)/19,700 M€ = 72%
Table 11.
Calculation example (for the base and b4 cases) using data from Figure 6. Million Euro—M€.
Furthermore, installing renewable energy systems, such as PV, ETC and PVT, has extremely positive effects from both the non-renewable primary energy savings point of view (PEnren reduces to 346,000 TJ y−1 and 406,000 TJ y−1 for actions c1 and c2, respectively, with savings between 40% and 50% with respect to the base case, Figure 7b) and from the economic point of view (savings in OPEX around 65%, Figure 7c).
At the national level, it is not worth investing separately in energy saving actions (a5 and a6). Instead, investing contemporaneously in increasing the thermal insulation of opaque and transparent building surfaces (a7) is effective, as it allows savings in PEnren greater than 30% (Figure 7b) and an economic savings in OPEX of 35% (Figure 7c).
4. Conclusions
This study takes a cue from the difficult international situation concerning the supply of natural gas from Russia (owing to the crisis and the ongoing conflict in Ukraine), the relative tension regarding the prices of gas and electricity and the impetus for decarbonization. This situation has strong consequences in Italy because the Italian energy mix is largely dependent on natural gas as the primary source, especially for the residential sector.
Different actions were simulated in Trnsys® in two characteristic buildings typical of the residential buildings in Italy to evaluate the non-renewable primary energy and operative costs savings on an annual basis with respect to a base case (reference scenario). The actions were related to three different categories to establish a priority list among them. Dynamic simulation helped to define the main target through different options and priorities that arise from different climatic conditions and the characteristics of the diversified building stock.
The final results can be interpreted both from the local point of view and from the global national one, and these differences are far from negligible. Indeed, the first look shows different priority lists according to different climatic areas. For example, the warmest climate buildings proved to be more sensitive to certain useful energy savings (a4—behavioural) than to energy efficiency measures (b4). This was not proven at all in colder climates and was shown to be quite the contrary. This is proof of the consistency of the methodology adopted. When the differences of single actions on the Italian territory were considered, we found that an improved building envelope (a7) was relevant in climatic zone E but less significant in other climates.
From the national level, as a whole, the best action to implement is regarding the heating/cooling generation system, i.e., the replacement of old boilers and air conditioning equipment by modern heat pumps and air conditioners and the installation of mechanical ventilation systems with heat recovery. These “energy efficiency” measures would allow an annual non-renewable primary energy savings of 58% and a reduction of annual OPEX from 19,700 million to 7730 million €. Investing in renewable energy plants based on solar energy was found to be the second best choice as this resulted in annual non-renewable primary energy savings between 40% and 50%.
Investing in passive “energy savings” measures, such as increasing thermal insulation simultaneously on opaque and transparent building surfaces was, indeed, less effective, even if it allowed for interesting non-renewable primary energy savings (greater than 30%). Instead, the easiest actions to implement (“energy saving” linked to administrative acts, such as varying the set-point temperature inside the rooms by 1 °C, reducing the operation time by one hour per day and reducing the operating period of the plants by 15 days) were shown to be less effective at the national level than in warmer climates.
The reported set of conclusions gives very detailed information and suggests that a simplified “priority list of actions” can be identified for the Italian territory—as a whole—but that a thorough analysis can focus on modified lists of priorities specifically for each climatic zone.
These considerations can be useful for Italian political decision makers in order to define a coherent building energy policy for renovation of the existing building stock while accounting for a widely diversified territory and suggesting different actions that can be adopted and incentivized.
Author Contributions
Conceptualization, M.N. and F.B.; methodology, M.N.; software, M.N. and F.B.; validation, M.N. and F.B.; data curation, M.N.; writing—original draft preparation, M.N.; writing—review and editing, M.N. and F.B.; supervision, M.N. All authors have read and agreed to the published version of the manuscript.
Funding
This research received no external funding.
Institutional Review Board Statement
Not applicable.
Informed Consent Statement
Not applicable.
Data Availability Statement
Data supporting the findings of this study are available from the corresponding author, M.N., upon reasonable request.
Conflicts of Interest
The authors declare that they have no conflict of interest.
Nomenclature
| Symbol | Meaning | Unit |
| COP | Coefficient of performance | - |
| fp | Primary energy factor | - |
| EER | Energy efficiency ratio | |
| PE | Primary energy | (kWh, J) |
| Subscript | Meaning | |
| el | Electricity from the grid | |
| nren | Non-renewable | |
| ren | Renewable | |
| tot | Total | |
| Acronym | Meaning | Unit |
| DHW | Domestic hot water | |
| EED | Energy efficiency directive | |
| EPBD | Energy performance of buildings directive | |
| EU | European Union | |
| LHV | Lower heating value | (kWh Sm−3) |
| NG | Natural gas | |
| OPEX | OPerative EXpenses | |
| PV | Photovoltaic | |
| PVT | Photovoltaic/thermal | |
| RED | Renewable energy directive | |
| TRY | Test reference year |
References
- European Union. Directive 2010/31/EU of the European Parliament and of the Council of 19 May 2010 on the Energy Performance of Buildings. Available online: http://data.europa.eu/eli/dir/2010/31/oj (accessed on 13 February 2023).
- European Parliament. Energy Performance of Buildings: Climate Neutrality by 2050, Press Release 9 February 2023—10:09 a.m. Available online: https://www.europarl.europa.eu/news/it/press-room/20230206IPR72112/energy-performance-of-buildings-climate-neutrality-by-2050 (accessed on 6 March 2023).
- European Union. Directive (EU) 2018/2002 of the European Parliament and of the Council of 11 December 2018 Amending Directive 2012/27/EU on Energy Efficiency. Available online: https://eur-lex.europa.eu/legal-content/EN/TXT/?uri=uriserv%3AOJ.L_.2018.328.01.0210.01.ENG (accessed on 13 February 2023).
- European Union. Directive (EU) 2018/2001 of the European Parliament and of the Council of 11 December 2018 on the Promotion of the Use of Energy from Renewable Sources (Recast). Available online: https://eur-lex.europa.eu/legal-content/EN/TXT/?uri=uriserv:OJ.L_.2018.328.01.0082.01.ENG (accessed on 13 February 2023).
- Authority for the Regulation of Energy, Grids and Environment (in Italian, Autorità di Regolazione per Energia Reti e Ambiente (ARERA)). Available online: https://www.arera.it/it/dati/condec.htm (accessed on 28 February 2023).
- Ecological Transition Ministery (Ministero Della Transizione Ecologica (MITE)), 2022, La Situazione Energetica Nazionale nel. 2021. Available online: https://dgsaie.mise.gov.it/pub/sen/relazioni/relazione_annuale_situazione_energetica_nazionale_dati_2021.pdf (accessed on 28 February 2023). (In Italian)
- Singh Gaur, A.; Fitiwi, D.Z.; Curtis, J. Heat pumps and our low-carbon future: A comprehensive review. Energy Res. Soc. Sci. 2021, 71, 101764. [Google Scholar] [CrossRef]
- Ballerini, V.; Rossi di Schio, E.; Valdiserri, P. How the Energy Price Variability in Italy Affects the Cost of Building Heating: A Trnsys-Guided Comparison between Air-Source Heat Pumps and Gas Boilers. Buildings 2022, 12, 1936. [Google Scholar] [CrossRef]
- Huckebrink, D.; Bertsch, V. Decarbonising the residential heating sector: A techno-economic assessment of selected technologies. Energy 2022, 257, 124605. [Google Scholar] [CrossRef]
- Pastore, L.M.; Lo Basso, G.; de Santoli, L. Towards a dramatic reduction in the European Natural Gas consumption: Italy as a case study. J. Clean. Prod. 2022, 369, 133377. [Google Scholar] [CrossRef]
- Less, B.D.; Casquero-Modrego, N.; Walker, I.S. Home Energy Upgrades as a Pathway to Home Decarbonization in the US: A Literature Review. Energies 2022, 15, 5590. [Google Scholar] [CrossRef]
- Kowalski, P.; Szałański, P.; Cepiński, W. Waste Heat Recovery by Air-to-Water Heat Pump from Exhausted Ventilating Air for Heating of Multi-Family Residential Buildings. Energies 2021, 14, 7985. [Google Scholar] [CrossRef]
- Li, Y.; Mojiri, A.; Rosengarten, G.; Stanley, C. Residential demand-side management using integrated solar-powered heat pump and thermal storage. Energy Build. 2021, 250, 111234. [Google Scholar] [CrossRef]
- Alhuyi Nazari, M.; Rungamornrat, J.; Prokop, L.; Blazek, V.; Misak, S.; Al-Bahrani, M. An updated review on integration of solar photovoltaic modules and heat pumps towards decarbonization of buildings. Energy Sustain. Dev. 2023, 72, 230–242. [Google Scholar] [CrossRef]
- Famiglietti, J.; Toppi, T.; Bonalumi, D.; Motta, M. Heat pumps for space heating and domestic hot water production in residential buildings, an environmental comparison in a present and future scenario. Energy Convers. Manag. 2023, 276, 116527. [Google Scholar] [CrossRef]
- Christopher, S.; Vikram, M.P.; Bakli, C.; Thakur, A.K.; Ma, Y.; Ma, Z.; Xu, H.; Cuce, P.M.; Cuce, E.; Singh, P. Renewable energy potential towards attainment of net-zero energy buildings status—A critical review. J. Clean. Prod. 2023, 405, 136942. [Google Scholar] [CrossRef]
- Teso, L.; Carnieletto, L.; Sun, K.; Zhang, W.; Gasparella, A.; Romagnoni, P.; Zarrella, A.; Hong, T. Large scale energy analysis and renovation strategies for social housing in the historic city of Venice. Sustain. Energy Technol. Assess. 2022, 52, 102041. [Google Scholar] [CrossRef]
- Baldi, F.; Genova, E.; Gugliandolo, A.; Segreto, M.A. Mapping the Potential of High-Reflective Roof Coverings in Residential Buildings in Italy. Sustainability 2022, 14, 4969. [Google Scholar] [CrossRef]
- Bianco, V.; Marmori, C. Modelling the deployment of energy efficiency measures for the residential sector. The case of Italy. Sustain. Energy Technol. Assess. 2022, 49, 101777. [Google Scholar] [CrossRef]
- An, Y.S.; Kim, J.; Joo, H.J.; Han, G.W.; Kim, H.; Lee, W.; Kim, M.H. Retrofit of renewable energy systems in existing community for positive energy community. Energy Rep. 2023, 9, 3733–3744. [Google Scholar] [CrossRef]
- Wang, X.; Ding, C.; Zhou, M.; Cai, W.; Ma, X.; Yuan, J. Assessment of space heating consumption efficiency based on a household survey in the hot summer and cold winter climate zone in China. Energy 2023, 274, 127381. [Google Scholar] [CrossRef]
- Capelo, S.; Soares, T.; Azevedo, I.; Fonseca, W.; Matos, M.A. Design of an Energy Policy for the Decarbonisation of Residential and Service Buildings in Northern Portugal. Energies 2023, 16, 2239. [Google Scholar] [CrossRef]
- Earle, L.; Maguire, J.; Munankarmi, P.; Roberts, D. The impact of energy-efficiency upgrades and other distributed energy resources on a residential neighborhood-scale electrification retrofit. Appl. Energy 2023, 329, 120256. [Google Scholar] [CrossRef]
- CTI—Comitato Termotecnico Italiano. Weather Reference Year. Available online: https://www.cti2000.it/index.php?controller=news&action=show&newsid=34985 (accessed on 15 December 2022). (In Italian).
- ENEA. Azioni Amministrative e Comportamentali per la Riduzione del Fabbisogno Nazionale di Gas Metano. Settore Residenziale. 2022. Available online: https://www.enea.it/it/seguici/events/conferenza-stampa/RapportotecnicoAzioniperlariduzionedelFabbisognoNazionalediGas.pdf (accessed on 15 December 2022). (In Italian).
- Terrinoni, L.; Signoretti, P.; Iatauro, D. Indice di Severità Climatica: Classificazione dei Comuni Italiani ai Fini Della Climatizzazione Estiva Degli Edifici; Report RdS/2012/107; ENEA: Roma, Italy, 2012. (In Italian) [Google Scholar]
- Solar Energy Laboratory. Trnsys 17. TRaNsient SYstem Simulation Program; University of Wisconsin-Madison and Thermal Energy System Specialists: Madison, WI, USA, 2012. [Google Scholar]
- Vialetto, G.; Noro, M.; Rokni, M. Innovative household systems based on solid oxide fuel cells for the Mediterranean climate. Int. J. Hydrogen Energy 2015, 40, 14378–14391. [Google Scholar] [CrossRef]
- UNI/TS 11300-1:2014; Prestazioni Energetiche degli Edifici—Parte 1: Determinazione del Fabbisogno di Energia Termica Dell’edificio per la Climatizzazione Estiva ed Invernale. Italian Standard Organization: Milano, Italy, 2014. (In Italian)
- Italian Government. Decreto del Presidente Della Repubblica 26 Agosto 1993, n. 412 Regolamento Recante Norme per la Progettazione, L’installazione, L’esercizio e la Manutenzione Degli Impianti Termici Degli Edifici ai Fini del Contenimento dei Consumi di Energia, in Attuazione Dell’art. 4, Comma 4, Della Legge 9 Gennaio 1991, n. 10. Available online: https://www.gazzettaufficiale.it/eli/id/1993/10/14/093G0451/sg (accessed on 14 February 2023). (In Italian).
- Italian Economic Development Ministry. Decreto Interministeriale 26 Giugno 2015—Adeguamento Linee Guida Nazionali per la Certificazione Energetica Degli Edifici. Available online: https://www.mise.gov.it/index.php/it/normativa/decreti-interministeriali/decreto-interministeriale-26-giugno-2015-adeguamento-linee-guida-nazionali-per-la-certificazione-energetica-degli-edifici?fbclid=IwAR0b1hSl5RfM4gkwQl14MuTMPZTjoaQcbJc5TDupjldOBSihzHZsfJiILyM?hitcount=0?hitcount=0?hitcount=0?hitcount=0?hitcount=0?hitcount=0?hitcount=0?hitcount=0?hitcount=0?hitcount=0?hitcount=0 (accessed on 13 February 2023). (In Italian)
- UNFCCC. Inventario delle Emissioni di CO2. 2021. Available online: https://www.assolombarda.it/servizi/ambiente/informazioni/ets-tabella-parametri-standard-nazionali (accessed on 28 January 2023). (In Italian).
- Lazzarin, R. Solar cooling: PV or thermal? A thermodynamic and economical analysis. Int. J. Refrig. 2014, 39, 38–47. [Google Scholar] [CrossRef]
- Noro, M.; Lazzarin, R. Solar cooling between thermal and photovoltaic: An energy and economic analysis in different climates. Energy 2014, 73, 453–464. [Google Scholar] [CrossRef]
- Lazzarin, R.; Noro, M. Past, present, future of solar cooling: Technical and economical considerations. Sol. Energy 2018, 172, 2–13. [Google Scholar] [CrossRef]
Disclaimer/Publisher’s Note: The statements, opinions and data contained in all publications are solely those of the individual author(s) and contributor(s) and not of MDPI and/or the editor(s). MDPI and/or the editor(s) disclaim responsibility for any injury to people or property resulting from any ideas, methods, instructions or products referred to in the content. |
© 2023 by the authors. Licensee MDPI, Basel, Switzerland. This article is an open access article distributed under the terms and conditions of the Creative Commons Attribution (CC BY) license (https://creativecommons.org/licenses/by/4.0/).