1. Introduction
In 2021, the transportation sector was responsible for about 28% of the total U.S. energy consumption [
1]. The train sector accounts for a small portion of this total transportation energy consumption. Based on the 2020 U.S. Bureau of Transportation Statistics data, the railroad sector accounted for 1.8% of the total transportation energy consumption and moved 27.4% of all intercity freight ton-miles. In contrast, trucks consume 23.8% of all total transportation energy and move 46.2% of all total intercity freight ton-miles [
2]. For energy efficiency, trains have significant aerodynamic advantages compared to trucks since their cars are closely spaced. Trains are labor efficient since only a few people are required to operate a single train with multiple cars and each railcar is equivalent to three trucks.
Energy consumption and railroad operations are of major interest to train operators and railroad policy makers. An energy efficient railroad operation can significantly reduce the transportation sector’s total energy consumption since trains are relatively more energy efficient compared to other transportation modes in other sectors. Train simulation is a useful method for performing model train operations and estimating train energy use. A train simulator also requires an adequate energy model to estimate accurate train energy consumption.
However, globally, the railroad sector has diverse characteristics, making modeling more difficult. Each country has different railway systems that are operated by various public and private companies. Passenger rail systems vary from low-speed small trains with frequent stops to intercity high-speed passenger trains. Additionally, there are long-haul high-speed freight trains that carry goods. The objective of this study is to develop a diesel train energy consumption model that can be implemented into train simulators and applied to various ecodriving train operational applications.
Ecodriving and optimum train speed control strategies to reduce energy consumption in railways are found in various references [
3,
4,
5,
6,
7,
8,
9,
10,
11,
12,
13,
14,
15]. Lukaszewicz [
3] conducted research on train driver models to assess the train’s running time and energy usage in simulations. Bocharnikov [
4] and colleagues examined the tradeoff between saving energy and reducing travel time by designing a fitness function with variable weightings. They utilized a genetic algorithm search method to determine the best train trajectories. Sicre et al. [
5] developed a simulation-based model for manual driving strategies that can minimize energy consumption in high-speed trains. The model used the train’s motion based on track and train characteristics, as well as operational constraints, with a genetic algorithm to select the optimal driving approach. Haahr et al. [
7] developed a dynamic programming algorithm to reduce train energy consumption by creating better train speed profiles using a time–space graph formulation. Zhang et al. [
8] introduced a new method called deep reinforcement-based train operation (DRTO), which involves a deterministic deep reinforcement learning algorithm, a dynamic incentive system, and an event-driven approach to improve DRTO performance based on event-driven strategies. Cao [
9] and colleagues proposed a trajectory optimization approach for high-speed trains to reduce traction energy consumption and enhance riding comfort. The study considered three new factors: discrete throttle settings, neutral zones, and sectionalized tunnel resistance. The model was discretized and transformed into a multistep decision optimization problem. George [
10] created an algorithm that determines the best trajectory for a freight train carrying cargo over a specific distance by optimizing acceleration, coasting, and deceleration. The ecodriving problem was solved using mixed-integer nonlinear programming (MINLP) from the Opti-Solver toolbox. Zhu and colleagues developed a Q-Learning-based model for ecodriving in trains. The study used a finite Markov decision process and Q-Learning approach to determine the most energy-efficient distribution policy. The study introduced two state definitions based on trip time and energy distribution and formulated the energy-efficient train control problem using the two state definitions. The study introduced two state definitions based on trip time and energy distributions and formulated the energy-efficient train control problem using the two state definitions. Yuan and Frey [
13] investigated inter-run variability in Metrorail segment speed trajectories, taking into account factors such as operation mode (OM) sequence, peak speed, acceleration/deceleration rate, and speed transients. Through 100 simulations per segment, the study found that energy savings ranging from 5% to 50% among segments and from 14% to 18% at the system level can be achieved without changing travel time. Sicre [
14] proposed an effective driving approach for high-speed trains using a genetic algorithm with fuzzy parameters based on an accurate simulation of the train’s motion. The proposed model was applied to an actual Spanish high-speed line to assess the energy savings provided by the efficient regulation algorithm compared to typical driving styles. Fernández-Rodríguez [
15] and colleagues developed a dynamic multiobjective model to calculate a set of efficient drivings that can be updated during real-time operation. Using this model, it is possible to react when delays arise by replacing the current driving with a faster and more energy-efficient one. The model is solved using the extension of NSGA-II for dynamic optimization problems (DNSGA-II), combined with a detailed simulator of the train’s motion. When developing an energy-use reduction strategy, it is essential to estimate accurate energy consumption and to utilize an appropriate energy consumption model. Various factors affect the energy consumption of trains, including train characteristics, trip-related factors, and route-related factors. The major factors influencing energy consumption include train type; travel distance; trip route, including grade and curvature; and load. Electric trains are typically powered by electricity from the grid and diesel-powered trains are powered by diesel engines consuming diesel fuel.
A train’s energy efficiency can be measured as total energy used per unit of distance traveled (e.g., gallons/L per mile/km). For light trains, the energy consumption estimation is typically expressed as the energy required to operate the train per weight-distance. This mass-specific method can be used for all locomotive types, including diesel, electric, or hydrogen, and is easy to use for estimating macroscopic energy consumption for overall energy efficiency. However, this method is not suitable to evaluate new operational strategies such as ecospeed control and ecotransit programs.
The study presents a train energy consumption model that estimates a train’s instantaneous energy usage by utilizing vehicle operational input variables, such as speed, acceleration, roadway grade, and track curvature, which can be simply obtained from GPS loggers or various applications [
16]. The proposed model can be used as a supplemental energy model given that it develops a simple model that can be applied in various train operational applications and train simulators. The rest of the paper is organized as follows: the subsequent section outlines the train fuel consumption data that were utilized for the study, followed by a description of the proposed model development and validation results in the following sections. Finally, the study’s conclusions are summarized.
2. Fuel Consumption Data
This study utilized a dataset that was collected by North Carolina State University. The data were collected for the Amtrak-operated Piedmont train rail route between Raleigh, NC, and Charlotte, NC. Diesel passenger trains are pulled by a diesel-electric locomotive with a diesel prime mover engine, which typically has 3000 hp or larger power. All data were collected from an EMD F59PH locomotive and all trains included three passenger cars. The total weight of test trains was 344 tons. Fuel measurements were conducted using a portable emissions measurement system (PEMS). A detailed description of the data collection can be found in [
17,
18,
19,
20,
21,
22]. We utilized data from 23 one-way trips in which four single locomotive trains traveled between Raleigh, NC, and Charlotte, NC. The data were collected and recorded every second for a total of 247,103 s (or 68.6 h). When analyzing the train data, the study did not consider the energy effects of the external environment. The train’s operational data were gathered on several occasions between May 2013 and August 2018 in North Carolina, USA. The data collection occurred within the temperature range of 11 to 31 °C, which falls within the normal temperature range. Additionally, the study did not consider the load factor and assumed that the total weight of the train remains constant throughout the entire journey, including a constant number of passengers.
Table 1 summarizes the train trip characteristics. The dataset for Train 1, NC1797, included five one-way trips and the dataset collected from Trains 2, 3, and 4 (or NC1810, NC1859, and NC1893) included six one-way trips. Some trip data were missing from the Train 2 and 4 datasets. Consequently, the trip distance for Trains 2 and 4 was shorter than the trip distance of Train 3. The total trip durations were 16.3, 16.9, 20.1, and 15.4 h for Trains 1 through 4, respectively.
Table 1 also demonstrates that Train 1 consumed more fuel than Trains 2 and 4 even though they traveled shorter distances; the fuel consumption rates (kg/km) of Trains 1, 2, 3, and 4 were 2.41, 2.19, 2.09, and 2.04 kg/km, respectively. Train 1 consumed significantly more fuel than the other trains and the data show that Trains 2, 3, and 4 were 11.3%, 13.2%, and 15.3% more fuel efficient than Train 1 for the collected dataset. According to information from Wikipedia [
23], the typical efficiency of trains in the USA is 0.478 km per liter (equivalent to 1.125 miles per gallon). Train 1, Train 2, Train 3, and Train 4 had measured efficiency rates of 0.380 km/L (0.893 mpg), 0.427 km/L (1.005 mpg), 0.438 km/L (1.029 mpg), and 0.448 km/L (1.055 mpg), respectively. These figures represent a difference of 21%, 11%, 8%, and 6% compared to the average efficiency of US trains. The results indicate that the test trains consumed up to 21% more fuel than the average US train.
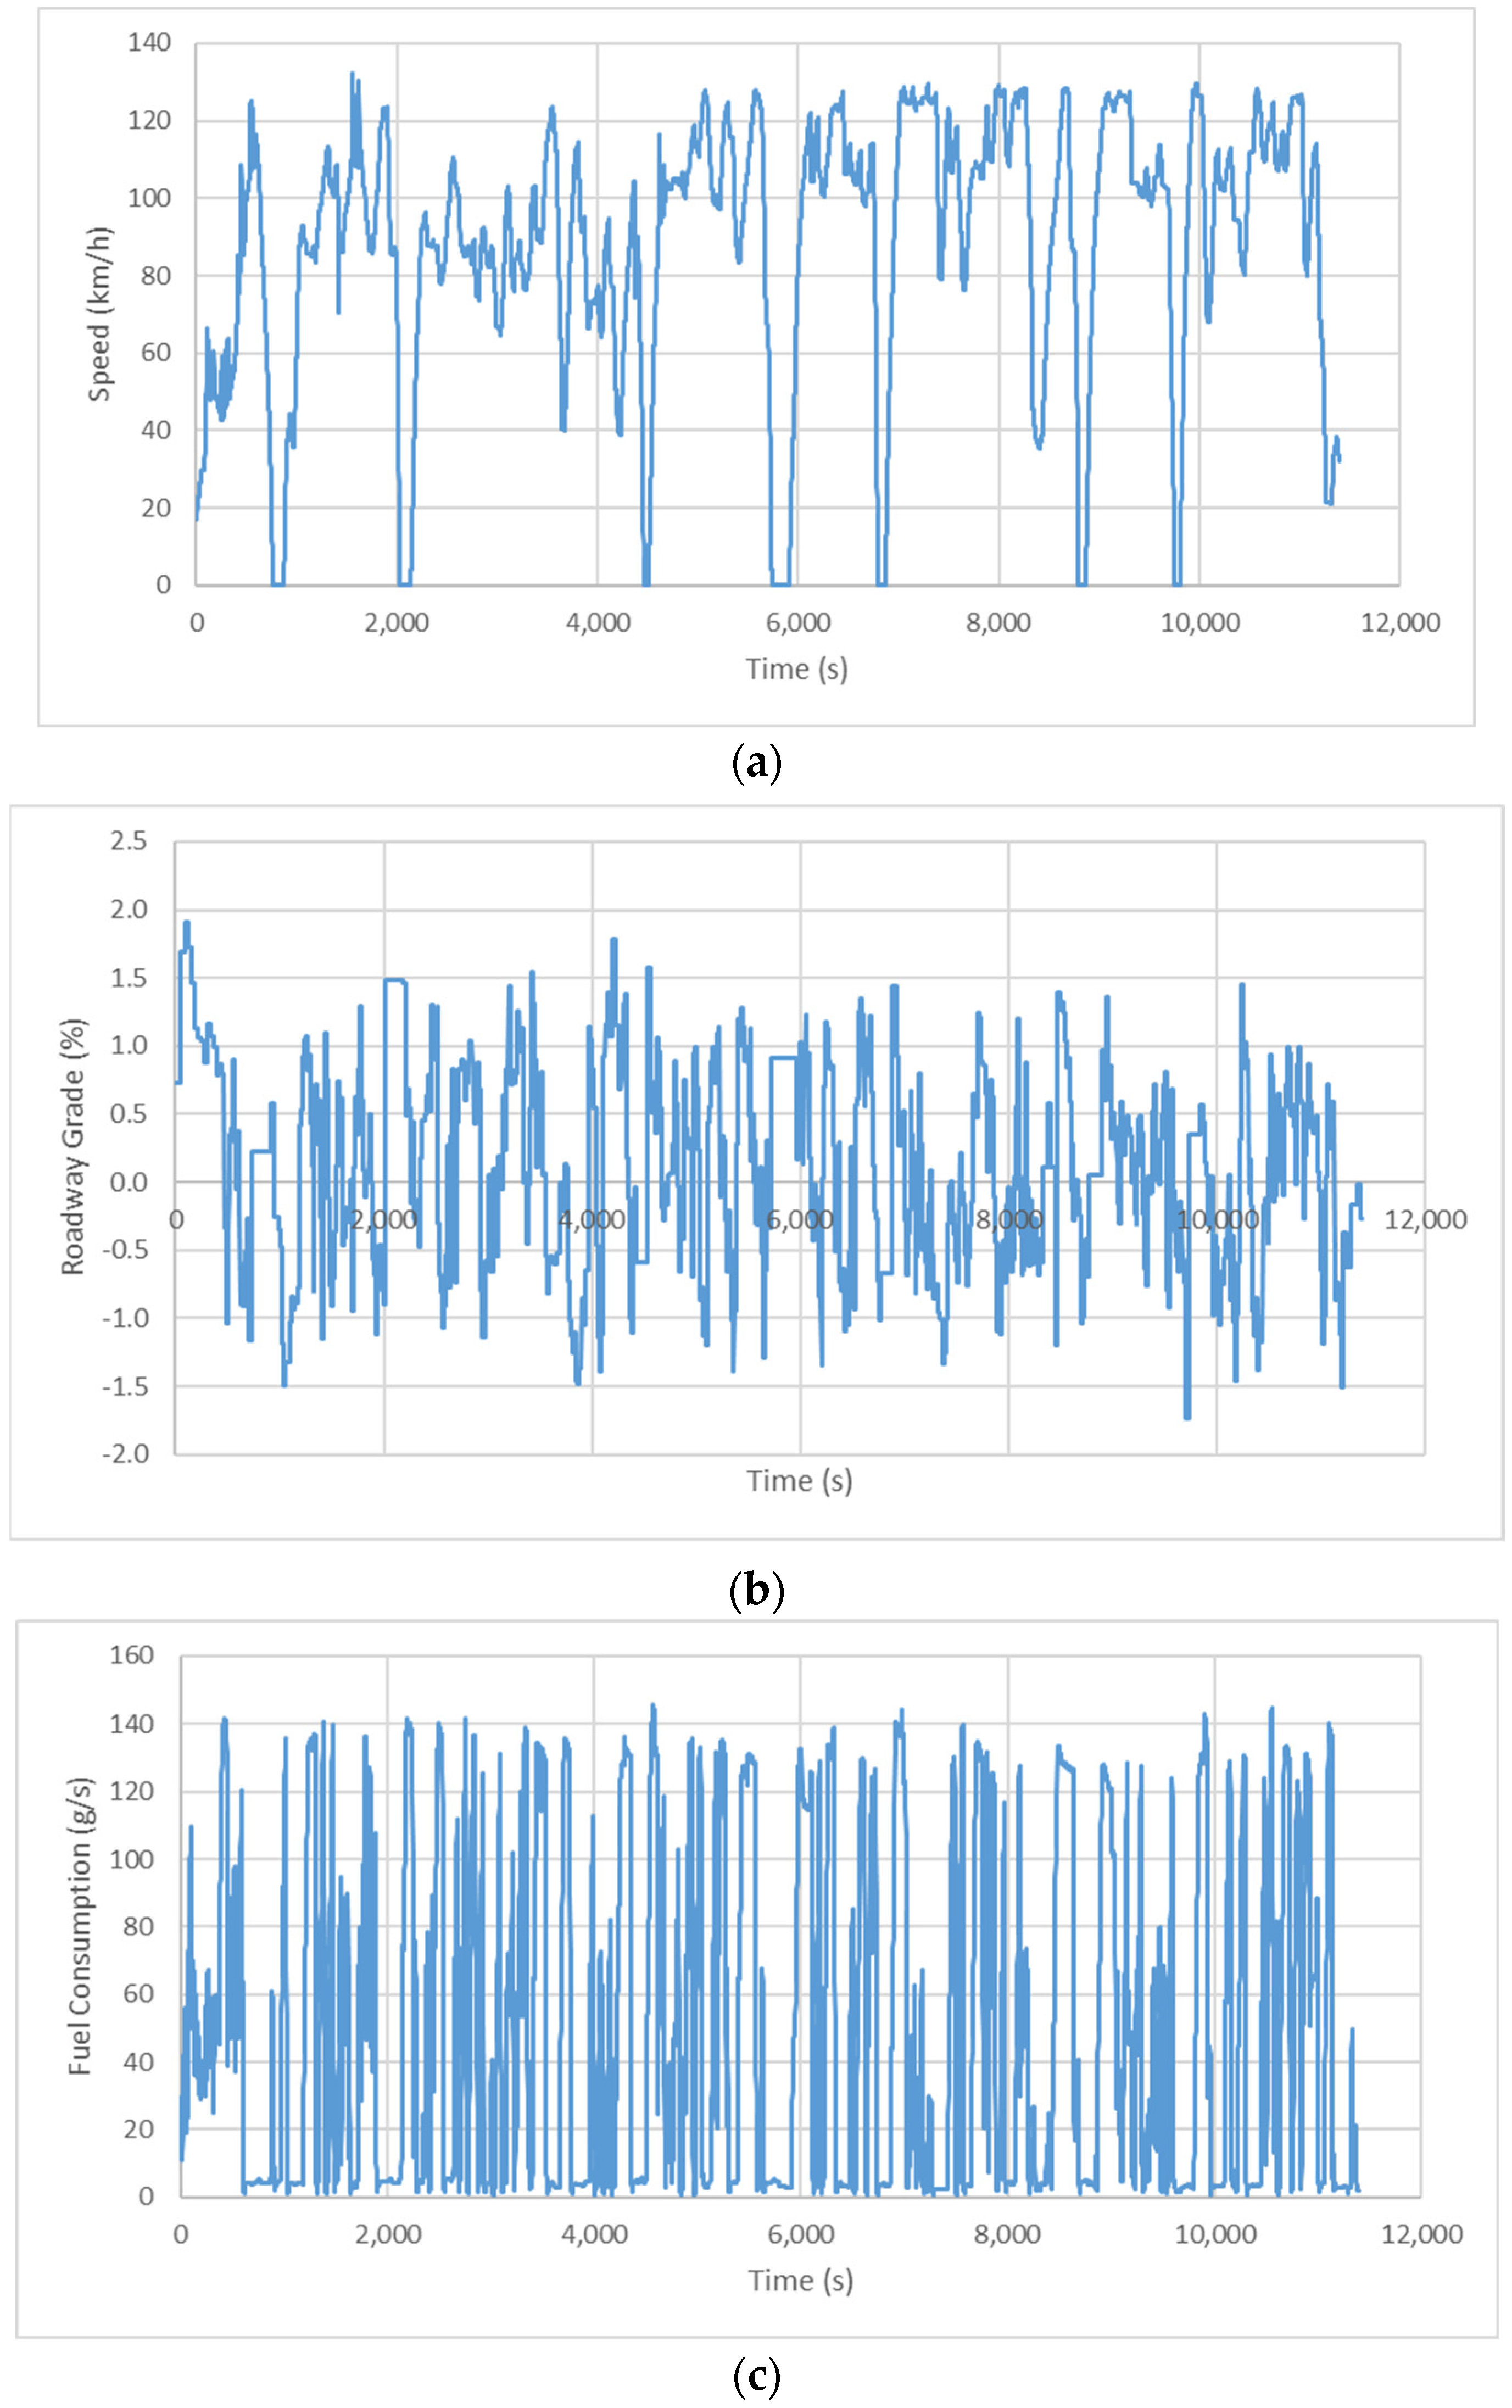
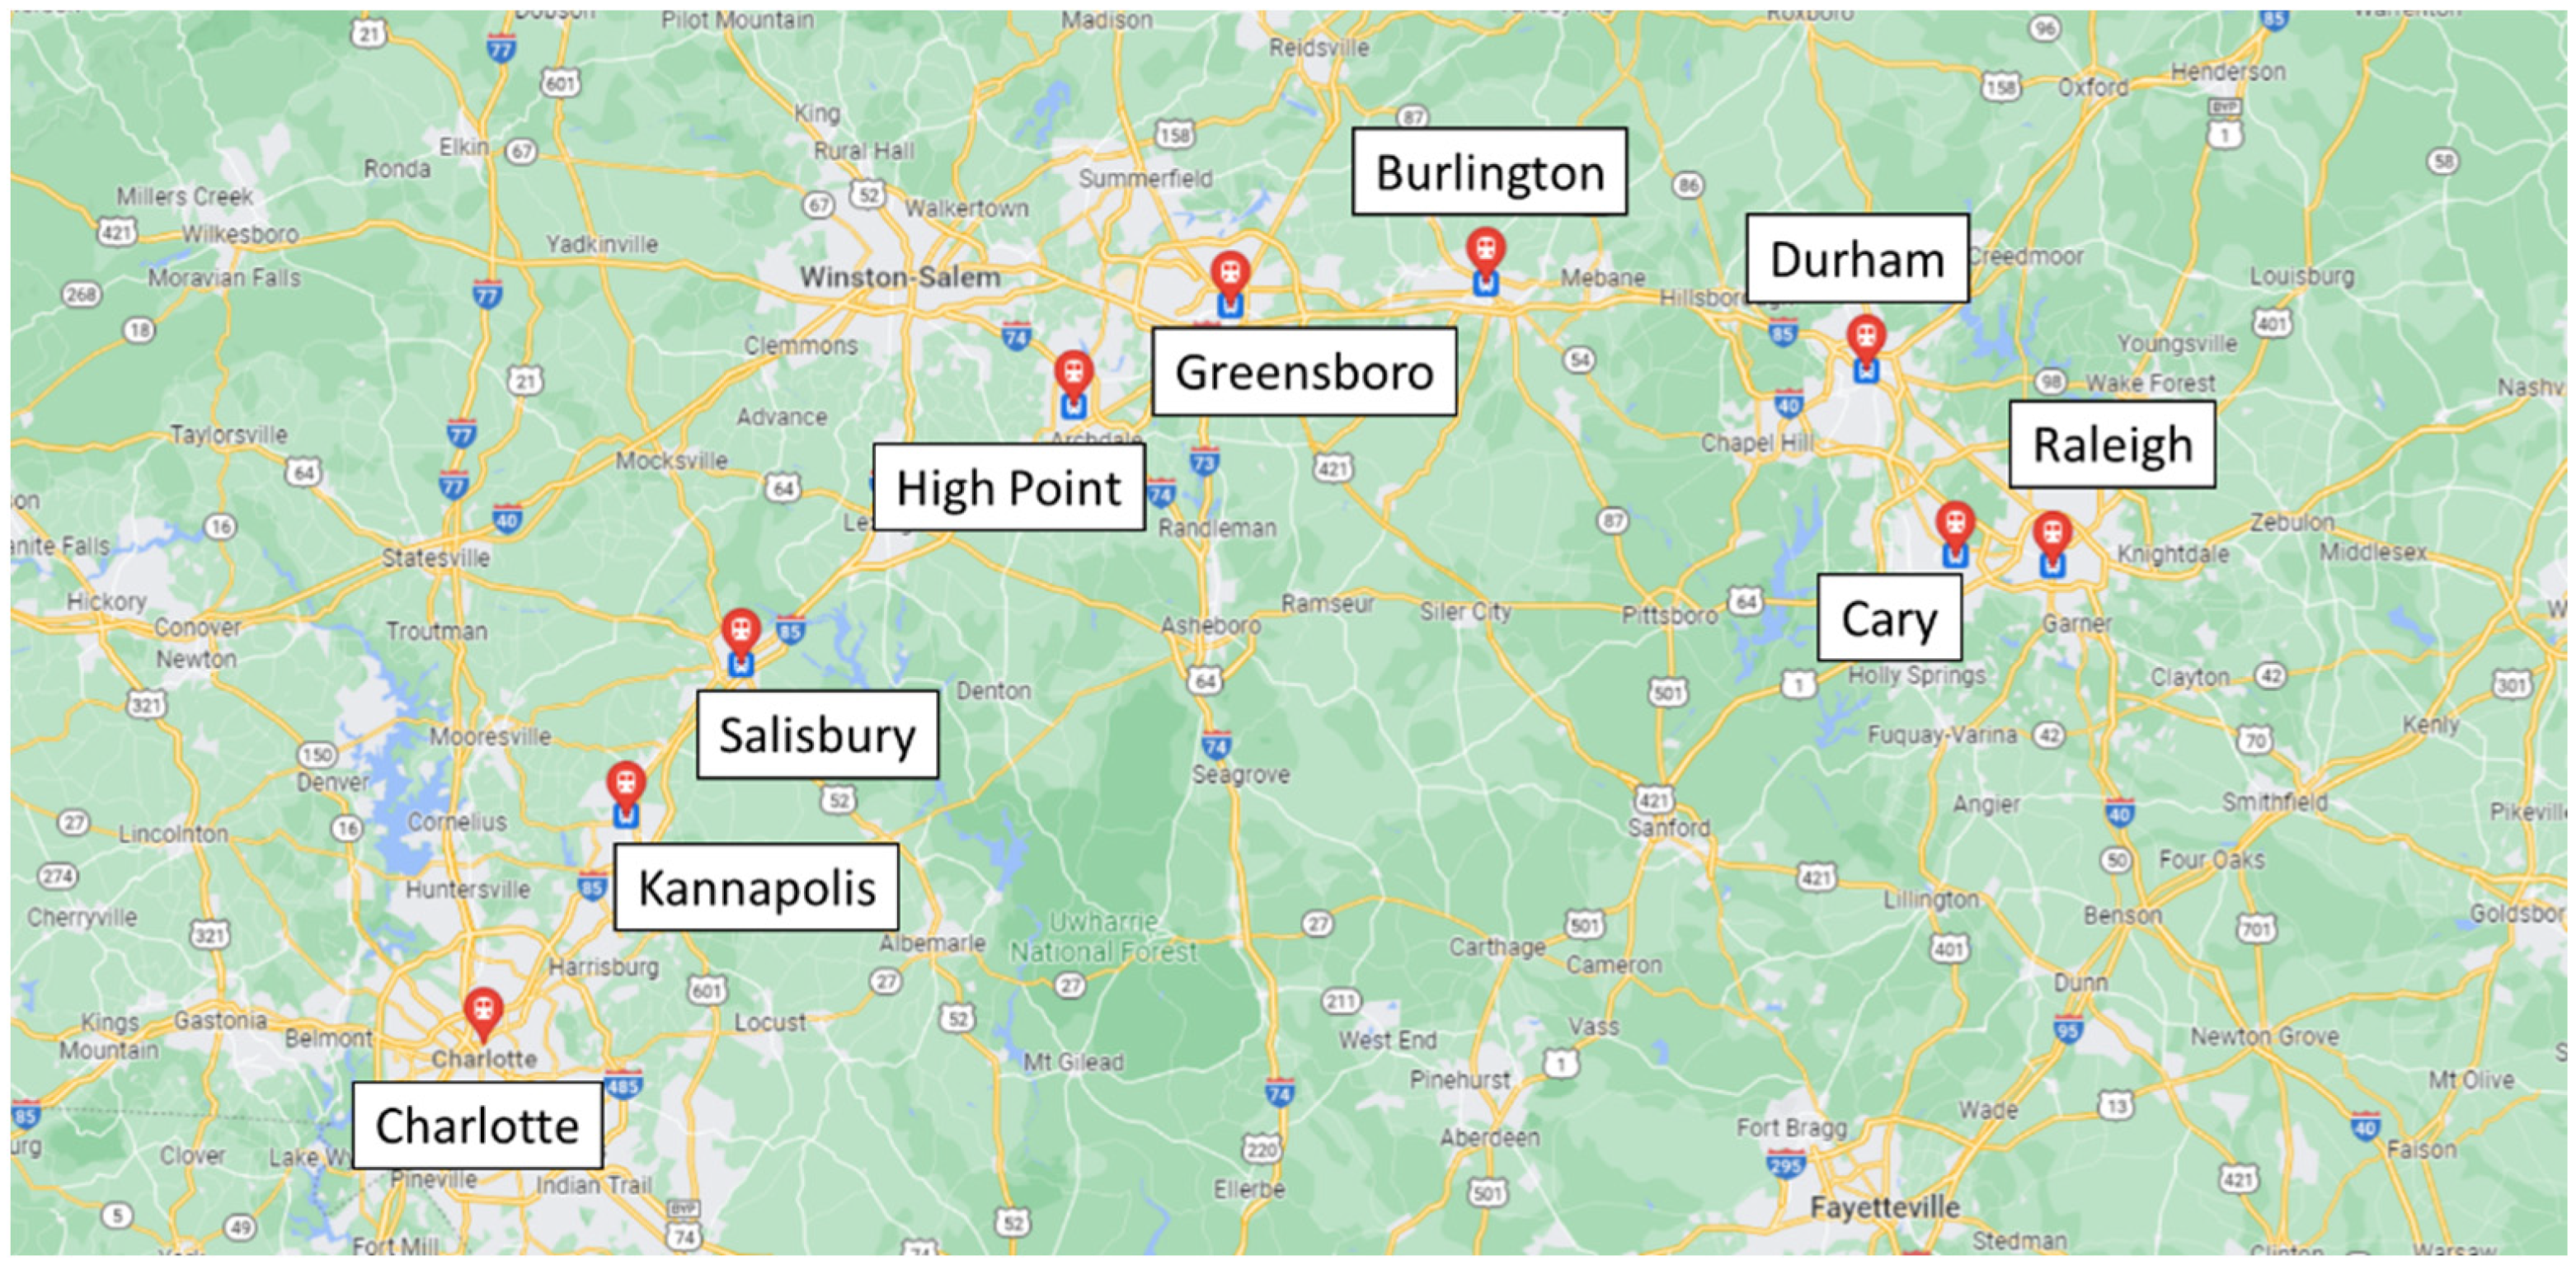
Figure 1 illustrates the speed profile, roadway grade, and fuel consumption data of a sample trip; this is a westbound Train 1 trip, which travelled from Raleigh, NC, USA, to Charlotte, NC, USA. The trip includes seven stops at the Cary, Durham, Burlington, Greensboro, High Point, Salisbury, Kannapolis rail stations. The total distance was 278.6 km (173.1 mile) for a 3.17 h trip. The average speed of the trip was 87.9 km/h (54.6 mph) with a maximum speed of 132.3 km/h (82.2 mph). The westbound trip involved moderate uphill travel with a maximum slope of 1.91% and a minimum slope of −1.73%. The respective altitudes of the Raleigh and Charlotte stations are 93 and 215 m above sea level. The total fuel consumption of the sample trip was 565.7 kg, or 7072 kWh, and the energy consumption rate was 25.4 kWh/km (40.9 kWh/mi).
Figure 2 illustrates the locations of railway stations.
We converted fuel consumption data to energy consumption in this study since energy consumption is a broader term that involves all types of energy uses, including fuel, electricity, and other forms of energy. We converted one gram of diesel fuel to 0.00031 gallon and converted 1 gallon of diesel to 40.7 kWh.
Table 2 summarizes the field-collected energy consumption data. The table explains that Train 1 consumed more energy per distance compared to other trains. The energy consumption rates of Train 1 were 29.9 and 30.3 kWh/km for eastbound and westbound trips, respectively. For eastbound trips, Train 2 consumed the lowest energy with 26.1 kWh/km and for westbound trips, Train 4 had the most energy efficient trips with 23.5 kWh/km. Train 1 consumed 13% and 22% more energy than Train 2 and Train 4 for the eastbound and westbound trips, respectively. The field data contains more westbound trips than eastbound trips. Therefore, the average distance and the travel time of westbound trips were longer than those of eastbound trips.
Table 3 shows energy consumption by each segment between various stations. Segments 3 and 4 (Durham to Burlington) and segments 6 and 7 (High Point to Salisbury) were the longest sections, at 53.5 and 55.2 km, and consumed more energy than other sections for both eastbound and westbound trips. However, the table shows that for eastbound trips, segments 3–2 and 9–8 consumed the most energy at 30.0 and 30.1 kWh/km, and that segment 4–3 was the most energy efficient section at 23.7 kWh/km. For westbound trips, segment 1–2 was the least energy efficient section at 40.2 kWh/km, and segment 6–7 was the most energy efficient section at 23.5 kWh/km. The average speed was estimated based on the measured trips.
3. Energy Consumption Modeling
It is difficult to estimate a trains’ energy consumption due to the complexity of the train dynamics and the lack of real-world field fuel consumption data. This study utilizes train dynamics based on the 1992 Canadian National resistance method in [
24]. The tractive effort of the locomotive should overcome the resistance forces, including the rolling friction, bearing resistance, train dynamic losses, and air resistance. Rolling friction between wheel and rail is a constant for a given quality of track. Bearing resistance varies based on the weight on each axle and the characteristics of the bearing used. Train dynamic losses vary with train speed, rail alignment, track quality, the surface conditions of the rail under load, the horizontal contour of the railhead, contour and condition of the wheel tread, and the tracking effect of the train. Air resistance is a function of the cross-sectional area of the vehicle, its length and shape, and the speed. The study utilized the modified Davis equation coefficients [
24] to consider new train characteristics, as expressed in Equation (1).
The gradient resistance force and curve resistance forces are added in Equation (2). Curve resistance is converted to an equivalent grade resistance by assuming that the unit resistance of a 1° curve is the same as the resistance of a 0.04% grade [
25]. Given that the Davis equation generates the resistance force in lbs, the unit conversion (4.4482) is used to convert from units of lbs to Newtons. Hence, the final resistance for each locomotive (
) or car (
) is expressed in Equation (2).
The tractive force at the wheel is estimated using Equation (3) and the power at the wheel (instantaneous energy use) to move the train forward is computed using Equation (4). To compute the power at the tank, we add the auxiliary power to calculate the final power consumption using Equation (5). The auxiliary power was estimated using the field data (.
The energy consumed by the train can then be computed using Equation (6). Various efficiency factors are considered to estimate the energy consumption of diesel locomotives. Some studies utilize fixed diesel engine efficiency after data calibration and some studies utilize variable efficiency factors. This study utilizes the train driveline efficiency,
, which combines a wheel-to-DC-bus efficiency,
and DC-bus-to-tank efficiency,
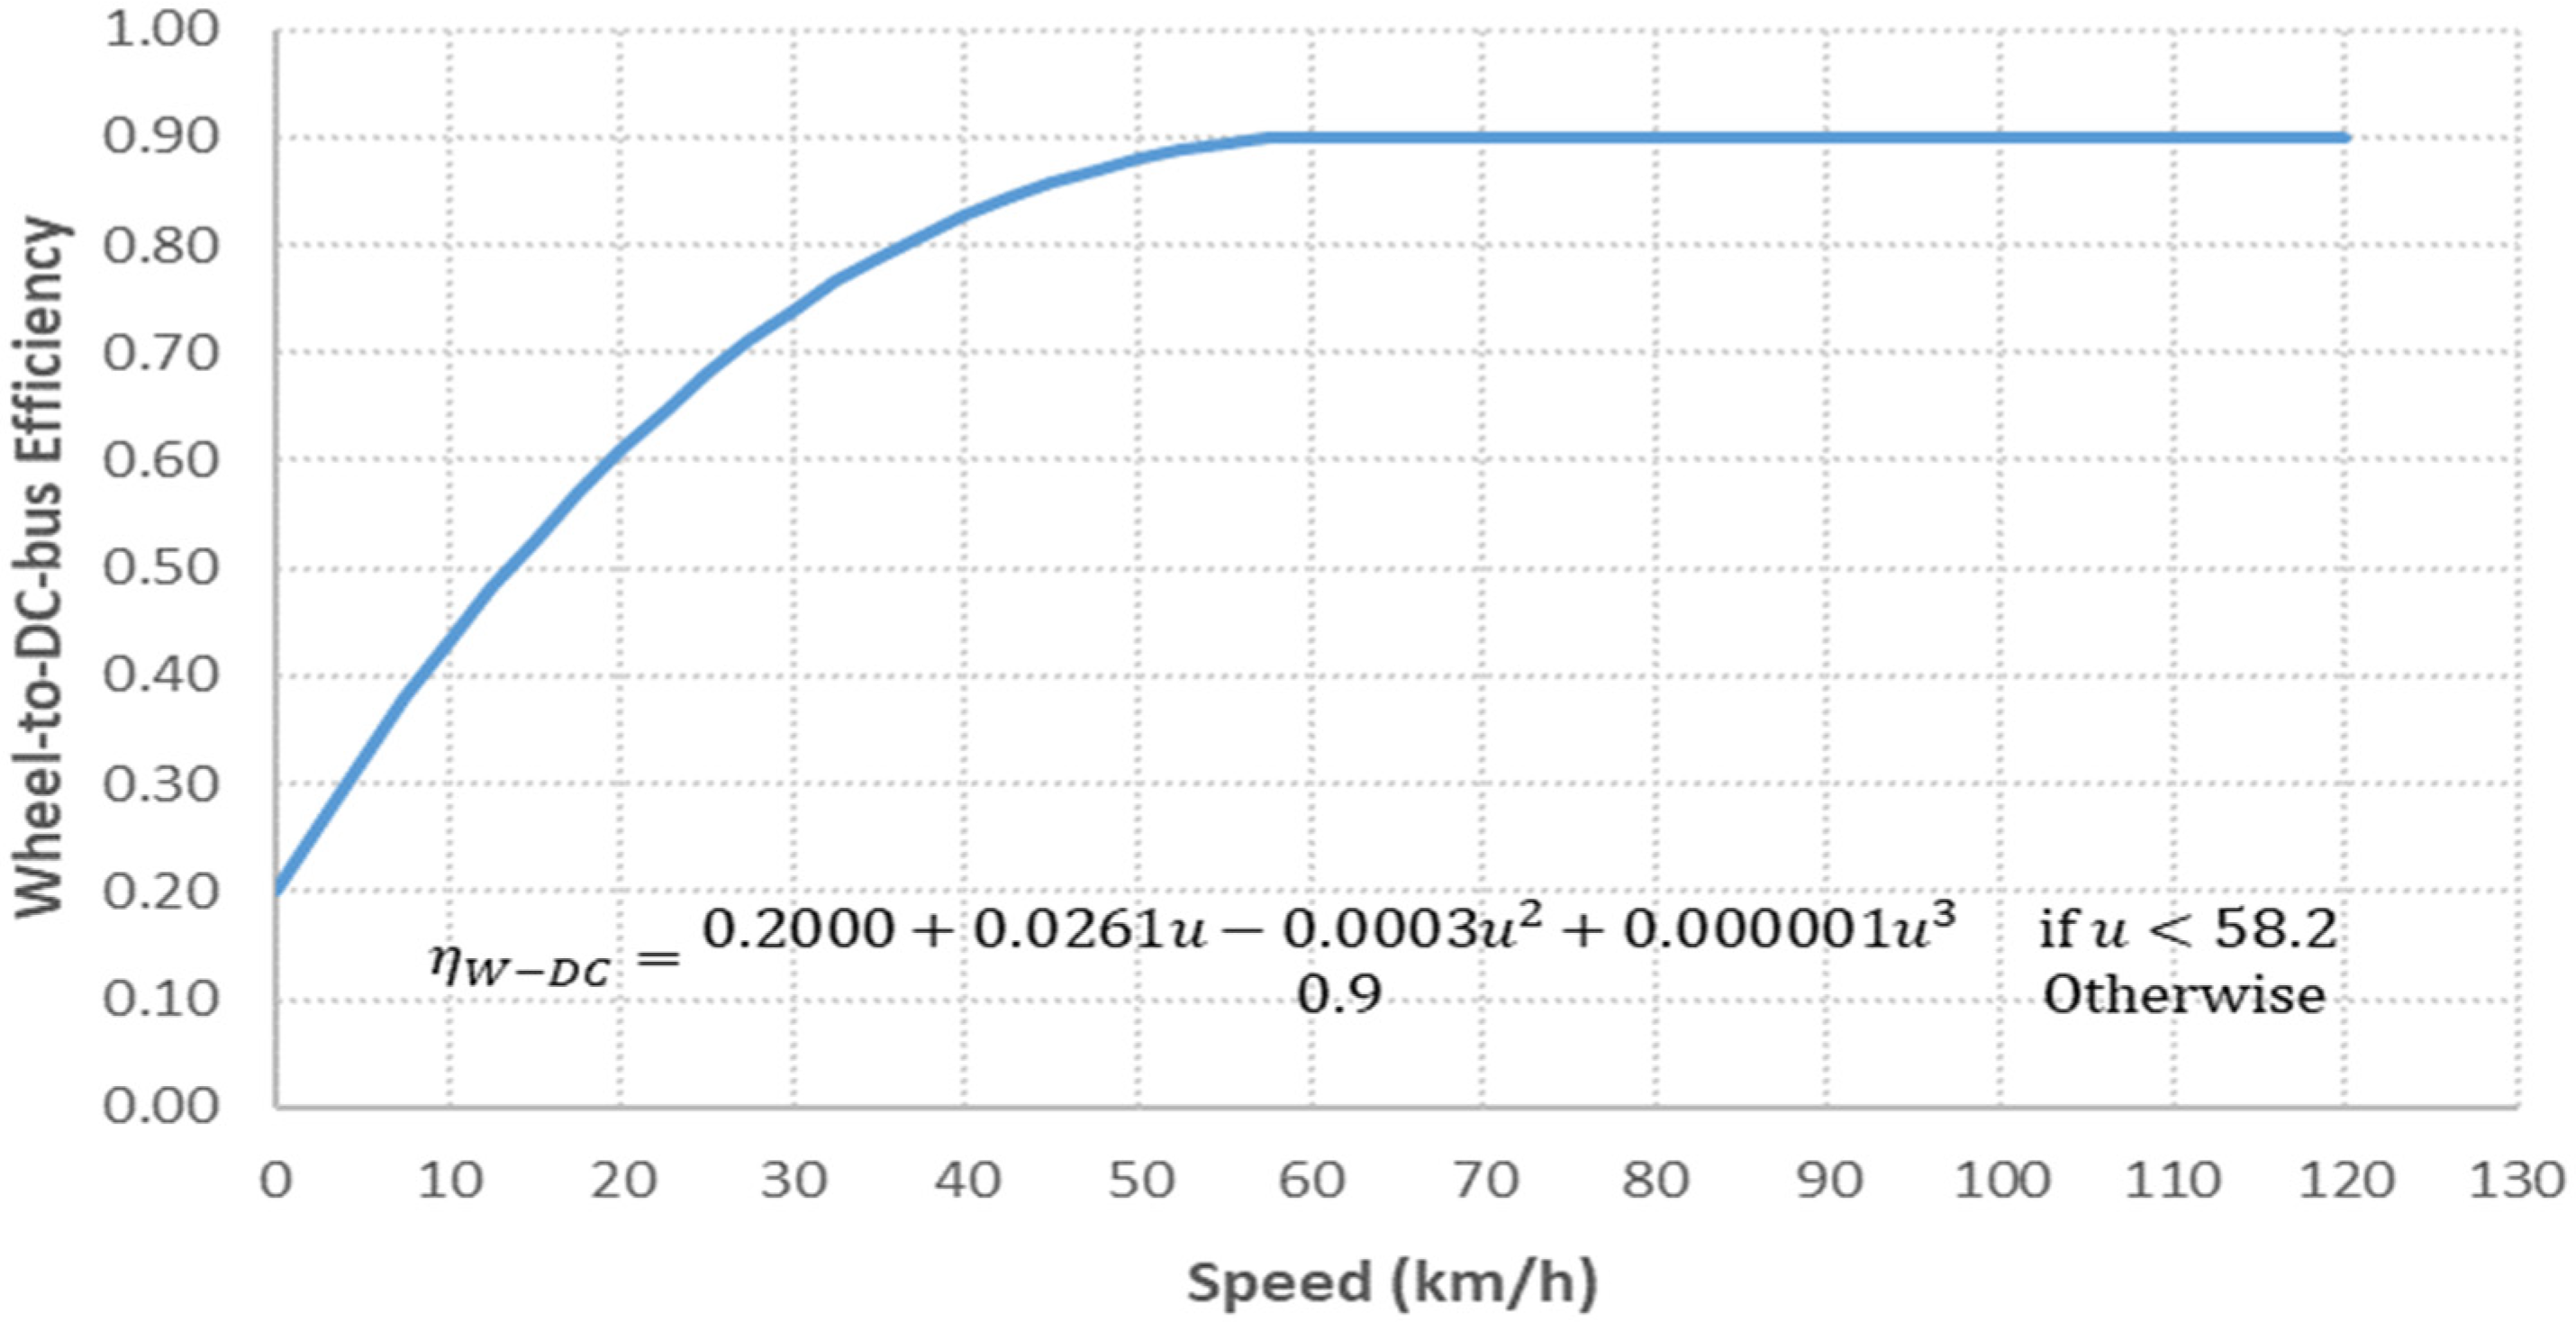
. The wheel-to-DC-bus efficiency is a function of the train speed, as shown in
Figure 3 [
26].
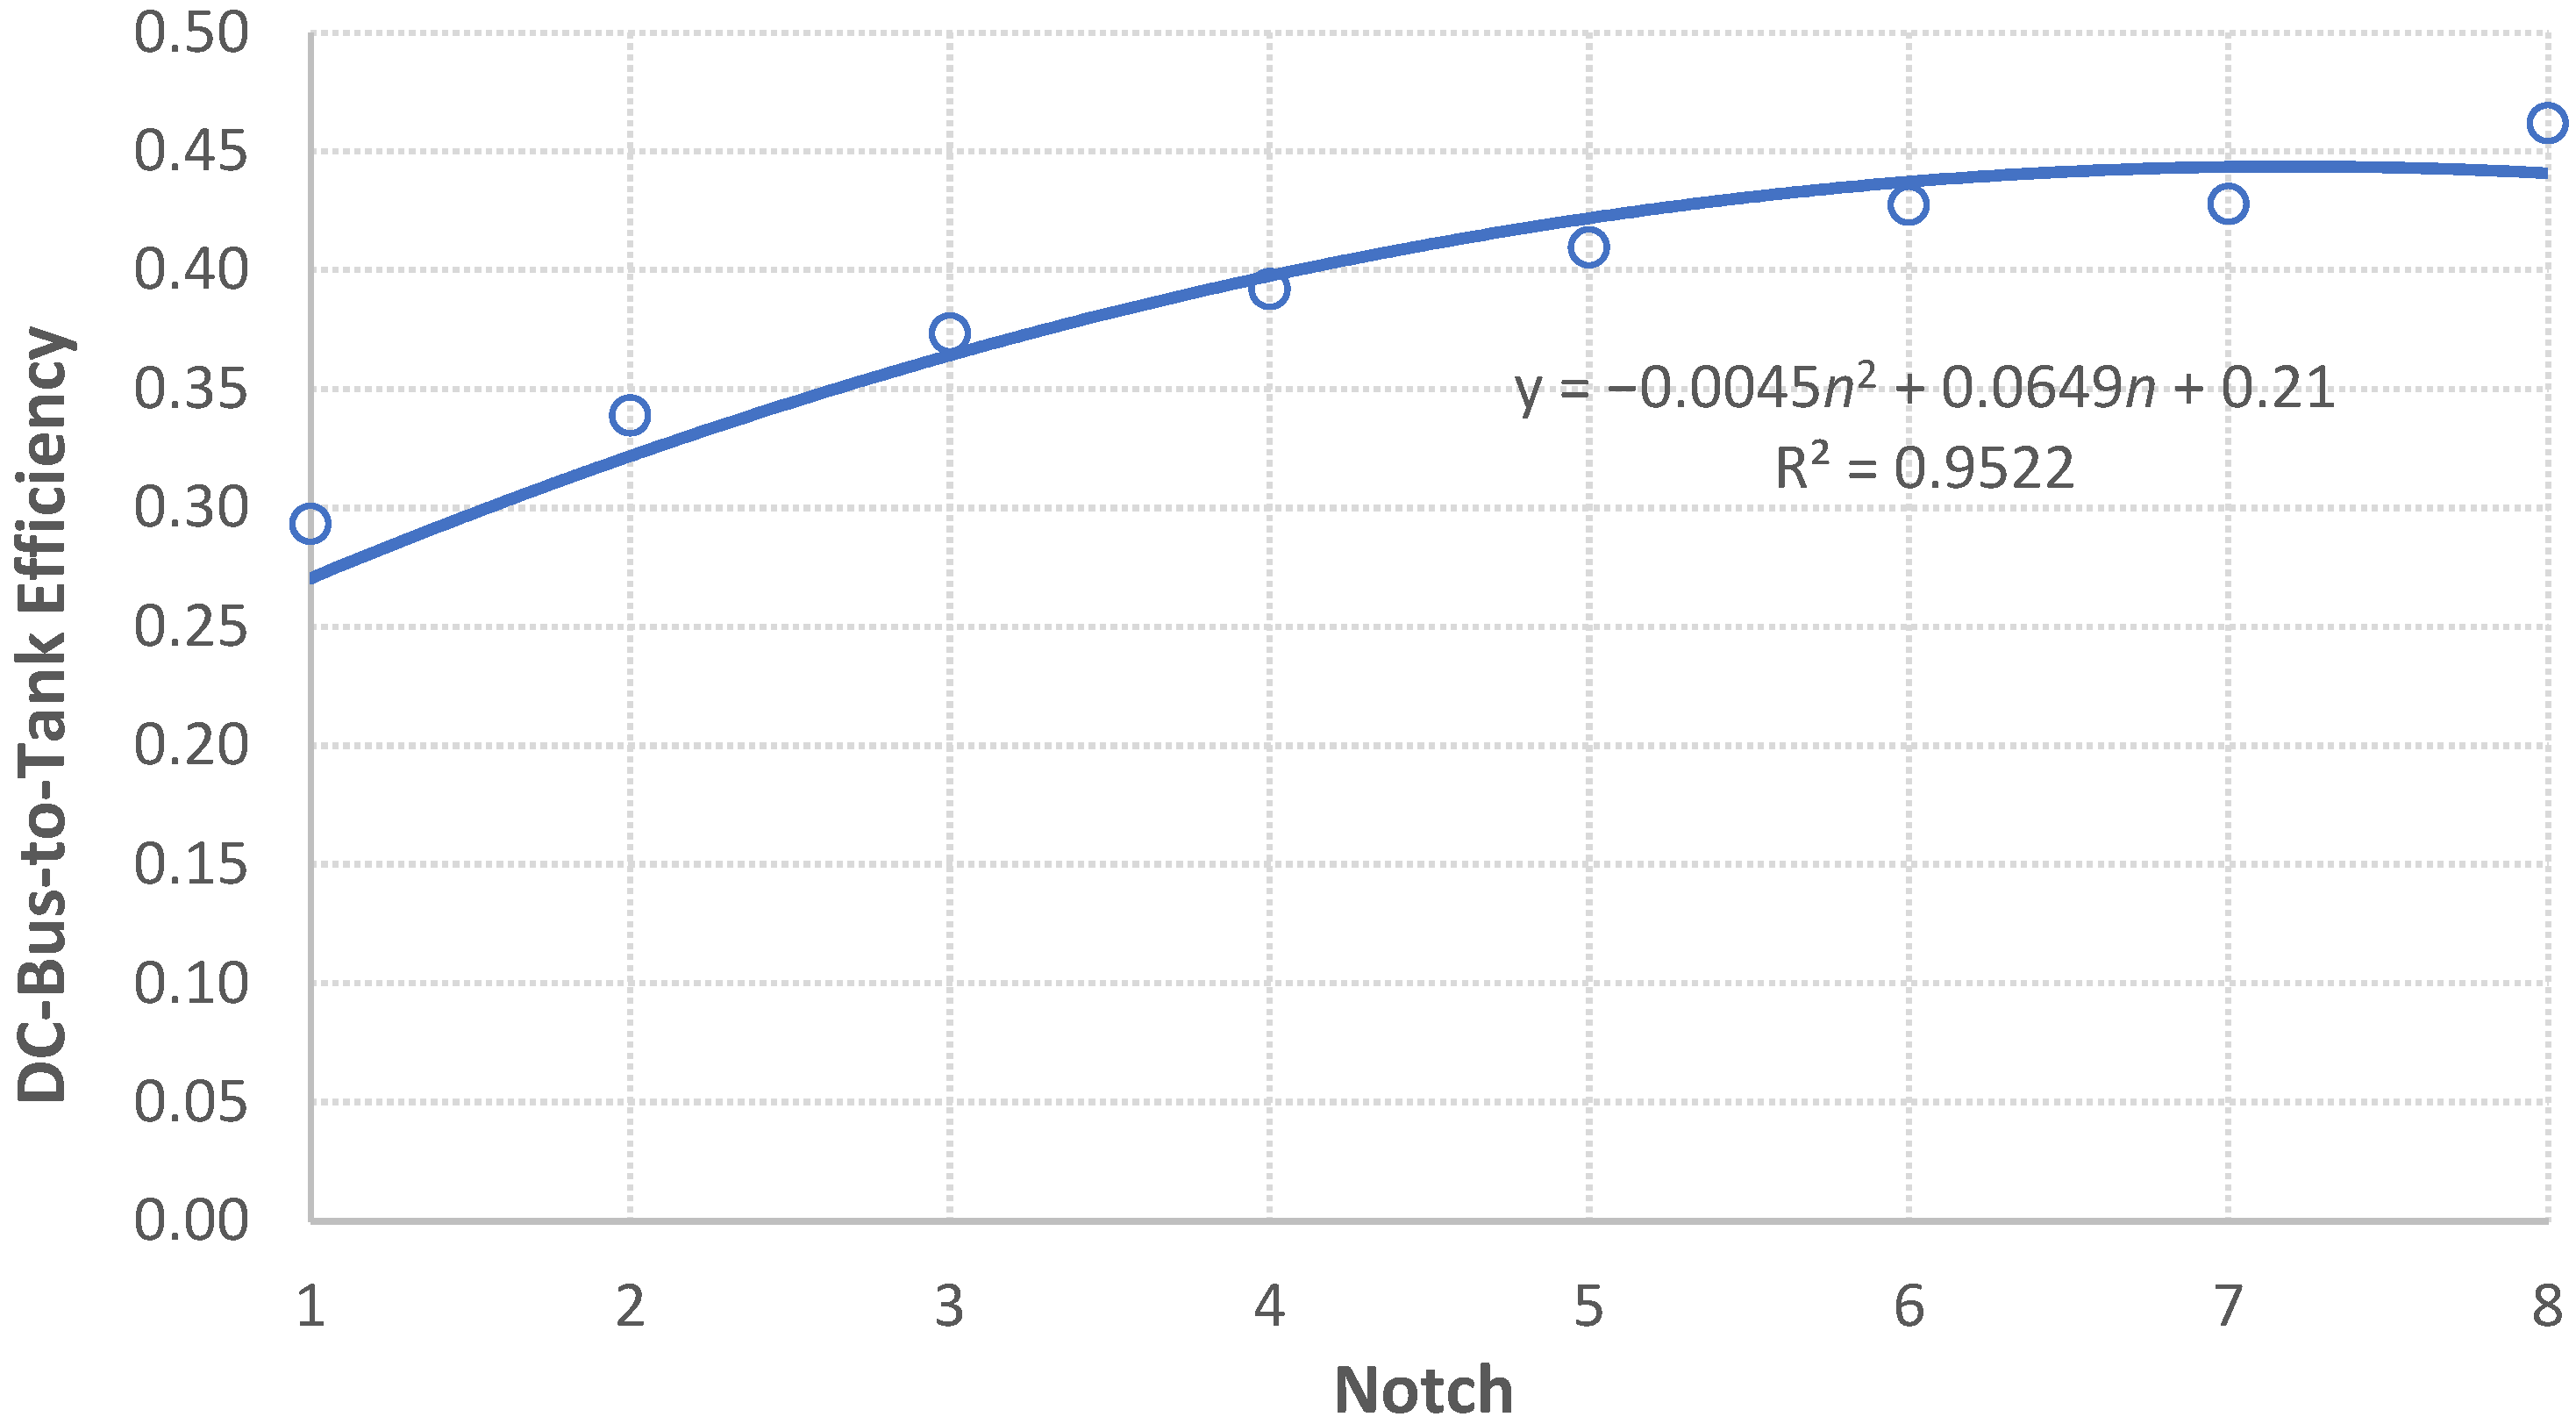
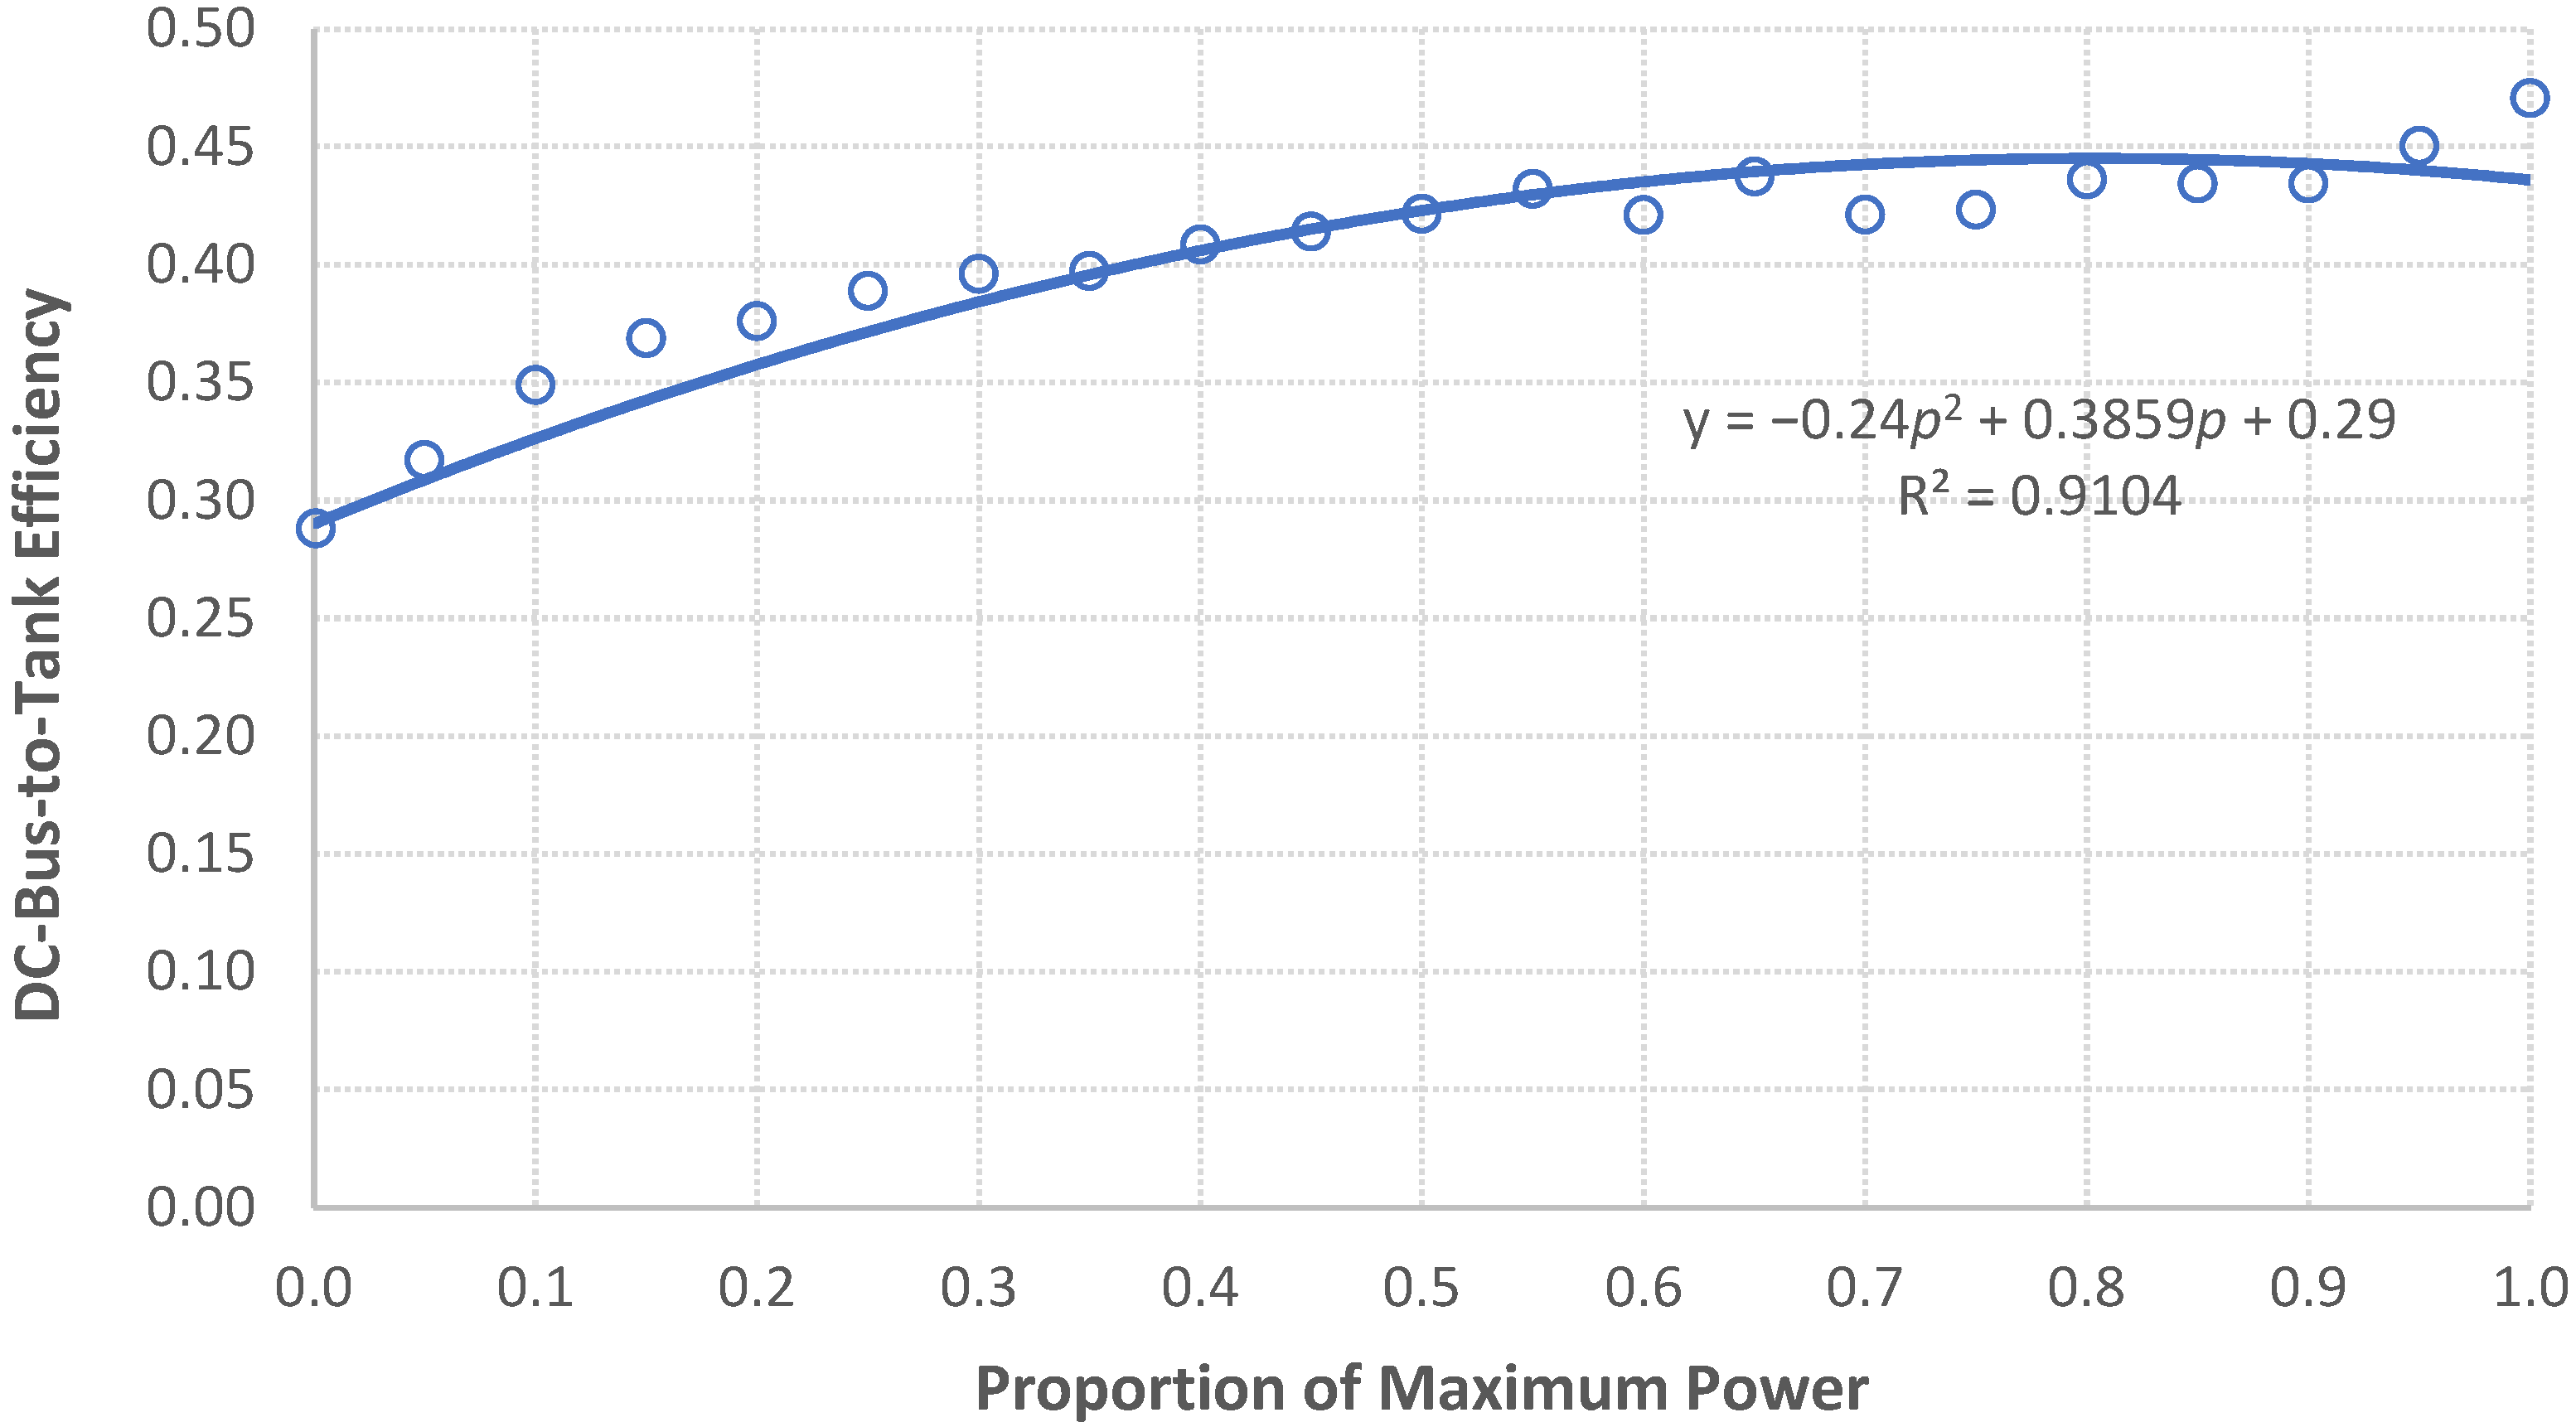
The DC-bus-to-tank efficiency is a function of throttle notch position (the rate at which the locomotive’s diesel power is being applied) and locomotive fuel type (e.g., diesel, electric, hydrogen). We estimated the DC-bus-to-tank efficiency using the collected field data by applying Equation (7), as illustrated in
Figure 4 and
Figure 5. We utilized all trip data and categorized by notch position or the proportion of the power to the maximum power to estimate DC-bus-to-tank efficiency compared to the field-collected fuel consumption data. The proposed functional form is a polynomial function, as demonstrated in Equation (8), where the variable x is either the notch position or the proportion of the instantaneous power to the maximum power.
The optimum coefficients were found to be
,
,
with a coefficient of determination of 0.952 for the notch function, as illustrated in
Figure 4.
Another model was developed, in which the DC-bus-to-tank efficiency was computed as a function of the vehicle power at the wheels (computed using Equation (4)) relative to the maximum power of all locomotives (as reported by the locomotive manufacturer). The optimum coefficients were found to be
,
, and
with a coefficient of determination of 0.9104, as illustrated in
Figure 5. Users can apply this model when notch data are not provided and this model provides continuous efficiency values.
Using the proposed efficiencies, the final energy consumption in kWh can be computed for each time step
(in seconds) by using Equation (9).
4. Model Evaluation
The model evaluation results demonstrate that the proposed model estimated a diesel train’s consumption with reasonable accuracy.
Table 4 shows the measured fuel consumption for all trip data and the estimated energy consumption based on two methods: DC-bus-to-tank efficiencies as a function of the notch position and DC-bus-to-tank efficiencies as a function of the proportion of power to the maximum power. The model estimated the energy consumption with an error of −2.0% for all data and with errors ranging from −13.2% to 7.3% for Train 1 to Train 4 data, when the notch position method was used. Similarly, the estimated energy consumption based on the proportion of power to the maximum power had an error of −1.3% for all data and errors ranging from −12.4% to 8.0% for Train 1 to Train 4 data. Both methods provide good estimations based on the field-collected data. However, we recommend using the
notch position method when notch data are available since it can reduce a step in generating the proportion of power to the maximum power.
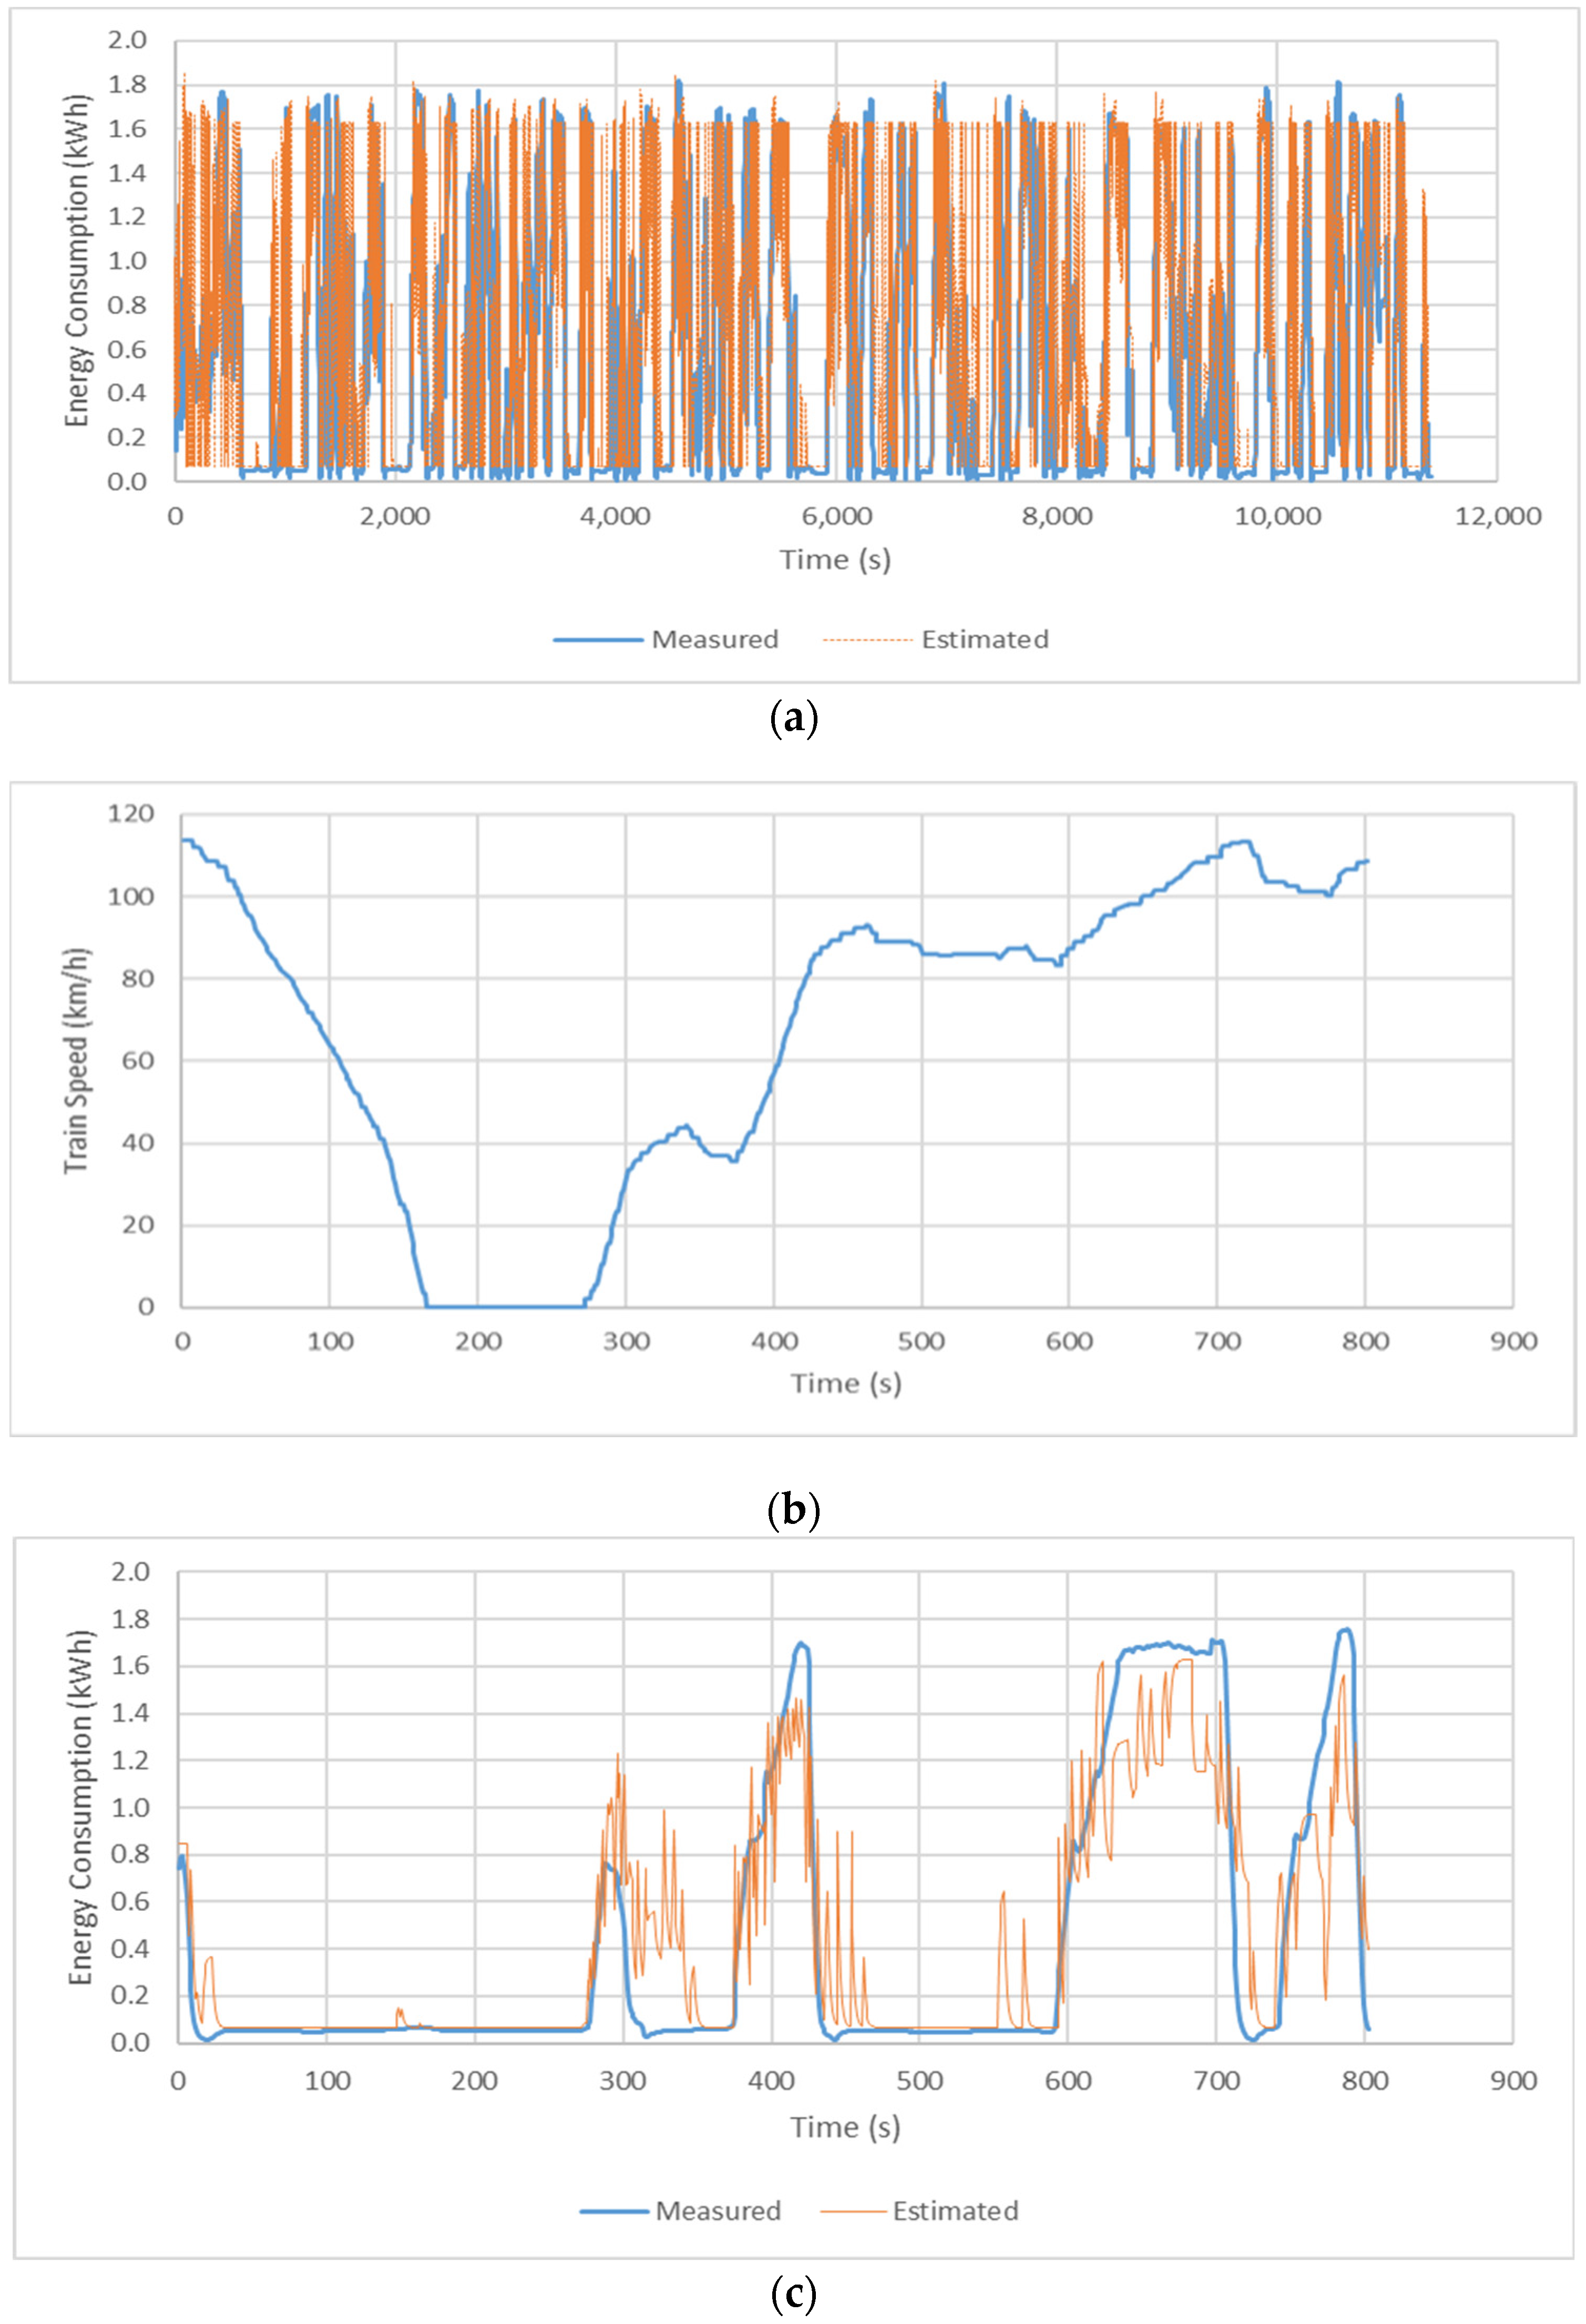
Figure 6 illustrates the field-collected instantaneous energy consumption rate of a sample Train 1 trip traveling from Raleigh, NC, to Charlotte, NC compared to the estimated instantaneous energy consumption rate. We estimated the energy consumption using the DC-bus-to-tank efficiency as a function of the proportion of power to the maximum power. Superimposed on the figures are the proposed model’s estimates of vehicle energy consumption rates based on train speed, grade, and curvature data. The total length of the westbound trip was 279 km (173 mile) and the average speed was 87.9 km/h (or 54.64 mph). The measured energy consumption was 7073 kWh (or 25.4 kWh/km) and the estimated energy consumption was 7441 kWh (or 26.7 kWh/km), which is a 5.2% error.
As shown in the figure, the model prediction closely matched the field collected energy consumption. The results show a strong correlation between the estimated energy consumption and the actual field measurements. The model may overestimate or underestimate some energy consumption levels for specific sections, but overall, the figure demonstrates that the model’s predictions aligned with the fuel measurements. This indicates that the model can effectively be used for evaluating the impact of transportation projects, including ecofriendly driving and real-time train operations.
Figure 6b illustrates the detailed speed view of the sample trip going from the Cary station to the Durham station.
Figure 6c compares the measured energy consumption of the section and the estimated energy consumption. The figure illustrates that the model accurately estimated the overall energy consumption patterns but showed oscillations when the speed of the train increased. Since the speed and acceleration levels are major input variables of the energy model, the model estimate was substantially responsive when the train increased its speed. For the first 270 s when the train decelerated and was idling, the energy consumption rate was mostly consistent with an idling rate. However, when the train accelerated, energy consumption rates were significantly increased. We utilized an exponential smoothing method with alpha 0.5 to reduce excessive oscillations. The exponential smoothing method is discussed in [
27]. The figure shows the estimated values moderately followed the patterns of the measured energy consumption. For the 800 s period, the predicted energy consumption was 350 kWh and the measured energy consumption was 344 kWh, which is a 1.75% error.
Table 5 summarizes the estimated energy consumption results by station trips. We used the DC-bus-to-tank efficiency that is a function of the proportion of power to the maximum power to estimate the energy consumption. The results include average station trip data from all collected data. Overall results show that the trains consumed 6947 and 6958 kWh for eastbound and westbound trips. The model estimated 6529 and 7144 kWh for eastbound and westbound trips; these are −6.0 and 2.7% errors for eastbound and westbound trips, respectively. The table includes the standard deviation (STDEV) data and shows the STDEV results for the estimated energy consumption were considerably lower than the measured data. The results indicate that the estimated energy consumption results were narrowly distributed compared to the measured data and the model estimated reliable energy consumption results with input variables. The table shows that the highest error rate was observed at −13.5% during the eastbound trip from High Point to Greensboro. However, the error rate of the westbound trip from Greensboro to High Point was only 0.9%. The table shows that the model predicts the energy consumption within a reasonable error range.
5. Model Validation
This study also validated the proposed model against an independent dataset. The model was validated using commuter service train data collected between Valencia and Cuenca, Spain, which had a total length of 198 km, and a time of 3 h 20 min. The data were collected from a series 592.200 train with three coach cars, weighing 130 tons, and having a maximum speed of 140 km/h. We used the DC-bus-to-tank efficiency, which uses the proportion of power to the maximum power to estimate the energy consumption.
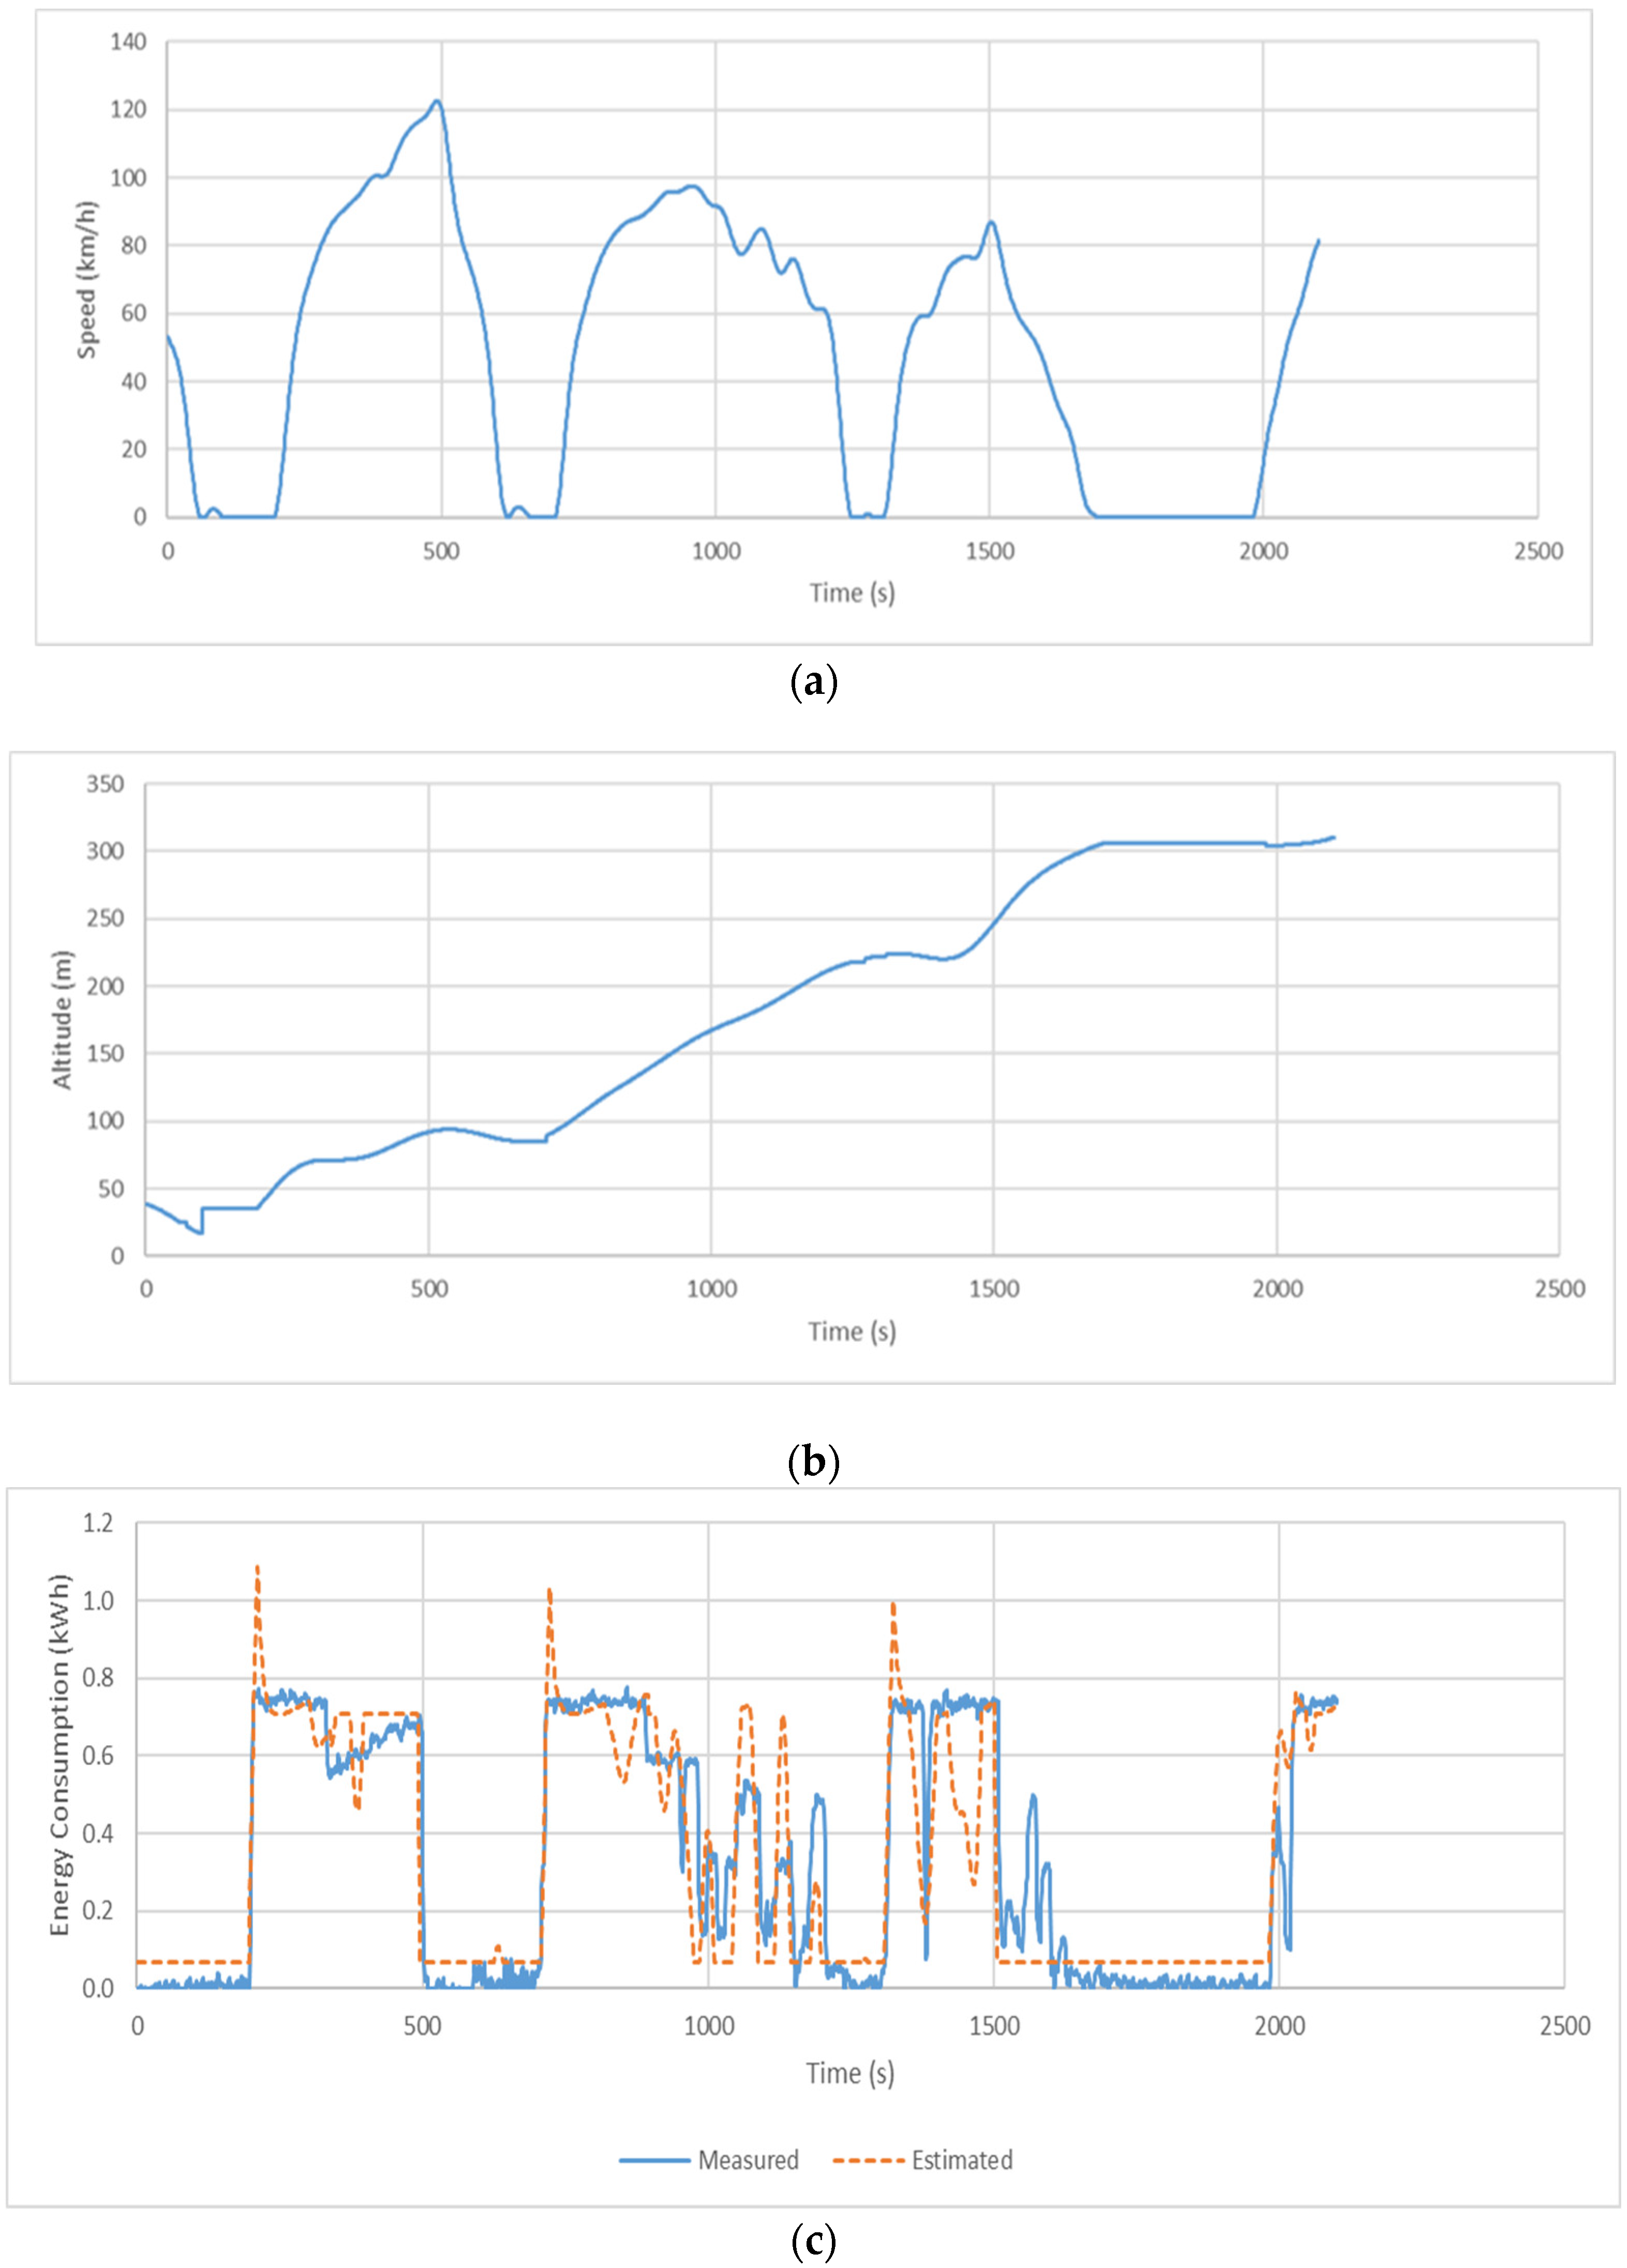
Figure 7 illustrates the model validation results for the first 28.2 km section. For the 35 min trip, the train consumed 697 kWh and the model estimated 688 kWh, which is a −1.4% error.
Figure 7a shows the speed profile of the sample trip that included three intermediate stops and a maximum speed of 123 km/h.
Figure 7b indicates that the train traveled to an uphill section from 17 to 310 m above sea level.
Figure 7c illustrates that the model’s predictions generally followed the fuel measurement patterns and accurately followed the field-collected data for both low- and high-speed sections. The results clearly demonstrate good agreement between the instantaneous energy consumption estimates and field measurements.
We also estimated the total energy consumption for the entire 198 km trip. We found that that the proposed model estimated 3579 kWh while the train consumed 3635 kWh during the trip, representing a −1.55% error rate. The results demonstrate that the proposed model can effectively estimate the train’s energy consumption in a variety of trip scenarios.
6. Conclusions
This research developed a simple model that computes the energy consumption of diesel trains in real-time, which can be used in railway ecodriving and train simulation software. Although previous studies have examined the real-time energy consumption of diesel trains, only a few have focused on models that can be applied in ecodriving train applications. The energy model uses the current speed of the train, its acceleration, the slope, and the curvature of the railroad as input variables to determine the energy consumption at that moment and the total energy consumption rate. The results showed that the model’s predictions were in line with real data, with an error of only −1.33% compared to the data collected from trips totaling 5854 km. The study also tested the model with additional independent data and found that it was accurate, producing a relative error of −1.55% compared to the 198 km trip field data collected between Valencia and Cuenca, Spain. This model can be valuable for railway engineers, policymakers, train operators, and environmental engineers to assess the energy impact of railway projects, ecodriving applications, and in microscopic train simulations. Future research should examine the energy consumption of hybrid trains that utilize an onboard rechargeable energy storage system, which can be charged during surplus energy production or regenerative braking, similar to hybrid electric vehicles.
