
P2P Electricity Trading Considering User Preferences for Renewable Energy and Demand-Side Shifts

 ,
,
Abstract
1. Introduction
1.1. Background
1.2. Related Work
1.3. Contribution of This Paper
1.4. Organization of This Paper
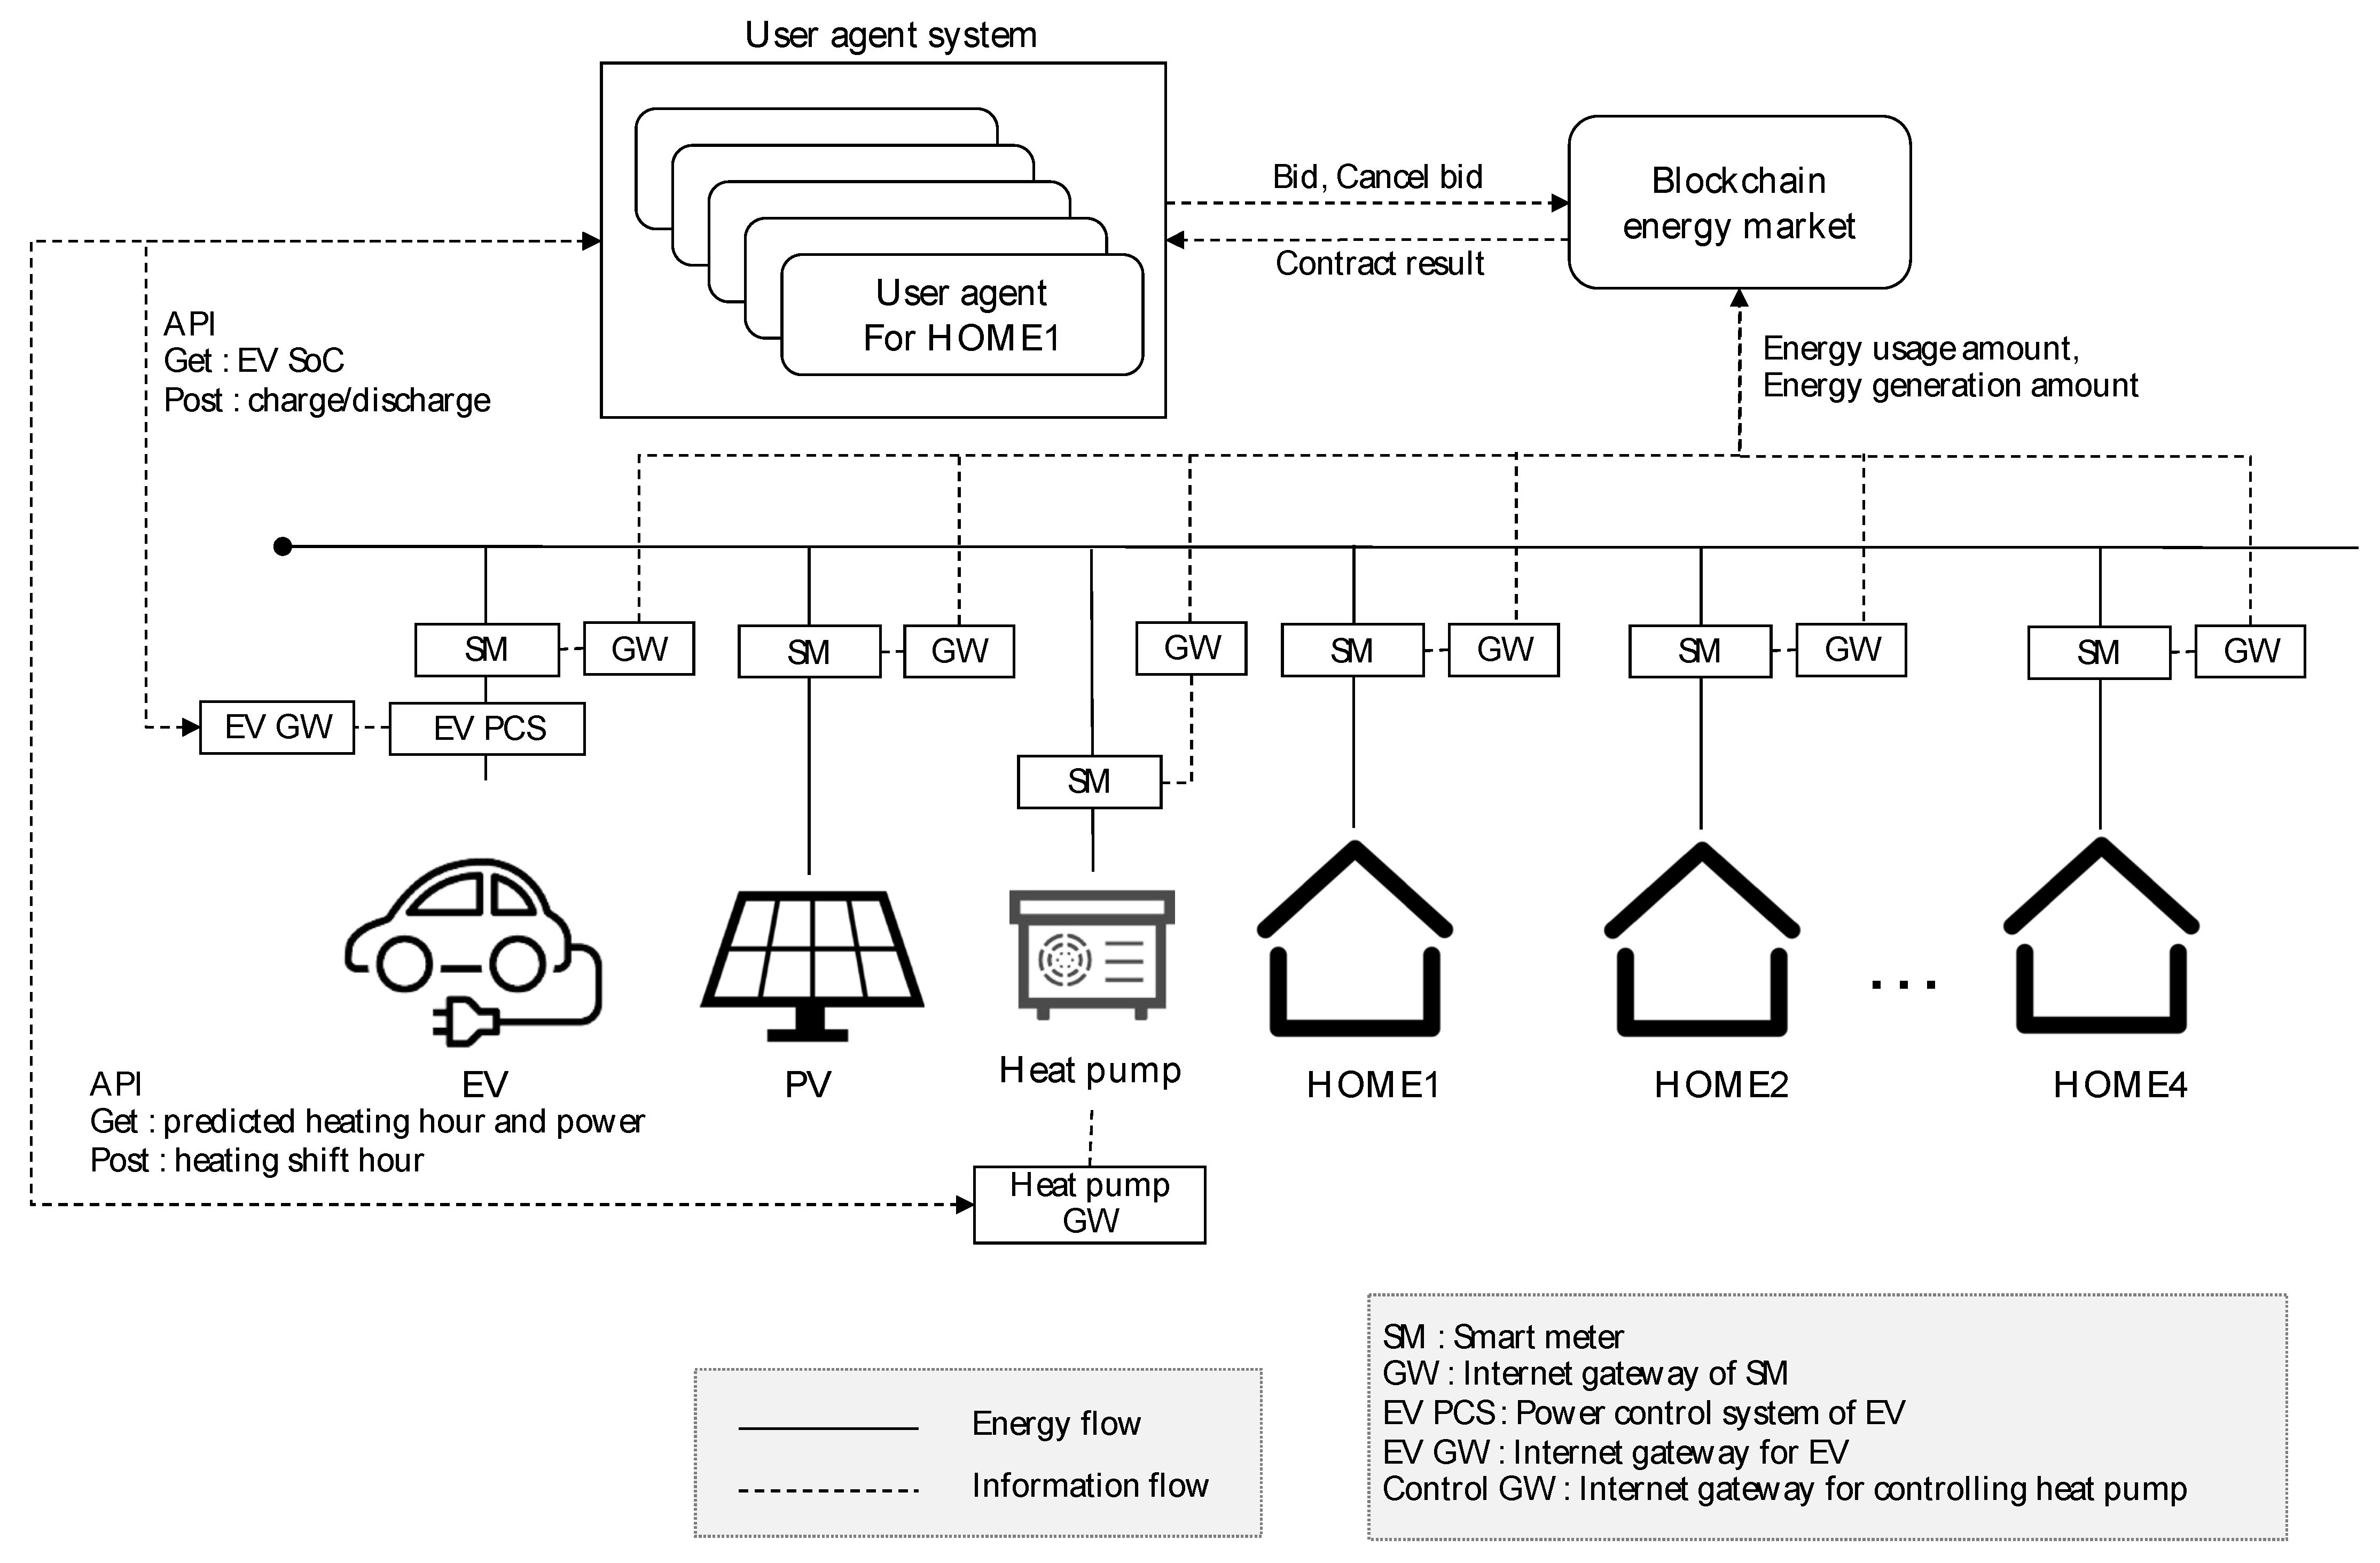
2. P2P Energy Trading Platform
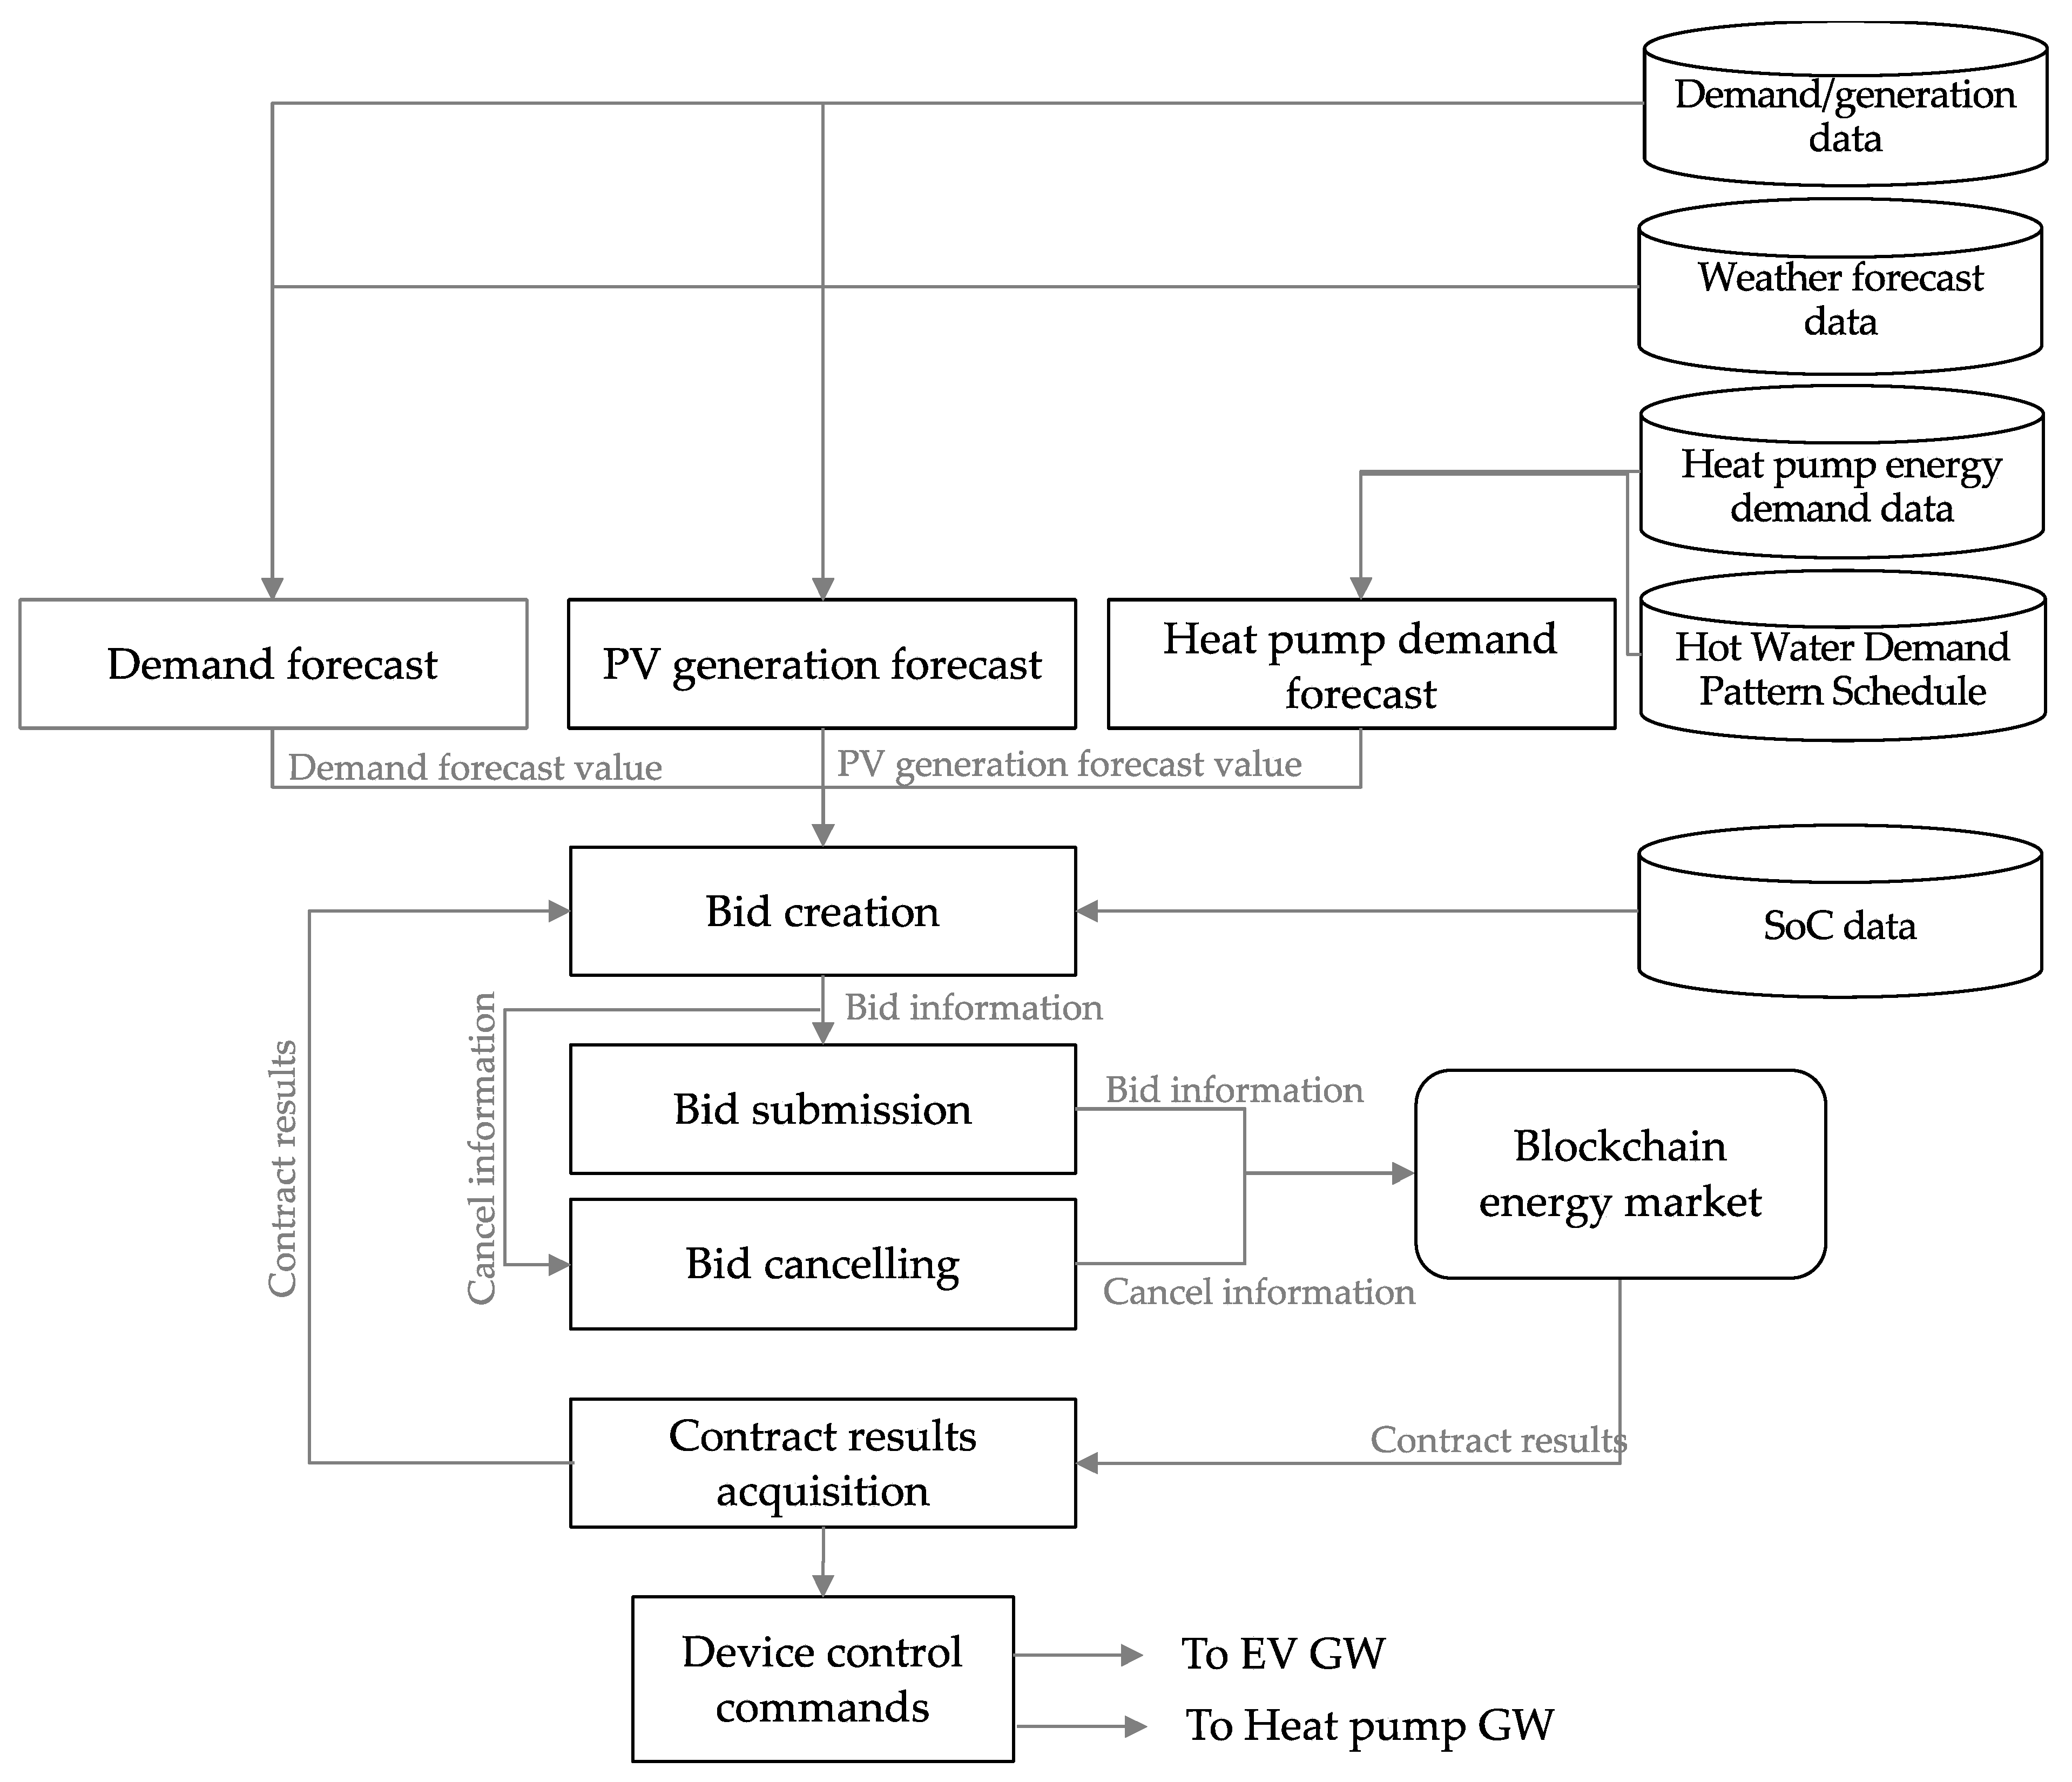
3. Functions of User Agents
4. Bidding and Facility Operation Optimization
5. Demonstration Experiment
5.1. Configuration of the Demonstration Experiment
5.2. Results of the Demonstration Experiment
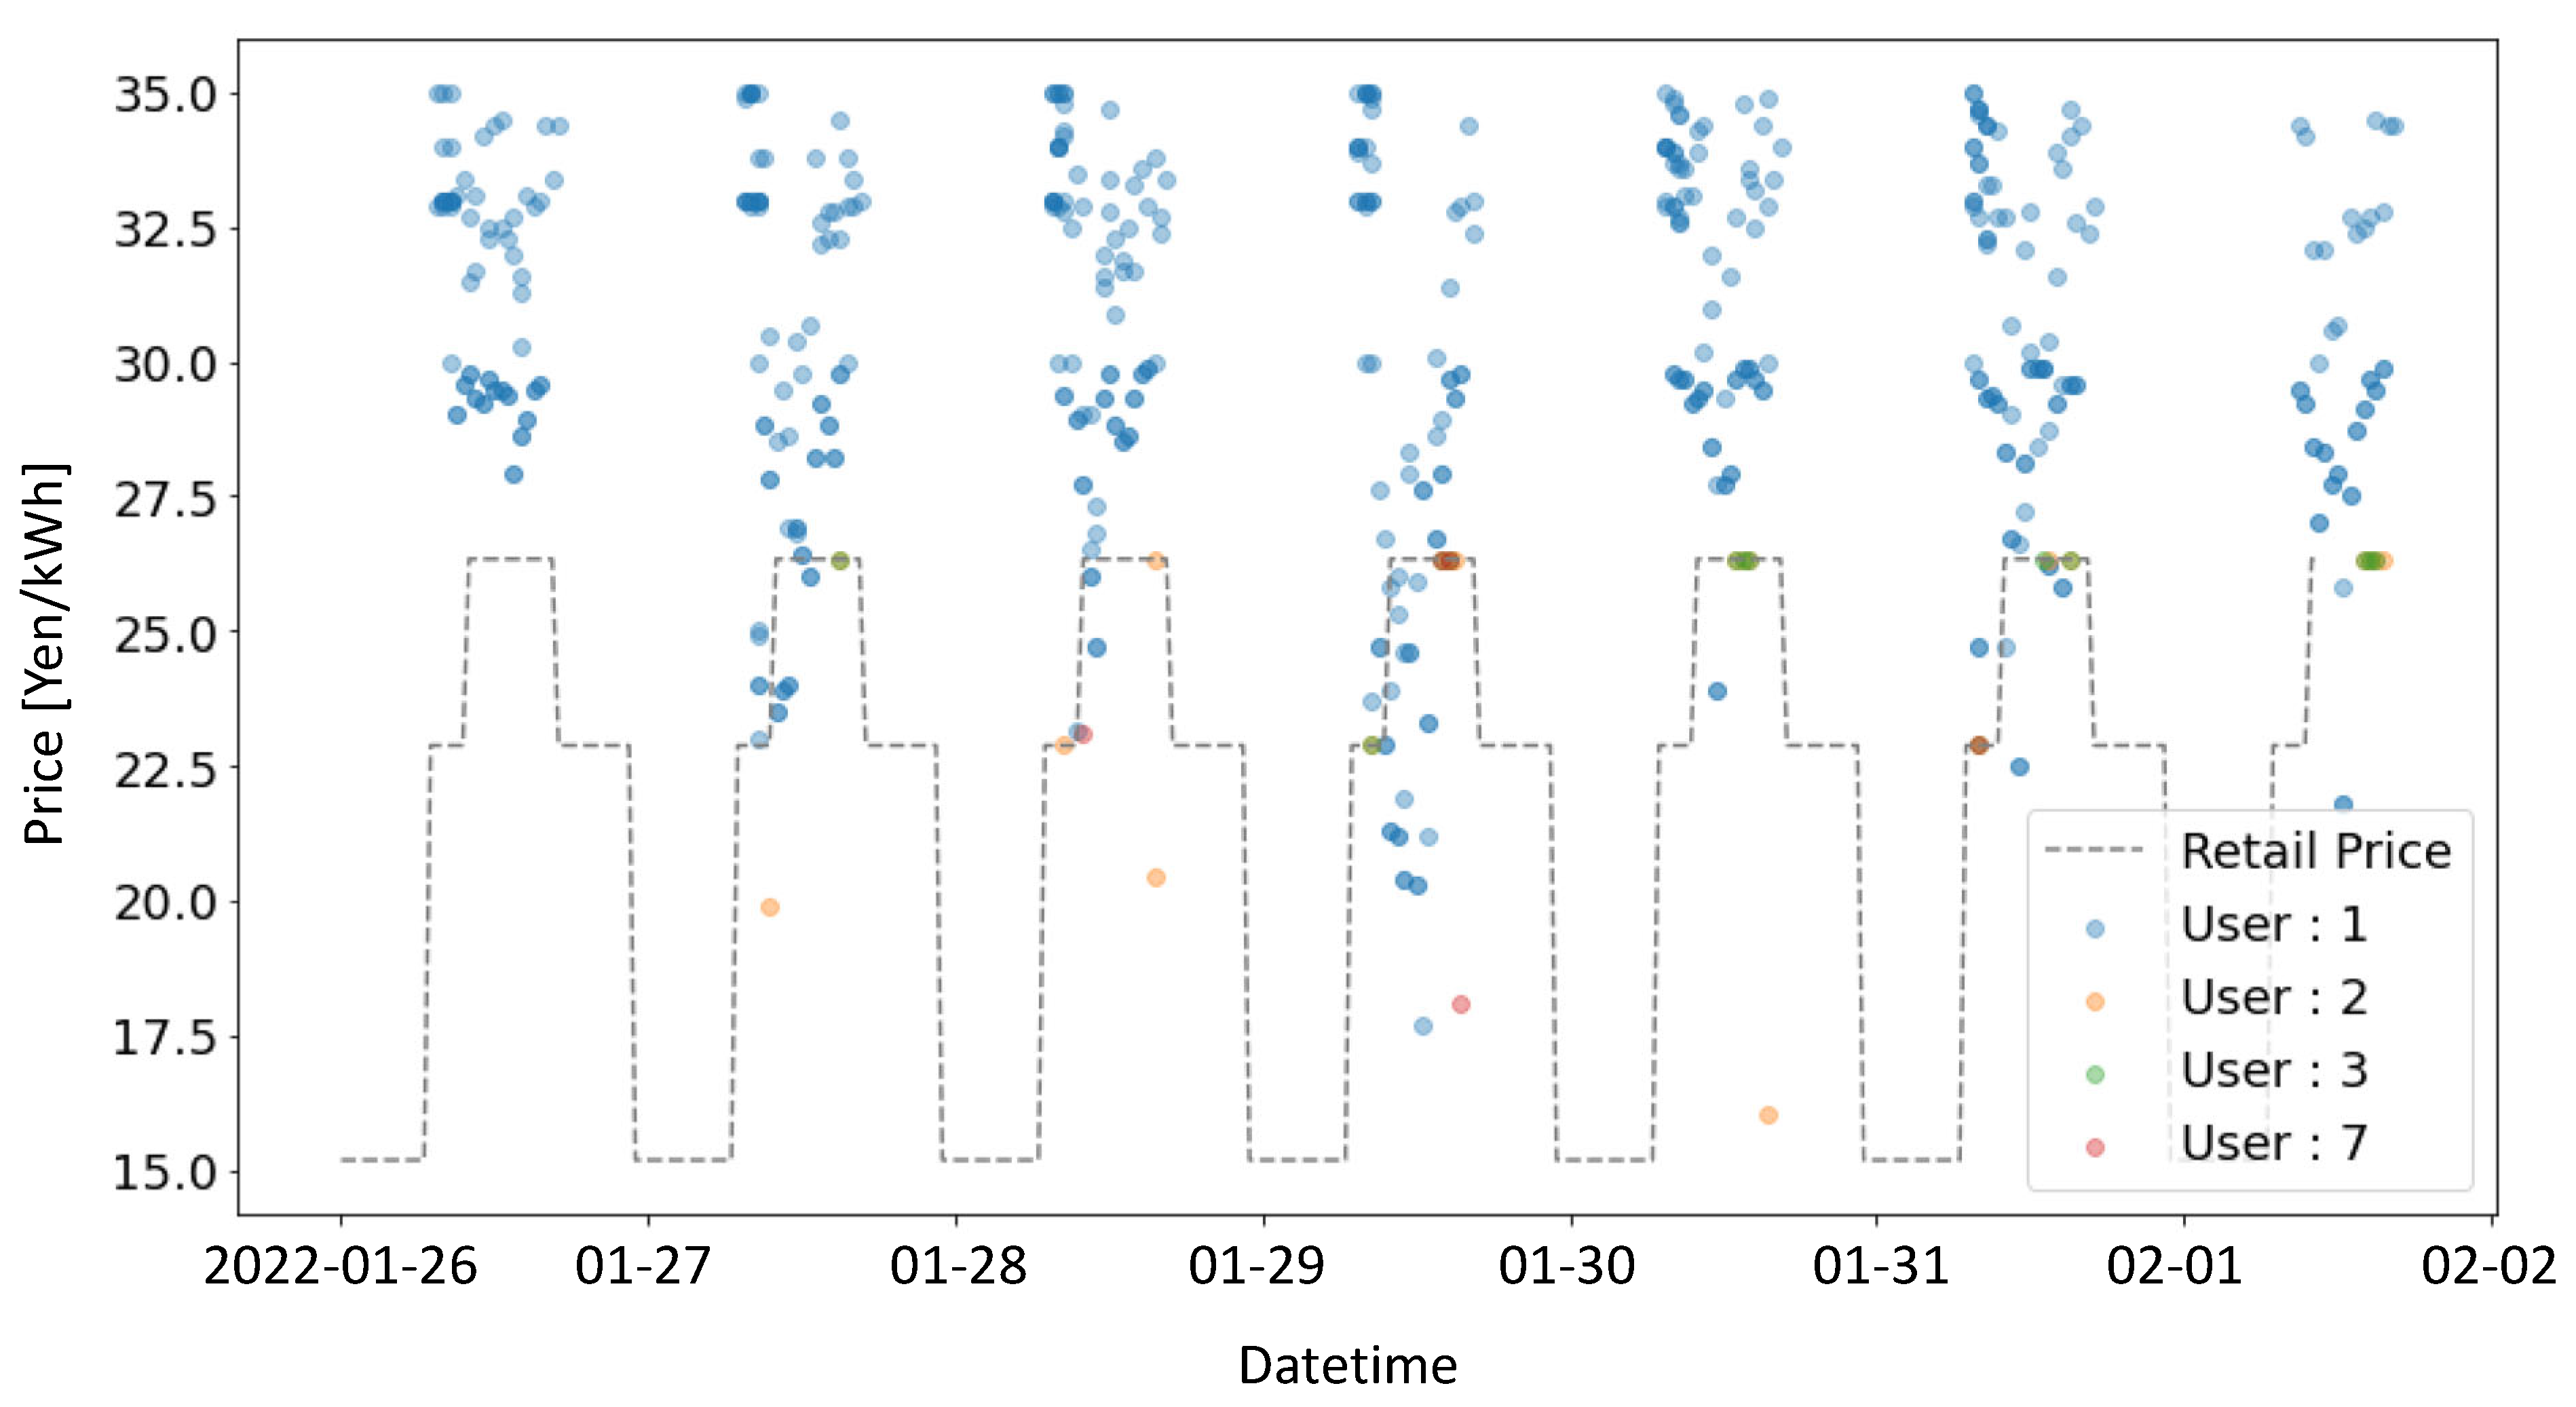
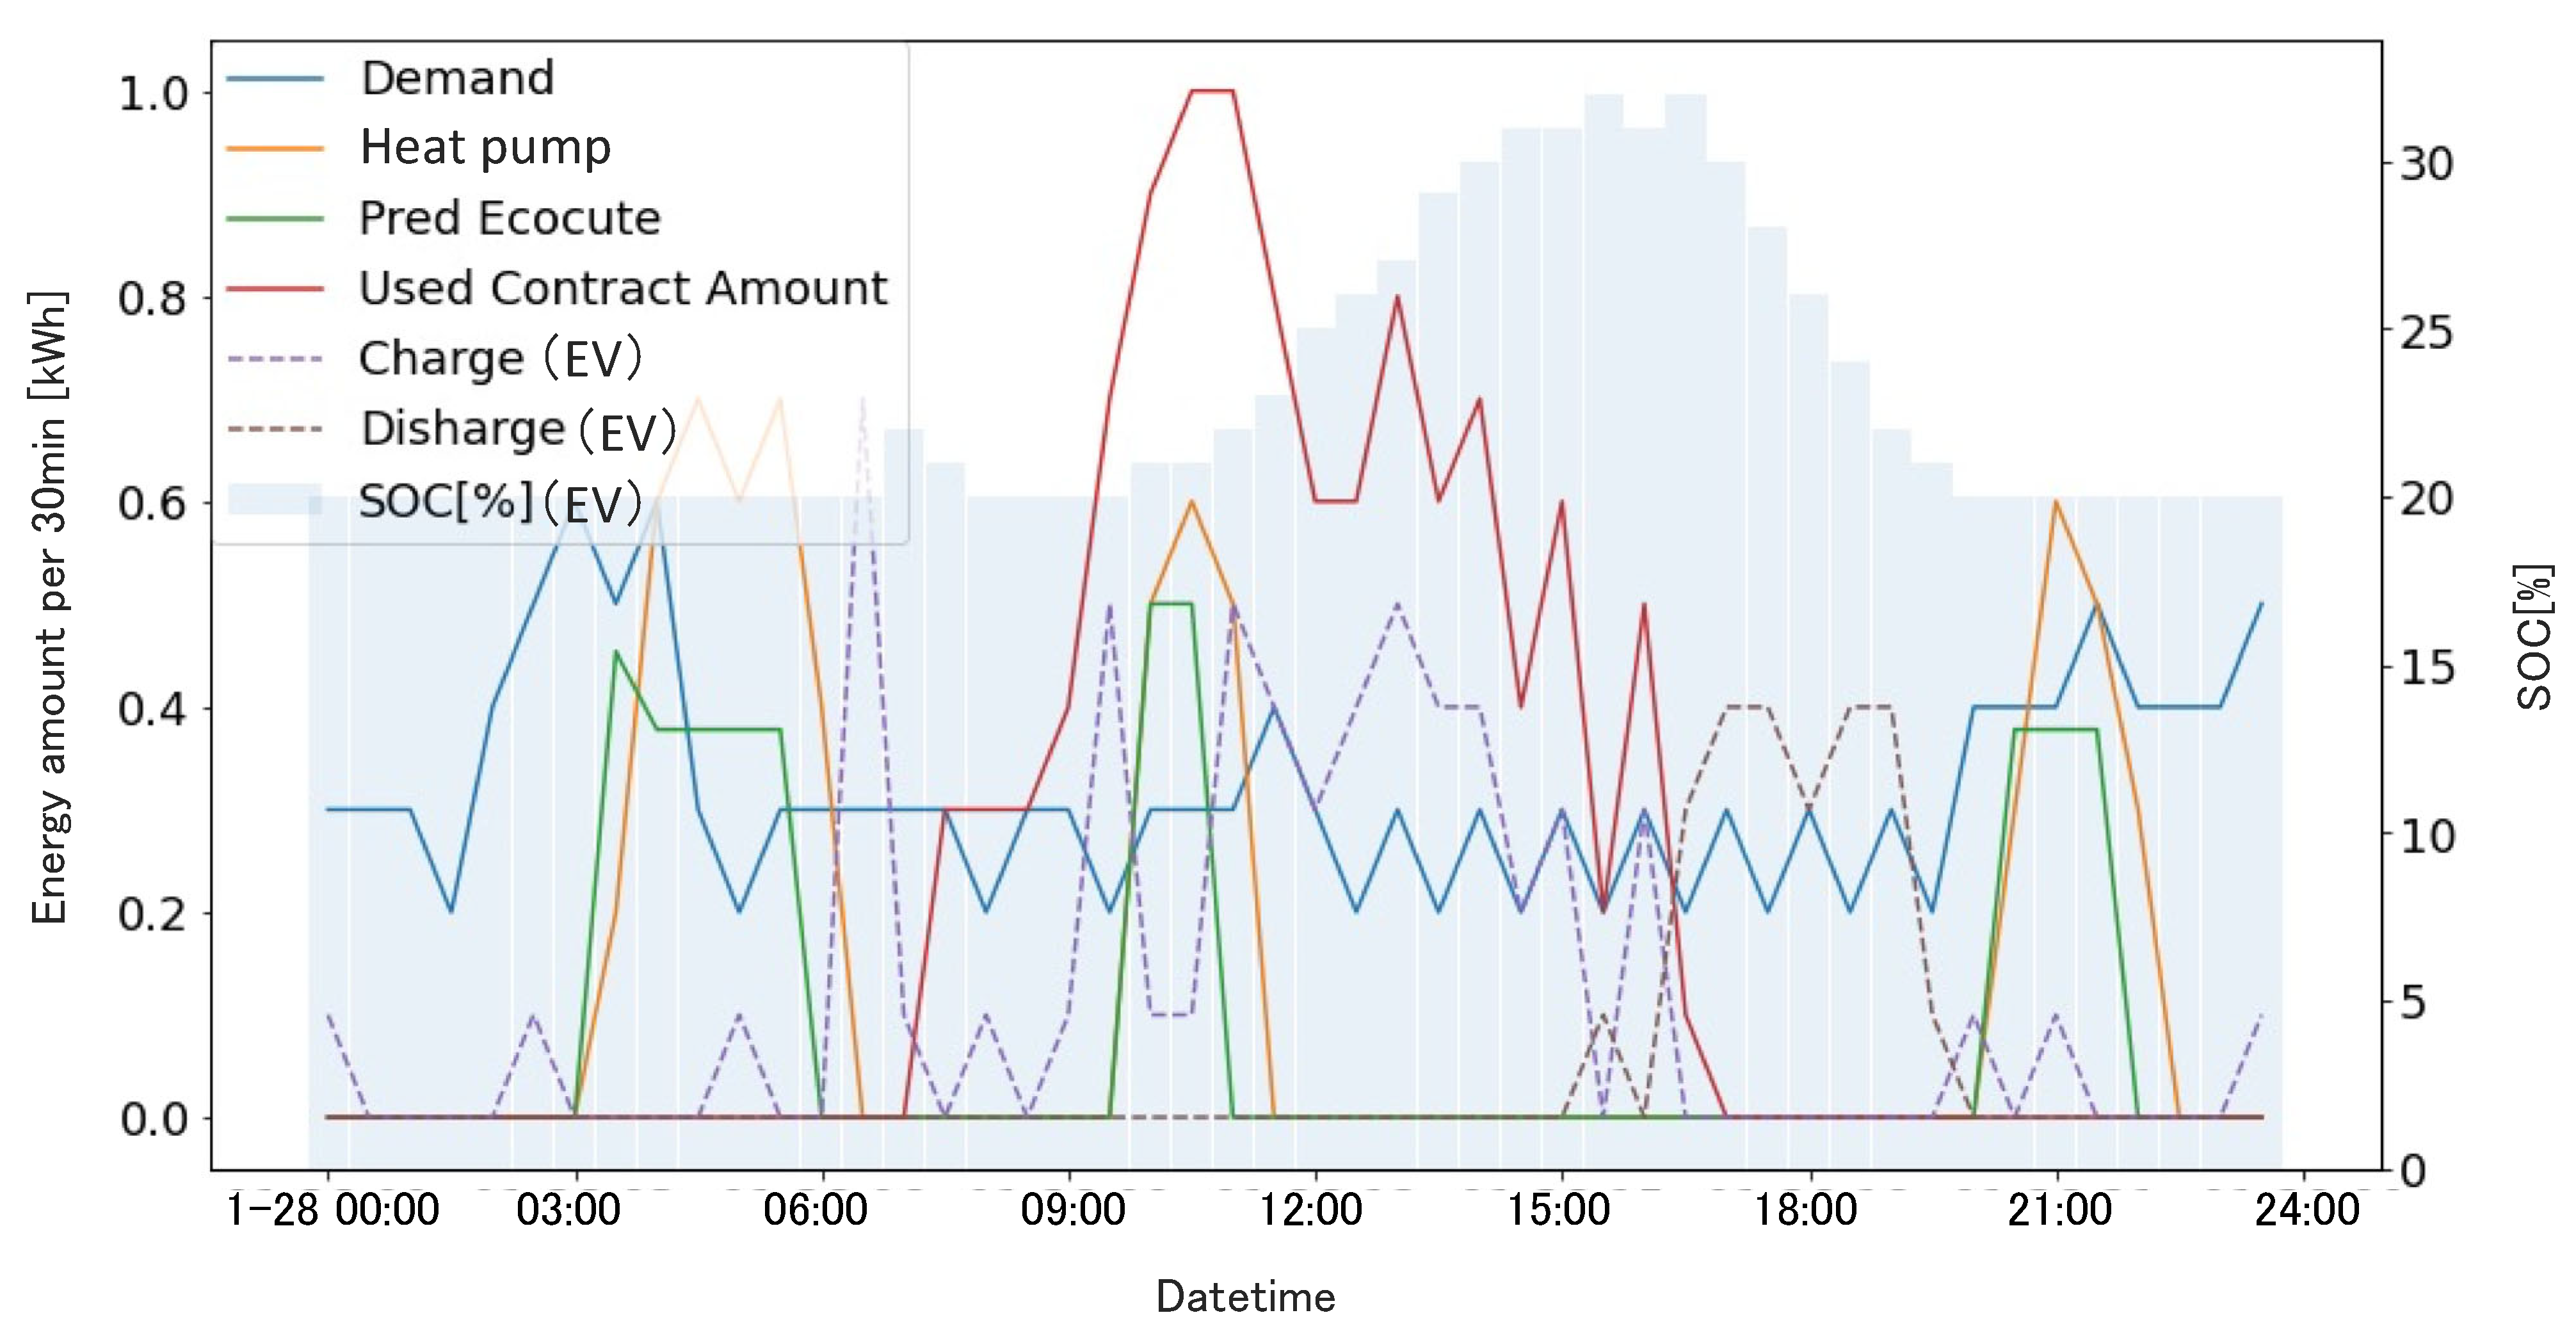
5.3. Experimental Results of Phase 1
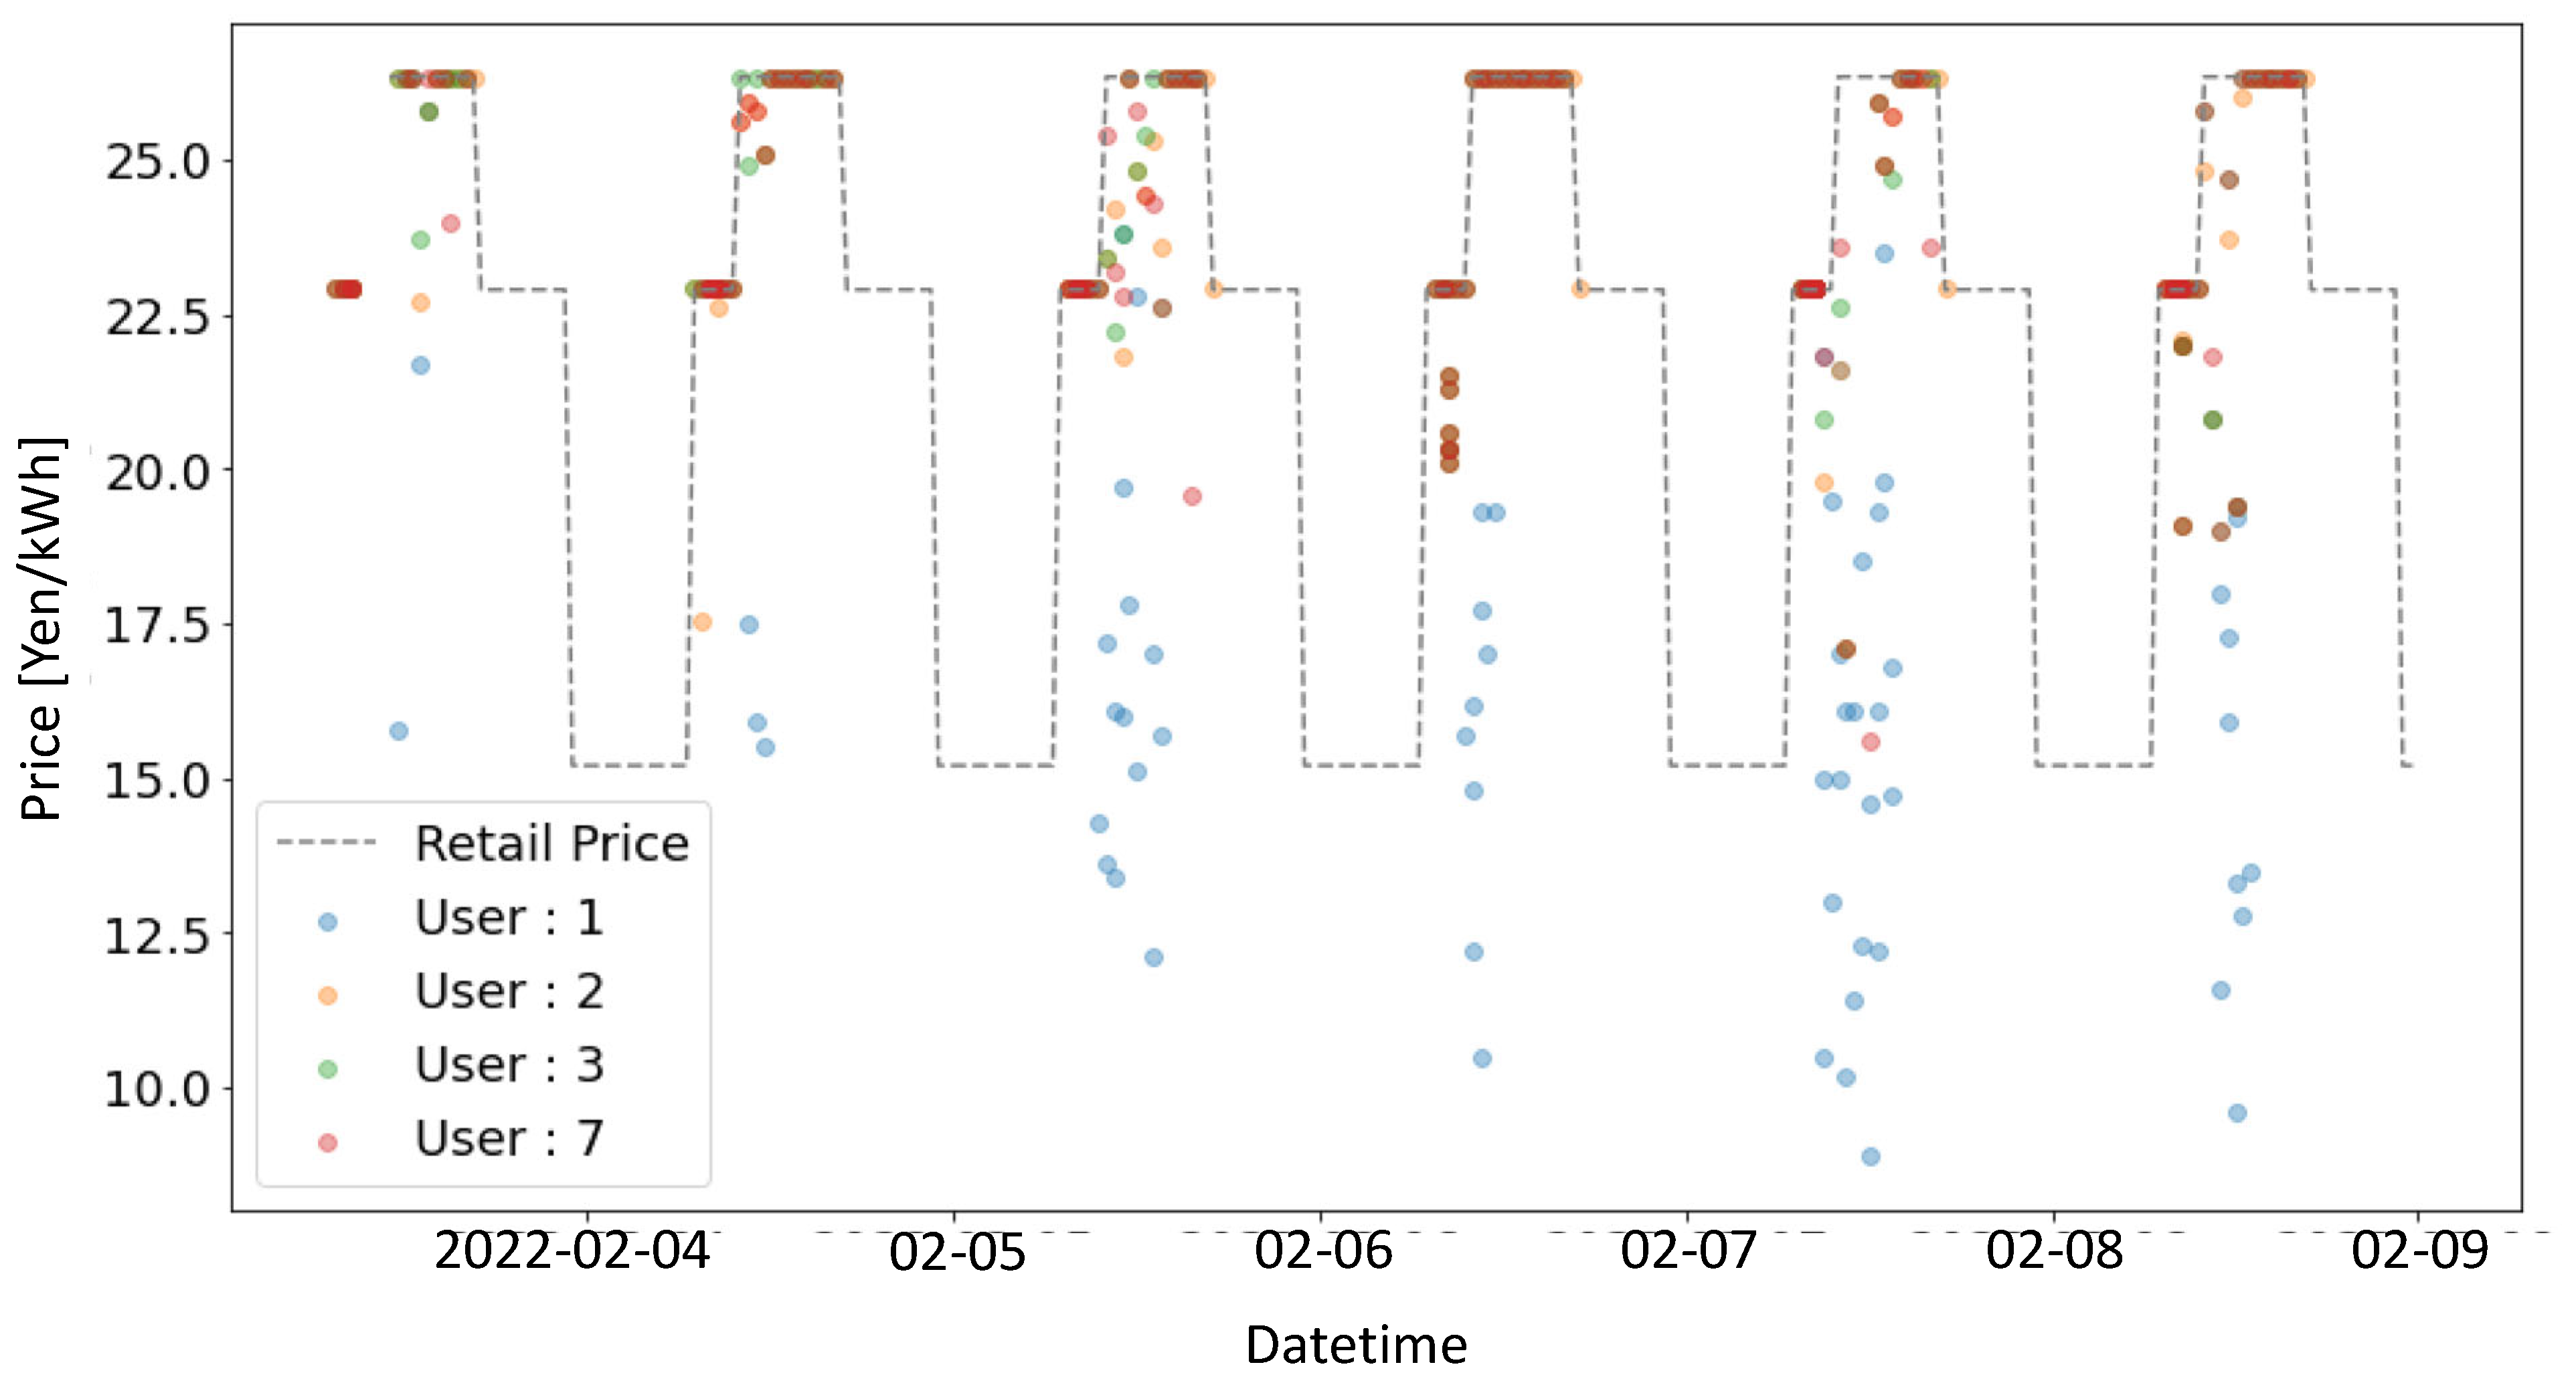
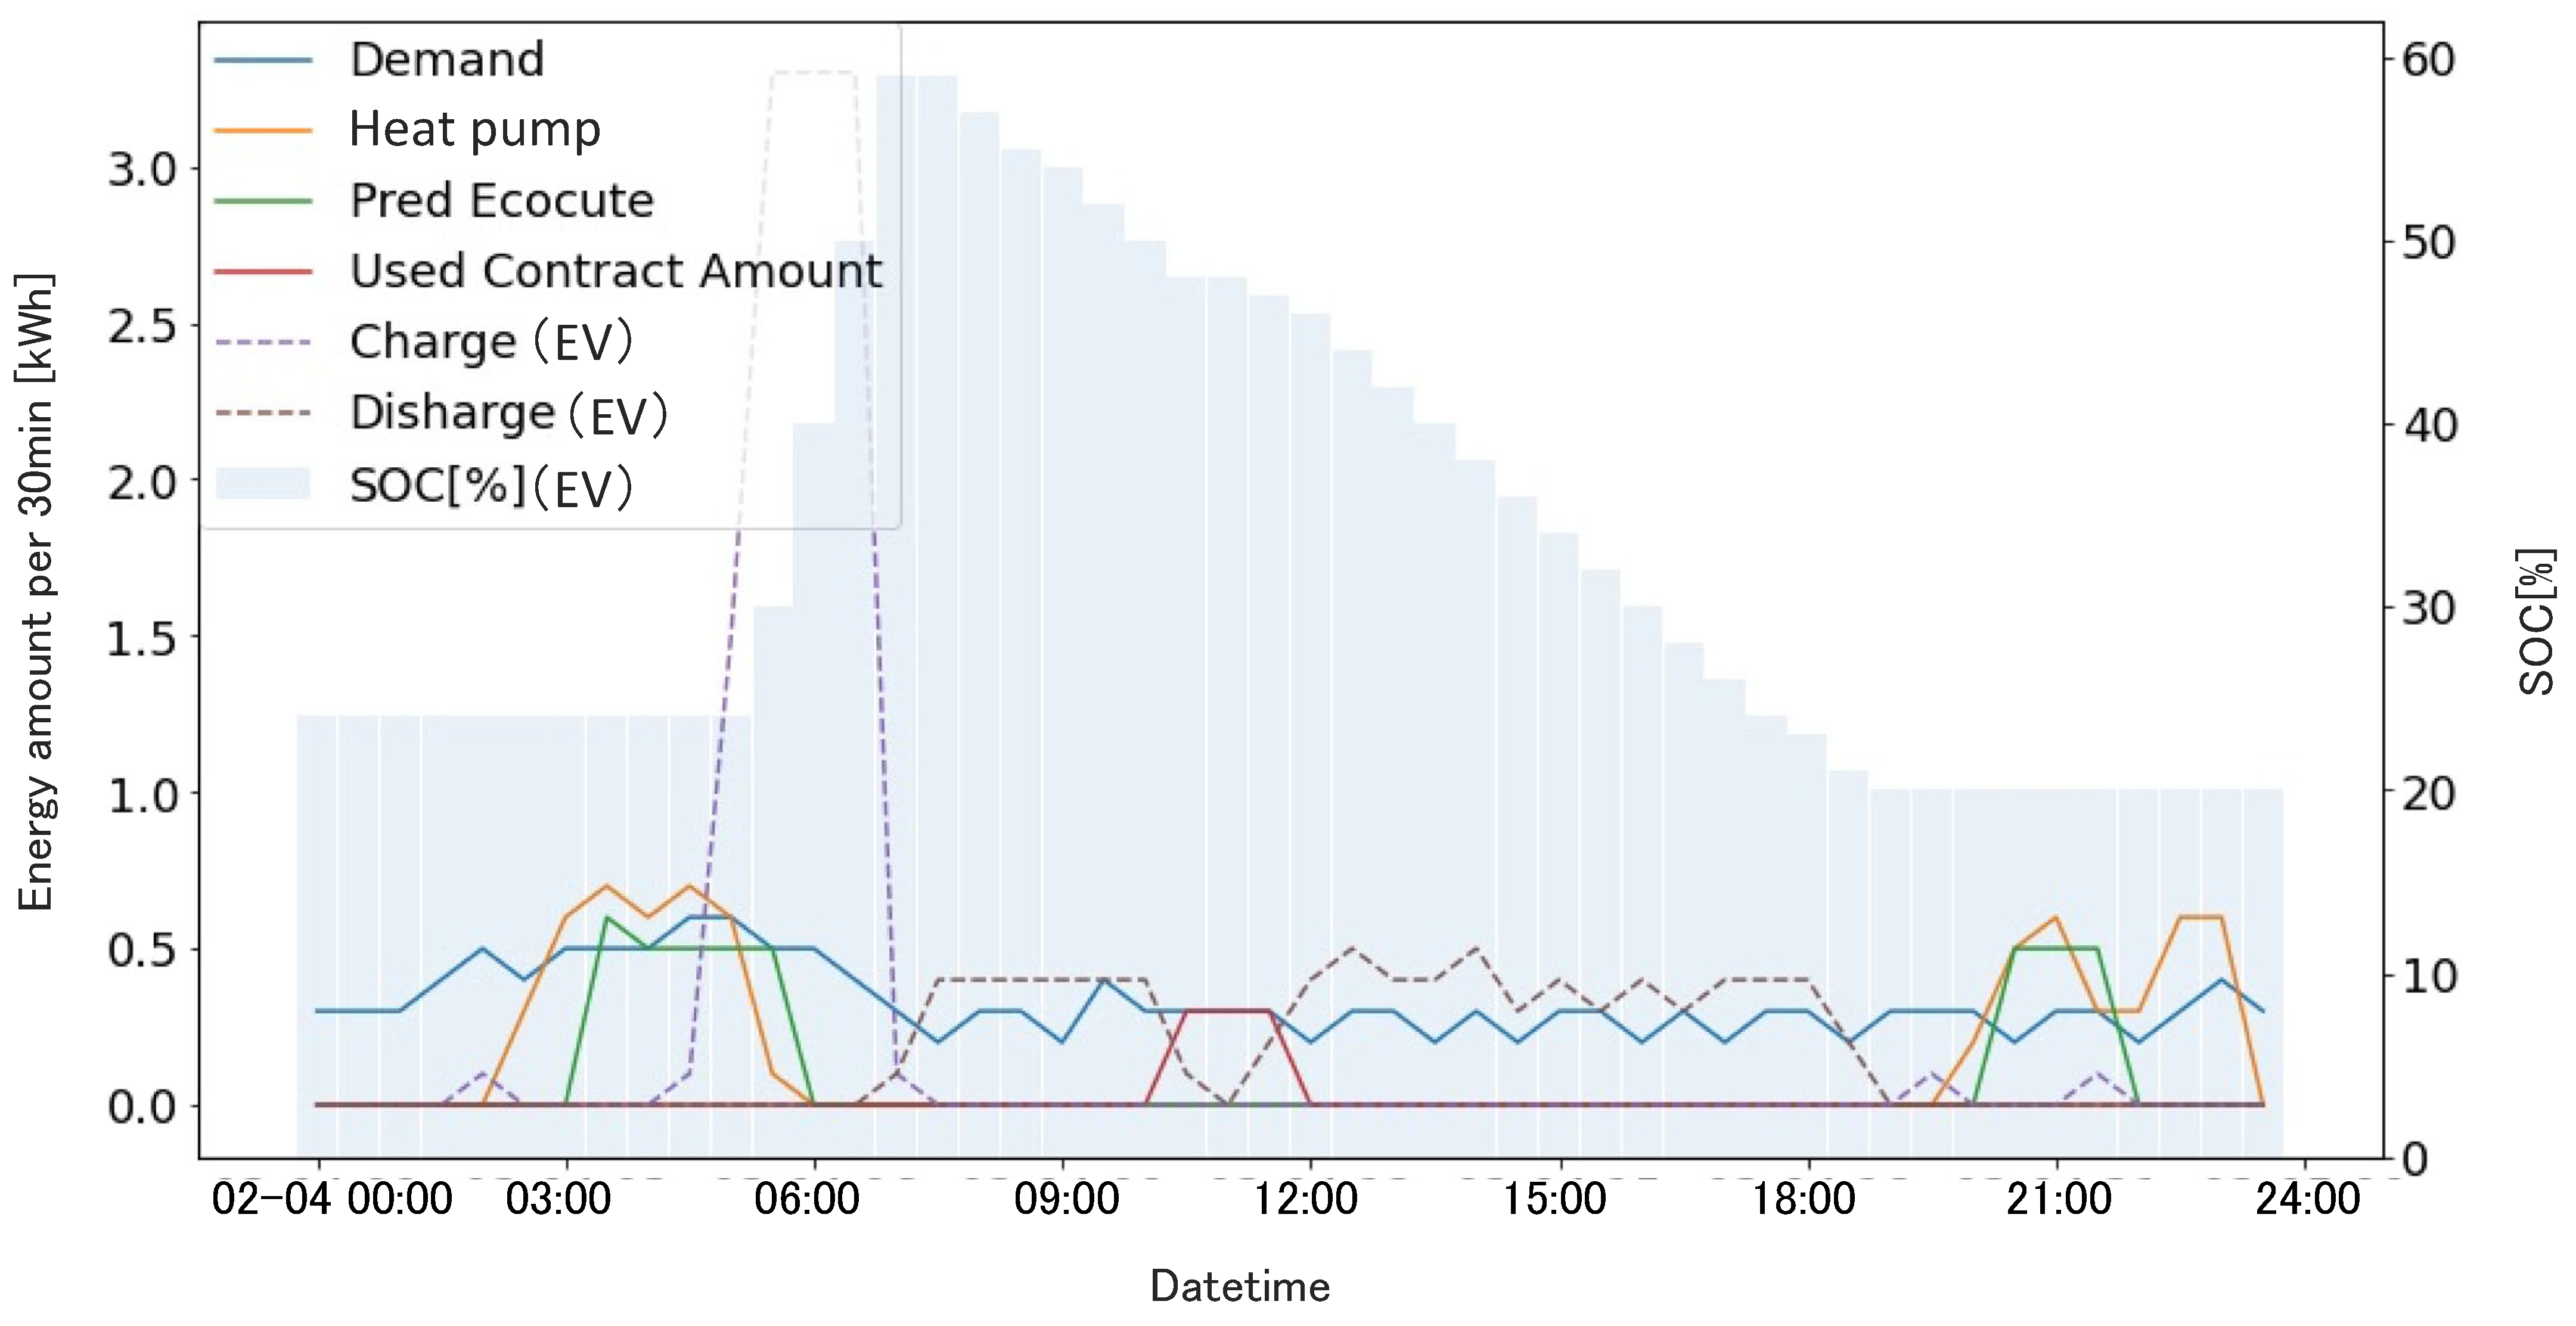
5.4. Experimental Results of Phase 2
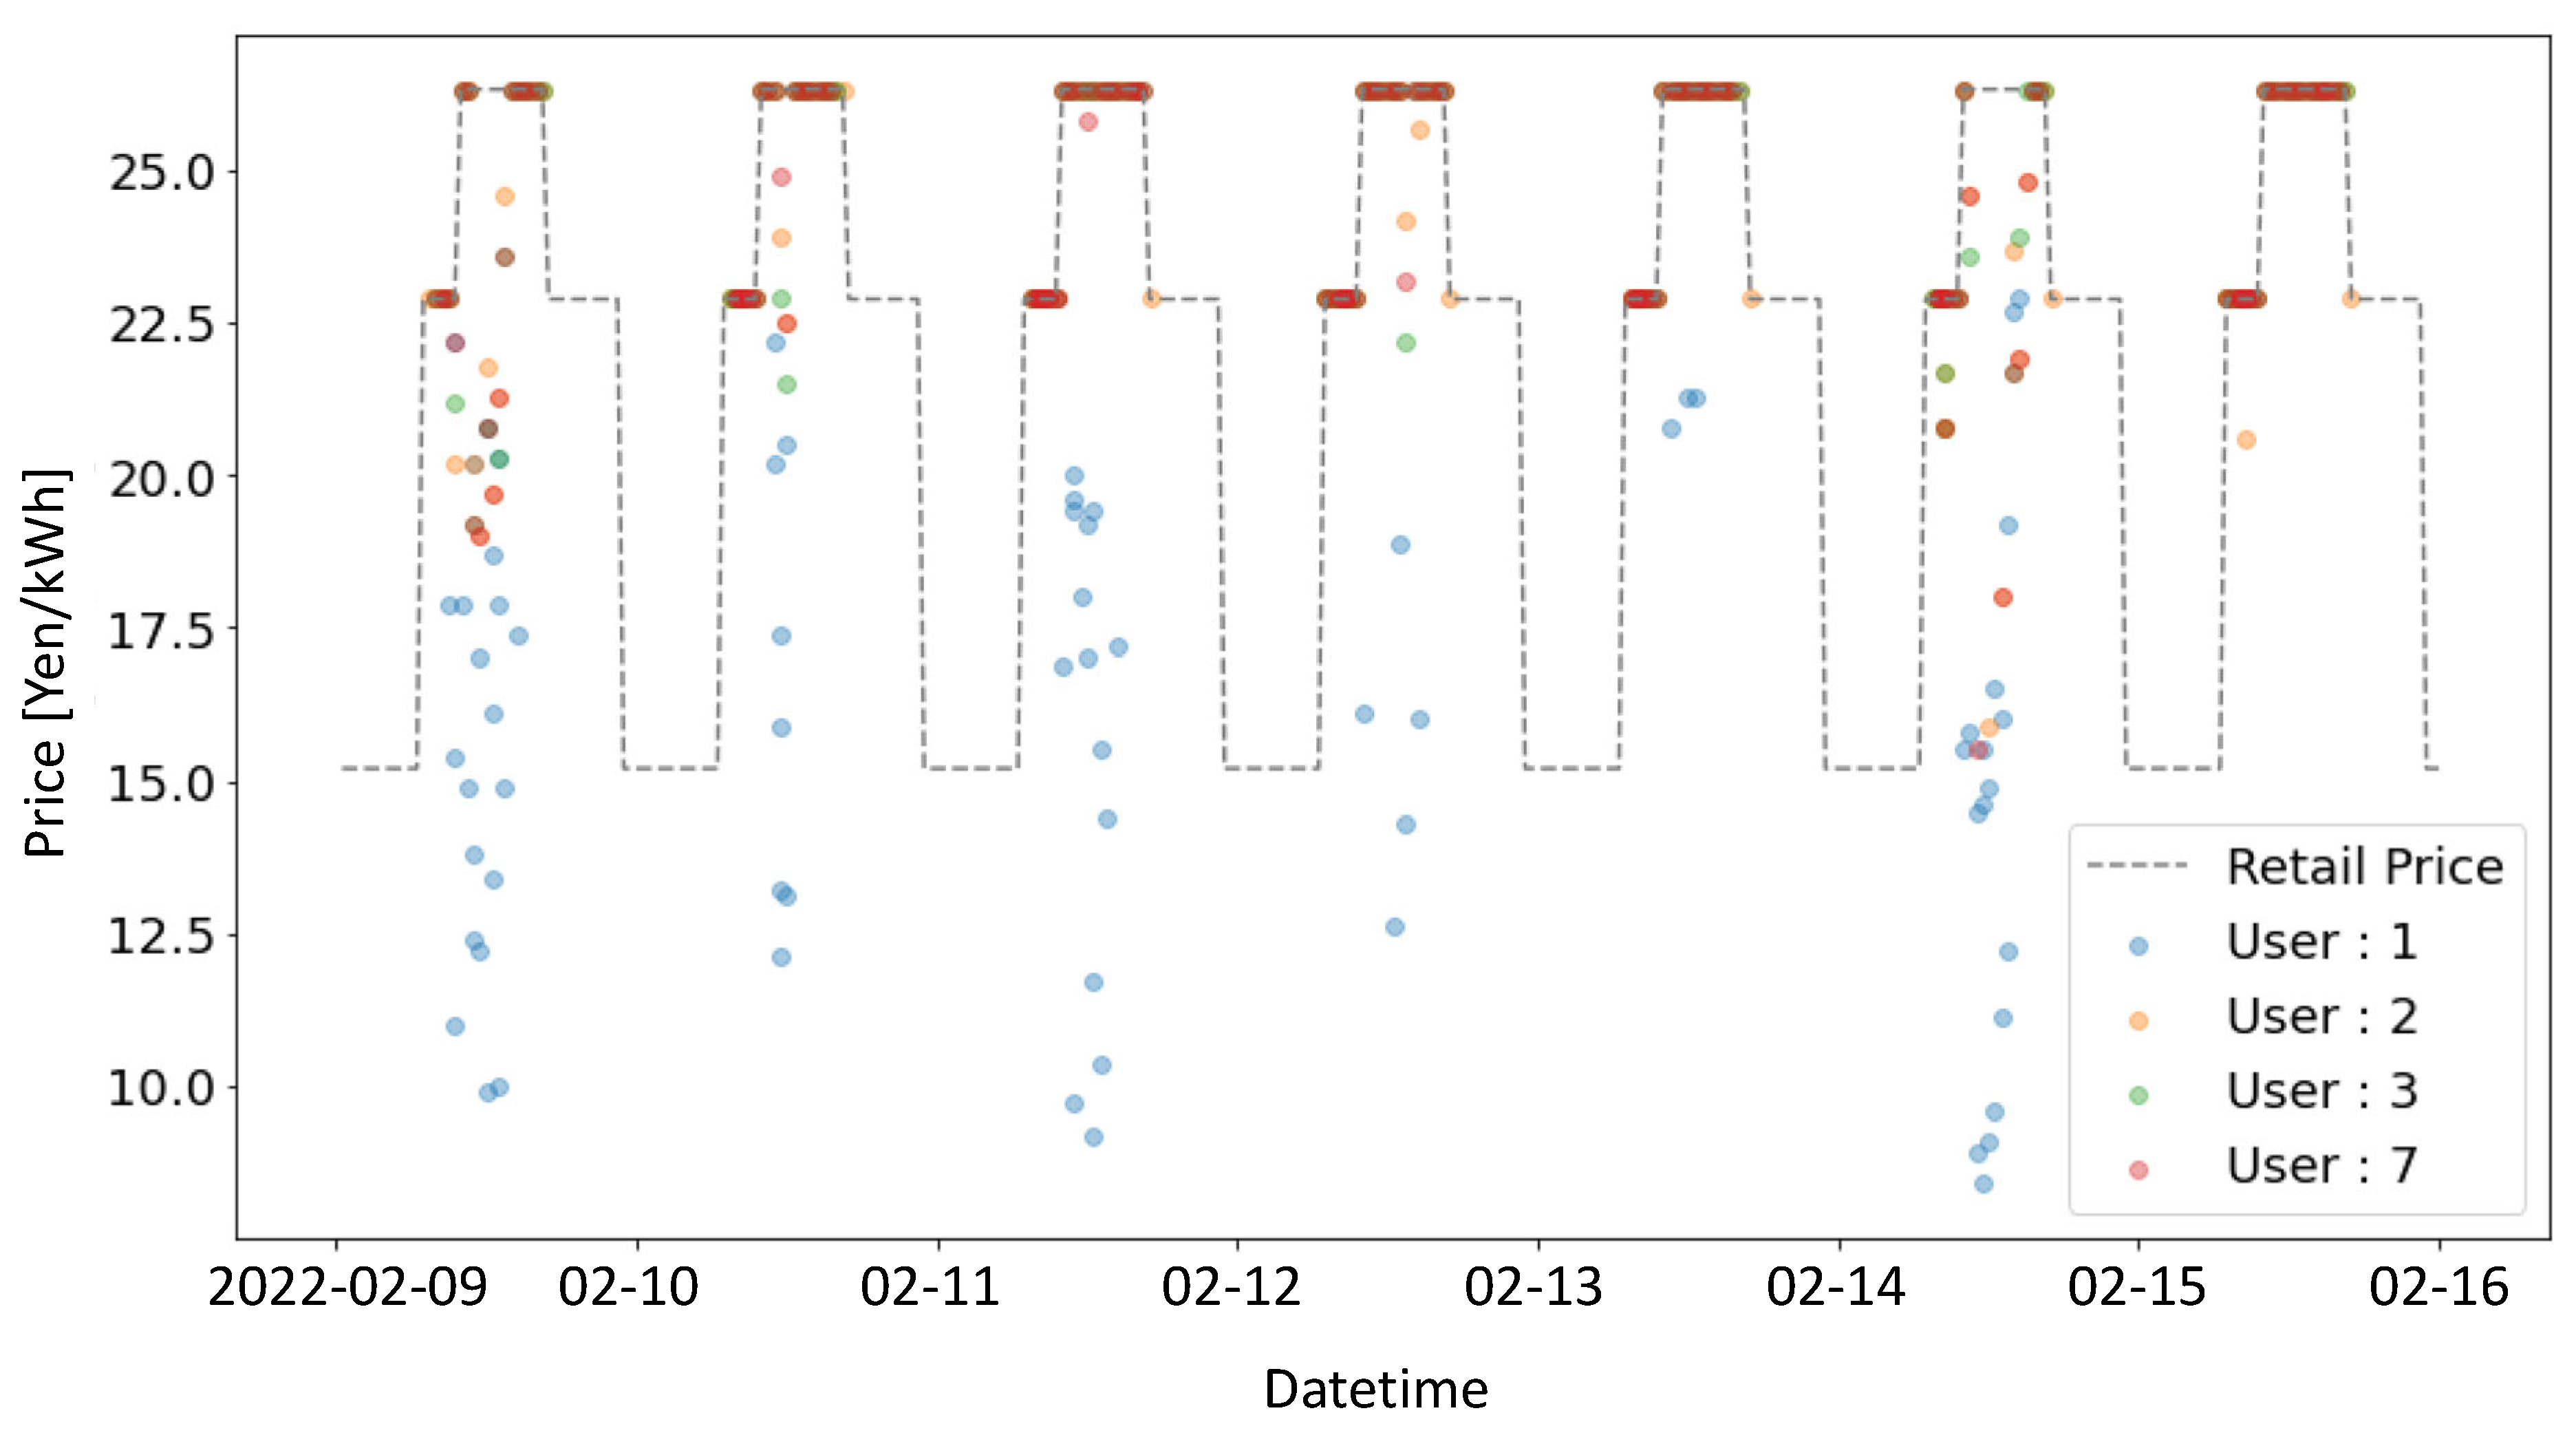
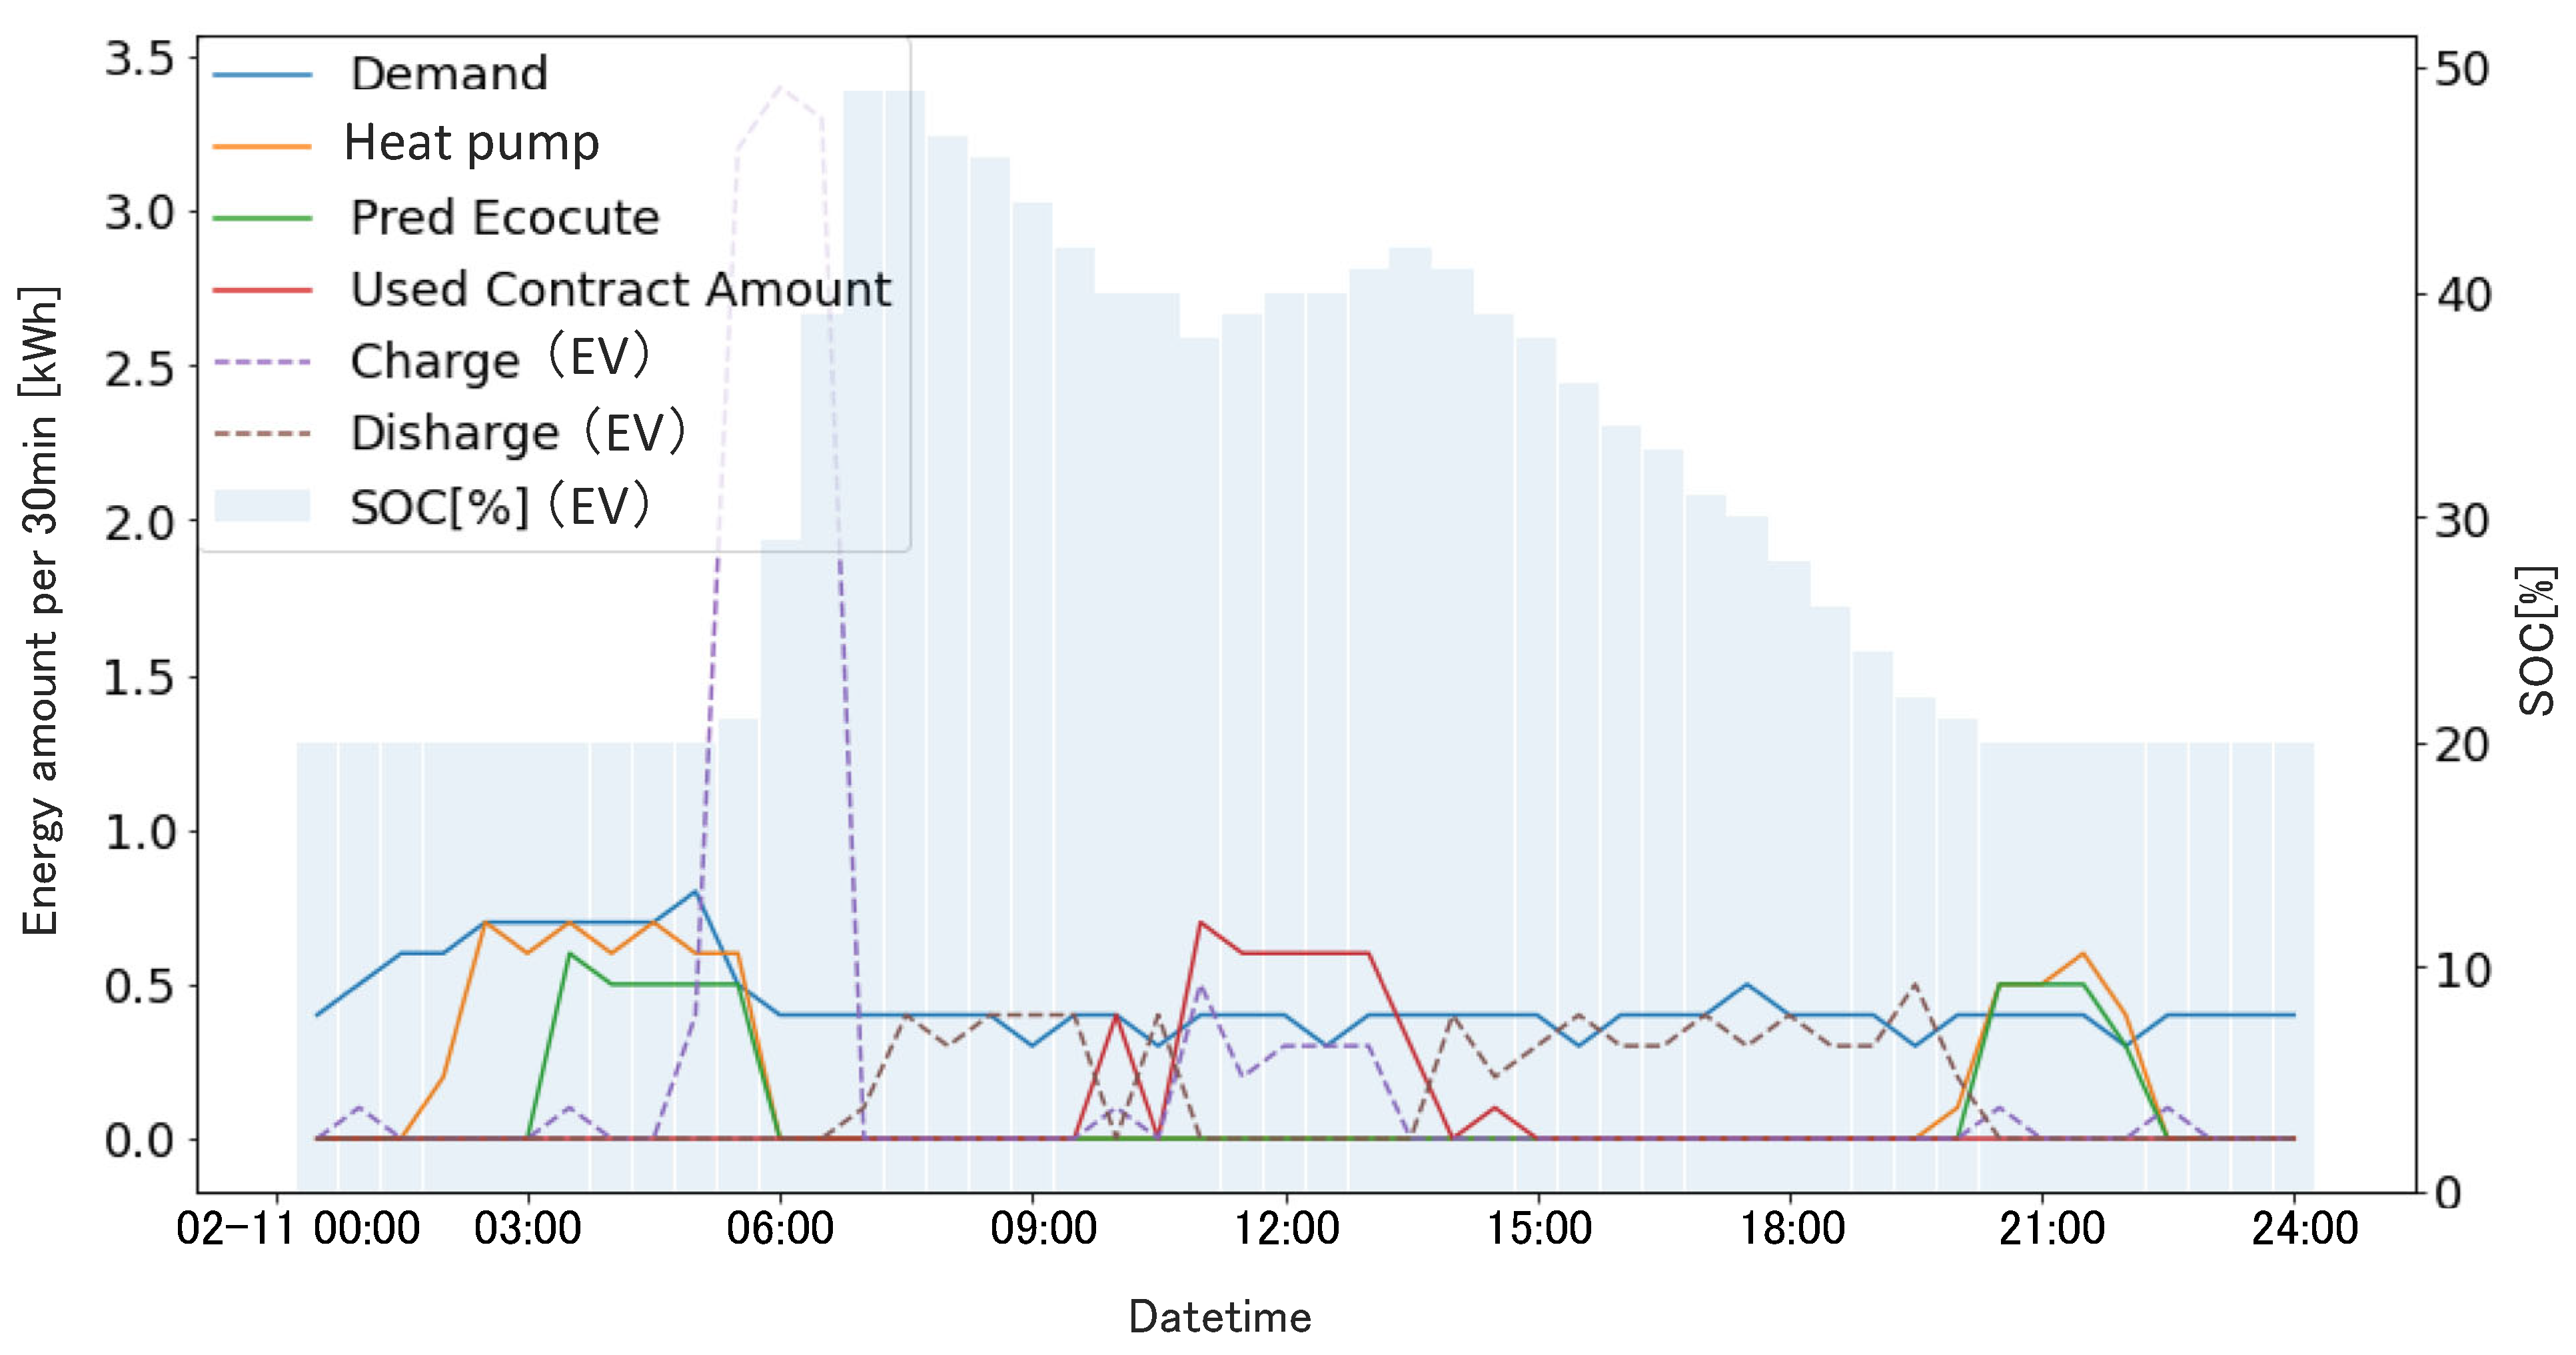
5.5. Experimental Results of Phase 3
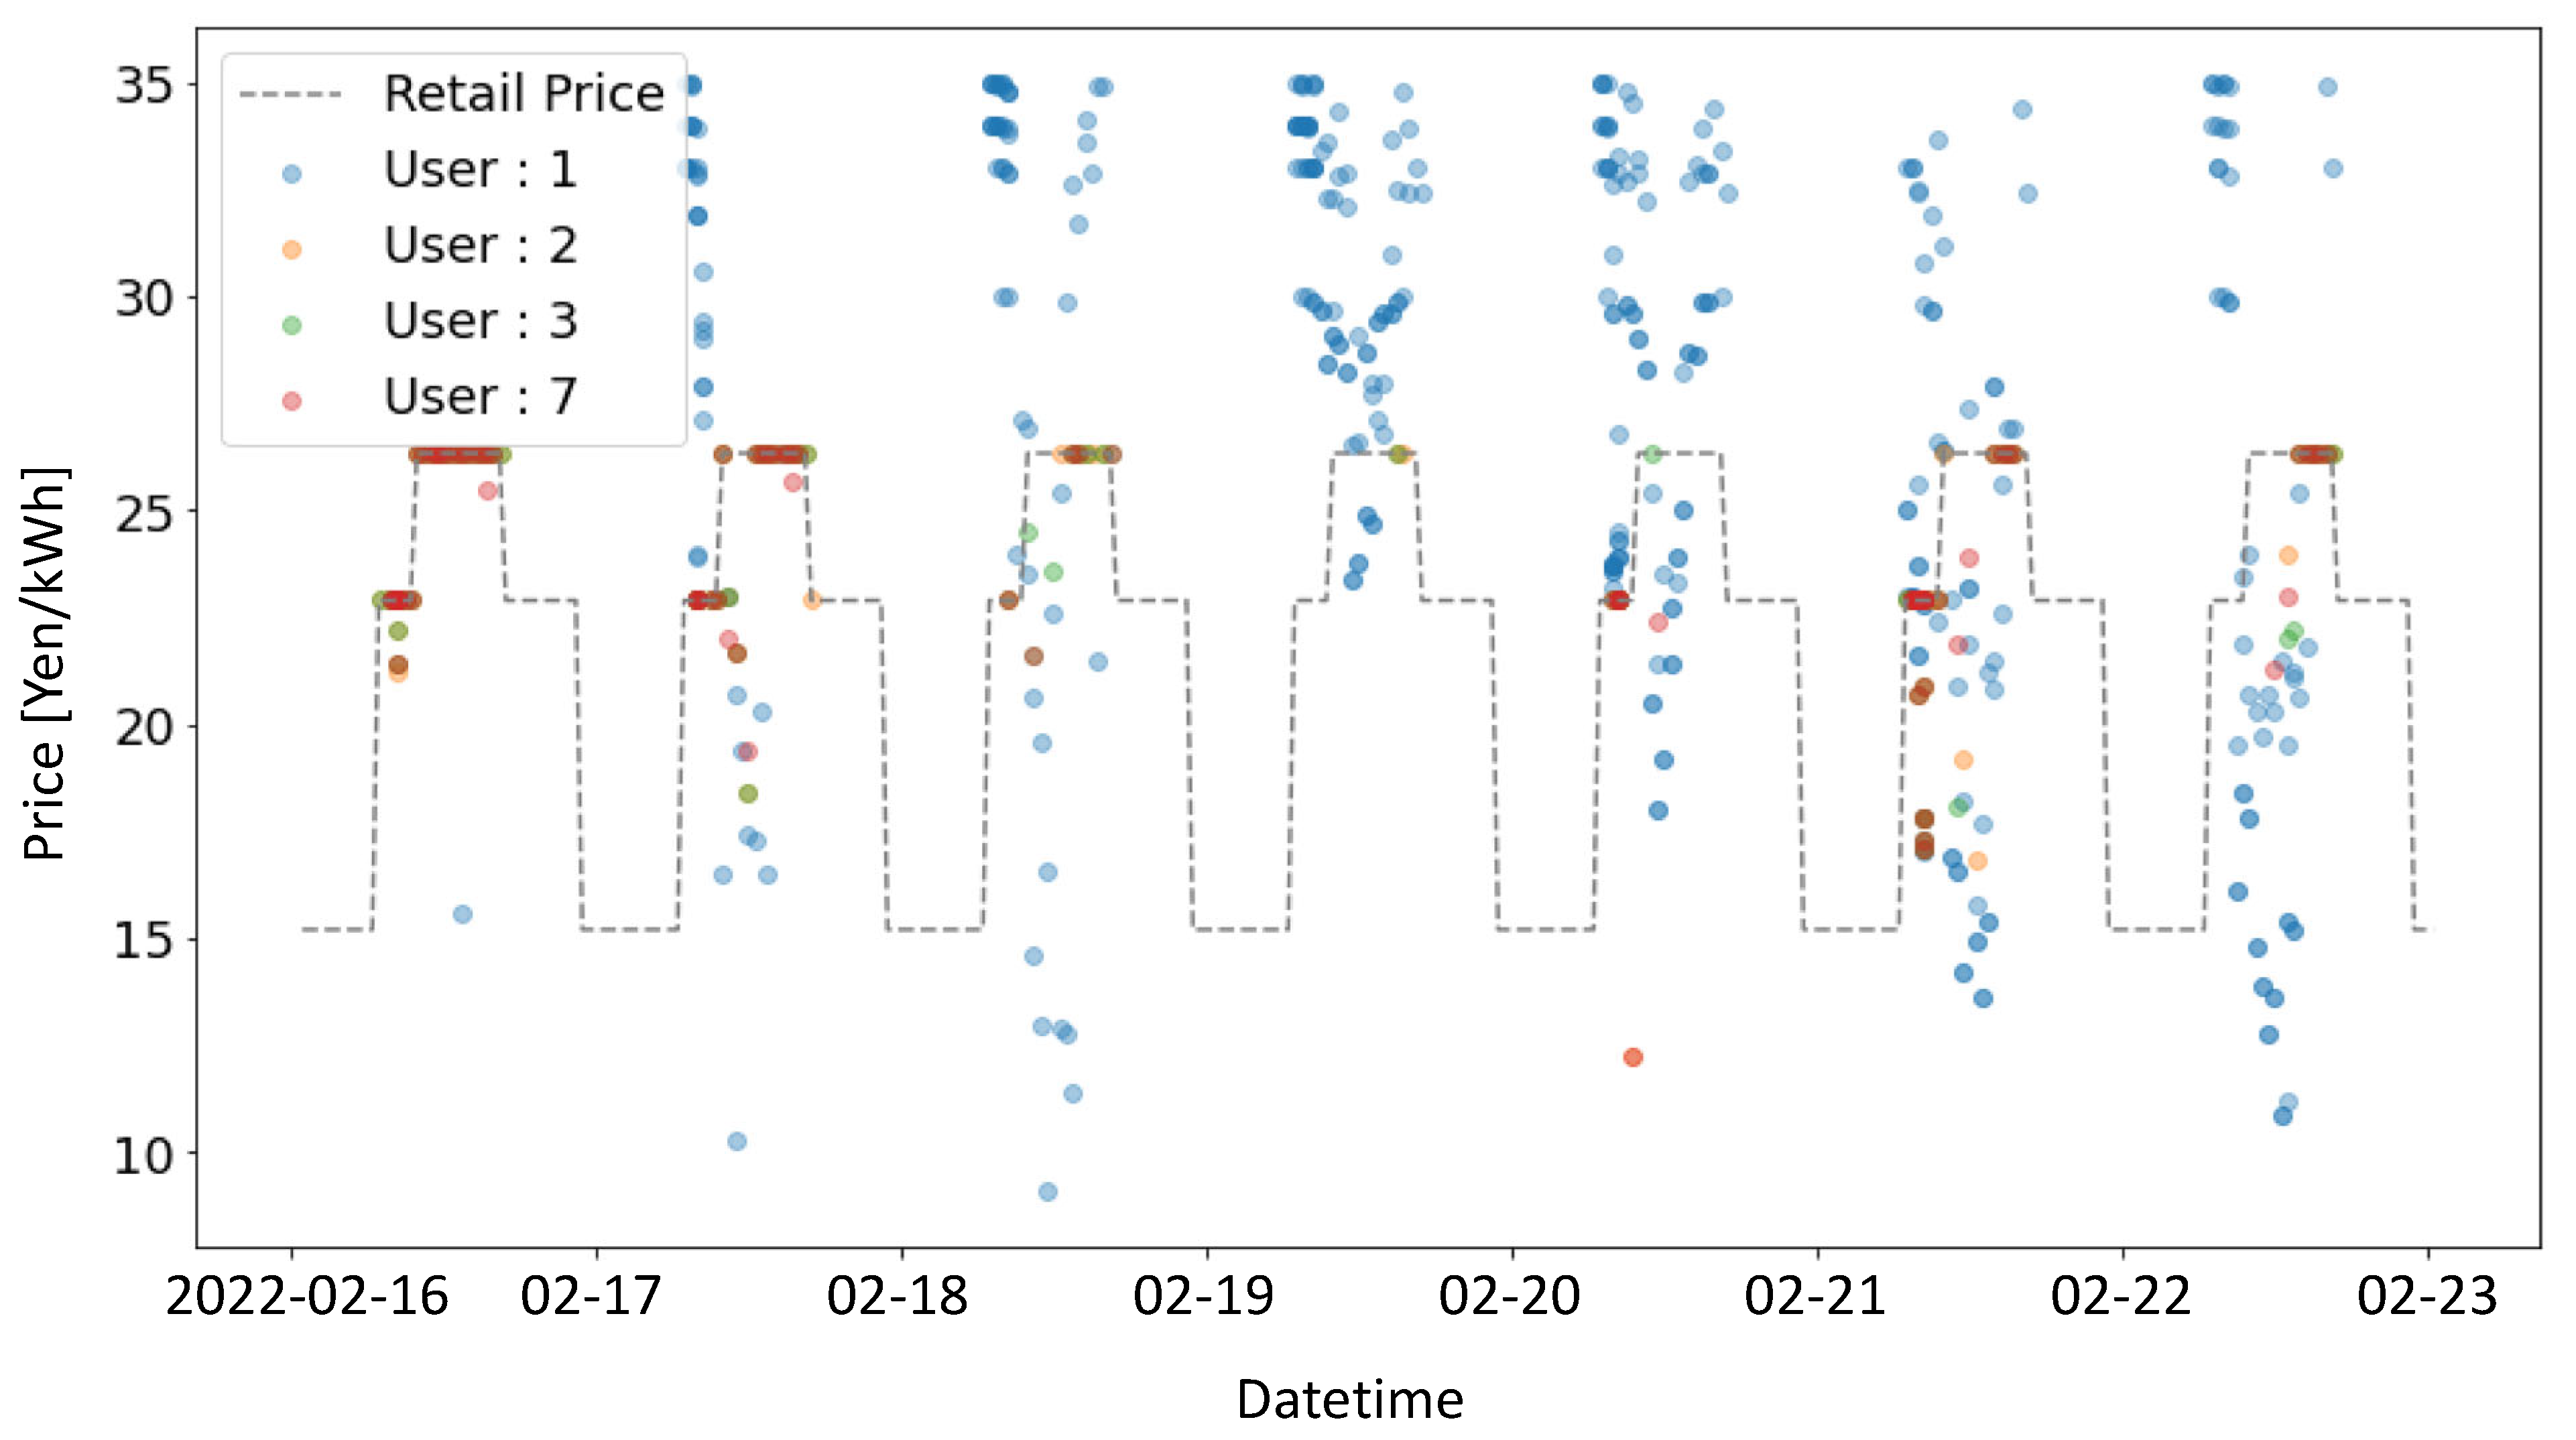
5.6. Experimental Results of Phase 4
5.7. Discussions
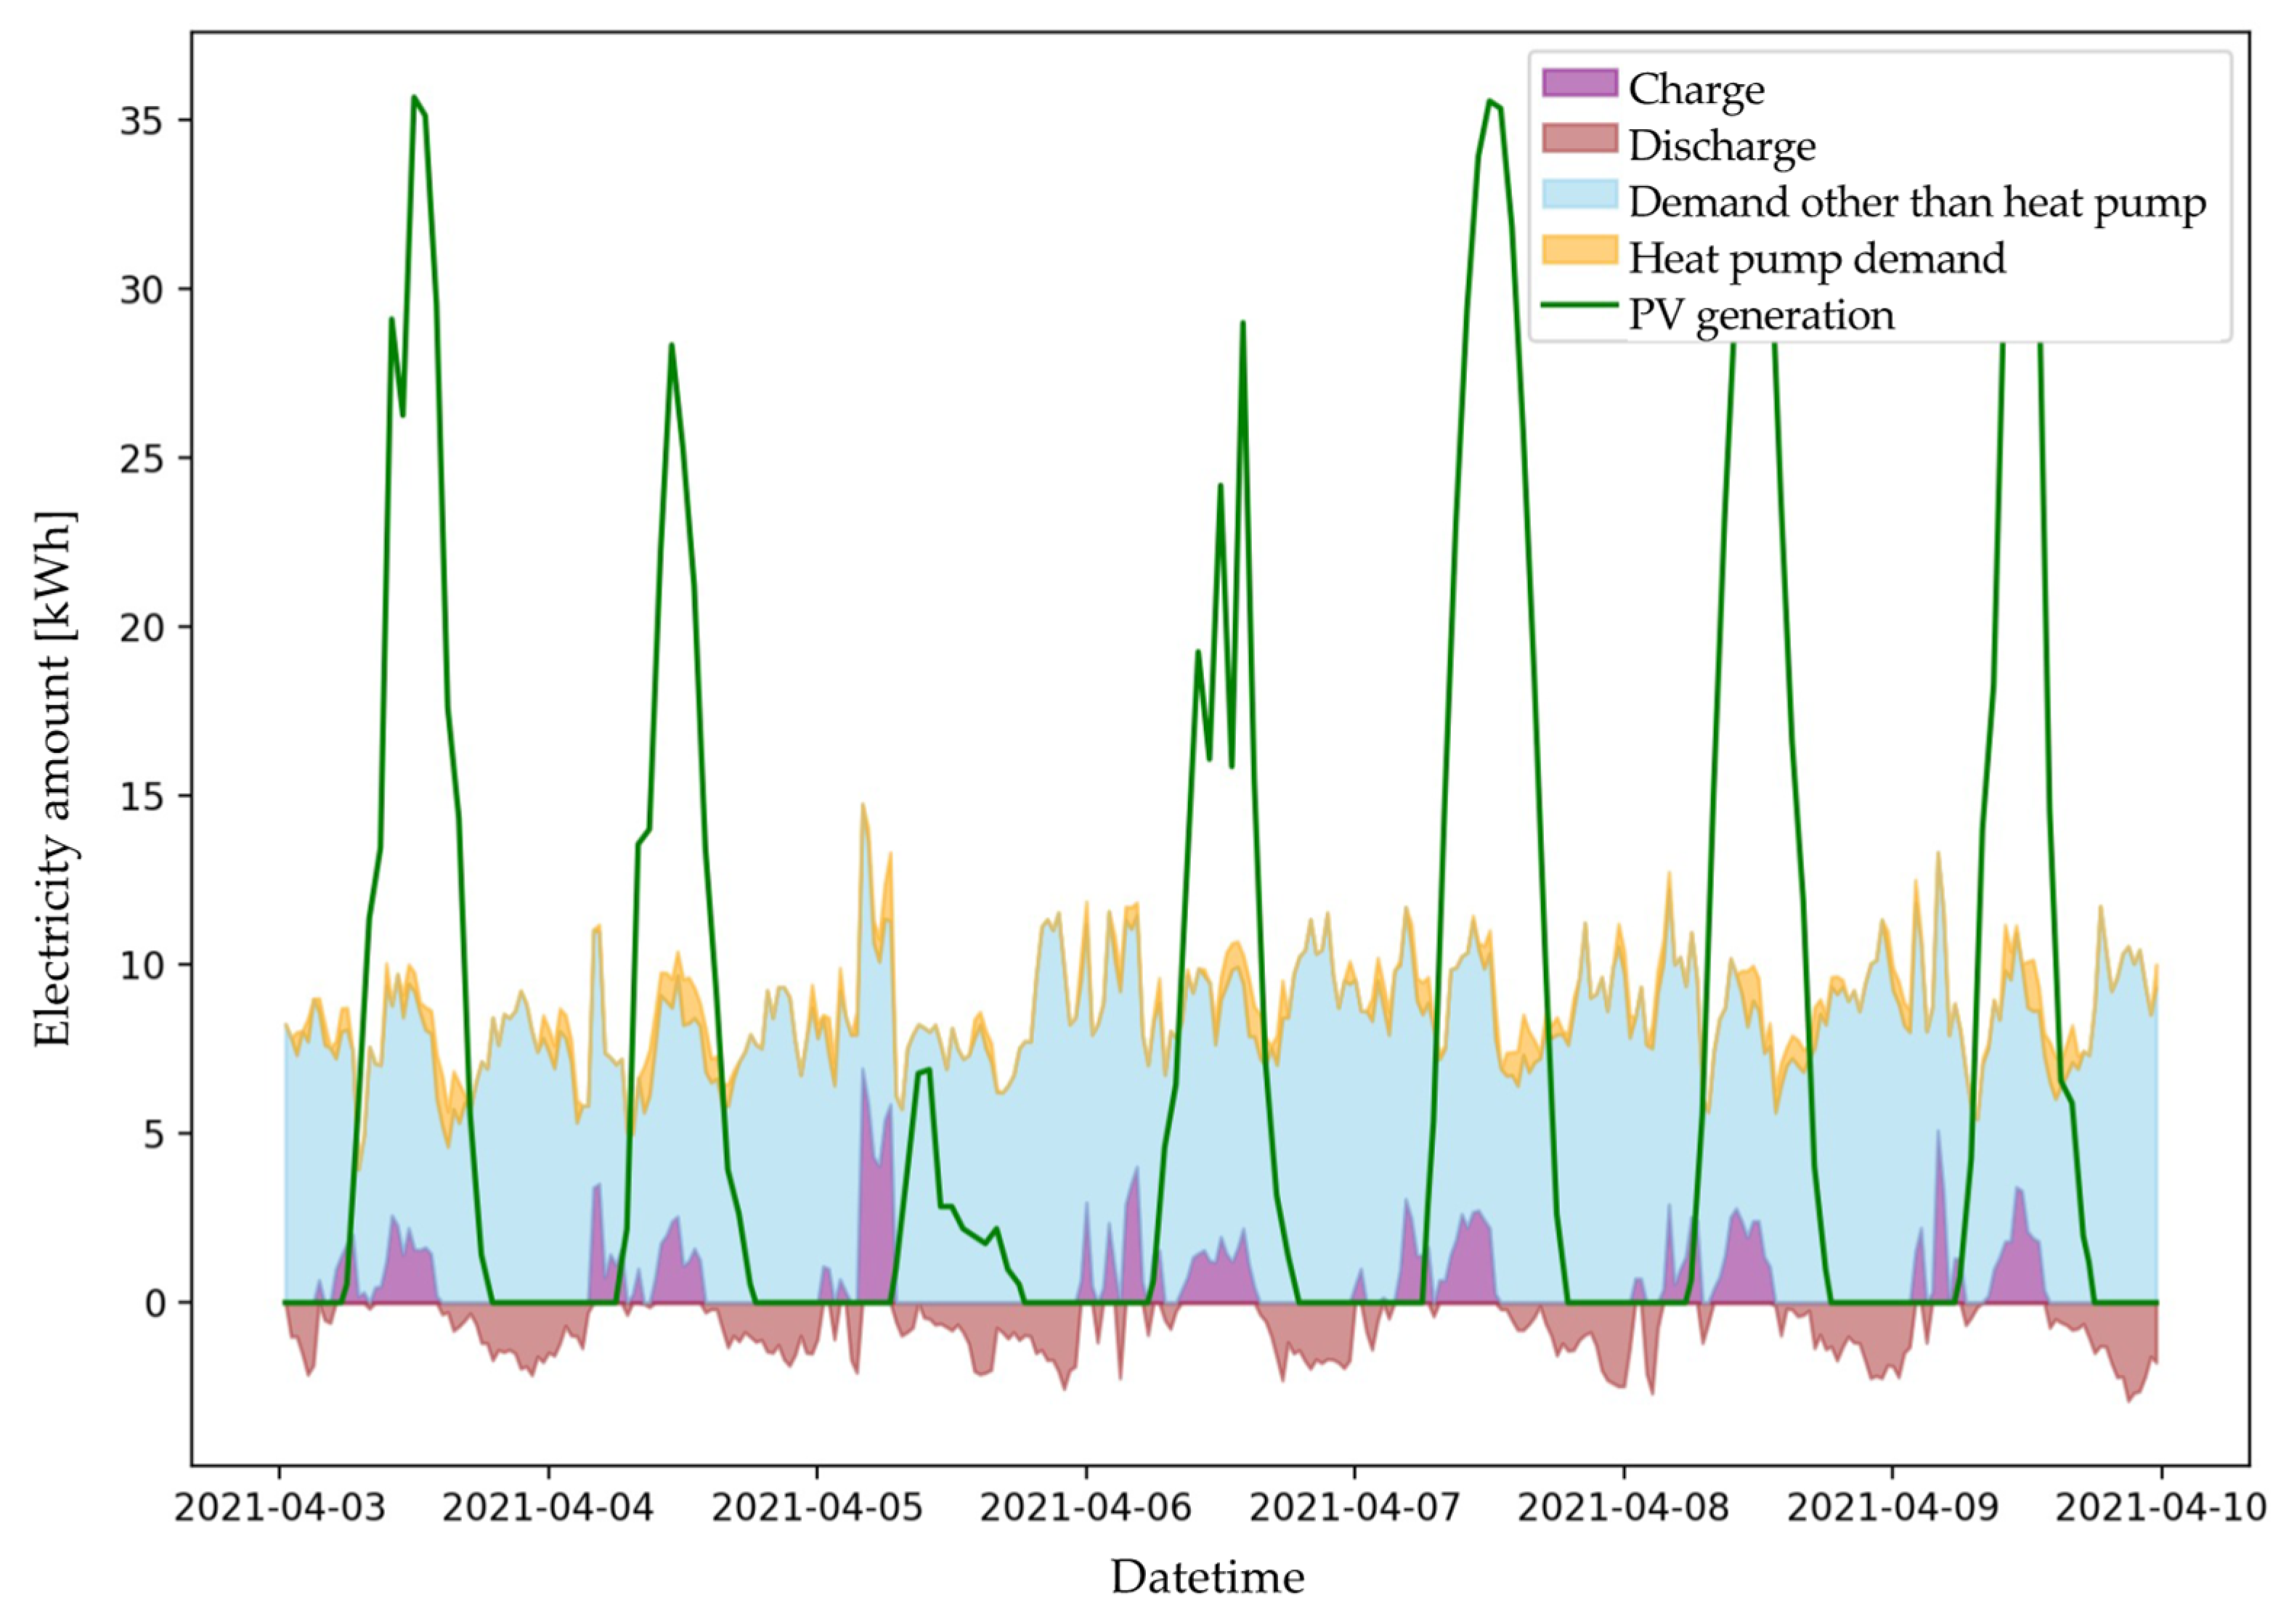
6. P2P Energy Trading Simulation
Bid Creation of the Simulator
7. Conclusions and Future Work
7.1. Conclutions
- The demonstration experiment confirmed that users in economy mode who own an EV can lower the average contract price.
- In the case of economy mode, there was no significant difference depending on whether the user owned a heat pump or not. This is thought to be because the economic benefits of the daytime shift did not arise due to the low power generation in Phase 2.
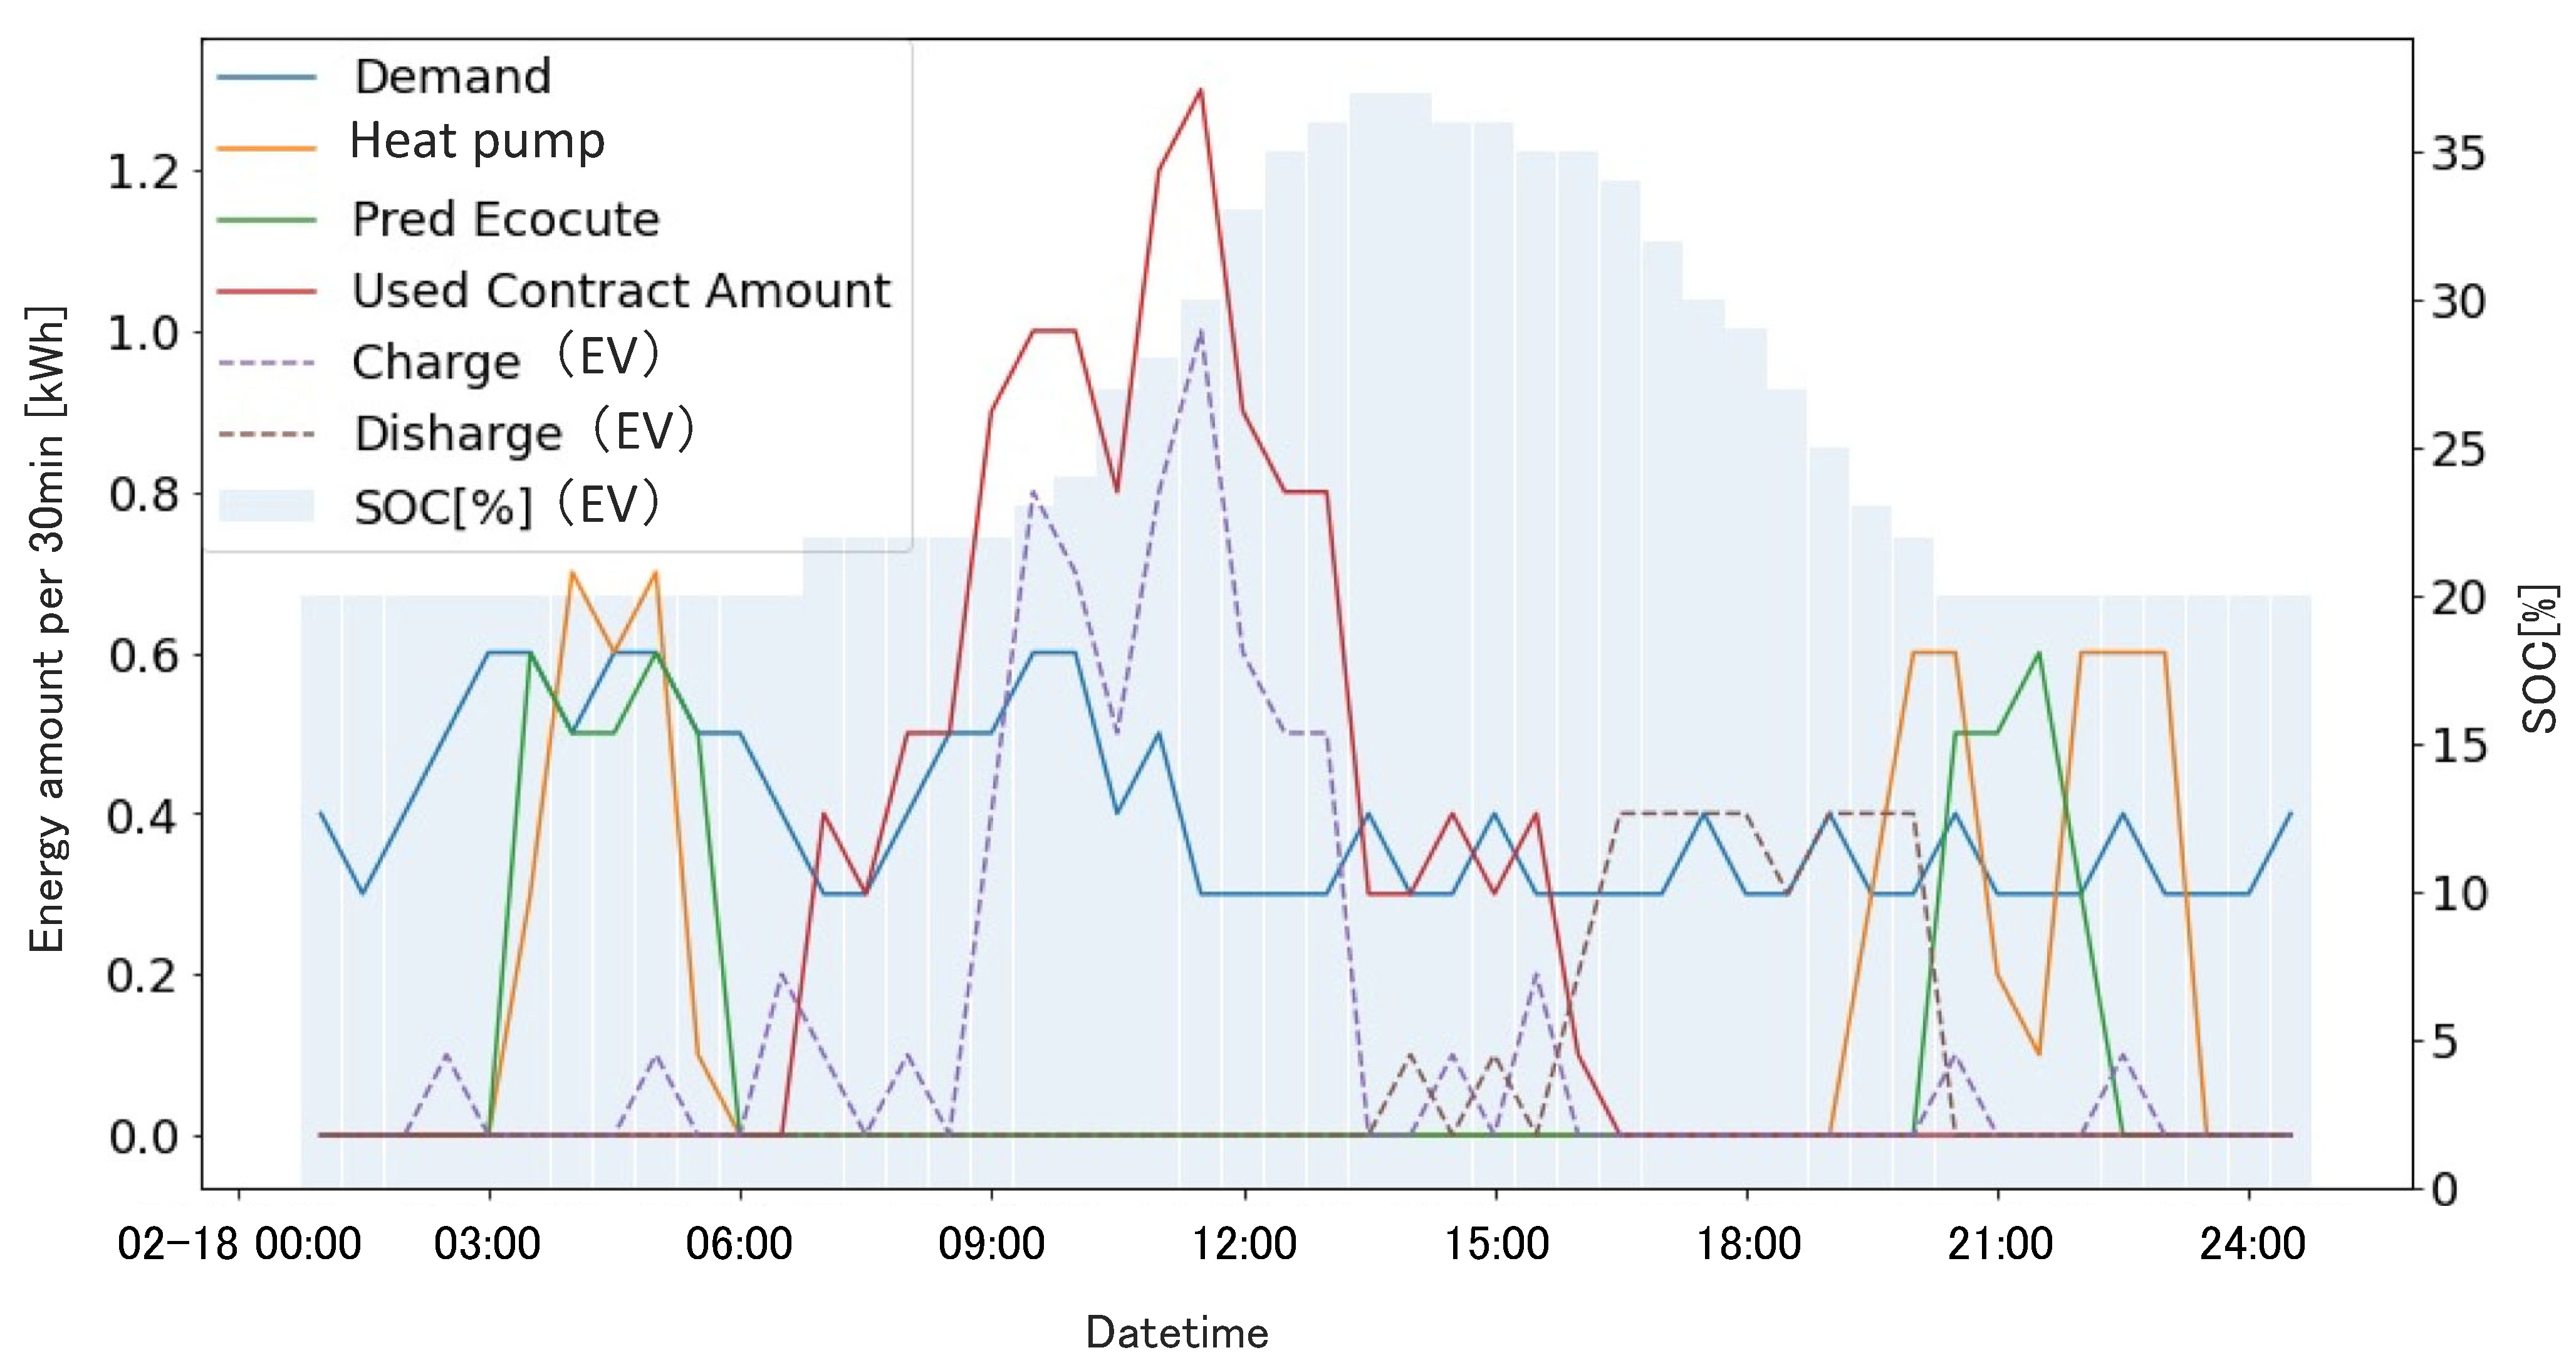
- In the case of green mode, it was confirmed that optimizing the daytime shift of a heat pump can improve the RE ratio while reducing the unit cost of electricity compared to the case where a heat pump is not shifted during the daytime.
7.2. Future Work
Author Contributions
Funding
Data Availability Statement
Acknowledgments
Conflicts of Interest
References
- Pörtner, H.-O.; Roberts, D.C.; Poloczanska, E.S.; Mintenbeck, K.; Tignor, M.; Alegría, A.; Craig, M.; Langsdorf, S.; Löschke, S.; Möller, V.; et al. (Eds.) IPCC, 2022: Summary for Policymakers. In Climate Change 2022: Impacts, Adaptation, and Vulnerability. Contribution of Working Group II to the Sixth Assessment Report of the Intergovernmental Panel on Climate Change; Cambridge University Press: Cambridge, UK, 2022; in press. [Google Scholar]
- Liu, W.; Qi, D.; Wen, F. Intraday Residential Demand Response Scheme Based on Peer-to-Peer Energy Trading. IEEE Trans. Ind. Inform. 2020, 16, 1823–1835. [Google Scholar] [CrossRef]
- AlSkaif, T.; Crespo-Vazquez, J.L.; Sekuloski, M.; van Leeuwen, G.; Catalão, J.P.S. Blockchain-Based Fully Peer-to-Peer Energy Trading Strategies for Residential Energy Systems. IEEE Trans. Ind. Inform. 2022, 18, 231–241. [Google Scholar] [CrossRef]
- Tanaka, K.; Abe, R.; Nguyen-Van, T.; Yamazaki, Y.; Kamitamari, T.; Sako, K.; Koide, T. A Proposal on an Electricity Trading Platform Using Blockchain. In Transdisciplinary Engineering Methods for Social Innovation of Industry 4.0; IOS Press: Amsterdam, The Netherland, 2018; pp. 976–983. [Google Scholar]
- Green, J.; Newman, P. Citizen utilities: The emerging power paradigm. Energy Policy 2017, 105, 283–293. [Google Scholar] [CrossRef]
- Dang, C.; Zhang, J.; Kwong, C.-P.; Li, L. Demand Side Load Management for Big Industrial Energy Users Under Blockchain-Based Peer-to-Peer Electricity Market. IEEE Trans. Smart Grid 2019, 10, 6426–6435. [Google Scholar] [CrossRef]
- Sikorski, J.J.; Haughton, J.; Kraft, M. Blockchain technology in the chemical industry: Machine-to-machine electricity market. Appl. Energy 2017, 195, 234–246. [Google Scholar] [CrossRef]
- Shukla, S.; Thakur, S.; Hussain, S.; Breslin, J.G. A Blockchain-Enabled Fog Computing Model for Peer-To-Peer Energy Trading in Smart Grid. In Blockchain and Applications; Prieto, J., Partida, A., Leitão, P., Pinto, A., Eds.; Springer International Publishing: Cham, Switzerland, 2021; pp. 14–23. [Google Scholar]
- Matsuda, Y.; Yamazaki, Y.; Oki, H.; Takeda, Y.; Sagawa, D.; Tanaka, K. Demonstration of Blockchain Based Peer to Peer En-ergy Trading System with Real-Life Used PHEV and HEMS Charge Control. Energies 2021, 14, 7484. [Google Scholar] [CrossRef]
- Mengelkamp, E.; Gärttner, J.; Rock, K.; Kessler, S.; Orsini, L.; Weinhardt, C. Designing microgrid energy markets: A case study: The Brooklyn Microgrid. Appl. Energy 2018, 210, 870–880. [Google Scholar] [CrossRef]
- Cali, U.; Çakir, O. Energy policy instruments for distributed ledger technology empowered peer-to-peer local energy markets. IEEE Access 2019, 7, 82888–82900. [Google Scholar] [CrossRef]
- Takeda, Y.; Nakai, Y.; Senoo, T.; Tanaka, K. Designing a User-Centric P2P Energy Trading Platform: A Case Study—Higashi-Fuji Demonstration. Energies 2021, 14, 7289. [Google Scholar] [CrossRef]
- Kontani, R.; Tanaka, K.; Yamada, Y. Feasibility Conditions for Demonstrative Peer-to-Peer Energy Market. Energies 2021, 14, 7418. [Google Scholar] [CrossRef]
- Ahl, A.; Yarime, M.; Goto, M.; Chopra, S.S.; Kumar, N.M.; Tanaka, K.; Sagawa, D. Exploring blockchain for the energy transition: Opportunities and challenges based on a case study in Japan. Renew. Sustain. Energy Rev. 2020, 117, 109488. [Google Scholar] [CrossRef]
- Ahl, A.; Yarime, M.; Tanaka, K.; Sagawa, D. Review of blockchain-based distributed energy: Implications for institutional development. Renew. Sustain. Energy Rev. 2019, 107, 200–211. [Google Scholar] [CrossRef]
- Hanna, R.; Ghonima, M.; Kleissl, J.; Tynan, G.; Victor, D.G. Evaluating business models for microgrids: Interactions of technology and policy. Energy Policy 2017, 103, 47–61. [Google Scholar] [CrossRef]
- Zhou, Y.; Wu, J.; Long, C. Evaluation of peer-to-peer energy sharing mechanisms based on a multiagent simulation framework. Appl. Energy 2018, 222, 993–1022. [Google Scholar] [CrossRef]
- Long, Y.; Wang, Y.; Pan, C. Incentive mechanism of micro-grid project development. Sustainability 2018, 10, 163. [Google Scholar] [CrossRef]
- Wu, X.; Hu, X.; Yin, X.; Moura, S.J. Stochastic Optimal Energy Management of Smart Home with PEV Energy Storage. IEEE Trans. Smart Grid 2018, 9, 2065–2075. [Google Scholar] [CrossRef]
- Vivekananthan, C.; Mishra, Y.; Li, F. Real-Time Price Based Home Energy Management Scheduler. IEEE Trans. Power Syst. 2015, 30, 2149–2159. [Google Scholar] [CrossRef]
- Englberger, S.; Gamra, K.A.; Tepe, B.; Schreiber, M.; Jossen, A.; Hesse, H. Electric vehicle multi-use: Optimizing multiple value streams using mobile storage systems in a vehicle-to-grid context. Appl. Energy 2021, 304, 117862. [Google Scholar] [CrossRef]
- Langer, L. An Optimal Peer-to-Peer Market Considering Modulating Heat Pumps and Photovoltaic Systems under the German Levy Regime. Energies 2020, 13, 5348. [Google Scholar] [CrossRef]
- Sagawa, D.; Tanaka, K.; Ishida, F.; Saito, H.; Takenaga, N.; Nakamura, S.; Aoki, N.; Nameki, M.; Saegusa, K. Bidding Agents for PV and Electric Vehicle-Owning Users in the Electricity P2P Trading Market. Energies 2021, 14, 8309. [Google Scholar] [CrossRef]
- Dean Holland Clift, Harry Suehrcke, Control optimization of PV powered electric storage and heat pump water heaters. Sol. Energy 2021, 226, 489–500. [CrossRef]
- Morstyn, T.; McCulloch, M.D. Multiclass Energy Management for Peer-to-Peer Energy Trading Driven by Prosumer Preferences. IEEE Trans. Power Syst. 2019, 34, 4005–4014. [Google Scholar] [CrossRef]
- Park, D.-H.; Park, J.-B.; Lee, K.Y.; Son, S.-Y.; Roh, J.H. A Bidding-Based Peer-to-Peer Energy Transaction Model Considering the Green Energy Preference in Virtual Energy Community. IEEE Access 2021, 9, 87410–87419. [Google Scholar] [CrossRef]
- Park, D.-H.; Park, Y.-G.; Roh, J.-H.; Lee, K.Y.; Park, J.-B. A Hierarchical Peer-to-Peer Energy Transaction Model Considering Prosumer’s Green Energy Preference. Int. J. Control. Autom. Syst. 2021, 19, 311–317. [Google Scholar] [CrossRef]
- Reis, I.F.G.; Gonçalves, I.; Lopes, M.A.R.; Antunes, C.H. Assessing the Influence of Different Goals in Energy Communities’ Self-Sufficiency—An Optimized Multiagent Approach. Energies 2021, 14, 989. [Google Scholar] [CrossRef]
- Pena-Bello, A.; Parra, D.; Herberz, M.; Tiefenbeck, V.; Patel, M.K.; Hahnel, U.J. Integration of prosumer peer-to-peer trading decisions into energy community modelling. Nat. Energy 2022, 7, 74–82. [Google Scholar] [CrossRef]
- ECHONET Lite, “ECHONET Lite API”. Available online: https://echonet.jp/web_api_appendix_v100/ (accessed on 1 December 2022).
- Meteorological Engineering Center, Inc. Apollon: Solar Power Generation Forecast System. Available online: https://www.meci.jp/apollon.html (accessed on 1 December 2022).
- Breiman, L. Random Forests. Mach. Learn. 2001, 45, 5–32. [Google Scholar] [CrossRef]
- The Kansai Electric Power Co., Inc. Hapi-E-Time R. Available online: https://kepco.jp/ryokin/menu/hapie_r/ (accessed on 29 November 2021).


| Hour | Price [Yen/kWh] |
|---|---|
| 7:00–10:00 | 22.89 |
| 10:00–17:00 | 26.33 |
| 17:00–23:00 | 22.89 |
| 23:00–7:00 | 15.20 |
| Entities | Description |
|---|---|
| HOME1 | Laboratory A with EV and Heat pump |
| HOME2 | Laboratory B |
| HOME3 | Laboratory C |
| HOME4 | Laboratory D |
| PV1 | Solar power generation |
| Experimental Phase | Period | Setting |
|---|---|---|
| Phase 1 | 2022/1/26–2022/2/1 | Set only HOME1 to green mode and all others to economy mode. |
| Phase 2 | 2022/2/2–2022/2/8 | All users are set to economy mode. |
| Phase 3 | 2022/2/9–2022/2/15 | The daytime shift of the heat pump of HOME1 is not performed and set all users to economy mode. |
| Phase 4 | 2022/2/16–2022/2/22 | The daytime shift of the heat pump of HOME1 is not performed, and only HOME1 is set to Green Mode, while all other users are set to Economy Mode. |
| Phase | Entities | Contract Amount [kWh] | Average Contract Price [Yen/kWh] |
|---|---|---|---|
| 1 | PV1 | 111.6 | 30.46 |
| HOME1 | 107.3 | 30.68 | |
| HOME2 | 2.1 | 24.74 | |
| HOME3 | 1.3 | 25.78 | |
| HOME4 | 0.9 | 24.28 | |
| 2 | PV1 | 85.4 | 22.10 |
| HOME1 | 22.7 | 16.85 | |
| HOME2 | 19.6 | 24.01 | |
| HOME3 | 14.2 | 24.03 | |
| HOME4 | 28.9 | 23.97 | |
| 3 | PV1 | 94.5 | 22.32 |
| HOME1 | 23.7 | 16.31 | |
| HOME2 | 22.0 | 24.15 | |
| HOME3 | 15.9 | 24.48 | |
| HOME4 | 32.9 | 24.38 | |
| 4 | PV1 | 139.9 | 25.52 |
| HOME1 | 100.9 | 26.13 | |
| HOME2 | 12.1 | 23.97 | |
| HOME3 | 9.3 | 24.03 | |
| HOME4 | 17.6 | 23.91 |
| Phase | Entities | Demand | Contract Amount in the Market [kWh] | Amount Purchased from the Grid [kWh] | RE Ratio [%] |
|---|---|---|---|---|---|
| 1 | HOME1 | 177.0 | 107.3 | 110.3 | 37.68 |
| HOME2 | 30.4 | 2.1 | 29.0 | 4.61 | |
| HOME3 | 33.7 | 1.3 | 32.5 | 3.56 | |
| HOME4 | 86.6 | 0.9 | 85.8 | 0.92 | |
| 2 | HOME1 | 201.5 | 22.7 | 186.7 | 7.34 |
| HOME2 | 35.6 | 19.6 | 25.9 | 27.25 | |
| HOME3 | 34.5 | 14.2 | 24.9 | 27.83 | |
| HOME4 | 86.6 | 28.9 | 66.8 | 22.86 | |
| 3 | HOME1 | 199.0 | 23.7 | 183.8 | 7.64 |
| HOME2 | 32.9 | 22.0 | 20.7 | 37.08 | |
| HOME3 | 34.1 | 15.9 | 22.2 | 34.90 | |
| HOME4 | 86.5 | 32.9 | 61.8 | 28.55 | |
| 4 | HOME1 | 200.8 | 100.9 | 140.8 | 29.88 |
| HOME2 | 33.4 | 12.1 | 26.3 | 21.26 | |
| HOME3 | 35.2 | 9.3 | 28.7 | 18.47 | |
| HOME4 | 87.2 | 17.6 | 75.3 | 13.65 |
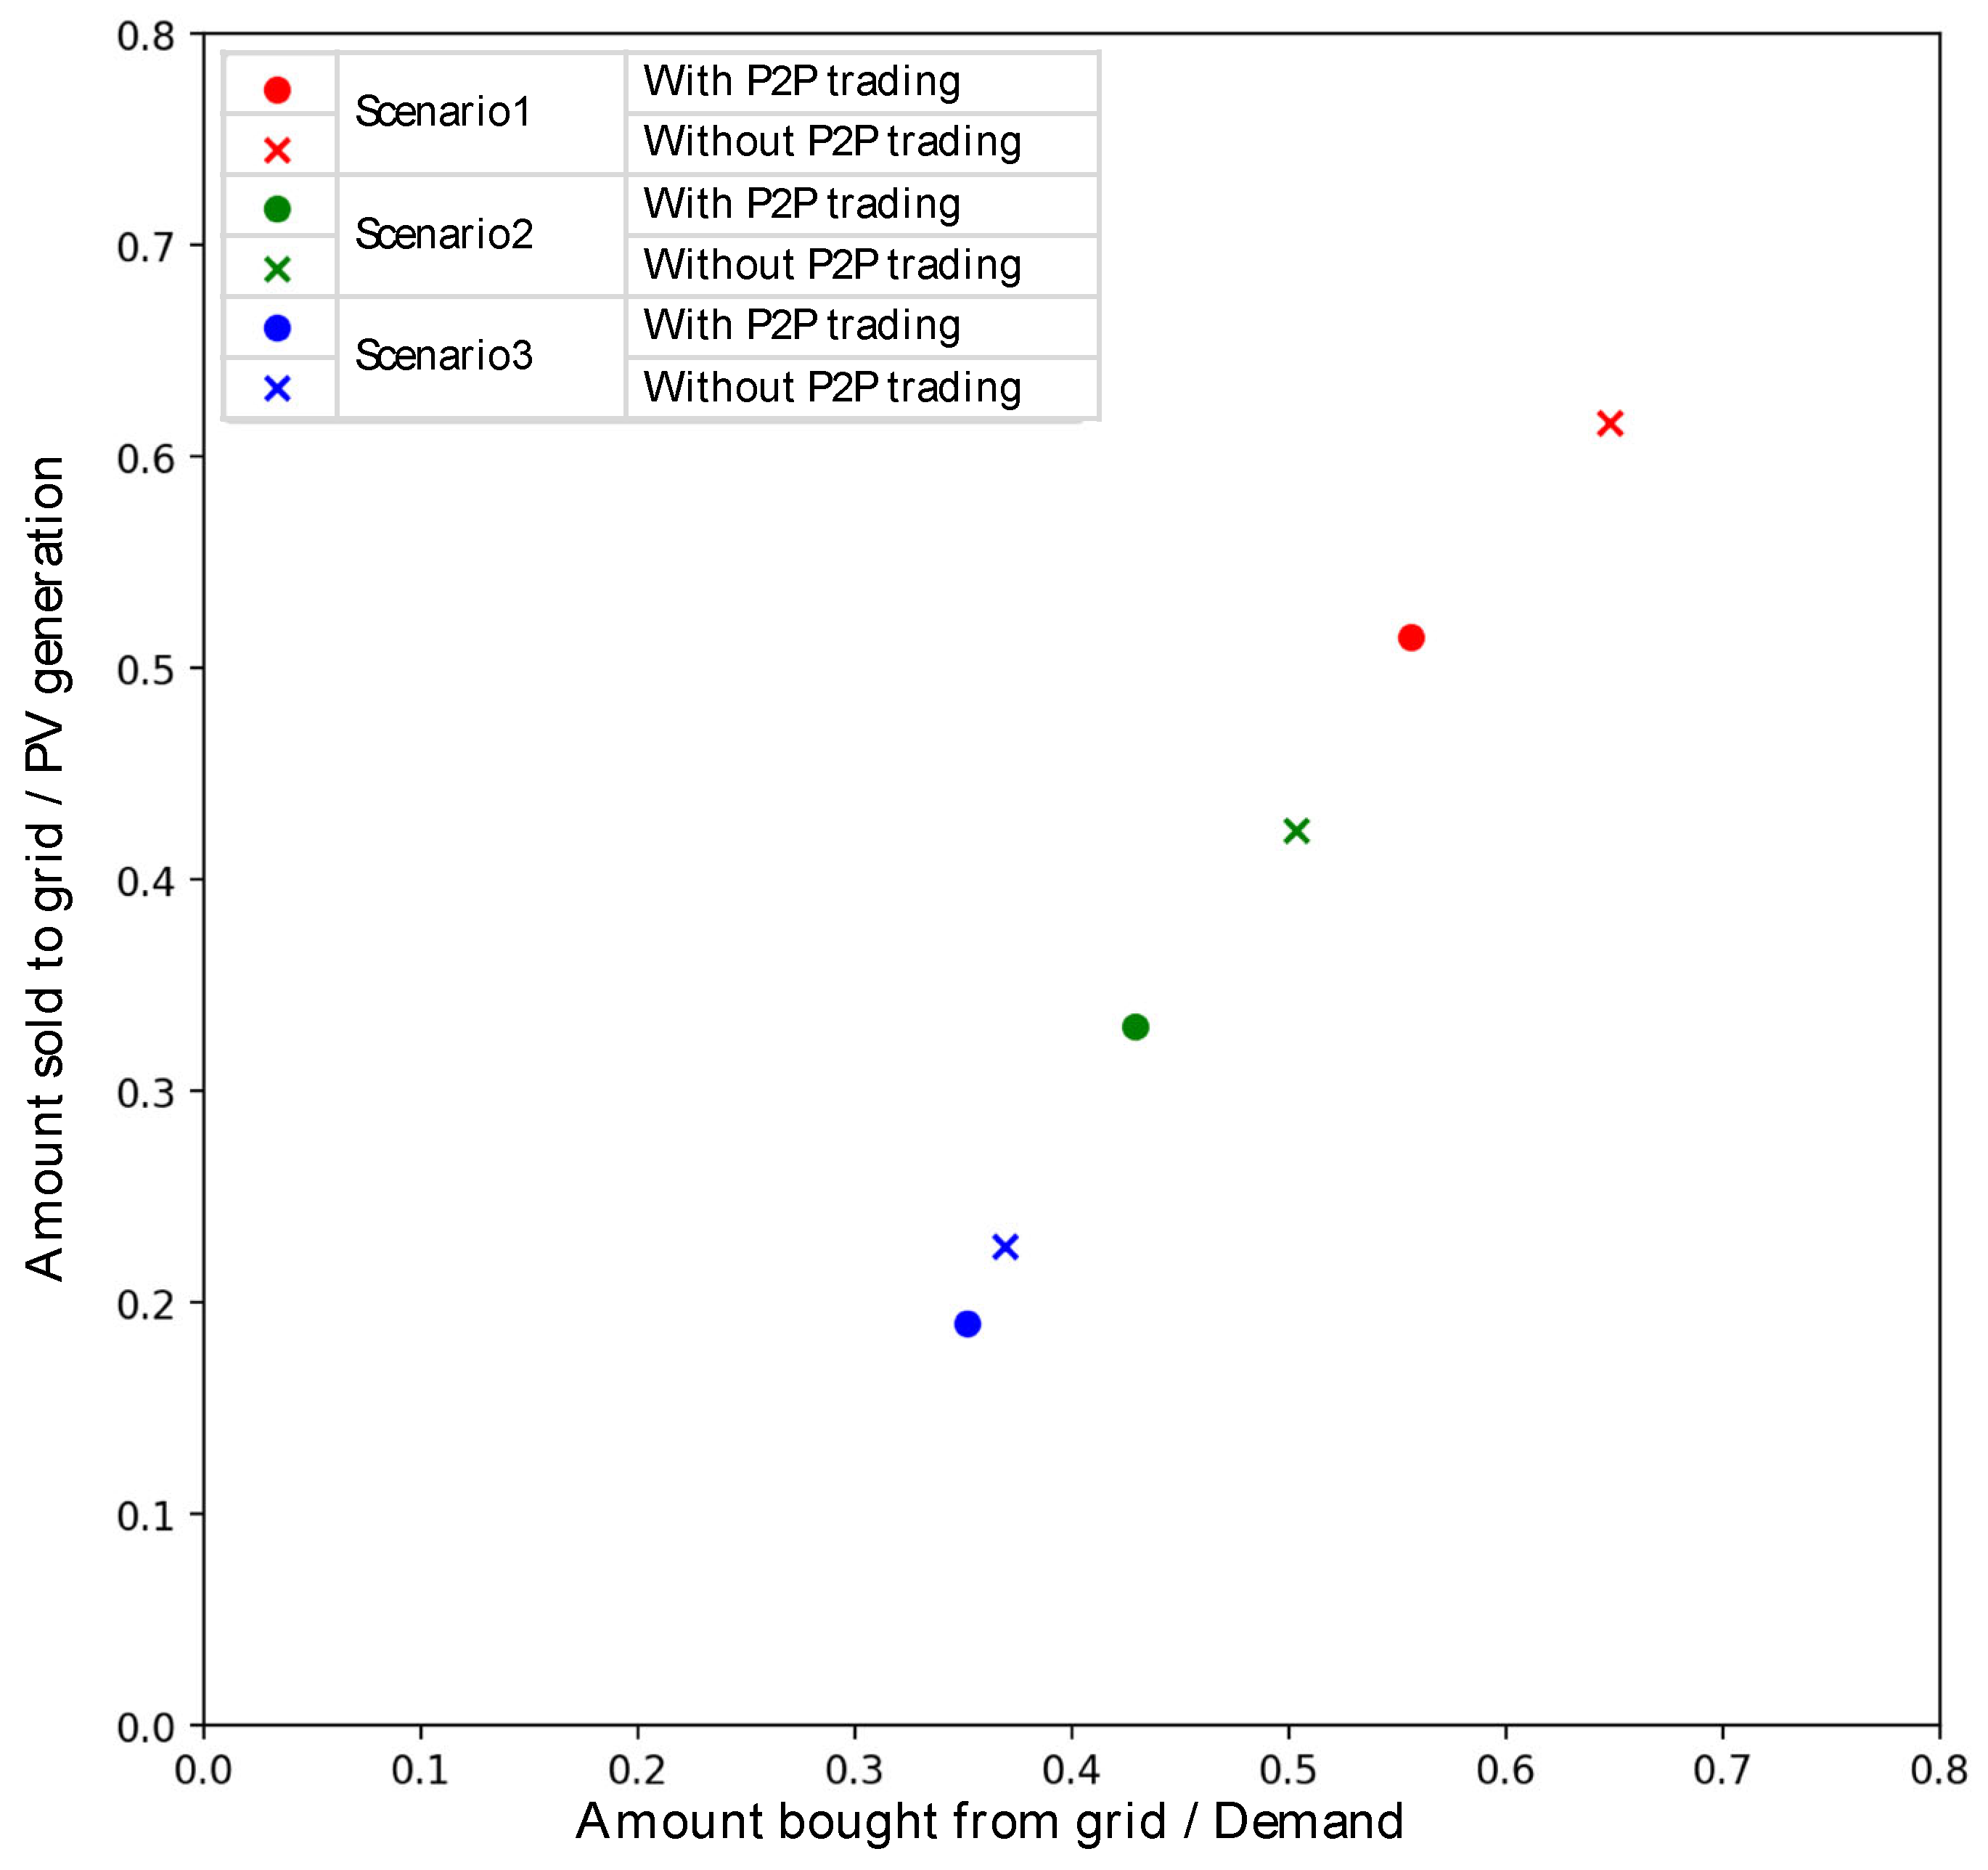
| Equipment Ownership Scenario | Percentage of PV Owned | Percentage of EV Owned | Percentage of HP Owned |
|---|---|---|---|
| 1 | 75% | 20% | 20% |
| 2 | 75% | 50% | 50% |
| 3 | 75% | 80% | 80% |
| Scenario | with or without P2P | PV Generation [kWh] | Demand [kWh] | Amount Sold to Grid [kWh] | Amount Bought from Grid [kWh] | Amount Sold to Grid ÷ PV Generation [%] | Amount Bought from Grid ÷ Demand [%] |
|---|---|---|---|---|---|---|---|
| Scenario1 | With | 2517 | 2755 | 1295 | 1533 | 51.5% | 55.6% |
| Without | 2517 | 2743 | 1551 | 1777 | 61.6% | 64.8% | |
| Scenario2 | With | 2517 | 2954 | 832 | 1269 | 33.0% | 42.9% |
| Without | 2517 | 2924 | 1065 | 1472 | 42.3% | 50.3% | |
| Scenario3 | With | 2517 | 3143 | 480 | 1105 | 19.1% | 35.2% |
| Without | 2517 | 3086 | 571 | 1140 | 22.7% | 36.9% |
Disclaimer/Publisher’s Note: The statements, opinions and data contained in all publications are solely those of the individual author(s) and contributor(s) and not of MDPI and/or the editor(s). MDPI and/or the editor(s) disclaim responsibility for any injury to people or property resulting from any ideas, methods, instructions or products referred to in the content. |
© 2023 by the authors. Licensee MDPI, Basel, Switzerland. This article is an open access article distributed under the terms and conditions of the Creative Commons Attribution (CC BY) license (https://creativecommons.org/licenses/by/4.0/).
Share and Cite
Sagawa, D.; Tanaka, K.; Ishida, F.; Saito, H.; Takenaga, N.; Saegusa, K. P2P Electricity Trading Considering User Preferences for Renewable Energy and Demand-Side Shifts. Energies 2023, 16, 3525. https://doi.org/10.3390/en16083525
Sagawa D, Tanaka K, Ishida F, Saito H, Takenaga N, Saegusa K. P2P Electricity Trading Considering User Preferences for Renewable Energy and Demand-Side Shifts. Energies. 2023; 16(8):3525. https://doi.org/10.3390/en16083525
Chicago/Turabian StyleSagawa, Daishi, Kenji Tanaka, Fumiaki Ishida, Hideya Saito, Naoya Takenaga, and Kosuke Saegusa. 2023. "P2P Electricity Trading Considering User Preferences for Renewable Energy and Demand-Side Shifts" Energies 16, no. 8: 3525. https://doi.org/10.3390/en16083525
APA StyleSagawa, D., Tanaka, K., Ishida, F., Saito, H., Takenaga, N., & Saegusa, K. (2023). P2P Electricity Trading Considering User Preferences for Renewable Energy and Demand-Side Shifts. Energies, 16(8), 3525. https://doi.org/10.3390/en16083525