Article

Practical Approach to Underground Distribution Power Cable Fleet Management

by
Pranav Pattabi
1,
Ali Naderian Jahromi
1,*,
Shanon Lo
1,
Kurtis Martin-Sturmey
1 and
Nirvaan Bhagwandass
2
1
High-Voltage Department, METSCO Energy Solutions Inc., Toronto, ON L4K 5W1, Canada
2
Oakville Hydro, Oakville, ON L6L 6R6, Canada
*
Author to whom correspondence should be addressed.
Energies 2023, 16(8), 3526; https://doi.org/10.3390/en16083526
Submission received: 8 March 2023 / Revised: 10 April 2023 / Accepted: 12 April 2023 / Published: 19 April 2023
(This article belongs to the Topic High Voltage Engineering)

Abstract

:
With the growing requirements imposed by regulatory authorities, grid operators and power utilities firms are confronted with the challenging task of ensuring the reliability, safety, and resilience of distribution networks amid aging asset infrastructure and a lack of resources. Over the past 15 years, the health index (HI)-based analysis has become an increasingly popular asset management tool for several power utilities. This strongly focuses on HI-based analysis to consider not only factors such as the cable vintage, type, and operating conditions, but also maintenance testing data. In this regard, the best industry practices for cable maintenance testing, including VLF Tan-Delta, partial discharge (PD), and time domain reflectometry (TDR), are outlined. Moreover, online tests, such as infrared thermography, ultrasonic PD scan, and temperature monitoring, are discussed. This paper also summarizes the classic asset management strategies for underground (UG) distribution power cables. The paper offers a practical approach for cable fleet management based on authors’ experience dealing with distribution power utility cable management for North American power utilities firms in the past 10 years. The proposed approach ensures reliable cable management at the lowest total life cycle cost. The topic of fleet management for UG power cables considering various condition parameters and an overall risk assessment is outlined. The fleet management guideline of UG power cables covers both cables and their accessories, such as terminations and joints. The main contributions of the paper are to: (1) determine the key parameters and testing factors for condition assessment of cables; (2) offer a practical approach to cable management that is not only based on technical issues, but also considers risk and impact costs, such as financial impact, reliability impact, etc.; and (3) propose a methodology for translating the HI/calculated risks into GIS, making it possible to identify major degradation patterns for fleet assessment. Considering budget and resource limitations around testing UG cable installations, this paper aims to assist asset managers, engineers, and asset owners in developing an effective cable fleet management strategy.

1. Introduction

Most power utilities firms and industrial establishments have significant underground (UG) electric distribution systems, the majority of which are near the end of service life and operate under an unknown condition. The typical design life of an UG power cable (UGPC) is 30 to 40 years. However, they tend to be in service for more than 40 years. The overall cost of replacing service-aged UGPCs is extremely high. Consequently, asset owners require an asset management approach to manage the fleet of UGPC systems, including the cable, termination, splice (joint), cable grounding, and cable monitoring system.
Medium voltage (MV) UGPC construction, including components such as insulation, semicon, jacket, and barrier, has undergone significant changes over the past five decades, experiencing nine cable design generations, as shown in [1]. Improvements made to the overall cable construction have increased the life expectancy of UGPCs significantly.
However, based on the authors’ experience, since the 1970s several utilities have found it challenging to deal with complete cable replacements, resulting in high failure rates and significant customer interruptions. 
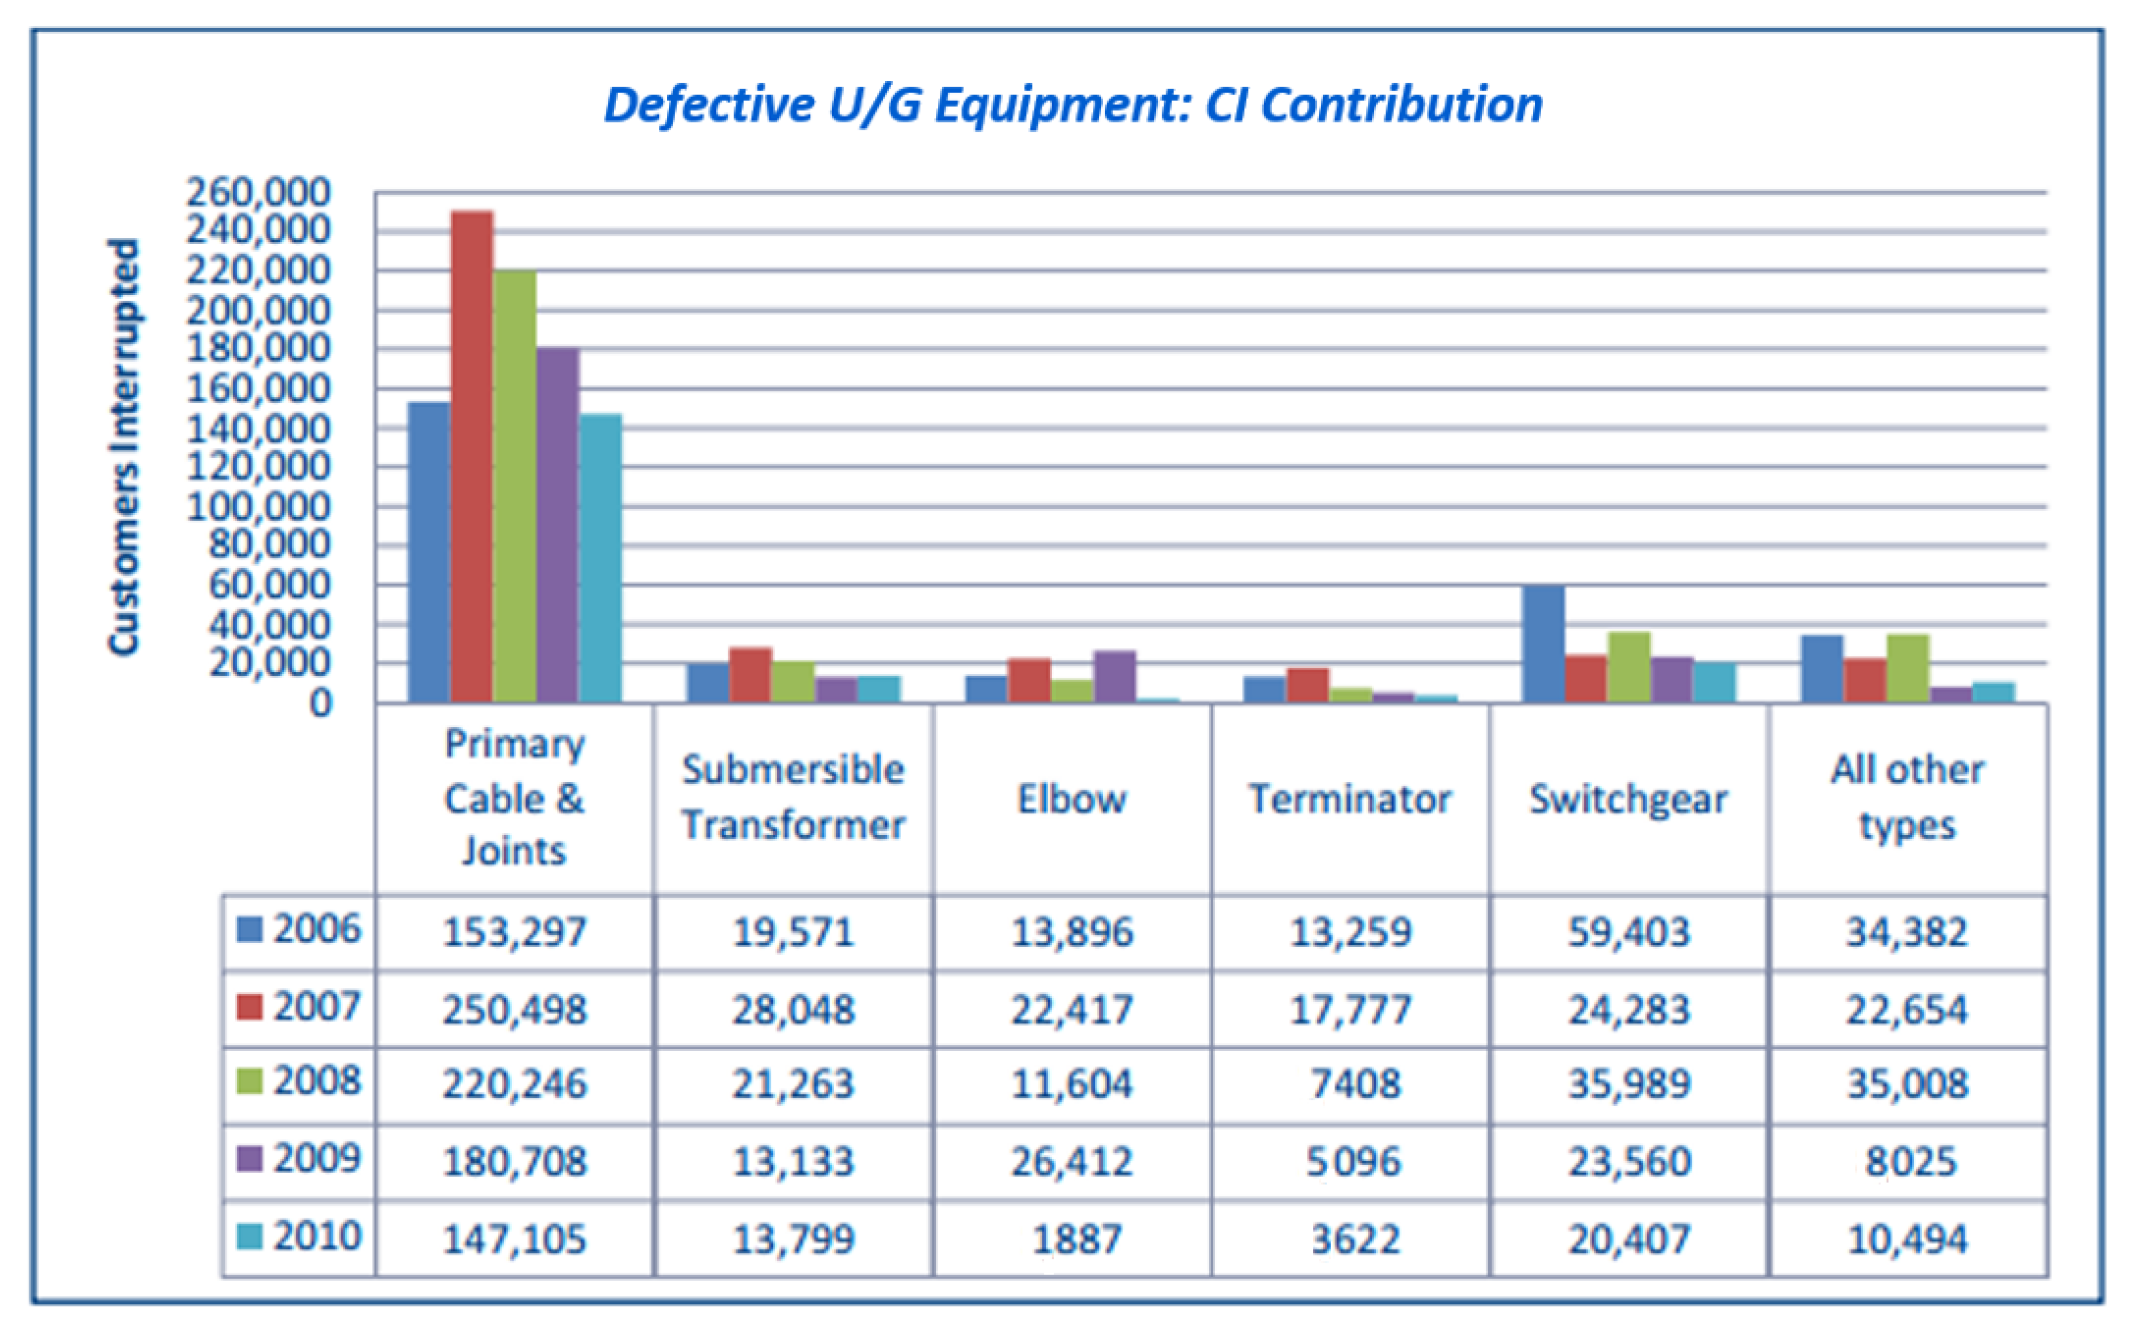
Figure 1 shows a study conducted by authors working for a Canadian power utility firm, which demonstrate the consequences of customer interruption due to no proactive maintenance management for primary cables and joints.
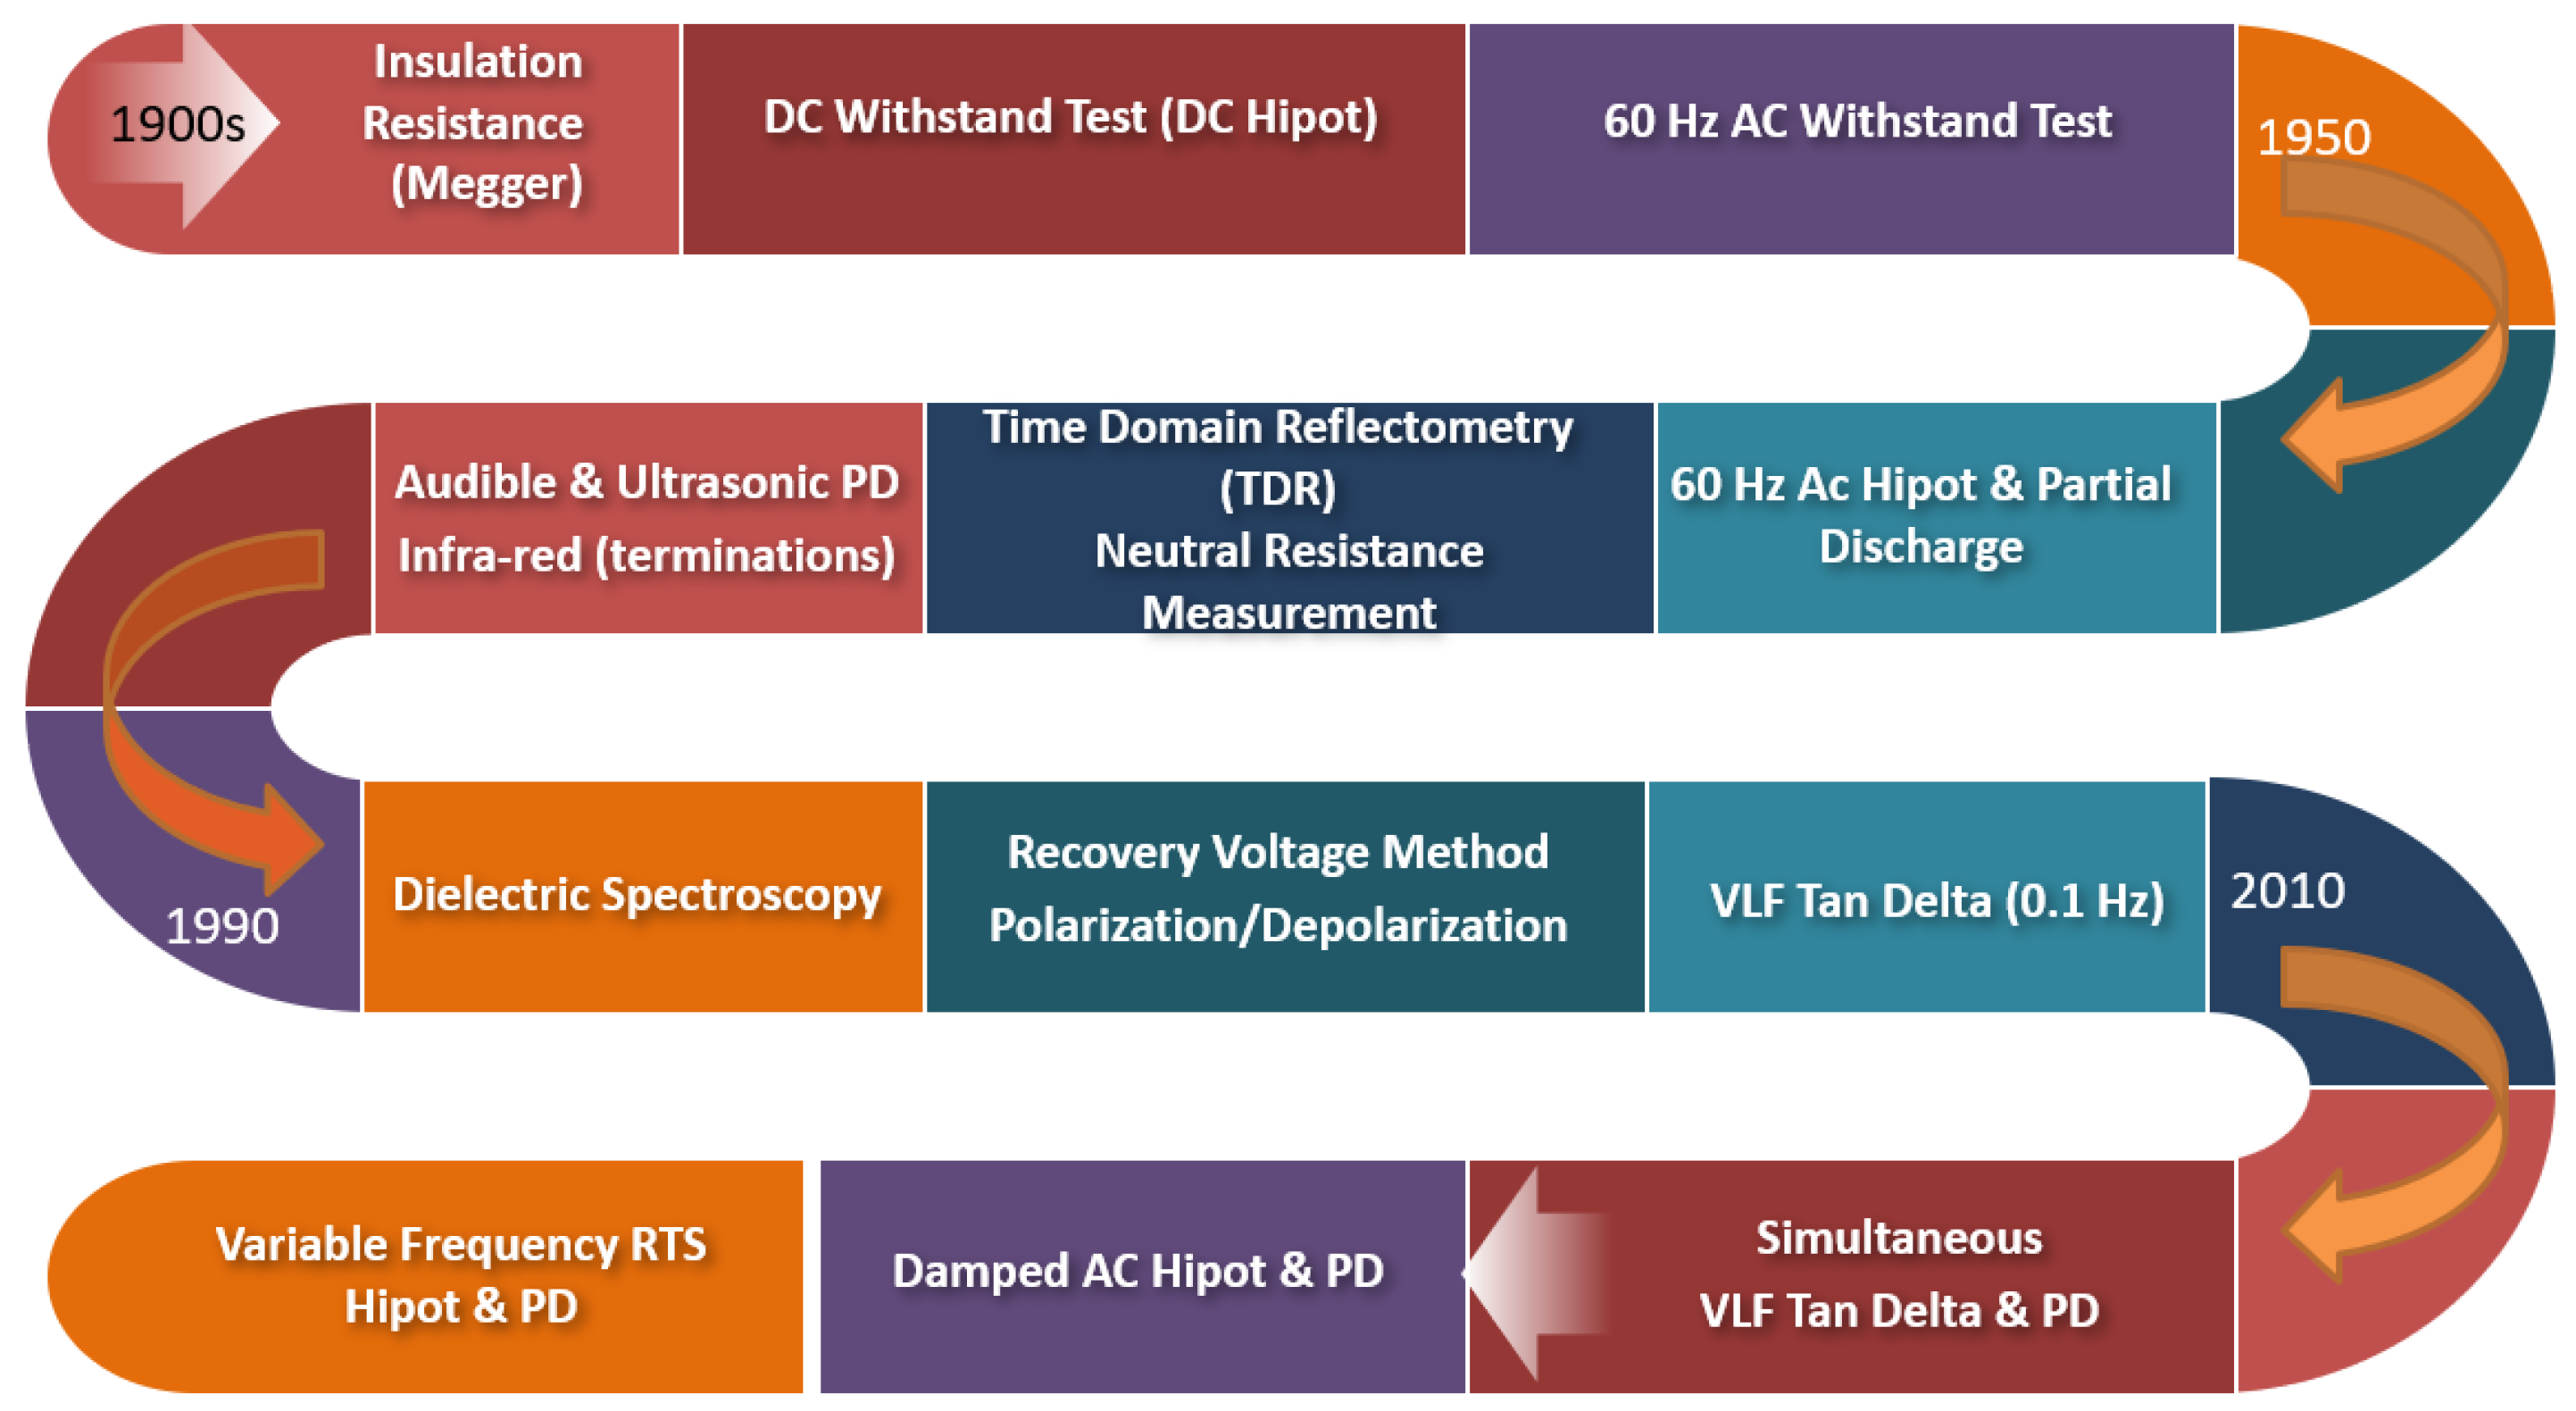
Currently, many in-service cables have also reached their end-of-life point, necessitating a cable fleet management program driven by diagnostic testing. UG cable testing has gone through a significant evolution since the early 1900s. Figure 2 shows the evolution of testing and diagnostics techniques specific to UGPCs, based on the field experience of the authors.
UGPC testing has evolved from basic Go/No-Go tests, such as insulation resistance, DC and AC, to withstand more advanced diagnostic tests, such as VLF Tan-delta, partial discharge (PD), time domain reflectometry (TDR), and variable frequency resonant test sets (RTS), for performing Hipot and PD.

2. Historical MV UGPC Asset Management Strategies

2.1. Run-to-Failure

Run-to-failure is a common asset management practice for asset owners and power utilities firms, specific to MV UGPCs. This strategy may be suitable for non-critical equipment, the failure of which has minimal impact and consequences. Cables that can easily be replaced upon breakdown or failure are candidates for a run-to-failure strategy. However, this is not recommended for all cables, especially those supporting critical loads or feeders.

2.2. Time-Based Asset Condition Assessment

Time-based ACA is based on time-based maintenance data collected on MV/high voltage (HV) power cables. Both basic and advanced tests can be performed under time-based ACA. Basic tests have a minimum value for UGPC condition assessment and are typically only performed during site acceptance testing (SAT). DC Hipot is a destructive test designed specifically for service aged XLPE/TRXLPE cables due to the increasing risk of trapped charges in the voids or enhanced electric tree growth within the cable insulation. Although DC Hipot is acceptable for oil-filled cables such as PILC, the authors recommend eliminating DC Hipot from MV cable maintenance testing to avoid any unnecessary confusion for the utility maintenance crew or contractors. Advanced ACA uses diagnostic tests that give deeper and more detailed information with respect to the condition of the power cables. The benefits of these advanced tests are that they can verify the integrity of cable components, identify types of possible defects, be used for trending, and meet other asset management objectives. ACA using advanced tests has become popular in the past 15 years and is covered in Section 3.

2.3. Condition-Based Asset Condition Assessment

Condition-based ACA (CBACA) has become more popular with some utilities firms in recent years and is used to perform preventive maintenance based on the present condition of UGPCs. Determination of the current condition of such assets is usually based on periodic measurements or monitoring. Due to the increased number of cable systems being installed, it is not possible to perform periodic time-based maintenance. Therefore, there is a growing perception that UGPC management should shift towards CBACA.

2.4. Health Indexing

One of the earlier publications outlining the application of HI to underground cables was accomplished by EDF over 230,000 km of the French distribution network involving UGPCs [2]. The HI analysis was based on four degradation mechanisms for cables (electrical aging, thermal aging, mechanical aging, and the aging of cable accessories). For each mode of degradation, aging law followed a Weibull distribution that allowed the evaluation of the extent of deterioration. Every mechanism was then weighted according to its importance and a linear weighted approach was used to calculate the final HI value [2].
One of the most extensive works in the US was conducted by NEETRAC by creating a knowledge-based study with regard to the asset management of the water tree aging mechanism of polymeric MV UGPCs [3]. This work emphasized the need to include other parameters for a comprehensive HI analysis; however, it did not include other practical parameters, such as loading, operating conditions, maintenance history, etc.
Recently, CIGRE WG B3 published a technical brochure that suggests that there is a direct link between the HI and the timescales for the transition from being sound to being the likely cause of an in-service failure [4]. This guide encourages asset managers to implement the HI methodology for different asset types and assist with asset maintenance and replacement planning.

3. Best Practices for UGPC Condition Assessment

The failure of a UGPC can be best represented through a bathtub curve, using the mathematical aspects outlined by Montanari et al. [5]. The three main sections of such a bathtub curve are infantile mortality, random failures, and aging.
With the uncertainty in predicting the condition of underground cable installations, cable diagnostic testing is critical to reducing premature failures (infantile morality section) and predicting the extent of degradation (aging section). Accordingly, commissioning testing, also known as SAT, serves as a quality control procedure to avoid unexpected early failures of new UGPCs, while maintenance testing helps detect the extent of degradation of in-service UGPC installations.
UGPC circuit components include the actual cable, terminations, joints (splices), and grounding. The cable itself has various components, such as the core conductor, conductor shield, insulation (TRXLPE, XLPE, or EPR), insulation shield, metallic shield, and jacket. Any condition assessment should consider all cable components.

3.1. Commissioning Testing

Between factory production and installation in the field, a UGPC experiences multiple stages of transportation and handling. This increases the likelihood of the introduction of a defect in such cable systems, especially those related to cable pulling and laying on-site and the installation of cable accessories (terminations and joints).
Industry data points to the fact that over half of cable system failures, such as poor workmanship or manufacturing issues, can be avoided through proper commissioning testing. Commissioning testing involves a series of tests conducted on-site prior to the energization of cable systems. A common best industry practice of commissioning testing typically involves three main tests to assess different components of a cable system: voltage withstand test, PD measurement, and metallic shield and jacket integrity test.

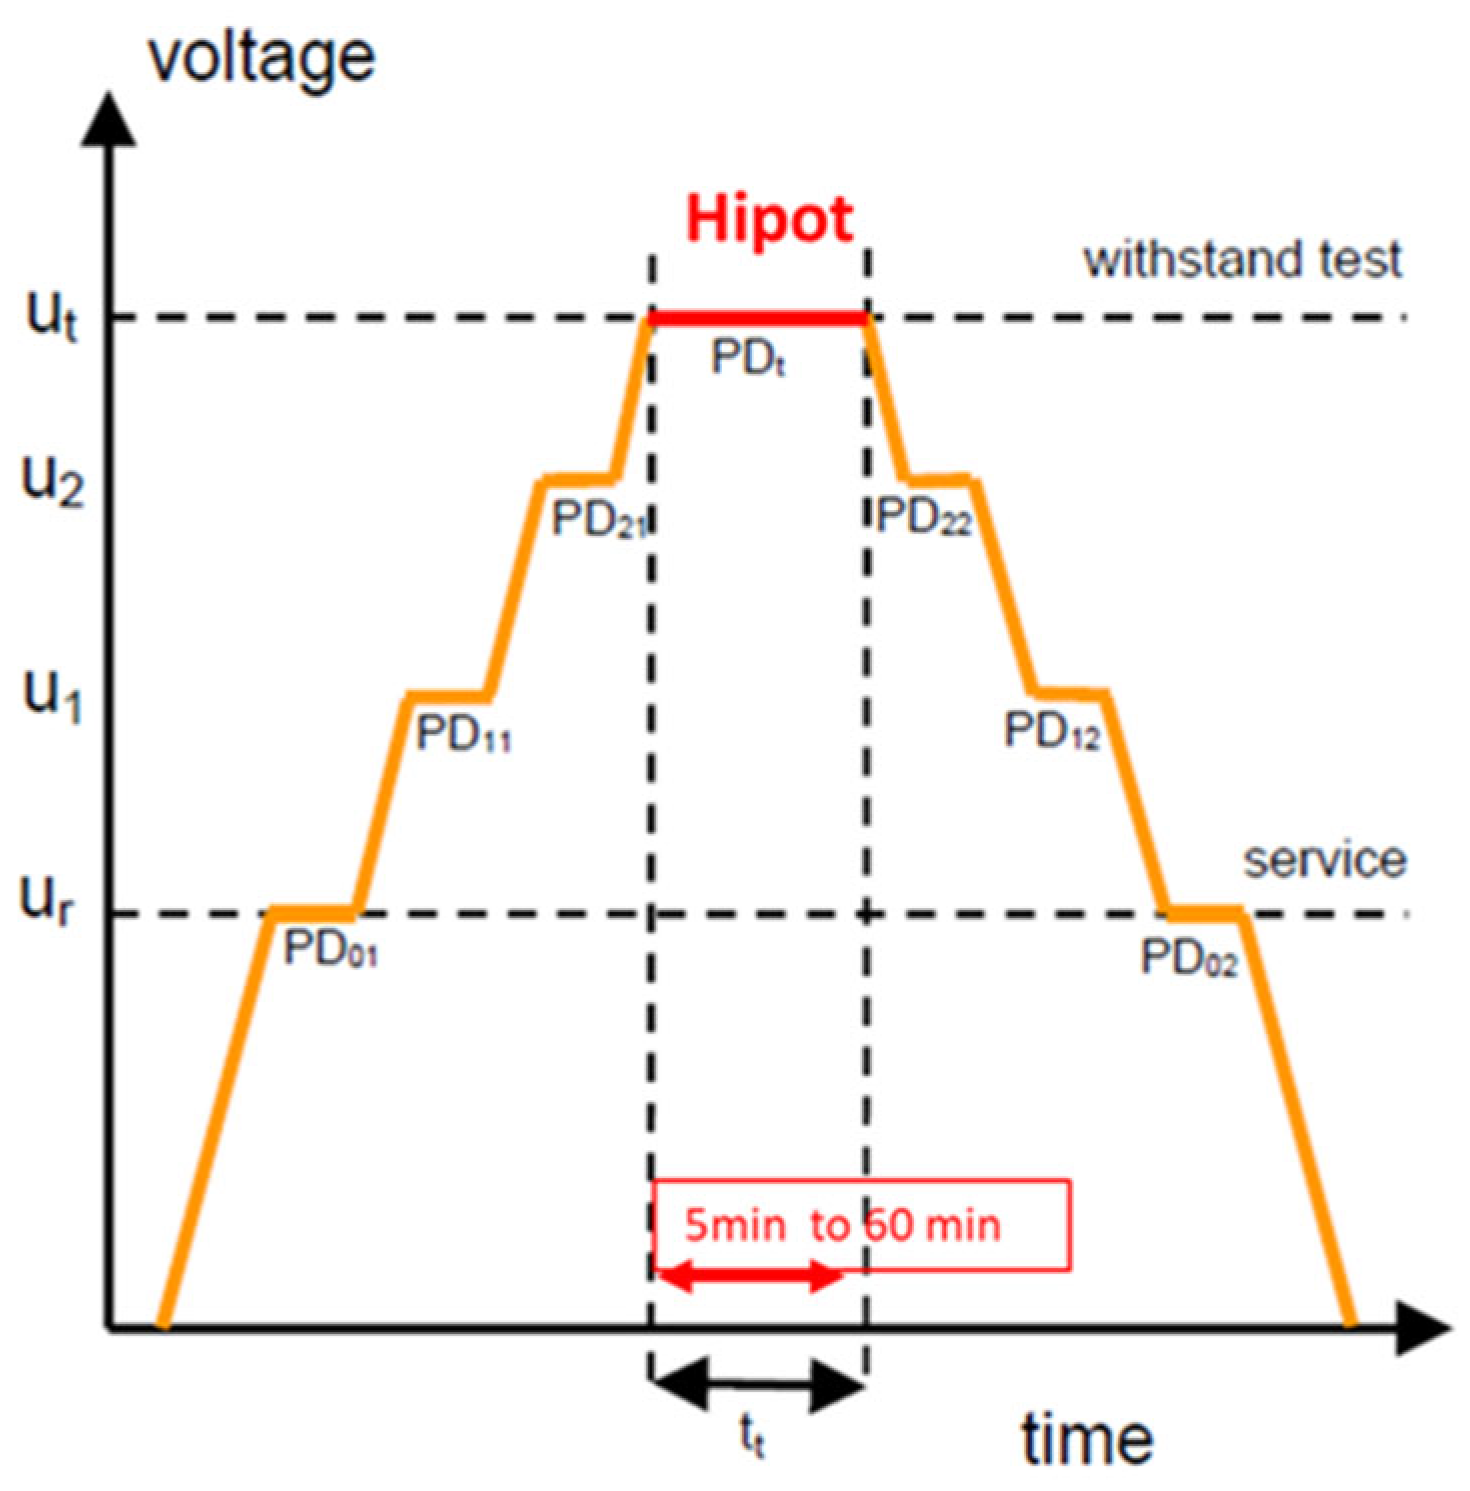
3.1.1. Voltage Withstand Test

Voltage withstand test, also known as a high-potential (Hipot) test, involves applying a voltage higher than the rated level for a defined duration to overstress the insulation to evaluate its integrity. The test is considered a “PASS” if no breakdown is observed at the completion of the defined test period. This test is well defined in the IEEE Std. 400. Various frequencies and waveshapes can be used to perform this test, with each having its merits and demerits [6].
The use of the power frequency (50/60 Hz) AC voltage to perform a voltage withstand test simulates the actual operating condition of an UGPC. However, there are practical limitations to testing longer cable lengths due to the size and capacity of such power supplies to supply the required cable charging current.
Given the challenge of using a power frequency AC voltage to test long cables, a modular variable frequency resonance test set (VFRTS) can be used. A VFRTS typically includes a fixed inductance module to strike a resonance with the cable under test, thereby reducing the input power requirement. The resonant frequency range typically lies between 20 Hz and 300 Hz and depends on the cable capacitance. Figure 3 shows a 70 kV VFRTS used by the authors for MV UGPC voltage withstand testing.
AC very low frequency (VLF) at 0.1 Hz/lower or damped AC (DAC) are more convenient options when testing as power frequency is not necessarily required. This is primarily because they allow for modular test sets and can typically be applied for non-critical installations or locations with access issues. However, VLF withstand testing results in longer test times because of the low-frequency test range. On the other hand, the short-duration excitation and decaying nature of the DAC cause varied breakdown field strengths as compared to continuous AC application [7].

3.1.2. Partial Discharge Measurement

A PD measurement helps identify and localize defects within insulation systems, both in cables and accessories. These defect types, such as voids, contaminants, surface impurities, or imperfections, become weak spots that can lead to the breakdown of cable systems.
During commissioning, a PD measurement system can be set up in parallel to a voltage withstand test, as depicted in Figure 4. During a PD measurement, various PD characteristics that help to determine the type and the severity of the PD sources must be recorded and reported: PD inception voltage (PDIV), PD extinction voltage (PDEV), PD magnitude, phase-resolved PD (PRPD) pattern, and localization of the PD source (if a PD defect is found).
The IEEE Std 400.3 [9] is the industry guide for PD measurement in power cables. Due to the sophistication of this test procedure and the differences between lab and field conditions (specific to background noise), there is no generic guidance on the interpretation of test results. The latest revision of the IEEE Std, 400.3 has provided a dance, based on PDIV and PDEV values.

3.1.3. Metallic Shield & Jacket Integrity Test

The cable metallic shield must have continuity and low resistance. For longer cables with splices, the low-ohm resistance test is conducted on individual sections. Poor workmanship is a significant failure mode in cable systems. Jacket imperfections and cuts during cable pulling and installation can introduce defects in the jacket, resulting in moisture ingress and premature failures. A jacket integrity test involves the insulation resistance measurement of the jacket with respect to the ground. A defined DC voltage is applied and held for a fixed duration (e.g., 1 min). Moreover, temperature correction for the measured insulation resistance value needs to be performed. The NETA ATS [10] provides adequate guidance for selecting the relevant test voltage and the expected threshold for the corresponding jacket insulation resistance value recorded.
Unlike HV cables, MV cable jackets do not have conductive paint and, therefore, the jacket integrity test result is only limited to a very small portion of the cable close to the terminations, which reduces the efficiency of this test.

3.2. Maintenance Testing

The proper condition assessment of service-aged cable systems is important for fleet management of underground cable installations. Diagnostic testing, performed as a maintenance procedure, provides the means to accurately determine the condition of in-service UGPCs and detect the type and extent of aging or degradation mechanisms involved. The best practice for cable maintenance testing includes performing a VLF tan-delta (TD) test, PD measurement, and time-domain reflectometry (TDR). Contrary to certain beliefs in the industry, these maintenance tests are non-destructive as the maximum applied test voltage is always within the cable-rated voltage.

3.2.1. VLF Tan-Delta Test

The VLF TD test is a popular offline diagnostic test that is used to estimate the amount of loss in a cable system based on the measurement of tan δ, which assesses the level of global insulation aging. This test is typically performed at three voltage steps up to 1.5 times the system phase-to-ground voltage (U0) at 0.1 Hz. The IEEE Std. 400.2 is the industry guide for testing shielded power cables at lower frequencies. This guide provides the condition assessment criteria for interpreting VLF TD results based on three diagnostic parameters: mean TD (at U0), differential TD (between 1.5 U0 and 0.5 U0), and TD stability (at U0) [11].

3.2.2. Partial Discharge Measurement

Similar to performing PD measurement as a commissioning test, it can also be used for relevant condition assessment of service-aged UGPCs to localize defects in the cable insulation or accessories. The key PD factors that should be considered during PD test are: PD magnitude (pC), PD inception voltage (PDIV), PD extinction voltage (PDEV), and the phase-resolved pattern (PRPD) [12]. The identification of the relevant PD defect type, based on the PD diagnostic parameters and subsequent localization of the PD source, is valuable from a condition assessment perspective. Through relevant PD localization and establishment of the PD severity level, cost-effective remediation or intervention strategies can be planned, alongside the recommended timeline for implementation, e.g., replacement of a cable elbow or splice as opposed to the entire cable system. Three critical elements for any PD test are: 1—Magnetude (pC or mV), 2—defect type confirmed by PRPD, 3—PDEV. Figure 5 shows a 3-D illustration of PD severity based on these 3 factors.
The IEEE Std. 400.3 is the industry guide for PD measurement as a maintenance test procedure. This guide was recently revised to include the latest interpretation of PD test results [9].
PD measurement as a maintenance test can be performed either offline or online. Offline PD measurement requires switching and cable isolation but is more sensitive and informative than an online evaluation. Online PD measurement involves either an ultrasonic scanning of the cable terminations/elbows or temporary/permanent PD monitoring, which occurs through the installation of high-frequency current transformers (HFCTs) around the concentric neutral.
Simultaneous VLF Tan-Delta and PD measurement performed by the authors, as shown in Figure 6, is a common practice for the onsite maintenance testing of UGPCs.

3.2.3. Time-Domain Reflectometry

TDR is a useful diagnostic procedure for determining/verifying the overall cable length, locating the presence of splices, and identifying any signs of water ingress/neutral corrosion in the concentric neutral of the cable. TDR is conducted offline by injecting a pulse with a fast rise time, observing the nature of the reflected pulse, and looking for any specific impedance changes. Each unique TDR trace or reflection represents the corresponding defect or cable system characteristic. The IEEE Std. 1617 is the industry guide for TDR and suggests comparing the size of reflection due to corrosion to joint reflection and end-of-cable reflection to assess the condition of the concentric neutral [13]. The NEETRAC guide on TDR measurement provides a detailed practical best practice of TDR measurement on power cables to determine the neutral corrosion and other modes of failure [14].

4. Asset Management of UGPCs

4.1. Aged-Based Asset Management

A common misconception among power cable owners is that all cables age uniformly and the calendar age is a good indicator of cable system health. This belief is not true as many cables undergo premature aging depending on the underlying failure mode or deficiency in the field (primarily due to workmanship issues); cables may also see less stress during their operation, leading to a longer life. Figure 7 shows the relationship between HI and age for 100 individual MV polymeric cable segments tested by the authors across different parts of Canada. The plot indicates that cable age is not equal to its actual condition.
Another pilot study was performed by the authors working for a major utility, where 13 km of MV XLPE/TRXLPE cables were tested as a part of an annual cable testing program. Based on the condition assessment performed, approximately half of the tested cable population exhibited varying degrees of at least two defects (between PD, insulation aging, and neutral corrosion). Another key observation from this study was that age is not a true indicator of cable condition, necessitating proper cable test diagnostics, as shown in Figure 8.
Existing technical publications by key organizations, such as NEETRAC, IEEE, and EPRI, have used water tree aging as a major indicator for the prediction of the remaining life of MV cables [3,11,15,16]. However, many other practical aspects of an overall cable system must be incorporated into an end-of-life assessment.
Some background on the various useful cable diagnostic tests, such as PD and related maintenance strategies, has been discussed by Jahromi [17]. It is practically impossible to test all the cables for some of the larger power utilities firms with extensive underground cable infrastructure. Hence, there is an existing industry gap on how proactive maintenance can help improve the asset management practice of an entire MV cable fleet.

4.2. Health Indexing

Health indexing is the first step in the condition assessment process of electrical assets such as UGPCs. An HI is a numerical score between 0% and 100%, which reflects the relative condition of an asset starting at 100% and degrading toward 0% over its service life [18]. The HI is composed of condition parameters that can be expected to contribute to the degradation and eventual failure of the asset, typically tied to specific failure modes. A weight is assigned to each condition parameter to indicate the amount of influence the condition has on the overall health of the asset. One of the simplest approaches to HI calculation is the linear weighted average. Using the weighted average technique, the HI is finally calculated as the weighted sum of the numerical scores associated with the condition indicators. The HI is calculated as the weighted sum of the numerical scores associated with the condition indicators [2,4,18,19]:
HI = ( i = 1 N S i W i   i = 1 N 4 W i )
where, N is the total number of condition parameters, i is the condition parameter number, Si is the condition score of condition parameter i, and Wi is the weight of condition parameter i.
Based on the resulting HI value, relevant intervention strategies can be planned for a fleet of UGPCs, as shown in Table 1.
Typical condition parameters to consider when performing the health indexing of UGPCs include service age, historical failure records, visual inspection of cable accessories, peak/average loading history, VLF Tan-Delta test result, PD measurement result, and TDR test result.
One of the limitations of the linear weighted average HI method is that the overall HI score may mask a significant defect or failure mode. Another option is to use the “worst case” scoring technique. The scoring system should also differentiate between repairable components such as terminations. The quality of test data can also be a limitation for an accurate UGPC fleet assessment.

4.3. Age Assessment and Failure Probability

For a UGPC, failure probability is the likelihood of a fault or other events occurring that might result in the repair or replacement of the cable system. The probability that a failure will occur at a certain point in time is highlighted by means of a failure curve [20]. In addition to age-based failure probability, condition-based failure probability curves can be developed, given adequate HI results. The typical age-based failure probability curve can be adjusted to more accurately model the probability of failure in service-aged cables by making use of the effective age of the cable segment. The effective age can be directly related to the accelerated age, resulting in a true condition-based failure probability curve. Based on several utility case studies conducted by the authors, condition-based assessments driven by cable testing can help reduce the failure probability of service-aged UGPCs (above ten years), as shown in Figure 9, through the implementation of proactive intervention strategies, given the fact that proper commissioning testing takes care of the first section of the bathtub curve (up to the first ten years).
The Weibull distribution method is used in analyzing failure rates, forecasting failure, and modeling failure and fault processes stemming from aging. The two-parameter Weibull distribution is characterized by the shape (β) and scale (η) parameters. The scale parameter is associated with the typical useful life (TUL) of the UGPC, while the shape parameter is associated with the flatness of the curve. For power cables, the TUL tends to vary depending on various factors, including insulation type, burial type, and environmental conditions.
For each year, the probability density function (PDF) corresponds to the probability of a failure occurring in that year of the cable segment’s life. Other statistical functions, such as cumulative distribution function (CDF) and hazard rate, can also be used to describe the probabilistic failure of an UGPC. CDF describes the probability that the UGPC has failed by a specific age. The hazard rate describes the probability that the UGPC will fail in the following year given its current age.
Knowledge of degradation mechanisms or failure modes increases the accuracy of consequence cost determination as this provides detailed information into the effects of the identified degradation mechanisms and relative probabilities of each occurring. In determining the types of deterioration for UGPCs, the following failure modes should be considered: electrical, thermal, mechanical, and chemical, as well as the root cause of each failure mode [21].

4.4. Risk Analysis

The impact of an UGPC failure is a key component of the asset risk framework. Two UGPCs in the same condition may have very different failure consequences. The cable system whose failure has a higher impact may require greater attention due to its higher criticality. The impact of the failure of power cables can be classified as health and safety, reliability, environmental, and financial costs.
The process of profiling the risk for each cable segment incorporates the UGPC condition information, health index values, calibrated failure curves, failure modes, and impacts of failure. The overall risk carried by an UGPC is the product of the current failure probability and the impact of failure. Failure probabilities are calculated using condition information, health index values, and calibrated failure curves. Likewise, impacts of failure are developed using specific failure modes for power cables. The impact of failure can be either qualified as an impact score or quantified into a monetary value. Using a qualification approach such as a risk matrix results in a mostly subjective approach to risk evaluation, whereas quantifying the impacts on a monetary basis or consequence costs allows for direct comparison between costs and benefits [19]. There is also a level of estimation associated with the determination of monetary values associated with risks.
The risk cost is calculated by first calculating the consequence cost for all failure modes. These are then summed by category to find the total reliability impact, financial impact, environmental damage impact, and safety impact costs. Each impact cost is then multiplied by the failure probability to identify risk costs, which are summed to find the total risk cost.
Risk Cost = Failure Probability × Total Impact Cost
where,
Total Impact Cost = Reliability Impact + Financial Impact +
Environmental Damage Impact + Safety Impact Cost
A high-risk cost can result from a high failure probability even if the cable segment is otherwise in good condition. This is due to failure probability being driven by both HI and age. Either of these factors could lead to a higher risk cost associated with the power cable. The result should be a complete risk profile, including reliability, financial, environmental, and safety risk costs, as shown in Figure 10 and developed by the authors.

5. Recommended Best Practice of UGPC Fleet Management

The latest industry practice for UGPC fleet management is based on developing a risked-based work frame (Section 4.4), which considers the total impact cost and risk cost (Section 4.4). The probability of failure used to calculate the risk is HI condition-based, not aged-based (Section 4.3). A typical HI formulation used by several Canadian power utilities firms is shown in Table 2.
HI % = ( i = 1 8 S i W i   i = 1 8 4 W i ) = i = 1 8 S i W i 72 × 100
The HI for each asset is used to calculate failure probability based on available industry data. The failure probability is then compared to the hazard rates on the Weibull curves presented in Figure 11 to find the condition-suggested age, which is known as effective age. The hazard rate is the probability that the asset will fail in the following year, given the current age of the cable. From this, the asset age is adjusted to find the effective age. Failure probability distribution depends on cable insulation, cable construction, operating and environment condition, loading, and maintenance practices. An example of difference between XLPE and TRXLPE PDF is shown in Figure 12.
An effective asset management program requires accurate asset data. The degree of accuracy and the extent of such data varies widely across the industry [22]. Data availability represents the single most important element that can influence the degree to which AM decision making relies on objective factors. Asset owners often either do not have readily available data or the data format is not suitable for ACA analysis.
Following a comprehensive HI analysis, the risk is calculated for each cable segment by incorporating the UGPC HI values, failure curves, failure modes, and impacts of failure described in Section 4.4. Figure 13 provides a summary of risked-based best practices for UGPC fleet management.
The steps toward the proposed fleet management methodology are:
  • Based on Table 2 parameters, collect the data and verify the data quality, validity, and accuracy;
  • Calculate HI (see Table 2) and determine the condition of cable. If required, apply the intervention recommendation given in Table 1;
  • It is recommended that each utility establishes its own PF% curves for different types of cables. In the absence of available data, a generic formulation based on thousands of data points collected in the past several years in Canada and USA can be used: PF % = 84 e 0.58 HI % ;
  • Calculate the impact costs: Total Impact Cost = Reliability Impact + Financial Impact + Environmental Damage Impact + Safety Impact Cost;
  • Calculate the risk cost. Risk Cost = PF% × Total Impact Cost;
  • Prioritize replacement based on the risk cost for the UGPC Fleet.
To build out a cable testing and condition assessment program, a pilot study is recommended to pick out unique service-aged cable segments from different regions of service of a utility or targeted locations of a commercial & industrial (C&I) establishment. Based on the results of the pilot study, an annual testing program can be put in place to test a mix of cables of different constructions, voltage classes, insulations (XLPE, TR-XLPE, EPR, PILC), vintages, rejuvenation conditions (injected versus non-injected), loading dimensions, and geographic locations. On top of offline cable testing, the cable termination and joint (splice) can be evaluated for any inherent hotspots or thermal anomalies using online infrared thermography. Major cable testing options (specifically for utilities firms) include:
  • Purchasing test equipment and using a third-party expert to train their field crew to perform field testing and assist with the interpretation of test results;
  • Involving a third-party expert to perform field testing and provide a relevant condition assessment.
The results from field testing can be fed into an asset management framework for relevant condition assessment and to decide on an intervention strategy based on a risk-based analysis. The environmental/cable laying conditions play a critical role in influencing the degradation mechanisms/factors affecting an UGPC in the field. With the advent of the Geographic Information System (GIS), the actual condition of UGPCs can be visually tracked to choose relevant cable segments for future editions of the annual testing program.
Based on the field test results updated in GIS, it is also important to identify the major degradation patterns (e.g., global cable insulation aging, PD, neutral corrosion, etc.) observed in the various regions tested and the corresponding condition of the cable segments. It is useful to correlate different geographic regions to the corresponding UGPC aging mechanisms to better inform future iterations of cable testing and condition assessment, trending of test results, developing specifications, and deciding on replacing a given cable segment.
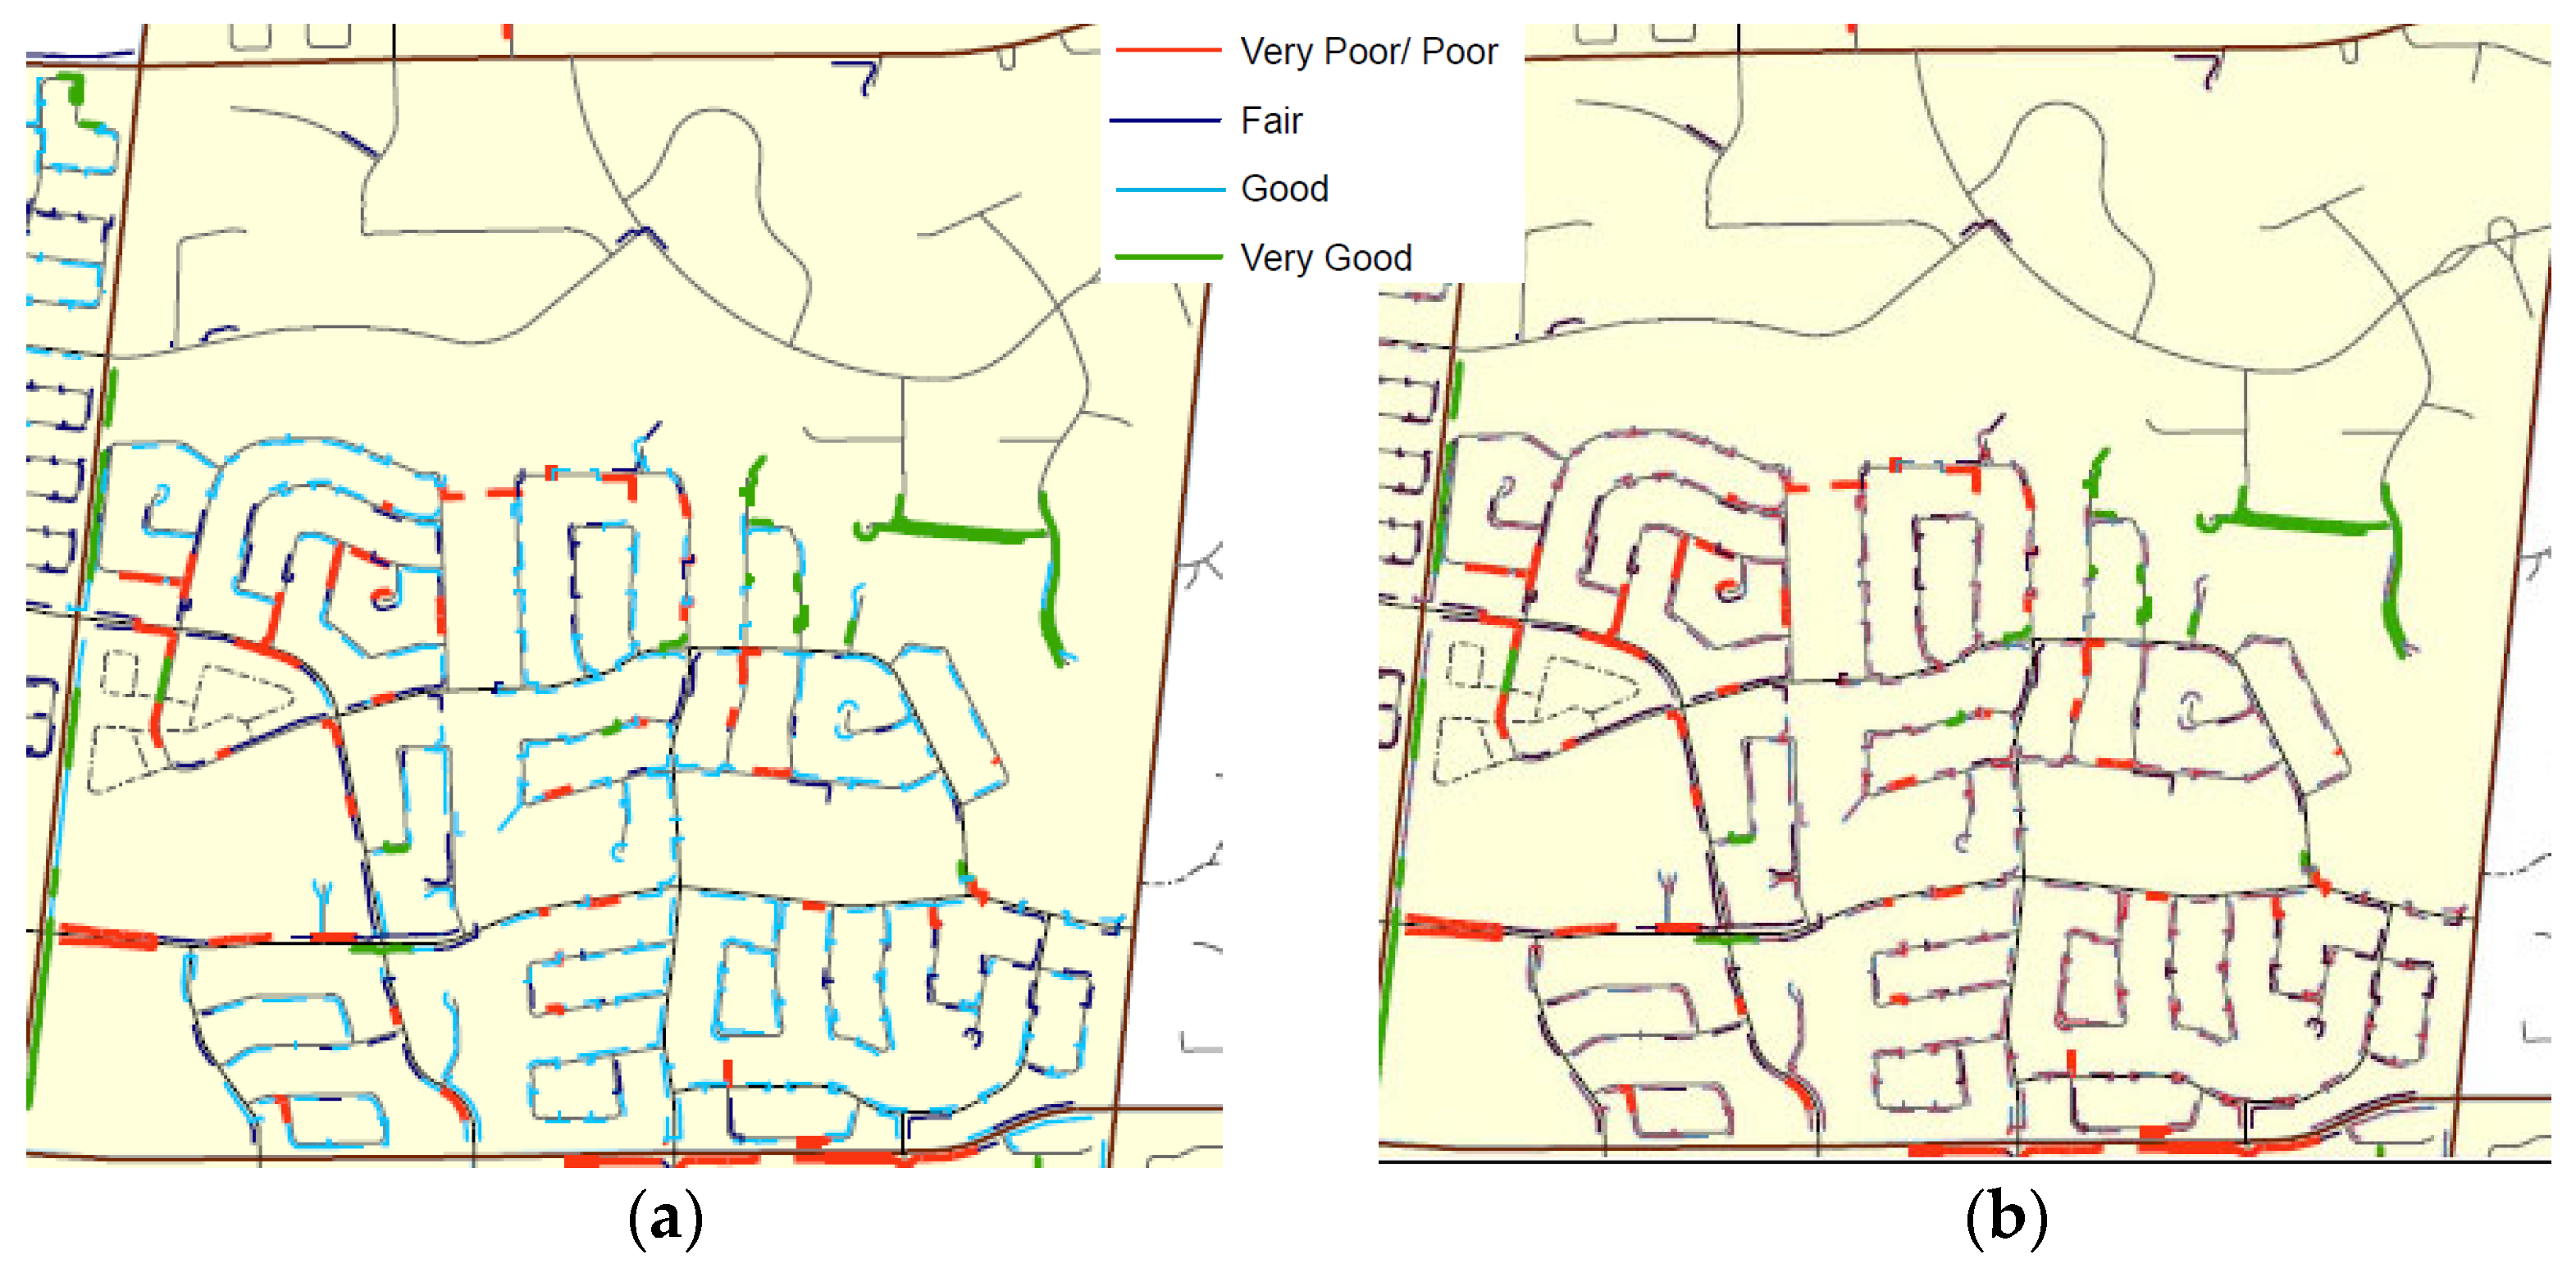
An example of GIS mapping showing the condition of a region of UGPCs (28 kV, TRXLPE/XLPE, 2/0, Al, direct buried, jacketed type) based on an age-based assessment and a condition-based assessment through testing, conducted by the authors, is illustrated in Figure 14. A proper condition-based assessment, facilitated by advanced diagnostic testing, reveals the actual condition of the various cable segments, thereby supporting relevant intervention strategies for managing different cable segments of the same vintage. Such a visual map also helps with identifying region-based degradation patterns and performing relevant condition assessments.
With data from a few years of testing, utilities firms could use data science to identify sample populations to represent the entire fleet of UGPCs. Once these sample populations are tested, these results can be incorporated into a HI framework and extrapolated to the remaining fleet.
This way, utilities firms could test a fraction of their overall underground cable population and still find valuable information to decide on the relevant intervention strategy for the remaining in-service cable infrastructure. Based on the experience of the authors in testing cables for more than 30 power utilities firms, the minimum size of the sample population varies between 20% to 30% of the total cable circuit length. For a utility with 1000 km of in-service MV UGPCs, considering a 25% sample population, it is required to test 250 km of cables. If the utilities firm can test 50 km of cables a year, it will take five years to fulfill the minimum sample population size, enabling the firm to have a more precise model for their HI framework and extrapolate results to the remaining fleet at the end of year five.
The remediations for geographic regions with issues such as global insulation aging and neutral corrosion in UGPCs include the choice of better cable insulation, such as a TRXLPE type, and ensuring a durable outer jacket, such as a polyethylene type, once these cables are replaced. Improving the cable laying conditions, such as the building of duct banks, is recommended for critical cable runs. Having a proper commissioning testing program helps avoid all three major degradation issues (accelerated insulation aging/water treeing, neutral corrosion, and PD) and ensures that the cable system can perform reliably up to the end of its typical useful life. A risk-based condition assessment is useful to prioritize the relevant cables for replacement and ensures a levelized capital expenditure profile.
Another new approach to cable fleet management is testing retired cables before scrapping them out. Reels of extracted cable segments can be evaluated using VLF Tan-Delta, PD measurement, and TDR test procedures to identify degradation patterns based on factors such as geographic location, cable insulation type, voltage rating, vintage, etc. Moreover, a sufficient length of these cable reels can be subject to an evaluation in the laboratory by performing limited HV breakdown testing, cable wafering, dyeing, and microscopic examination. The outcome of such an assessment can be used to perform targeted testing in the field and better inform future iterations of cable specifications, procurement, and management.

6. Conclusions

UGPCs are one of the most complex assets to manage due to the lack of possibility of a comprehensive visual inspection, their cost-intensive nature, and the high probability of unexpected failures that disrupt electric power delivery. Based on the field test data, it can be seen that:
  • Calendar age is not a true indicator of cable condition, necessitating proper cable test diagnostics;
  • The weighted average HI method is the most common HI technique used as the condition indicator of MV UGPC fleet;
  • The best industry practice is to use HI analysis to calculate the risk for each cable segment by incorporating the UGPC HI values, failure curves, failure modes, and impacts of failure;
  • By translating the field test results and calculated risks into GIS, it is possible to identify major degradation patterns (e.g., water tree insulation aging, PD, neutral corrosion, etc.) in various geographical regions.
Cable populations installed at the same time can result in “asset replacement walls”, where these same populations exceed their useful lives at the same time. To better manage these “walls”, this paper outlined guidelines for fleetwide management of UGPCs by applying a combination of on-site diagnostic test procedures and analytics to better prioritize and plan the relevant intervention strategy:
  • In-field testing provides localized condition analytics for individual cable segments;
  • Apart from planning the right cable segments for replacement, lower-cost interventions could also be the outcome, such as the replacement of cable accessories;
  • Cables shall be prioritized based on the actual condition and risk.
Within utilities, there are several models for developing a cable testing and condition assessment program by engaging third-party experts to the extent needed. An annualized and targeted testing initiative can help identify bad actors within a cable fleet. Such a program also helps identify region-wide modes of cable system degradation that can be translated to the remaining fleet for relevant condition assessment and planning intervention options.

Author Contributions

Methodology, P.P. and A.N.J.; Formal analysis, S.L.; Resources, K.M.-S. and N.B. All authors have read and agreed to the published version of the manuscript.

Funding

This research received no external funding.

Data Availability Statement

Data is unavailable due to privacy restrictions.

Conflicts of Interest

The authors declare no conflict of interest.

References

  1. Jahromi, A.N.; Pattabi, P.; Lo, S. Advanced Diagnostic Testing of Medium Voltage Utility Cable Systems. In Proceedings of the CIGRE Canada Conference & Expo, Toronto, BC, Canada, 25–28 September 2023. [Google Scholar]
  2. Puluhen, B.; Dorison, E.; Murin, V.; Tambrun, R. Health Index: A Technical Indicator of Underground Network Reliability. In Proceedings of the 21st International Conference on Electricity Distribution (CIRED), Frankfurt, Germany, 6–9 June 2011. [Google Scholar]
  3. Hampton, N.; Perkel, J.; Williams, D. Asset Management of MV Cables using Data Driven Health Indices for Water Treeing. In Proceedings of the International Conference on Insulated Power Cables (Jicable), Paris, France, 23–27 June 2019. [Google Scholar]
  4. Asset Health Indices for Equipment in Existing Substations. In CIGRE Technical Brochure 858; CTC Global: Irvine, CA, USA, 2011.
  5. Montanari, G.C.; Seri, P.; Ghosh, R.; Bononi, S.F.; Albertini, M. Testing cable system reliability after commissioning and during operation life. High Volt. 2021, 6, 34–41. [Google Scholar] [CrossRef]
  6. IEEE Std 400; 400-2012-IEEE Guide for Field Testing and Evaluation of the Insulation of Shielded Power Cable Systems Rated 5 kV and Above. IEEE: New York, NY, USA, 2012.
  7. Jahromi, N.; Pattabi, P.K.; Lo, S.; Densley, J. Comparison of Different Voltage Waveforms for Partial Discharge Measurement in Medium Voltage Cables and Accessories. In Proceedings of the 2022 IEEE Electrical Insulation Conference (EIC), Knoxville, TN, USA, 19–23 June 2022. [Google Scholar]
  8. Naderian, A.; Pattabi, P.; Jamali, B.; Densley, J.; Lamarre, L. Advanced Cable Diagnostic Test Techniques for XLPE, HPFF and LPFF Cable Systems; CEATI: Montreal, QC, Canada, 2022. [Google Scholar]
  9. IEEE 400.3; 400.3, IEEE Guide for Partial Discharge Testing of Shielded Power Cable Systems in a Field Environment. IEEE: New York, NY, USA, 2022.
  10. ANSI/NETA ATS-2009; Standard for Acceptance Testing Specifications for Electrical Power Equipment and Systems. NETA ATS: Portage, MI, USA, 2021.
  11. IEEE 400.2; IEEE Guide for Field Testing of Shielded Power Cable Systems Using VLF (less than 1 Hz). IEEE: New York, NY, USA, 2013.
  12. Jahromi, N. Review of Field Acceptance Hipot & PD Testing of Medium Voltage Underground Cables. In Proceedings of the Electrical Insulation Conference (EIC), Baltimore, MD, USA, 11–14 June 2017. [Google Scholar]
  13. IEEE 1617; IEEE Guide for Detection, Mitigation, and Control of Concentric Neutral Corrosion in Medium-Voltage Underground Cables. IEEE: New York, NY, USA, 2007.
  14. Mejia, J.C.H. NEETRAC Cable Diagnostic Focused Initiative—Chapter 5-TDR. 1 February 2016. Available online: https://www.neetrac.gatech.edu/publications/CDFI/5-TDR_17_with-Copyright.pdf (accessed on 8 March 2023).
  15. Mejia, J.C.H. Cabe Diagnostics Focused Initiative (CDFI)—Chapter 6-Dissipation Factor. 1 February 2016. Available online: https://www.neetrac.gatech.edu/publications/CDFI/6-Tan-Delta-21_with-Copyright.pdf (accessed on 8 March 2023).
  16. EPRI. Cable Aging Management Program Implementation Guidance; EPRI: Palo Alto, CA, USA, 2011. [Google Scholar]
  17. Jahromi, N. Cable Diagnostics Trends. IEEE 2022, 36, 3–6. [Google Scholar]
  18. Hjartarson, T.; Otal, S. Predicting Future Asset Condition Based on Current Health Index and Maintenance Level. In Proceedings of the ESMO 2006–2006 IEEE 11th International Conference on Transmission & Distribution Construction, Operation and Live-Line Maintenance, Albuquerque, Mexico, 15–20 October 2006. [Google Scholar]
  19. Otal, R.; Bakulev, A. Risk-based asset management optimization. In Proceedings of the 2014 IEEE PES T&D Conference and Exposition, Chicago, IL, USA, 14–17 April 2014. [Google Scholar]
  20. Abernethy, R. The New Weibull Handbook Fifth Edition, Reliability and Statistical Analysis for Predicting Life, Safety, Supportability, Risk, Cost and Warranty Claims; Biblio, Inc.: Asheville, NC, USA, 2006. [Google Scholar]
  21. Jahromi, N.; Pattabi, P.K.; Lo, S.; Densley, J. Approaches to the forensic failure investigation of medium voltage polymeric cables. In Proceedings of the 2020 IEEE Electrical Insulation Conference (EIC), Knoxville, TN, USA, 22 June–3 July 2020. [Google Scholar]
  22. Matthew, O.; Hampton, R.N.; Perkel, J.; Weisenfeld, N. Notes from Underground Cable Fleet Management; IEEE: New York, NY, USA, 2010; pp. 75–84. [Google Scholar]
Figure 1. Significant customer interruptions for UG primary cables and joints observed for a Canadian power distribution utility firm without proactive maintenance.
Energies 16 03526 g001
Figure 2. Evolution of testing techniques for UGPCs.
Energies 16 03526 g002
Figure 3. Example of a 70 kV/10A VFRSTS including an isolation transformer, inverter, step-up transformer, HV reactor, and coupling capacitor and used as HV power supply for on-site tests.
Energies 16 03526 g003
Figure 4. A voltage withstand test sequence with PD measurement in parallel: Ur = U0, U1 = 1.25 U0; U2 = 1.5 U0, Ut = 1.7 U0 [8].
Energies 16 03526 g004
Figure 5. Illustration of PD severity based on PD magnitude (pC), PDEV, and type of defect (detected by PRPD).
Energies 16 03526 g005
Figure 6. Simultaneous VLF Tan-Delta and PD Measurement Setup.
Energies 16 03526 g006
Figure 7. Relationship between HI and cable age.
Energies 16 03526 g007
Figure 8. Sample distribution of defect types as a function of cable system age (25 kV, 750 MCM, Cu, TRXLPE/XLPE, direct buried, and jacketed).
Energies 16 03526 g008
Figure 9. Comparison of age-based and condition-based failure probability curves for UGPCs, considering the cable alone (XLPE, direct-buried, jacketed type).
Energies 16 03526 g009
Figure 10. Conceptual design of a risk profile for a population of MV UGPC.
Energies 16 03526 g010
Figure 11. Weibull curve of survival and hazard rates vs effective age.
Energies 16 03526 g011
Figure 12. PDF curves for TRXLPE cable direct-buried (TUL = 30 years) and installed in duct (TUL = 40 years).
Energies 16 03526 g012
Figure 13. Process guidelines for best practice of UGPC fleet management.
Energies 16 03526 g013
Figure 14. GIS mapping showing condition of a region of UGPCs (100 km, 28 kV, TRXLPE/XLPE, 2/0, Al, direct buried, and jacketed type) using (a) an age-based assessment and (b) a condition-based assessment through testing.
Energies 16 03526 g014
Table 1. Recommended intervention strategies for UGPCs, based on HI results.
Grading ClassHI (%)ConditionRecommended Intervention Strategy
A85–100Very good—Like newExpected performance as a new cable. Continue with normal maintenance
B70–85Good—Minor signs of agingA reliable operation is expected for a long
period. Continue with normal maintenance
C50–70Fair—Notable signs of aging or deterioration A reliable operation is expected. Consider CBM where applicable; possible remedial work or replacement is needed depending on the cable system’s criticality and the trend of test results
D30–50Poor—
Significant
deterioration
Start the planning process to replace or
rehabilitate the cable, considering the risk and consequences of failure
E0–30Very Poor—
Extreme
deterioration
Very high likelihood of failure. The cable has reached its end-of-life point; immediately assess the risk and replace based on the assessment
Table 2. Typical underground cable HI formulation.
Condition ParameterWeight
(Wi)
RankingNumerical Grade (Si)Max Score
Number of failures4A, B, C, D, E4, 3, 2, 1, 016
Splice count2A, B, C, D, E4, 3, 2, 1, 08
Peak load history1A, B, C, D, E4, 3, 2, 1, 04
Average load history1A, B, C, D, E4, 3, 2, 1, 04
VLF-Tan delta test3A, B, C, D, E4, 3, 2, 1, 012
Partial discharge3A, B, C, D, E4, 3, 2, 1, 012
Metallic shield corrosion3A, B, C, D, E4, 3, 2, 1, 012
Accessories condition (termination, splice, elbow)1A, B, C, D, E4, 3, 2, 1, 04
Total score72
Disclaimer/Publisher’s Note: The statements, opinions and data contained in all publications are solely those of the individual author(s) and contributor(s) and not of MDPI and/or the editor(s). MDPI and/or the editor(s) disclaim responsibility for any injury to people or property resulting from any ideas, methods, instructions or products referred to in the content.

