Article

Simulation and Economic Investigation of CO2 Separation from Gas Turbine Exhaust Gas by Molten Carbonate Fuel Cell with Exhaust Gas Recirculation and Selective Exhaust Gas Recirculation

Key Laboratory of Power Station Energy Transfer Conversion and System, Ministry of Education, National Thermal Power Engineering & Technology Research Center, School of Energy, Power and Mechanical Engineering, North China Electric Power University, Beijing 102206, China
*
Author to whom correspondence should be addressed.
Energies 2023, 16(8), 3511; https://doi.org/10.3390/en16083511
Submission received: 1 March 2023 / Revised: 5 April 2023 / Accepted: 15 April 2023 / Published: 18 April 2023

Abstract

:
The paper presents a simulation investigation of using a molten carbonate fuel cell (MCFC) combined with exhaust gas recirculation (EGR) or selective exhaust gas recirculation (SEGR) to reduce CO2 emission from the gas turbine in order to cope with climate change problem. EGR or SEGR can be used to concentrate the low-concentration CO2 in gas turbine exhausts. The CO2 concentration is then raised further by adding gas turbine exhaust to the MCFC’s cathode. The suggested gas–steam combined cycle system paired with MCFC and CO2 collection without EGR is contrasted with two novel gas–steam combined cycle systems integrated with MCFC, EGR, or SEGR with CO2 capture (the reference system). The thermal efficiency of the gas–steam combined cycle systems’ integrated MCFC, EGR and SEGR with CO2 collection is 56.08%, which is 1.3% higher than the reference system. The cost of CO2 avoided in the new system with SEGR will be equal to that of the system with the MEA technique for CO2 capture if the MCFC cost is reduced to 904.4 USD/m2.

1. Introduction

Reducing CO2 emissions is a significant way to solve the problem of global warming, as CO2 is the main component of greenhouse gases [1]. The establishment of low-carbon cities is promoted in China to keep CO2 emissions under control [2]. In the past 30 years, nearly 40% of CO2 in China has been released by fossil fuel power plants [3]. Therefore, it is necessary to lower China’s fossil fuel power plants’ CO2 emissions. Gas turbines (GT) are employed more frequently than conventional coal-fired power plants because of their dependability, flexibility and comparatively low CO2 emissions [4]. Because the gas turbine uses around 2.5 times as much air as is required for full combustion, the CO2 content in the exhaust stream is quite low (about 3–4 percent points), necessitating a further expensive CO2 extraction process [5].
Due to its unique properties, the molten carbonate fuel cell (MCFC) may be utilized to remove CO2 from the gas turbine exhaust. Gas turbine exhaust gas’s CO2 and O2 combine to form carbonate ions when it is injected into the MCFC’s cathode. The MCFC’s molten electrolyte is then used to carry the carbonate ions from the cathode to the anode. At the anode of MCFC, the carbonate ions react with H2, then H2O and CO2 are generated. Once the anode exhaust gas is burned in the afterburner with pure O2 acting as the oxidizer, all that is left are CO2 and H2O. Pure CO2 gas can be achieved after being dehydrated. Stefano Campanari et al. [6] investigated the performance of MCFC as a CO2 separator integrated into natural gas combined cycles. According to the findings, with a CO2 recovery rate of around 71%, the specific energy consumption for CO2 avoidance was less than 0.5 MJ/kgCO2. A gas–steam combined cycle (GSCC) system that incorporates CO2 capture was investigated by Duan et al. [7]. The system efficiency was around 54.96% when the CO2 avoidance rate was 85%. Nonetheless, it has been established that the MCFC efficiency is sensitive to the gas turbine exhaust gas’s c CO 2 content [8]. Wang et al. [9] introduced the comparison among different fuel cells for carbon capture. The results showed that MCFC-based configurations could gain better performance than the solid oxide fuel cell (SOFC) based configurations.
Gas turbine exhaust gas recirculation (EGR) is a popular technique for increasing the cycle’s c CO 2 while lowering the energy required for the carbon capture process [10]. The EGR process is as follows: a part of the exhaust gas is returned to the air compressor (AC) after the heat recovery steam generator releases it (HRSG). Air mass flow into the AC is reduced to maintain a constant total mass flow of the working medium, which raises the CO2 concentration in the cycle. The application of EGR also reduces the emissions of nitrogen oxide because both the oxygen and nitrogen concentrations are decreased in the cycle [11]. The effects of EGR on full load and partial load operation performances of GTs were studied by Joe Hachem et al. [4]. By using four distinct techniques, Hailong Li et al. [10] assessed the impact of raising the CO2 content in the exhaust gas of GT-based power plants. According to the research, the combined cycle with EGR had the highest electrical efficiency and could change the CO2 molar fraction over the widest range, from 3.8 mol% to at least 10 mol%. In order to explore strategies for increasing efficiency, Pan et al. [12] assessed the effectiveness and effects of a post-combustion CO2 capture (PCC) on the natural gas combined cycle (NGCC). The findings demonstrated that when the EGR ratio grew, the stripper’s energy consumption fell because EGR reduced the mass flow rate of exhaust gas and increased c CO 2 , which reduced the stripper’s need for steam in a PCC. The upper bound of EGR ratio was 33% due to the restriction of the minimum oxygen concentration. The impact of a carbon capture procedure on the NGCC was investigated by Woo-Sung Lee et al. [13]. As a consequence, 533 MW of net electricity was produced using an NGCC with a 90% CO2 recovery rate. The total cost of CO2 collection was around 46.5 USD/ton. Carapellucci et al. [14] investigated the functioning of NGCC integrated with MCFC using EGR without CO2 capture and with CO2 capture. The results showed that the addition of an MCFC fed by GT exhaust gases markedly increases the rated plant capacity.
The term “selective exhaust gas recirculation” (SEGR) refers to a different method of recycling CO2 from gas turbine exhaust gas with membranes to increase the c CO 2 in the cycle. Zhao et al. [15] used multi-stage membrane systems to capture CO2 from coal-fired power plants. The results showed that CO2 purity of 95 mol% and 90% CO2 capture rate could be achieved with the SEGR method. Merkel et al. [16] used membranes to capture CO2 in the post-combustion power plant. The results showed that processes using a vacuum at the permeate side required less energy than processes using the compression of the feed gas. The CO2 generated by the integrated gasification combined cycle (IGCC) power plants was captured by Merkel et al. [17] using the H2-selective and CO2-selective membranes. The results showed that, compared to cold absorption, 60% of the capital cost and 50% of the energy consumption could be reduced. The impact of the sweep gas on the membrane area and the degree of CO2 separation was studied by Franz J et al. [18]. The findings demonstrated that for a 600 MW reference power plant, the technological approach utilizing sweep gas allowed for an efficiency reduction of 3.8 percentage points with a 70% CO2 capture. The membrane techniques were employed by Richard et al. [5] to remove CO2 from the gas turbine combined cycle power plants. The results revealed that the SEGR method made CO2 capture easier, and the lowest capture cost occurred with CO2 capture rates of 60–70%. Herraiz L et al. [19] used SEGR and amine-based chemical absorption technology to capture CO2 of the natural gas-fired combined cycle plants. The results showed that the SEGR increased c CO 2 in gas turbine flue gas to 13–14 vol%. Gatti M et al. [20] presented the preliminary technical and economic assessment of four alternative technologies (including MCFC and CO2 permeable membranes) suitable for post-combustion CO2 capture from NGCC exhaust gases. The results showed that MCFC seemed to outperform the baseline from both performance and cost; CO2 permeable membranes are affected by the large area and high capital costs.
According to the previous description, both the EGR and SEGR can enrich CO2 with almost no energy input. The SEGR is driven by the difference in CO2 partial pressure between air and flue gas while employing the air stream as the sweep gas. Compressors or vacuum pumps are not needed. To move the gas streams through the membrane unit, fans or blowers are the sole energy consumption sources. However, the enrichment of c CO 2 of flue gas by EGR or SEGR is limited, only 15–20 vol% [5]. With the combination of the EGR or SEGR with MCFC, the c CO 2 of flue gas will further increase, which encourages CO2 collection while using less energy. There is no research on the combination of SEGR with MCFC currently.
On the base of the above research, two GSCC systems integrated with MCFC, EGR or SEGR and CO2 capture are proposed in this paper. In the first system, EGR increases the c CO 2 of the GT exhaust gas; in the second system, SEGR and EGR increase the c CO 2 of the GT exhaust gas. The thermal and economic performances of different systems are analyzed and compared. On the thermal efficiency and financial performance of the new systems, the impacts of the EGR/SEGR ratio and the CO2 collection rate are investigated.

2. Description of System

2.1. The GSCC System Coupled with MCFC and CO2 Capture without EGR (Reference System)

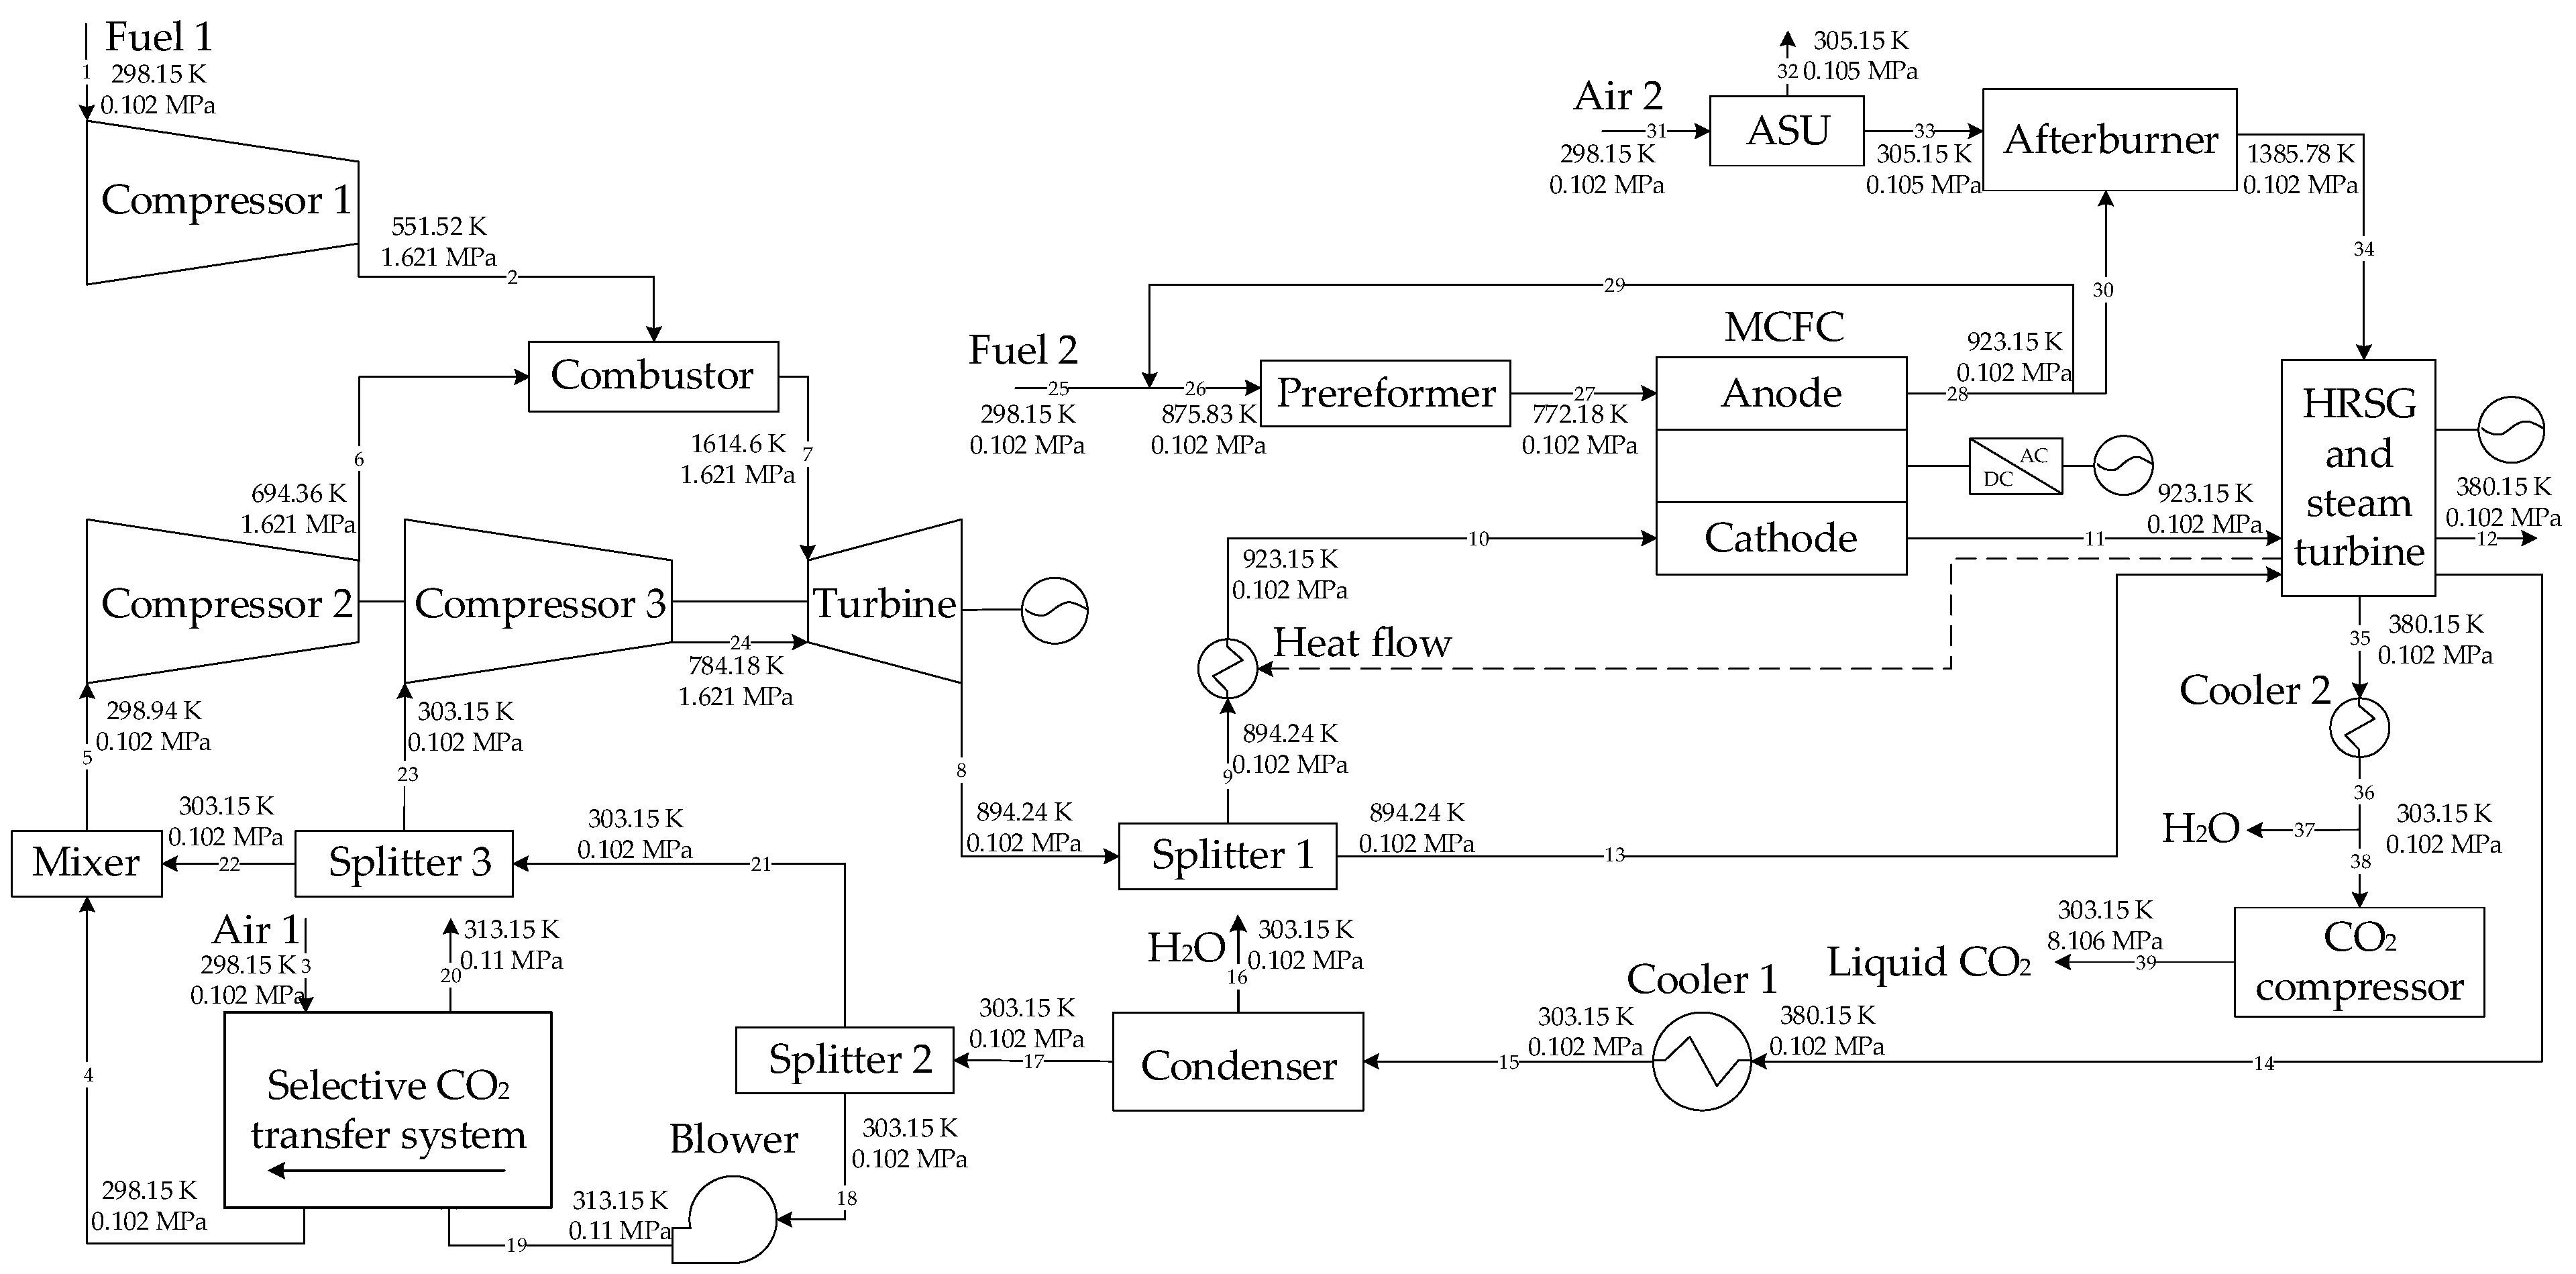
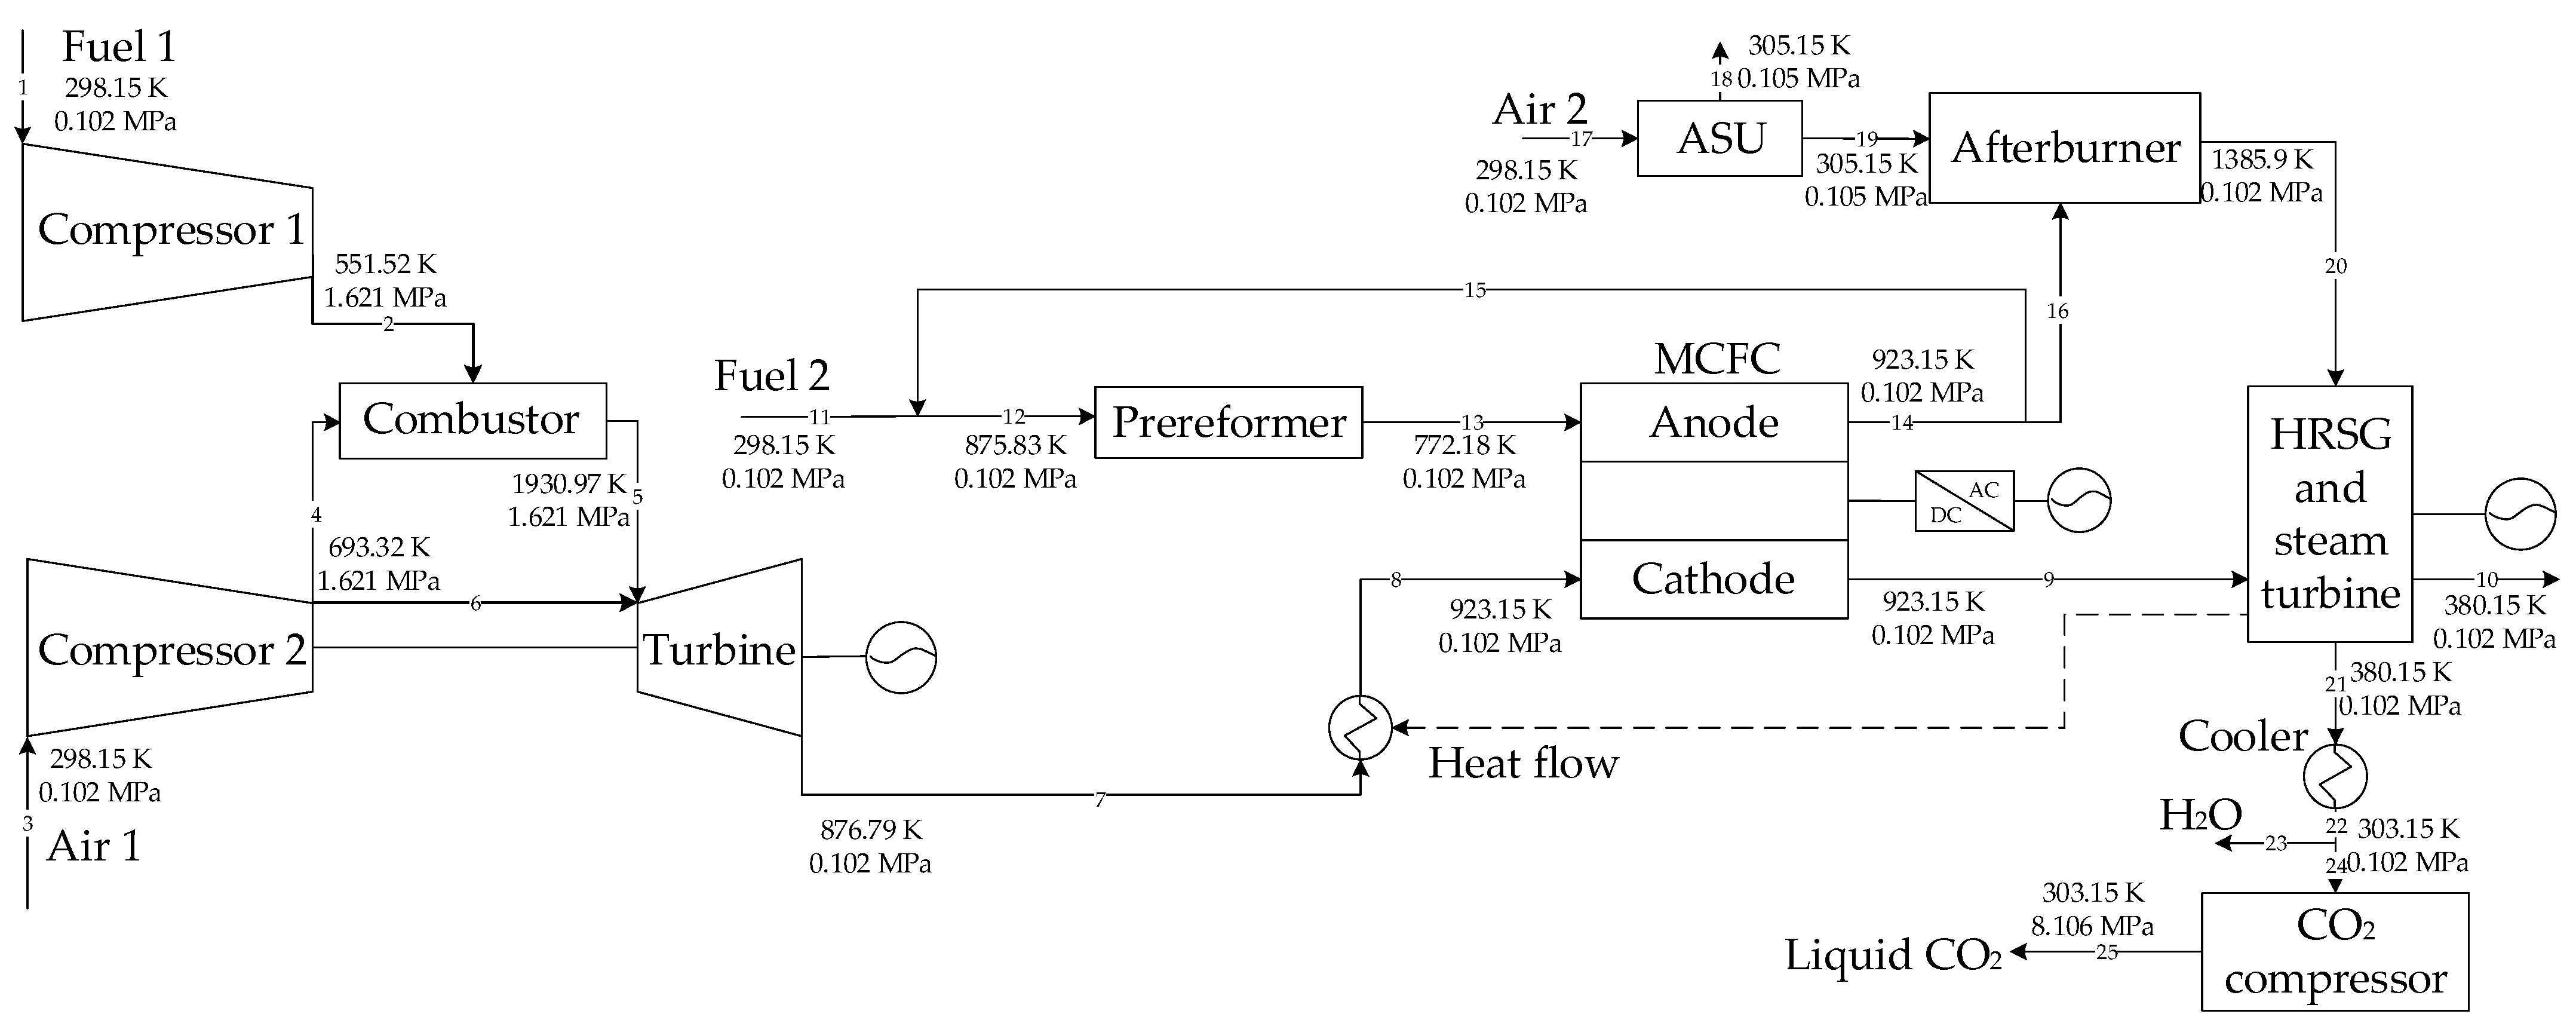
The GSCC system paired with MCFC and CO2 collection without EGR was chosen as the reference system, and the flowchart is shown in Figure 1. After being compressed in compressor 1, the fuel (2) is fed into the combustor. After being compressed in compressor 2, the air is split into two parts. One part (4) is fed into the combustor; the other part (6) is fed into the GT as the cooling air. The combustion chamber outlet’s flue gas expands in the GT to generate electricity, and the exhaust gas from the GT is subsequently supplied into the MCFC cathode. In order to avoid the issue of carbon deposition, a portion of the anode exhaust gas (15) goes into the pre-reformer. This converts the fuel into H2 and CO. H2 interacts with the carbonate ions brought in from the cathode in the anode to create H2O and CO2. The cathode output gas (9), which has high-temperature and low- c CO 2 following the electrochemical process, is released into the environment after releasing heat in the heat recovery steam generator (HRSG) (10). The air separation unit’s pure O2 (19) is used to burn the remaining anode exhaust gas (16) in the afterburner (ASU). The HRSG is then supplied with the afterburner’s output gas (20) to release heat. Ultimately, the liquid CO2 is created by condensing and compressing the cooled afterburner exhaust gas (21), which is composed exclusively of H2O and CO2 (25).

2.2. The GSCC System Integrated with MCFC and CO2 Capture with EGR (Case 1)

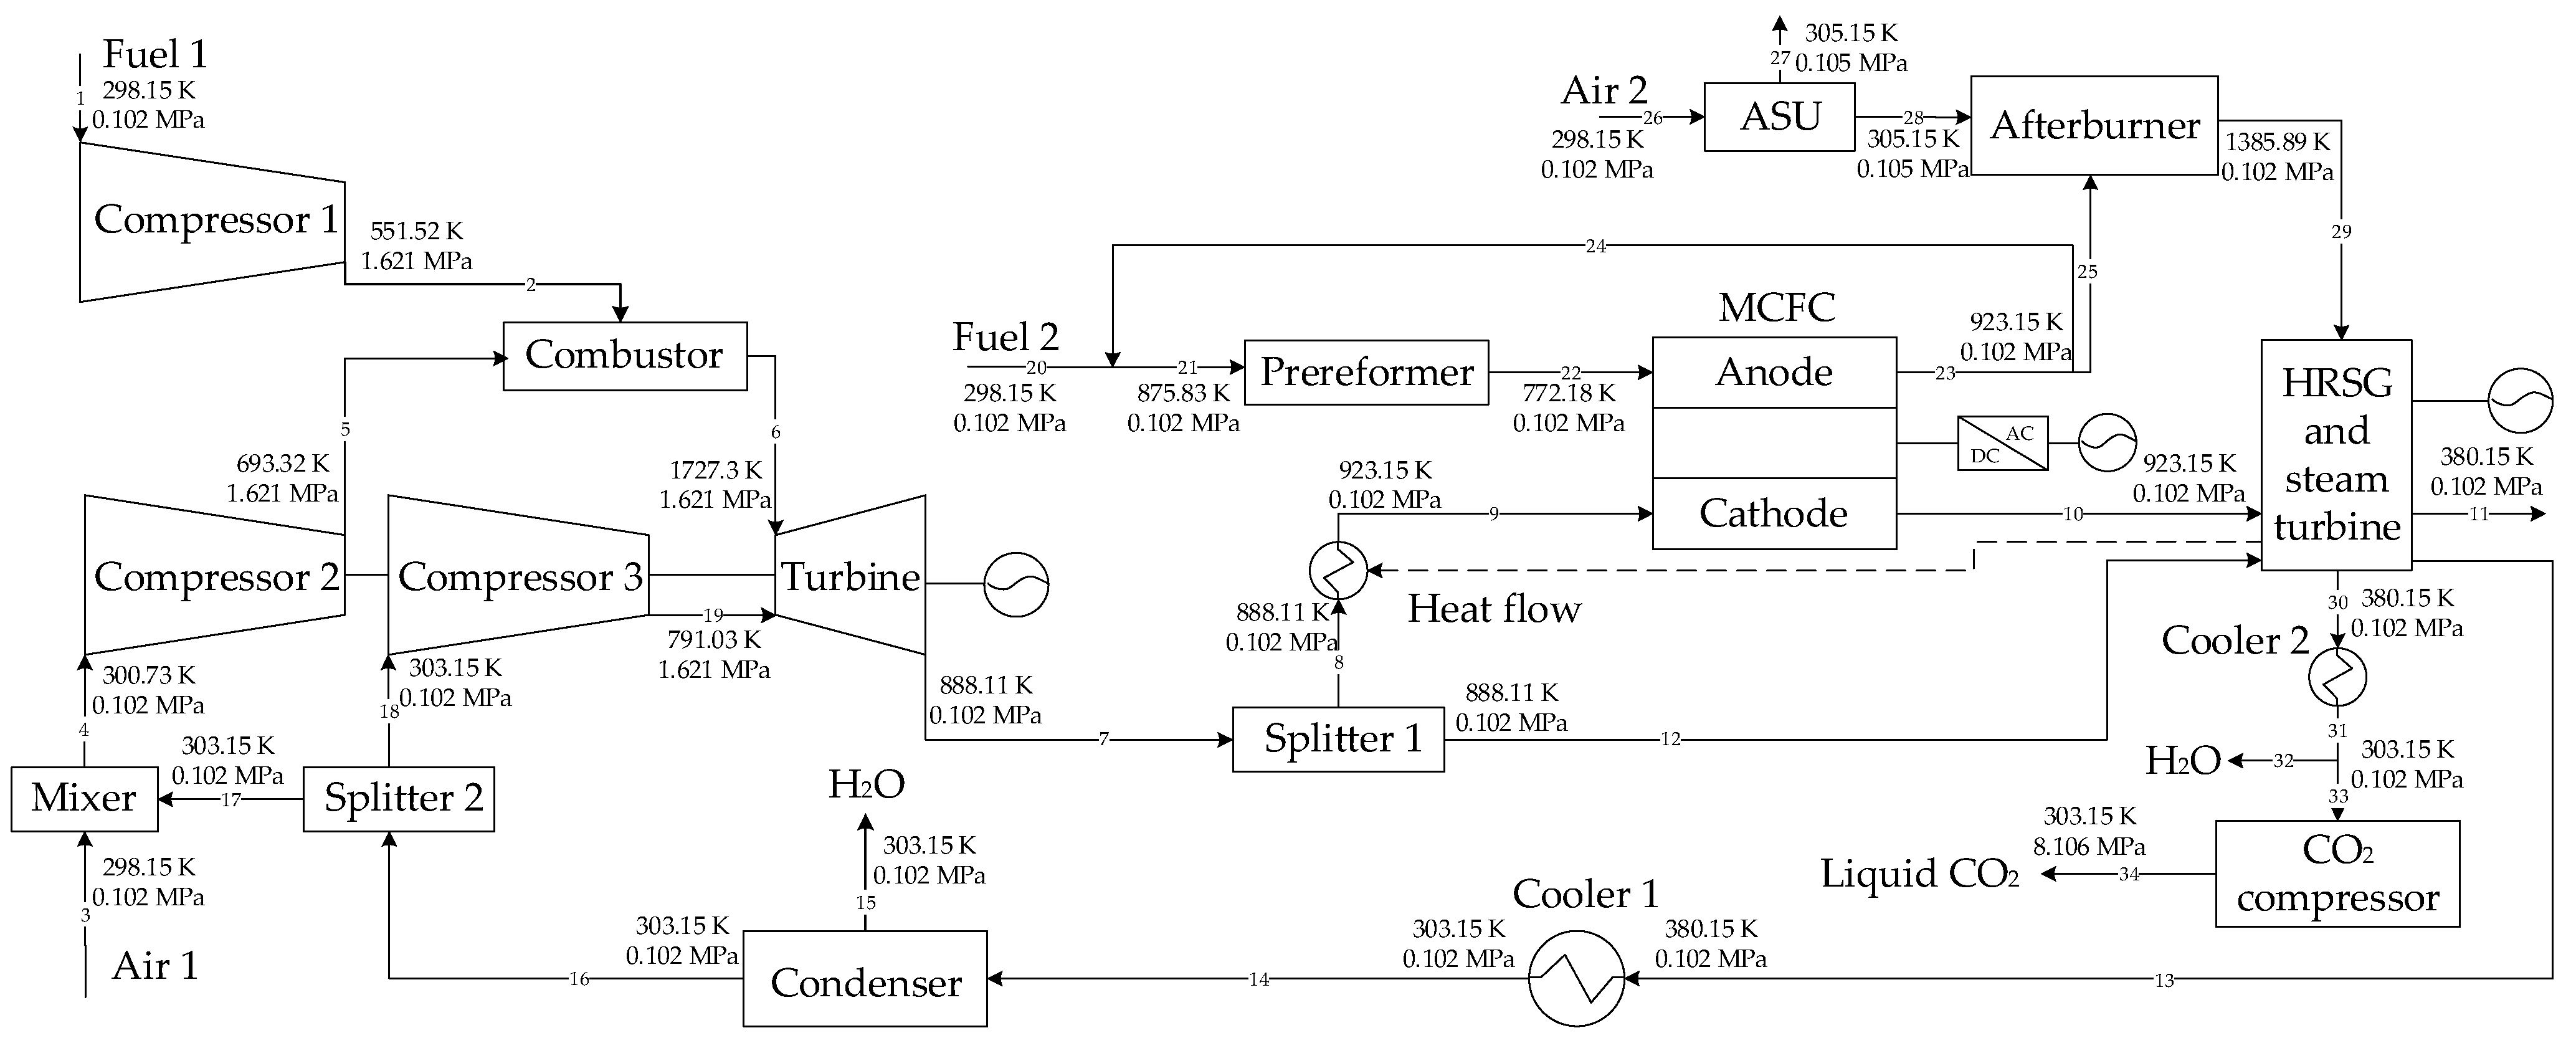
Figure 2 shows the simplified flowchart of the GSCC system that is integrated with MCFC and CO2 capture using EGR. The exhaust gas from a GT is split into two pieces. After being heated in the HRSG to a temperature of 923.15 K, one part (9) is injected into the MCFC cathode. The other part (12) is fed into the condenser to remove H2O (15) after cooling down in the HRSG and Cooler 1 to the temperature of 353.15 K. After being compressed in compressor 3, 40% of the water-removed exhaust gas (18) is supplied into the gas turbine as the cooling gas (19) to keep the O2 concentration ( c O 2 ) in the combustor over 15 mol%. Air 1 is fed into the combustor chamber after being mixed with the rest exhaust gas (17) and compressed in compressor 2.

2.3. The GSCC System Integrated MCFC, EGR and SEGR with CO2 Capture (Case 2)

Figure 3 shows a simplified flowchart of the GSCC system integrated MCFC, EGR and SEGR with CO2 capture. After releasing heat in HRSG, a part of the gas turbine exhaust gas (13) is cooled down in cooler 1 to the temperature of 303.15 K. In contrast to the flowchart for Case 1, 40% of the water-removed exhaust gas (21) is supplied into splitter 3, and 60% of the exhaust gas (18) is vented into the selective CO2 transfer system. Then part of the exhaust gas (23) goes into the gas turbine as the cooling gas (24) after being compressed in compressor 3. Air 1 (3) goes into the selective CO2 transfer system as the sweep gas. The air that contains CO2 that has passed through the membranes is then combined with some of the exhaust gas (22), which is then compressed in compressor 2.

3. System Modeling

The Aspen Plus software was used to build the system models. Table 1 shows the parameters of the new systems, while Table 2 lists the parameters of the MCFC. Some assumptions are as follows [21]:
  • Steady-state conditions;
  • The MCFC is thermally insulated, and there is no entropy flow to the outside environment;
  • The permeability of the membranes is constant, and no coupling effect is taken into account;
  • The system’s interactions with potential or kinetic energy are disregarded;
  • The assumption is that all gases are perfect incompressible gases.
Pure CH4 is given to the MCFC anode as the electrochemical reaction fuel to ensure that the exhaust gas from the afterburner includes only CO2 and H2O. The MCFC is simulated with a Fortran code. The main reaction equations are as follows:
Reforming reaction [7]:
CH 4 + H 2 O CO + 3 H 2 ,
CO + H 2 O CO 2 + H 2 ,
Cathode reaction [7]:
0.5 O 2 + CO 2 + 2 e CO 3 2 ,
Anode reaction [7]:
H 2 + CO 3 2 H 2 O + CO 2 + 2 e ,
The ideal reversible voltage, E Nerst (V), can be calculated as follows [24]:
E Nerst = Δ G n F + R T n F l n [ p H 2 ( p O 2 ) 0.5 P CO 2 , ca P H 2 O P CO 2 , an ] ,
Δ G = 242,000 45.8 T ,
where Δ G represents the Gibbs free energy (kJ/kg), n indicates the number of electrons that the H2 molecule emitted, and p i is the species i’s partial pressure (MPa).
The activation loss can be calculated as follows [24,25]:
η act = η act , an + η act , ca ,
η act , an = R T α n F l n j p H 2 j 0 , an p H 2 , TPB ,
η act , ca = R T α n F l n j ( p O 2 ) 0.5 p CO 2 , ca j 0 , ca ( p O 2 , TPB ) 0.5 p CO 2 , ca , TPB ,
j 0 , an = j 0 , an 0 ( p H 2 ) 0.25 ( p H 2 O ) 0.25 ( p CO 2 , an ) 0.25 ,
j 0 , ca = j 0 , ca 0 ( p O 2 ) 0.375 ( p CO 2 , ca ) 1.25 ,
where η act represents the activation voltage loss (V), j represents the current density (A/m2), j 0 is the exchange current density (A/m2), and j 0 0 is the standard exchange current density (A/m2).
The ohmic loss can be calculated as follows [26]:
η ohm = j R ohm ,
R ohm = τ an σ an + τ elec σ elec + τ ca σ ca ,
where η ohm is the ohmic voltage loss (V), R ohm is the ohmic polarization cell resistance ( Ω · m 2 ), τ is the thickness (mm), and σ is the electrical conductivity (S/m−1).
The gas transport model in porous media is used in Equations (17)–(21), where it is used to compute the partial pressures of gas at the three-phase boundaries ( p i , TPB ). The concentration loss can be calculated as follows [26]:
η conc = η conc , an + η conc , ca ,
η conc , an = R T 2 F l n ( p H 2 p H 2 O , TPB p CO 2 , an , TPB p H 2 , TPB p H 2 O p CO 2 , an ) ,
η conc , ca = R T 2 F l n ( p CO 2 , ca ( p O 2 ) 0.5 p CO 2 , ca , TPB ( p O 2 , TPB ) 0.5 ) ,
p H 2 , TPB = p H 2 R T τ an 2 F D eff , an j ,
p H 2 O , TPB = p H 2 O + R T τ an 2 F D eff , an j ,
p CO 2 , an , TPB = p CO 2 , an + R T τ an 2 F D eff , an j ,
p O 2 , TPB = p O 2 R T τ ca 4 F D eff , ca j ,
p CO 2 , ca , TPB = p CO 2 , ca R T τ ca 2 F D eff , ca j ,
where η conc is the concentration voltage loss (V), p i , TPB represents the partial pressure of the species i at the three-phase boundary (MPa), and D eff is the effective diffusivity (m2/s).
The actual MCFC voltage can be calculated as follows:
V cell = E Nerst η act η ohm η conc ,
where V cell is the cell voltage (V).
These are the formulas for calculating the MCFC power output, W MCFC (W):
W MCFC = A c j V cell ,
where A c represents the cell active area (m2).
The net power output can be calculated as follows:
W MCFC , net = η DC AC W MCFC ,
where the efficiency of converting direct current into the alternative current is known as η DC AC .
The following formula may be used to calculate the MCFC’s thermal efficiency, η MCFC :
η MCFC = W MCFC , net m fuel   after   pre reformer θ H 2 ˙ L H V H 2 ,
where m fuel   after   pre reformer ˙ represents the fuel mass flow after the pre-reformer (kg/s), θ H 2 represents the H2 mass fraction of the fuel mass flow after the pre-reformer, and L H V H 2 represents the low heat value of H2 (kJ/kg).
The selective CO2 transfer system is set as counter-current. The selective CO2 transfer system is simulated with the Aspen Custom Modeler. These are the formulas for calculating a species i’s gas permeance [18]:
d n i ˙ = d A · Q i ( p i , f p i , p ) ,
where Q i is the permeability of the species i (kmol/(m2s·MPa)), d n i ˙ represents the gas permeance of species i for a segment of area (kmol/s), A represents the area (m2), p i , f represents the partial pressure of the species i at the feed side (MPa), and p i , p represents the partial pressure of species i at the permeate side (MPa).
The fuel utilization rate of MCFC can be calculated as follows:
U fuel = 1 m fuel , outlet m fuel , inlet ,
The CO2 utilization rate of MCFC can be calculated as follows:
U CO 2 = 1 m CO 2 , outlet m CO 2 , inlet ,
The overall CO2 capture rate can be calculated as follows:
O C C R = m CO 2 , capture m CO 2 , emissions ,
The overall system thermal efficiency can be calculated as follows:
η = W total , net m fuel   after   pre reformer θ H 2 ˙ L H V H 2 + m GT ˙ L H V ,

4. Model Validation

4.1. The Reference System Model Validation with Literature

In reference [7], the study used a GSCC system with integrated MCFC for CO2 collection. The findings indicated that the system’s total efficiency was 54.96% at 85% CO2 collection and 85% fuel utilization rate. In this paper, the overall efficiency of the reference system is 54.78% with the same MCFC operating parameters.

4.2. The Selective CO2 Transfer System Validation with Experiment Data

In reference [27], a post-combustion CO2 collection experiment was run in counter-current air sweep mode for mixed gas permeation. Investigations were conducted on the impacts of pressure ratio, sweep gas ratio and temperature. The results showed that the CO2 permeance was 1000 (gpu) and the CO2/N2 selectivity was 50, which made the selective CO2 transfer system model in this paper validated.

4.3. The MCFC Model Validation with Experiment

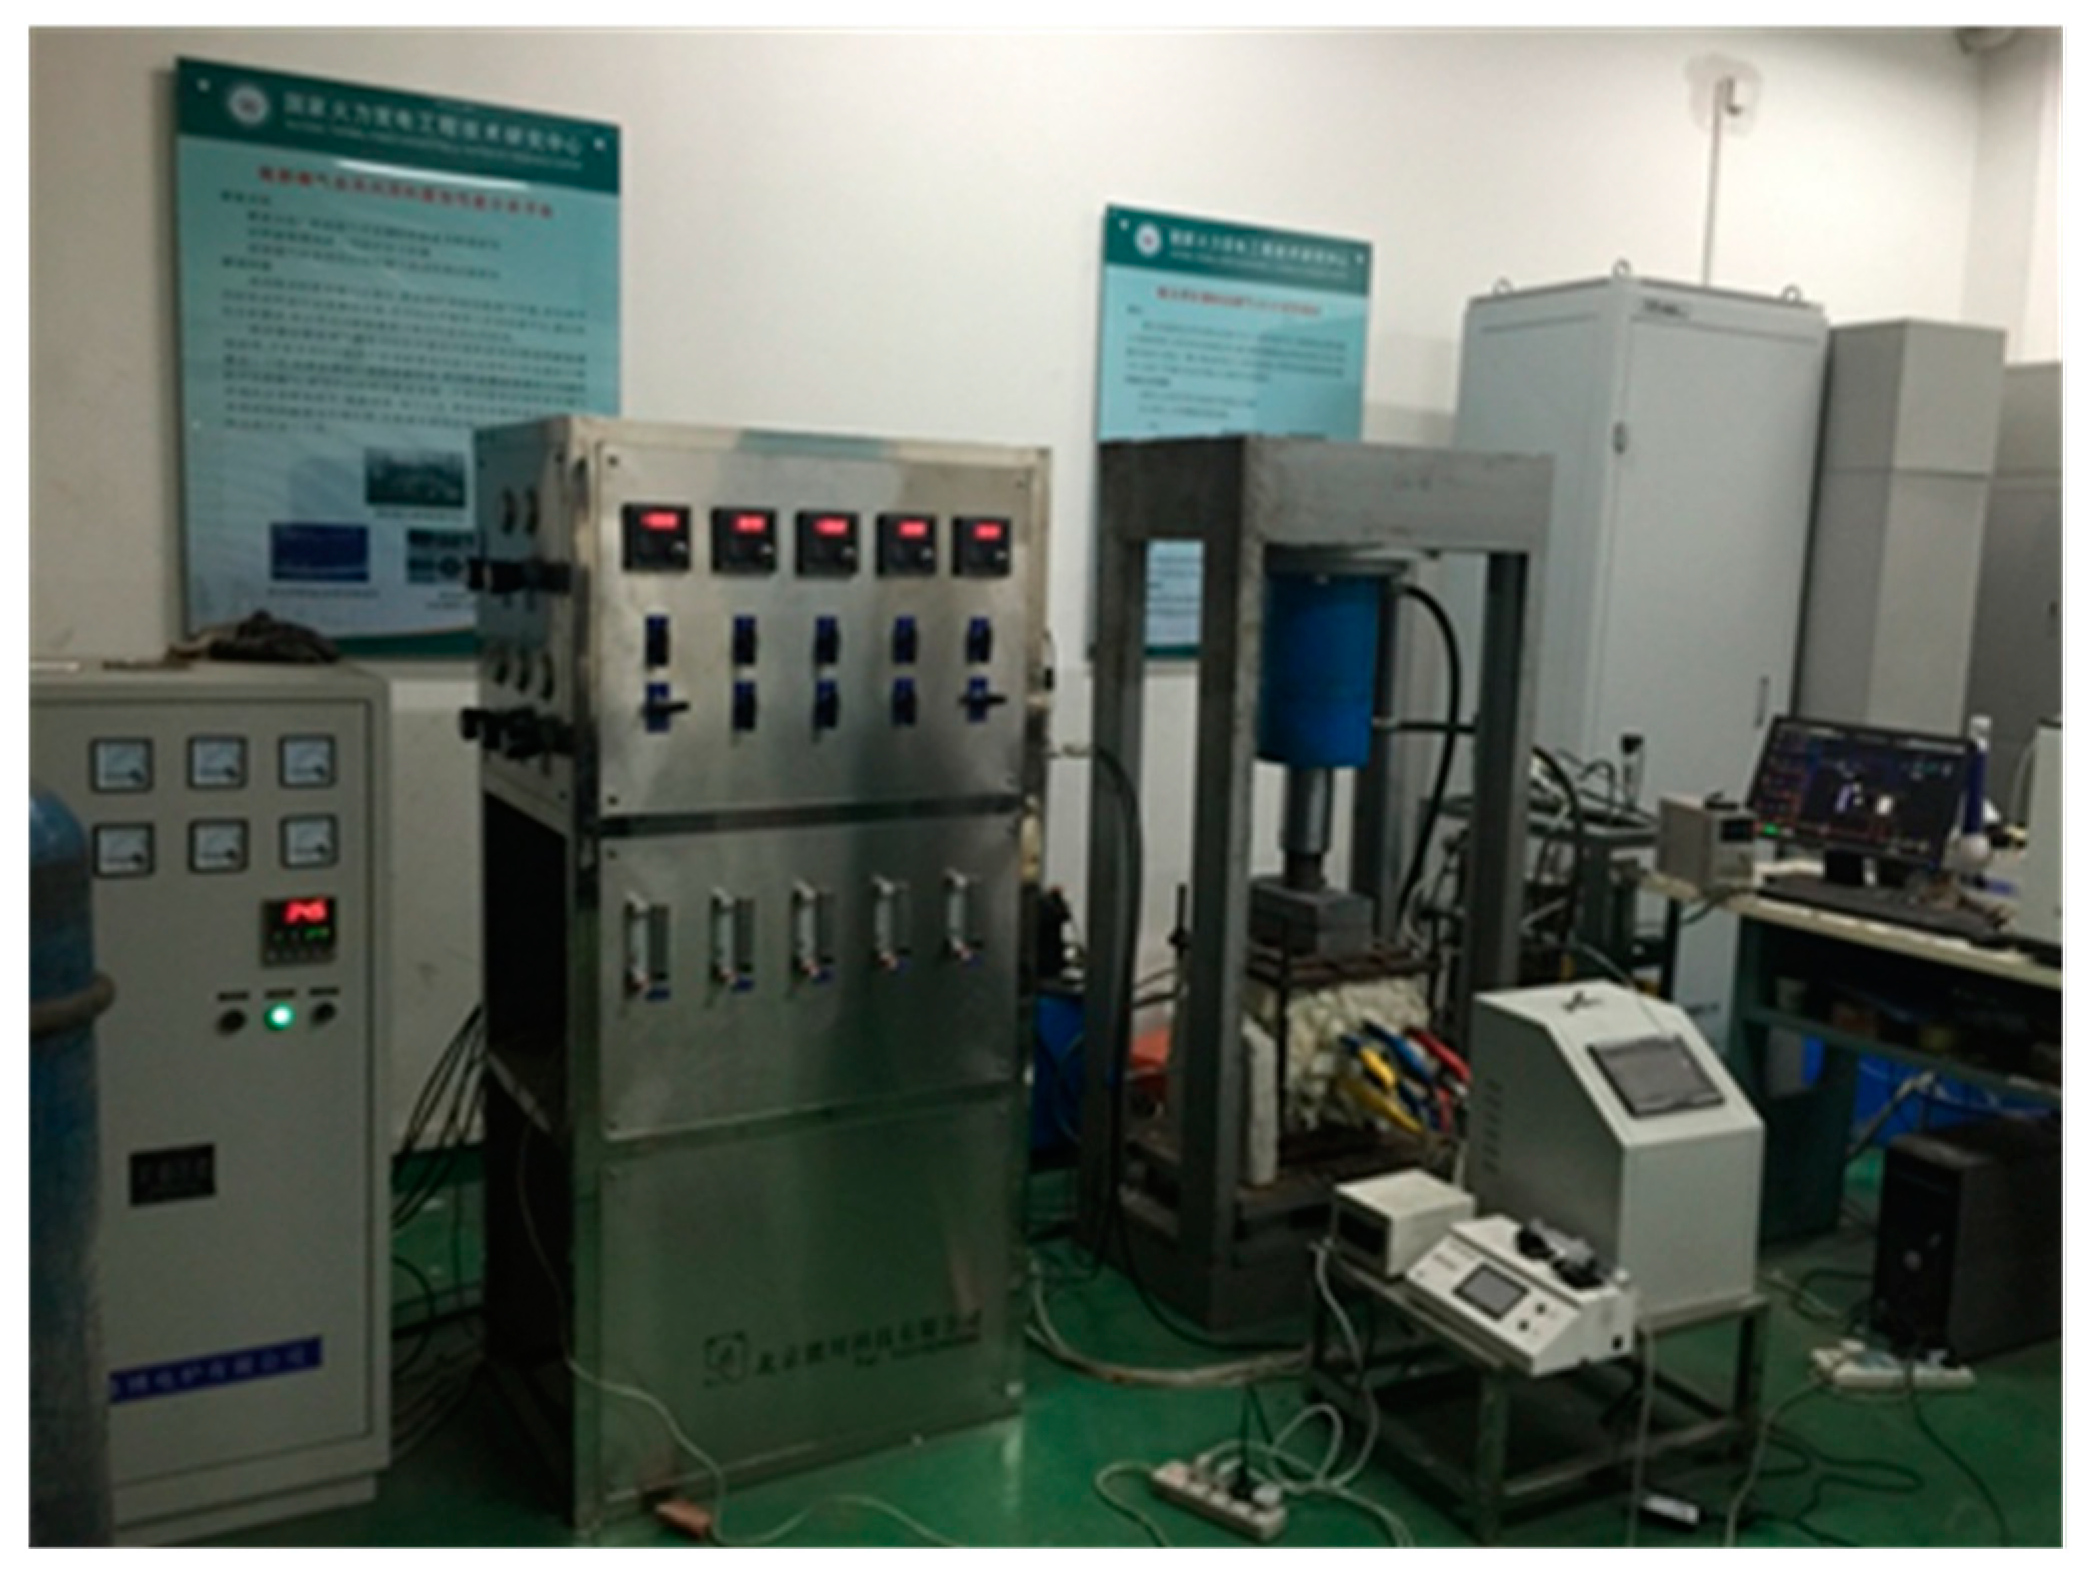
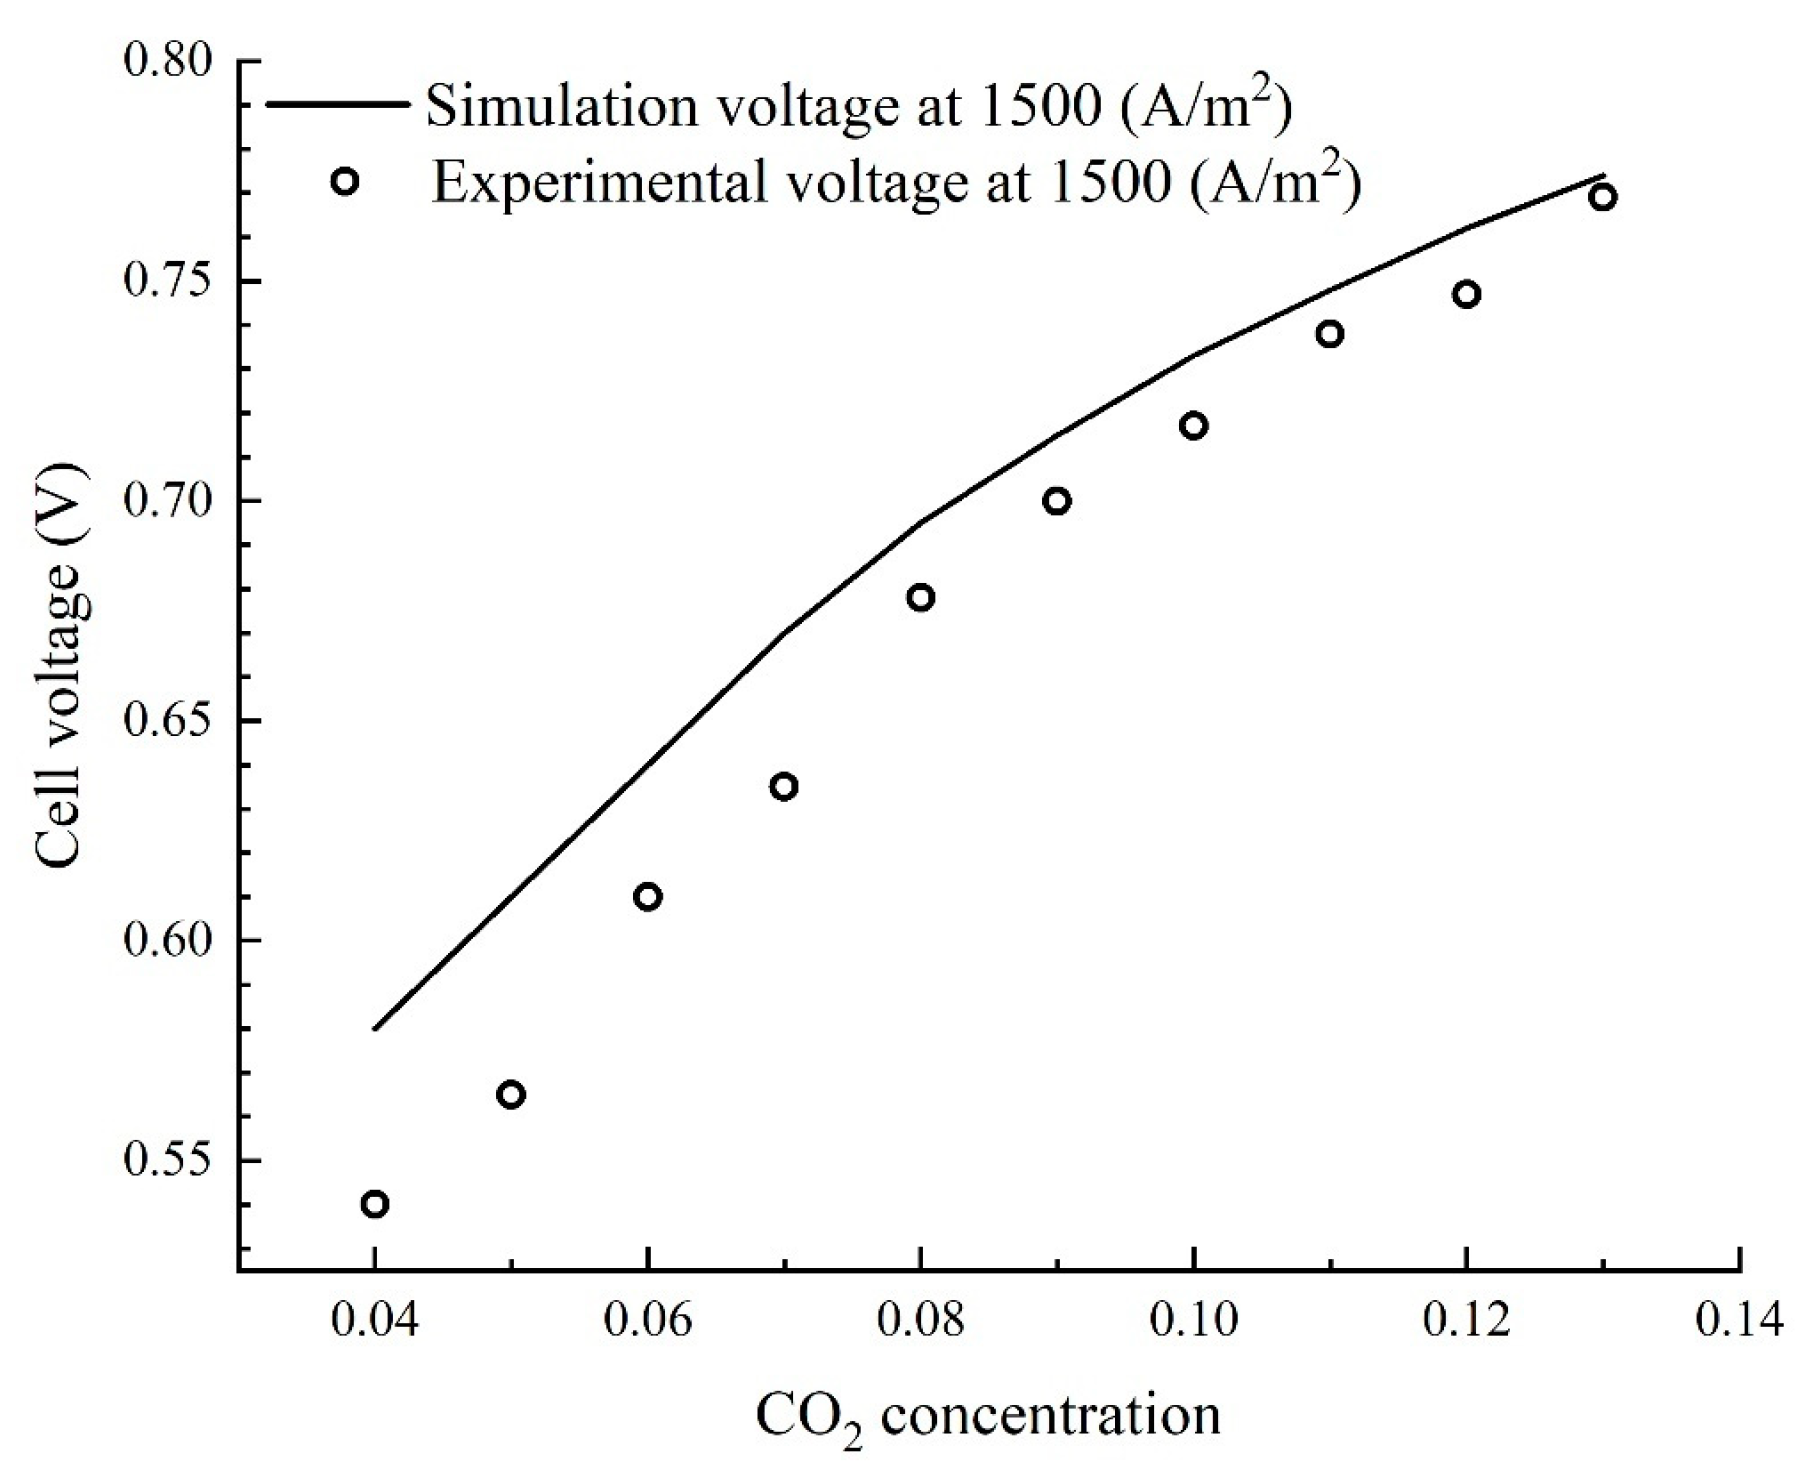
An MCFC planar unit cell with a porous Ni/Cr alloyed anode and a porous NiO cathode was tested to check the model reliability, as shown in Figure 4. A 62 % Li2CO3 and a 38 % K2CO3 combination made up the electrolyte. LiAlO2 is the electrolyte matrix. The experimental facility was made up of measuring, heating and gas flow control equipment, as well as an MCFC unit cell. In an atmosphere, the cell operates at 650 °C. The current density and cell voltage are set and measured by the electrochemical workstation. Figure 5 shows the simulation voltage and the real voltage operating at various c CO 2 during the experiment. The error indicator RMSE is calculated in Equation (31) [28], which value is 0.014V in this paper. It is obvious that the modeling results and the experimental findings correspond perfectly.
R M S E ( x ) = 1 N i = 1 N ( I i e x p e r i m e n t a l I i e s t i m a t e d ) 2 ,

5. Results and Discussion

5.1. Analysis of Case 1

To determine Case 1’s performance traits, a case ( U fuel = 0.85 and U CO 2 = 0.85) was thoroughly examined. In Figure 2, the streamlined flowchart for Case 1 is shown. The EGR percentage for Splitter 1 is 0.5, which means that 50% of the GT exhaust gas goes into the MCFC’s cathode. In splitter 2, 40 vol% of the water-removed exhaust gas goes into compressor 3 to maintain the c O 2 at the combustor 15 mol% [5]. Table 3 lists the specific information for Case 1’s primary streams. A total of 88.16% of the CO2 was captured overall in Case 1, with a system thermal efficiency of 54.71%.
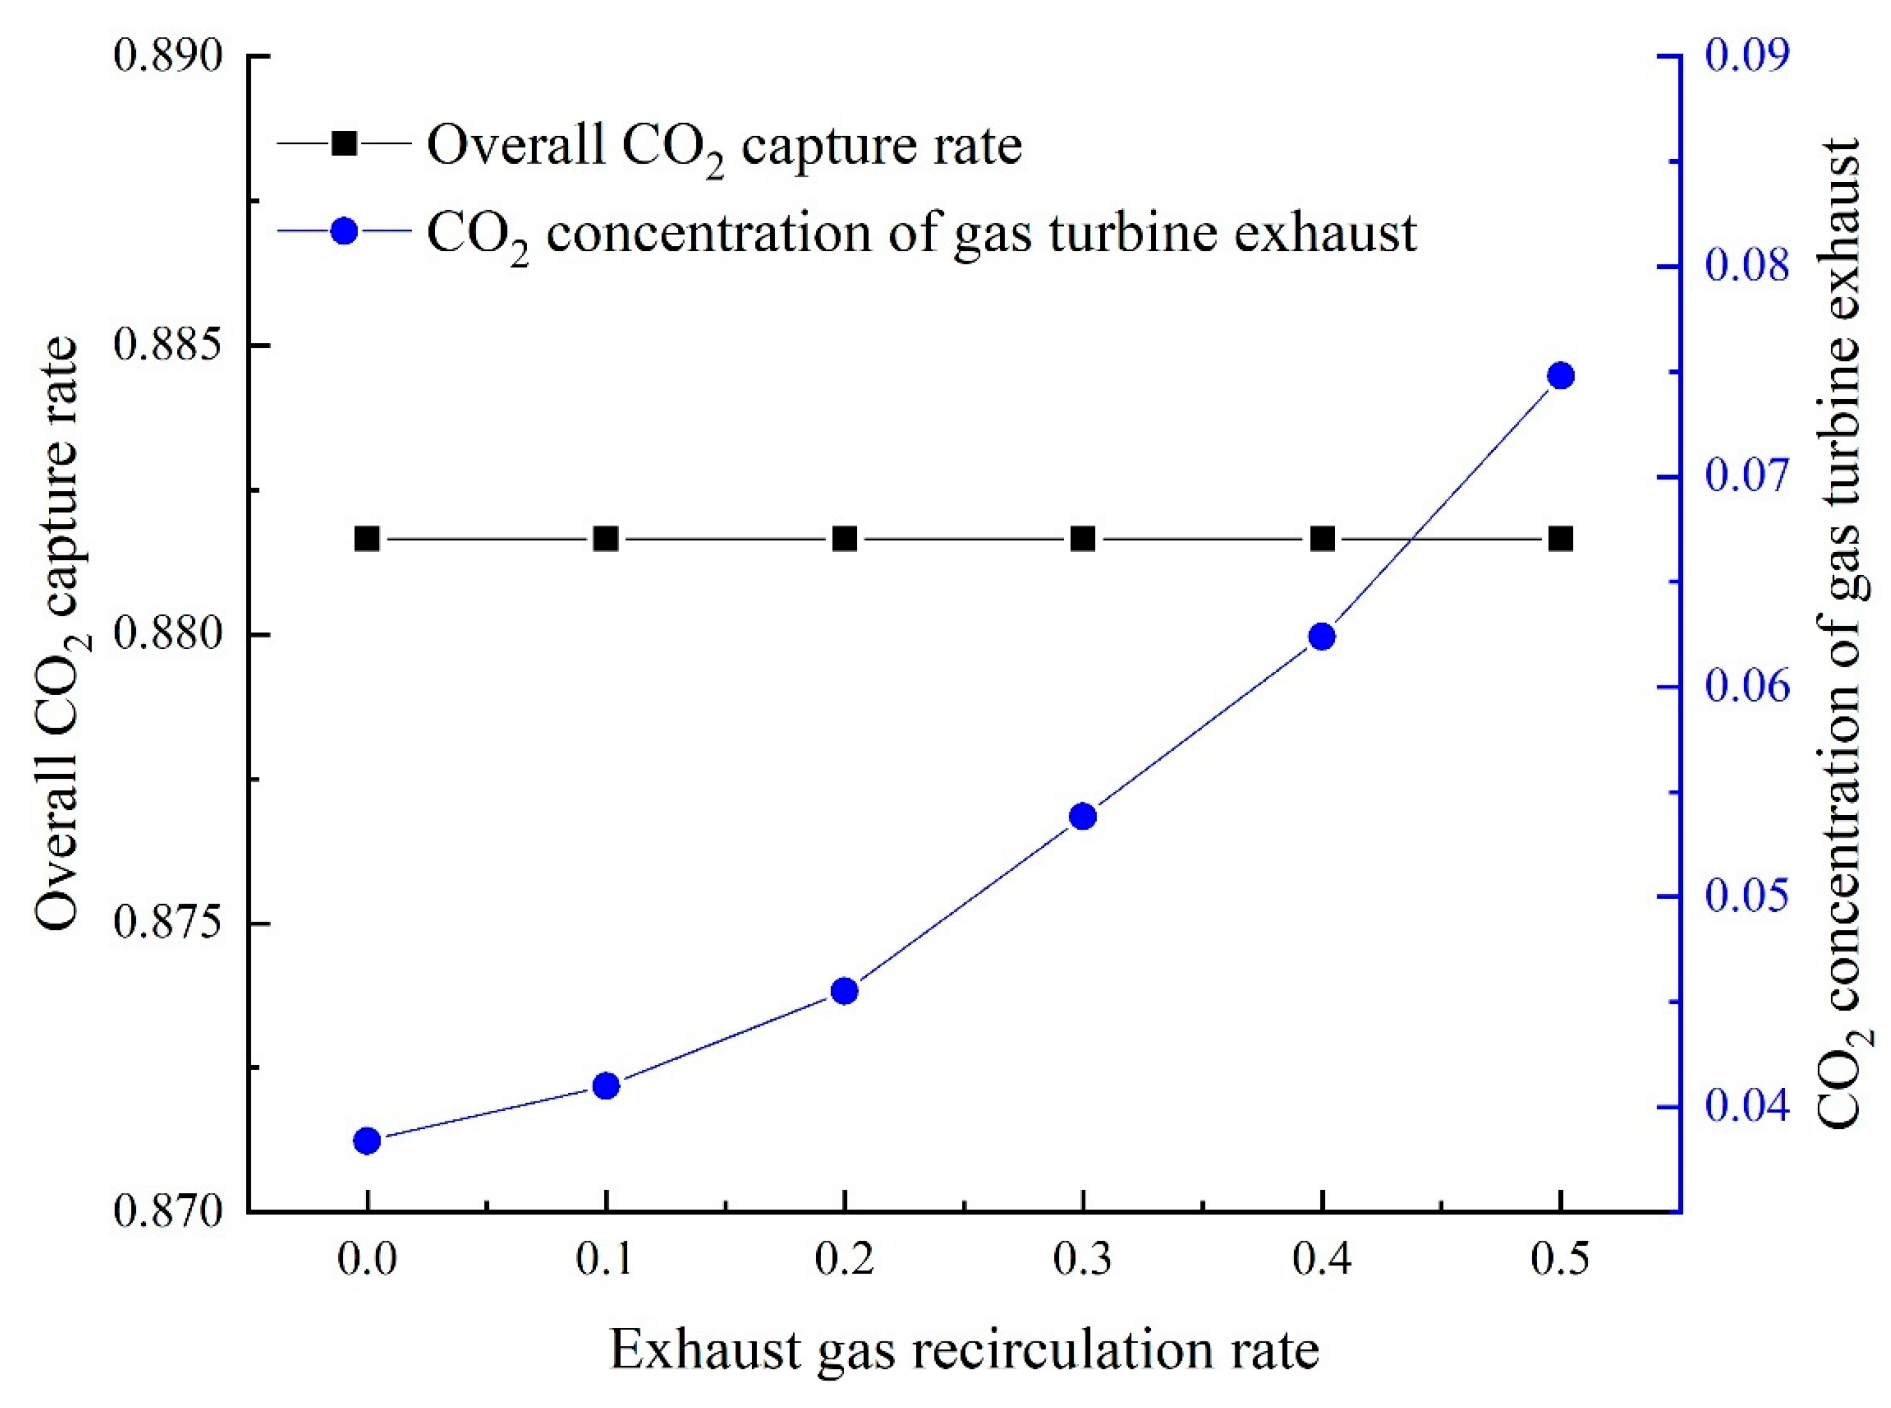
The MCFC’s CO2 consumption rate is held constant at 0.85 to assess the effect of the EGR rate on system performance. The mass flow of air 1 into the mixer was decreased when the EGR rate was raised from 0 to 0.5 to keep the turbine inlet temperature constant, as illustrated in Figure 6. The GT exhaust gas’s CO2 content goes from 0.038 to 0.075 when the air mass flow into the combustor is decreased. The amount of CO2 injected into the MCFC cathode and the amount of fuel fed into the MCFC are both maintained constant when the EGR rate is changed. Therefore, the OCCR of the system is not affected by the change in the EGR rate, which is kept constant at 0.8816.
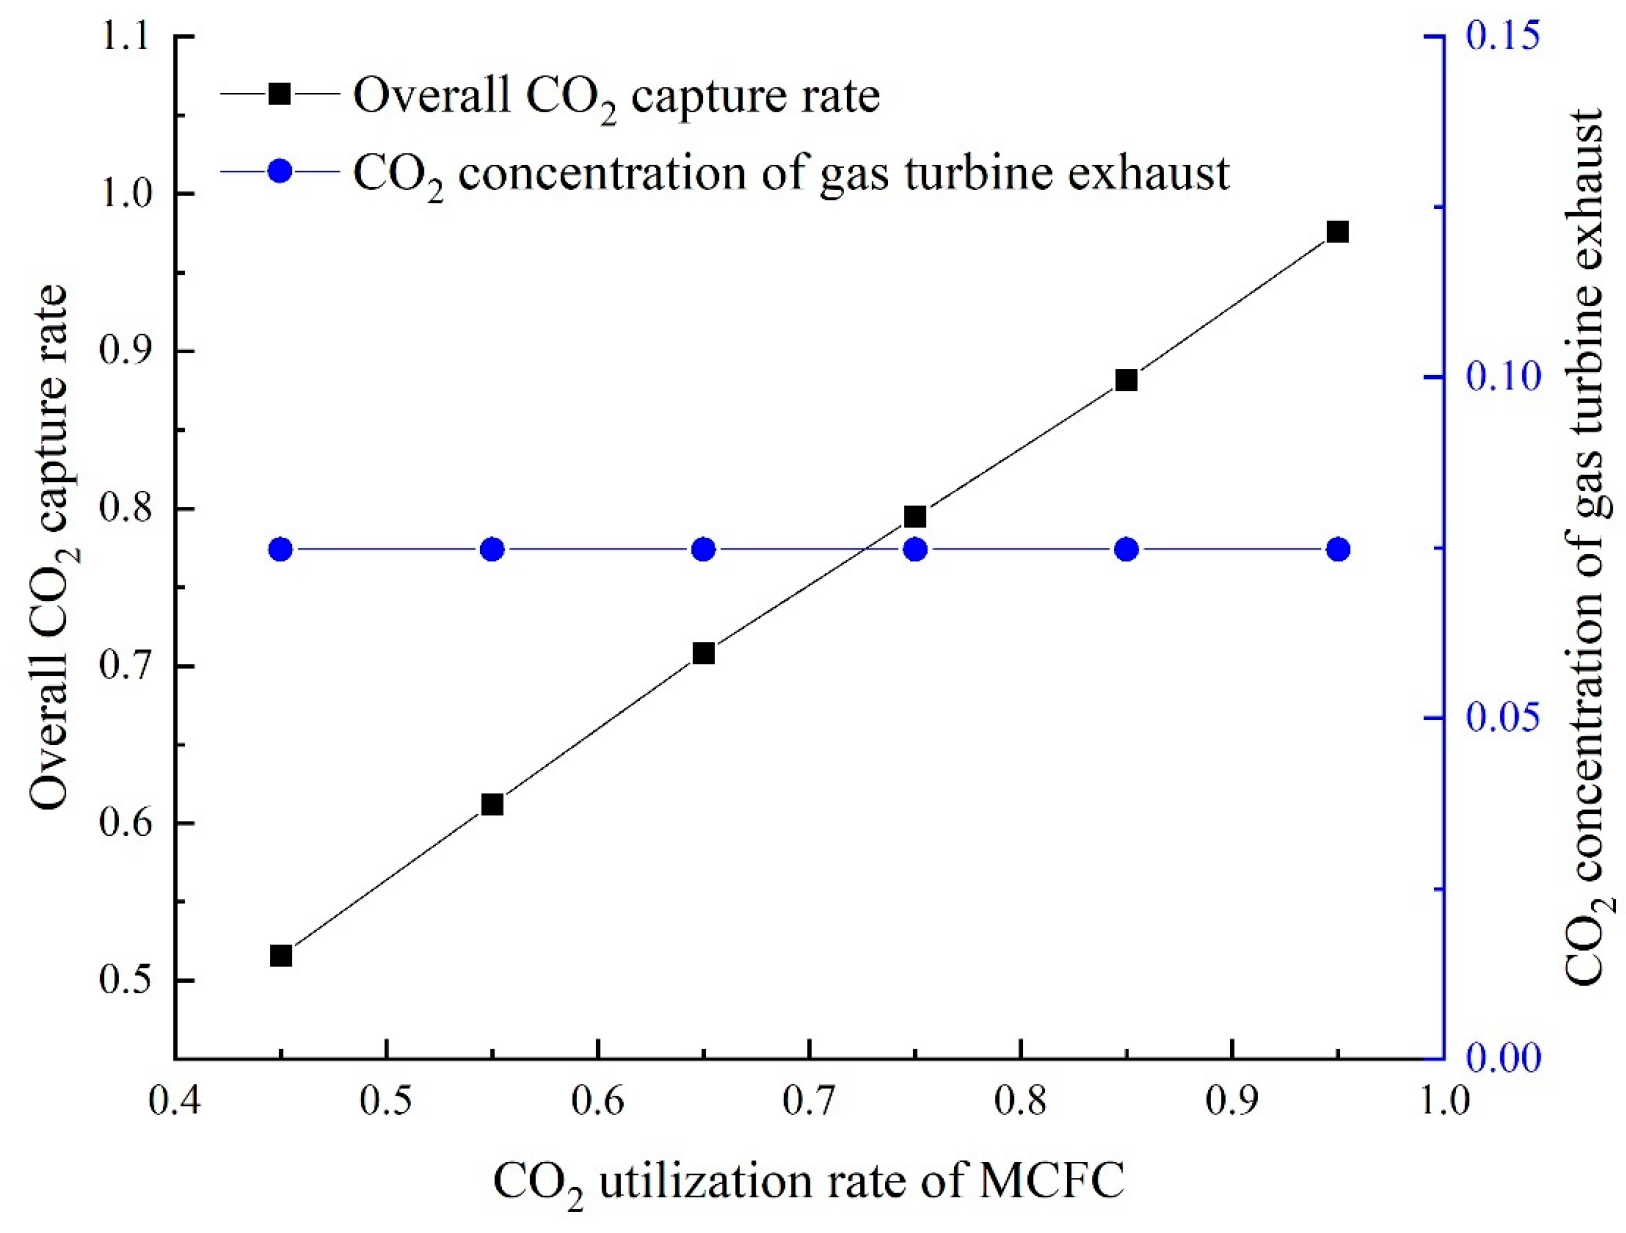
Both the current density of the MCFC and the CO2 mass flow of the gas turbine exhaust are maintained constants to study how the system performance depends on the MCFC’s rate of CO2 usage. In order to vary the CO2 utilization rate of MCFC from 0.45 to 0.95, the area of MCFC was increased from 54,118 m2 to 126,293 m2. Figure 7 shows that when the EGR rate is kept at 0.5, and the CO2 utilization rate of MCFC is varied from 0.45 to 0.95, the overall CO2 capture rate of the system is increased from 0.516 to 0.973. The c CO 2 of gas turbine exhaust gas is not influenced by the U CO 2 of MCFC.
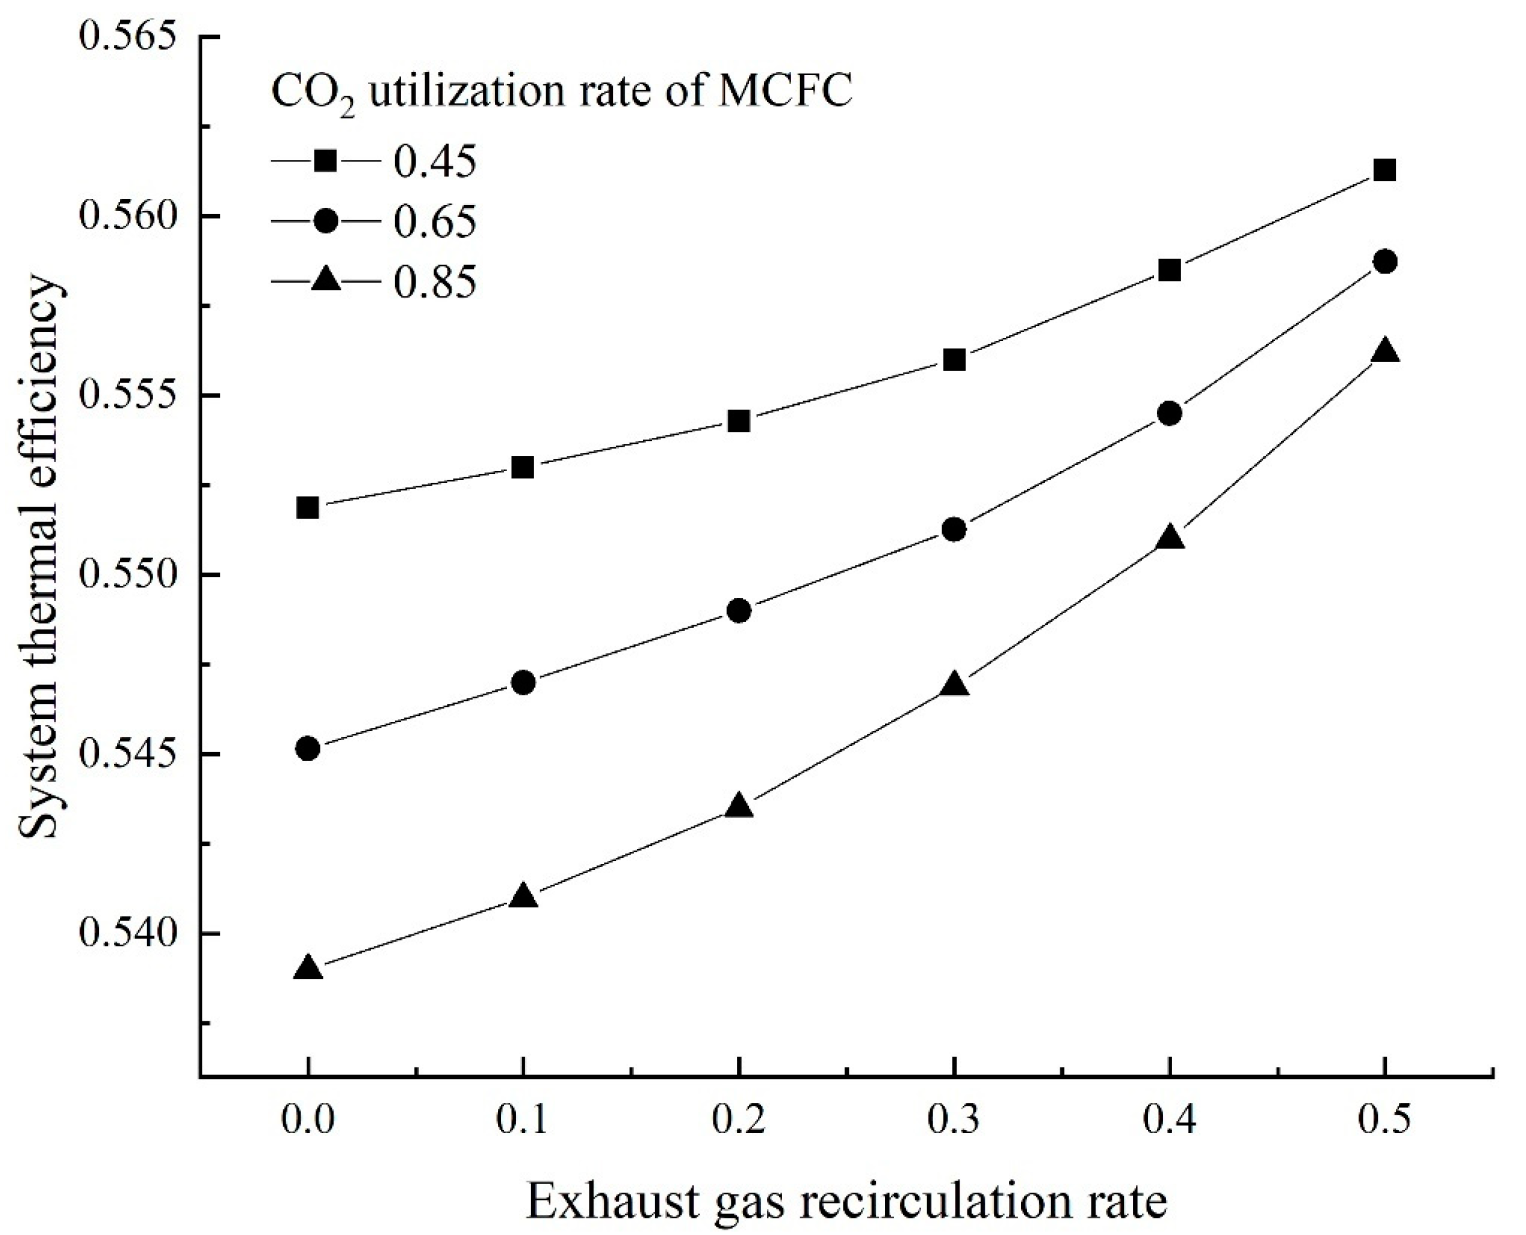
In line with the increase in c CO 2 of GT exhaust gas, the cell voltage of MCFC increases with the growth in EGR rate while the current density is held constant. As shown in Figure 8, when the power of MCFC rises with the increase in the cell voltage and the intake fuel mass flow of MCFC is kept constant, with a rise in EGR rate, the system’s thermal efficiency rises. The power output of the system will be raised along with the MCFC intake fuel as the CO2 utilization rate rises, resulting in an increase in the total intake of fuels. The system’s thermal efficiency will drop, as shown in Figure 8, since the U CO 2 has a greater influence on the system’s input fuels than it does on its output power.

5.2. Analysis of Case 2

To determine the performance traits of Case 2, a case ( U fuel = 0.9 and U CO 2 = 0.85) was thoroughly examined. The simplified flowchart of Case 2 is displayed in Figure 3. Forty percent of the exhaust gas from the GT is directed into the MCFC’s cathode when splitter 1’s EGR percentage is 0.6. In splitter 2, 70 vol% of the exhaust gas goes into the selective CO2 transfer system, where 94.4% of the CO2 in the exhaust gas is transferred to the sweep air. To keep the c O 2 at the combustor over 15 mol %, splitter 3 feeds 40 volume % of the exhaust gas into compressor 3. Table 4 lists the specific information for Case 2’s primary streams. The entire CO2 collection rate is 88.16%, while the new system’s thermal efficiency, in this case, is 56.38%.
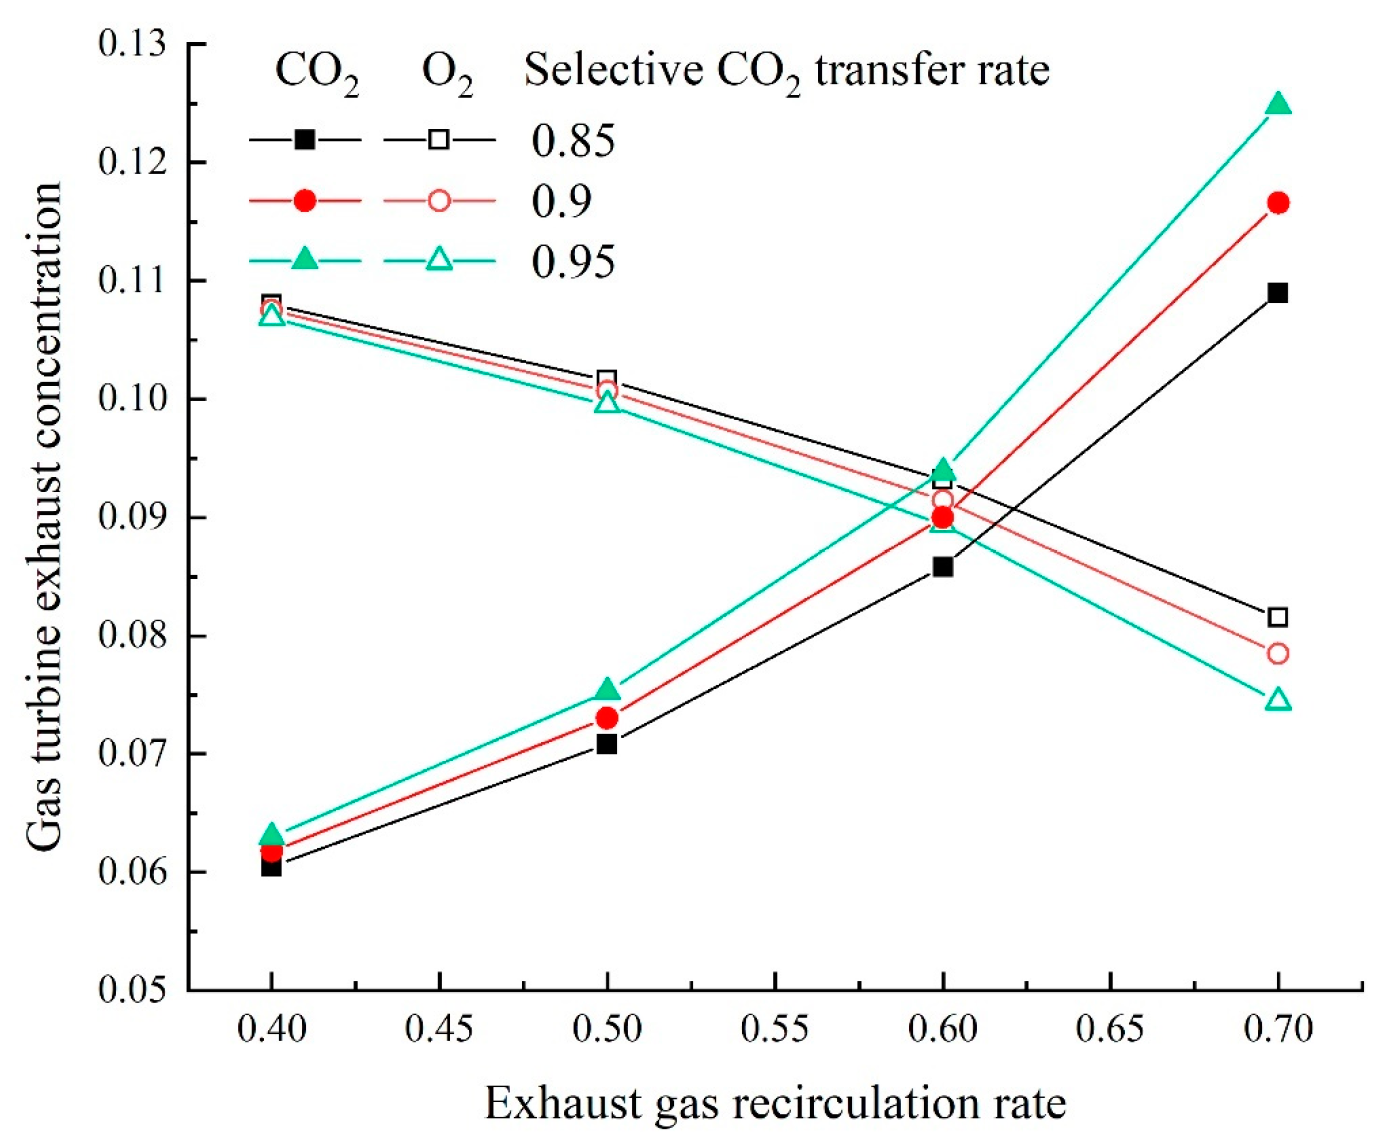
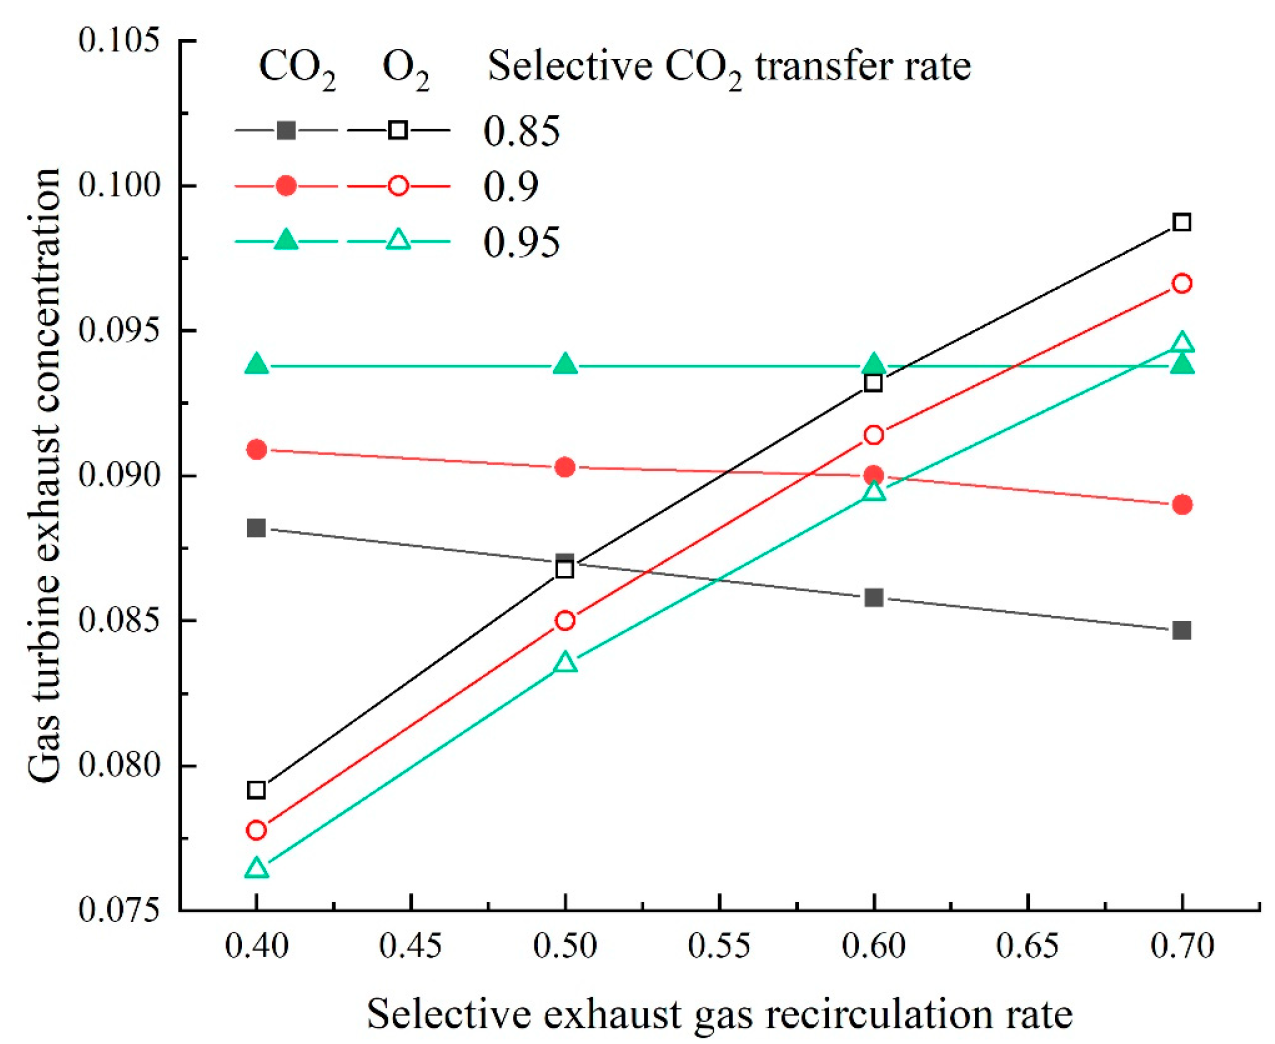
In order to investigate the effect of the EGR rate (splitter 1, as shown in Figure 3) on the system performance, the SEGR rate (splitter 2, as shown in Figure 3) is kept at 0.7, and the CO2 utilization rate of MCFC is kept at 0.85. When the EGR rate is raised from 0.4 to 0.7 to keep a consistent turbine inlet temperature, the mass flow of air 1 as the sweep gas decreases, which lowers the gas turbine’s c O 2 , as shown in Figure 9. With the reduction in the mass flow of air into the combustor, the c CO 2 of GT exhaust increases, as shown in Figure 9. The selective CO2 transfer rate is increased by raising the area of the membrane. Naturally, as shown in Figure 9, when the EGR is maintained constant, and the selective CO2 transfer rate is raised, the c CO 2 of gas turbine exhaust gas rises and the c O 2 falls.
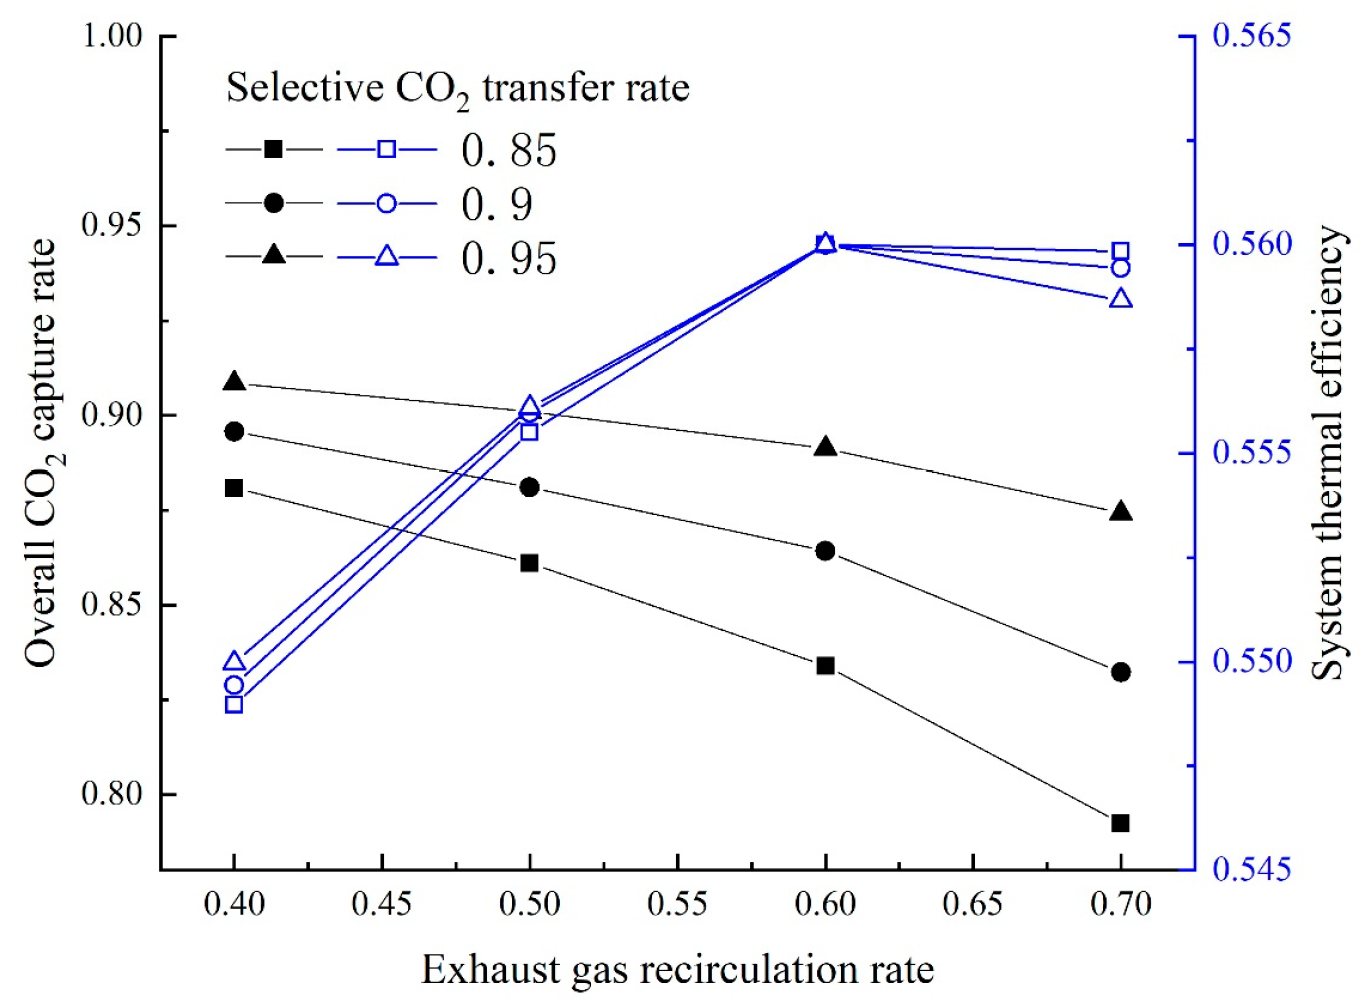
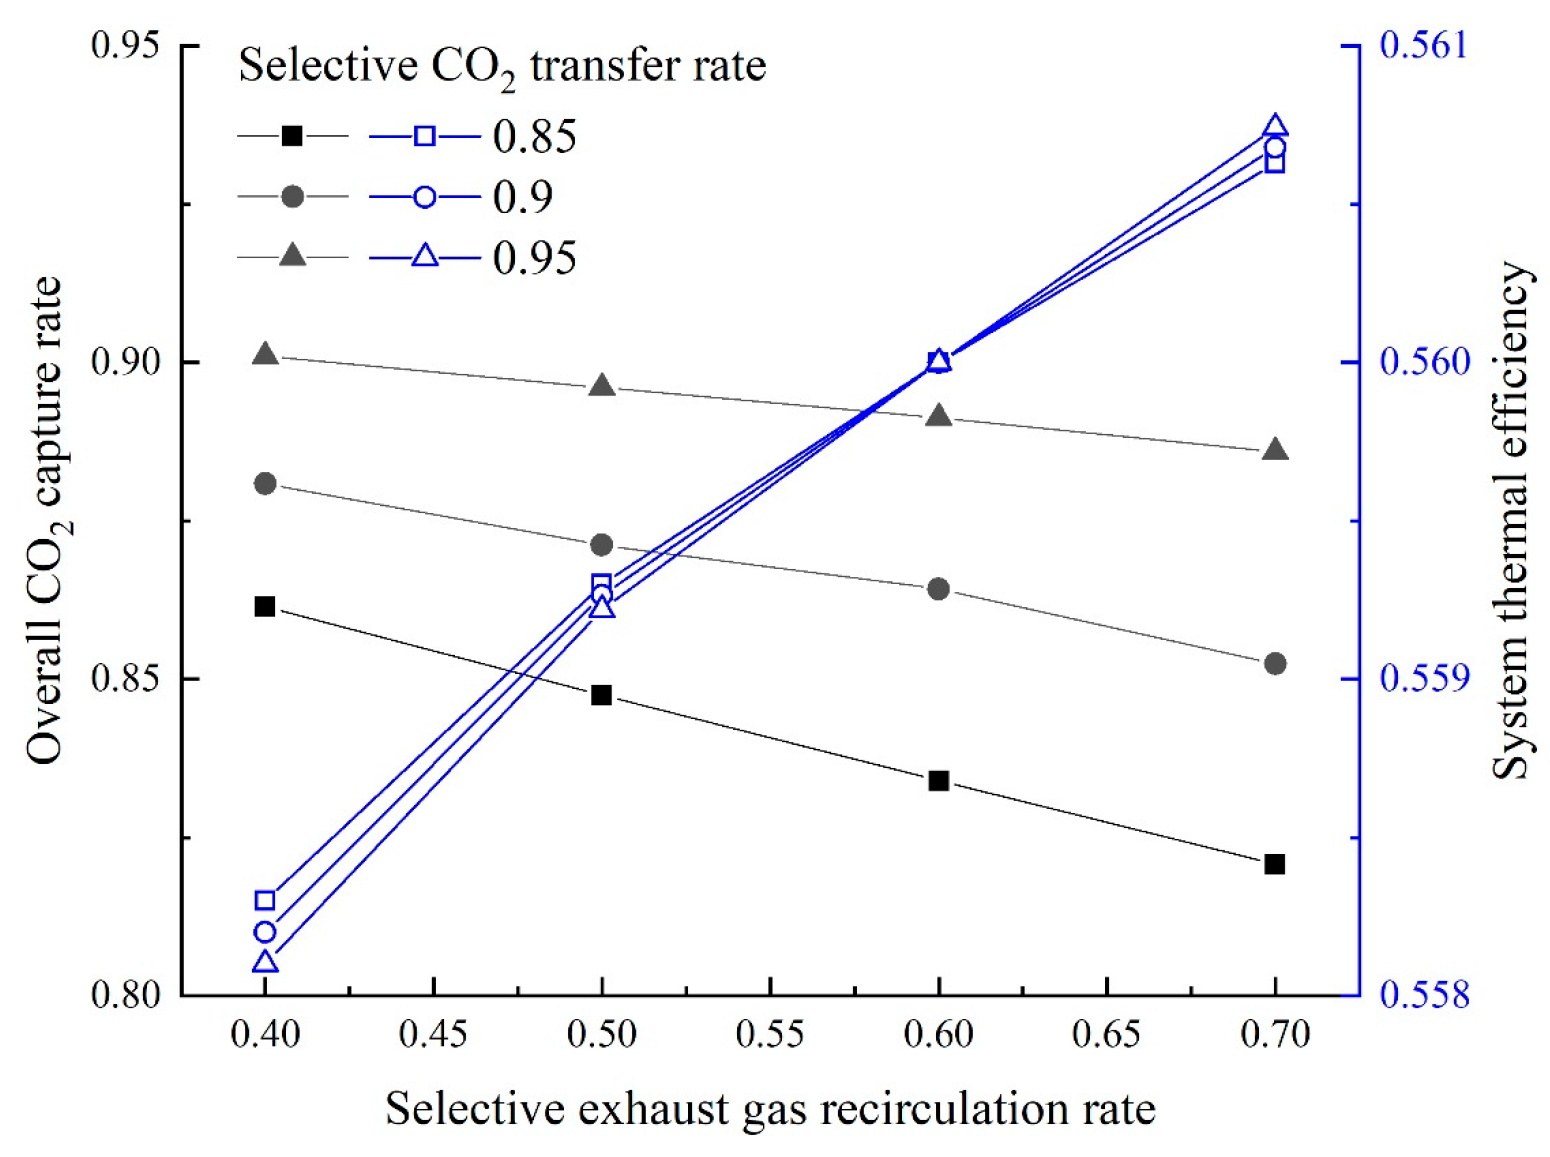
The mass flow of CO2 supplied into the MCFC cathode is decreased when the EGR rate is increased. Both the cell area and the fuel mass flow of MCFC are decreased to maintain a steady rate of CO2 and fuel usage. Therefore, both the mass flow rates of the CO2 collected and the system’s overall CO2 output drop. However, as the effect of the EGR rate rise on the captured CO2 is greater than the total system CO2 emission, the overall CO2 capture rate of the system is reduced, as shown in Figure 10. When the EGR rate is changed, the system’s thermal efficiency is mainly influenced by the MCFC output power, which is determined by the MCFC cell voltage. When the EGR rate is increased from 0.4 to 0.6, the cell voltage is determined by the c CO 2 , because the c CO 2 is obviously smaller than the c O 2 . As a result, when the EGR rate is increased from 0.4 to 0.6, the thermal efficiency of the system rises with an increase in c CO 2 , and the slope decreases as the c O 2 decreases with the increase in the EGR rate. When the EGR rate is maintained constant and the selective CO2 transfer rate is increased, the system thermal efficiency increases with a rise in c CO 2 , as shown in Figure 10. When the EGR rate is increased from 0.6 to 0.7, the cell voltage is determined by the c O 2 , because the c O 2 is obviously smaller than the c CO 2 . The system’s thermal efficiency, therefore, reduces with the decrease in c O 2 when the EGR rate is raised from 0.6 to 0.7; similarly, when the EGR rate is held constant at 0.7, and the selective CO2 transfer rate is raised, the system thermal efficiency reduces with the decrease in c O 2 , as illustrated in Figure 10.
In order to investigate the effect of the SEGR rate (splitter 2, as shown in Figure 3) on the system performance, the EGR rate (splitter 1 in Figure 3) is kept at 0.6, and the CO2 utilization rate of MCFC is kept at 0.85. In order to maintain the turbine inlet temperature constant, the SEGR rate is changed from 0.4 to 0.7, which raises the mass flow of air 1 as the sweep gas and raises the gas turbine’s c O 2 , as illustrated in Figure 11. With the rise of the mass flow of the air into the combustor, the c CO 2 of GT exhaust gas decreases slightly, as shown in Figure 11. The selective CO2 transfer rate is increased by raising the area of the membrane. Obviously, when the EGR is maintained constant, and the selective CO2 transfer rate is raised, the c CO 2 of gas turbine exhaust gas rises and the c O 2 decreases, as shown in Figure 11.
As was indicated before, as the SEGR rate is raised, the mass flow of CO2 fed to the MCFC cathode decreases, which lowers the system’s overall CO2 capture rate. When the SEGR rate is changed, the system’s thermal efficiency is mainly influenced by the MCFC output power, which is determined by the MCFC cell voltage. When the SEGR rate is increased from 0.4 to 0.7, the cell voltage is determined by the c O 2 , as the c CO 2 is not influenced significantly. Therefore, the system’s thermal efficiency rises with the increase in c O 2 when the SEGR rate is increased from 0.4 to 0.7. Because the c O 2 is plainly less than the c CO 2 , as shown in Figure 12, the system’s thermal efficiency decreases with the drop of c O 2 when the SEGR rate is maintained at 0.4 or 0.5, and the selective CO2 transfer rate is raised. Because the c CO 2 is visibly less than the c O 2 when the SEGR rate is held constant at 0.7 and the selective CO2 transfer rate is raised, as illustrated in Figure 12, the system thermal efficiency increases as the c CO 2 rises.

5.3. Comparison of Different Systems

The MCFC size, current density and OCCR were held constant to compare the overall system thermal efficiencies of the new systems (Case 1 and Case 2) to the reference system. The operating conditions and results are listed in Table 5. In order to ensure the operation of MCFC, there must be enough O2 mass flow in the GT exhaust gas that fed into the MCFC cathode, which makes that the recirculation rate of the EGR system is not over 0.5 and that of the SEGR system is not over 0.7. With the same total CO2 capture rate of 88.16%, Table 5 demonstrates that Cases 1 and 2 have thermal efficiencies that are 1.81% and 2.89% greater than the reference system, respectively. In reference [14], NGCC integrated with MCFC using turbine exhaust gas recirculation is studied. With 60% of exhaust gas at the turbine outlet put back into the air at the compressor inlet, the c CO 2 at the MCFC cathode input is raised to 5.71% mol, which can validate the correctness of the results obtained in this paper. It can also be seen that, compared with the recirculation of the turbine exhaust gas in reference [14], the recirculation of the MCFC cathode exhaust gas in this paper raises the c CO 2 at the MCFC cathode inlet higher.

6. Economic and Environment Performance Evaluation

This section compares the environmental and economic performances of new systems to those of the reference system. The cost of energy (COE) and the cost of CO2 avoided (CCA) are the main economic factors considered when comparing different CO2 collection techniques. The COE is calculated with the IEA methodology [29,30], which sets the net present value (NPV) of the power plant to zero. This can be achieved by varying the per kWh price until the revenues balance all the expenses over the whole lifetime of the power plant. The CCA, USD/ ton CO 2 , is described as follows:
CCA = 1000 ( C O E CO 2 , CAP C O E REF ) E C O 2 REF E C O 2 CO 2 , CAP ,
Table 6 displays a few significant presumptions for the COE evaluation. Table 7 presents the comparing findings. The price per square foot for MCFC is fixed at 1891 USD/m2 [31].
The COE values of the new systems are substantially higher when compared to those of other systems, as shown in Table 7. Compared with the CCA of the traditional mono-ethanol ammine (MEA) method for CO2 capture [34], the CCA values for the new systems in this paper are higher. Due to the high expense of MCFC, this viewpoint is short-term. The cost of MCFC will decrease as MCFC technology develops [35].
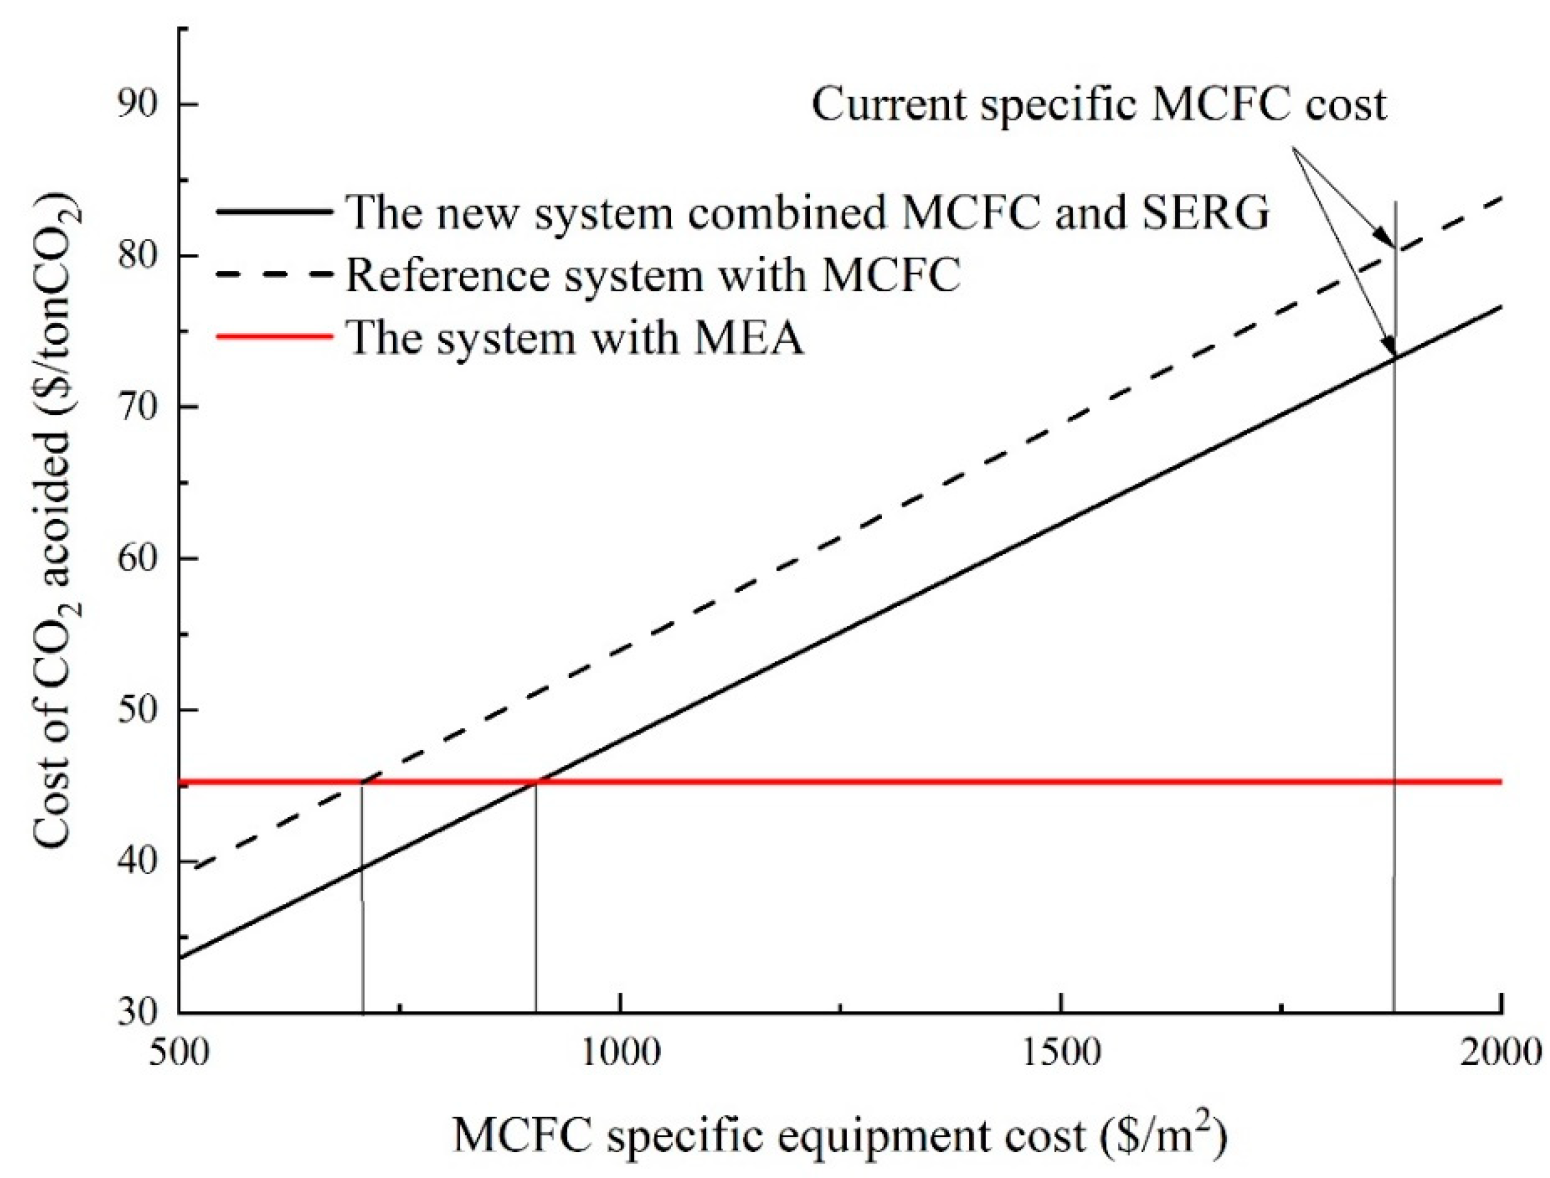
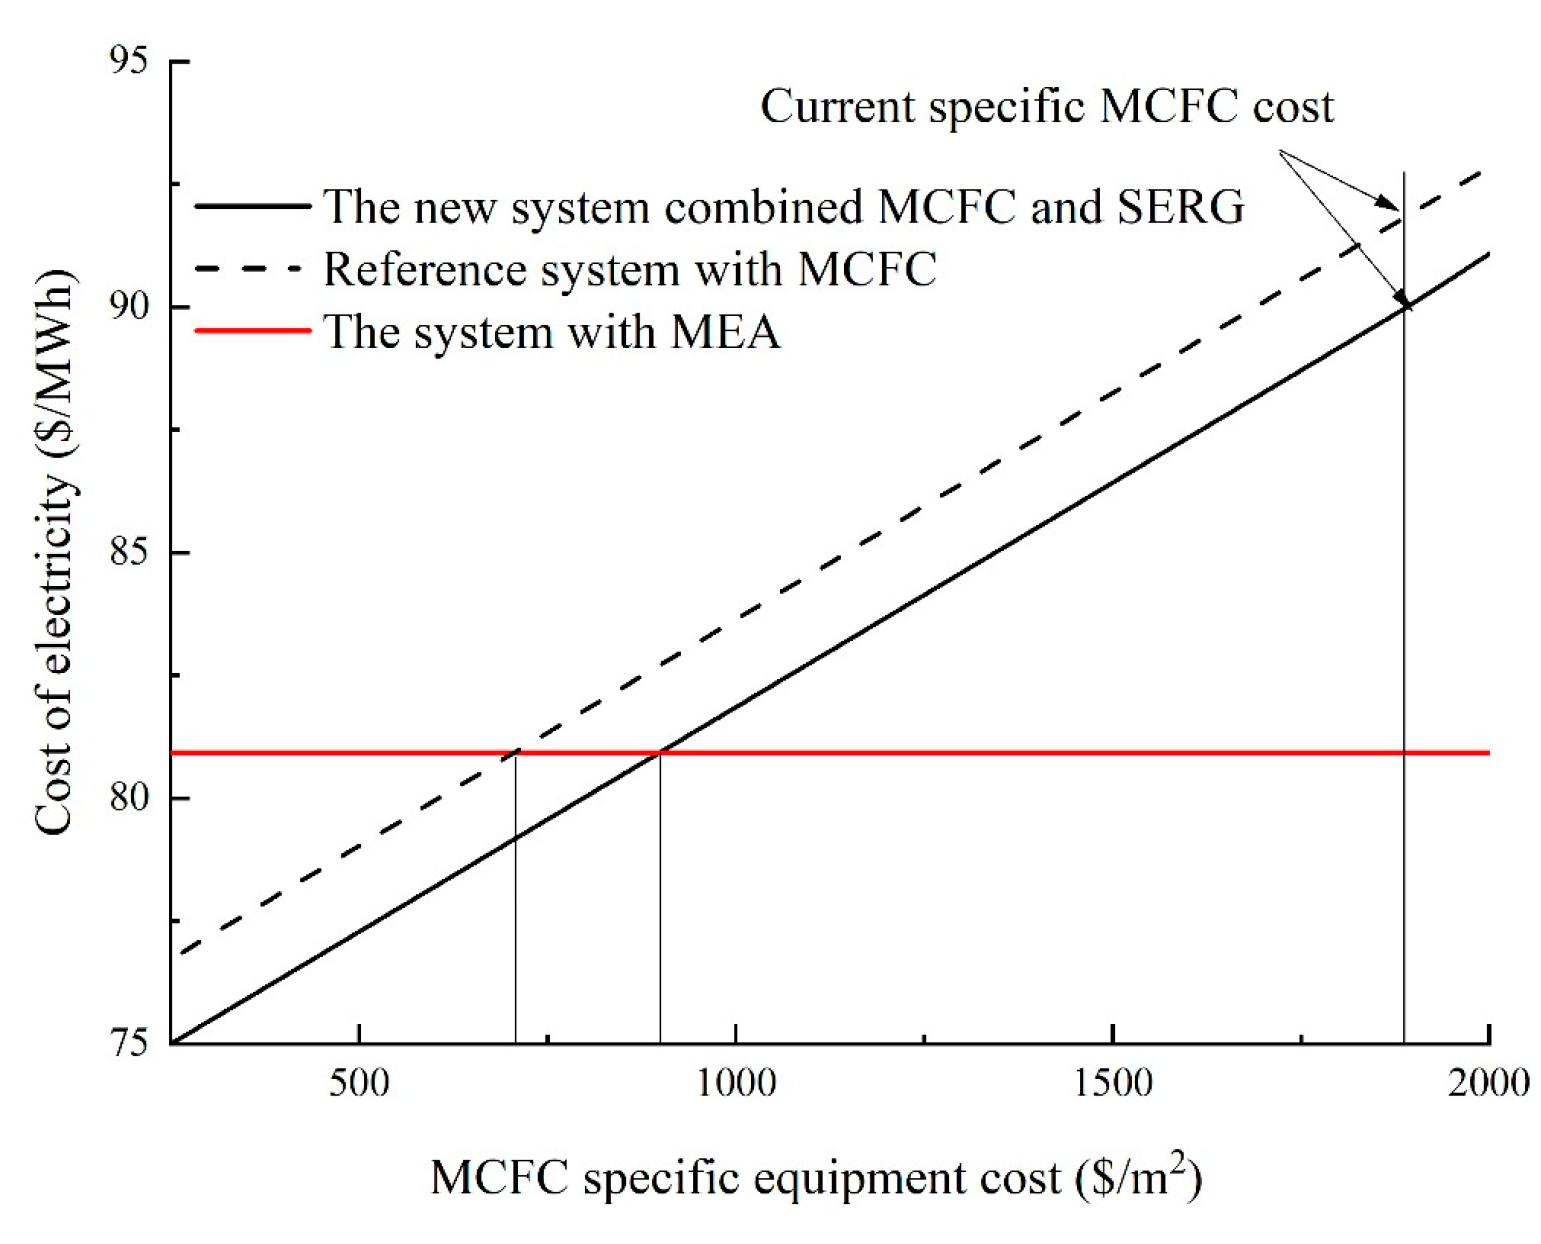
According to Figure 13, the cost of CO2 avoided by the system with CO2 capture by MCFC will be equal to the CCA of the GSCC system with CO2 capture by the MEA technique if the MCFC cost is reduced from the present 1891 USD/m2 to 707.6 USD/m2. The cost of CO2 saved in Case 2 will be equal to the CCA of the system with the MEA technique for CO2 capture if the MCFC cost is reduced from the present 1891 USD/m2 to 904.4 USD/m2 [33]. Figure 14 demonstrates that the COE for the system with MCFC-based CO2 capture will be equal to that of the system using the MEA technique for CO2 capture when the MCFC cost is reduced from the present 1891 USD/m2 to 705.7 USD/m2. When the MCFC cost is reduced from the current 1891 USD/m2 to 897.6 USD/m2, the COE for the system with MCFC and SEGR for CO2 collection will be equivalent to that of the system with the MEA method for CO2 capture [33]. As a result, the cost of the MCFC-specific equipment strongly influences whether the new system’s COE or CCA will drop.
7. Conclusions

This study proposes new CO2 recovery integrated gas turbine, MCFC, EGR and SEGR systems. Compared to the GSCC system coupled with MCFC and CO2 collection without EGR, the new technologies are more effective (the reference system). The thermal efficiency of the GSCC system combined with MCFC and CO2 collection with EGR is 55.64% when the OCCR is 88.16%, and it is 56.08% when the system is also integrated with EGR and SEGR. The thermal efficiencies of new systems are higher compared with the reference system. The thermal efficiency of the new GSCC system integrated with MCFC and CO2 capture with EGR is 0.3% lower than that of the original GSCC system without CO2 capture, and the thermal efficiency of the new GSCC system integrated with MCFC and CO2 capture with EGR and SEGR is 0.14% higher than that of the original GSCC system without CO2 capture.
  • For case 1, when the EGR is raised from 0 to 0.5, the c CO 2 of the GT exhaust is increased from 3.84% to 7.48%, and the system thermal efficiency is increased; when the U CO 2 of MCFC is raised from 0.45 to 0.95, the overall CO2 capture rate of the system is increased from 51.6% to 97.3%;
  • For case 2, when the EGR is raised and SEGR is kept constant, the overall capture rate is reduced, and the system thermal efficiency is firstly raised and then reduced. When the EGR is maintained constant and SEGR is raised, the overall capture rate is reduced, and the system thermal efficiency is raised;
Due to the high cost of MCFC at the moment, the new system does not offer obvious advantages in terms of technical or economic performance. The benefit of the MCFC-based CO2 capture system and upcoming technological advancements will assist in improving its economic performance.

Author Contributions

Conceptualization, J.B. and L.D.; methodology, J.B.; software, J.B.; validation, J.B. and L.D.; formal analysis, J.B.; investigation, J.B.; resources, J.B.; data curation, J.B.; writing—original draft preparation, J.B.; writing—review and editing, L.D.; visualization, J.B.; supervision, L.D.; project administration, L.D. and Y.Y.; funding acquisition, Y.Y. All authors have read and agreed to the published version of the manuscript.

Funding

This research was funded by the National Nature Science Foundation Project of China (No. 52076078); and the Science Fund for Creative Research Groups of the National Natural Science Foundation of China (No. 51821004).

Conflicts of Interest

The authors declare no conflict of interest.

Nomenclature

Aarea, m2
ACair compressor
A c cell active area, m2
ASUair separation unit
c CO 2 CO2 concentration
c O 2 O2 concentration
CCAthe cost of CO2 avoided, USD/   ton CO 2
COEthe cost of electricity, USD/MWh
D eff the effective diffusivity, m2/s
ECO2the CO2 specific emissions, g/kWh
E Nerst the ideal reversible voltage, V
EPCthe engineering, procurement and construction cost, M$
FFaraday constant, 96,487 C/mol
Δ G Gibbs free energy, kJ/kg
GSCCGas–steam combined cycle
GTgas turbine
HRSGheat recovery steam generator
ICthe indirect cost, M$
IDCthe interest during construction, M$
INSTthe installation cost, M$
jcurrent density, A/m2
j 0 exchange current density, A/m2
j 0 0 standard exchange current density, A/m2
L H V low heat value of fuel, kJ/kg
m CO 2 , inlet the CO2 mass flow rate in cathode inlet, kg/s
m CO 2 , outlet the CO2 mass flow rate in cathode outlet, kg/s
m fuel   after   pre reformer the fuel mass flow after the pre-reformer
m fuel , inlet the fuel mass flow rate in anode inlet, kg/s
m fuel , outlet the fuel mass flow rate in anode outlet, kg/s
m MCFC ˙ mass flow rate of MCFC input fuel, kg/s
m GT ˙ mass flow rate of gas turbine input fuel, kg/s
Nthe number of single cell
nthe number of electrons released in the dissociation of H2 molecule
OCCthe owner’s cost and contingencies, M$
OCCROverall CO2 capture rate, -
p i the partial pressure of the species i, MPa
Q i permeability of the species i, kmol/(m2s·MPa)
Rmolar gas constant, J/(mol K)
R ohm cell resistance of ohmic polarization, Ω · m 2
SOFCsolid oxide fuel cell
STsteam turbine
TDPCthe total direct plant cost, M$
TECthe total equipment cost, M$
TPCthe total plant cost, M$
TPIthe total plant investment, M$
U CO 2 CO2 utilization rate
U fuel fuel utilization rate
V cell cell voltage, V
zthe mole flow of reacted electrons, mole/s
Greek symbols
η thermal efficiency, -
η act activation voltage loss, V
η DC AC Conversion efficiency of DC (direct current) into AC (alternative current)
η ohm ohmic voltage loss, V
η conc concentration voltage loss, V
τ thickness, mm
θ H 2 the H2 mass fraction of the fuel mass flow after the pre-reformer
σ electrical conductivity, S/m−1
Subscripts
actactivation
ananode
cacathode
concconcentration
elecelectrolyte
ffeed side
ispecies i
ohmohmic
ppermeate side
TPBthree-phase boundary

References

  1. Shahbaz, M.; Raghutla, C.; Song, M.; Zameer, X.; Jiao, Z. Public-private partnerships investment in energy as new determinant of CO2 emissions: The role of technological innovations in China. Energy Econ. 2020, 86, 104664. [Google Scholar] [CrossRef]
  2. NDRC. Notice of Launching the Third Batch of National Low Carbon Cities Pilot Projects. 2019. Available online: http://www.gov.cn/xinwen/2017-01/24/content_5162933.htm (accessed on 5 May 2022).
  3. Zhao, X.; Yin, H.; Zhao, Y. Impact of environmental regulations on the efficiency and CO2 emissions of power plants in China. Appl. Energy 2015, 149, 238–247. [Google Scholar] [CrossRef]
  4. Joe, H.; Thierry, S.; Dominique, O.; Cuif-Sjostrand, M.; Zoughaib, A.; Molière, M. Exhaust gas recirculation applied to single-shaft gas turbines: An energy and exergy approach. Energy 2022, 238, 121656. [Google Scholar]
  5. Baker, R.W.; Freeman, B.; Kniep, J.; Wei, X.; Merkel, T. CO2 capture from natural gas power plants using selective exhaust gas recycle membrane designs. Int. J. Greenh. Gas Control 2017, 66, 35–47. [Google Scholar] [CrossRef]
  6. Campanari, S.; Manzolini, G.; Chiesa, P. Using MCFC for high efficiency CO2 capture from natural gas combined cycles: Comparison of internal and external reforming. Appl. Energy 2013, 112, 772–783. [Google Scholar] [CrossRef]
  7. Duan, L.; Zhu, J.; Yue, L.; Yang, Y. Study on a gas-steam combined cycle system with CO2 capture by integrating molten carbonate fuel cell. Energy 2014, 74, 417–427. [Google Scholar] [CrossRef]
  8. Milewski, J.; Bujalski, W.; Woowicz, M.; Futyma, K.; Bernat, R. Experimental Investigation of CO2 Separation from Lignite Flue Gases by 100 cm2 Single Molten Carbonate Fuel Cell. Appl. Mech. Mater. 2013, 376, 299–303. [Google Scholar] [CrossRef]
  9. Wang, F.; Deng, S.; Zhang, H.; Wang, J.; Zhao, J.; Miao, H.; Yuan, J.; Yan, J. A comprehensive review on high-temperature fuel cells with carbon capture. Appl. Energy 2020, 275, 115342. [Google Scholar] [CrossRef]
  10. Li, H.; Ditaranto, M.; Berstad, D. Technologies for increasing CO2 concentration in exhaust gas from natural gas-fired power production with post-combustion, amine-based CO2 capture. Energy 2011, 36, 1124–1133. [Google Scholar] [CrossRef]
  11. Li, H.; Haugen, G.; Ditaranto, M.; Berstad, D.; Jordal, K. Impacts of exhaust gas recirculation (EGR) on the natural gas combined cycle integrated with chemical absorption CO2 capture technology. Energy Procedia 2011, 4, 1411–1418. [Google Scholar] [CrossRef]
  12. Pan, M.; Aziz, F.; Li, B.; Perry, S.; Zhang, N.; Bulatov, I.; Smith, R. Application of optimal design methodologies in retrofitting natural gas combined cycle power plants with CO2 capture. Appl. Energy 2016, 161, 95–706. [Google Scholar] [CrossRef]
  13. Lee, W.S.; Kang, J.H.; Lee, J.C.; Lee, C.H. Enhancement of energy efficiency by exhaust gas recirculation with oxygen-rich combustion in a natural gas combined cycle with a carbon capture process. Energy 2020, 200, 117586. [Google Scholar] [CrossRef]
  14. Carapellucci, R.; Saia, R.; Giordano, L. Study of gas-steam combined cycle power plants integrated with MCFC for carbon dioxide capture. Energy Procedia 2014, 45, 1155–1164. [Google Scholar] [CrossRef]
  15. Zhao, L.; Menzer, R.; Riensche, E.; Blum, L.; Stolten, D. Concepts and investment cost analyses of multi-stage membrane systems used in post-combustion processes. Energy Procedia 2009, 1, 269–278. [Google Scholar] [CrossRef]
  16. Merkel, T.C.; Lin, H.; Wei, X.; Baker, R. Power plant post-combustion carbon dioxide capture: An opportunity for membranes. J. Membr. Sci. 2010, 359, 126–139. [Google Scholar] [CrossRef]
  17. Merkel, T.C.; Zhou, M.; Baker, R.W. Carbon dioxide capture with membranes at an IGCC power plant. J. Membr. Sci. 2012, 389, 441–450. [Google Scholar] [CrossRef]
  18. Franz, J.; Schiebahn, S.; Zhao, L.; Riensche, E.; Scherer, V.; Stolten, D. Investigating the influence of sweep gas on CO2/N2 membranes for post-combustion capture. Int. J. Greenh. Gas Control 2013, 13, 180–190. [Google Scholar] [CrossRef]
  19. Herraiz, L.; Fernández, E.S.; Palfi, E.; Lucquiaud, M. Selective exhaust gas recirculation in combined cycle gas turbine power plants with post-combustion CO2 capture. Int. J. Greenh. Gas Control 2018, 71, 303–321. [Google Scholar] [CrossRef]
  20. Gatti, M.; Martelli, E.; Di Bona, D.; Gabba, M.; Scaccabarozzi, R.; Spinelli, M.; Viganò, F.; Consonni, S. Preliminary Performance and Cost Evaluation of Four Alternative Technologies for Post-Combustion CO2 Capture in Natural Gas-Fired Power Plants. Energies 2020, 13, 543. [Google Scholar] [CrossRef]
  21. Bian, J.; Zhang, H.; Duan, L.; Desideri, U.; Yang, Y. Study of an integrated gas turbine -Molten carbonate fuel cell -organic Rankine cycle system with CO2 recovery. Appl. Energy 2022, 323, 119620. [Google Scholar] [CrossRef]
  22. Duan, L.; Sun, S.; Yue, L.; Qu, W.; Yang, Y. Study on a new IGCC (Integrated Gasification Combined Cycle) system with CO2 capture by integrating MCFC (Molten Carbonate Fuel Cell). Energy 2015, 87, 490–503. [Google Scholar] [CrossRef]
  23. Islam, M.W. Effect of different gasifying agents (steam, H2O2, oxygen, CO2, and air) on gasification parameters. Int. J. Hydrogen Energy 2020, 45, 31760–31774. [Google Scholar] [CrossRef]
  24. Bian, J.; Duan, L.; Lei, J.; Yang, Y. Study on the Entropy Generation Distribution Characteristics of Molten Carbonate Fuel Cell System under Different CO2 Enrichment Conditions. Energies 2020, 13, 5778. [Google Scholar] [CrossRef]
  25. Hayre, R. Fuel Cell Fundamentals; John Wiley & Sons: Hoboken, NJ, USA, 2006. [Google Scholar]
  26. Arpornwichanop, A.; Saebea, D.; Patcharavorachot, Y.; Assabumrungrat, S. Analysis of a pressurized solid oxide fuel cell-gas turbine hybrid power system with cathode gas recirculation. Int. J. Hydrogen Energy 2013, 38, 4748–4759. [Google Scholar]
  27. Younas, M.; Tahir, T.; Wu, C.; Sohaib, Q.; Farrukh, S.; Muhammad, A.; Rezakazemi, M.; Li, J. Post-combustion CO2 capture with sweep gas in thin film composite (TFC) hollow fiber membrane (HFM) contactor. J. CO2 Util. 2020, 40, 101266. [Google Scholar] [CrossRef]
  28. Ali, F.; Sarwar, A.; Bakhsh, F.I.; Ahmad, S.; Shah, A.A.; Ahmed, H. Parameter extraction of photovoltaic models using atomic orbital search algorithm on a decent basis for novel accurate RMSE calculation. Energy Convers. Manag. 2023, 277, 116613. [Google Scholar] [CrossRef]
  29. IEA. Leading Options for the Capture of CO2 Emissions at Power Stations; IEA: Paris, France, February 2000; pp. 21–34, PH3/14. [Google Scholar]
  30. IEA. Improvement in Power Generation with Post-Combustion Capture of CO2; IEA: Paris, France, November 2004; pp. 82–121, PH4/33. [Google Scholar]
  31. Akrami, E.; Ameri, M.; Rocco, M.V. Conceptual Design, exergoeconomic analysis and multi-objective optimization for a novel Integration of biomass-fueled power plant with MCFC-cryogenic CO2 separation unit for low-carbon power production. Energy 2021, 227, 120511. [Google Scholar] [CrossRef]
  32. Ramasubramanian, K.; Verweij, H.; Winston Ho, W.S. Membrane processes for carbon capture from coal-fired power plant flue gas: A modeling and cost study. J. Membr. Sci. 2012, 421, 299–310. [Google Scholar] [CrossRef]
  33. Campanari, S.; Chiesa, P.; Manzolini, G.; Bedogni, S. Economic analysis of CO2 capture from natural gas combined cycles using molten carbonate fuel cells. Appl. Energy 2014, 130, 562–573. [Google Scholar] [CrossRef]
  34. Leto, L.; Dispenza, C.; Moreno, A.; Calabro, A. Simulation model of a molten carbonate fuel cell–microturbine hybrid system. Appl. Therm. Eng. 2011, 31, 1263–1271. [Google Scholar] [CrossRef]
  35. De Servi, C.; Tizzanini, A.; Campanari, S.; Pietra, C. Enhancement of the electrical efficiency of commercial fuel cell units by means of an organic Rankine cycle: A case study. ASME J. Eng. Gas Turbine Power Power 2013, 135, 42309. [Google Scholar] [CrossRef]
Figure 1. The simplified flowchart of the GSCC system coupled with MCFC and CO2 capture without EGR.
Energies 16 03511 g001
Figure 2. The simplified flowchart of the GSCC system integrated with MCFC and CO2 capture with EGR.
Energies 16 03511 g002
Figure 3. The simplified flowchart of the GSCC system integrated MCFC, EGR and SEGR with CO2 capture.
Energies 16 03511 g003
Figure 4. Test facility of MCFC single cell.
Energies 16 03511 g004
Figure 5. Experimental and simulation voltages under different concentrations of CO2.
Energies 16 03511 g005
Figure 6. Impact of EGR rate (splitter 1 as shown in Figure 2) on the OCCR and the c CO 2 of the GT exhaust of Case 1.
Energies 16 03511 g006
Figure 7. Impact of U CO 2 of MCFC on the OCCR and the c CO 2 of the GT exhaust of Case 1.
Energies 16 03511 g007
Figure 8. Impact of EGR rate (splitter 1 as shown in Figure 2) and U CO 2 of MCFC on the system thermal efficiency of Case 1.
Energies 16 03511 g008
Figure 9. Impact of EGR rate (splitter 1, as in Figure 3) and selective CO2 transfer rate on the c CO 2 and c O 2 of the GT exhaust gas of Case 2.
Energies 16 03511 g009
Figure 10. Impact of EGR rate (splitter 1, as shown in Figure 3) and selective CO2 transfer rate on the OCCR and the system thermal efficiency of Case 2.
Energies 16 03511 g010
Figure 11. Impact of SEGR rate (splitter 2 as shown in Figure 3) and selective CO2 transfer rate on the c CO 2 and c O 2 of the GT exhaust gas of Case 2.
Energies 16 03511 g011
Figure 12. Impact of SEGR rate (splitter 2 in Figure 3) and selective CO2 transfer rate on the OCCR and the system thermal efficiency of Case 2.
Energies 16 03511 g012
Figure 13. Cost-specific equipment study for CCA with MCFC.
Energies 16 03511 g013
Figure 14. Analysis of COE’s sensitivity to the cost of MCFC equipment.
Energies 16 03511 g014
Table 1. Main simulation parameters of new systems.
ComponentsParametersValue
Ambient conditions [7]298.15 K, 1.01 atm
Compositions of air [7]N2 79%, O2 21%
Generator efficiency [7]99%
Gas turbineFuel compositionCH4 100%
Lower heating value (LHV) (kJ/kg) [7]50,030
Mass flow of GT fuel (kg/s)15
Ratio of pressure16
Inlet temperature of turbine (K)1561
MembranesCO2 permeance (gpu) [17]1000
CO2/N2 selectivity (-) [17]50
HRSGSteam pressure of LP/MP/HP (MPa) [7]0.39/3.6/17.6
Mechanical efficiency of turbine [7]99%
Isentropic efficiency of LP/MP/HP [7]92%/91%/90%
Air separation unitOperating pressure of AC (MPa) [22]0.6
AC isentropic efficiency [22]86%
CO2 compressionCompression stage number [7]3
Outlet pressure (atm) [7]80
Outlet temperature (K) [7]303.15
Table 2. Parameters of MCFC.
Parameters Value
Fuel CH4 100%
Fuel mass flow (kg/s) 3.75
Fuel after the pre-reformer (mass fraction) H2 1.51% CO2 85.7% H2O 12.79%
Fuel mass flow after the pre-reformer (kg/s) 102.7
H2 LHV (kJ/kg) [23] 121,000
Current density (A/m2) [7] 1500
Area (m2) 102,245
Steam-to-carbon ratio [7] 3.5
Fuel utilization rate 0.85
Operation temperature (K) [22] 923.15
η DC AC [22] 95%
Thickness (mm) [24]Anode0.6
Cathode0.6
Electrolyte1
Standard exchange current (A/m2) [24]Anode50
Cathode2
Active surface area (m2/m3) [24]Anode2.7 × 105
Cathode3.0 × 105
Electrical conductivity (S/m−1) [24]Anode100
Cathode100
Electrolyte138.6
Effective diffusivity (m2/s) [24]Anode3.97 × 10−6
Cathode1.89 × 10−6
Table 3. Detailed stream data of Case 1.
TemperaturePressureMole FlowMole Fraction (-)
(K)(MPa)(kmol/s)CH4COH2CO2N2O2H2O
1298.150.1020.9351------
2551.521.6210.9351------
3298.150.10212.5----0.790.21-
4300.730.10219.44---0.0290.8130.158-
5693.321.62119.44---0.0290.8130.158-
61727.31.62120.37---0.0730.7760.0590.092
7888.110.10225---0.0750.790.060.075
8888.110.10212.5---0.0750.790.060.075
9923.150.10212.5---0.0750.790.060.075
10923.150.10211.31---0.0120.8730.0320.083
11380.150.10211.31---0.0120.8730.0320.083
12888.110.10212.5---0.0750.790.060.075
13380.150.10212.5---0.0750.790.060.075
14303.150.10212.5---0.0750.790.060.075
15303.150.1020.935------1
16303.150.10211.57---0.0810.8540.065-
17303.150.1026.94---0.0810.8540.065-
18303.150.1024.626---0.0810.8540.065-
19791.031.6214.626---0.0810.8540.065-
20298.150.1020.2341------
21875.830.1023.3410.070.0470.040.593--0.25
22772.180.1023.4980.0440.060.1140.572--0.21
23923.150.1023.107-0.050.0440.637--0.269
24923.150.1024.603-0.050.0440.637--0.269
25923.150.1021.496-0.050.0440.637--0.269
26298.150.1020.355----0.790.21-
27305.150.1050.241----0.990.01-
28305.150.1050.072-----1-
291385.890.1021.498---0.687--0.313
30380.150.1021.498---0.687--0.313
31303.150.1021.498---0.687--0.313
32303.150.1020.468------1
33303.150.1021.031---1---
34303.158.1061.031---1---
Table 4. Data on the streams from Case 2 in detail.
TemperaturePressureMole FlowMole Fraction (-)
(K)(MPa)(kmol/s)CH4COH2CO2N2O2H2O
1298.150.1020.9351------
2551.521.6210.9351------
3298.150.10217.99----0.790.21-
4298.150.10218.83---0.0460.7570.197-
5298.940.10221.19---0.0530.760.187-
6694.361.62121.19---0.0530.760.187-
71614.61.62122.12---0.0930.7280.0940.085
8894.240.10223.7---0.0930.7330.0950.079
9894.240.1029.478---0.0930.7330.0950.079
10923.150.1029.478---0.0930.7330.0950.079
11923.150.1028.286---0.0110.8380.0610.09
12380.150.1028.286---0.0110.8380.0610.09
13894.240.10214.22---0.0930.7330.0950.079
14380.150.10214.22---0.0930.7330.0950.079
15303.150.10214.22---0.0930.7330.0950.079
16303.150.1021.122------1
17303.150.10213.1---0.1010.7960.103-
18303.150.1029.167---0.1010.7960.103-
19313.150.119.167---0.1010.7960.103-
20313.150.118.32---0.0060.8730.121-
21303.150.1023.929---0.1010.7960.103-
22303.150.1022.357---0.1010.7960.103-
23303.150.1021.571---0.1010.7960.103-
24784.181.6211.571---0.1010.7960.103-
25298.150.1020.2341------
26875.830.1023.3410.070.0470.0410.593--0.249
27772.180.1023.4980.0440.060.1140.574--0.208
28923.150.1024.603-0.050.0440.637--0.269
29923.150.1023.107-0.050.0440.637--0.269
30923.150.1021.496-0.050.0440.637--0.269
31298.150.1020.355----0.790.21-
32305.150.1050.241----0.9950.005-
33305.150.1050.072-----1-
341385.780.1021.498---0.687--0.313
35380.150.1021.498---0.687--0.313
36303.150.1021.498---0.687--0.313
37303.150.1020.468------1
38303.150.1021.031---1---
39303.158.1061.031---1---
Table 5. Operating conditions and thermal efficiency of the investigated systems.
The Reference SystemCase 1Case 2
EGR rate (splitter 1 in Figure 2 or Figure 3)-0.50.6
SEGR rate (splitter 2 in Figure 3)--0.7
MCFC CO2 utilization rate0.850.850.9
Selective CO2 transfer rate--0.944
Overall CO2 capture rate (%)88.1688.1688.16
c CO 2 of GT exhaust (%mol)3.847.489.32
Cell voltage of MCFC (V)0.590.660.72
Cell current density (A/m2)150015001500
Cell area (m2)102,245102,245102,245
CO2 purity (%)99.899.899.8
Overall system thermal efficiency (%)54.7855.6456.08
Table 6. Staple assumptions for COE evaluation.
ParametersValue
Discount rate (%) [7]8
Lifespan (Year) [7]25
Working hours of the first year (h) [7]5750
Rest of lifetime operating hours (h) [7]7500
Membrane replacement cost (USD/m2) [5]15
Membrane life (Year) [32]4
Costs   of   fuel   ( USD / GJ LHV ) [33]7.085
Table 7. Assessment of economic performance of different systems. (MCFC specific cost = 1891 USD/m2).
ParametersGSCC System without CO2 Capture [7]The Reference SystemCase 1Case 2
Power (MW)
GT output285.85285.85275.01277.12
ST output133.94156.48165.92161.68
MCFC output-90.5101.5110.49
CO2 compressor consumption-17.7617.7617.76
ASU consumption-2.242.242.24
Blower consumption---2.73
Net power419.79512.83522.43526.56
Overall thermal efficiency (%)55.9454.7855.6456.08
Economic parameters
Plant component TEC (M$)
GT62.1562.1562.1562.15
ST25.2628.5229.8529.64
MCFC-193.41193.41193.41
HRSG27.9340.7341.2639.3
Membrane---18.47
Heat rejection30.1945.8646.6244.48
BOP0.2316.1216.5317.55
ASU-5.825.825.82
CO2 compressor-16.7816.7816.78
TEC (M$)145.76409.39412.42427.6
EPC (M$)279.16812.82828.62850.22
TPC (M$)321.04934.74952.91977.75
IDC (M$)22.4765.4366.768.44
TPI (M$)343.511000.181007.311046.2
Specific total plant cost (USD/kW)764.761822.7118021856.86
COE components (USD/MWh)
Capital11.4327.3227.2127.77
Fixed O&M4.645.135.095.25
Consumables0.716.196.076.48
Fuel44.0846.5645.0844.20
COE (USD/MWh)60.8685.283.4583.7
CO2-specific emission (g/kWh)352.3844.7443.3042.19
Cost   of   CO 2   avoided   ( USD / ton CO 2 ) -79.1273.0873.63
Disclaimer/Publisher’s Note: The statements, opinions and data contained in all publications are solely those of the individual author(s) and contributor(s) and not of MDPI and/or the editor(s). MDPI and/or the editor(s) disclaim responsibility for any injury to people or property resulting from any ideas, methods, instructions or products referred to in the content.