Abstract
The high-rate discharging performance of lithium titanate batteries is a crucial aspect of their functionality. Under high-power demands, the discharge rate, which is defined as the ratio of discharge current to the maximum capacity, can exceed 50 C or higher. This study investigates the evolution of incremental capacity (IC) curves and frequency response characteristic of 2 Ah lithium titanate batteries subjected to aging cycles at 50 C. The results provide a new indicator to assess the fading of the state of health (SOH) of lithium titanate batteries during ultra-high-rate discharge cycles.
1. Introduction
The discharge current rate is a crucial property of lithium-ion batteries (LIBs), reflecting its power performance. The current rate is expressed as a multiple of a battery’s maximum capacity in units of C. For instance, a 2 C current rate for a 1 Ah capacity battery implies that the battery is being discharged (or charged) at 2 A. High-power batteries are necessary in applications such as frequency regulation in smart grids, sparkers used in seismic exploration, or to deliver constant, high-power outputs for short periods of time.
For almost three decades, graphite has been the predominant anode material in lithium-ion batteries (LIBs). During the charging process of a graphite-based anode LIB, Li-ions intercalate into the graphene sheets, leading to the formation of LiC6, which has a theoretical capacity of 372 mAh/g at a potential of approximately 0.1 V versus Li+/Li [1]. Due to the low intercalation potential, it is widely believed that graphite-based anode is the main culprit that hinders high-rate performance of LIBs because of the Li dendrite formation problem. Lithium titanium oxide (LTO), commonly Li4Ti5O12, is a highly promising alternative to carbon anodes for high-power batteries.
The intercalation/deintercalation potential of LTO is approximately 1.55 V [2,3], which is significantly higher than the potentials of lithium plating and solid electrolyte interphase (SEI) film. This results in a significantly improved safety performance of the LTO anode. Furthermore, the LTO material exhibits zero-strain properties, providing better mechanical performance compared to graphite-based anodes. As a result, the LTO battery demonstrates promising advantages in high-rate discharge, cycle life [4], and temperature stability [5]. Table 1 compares the electrochemical and mechanical properties of graphite and LTO [6,7,8].

Table 1.
Electrochemical and mechanical properties of graphite and LTO.
The research on the state of health (SOH) estimation and aging mechanisms of lithium-ion batteries (LIBs) has been a topic of significant interest for many years. For graphite-based LIBs, the main aging mechanisms include the growth of the solid electrolyte interphase (SEI) film [9], lithium plating/dendrites [10], overcharging/discharging [11], and calendar aging. These mechanisms work in concert, making it challenging to analyze the aging process of LIBs. In general, the two main aging mechanisms are the loss of active material (LAM) and the loss of lithium inventory (LLI) [12].
The aging mechanisms of lithium-ion batteries (LIBs) using LTO as the anode material differ significantly from those of graphite-based LIBs. Unlike the latter, the LTO anode does not have SEI film formation or lithium plating, and its zero-strain property contributes to its improved mechanical performance. However, compared to graphite-based anode LIBs with the same cathode material, the platform voltage of LTO batteries is lower by about 1.4 V and its theoretical specific capacity is also much lower than graphite. These factors make LTO batteries less ideal for commercial electric vehicles. Currently, the aging process and SOH estimation of LTO batteries are still relatively under-researched areas.
The studies focused on the estimation of SOH of lithium-Ion batteries (LIBs) with lithium titanium oxide anode are scarce, and mainly concentrate on its high power performance, with a current rate of 10 C or lower. A study conducted by Hang et al. [13] employed electrochemical impedance spectroscopy (EIS) to examine LTO/LiCoO2 (LCO) batteries at various depth of discharge (DOD) and temperature levels, and developed an electrical equivalent circuit model (ECM) consisting of the anode and cathode to describe the resistance. They found that the capacity fade of this LIB due to cycling was primarily caused by the increase of interfacial resistance and the decline of the capacity of the LCO cathode. The study also reported that the capacity fade of the LTO batteries underwent two stages, with a sudden increase in capacity fade rate after 1500 cycles.
Han et al. [14] conducted aging experiments on commercial LIBs, which were composed of five different electrode material combinations including LTO/NMC batteries, by charging at 1/3 C and discharging at 1.5 C at temperatures of 45 °C and 5 °C. After 1020 cycles, they found that the capacity fade of LTO batteries was subtle, and there was no detectable increase in resistance or loss of active material. The IC curves indicated that the loss was primarily due to the degradation of the cathode material. On the other hand, the capacity fade of C/LFP batteries was due to the loss of lithium inventory and active material of the anode. The capacity fade of C/LMO batteries was caused by an increase in resistance and loss of active material. In their subsequent study [15], they performed cycles by charging at 3 C and discharging at 2 C at 55 °C. They observed the two-stage fading reported by Hang et al. [13] in all the batteries, where the capacity fade rate in the second stage was 2–3 times higher than that in the first stage. This phenomenon is attributed to the fact that the loss rate of capacity for the cathode is higher than that for the anode. Typically, there is more cathode material than anode material in a LIB. During stage 1, the capacity fade is primarily caused by the loss of anode material. In stage 2, the fading of the cathode material begins to occur at a higher rate.
Stroe et al. [16] conducted aging experiments on two LTO/NMC batteries under different temperature and current rate conditions. The first battery was tested at 42.5 °C with a 3 C rate for charging and discharging, while the second battery was tested at 50 °C with a 1 C rate. The results showed an initial increase in capacity, which is known to occur due to the expansion of the electrode’s active area through electrochemical milling [17]. However, after the capacity dropped to 40% of its initial value, the high-power performance rapidly declined. By the end of the aging cycles, the internal resistance had increased by 400% compared to its initial value (in the case of the battery tested at a 3 C rate).
Liu et al. [18] conducted aging experiments on LTO/NMC batteries at both 5 C and 10 C current rates. Their results indicated that the capacity fade of LTO batteries is primarily attributed to the loss of cathode material. Additionally, they observed that the process of lithium plating (LLI) occurs at lower current rates during the aging process, and that high depths of discharge also accelerate the aging process.
In our previous study [19], we conducted aging cycles at a 66 C on 18 Ah LTO/LMO batteries. The fading process was rapid and consistent. After just 10 cycles, the available capacity at 66 C had decreased to 80% of the initial value. No significant changes in capacity were observed at discharging rates of 10 C or lower. It appears that only the high power property is impacted by high-rate discharging. The impedance spectroscopy (IC) curves observed during the aging cycles indicated that a greater amount of cathode material was participating in the reaction, but with a tendency towards more incomplete phase transitions. This is assumed to be a result of a deterioration in ionic mobility.
Our paper mainly includes the following work:
- Perform aging cycles at ultra-high-rate current (50 C) on 20 LTO cells;
- Obtain the evolution of IC curves during the ultra-high-rate current cycles;
- Use EIS to analyze the frequency response characteristic;
- Obtain a key indicator of high-power capacity fading of LTO cells.
2. Materials and Methods
2.1. Experiment Condition
The 2 Ah LTO/LMO cells we used in experiments are shown in Figure 1. These cells are designed to discharge at 50 C, at most. The voltage range is 1.5 to 2.8 V.
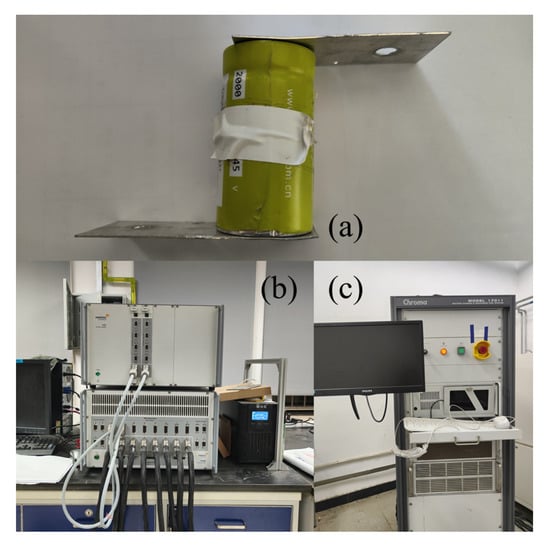
Figure 1.
Materials and experimental equipment. (a) One of the LTO cells used in this study; (b) Chroma 17011 Battery test bench; (c) Solartron electro-chemical workstation.
The aging cycle experiments described in this paper were conducted using a 12-channel, 17011 type battery test bench manufactured by Chroma Technology, Bellows Falls, VT, USA. This bench has a current range of −100 A to 100 A and a voltage range of 0–5 V, with a voltage accuracy of ±0.02%, reading +0.02% full scale, and current accuracy of ±0.05% full scale. The current ripple is less than 0.02% of the full scale. The temperature was regulated using a thermal chamber manufactured by Chongqing Yinhe Experimental Equipment, Chongqing, China. To perform high-precision experiments, such as charging response experiments and Electrochemical Impedance Spectroscopy (EIS), we utilized an electrochemical workstation manufactured by Solartron Metrology, Bognor Regis, UK.
2.2. Experiment Methods
This paper would mention following four kinds of experiments:
- Aging cycle experimentCharge the cells with a constant current of 1 C (2 A) to 2.8 V, then turn it into a constant voltage step until the current decreases to 0.05 C or lower. Rest for 30 min, then discharge the cell at 50 C (100 A) to 1.5 V. Rest for 3 h to eliminate the polarization caused by high-rate discharging. This experiment is performed at 55 °C.
- Capacity calibrating experimentCharge the cells as described in aging cycle experiment, then rest for 30 min. Discharge the cells with a constant current to 1.5 V, then rest for 3 h and start over with a different discharging current rate. In a capacity calibrating experiment, the discharging current would be 0.5, 1, 5, 10, 20, 30, 40, and 50 C. This experiment is performed at 23 °C.
- Charging response experimentDischarge the cells with a constant current of 0.1 C (0.2 A) to 1.5 V. The SOC is considered to be 0%. Charge the cells with a constant current to 2.8 V from 0% SOC, then start over with a different charging current.The charging current used in this experiment is 0.05, 0.1, 0.25, 0.5, 1, 1.5, and 2 C to obtain the charging response at different charging current rates. This experiment is performed at 23 °C.
- EISPerform EIS on each cell with a voltage excitation of 4 mV. The frequency range is 0.01 Hz–100 kHz. Each cell is tested at three various SOC: 30, 50, and 100%. This experiment is performed at 23 °C.
This paper involves 20 cells. At first, our experiments were conducted on 22 cells. The cell #3 and #19 were damaged accidentally, so they were removed from the whole experiment. The ordinal number of other cells remain the same. For each cell, the sequence of experiments performed is as follows:
- Charging response experiment;
- EIS;
- Capacity calibrating experiment;
- Aging cycle experiment, for 50 cycles;
- Capacity calibrating experiment;
- Back to Step. 1.
The capacity calibrating experiments are carried out both before and after 50 aging cycles in order to measure any capacity recovery that may occur during the charging response experiments, which take several days to complete. Cell #1 to #12 underwent 1350 cycles, while cell #13 to #22 underwent 1200 cycles due to scheduling constraints.
3. Results
3.1. Aging Cycle Experiments
Figure 2 shows the capacity of a representative cell (#7) at different current rate during aging cycles. Figure 3 shows the capacity of all cells at 0.5 C and 50 C.
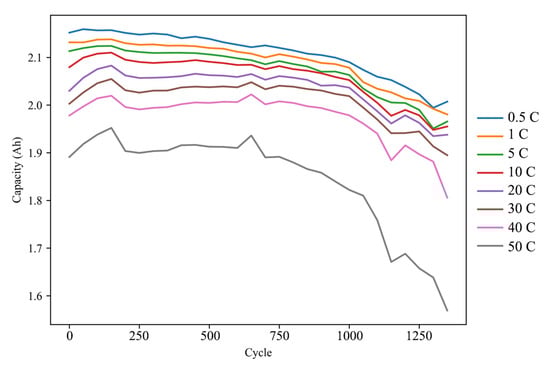
Figure 2.
The capacity at all current rate of cell #7 during aging cycles.
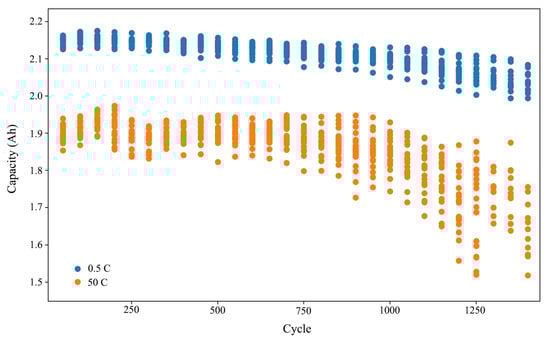
Figure 3.
The capacity at 0.5 C and 50 C of all cells during aging cycles.
It is evident that the available capacity at high currents experiences a more rapid fade. A two-stage fading process is also observable. The rate of capacity degradation significantly increases after approximately 700 cycles. This number is half of the result obtained by Hang et al. (1500 cycles) [13] and is close to the results reported by Han et al. (450 to 810 cycles) [15]. The location of the inflection point is dependent on the quantity of the positive and negative electrode materials as well as the specific experimental conditions. Considering that our experiment was conducted under similar conditions as the latter, at 55 °C and with a much higher current rate, it is reasonable to assume this conclusion holds. Furthermore, it is apparent that the inconsistency among all cells amplifies during the aging cycles, which is particularly significant in the case of high-rate discharge.
Figure 4 illustrates the discharge curves of Cell #7 prior to and after the aging cycles. As demonstrated, when discharged at a low current rate, the majority of the discharge curve remains largely unchanged, with a slight decrease in the platform voltage. The primary capacity fade occurs towards the end of the discharge. Conversely, for high-rate discharge, the voltage drops precipitously shortly after the initiation of discharge, resulting in significantly greater energy loss. The same phenomenon was observed on all cells.
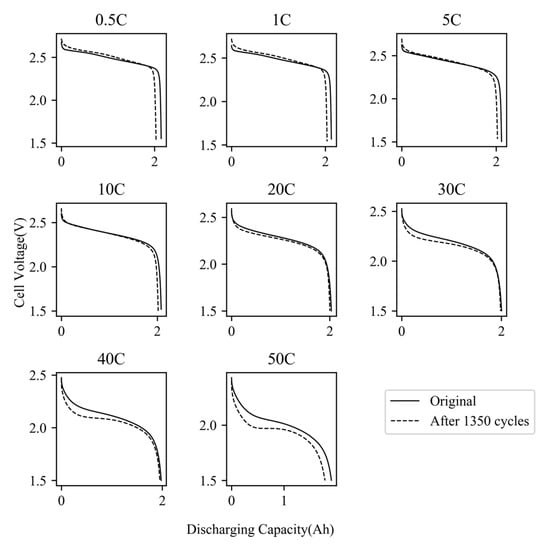
Figure 4.
Discharging curves at all current rate of cell #7 before and after aging cycles.
3.2. IC Analysis
The incremental capacity (IC) analysis is a commonly utilized, non-destructive method for evaluating the SOH of lithium-ion batteries. The calculation of IC involves differentiating the changes in cell capacity with respect to changes in voltage over a short time interval.
The IC curve provides many features related to the aging mechanism of the battery that can be easily identified and tracked, such as peak location [20], peak height [21], and integrated peak area [22]. These parameters are used to describe the internal state of the battery and make ICA a popular choice for many battery management systems (BMSs). Furthermore, it is easier to obtain stable voltage-capacity data during the charging process compared to the discharging process.
The peaks in the IC curve represent the locations of phase equilibria in the electrode material [23]. In the case of lithium titanate batteries, the LTO anode undergoes a two-phase transformation (Li4Ti5O12/Li7Ti5O12) during lithium-ion extraction or insertion, which occurs at a voltage plateau of approximately 1.562 V vs. Li/Li+ [3]. This LTO anode provides a reference potential for the cathode reaction. As shown in Figure 5, the potential of the LTO anode remains largely unchanged until it reaches a higher state of charge (SOC). At the end of charging, the potential of the LTO anode decreases rapidly, resulting in a rapid increase in cell voltage. The LTO material is generally considered to remain unchanged after aging cycles [24], and therefore, the IC curve of LTO cells is primarily determined by the cathode reaction. In the case of LMO, specifically LixMn2O4, it exhibits two potential plateaus at 4.110 V and 3.94 V versus Li/Li+. As a consequence, the IC curve of the cell displays two peaks at approximately 2.5 V and 2.6 V.
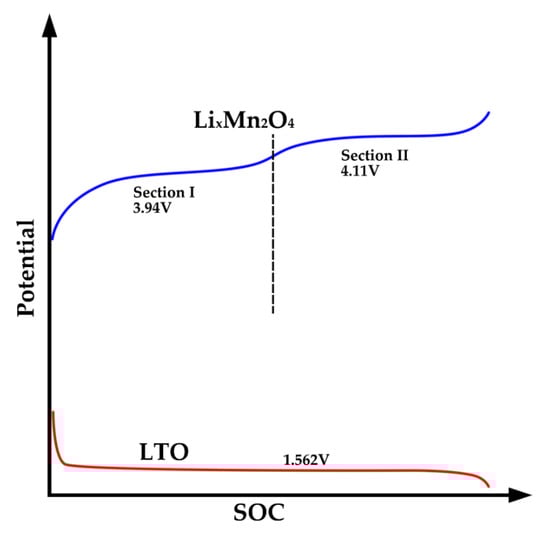
Figure 5.
Schematics of potential of LTO and LMO material.
Figure 6 depicts an example of the IC curves of one of the cells studied with a charging current of 0.05 C. As shown, the curve has two peaks (P1, P2), a valley (V), and an inflection point (T) at the end of the curve, which represents the voltage drop of the LTO anode at the end of charging. This IC curve can be naturally divided into four regions (a–d). We would trace the position and height of peaks, valley, and the area of four regions to investigate the aging mechanism of LTO cells.
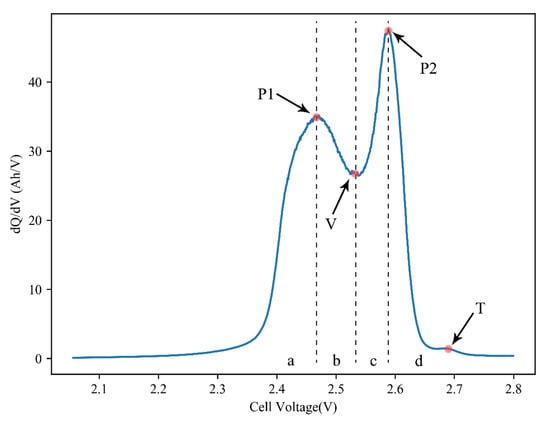
Figure 6.
Typical IC curve of LTO/LMO cell.
Figure 7 illustrates the evolution of IC curves during the aging process of a representative cell (#7). As shown, the position of peaks and valleys remains relatively stable, indicating that the cell resistance does not increase significantly. However, the heights of the peaks decrease, which is often indicative of LAM. Unlike in C/LFP cells, this decrease does not cause a reduction in the overall area under the curve. Instead, the left side of the curve sinks downward while the right side bulges upward, and the inflection point becomes gradually less noticeable. The area of region a is observed to transfer to region d over the course of the experiment. Figure 8 displays the changes in IC parameters during the aging cycles.
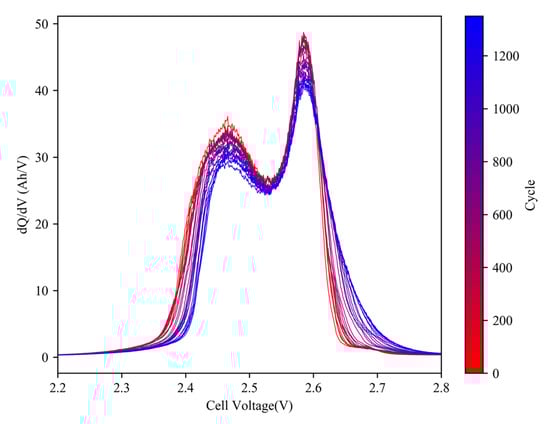
Figure 7.
Evolution of IC curves (0.05 C) of cell #7 during aging cycles.
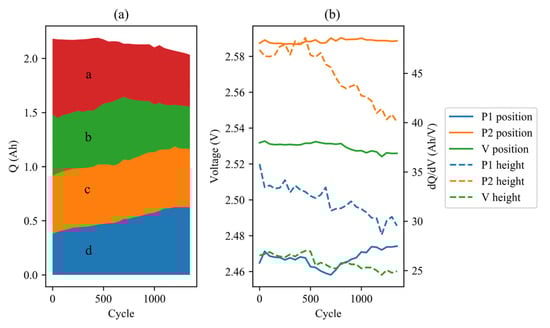
Figure 8.
IC parameters (0.05 C) evolution of cell #7 during aging cycles: (a) area; (b) positions and heights of peaks.
The figure demonstrates that the increase in the area of region d counteracts the decrease in the area of regions a and b, to some extent. If regions a and b, as well as regions c and d, are merged, the area seems to be transferred from P1 to P2. This phenomenon may be attributed to the cumulative polarization in high-rate discharging.
Figure 9 illustrates the proportion of the area occupied by the P1 region of the IC curves for all cells throughout aging cycles. The results indicate a gradual decrease in the P1 area proportion from 57–60% to below 45%. Notably, this decline exhibits a two-stage pattern, with an accelerated rate of decrease observed after 600 cycles, resembling the capacity fading process.
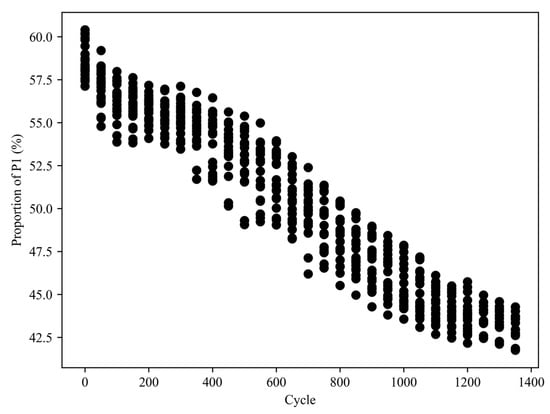
Figure 9.
Proportion of the area of the P1 region of the IC curves for all cells during aging cycles.
Our previous research [19] indicates that IC curves at higher charging currents are more sensitive to the effects of high-rate aging cycles. Figure 10 presents the IC curve evolution of 4 A charging for cell #7, while Figure 11 illustrates the changes in IC parameters.
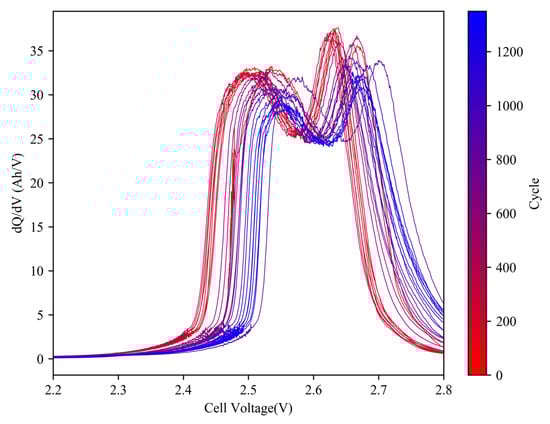
Figure 10.
Evolution of IC curves (2 C) of cell #7 during aging cycles.
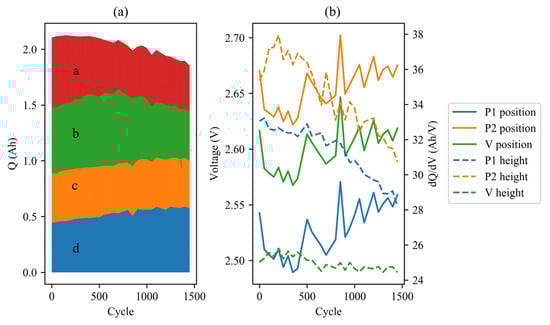
Figure 11.
IC parameters (2 C) evolution of cell #7 during aging cycles: (a) area; (b) positions and heights of peaks.
In the 4 A charging process, the positions of the two peaks clearly shifted to the right. P1 shifted from 2.505 V to 2.558 V indicating a potential increase in resistance of around 10 mΩ. Additionally, a decrease in peak heights and an area transfer were observed, suggesting the presence of strong polarization. It is possible that the inadequate speed of Li-ion migration is responsible for the rapid voltage drop, which is related to the steep decline in voltage during high-rate discharging.
3.3. EIS
EIS is a useful technique for accurately quantifying each electrochemical parameter of a Li-ion cell without causing any damage to the cell. It is widely believed that the impedance spectra of a Li-ion cell exhibit a small semicircle attributed to the anode at high frequency, a large semicircle attributed to the cathode at intermediate frequency, and a diffusion-related impedance response at low frequency. In the case of LTO batteries, two semicircles can be observed at low temperatures (0 °C or lower) [13]. However, at room temperature, the two semicircles merge and cannot be distinguished, as the time constants of the two internal processes become similar, as shown in Figure 12.
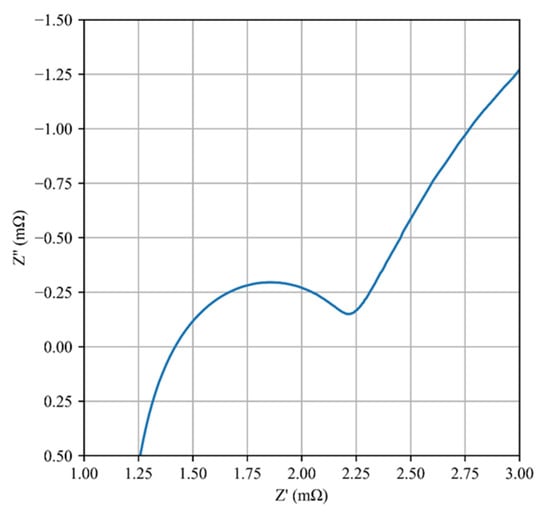
Figure 12.
Typical Nyquist diagram of LTO/LMO cell at room temperature.
Figure 13 presents the Nyquist diagram evolution of a representative cell (#7) at 50% state of charge (SOC) during the aging process. The change in ohmic resistance and eigenfrequency of the middle-frequency semicircle are illustrated in Figure 14. The two semicircles representing the anode and cathode started to separate as the aging cycles progressed, indicating that the time constants of the two electrode reactions became dissimilar. The ohmic resistance increased slightly from 1.4 mΩ to 1.55 mΩ, while the decrease in eigenfrequency suggests that the time constant of the cathode reaction increased by several tens of times. The growth of the cathode reaction semicircle indicates a significant increase in charge transfer resistance, resulting in considerable energy loss.
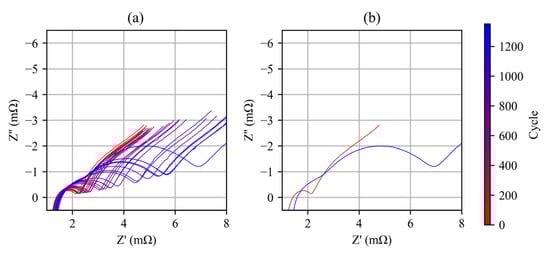
Figure 13.
(a) Evolution of the Nyquist diagram of cell #7 during aging cycle; (b) Nyquist diagrams of cell #7 before and after aging cycles.
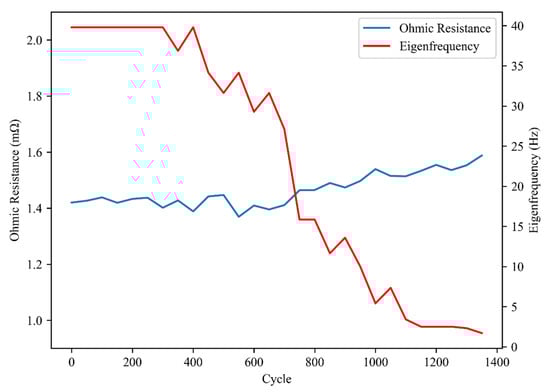
Figure 14.
Changes of ohmic resistance and eigenfrequency of cell #7 during aging cycles.
Figure 15 shows the ohmic resistance and eigenfrequency evolution of all cells during aging process. It can be observed that the eigenfrequency of all cells underwent similar changes, stabilizing at 40 Hz before gradually decreasing to 5 Hz and then plateauing. The ohmic resistance exhibited a steady increase, with most cells showing an increase from around 1.5 mΩ to 1.8 mΩ, while some cells showed a maximum increase up to 3.6 mΩ. For most cells, the most prominent aging features were the rapidly decreasing eigenfrequency and the increasing charge transfer resistance, which can be inferred from the enlarged middle-frequency semicircle.
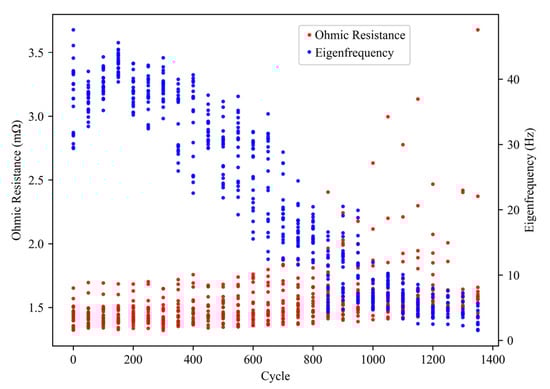
Figure 15.
Changes of ohmic resistance and eigenfrequency of all cells during aging cycles.
These changes in impedance spectra indicate the occurrence of irreversible degradation mechanisms in the cell, such as electrode cracking or dissolution, and electrolyte depletion [25]. The increase in ohmic resistance can be attributed to the gradual degradation of cell components, such as electrodes and current collectors. The decrease in eigenfrequency is indicative of slower reaction kinetics, which can be attributed to the formation of passivation layers, such as cathode degradation products, which impede the transport of ions and electrons. The increase in charge transfer resistance indicates a reduction in the electrochemical surface area of the cathode, which can be attributed to the loss of active material or the formation of insulating layers.
Hall et al. [26] reported similar results in their study. After 10,000 cycles at 50 °C and a 4 C current rate, the Nyquist figure of the LTO/NCA cells exhibited a noticeable increase in the middle-frequency semi-circle, which was caused by the increase in the internal resistance of the NCA cathode and the double-layer capacitance, and was unrelated to the LTO anode. At the same time, it has been widely reported that a NiO-like layer forms on the surface of NCA particles due to the degradation of cathode material at elevated temperatures [27,28,29,30]. This reaction is irreversible [31] and leads to an increase in impedance and capacity fading [12]. This is consistent with our results.
4. Conclusions
This paper investigates the aging process of 2 Ah LTO cells at an ultra-high current rate using charging response and EIS. Capacity fading occurs at all current rates, with faster fading at higher current rates. At high current rates, the platform voltage decreases rapidly, causing greater energy loss than capacity fading, and the inconsistency of all cells amplifies rapidly.
The charging response experiment reveals that the decline in peak area and rightward movement of peak position of IC curves, which were commonly emphasized in previous studies, are not significant in the 0.05 C charging process. The most important change is the area transferring from P1 to P2 and the consequent change in curve morphology, which is considered the result of strong polarization. The change in the area proportion of IC curves becomes a useful indicator of high-current fading. In the 2 C charging process, changes in peak height and position are observed.
EIS reveals a separation of semicircles corresponding to the anode and cathode reactions. Over the course of aging cycles, the time constants of these two reactions grow at different rates, similar to the low-temperature environment. This finding suggests a discrepancy in the sensitivity of the anode and cathode materials to high-rate discharging. The ohmic resistance experiences an insignificant increase, while the eigenfrequency of the cathode reaction undergoes a significant decrease, enabling online monitoring of the power properties of LTO cells.
This investigation offers a comprehensive examination of the aging process of LTO cells at 50 C. The results may facilitate the selection of cells with superior high-power capabilities and enable the assessment of cell states used in such applications, without conducting high-rate discharging experiments. The area transferring of IC curves and change of impedance semicircle represent compelling and encouraging indicators for such evaluations.
Author Contributions
Conceptualization and validation, C.W.; resources, Y.S.; writing—review and editing, Y.G., supervision, P.Y. All authors have read and agreed to the published version of the manuscript.
Funding
This research received no external funding.
Data Availability Statement
Data are available on request due to restrictions, e.g., privacy or ethical.
Conflicts of Interest
The authors declare no conflict of interest. The funders had no role in the design of the study; in the collection, analyses, or interpretation of data; in the writing of the manuscript, or in the decision to publish the results.
References
- Nishi, Y. Lithium ion secondary batteries; past 10 years and the future. J. Power Sour. 2001, 100, 101–106. [Google Scholar] [CrossRef]
- Ohzuku, T.; Ueda, A.; Yamamoto, N. Zero-strain insertion material of Li [Li1/3Ti5/3] O4 for rechargeable lithium cells. J. Electrochem. Soc. 1995, 142, 1431. [Google Scholar] [CrossRef]
- Colbow, K.M.; Dahn, J.R.; Haering, R.R. Structure and electrochemistry of the spinel oxides LiTi2O4 and Li43Ti53O4. J. Power Sour. 1989, 26, 397–402. [Google Scholar] [CrossRef]
- Takami, N.; Inagaki, H.; Tatebayashi, Y.; Saruwatari, H.; Honda, K.; Egusa, S. High-power and long-life lithium-ion batteries using lithium titanium oxide anode for automotive and stationary power applications. J. Power Sour. 2013, 244, 469–475. [Google Scholar] [CrossRef]
- Belharouak, I.; Koenig, G.M., Jr.; Amine, K. Electrochemistry and safety of Li4Ti5O12 and graphite anodes paired with LiMn2O4 for hybrid electric vehicle Li-ion battery applications. J. Power Sour. 2011, 196, 10344–10350. [Google Scholar] [CrossRef]
- Nemeth, T.; Schröer, P.; Kuipers, M.; Sauer, D.U. Lithium titanate oxide battery cells for high-power automotive applications–Electro-thermal properties, aging behavior and cost considerations. J. Energy Storage 2020, 31, 101656. [Google Scholar] [CrossRef]
- Lu, J.; Chen, Z.; Pan, F.; Cui, Y.; Amine, K. High-performance anode materials for rechargeable lithium-ion batteries. Electrochem. Energy Rev. 2018, 1, 35–53. [Google Scholar] [CrossRef]
- Zhao, B.; Ran, R.; Liu, M.; Shao, Z. A comprehensive review of Li4Ti5O12-based electrodes for lithium-ion batteries: The latest advancements and future perspectives. Mater. Sci. Eng. R Rep. 2015, 98, 1–71. [Google Scholar]
- Barré, A.; Deguilhem, B.; Grolleau, S.; Gérard, M.; Suard, F.; Riu, D. A review on lithium-ion battery ageing mechanisms and estimations for automotive applications. J. Power Sour. 2013, 241, 680–689. [Google Scholar] [CrossRef]
- Jaguemont, J.; Boulon, L.; Dubé, Y. A comprehensive review of lithium-ion batteries used in hybrid and electric vehicles at cold temperatures. Appl. Energy 2016, 164, 99–114. [Google Scholar] [CrossRef]
- Qian, K.; Li, Y.; He, Y.B.; Liu, D.; Zheng, Y.; Luo, D. Abuse tolerance behavior of layered oxide-based Li-ion battery during overcharge and over-discharge. RSC Adv. 2016, 6, 76897–76904. [Google Scholar] [CrossRef]
- Vetter, J.; Novák, P.; Wagner, M.R.; Veit, C.; Möller, K.C.; Besenhard, J.O. Ageing mechanisms in lithium-ion batteries. J. Power Sour. 2005, 147, 269–281. [Google Scholar] [CrossRef]
- Hang, T.; Mukoyama, D.; Nara, H.; Takami, N.; Momma, T.; Osaka, T. Electrochemical impedance spectroscopy analysis for lithium-ion battery using Li4Ti5O12 anode. J. Power Sour. 2013, 222, 442–447. [Google Scholar] [CrossRef]
- Han, X.; Ouyang, M.; Lu, L.; Li, J.; Zheng, Y.; Li, Z. A comparative study of commercial lithium ion battery cycle life in electrical vehicle: Aging mechanism identification. J. Power Sour. 2014, 251, 38–54. [Google Scholar] [CrossRef]
- Han, X.; Ouyang, M.; Lu, L.; Li, J. Cycle life of commercial lithium-ion batteries with lithium titanium oxide anodes in electric vehicles. Energies 2014, 7, 4895–4909. [Google Scholar] [CrossRef]
- Stroe, A.I.; Knap, V.; Stroe, D.I. Comparison of lithium-ion battery performance at beginning-of-life and end-of-life. Microelectron. Reliab. 2018, 88, 1251–1255. [Google Scholar] [CrossRef]
- De Hoog, J.; Timmermans, J.M.; Ioan-Stroe, D.; Swierczynski, M.; Jaguemont, J.; Goutam, S. Combined cycling and calendar capacity fade modeling of a Nickel-Manganese-Cobalt Oxide Cell with real-life profile validation. Appl. Energy 2017, 200, 47–61. [Google Scholar] [CrossRef]
- Liu, S.; Winter, M.; Lewerenz, M.; Becker, J.; Sauer, D.U.; Ma, Z.; Jiang, J. Analysis of cyclic aging performance of commercial Li4Ti5O12-based batteries at room temperature. Energy 2019, 173, 1041–1053. [Google Scholar] [CrossRef]
- Wang, C.; Liu, Z.; Sun, Y.; Gao, Y.; Yan, P. Aging behavior of lithium titanate battery under high-rate discharging cycle. Energies 2021, 14, 5482. [Google Scholar] [CrossRef]
- Weng, C.; Cui, Y.; Sun, J.; Peng, H. On-board state of health monitoring of lithium-ion batteries using incremental capacity analysis with support vector regression. J. Power Sour. 2013, 235, 36–44. [Google Scholar] [CrossRef]
- Li, Y.; Abdel-Monem, M.; Gopalakrishnan, R.; Berecibar, M.; Nanini-Maury, E.; Omar, N. A quick on-line state of health estimation method for Li-ion battery with incremental capacity curves processed by Gaussian filter. J. Power Sour. 2018, 373, 40–53. [Google Scholar] [CrossRef]
- Tang, X.; Zou, C.; Yao, K.; Chen, G.; Liu, B.; He, Z.; Gao, F. A fast estimation algorithm for lithium-ion battery state of health. J. Power Sour. 2018, 396, 453–458. [Google Scholar] [CrossRef]
- Dubarry, M.; Liaw, B.Y.; Chen, M.S.; Chyan, S.S.; Han, K.C.; Sie, W.T.; Wu, S.H. Identifying battery aging mechanisms in large format Li ion cells. J. Power Sour. 2011, 196, 3420–3425. [Google Scholar] [CrossRef]
- Yu, Z.; Zhang, X.; Yang, G.; Liu, J.; Wang, J.; Wang, R.; Zhang, J. High rate capability and long-term cyclability of Li4Ti4.9V0.1O12 as anode material in lithium ion battery. Electrochim. Acta 2011, 56, 8611–8617. [Google Scholar] [CrossRef]
- Wong, D.N.; Wetz, D.A.; Heinzel, J.M.; Mansour, A.N. Characterizing rapid capacity fade and impedance evolution in high rate pulsed discharged lithium iron phosphate cells for complex, high power loads. J. Power Sour. 2016, 328, 81–90. [Google Scholar] [CrossRef]
- Hall, F.; Touzri, J.; Wußler, S.; Buqa, H.; Bessler, W.G. Experimental investigation of the thermal and cycling behavior of a lithium titanate-based lithium-ion pouch cell. J. Energy Storage 2018, 17, 109–117. [Google Scholar] [CrossRef]
- Basu, S.; Patil, R.S.; Ramachandran, S.; Hariharan, K.S.; Kolake, S.M.; Song, T. Non-isothermal electrochemical model for lithium-ion cells with composite cathodes. J. Power Sour. 2015, 283, 132–150. [Google Scholar] [CrossRef]
- Kojima, Y.; Muto, S.; Tatsumi, K.; Kondo, H.; Oka, H.; Horibuchi, K. Degradation analysis of a Ni-based layered positive-electrode active material cycled at elevated temperatures studied by scanning transmission electron microscopy and electron energy-loss spectroscopy. J. Power Sour. 2011, 196, 7721–7727. [Google Scholar] [CrossRef]
- Abraham, D.P.; Reynolds, E.M.; Sammann, E.; Jansen, A.N.; Dees, D.W. Aging characteristics of high-power lithium-ion cells with LiNi0.8Co0.15Al0.05O2 and Li4/3Ti5/3O4 electrodes. Electrochim. Acta 2005, 51, 502–510. [Google Scholar] [CrossRef]
- Watanabe, S.; Kinoshita, M.; Nakura, K. Capacity fade of LiNi(1−x−y)CoxAlyO2 cathode for lithium-ion batteries during accelerated calendar and cycle life test. I. Comparison analysis between LiNi(1−x−y)CoxAlyO2 and LiCoO2 cathodes in cylindrical lithium-ion cells during long term storage test. J. Power Sour. 2014, 247, 412–422. [Google Scholar] [CrossRef]
- Wu, L.; Nam, K.W.; Wang, X.; Zhou, Y.; Zheng, J.C.; Yang, X.Q.; Zhu, Y. Structural origin of overcharge-induced thermal instability of Ni-containing layered-cathodes for high-energy-density lithium batteries. Chem. Mater. 2011, 23, 3953–3960. [Google Scholar] [CrossRef]
Disclaimer/Publisher’s Note: The statements, opinions and data contained in all publications are solely those of the individual author(s) and contributor(s) and not of MDPI and/or the editor(s). MDPI and/or the editor(s) disclaim responsibility for any injury to people or property resulting from any ideas, methods, instructions or products referred to in the content. |
© 2023 by the authors. Licensee MDPI, Basel, Switzerland. This article is an open access article distributed under the terms and conditions of the Creative Commons Attribution (CC BY) license (https://creativecommons.org/licenses/by/4.0/).