Abstract
This paper presents the results of a simulation study on the selection of an energy-optimal refrigeration system based on natural refrigerants as a function of outdoor climate parameters as a decision variable in a supermarket application. Simulations were conducted for twelve locations. Three new original refrigeration systems were presented: Cascade R744/R717 which is an advanced booster extended with an ammonia condensing system (CASC_1); Cascade R744/R717 with CO2 pump-fed MT and pressure-fed LT evaporators (CASC_2); and the R717 booster with CO2 pump-fed MT and LT evaporators (CB_NH3). As a reference system, a CO2 booster system with multi-ejectors and flooded evaporators (CB_EJ) was adopted. The CB_EJ system has been confirmed to be energy optimal for cold and temperate climates (Cfb, Dfa and cooler). In warm temperate climates (Csa, BSk, Cfa and similar), the energy consumption of CB_NH3 was the lowest. CASC_2 and CB_NH3 are energy optimal for hot climates (BWh, Af, Aw). The CB_NH3 system always outperforms CASC_2 by 2.5–3.8%. For a tropical climate (Bhubaneswar—Aw), the annual electricity demand of the optimal CB_NH3 system is lower by 18.8%, 10.2%, and 2.7% relative to CB_EJ, CASC_1, and CASC_2, respectively. The COP of the CASC_1 (outdoor temperature 40 °C) is higher by 50%, 2.7%, and 4.7% compared with the CB_EJ, CB_NH3 and CASC_2 systems, respectively. The application of CASC_1 system, relative to CB_EJ, is reasonable only for hot climates and decreases by 7.2% the annual electricity demand for Bhubaneswar.
1. Introduction
Legislative reasons in Europe have led to the need to abandon the use of HFC in refrigeration systems and to introduce systems using refrigerants with GWP < 150 into the commercial refrigeration sector on a large scale [1]. Due to their wider availability and relatively lower price, the focus has been mainly on natural refrigerants, in particular, CO2. The interest in the topic is reflected in the number of papers listed annually in the ScienceDirect database on CO2 refrigeration, which has increased from 81 in 2007 to 670 in 2021.
CO2 booster systems have seen significant development in these years. Initially from the basic system first used in a Danish shop in 2007 [2], through subsequent improvements such as parallel compression [3,4,5], the introduction of flooded evaporators [6], or finally the development of multi-ejector technology [7,8], the efficiency of CO2 systems has gradually improved. Subsequent enhancements of booster systems have been described as 1’, 2′, and 3’ generation booster systems with CO2 [9,10].
The energy benefits of replacing conventional systems with R404A and implementing CO2 systems were noted for cold and temperate climates. In warmer, and tropical climates, the booster systems described above require additional modifications to improve the performance of the system under high outdoor temperature conditions. Research in this area has been conducted in two directions.
One approach is the use of cascade systems using HFCs or natural refrigerants. Sun et al. [11] investigated different variants of three-stage cascade systems using low-GWP refrigerants. They showed that, considering environmental factors, R717 is the recommended refrigerant for the high-temperature circuit. Purohit et al. [12] presented an analysis of the performance of a 2’ generation R717/R744 cascade system compared with a conventional system (R404A) and a 3’ generation CO2 booster system. They found that for Kuwait, the cascade system had a 14.11% lower annual energy requirement than the baseline system with R404a, and the all-CO2 system showed only a 12.73% advantage. However, the CO2 booster was the most efficient in cold climates (Shillong). A NH3/CO2 cascade system using CO2 pump-fed MT circuits and pressure-fed LT circuits was proposed by Saini et al. [13] for use in the food industry in Mumbai (tropical climate). The cascade system was proven to reduce the annual electricity demand by 8.3% compared with an ammonia-only multiparameter system. Zhang et al. [14] investigated analytically and experimentally an R1270/CO2 cascade system for LT applications. Sharma et al. [15] presented the results of a simulation study of eight supermarket refrigeration systems, including a 1’ and 2’ generation CO2 booster and different variants of CO2/R404A cascades under US climate conditions. The results of these studies indicate that the 1’ generation booster system was energy optimal in the northern two-thirds of the US, compared with systems based on R404A or CO2/R404A cascades. The use of a CO2/R404A cascade led to a reduction in CO2 emissions, with no significant reduction in energy demand. Tsamos et al. [16] compared the performance of a 1’ and 2’ generation CO2 booster system with a NH3/CO2 cascade system for two locations: London and Larnaca (Cyprus). The study results confirm that, under temperate climate conditions, the 2′ generation CO2 booster system is energy optimal in this comparison (8.4 ÷ 8.6% less energy demand), while under warm climate conditions, the R717/R744 cascade system is optimal (energy consumption 9.2 ÷ 11.6% less).
Another possibility is the use of dedicated mechanical subcooling (DMS) systems, which reduce the mass flux of flash gas generated in the liquid receiver [17]. Using DMS for a Bangkok plant resulted in energy and economic benefits [18]. Purohit et al. [19] compared the performance of a 2’ generation booster system with a system using DMS with R290 and a R1234ze(E)/CO2 cascade in an application for markets located in hot climates. The cascade system was shown to have the highest COP at outdoor temperatures above 23 °C. Gullo et al. [20] analysed the use of a R134A/R744 cascade system compared with a 1’ and 2’ generation booster as standard and supplemented with DMS. Differences in annual energy demand between the parallel compression booster with and without DMS, the classic booster with DMS and the cascade system were shown to be ±0.8%, and the system with parallel compression and DMS with R290 showed the lowest energy demand. Gullo also performed an exergy analysis for a DMS with R290 that shows significant improvement in system efficiency by applying the DMS [21].
The use of NH3 in indirect expansion (IX) commercial cooling systems was proposed by the authors in a previous publication [22], where it was compared with 1’, 2’, and 3’ generation CO2 booster systems. The IX ammonia system might be an alternative to CO2 systems in Mediterranean climates, while for temperate climates, the 3’generation CO2 booster system was clearly superior to the others.
The aforementioned literature each time includes considerations of a preconceived refrigeration system structure for a specific location that defines the climate. In the conclusions, general terms are given to recommend the use of the respective systems, such as for cold, moderate, or warm climates. The question remains unanswered as to where exactly the optimum limit of applicability of the respective solutions lies and whether it is only determined by the average annual temperature or is influenced in addition by daily and annual temperature amplitudes. Another open issue is whether the set of available and currently studied variants is finite or whether new options for supermarket refrigeration systems, which have not yet been analysed, can be proposed.
The purpose of this paper is to investigate the influence of external climate on the selection of an energy-optimal refrigeration system structure using natural refrigerants and to identify optimal system structures for specific climate types. Annual average COP was adopted as an objective in the analysis. A custom refrigeration system simulation model was developed, in which the decision variable is the external climate affecting the MT and LT cooling loads. The analysis includes as the reference a CO2 booster system with multi-ejectors and flooded evaporators (3’ generation) and three new and original refrigeration system structures (two NH3/CO2 cascade systems and a NH3 booster with CO2 as a coolant) under climatic conditions ranging from cold to tropical climates.
2. Acceptable Structures of Refrigeration Systems
In optimisation theory, the set of acceptable variants of each system is obtained from the set of all possible variants of the system fulfilling the utility function and the set of limiting conditions. For a refrigeration system, the utility function is the normalisation of temperature and, to a limited extent, relative humidity in the normalisation zones of these parameters. For supermarkets, the temperature normalisation zones are as follows:
MT zone—temperature (−5, +5) °C;
LT zone—temperature (−40, −20) °C.
These zones have several pressurised or pump-fed evaporators. The structure of the cold receivers clearly implies the use of multi-stage or cascade refrigeration systems. As a limiting condition, only natural refrigerants were considered.
It can be stated that the set of acceptable structures for refrigeration systems based on natural refrigerants is broad and well researched. However, as was pointed out in recent review articles [9,10], there remains a need to continue the search for new, even more energy-efficient solutions.
Therefore, in the present study, three new, original, acceptable refrigeration system structures based on natural refrigerants were proposed and investigated. Inspiration here came from two premises and conclusions from previously undertaken studies [22].
The first was that the 3’ generation booster system (CB_EJ, Figure 1), which is energy-optimal for cold and temperate climates, in hot conditions shows a sharp decline in COP. Therefore, a novel 3’ generation booster CO2/NH3 cascade system was proposed, with the concept of using a NH3 circuit for the highest outdoor air temperature range (CASC_1, ) (Figure 2).
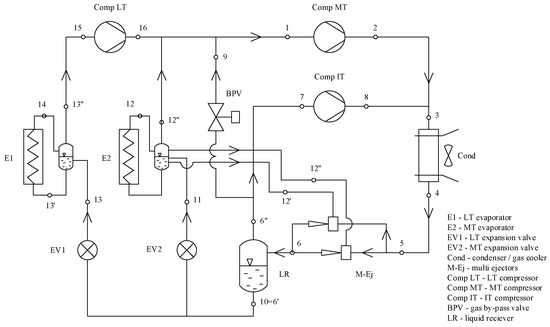
Figure 1.
Diagram of the 3’ generation CO2 booster system (CB_EJ),.
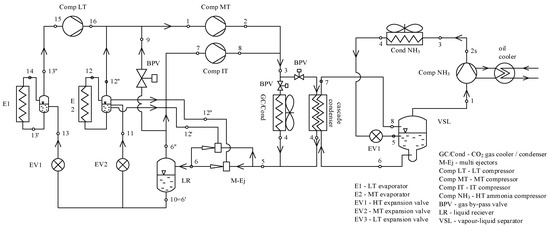
Figure 2.
Diagram of the novel NH3/CO2 cascade—3’ generation CO2 booster system enhanced with a HT NH3 system (CASC_1), .
The second premise arises from the combination of the thermodynamic properties of CO2 as a coolant in pump-fed evaporator systems and NH3 in the compressor circuit. According to [23], due to the higher density of gaseous CO2 (compared with NH3), the liquid occupies a proportionally larger pipeline cross-section. Therefore, the recirculation factor for CO2 can be reduced to (for ammonia, is recommended). Furthermore, for the same pressure drop, CO2 has a temperature drop 5 to 10 times lower than NH3 or R134A (depending on the evaporation temperatures), which corresponds to a lower temperature slippage. Low energy requirements for the circulating pumps are a consequence of the low viscosity of CO2 and reduced volume flux, due to the use of partial evaporation. The authors simulated the flow of coolants in the temperature range of −5 °C to −30 °C with a recirculation rate of for a pump circuit with CO2 and hydraulic systems with commercial coolants at a temperature difference of 5K between supply and return. The coolants used for the comparison were Antifrogen N 35%, Dowtherm Q, HyCool 40, Tyfoxit 1.20, Syltherm 800, and Antifrogen KF 100%. The flow rate of CO2 in the pump circuit was shown to be six to nine times lower than that of the reference coolants. Based on these considerations, the use of CO2 in pump-fed evaporator circuits appears reasonable. However, ammonia is a very thermodynamically efficient natural refrigerant. Therefore, the combination of these advantages is an interesting concept to explore. Hence, two successive proposals for refrigeration systems that are a combination of NH3 as a refrigerant and liquid CO2 as a coolant: CASC_2 (Figure 3) with CO2 pump-fed MT evaporators and CO2 pressure-fed LT evaporators, and CB_NH3 (Figure 4) with CO2 pump-fed MT LT evaporators and a NH3 refrigerant.
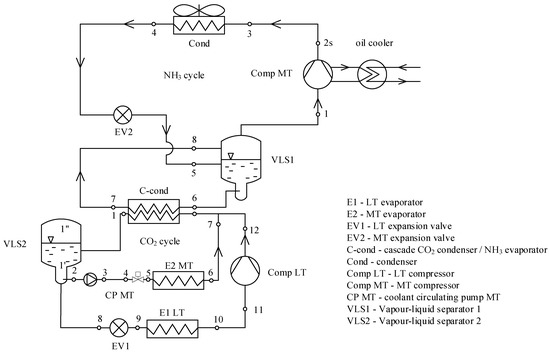
Figure 3.
Diagram of the novel NH3/CO2 cascade system with MT pump-fed and LT pressure-fed evaporators (CASC_2), .
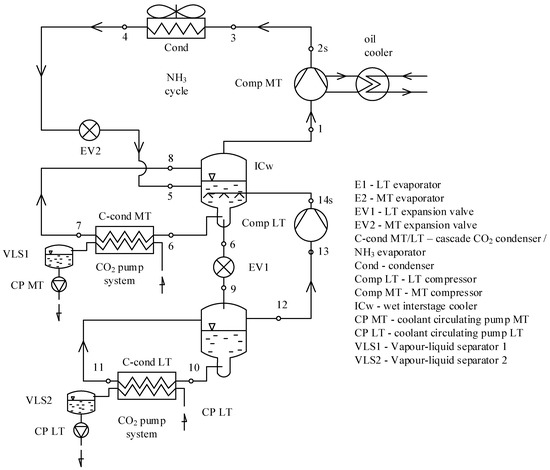
Figure 4.
Diagram of the novel NH3 booster system with pump-fed MT and LT evaporators (CB_NH3), .
Four acceptable structures () of refrigeration systems in application in a typical supermarket are the subject of this optimisation study. External climate parameters are the decision variable, and the target function is the minimum annual energy demand or the maximum COP.
3. Technological Model of the Cooling Loads for a Supermarket
This study investigates a standard medium-sized European market, consisting of open and closed display cabinets (MT), closed cabinets (LT), and cold rooms (MT and LT). Individual evaporator balances were performed for the considered set of refrigeration units, where the decision variable is the ambient temperature. Common physical models and the local industry literature were used for this purpose [23,24]. The cooling demand curves for individual evaporators were then aggregated to derive a function of cooling demand variability relative to indoor temperature. The variation in the cooling capacity demand depending on the ambient temperature in the range was examined. The temperature within the facility is controlled using an independent heating and air-conditioning system, which was not included in the cooling balance of the analysed systems as this would complicate the analysis for different locations due to the fact that the air-conditioning loads are strictly dependent on the detailed construction of the particular building, location in relation to the sides of the world, local shading, and other variables.
Daytime and night/holiday operation modes are distinguished. In the day mode, the temperature is regulated between 20 and 26 °C depending on the outside temperature. In the night mode, a temperature reduction to 18 °C is allowed during winter. The open MT display cabinets are closed at night/holidays, reducing the cooling demand. The daytime mode occurs between the hours of 6 am and 9 pm, 7 days a week, without exclusion of public holidays.
By considering the variation in cooling loads as a function of internal temperature and the variation in internal temperature as a function of external temperature and operating mode, the variation in cooling loads as a function of outdoor temperature and system mode shown in the graph in Figure 5 was derived. The cooling demand varies between 36.5 and 85.0 kW, and from 16.8 to 18.0 kW, for the MT and LT stages, respectively. Thus, the load factor (LF) varies between 4.74 and 2.17, which corresponds to the typical LF ratio [15]. It was assumed that the instantaneous cooling capacity would be equal to the instantaneous cooling loads, which is common practice in the literature for comparative analysis of systems.
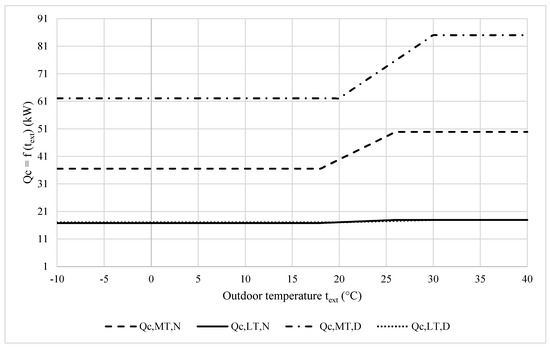
Figure 5.
Variation in cooling loads for MT and LT evaporators as a function of outdoor temperature and operating mode. D—daytime, N—night-time.
4. Outdoor Climate Models
The analysis was conducted for a range of locations characterised by different climates. Cities representing climates ranging from a cold climate without a dry season and with cold summers (Dfc), warm summers (Dfb), and hot summers (Dfa), through temperate climates without a dry season with warm summers (Cfb), dry and hot summers (Csa), as well as climates without a dry period with hot summers (Cfa), to arid cold steppe climates (BSk) and arid hot desert climates (BWh), and finally to tropical rainforest (Af) and tropical savannah (Aw) climates. Climate designations were adopted according to the Köppen–Geiger classification [25]. Climate data for each hour of the year were obtained from TMY [26]. The key data for the selected locations are collected in the Table 1, which shows the mean, minimum, and maximum temperatures over the year, as well as the number of hours annually where the temperature exceeds 22.5 °C and 26.5 °C. The importance of these temperatures are explained later.

Table 1.
Climate data.
The 12 locations differ in average outdoor temperature and annual temperature amplitude. The detailed variability in outdoor climate conditions is shown in Figure 6 and Figure 7, which illustrate the distribution of outdoor temperatures throughout the year.
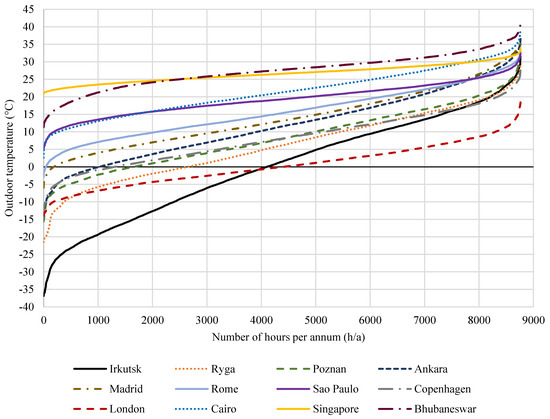
Figure 6.
Distribution of outdoor temperatures over the year.
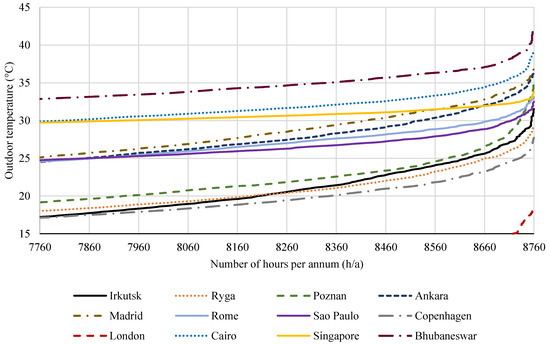
Figure 7.
Distribution of outdoor temperatures over the year (section showing outdoor temperatures greater than 15 °C).
5. Simulation Models for Refrigeration Systems
5.1. Algorithms and Output
The energy demand simulation model for refrigeration systems has one independent variable (external climate, outdoor temperature) and one dependent variable—the operating mode (day or night). The operating mode influences the configuration of the cooling loads, which affects the cooling capacity, as described in Section 3, while the outdoor temperature defines the indoor temperature, which also affects the evaporator balance. The external temperature obviously influences the condensing pressure. The parallel compressors in the CB_EJ and CASC_1 systems and cascade system activation in the CASC_1 variant is initiated as a function of the outside temperature.
Thermodynamic calculations were conducted based on basic physical processes in a quasi-steady state with the following assumptions. The compressor and pump efficiencies for each system are shown in Table 2. The compressor efficiencies were determined as a function of the compression ratio (σ), namely, the compressor discharge and suction pressure quotient. For this purpose, data on the operation of specific compressors were obtained from the corresponding selection software in the operating pressure range considered in the simulation, and then approximations were made with an accuracy of . The parameters for condensers, gas coolers, subcooling, and others are included in Table 3. The pressure in the condenser/gas cooler and the intermediate liquid receiver was determined using a variation function relative to the condenser/gas cooler outlet temperature. These data were obtained from the system manufacturer’s software [27] through a series of substitutions. From these data, approximation functions were created and implemented in the simulation. In the case of ammonia condensers, a higher temperature differential between ambient and condensing temperatures was assumed to enable the use of an intermediate system, for example a dry-cooler, which may be required for safety reasons. Therefore, the ammonia load was limited to the machinery room which must meet the safety requirements of the relevant regulations for the location.
The CB_EJ system () is designed to use flooded evaporators () with evaporation temperatures of −4 °C and −27 °C for the MT and LT stages, respectively, according to [20,28]. The parallel compressors are switched on at . The above criterion was determined by simulation for the data set with the assumptions used in the paper. Above the temperature of 11.3 °C, the criterion of minimum mass flow through the parallel compressors is achieved. This coincides with the temperature range for turning on the parallel compressors in the outdoor temperature range of 12 °C to 15 °C, which is observed in practice when HP ejectors are used [29]. Below this temperature, only the LS and MS compressors operate. To calculate the entrainment coefficients, the Danfoss DFEjector calculator is used and implemented in the calculation model. The use of a Combi (HP 1875 + LE200) Multi-Ejector block is assumed, but only the HP ejector’s operation was investigated. The liquid ejector operates only to lift up the liquid from the MT receiver when a pre-defined level is exceeded. The largest energy gain from the use of liquid ejectors is related to the increased evaporation temperature [10,30]. The operation was expected to be carried out all year round [31]. The above assumptions correspond to common practice in the literature [32]. Below this temperature, the system operates as a booster. The liquid receiver pressure is optimised according to Danfoss using the formula in Table 3.
The CASC_1 system () is an extension of the CB_EJ booster with an additional condensing system. The assumptions when operating without the cascade system are as for the CB_EJ system. The optimal switch-on temperature of the cascade system, above which energy benefits are observed, is equal to 26.5 °C. The parameters of the HT cascade condenser are listed in Table 3.
In the other systems (CASC_2 and CB_NH3), original refrigeration systems were proposed based on an ammonia system. Due to the toxic properties of ammonia and the limitations of its use, it was decided that ammonia would be restricted to the technical space only, while the cooling distribution system including the receivers would be fed with carbon dioxide.
The CASC_2 system consists of a medium-temperature ammonia refrigeration circuit connected by a NH3/CO2 cascade condenser to a pump-pressurised CO2 system. The medium-temperature evaporators are pump-fed, while the LT evaporators are pressure-fed using expansion valves. The CO2 from the LT circuit is compressed to the MT level using the LT compressor. A mixture of superheated vapour from the LT circuit and wet vapour from the MT evaporators is returned to the cascade condenser, where it is condensed and feeds the CO2 liquid receiver.
The CB_NH3 system is an ammonia booster system with a wet intercooler and two compression stages, LT and MT. Liquid CO2 is used as a coolant in the MT and LT circuits, which is pumped, then partially evaporated in the evaporators (recirculation factor n = 2), and returned to the cascade condenser, where the wet vapor is condensed and feeds the CO2 receiver.
The pump circuits use variable flow control with a constant head. This is implemented using a variable speed refrigerant pump with a fixed head setting. Each individual evaporator is equipped with a two-way control valve for stepless regulation of the receiver power in a quantitative manner by changing the flow through the evaporator.
The following pressure drops were assumed in the pump circuits, which are present in design practice, and were further verified in the selection programme [27]:
- MT circuit—160 kPa:
- Supply pipelines 50 kPa;
- Control valve 40 kPa;
- Evaporator 40 kPa (0.5 K slippage);
- Return pipelines 30 kPa.
- LT circuit—100 kPa:
- Supply pipelines 30 kPa;
- Control valve 25 kPa;
- Evaporator 25 kPa (0.5 K slippage);
- Return pipelines 20 kPa.
The temperature difference in the cascade heat exchangers between condensing and evaporating refrigerant was set at 2.8 K, according to [23].
Table 2.
Compressor and pump efficiencies in the simulation model.
Table 2.
Compressor and pump efficiencies in the simulation model.
| System | Compressor and Pump Efficiencies Equations [33,34] |
|---|---|
| CB_EJ | LS Compressor: DORIN CD6 601-40l: MS Compressor total efficiency according to [20]: (in the subcritical zone) (in the transcritical zone) IS Compressor total efficiency according to [20]: (in the subcritical zone) (in the transcritical zone) Isentropic efficiencies: DORIN CD2000H: |
| CASC_1 | LS, IS, MS are the same as in CB_EJ HS Compressor: Bitzer W4GA-K: |
| CASC_2, CB_NH3 | HS Compressor: Bitzer W4GA-K: LS Compressor: Bitzer W2NA: |
* For CASC_2 LT compressor efficiencies according to CB_EJ.
Table 3.
Condenser/gas cooler parameters for individual systems.
Table 3.
Condenser/gas cooler parameters for individual systems.
| System | Condenser/Gas Cooler Parameters |
|---|---|
| CB_EJ, CASC_1 | Refrigerant temperature in condenser/gas cooler assumed with four-zone split according to [20]: , , , . Approximation equations for the optimisation of pressure in the condenser/gas cooler and liquid receiver: |
| CASC_1, CASC_2, CB_NH3 | , ; Cascade condensers: HT: , MT: LT: |
The energy demand for the condenser/dry-cooler fan operation was not included in the analysis. The electricity consumed by the refrigeration cabinets and cubic coolers was also not included, assuming that they would be the same for all systems and, therefore, would not affect the selection of the energy-optimal system.
The general optimisation algorithm is presented in Figure 8. The simulation is run on an hourly interval and starts by choosing the location that defines the outdoor climate. The cooling loads for each hour of the year are then calculated based on the outdoor temperature and the specified operating mode, which provide the basis for calculating the thermodynamic circuits for the individual systems. The results of the simulation are presented in the next section.
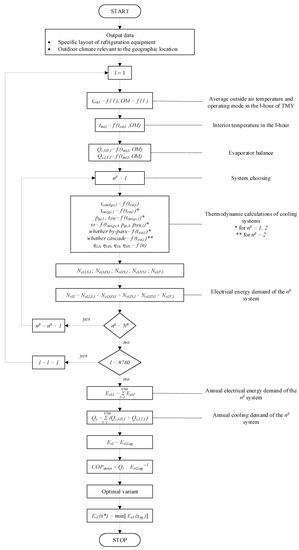
Figure 8.
General optimisation algorithm.
5.2. Results and Discussion
Two simulations were conducted to analyse the performance of systems. The first involved the modelling of energy demand for specific locations. The second approach was a comparison of the energy demand in the external temperature range from −10 °C to +40 °C. The results of the first analysis are presented in Figure 9 and Figure 10, which sequentially show the annual energy demand for each cooling system and the average annual COP of each system.
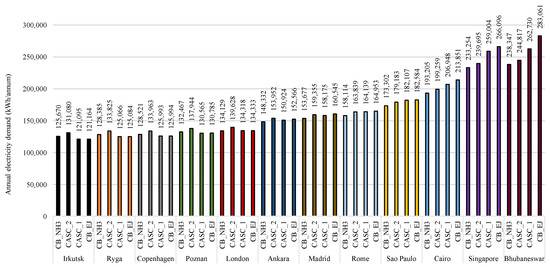
Figure 9.
Annual electricity demand for cooling systems in various locations (climates).
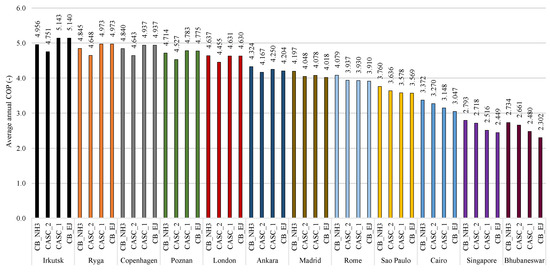
Figure 10.
Average annual COP of cooling systems in various locations (climates).
On the basis of the energy demand analysis carried out, in which the decision variable is the location (climate), the following conclusions can be drawn:
- The annual average outside temperature is the main factor determining the energy demand for refrigeration systems. An increase in the annual average temperature results in a decline in the annual average COP and higher energy demand for individual cooling systems, despite the differences in the annual amplitude of outdoor temperatures between the considered locations.
- Three groups of climate zones can be distinguished, for which significantly different results are obtained. The CASC_1 system is the most energy efficient in cold and temperate climates such as Cfb, Dfa, and colder. However, the differences in annual energy consumption between the CASC_1 and CB_EJ in those climates are minor (less than 0.17%), so in the locations of Irkutsk, Riga, Copenhagen and Poznan, the CB_EJ performs better than the systems with ammonia. The differences in those climates between the CB_EJ and the CB_NH3 vary from 2.0% to 3.7%. In the case of London, the energy demand for CB_NH3 is almost the same as for CASC_1 and CB_EJ. In warm temperate climates (Csa, BSk, Cfa and similar), systems with ammonia become more energy efficient than the CO2 based systems. The relative differences between the systems for Ankara, Madrid, Rome, and Sao Paulo range up to 5.36%. In hot climates (BWh, Af, Aw), the NH3 booster system that uses CO2 in pump circuits is the most energy efficient.
- The use of an additional ammonia condensing system results in improved efficiency of the booster system using CO2. The CASC_1 system is better than the CB_EJ system in every location. However, the relative difference between these systems ranges from a negligible gain of 0.01% in temperate climates (Copenhagen—Cfb) to a clear advantage of 7.2% in tropical climates (Bhubaneswar—Aw). The difference in energy consumption between these two systems is strongly related to the number of hours per year in which the outdoor temperature exceeds 26.5 °C.
- In temperate and colder climates, there is no benefit to using a cascade system to support the operation of the CO2 booster system. For locations Irkutsk, Riga, Copenhagen, Poznan, and London, the differences in energy demand for the CB_EJ system versus CASC_1 were 0.06%, 0.01%, 0.01%, 0.17%, and 0.01%, respectively, in favour of CASC_1. The number of hours of additional condensing NH3 system operation () in these climates ranges from 6 (Copenhagen) to 104 (Poznan). Most of the time (99.2 ÷ 99.9%), the CASC_1 system operates as a booster CB_EJ. Although economic analysis is not considered in this publication, for such minor energy gains, an additional extension of the refrigeration system would not be reasonable.
- In temperate warm climates, the CB_NH3 begins to outperform the CASC_1 and CB_EJ systems. The relative differences in energy demand between CB_EJ and CASC_1 for Ankara, Madrid and Rome are 1.75%, 2.93% and 3.81%, respectively.
- In extreme hot climate conditions of the arid hot desert (BWh—Cairo), tropical rainforest (Af—Singapore) and tropical savannah (Aw—Bhubaneswar) zones, the CB_NH3 system substantially outperforms the other configurations. The energy consumption of the best system is between 2.6% and 3.0% lower in comparison with the CASC_2 system. The CO2-based refrigeration systems are considerably less efficient in these areas. The CASC_1 and CB_EJ systems are characterised by higher energy demands compared with the CB_NH3 system: 7.11% and 10.69%, respectively, for Cairo; 11.04% and 14.08%, respectively, for Singapore; and 10.23% and 18.76%, respectively, for Bhubaneswar.
- The CB_NH3 system shows consistently lower energy consumption than the CASC_2 system in every climate condition. The relative difference between these systems ranges from 2.6% (Bhubaneswar) to 4.1% (Irkutsk).
- Beyond the average annual temperature, an important factor in determining the annual cooling demand for MT and LT loads is the annual temperature amplitude and, in particular, the number of hours in which the temperature exceeds 22.5 °C. Of the locations analysed, those with a temperate cold climate with maritime influence, i.e., Copenhagen (620.3 MWh/a) and London (621.4 MWh/a), have the lowest annual cooling demand. Although the average annual temperature in Riga and Irkutsk is lower than in Copenhagen, the annual cooling demand is higher in these cities by 0.27% and 0.4%, respectively. For temperate warm European locations, the annual demand is on average 3.4 ÷ 4.0% higher. In hotter locations, i.e., Sao Paulo and Cairo, cooling demand is 5.0%, 10.7% higher, respectively, jumping to 21.7% and 21.8% for tropical Singapore and Bhubaneswar.
- The presence of significant differences in instantaneous cooling demand throughout the year affects the difference between the average COP of the system calculated as the average of all hourly COPs of the system and the ratio of annual cooling demand and annual electricity demand. The second method is the appropriate one, as the calculation of the annual average COP must consider the different weights of specific time intervals with varying cooling loads. Hot periods, due to the higher instantaneous cooling demand, have a more significant impact on the annual average COP of a system than cooler periods, in which the cooling loads are lower.
- The external climate is constantly changing, so the calculations made are adequate for the data set that has been entered into the simulation. In recent years, there has been a significant increase in annual temperatures in European countries. In 2022, record high outdoor temperatures were reported in Portugal, Spain, and the UK, among others. In 2022 in Poznan, 122 h in which were recorded, which is four times greater than the average in TMY [35]. The upward trend in mean annual temperatures and the increasing number of hours per year with temperatures above 22.5 °C, and especially above 35 °C and 40 °C, will result in higher energy savings when using CASC_2 and CB_NH3 systems compared with the CB_EJ system.
The results of the COP variation analysis as a function of outdoor temperature and operating mode for the individual systems are presented later. The volatility function is shown in Figure 11 for the day mode and in Figure 12 for night mode.
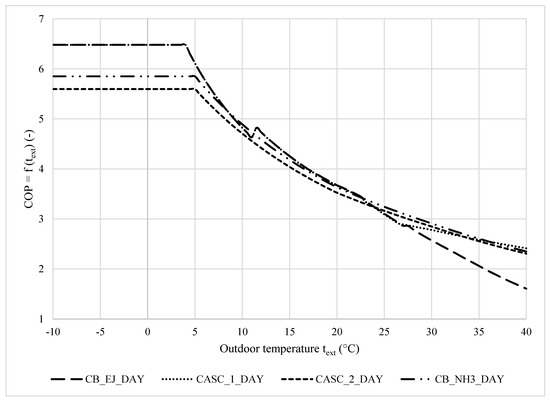
Figure 11.
Graph of the variation in COP as a function of outdoor temperature for refrigeration systems for daytime operating mode (OM = Day).
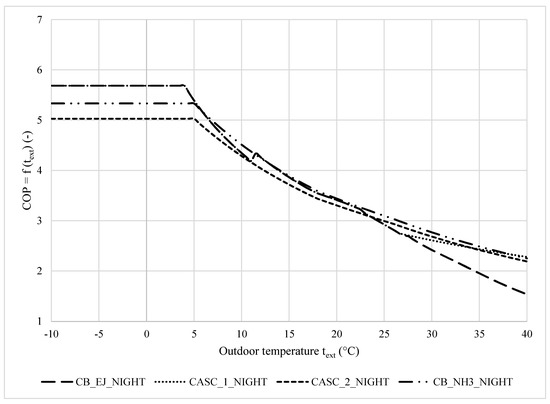
Figure 12.
Graph of the variation in COP as a function of outdoor temperature for refrigeration systems for night operating mode (OM = Night).
The following conclusions can be derived from the graphs (Figure 12):
- Depending on the outdoor temperature, different systems have the highest COP. No system shows the highest efficiency for the entire considered outdoor temperature range. The individual systems examined in the simulation are characterised by a different variation in efficiency depending on the outside temperature.
- The load factor (LF) is a decision variable that significantly affects the COP of the cooling system. Each system shows a higher efficiency for daytime operation compared with night-time operation, due to the higher LF for the day mode. For daytime mode operation (), the CB_NH3 system equals the efficiency of the CASC_1 and CB_EJ systems at . For night mode operation (), this moment occurs earlier at due to the higher vapour superheating at the suction of MT compressors that occurs in systems with CO2. For systems with NH3, this effect is not present due to the use of a wet intercooler.
- For temperatures below 26.5 °C, the CB_EJ and CASC_1 systems show the same efficiency since they operate identically under these conditions. For temperatures up to +4 °C, the COP equals 6.48 (D) or 5.68 (N), depending on the operation mode. Beyond this temperature, the efficiency begins to decrease logarithmically up to +11.3 °C, where the multi-ejectors and parallel compression are activated. This explains the instantaneous increase in COP of approximately 0.19 which leads to overperforming the other systems up to +22.5 °C. After that the COP decrease accelerates due to the growing amount of flash gas required for compression. Above 26.5 °C, the NH3 condensing unit in CASC_1 is activated and the system begins to overperform the CB_EJ system. The difference between these systems increases linearly from 0% at 26.5 °C to 50% at +40 °C.
- For the CASC_2 and CB_NH3 systems at , the COP is constant at 5.6 and 5.85, respectively, for the day mode. Above 5 °C, the COP decreases logarithmically. The difference between the CASC_2 and CB_NH3 systems varies inversely with increasing outdoor temperatures from an initial difference of ΔCOP = 0.25 (4.4%) for to ΔCOP = 0.04 (1.9%) for .
- The CB_EJ and CASC_1 systems are the most efficient at low outdoor temperatures, due to the lower minimum operating temperature of condensation, which is the result of a higher disposable CO2 pressure differential for the correct operation of the expansion valves than for ammonia. Below 4 °C outdoors, the COP of these systems is 10.8% and 15.8% higher compared with CB_NH3 and CASC_2, respectively. With increasing outdoor temperatures, this difference decreases up to . Above this temperature, the CB_NH3 system outperforms the other systems. Switching on the multi-ejectors and parallel compressors at 11.3 °C results in a sharp increase in efficiency in the CB_EJ and CASC_1 systems, so these systems become again more efficient than CB_NH3. This changes after passing the 22.5 °C mark. The CASC_2 system outperforms the CB_EJ and CASC_1 systems above . The difference between CASC_2 and CB_NH3 and CB_EJ and CASC_1 increases significantly above 22.5 °C, where the latter experiences an increased drop in efficiency. When the CASC_1 cascade system is switched on, the difference in COP between this system and CASC_2 and CB_NH3 is 2.1% and 4.6%, respectively, and then decreases. CASC_1 becomes more efficient than CASC_2 and CB_NH3 at temperatures of 33.5 °C and 36.5 °C, respectively. The discrepancy between CASC_1 and CASC_2 and CB_NH3 at 40 °C reaches 4.7% and 2.7%, respectively, in favour of CASC_1.
- In night mode, similar correlations are observed, with the maximum COP for the systems being lower than for the day mode, and the intersection point of the COP graphs for CASC_2 and CB_NH3 with CB_EJ and CASC_1 occurring at lower outdoor temperatures of 23.5 °C and 6 °C, respectively. The maximum COP for the CB_EJ and CASC_1 systems is 5.68, while the maximum values for CASC_2 and CB_NH3 are 5.03 and 5.33, respectively.
- The efficiency difference between CB_NH3 and CASC_2 for the night mode varies from 5.7% at to 2.7% at . The discrepancies between CASC_1 and CB_EJ are similar for night and day modes. The maximum difference occurs for and is equal to 48%. In those conditions, the CASC_2 and CB_NH3 systems are less efficient than CASC_1 by a maximum of 4.1% and 1.3%, respectively, which is consistent with the daytime mode operations.
6. Conclusions
This paper presents the results of a simulation study on the selection of an energy-optimal refrigeration system based on natural refrigerants and using outdoor climate parameters as the decision variable in a supermarket application. Four systems were analysed in the set of acceptable variants. A CO2 booster system with multi-ejectors and flooded evaporators (CB_EJ) was adopted as reference. Three new original refrigeration systems were presented: Cascade R744/R717 is an advanced booster extended with an ammonia condensing system (CASC_1); Cascade R744/R717 has CO2 pump-fed MT and pressure-fed LT evaporators (CASC_2); and an R717 booster with CO2 pump-fed MT and LT evaporators (CB_NH3). The inspiration for undertaking the study for the CASC_1 system was the large drop in COP of the 3’ generation CO2 booster system in hot climates. The reason for considering the second and third cascade systems was its combination of the advantages of ammonia as a very thermodynamically efficient refrigerant with the use of carbon dioxide as a coolant, which has a relatively high heat capacity and low hydraulic resistance in pump-fed systems. The research was simulation-based, and the objective function was the minimum annual electricity consumption. A new original simulation program was developed, which is based on physical relationships and supplemented with data obtained from validated software of reputable manufacturers in the refrigeration industry (Danfoss calculator DFEjector, Bitzer GMBH, 2021; Dorin S.p.A., 2021).
The simulation results obtained provide a solution to two research problems:
- COP as a function of outdoor temperature ().
- Annual energy demand as a function of climate conditions.
- Regarding the , it can be stated that:
- Besides the outdoor air temperature, the important decision variables influencing the COP of the studied cooling systems are the load factor (LF) and the mode of operation (day/night). These variables also affect the outdoor air temperature below which the COP values of the CASC_1 and CB_EJ systems are greater than that of CB_NH3 and, conversely, the temperature above which the relationship is reversed. For daytime mode (, the transition temperature is and for night-time mode ;
- For , the 3’ generation booster system (CB_EJ) and its development, the CASC_1 system, operate in the same way and present the maximum COP (6.48) up to 10.8% and 15.8% higher compared with CB_NH3 and CASC_2, respectively, in daytime mode. In the night-time mode, the maximum COP of the CB_EJ and CASC_1 is 5.68, which is 6.6% and 13.0% higher compared with CB_NH3 and CASC_2, respectively;
- For , the COPs of all three newly proposed refrigeration systems (CASC_1, CASC_2, and CB_NH3) are greater than the COP of the 3’ generation CO2 Booster;
- For , there is no difference between the COP of the CB_EJ and CASC_1 systems, while the CASC_2 and 3 systems are more efficient by 5.0% and 7.3%, respectively. CASC_1 outperforms CASC_2 and CB_NH3 at an outdoor temperature of 33.5 °C and 36.5 °C, respectively. When the temperature rises to 40 °C, the relative differences between CASC_1 and CB_EJ, CASC_2, and CB_NH3 are 50%, 4.7%, and 2.7%, respectively, in favour of the CASC_1 system.
Regarding annual energy consumption as a function of external climate, it can be stated that:
- The CB_EJ system is energy-optimal for cold and temperate climates (Cfb, Dfa), and in warm temperate climates (Csa, BSk, Cfa and similar), the energy consumption of this system is 2.85% to 5.36% greater than for the newly proposed system CB_NH3;
- The CASC_2 and CASC_3 systems are energy-optimal for hot (BWh, Af, Aw) and warm climates (Csa, BSk, Cfa), with the CB_NH3 system always outperforming CASC_2 (relative difference 2.6–4.1%). For the tropical climate (Bhubaneswar—Aw), the annual electricity demand of the CB_NH3 system is 18.8%, 10.2%, and 2.7% lower, compared with CB_EJ, CASC_1 and CASC_2, respectively;
- The extension of the CB_EJ system to CASC_1 is reasonable only for hot climates (for cold and temperate climates, the relative differences in annual energy demand are less than 1.1%). For tropical climates (Bhubaneswar—Aw), the annual energy demand of the CASC_1 system is 7.2% lower compared with the CB_EJ system. The energy savings from the NH3 condensing system are strongly correlated with the number of hours per year with temperatures above 26.5 °C. Therefore, for temperate warm climates, the application of the CASC_1 system should be preceded by an energy and economic analysis;
- A key parameter—in addition to the average air temperature—is the amplitude of the outdoor air temperature, and in particular, the number of hours annually when the temperature exceeds 20 °C. This particularly affects the annual cooling demand for MT and LT loads. The simulation studies showed that there were locations for which, despite a lower annual mean outside air temperature (Riga, Irkutsk), the annual cooling demand was higher than in locations with a higher annual mean outside air temperature (Copenhagen, London). This was due to the number of hours with temperatures above 20 °C being several times higher (Riga, Irkutsk);
- The presented research results have considerable application relevance in relation to climate change and the progressive increase in outdoor air temperature, especially in currently temperate climates, including European countries. The upward trend in mean annual temperatures and the increasing number of hours per year with temperatures above 22.5 °C, and especially above 35 °C and 40 °C, will result in greater energy savings when using CASC_2 and CB_NH3 systems.
The results obtained confirm the qualitative hypotheses that, under hot climate conditions, the proposed new original systems, CASC_1, CASC_2, and CB_NH3, achieve significantly higher energy efficiencies compared with the reference system. The proposed CASC_2 and CB_NH3 systems are also significantly simpler in their design than the CB_EJ and CASC_1 systems, which may result in easier operation and servicing, which are important considerations in countries with fewer qualified personnel.
The achieved outcomes allow the definition of additional criteria for the selection of a refrigeration system for supermarkets, especially for locations in hot climates. This is particularly relevant in the context of a warming climate and the expansion of hot climate zones.
As an extension of the current research, an economic analysis of the use of individual systems in selected locations should be carried out. The systems presented also need to be tested under real conditions in operating facilities.
Author Contributions
Conceptualization, L.D.; methodology, L.D. and M.P.; software, L.D.; writing—original draft preparation, L.D.; writing—review and editing, M.P.; supervision, M.P.; funding acquisition, M.P. All authors have read and agreed to the published version of the manuscript.
Funding
This research was funded by the Polish Ministry of Science and Higher Education, grant number 0713/SBAD/0981.
Acknowledgments
The authors would like to acknowledge Danfoss Climate Solutions for providing the DFEjector calculation tools.
Conflicts of Interest
The authors declare no conflict of interest.
Nomenclature
| Indices | |
| l | index of the period of time discernment (hours per year), l = 1, …, L, |
| L | number of the periods of time discernment (hours per year) |
| -acceptable variant of the cooling system | |
| number of acceptable variants for the normalisation of constant parameters of the cooling system | |
| IT | level of temperatures according to the intermediate pressure |
| LT | low temperature |
| MT | medium temperature |
| OM | operating mode |
| DX | direct expansion (of the refrigerant) |
| IX | indirect expansion (of the refrigerant) |
| Contractual values | |
| DBT | dry-bulb temperature, °C |
| annual electricity demand, kWh/a (kWh per annum) | |
| Nel | total electric power of all devices of the refrigeration system, kW |
| Nel,MT, Nel,LT, Nel,IT | electric power of compressors of the MT, LT, or IT level |
| Nel,p | electric power of coolant circulation pumps, kW |
| evaporator cooling capacity, kW | |
| pressure of the refrigerant in the gas cooler, bar | |
| t | temperature, °C |
| temperature of refrigerant condensation, °C | |
| temperature of refrigerant evaporation, °C | |
| outdoor air temperature, °C | |
| indoor air temperature, °C | |
| temperature of the intermediate pressure receiver (liquid receiver), °C | |
| temperature of the refrigerant leaving the condenser/gas cooler, °C | |
| TMY | Typical Meteorological Year () |
| volume flow of the coolant, m3/s | |
| quality of the refrigerant leaving the evaporator, - | |
| subcooling of the refrigerant, K | |
| additional superheat in suction pipelines, K | |
| total efficiency of the pump, - | |
| isentropic efficiency of the compressors, - | |
| total efficiency of the compressors, - | |
| compression ratio. - | |
| the entrainment ratio, - | |
| Symbols and Abbreviations | |
| COP | Coefficient of performance |
| CB_EJ | All-CO2 booster with multi-ejectors |
| CASC_1 | Cascade of a CO2 booster with multi-ejectors and an additional NH3 condensing unit |
| CASC_2 | NH3/CO2 cascade with CO2 as a coolant in MT pump-fed and a CO2 LT compressor system—one MT cascade condenser |
| CB_NH3 | NH3 booster with CO2 as a coolant in MT and LT pump fed systems and two (MT & LT) cascade condensers, |
| DMS | Dedicated Mechanical Subcooling |
| GWP | Global Warming Potential |
| LF | Load factor (MT to LT cooling load ratio) |
Appendix A

Figure A1.
Thermodynamic processes of the R744 for the CB_EJ system (, text = 30 °C).

Figure A2.
Thermodynamic processes of the R744 for the CASC_1 system (, text = 30 °C).

Figure A3.
Thermodynamic processes of the R717 for the CASC_1 system (, text=30 °C).

Figure A4.
Thermodynamic processes of the R717 for the CASC_2 system (, text = 30 °C).

Figure A5.
Thermodynamic processes of the R744 for the CASC_2 system (, text = 30 °C).

Figure A6.
Thermodynamic processes of the R717 for the CB_NH3 system (, text = 30 °C).
References
- Schulz, M.; Kourkoulas, D. Regulation (EU) No 517/2014 of the European Parliament and of the Council of 16 April 2014 on Fluorinated Greenhouse Gases and Repealing Regulation (EC) No 842/2006. Off. J. Eur. Union 2014, 2014, L150/195-230. [Google Scholar]
- Christensen, F. Development and Demonstration of a Prototype Transcritical CO2 Refrigeration System—Final Report; 2008. Available online: https://webgate.ec.europa.eu/life/publicWebsite/project/details/2479# (accessed on 11 April 2023).
- Javerschek, O.; Reichle, M.; Karbiner, J. Optimization of Parallel Compression Systems. In Proceedings of the 12th Conference of International Building Performance Simulation Associationth IIR Gustav Lorentzen Conference on Natural Refrigerants, Edinbourg, UK, 21–24 August 2016; pp. 1084–1092. [Google Scholar]
- Javerschek, O.; Craig, J.; Xiao, A. CO2 as a Refrigerant—Start Right Away! Refrig. Sci. Technol. 2015, 2302–2312. [Google Scholar] [CrossRef]
- Chesi, A.; Esposito, F.; Ferrara, G.; Ferrari, L. Experimental Analysis of R744 Parallel Compression Cycle. Appl. Energy 2014, 135, 274–285. [Google Scholar] [CrossRef]
- Finckh, O.; Schrey, R.; Wozny, M. Energy and Efficiency Comparison between Standardized HFC and CO2 Transcritical Systems for Supermarket Applications. In Proceedings of the 23rd IIR International Congress of Refrigeration, Prague, Czech Republic, 21–26 August 2011. [Google Scholar]
- Hafner, A.; Försterling, S.; Banasiak, K. Multi-Ejector Concept for R-744 Supermarket Refrigeration. Int. J. Refrig. 2014, 43, 1–13. [Google Scholar] [CrossRef]
- Hafner, A.; Poppi, S.; Nekså, P.; Minetto, S.; Eikevik, T.M. Development of Commercial Refrigeration Systems with Heat Recovery for Supermarket Building. In Proceedings of the 10th IIR Gustav Lorentzen Conference on Natural Refrigerants, Delft, The Netherlands, 25–27 June 2012. [Google Scholar]
- Gullo, P.; Hafner, A.; Banasiak, K. Transcritical R744 Refrigeration Systems for Supermarket Applications: Current Status and Future Perspectives. Int. J. Refrig. 2018, 93, 269–310. [Google Scholar] [CrossRef]
- Gullo, P.; Hafner, A.; Banasiak, K.; Minetto, S.; Kriezi, E.E. Multi-Ejector Concept: A Comprehensive Review on Its Latest Technological Developments. Energies 2019, 12, 406. [Google Scholar] [CrossRef]
- Sun, Z.; Wang, Q.; Dai, B.; Wang, M.; Xie, Z. Options of Low Global Warming Potential Refrigerant Group for a Three-Stage Cascade Refrigeration System. Int. J. Refrig. 2019, 100, 471–483. [Google Scholar] [CrossRef]
- Purohit, N.; Sharma, V.; Sawalha, S.; Fricke, B.; Llopis, R.; Dasgupta, M.S. Integrated Supermarket Refrigeration for Very High Ambient Temperature. Energy 2018, 165, 572–590. [Google Scholar] [CrossRef]
- Saini, S.K.; Dasgupta, M.S.; Widell, K.N.; Bhattacharyya, S. Comparative Analysis of a Few Novel Multi-Evaporator CO2-NH3 Cascade Refrigeration System for Seafood Processing & Storage. Int. J. Refrig. 2021, 131, 817–825. [Google Scholar] [CrossRef]
- Zhang, Y.; He, Y.; Wang, Y.; Wu, X.; Jia, M.; Gong, Y. Experimental Investigation of the Performance of an R1270/CO2 Cascade Refrigerant System. Int. J. Refrig. 2020, 114, 175–180. [Google Scholar] [CrossRef]
- Sharma, V.; Fricke, B.; Bansal, P. Comparative Analysis of Various CO2 Configurations in Supermarket Refrigeration Systems. Int. J. Refrig. 2014, 46, 86–99. [Google Scholar] [CrossRef]
- Tsamos, K.M.; Amaris, C.; Mylona, Z.; Tassou, S. Analysis of Typical Booster Configuration, Parallel-Compressor Booster Configuration and R717/R744 Cascade Refrigeration System for Food Retail Applications. Part 2: Energy Performance in Various Climate Conditions. Energy Procedia 2019, 161, 268–274. [Google Scholar] [CrossRef]
- Llopis, R.; Nebot-Andrés, L.; Sánchez, D.; Catalán-Gil, J.; Cabello, R. Subcooling Methods for CO2 Refrigeration Cycles: A Review. Int. J. Refrig. 2018, 93, 85–107. [Google Scholar] [CrossRef]
- Cortella, G.; Coppola, M.A.; D’Agaro, P. Sizing and Control Rules of Dedicated Mechanical Subcooler in Transcritical CO2 Booster Systems for Commercial Refrigeration. Appl. Therm. Eng. 2021, 193, 116953. [Google Scholar] [CrossRef]
- Purohit, N.; Gullo, P.; Dasgupta, M.S. Comparative Assessment of Low-GWP Based Refrigerating Plants Operating in Hot Climates. Energy Procedia 2017, 109, 138–145. [Google Scholar] [CrossRef]
- Gullo, P.; Elmegaard, B.; Cortella, G. Energy and Environmental Performance Assessment of R744 Booster Supermarket Refrigeration Systems Operating in Warm Climates. Int. J. Refrig. 2016, 64, 61–79. [Google Scholar] [CrossRef]
- Gullo, P. Advanced Thermodynamic Analysis of a Transcritical R744 Booster Refrigerating Unit with Dedicated Mechanical Subcooling. Energies 2018, 11, 3058. [Google Scholar] [CrossRef]
- Drojetzki, L.; Porowski, M. The Problem of Selecting an Energy-Optimal Cooling System Using Natural Refrigerants in a Supermarket Application in a Humid Continental and Mediterranean Climate Conditions. Int. J. Refrig. 2022, 136, 184–208. [Google Scholar] [CrossRef]
- ASHRAE. 2018 ASHRAE Handbook: Refrigeration; ASHRAE: Atlanta, GA, USA, 2018; ISBN 9781939200983. [Google Scholar]
- Gaziński, B.; Krzyżaniak, G. Przechowalnictwo Żywności; Wydanie 2; Systherm D. Gazińska sp. j.: Poznań, Poland, 2013; ISBN 978-83-61265-76-4. [Google Scholar]
- Beck, H.E.; Zimmermann, N.E.; McVicar, T.R.; Vergopolan, N.; Berg, A.; Wood, E.F. Present and Future Köppen-Geiger Climate Classification Maps at 1-Km Resolution. Sci. Data 2018, 5, 1–12. [Google Scholar] [CrossRef]
- National Solar Radiation Database. Available online: https://nsrdb.nrel.gov/about/tmy.html (accessed on 1 July 2022).
- Danfoss Coolselector2. Available online: https://www.danfoss.com/en-gb/service-and-support/downloads/dcs/coolselector-2/ (accessed on 11 April 2023).
- Pardiñas, Á.; Jokiel, M.; Schlemminger, C.; Selvnes, H.; Hafner, A. Modeling of a CO2-Based Integrated Refrigeration System for Supermarkets. Energies 2021, 14, 6926. [Google Scholar] [CrossRef]
- Danfoss High Pressure Lift Ejector and Liquid Ejector Systems 2020, 28. Available online: https://assets.danfoss.com/documents/150968/AB351943880096en-000101.pdf (accessed on 11 April 2023).
- Minetto, S.; Brignoli, R.; Zilio, C.; Marinetti, S. Experimental Analysis of a New Method for Overfeeding Multiple Evaporators in Refrigeration Systems. Int. J. Refrig. 2014, 38, 1–9. [Google Scholar] [CrossRef]
- Hafner, A.; Banasiak, K. Full Scale Supermarket Laboratory R744 Ejector Supported & AC Integrated Parallel Compression Unit. In Proceedings of the 12th IIR Gustav Lorentzen Conference on Natural Refrigerants, Édimbourg, UK, 21–24 August 2016; pp. 949–956. [Google Scholar]
- Gullo, P.; Hafner, A.; Cortella, G. Multi-Ejector R744 Booster Refrigerating Plant and Air Conditioning System Integration—A Theoretical Evaluation of Energy Benefits for Supermarket Applications. Int. J. Refrig. 2017, 75, 164–176. [Google Scholar] [CrossRef]
- Bitzer GMBH Bitzer Selection Software. Available online: https://www.bitzer.de/websoftware/ (accessed on 11 April 2023).
- Dorin S.p.A. Refrigeration Compressor Types Software. Available online: https://www.dorin.com/en/Software (accessed on 11 April 2023).
- Poznan University of Life Sciences Metheorological Station Marcelin. Available online: http://woak.up.poznan.pl/pl/pracownik/stacja-meteo-na-marcelinie (accessed on 11 April 2023).
Disclaimer/Publisher’s Note: The statements, opinions and data contained in all publications are solely those of the individual author(s) and contributor(s) and not of MDPI and/or the editor(s). MDPI and/or the editor(s) disclaim responsibility for any injury to people or property resulting from any ideas, methods, instructions or products referred to in the content. |
© 2023 by the authors. Licensee MDPI, Basel, Switzerland. This article is an open access article distributed under the terms and conditions of the Creative Commons Attribution (CC BY) license (https://creativecommons.org/licenses/by/4.0/).