Abstract
This paper presents an economic assessment of three drying systems (DS) with different configurations: diesel-powered (DDS), grid-powered (GDS), and photovoltaic-powered (PVDS). The third configuration, PVDS, presents important technological innovations regarding the electric configuration (stand-alone PV, without batteries or grid support) and the heat pump technology used (optimized for drying the recirculated air, which permits a reduction in the electricity consumption by more than 45% if compared to a diesel air-heater or an electric resistance). The profitability of the investment required for the installation of the three systems is proven by calculating the profitability index (PI), the internal rate of return (IRR), the payback period (PBP), and the levelized cost of energy (LCOE). All the indicators show good profitabilities for the three technologies (the PI values range from 6.78 to 10.11, the IRR values range from 24% to 37%, and the PBPs are between 3 and 4 years), but the PVDS clearly offers important economic advantages: its PI and IRR are more than 40% higher, the PBP is 25% shorter, and the LCOE is between 40 and 47% lower than for the two other systems. The results of this analysis correspond to a particular base case but are obviously sensitive to geopolitical and economic changes: the ultimate strength of the PVDS configuration is its resilience against a possible rise in electricity and diesel prices, reducing the uncertainty for investors and policymakers.
1. Introduction
In recent years, the benefits obtained from the production of irrigated crops have been significantly reduced for farmers with modernized irrigation systems. For example, in the region of La Rioja (northern Spain), the surface used for irrigated potato crops has decreased by 52% in the last 10 years and by 36% for beetroot crops [1]. The main causes are a reduction in the unit prices paid by the intermediaries, the withdrawal of state subsidies to the farmers, and increasing electricity costs. A possible way of mitigating these problems is the substitution of these crops with alfalfa, as this fodder presents a high added value (typically being sold for feeding racehorses). In Spain alone, the annual alfalfa market represents between EUR 240 and 520 M, similar to Australia, and in the USA, this market represents USD 1500 M [2]. Additionally, alfalfa is considered a fallow crop, permitting the obtainment of benefits from the land when it is theoretically resting. The main inconvenience of alfalfa is that, once it is baled, it needs to contain a relative humidity of less than 25%; otherwise, there is a risk of fermentation, reducing its nutritive properties and even starting fires in storage facilities. The simplest way of reaching this low humidity is to let the crop dry naturally on the land, exposing it to the sun once it has been harvested. However, this sun exposure reduces the nutritional properties of the alfalfa and might take too long depending on the climatic conditions, limiting the number of annual cuts. In humid regions, farmers are usually forced to use drying technology as a support to sun exposure, with consequent energetic and economic costs. This is the reason why alfalfa production is more extensive in sunny, dry regions than in humid ones, even if the latter usually offers more productive land.
For decades, the combination of an air heater and turbine that forces the hot air through the bale has been a popular drying technology [3,4,5,6]. Both the heater and the turbine are typically diesel- and/or grid-powered, resulting in an elevated economic cost and a high environmental impact (particularly for diesel-powered systems, which are the most common ones). The increasing prices of fossil fuels and electricity have compromised the economic viability of these installations to the point that the farmer sometimes chooses to lose the crop rather than dry it. As an alternative, recent studies have evaluated the use of solar thermal energy to substitute the use of fossil fuels or non-renewable electricity [7,8,9]. Kosan et al. analyzed the performance of a double-chamber solar collector specifically for drying alfalfa, obtaining good results [7]. Extensive reviews on solar thermal drying technologies show that they can reduce energy consumption by 15–80% [8] and that there is a niche for small and medium food producers [9]. The use of photovoltaic (PV) generators for powering drying systems has also been studied in recent years [10,11,12,13], partly because of the huge drop in PV prices and the climatic crisis associated with the massive use of fossil fuels. Bennamoun et al. [10] and Barisik et al. [11] showed the energetic and economic potential of incorporating PV energy into drying systems, whether it is combined with solar thermal energy (into the so-called PVT collectors) or only PV. Rezvani et al. [12] and Fterich et al. [13] published experimental studies that showed the good performance of PVT collectors for drying applications.
In addition to the energy source used for powering the system, there is also room for improvement in the way the humidity of the alfalfa bales (or any other product that needs to be dried) is extracted. The use of heat pumps (HP) as air heaters, instead of diesel heaters or electric resistances, can reduce electricity consumption. Jin Goh et al. [14] affirm that the use of HPs in drying systems can improve the quality of the product and reduce energy costs. Several experimental studies showed the good performance of heat pump dryers with different configurations [15,16,17]. The first novelty of this paper is that this study presents an additional innovation for making this reduction even more significant: the use of an HP technology particularly optimized for air-drying [18]. Once the air has absorbed the humidity from the alfalfa bales, the humidity is condensed to obtain very dry air that is then recirculated through the alfalfa.
Finally, the combination of HP units and PV generators has been widely explored in previous works (not only for drying applications), but always with one of the following electric configurations: grid-connected systems (with or without selling the PV surplus to the grid) [19,20,21] or stand-alone systems with batteries or another type or storage support [10,22,23]. The second novelty of this paper is based on the fact that this study uses a PV system composed of a PV generator and a frequency converter (FC) for powering the HP drier but without any grid or electricity energy storage (EES) support. This is possible thanks to a technical solution developed at the Solar Energy Institute of the Polytechnic University of Madrid (IES-UPM) [24]. This stand-alone configuration permits a reduction in the operating costs and the CO2 emissions associated with the drying process to virtually zero. This new combination of stand-alone PV heat pumps with air-drying heat pumps will be denominated here as a photovoltaic-powered drying system (PVDS).
The objective of this paper is to evaluate the economic feasibility of this innovative PVDS compared to two traditional drying systems: diesel- and grid-powered systems. This assessment includes:
A comparative economic viability analysis of the monetary investment required to install a diesel-powered drying system (DDS), a grid-powered drying system (GDS), and a PVDS. The return on investment is compared for these three options, where the main difference is the operational costs associated with energy generation. The results are expressed in terms of the profitability index (PI), internal rate of return (IRR), and payback period (PBP).
An estimation of the savings in terms of the levelized cost of energy (LCOE), comparing the PVDS solution to the diesel- and grid-powered ones.
An estimation of the CO2 savings with PVDS compared to the other systems.
The rest of the paper is structured as follows: Section 2 includes a nomenclature table, Section 3 describes the methodology for the economic assessment, Section 4 presents and discusses the base-case results, Section 5 presents a sensitivity analysis, and Section 6 summarizes the main conclusions of this work.
2. Nomenclature
In order to facilitate the reading of the following sections, Table 1 includes the nomenclature used in this paper for referring to technical terms and variables (units are in brackets).

Table 1.
Nomenclature used in this paper for referring to technical terms and variables (units are in brackets).
3. Methodology
This paper compares the economic profitability and environmental impact of three different drying systems: a diesel-powered drying system (DDS) and a grid-powered drying system (GDS)—both composed of an air heater and an electric turbine—and a PV-powered drying system (PVDS) composed of an air-drying HP unit exclusively fed by a PV system. The methodology used for this evaluation is described in the following sections. Firstly, the energy consumption required for drying a certain number of bales per year is estimated for the three systems, as well as the corresponding CO2 emissions. Secondly, the sizing of the PV generator for the PVDS is established based on the estimated energy consumption, considering some energy losses that are inherent in these types of applications (as opposed to grid-connected PV systems). Finally, this section describes in detail the methodology used for the economic viability analysis and for the LCOE of the three systems.
3.1. Energy Consumption and CO2 Emissions
Figure 1 presents the schematic of the three systems under study: the DDS (a) is composed of an air heater and a diesel generator that powers a turbine that draws hot air through the alfalfa bales; the GDS (b) is composed of electric resistance that acts as the air heater, and an air turbine that is now powered by the grid; the PVDS (c) is composed of an air-drying HP unit and an air turbine, both powered just by a PV generator through seldom frequency converters.
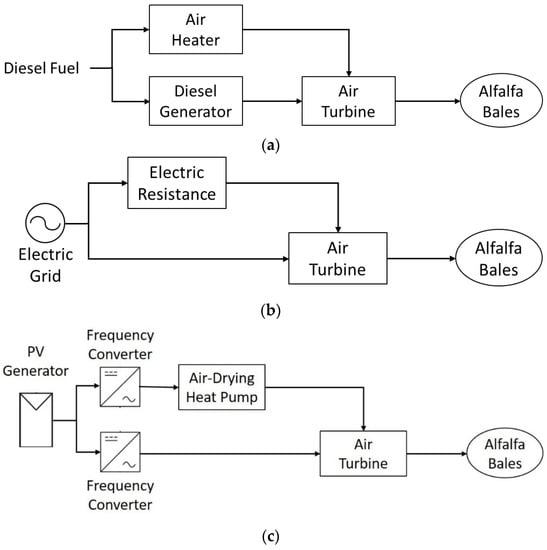
Figure 1.
Schematic of the diesel-powered drying system (a), grid-powered drying system (b), and PV-powered drying system (c).
According to different interviews with farmers [25], a DDS consumes 50 L/h (for powering both the air heater and the air turbine) and dries approximately 2.5 tons/h of alfalfa (dry matter). From this information, the hourly energy consumption of the three systems (DDS, GDS, and PVDS) was estimated. Finally, the results were scaled up for drying 60 tons of alfalfa (dry matter) per year under the hypothesis that the consumption increases linearly with the volume of dried product.
- −
- DDS: The diesel consumption of the DDS has been split in two: from the 50 L/h consumed for drying 2.5 tons of alfalfa, 37 L/h is consumed by the air heater, and 13 L/h is consumed by the diesel generator for powering the air turbine [25]. Considering 9.85 kWh/L as the inferior caloric value of the diesel fuel and an average efficiency of 90.6% for the air heater [26], the hourly consumption of the air heater is 330.3 kWh. On the other hand, the diesel generator consumes 45.5 kWh, assuming an average energy output per diesel fuel consumption of 3.5 kWh/L [27]. In total, the DDS system consumes 375.8 kWh to dry 2.5 tons; to dry 60 tons per year, it would consume 9019.2 kWh/year (considering a proportional increase). Finally, for an average CO2 emission intensity of 2790 gCO2/kWh [28], this consumption generates 25.16 metric tons of CO2/year.
- −
- GDS: The electric resistance must generate the same thermal energy as the air heater of the DDS (that is, 330.3 kWh, as explained in the previous paragraph). To do so with an efficiency of 99% [29], it must consume 333.6 kWh. As for the air turbine, it consumes the same 45.5 kWh as the DDS (there is no difference between the two systems in the way they pulse the hot air through the bales). In total, the GDS system consumes 379.1 kWh to dry 2.5 tons; to dry 60 tons per year, it would consume 9099.4 kWh/year (again, assuming a proportional increase). For a conversion factor of 259 gCO2/kWh of electric grid [28], this consumption generates 2.35 metric tons of CO2/year.
- −
- PVDS: The HP dryer used in this study has an average drying capacity of 21 L of water per hour, with an average electric consumption of 0.20 kWh per liter of water [18]. Assuming that the alfalfa bales have an initial relative humidity of 27.5% and that they need a final humidity of 12%, the HP needs to extract 96 l of water per bale [25]. Each bale weighs 396 kg (dry matter) [25], so the annual consumption required for drying 60 tons of alfalfa is 4715.66 kWh/year. Note that this represents savings in terms of electricity consumption of close to 50% compared to the DDS and GDS. Additionally, this energy consumption does not generate CO2 emissions (for the PV energy, the emissions are associated only with the manufacturing and transport of the system components, not considered in this work).
Table 2 summarizes the values of electricity consumption and CO2 emissions given in the previous paragraphs for easily comparing the three systems under study (numbers between parenthesis are the savings in energy consumption, comparing the DDS and GDS to the PVDS.
Table 2.
Values of yearly electricity consumption and CO2 emissions estimated for the three systems under study. Values between parenthesis are the savings in terms of electricity consumption if a PVDS was used instead of a DDS or GDS.
3.2. Sizing of the PV Generator for the PVDS System
The performance ratio (PR) of a PV system is the total AC energy obtained over a certain time period divided by the DC energy that could have been generated in ideal conditions. For an expected PR value, it is easy to calculate the peak power (i.e., installed power) of the PV generator, , that is required for a certain AC energy demand, according to the following expression [30]:
where is the AC energy from the PV generator, is the maximum power of the PV generator in standard test conditions (STC), is the global solar irradiance in the plane of the generator at STC (1000 W/m2) and is the global solar irradiance on the plane of the generator.
PR values for grid-connected systems are typically between 0.75 and 0.9 [31,32,33] because they can theoretically inject all of the PV electricity produced into the grid. However, when the PV generator is connected to an intermittent load, such as the drying system described here, it is almost impossible to reach such high PR values. There are three main causes of additional energy losses: the drying period might only be several months rather than the whole year, the operating power ranges of the drying system components (even if they allow variable speed, they can only be turned on when a certain threshold of power is available), and the decisions made by the final user (who can choose to dry during some hours of the day and not during others, depending, for example, on the alfalfa availability). In previous works, the IES-UPM developed a methodology for considering the energy losses associated with this application (and not with the quality of the PV system itself) based on the factorization of the traditional PR [34]:
where is the PR considering only losses strictly associated with the PV generator itself (i.e., actual versus nominal peak power, dirtiness, thermal and DC/AC conversion losses), is the utilization ratio (UR) that reflects the energy losses associated with the drying period (Dp), is the UR that reflects the energy losses associated with the operating power ranges of the drying system, and is the UR that reflects the energy losses associated with the end user of the system.
By combining Equations (1) and (2), if the designer of the PV system knows the AC energy demand of the drying process, the total yearly solar irradiation on the plane of the PV generator at the system locationand the expected energy losses, the calculation of the required PV peak power is immediate. The AC energy demand was estimated in Section 3.1, and the monthly and yearly solar irradiation was obtained using the simulator of PV systems SISIFO [35] for a PV generator on a static structure, south-oriented, and tilted 30°, located in Zarratón (Spain). This simulator takes the typical meteorological year (hourly irradiance and temperature series of data that best represent median weather conditions) generated by the PVGIS database [36] for a given location. Then, it uses the correlations of Erbs [37] for splitting horizontal global irradiation into its direct and diffuse components and the Perez model [38] for the transposition from horizontal to the plane of the generator. The Dp for the alfalfa is from May to September, which means a value of 0.52. Unfortunately, there are no experimental records for this specific application that permit the estimation of the remaining expected energy losses. To partially solve this barrier, the authors have remitted to the values obtained for real PV-powered irrigation systems that have been designed and monitored by the IES-UPM [39]. Irrigation systems and heat pump drying systems have in common that their main electric loads (i.e., the water pump and the refrigerant compressor) can operate at variable speeds, so the causes for the energy losses reflected in the PR factorization are the same.
Table 3 presents the input values used for the sizing of the PV generator, as well as the corresponding value of according to Equations (1) and (2):
Table 3.
Input values used for the sizing of the PV generator of the PVDS and the corresponding PV peak power that needs to be installed.
3.3. Economic Viability Analysis
The viability of the monetary initial investment cost (IIC) required for installing each of the drying systems is expressed in terms of the PI, IRR, and PBP. The values of these indicators are determined by the annual cash flows (CFn) during the lifetime of the system (25 years), defined as the difference between the annual profits and costs, following Crundwell’s guidelines [40]. The annual profits () match the revenue from selling the alfalfa bales and are the same for the three systems, while the annual costs, consisting of the operation and maintenance () and amortization costs (), will differ in each case. In general, the annual CFs are given by the following equation:
where is EUR 18,000 (assuming a selling price of 300 EUR/t [41], was calculated for a constant amortization linear coefficient of 7% of the IIC [42], and t, the corporate tax rate in Spain, which is 25% [43]. Table 4 shows the input values given to the remaining variables for the three drying systems.
Table 4.
Initial investment cost (IIC) and annual operation and maintenance cost (OMn) considered for the diesel-powered drying system (DDS), grid-powered drying system (GDS), and photovoltaic drying system (PVDS). All the costs include a value-added tax or VAT of 21% for Spain.
Finally, the three economic viability indicators are calculated from the CFs according to Equations (4)–(6). The PI is defined as the present value of future cash flows divided by the IIC, the IRR is the interest rate at which the IIC is returned at the end of the lifetime of the project, and the PBP is the period of time needed for the IIC to be returned with the present value of CFs:
where i is the interest rate, which has been given the value 0.8% (the average in the last 10 years in Spain [43].
3.4. Levelized Cost of Energy (LCOE)
LCOE is defined as the lifetime cost of a certain energy generation system (including the IIC and OM costs) divided by the total energy production (EP) during this lifetime [49]. The resulting LCOEs are given by the following equations, according to the US EIA:
where EPn,DDS = 9017.92 kWh, EPn,GDS = 9098.00 kWh, and EPn,PVDS = 4715.66 kWh (see Section 3.1), and the rest of the input values are taken from Table 4.
4. Results and Discussion
4.1. Results of the Economic Viability Analysis
For the installation of a drying system to be economically viable, whether it is powered by a diesel generator, the electric grid, or a PV system, the PI must be larger than 1, the IRR must be higher than the national interest rate, and the PBP should be significantly lower than the lifetime of the system [40]. Table 5 shows the PI, IRR, and PBP values of the economic investment required for installing a DDS, a GDS, and a PVDS. It can be observed that such an investment is profitable in any case: the PI values are 7.03, 6.78, and 10.11, the IRR values are 25.7%, 24.9%, and 37.1% (much higher than the interest rate considered as reference, 0.8%), and the PBP values are 4 and 3 years, less than a quarter of the lifetime of the system. The profitability is significantly better for the PVDS (the PI and IIR are more than 40% higher) because not only is the IIC lower for this system, but (and especially) so are the OM costs. If comparing the two other systems, the DDS is slightly more profitable than the GDS because the unit cost of diesel fuel is lower than the electricity costs. However, the difference is not particularly significant (the PI and IIR are only 3% higher), and this situation could easily be reversed in the current landscape of fossil fuel scarcity.
Table 5.
Profitability index (PI), internal rate of return (IRR), and payback period (PBP) of the economic investment required for installing a diesel-powered drying system (DDS), a grid-powered drying system (GDS), and a PV-powered drying system (PVDS).
4.2. Results for the Levelized Cost of Energy (LCOE)
Table 6 presents the LCOE of the three systems under study (DDS, GDS, and PVDS), as well as the savings in terms of LCOE of the PVDS compared with the two other systems. These savings are more than 40% in both cases, indicating that the cost per unit energy consumption is lower if using a PVDS. As well as with the economic profitability, the results are better for the DDS than for the GDS. The electricity costs (including energy and power costs) are higher than the diesel costs (including the fuel and OM), resulting in a bigger LCOE (and smaller LCOE savings).
Table 6.
Levelized cost of energy (LCOE) of the diesel-powered drying system (DDS), the grid-powered drying system (GDS), and the PV-powered drying system (PVDS), and savings of the PVDS system compared to the DDS and GDS.
4.3. General Discussion
Considering the economic viability results (the PI values range from 6.78 to 10.11, the IRR values range from 24% to 37%, and the PBP are between 3 and 4 years) and the LCOE values (which range from 0.31 to 0.52 EUR/kWh) obtained in this assessment, it can be stated that the PVDS solution presents significant advantages over the DDS and GDS. The economic investment required for installing the PV system and the heat pump dryer is 44% and 49% more profitable than for installing diesel- or grid-powered configurations, respectively. This is reflected in the PI and IRR values (10.11 EUR/EUR and 37.1% for the PVDS). The monetary costs of generating the energy required for the drying process are also 40% and 47% lower with the PVDS solution. This is reflected in the LCOE (0.31 EUR/kWh for the PVDS). Moreover, these results are not likely to be reversed in the short term, considering the current landscape of fossil fuel scarcity. Diesel fuel costs are expected to decrease slightly in the very short term but then slowly start to increase after 2–3 years, while electricity prices are expected to fluctuate around current values but also slowly increase on average [50].
Furthermore, it should be taken into account that the PV solution is not only more economical but also consumes less energy (less than 50% of the energy consumption of the DDS and GDS) and produces fewer pollutants (although the life cycle assessment of the three systems in terms of CO2 emissions is not considered in this work, the PVDS solution does not emit greenhouse gases during its operation, while the DDS and GDS emit 25.16 and 2.33 metric tons CO2/year, respectively). This is especially relevant for mitigating climatic change, one of the cornerstones of European energy policies.
Finally, there is an additional benefit of using PV-powered systems that is not reflected in an economic assessment but should be considered when considering different options: it is an independent and reliable power supply that does not depend on any generation and/or transportation infrastructure. If combined with electricity storage systems, it can be more reliable than the electric grid, especially in remote locations. This additional advantage is becoming more and more relevant in market assessments due to the increasing fear of electric and/or diesel fuel supply deficiencies.
4.4. Discussion on the Initial Investment Cost for the PVDS
As already discussed, the use of PV energy for drying applications presents important economic, energetic, and environmental advantages, as well as offering a reliable electric supply. This paper intends to be useful for farmers considering new investments in drying infrastructures. In light of this objective, the authors include in this section a short discussion on the IIC, or CAPEX (as usually named in the PV sector), of the PV system that would be necessary for drying a certain volume of alfalfa per year. It should be highlighted that the volume of alfalfa considered for the base case of this analysis requires a small PV system of only 7 kWp. The CAPEX for bigger PV systems is much smaller, both in terms of the installed PV peak power and tons of dried alfalfa per year, as shown in Figure 2 [44]. A PV system of 1 kWp would permit the drying of around 9 tons of alfalfa per year at a unit cost of 0.23 EUR/ton; with a PV system of 10 MWp, more than 85,000 tons of alfalfa could be dried at a unit cost of 0.07 EUR/ton. The selling price of the alfalfa would essentially be the same as the one considered for the base case (because it is set in an international market according to international production and demand), so the economic profit from using PV energy could be significantly higher for larger-scaled systems.
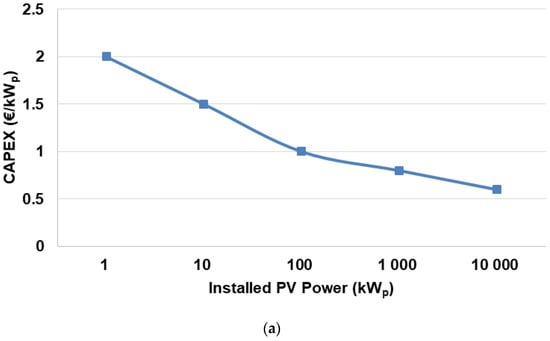
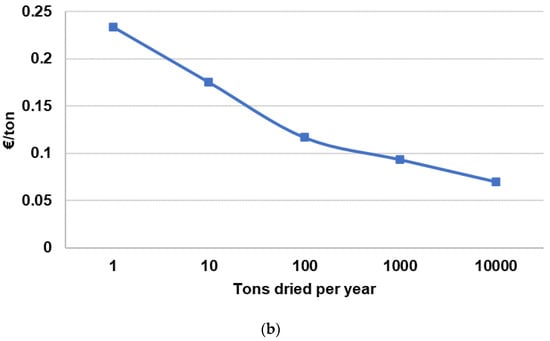
Figure 2.
Unit cost per unit of installed PV power (a) and per ton of dried alfalfa (b) for different system sizes, from a small scale (1 kWp) to a large scale (10 MWp).
5. Sensitivity Analysis
The results previously presented are conditioned by the inputs introduced into the model, some of which are currently subject to significant variations. For example, a diesel price of 0.85 EUR/l has been considered, which is conservative as recent geopolitical events have increased fossil fuel costs in Europe up to historical values. Therefore, to generalize these results, it is necessary to carry out a sensitivity analysis with respect to the most important input variables. This section presents the variability of the final results for the most relevant variables of the model.
5.1. Annual Variation in Electricity Prices
For the base case of this assessment, an annual increase of 3% for the electricity costs has been considered. Figure 3 shows the PI of the GDS (a), the LCOE (b), and the LCOE savings—comparing the PVDS with the GDS—(c) obtained for an annual variation in electricity prices between −6% and +12%. The PI follows a polynomial trend and the LCOE follows an exponential trend, tending to 7.18 (EUR/EUR) and 0.51 (cEUR/kWh) if there was no annual variation in the electricity prices. The LCOE savings of the PVDS follow a linear trend.
Figure 3.
Profitability index (a), levelized cost of energy (b), and LCOE savings compared to the grid-powered drying system (c) obtained for an annual variation in electricity prices between −6% and +12%.
The IRR and PBP values are also sensitive to this variable, but it is easier to visually identify when an investment stops being profitable (PI < 1) simply by looking at the PI. In this case, the investment required for the GDS would cease to be profitable if the electricity prices increased more than 16.40% annually. The LCOE of the GDS increases very rapidly with the increase in the price of energy, to the point that it quadruples when increasing from −6% to 12%. The LCOE of the GDS would be lower than that of the PVDS (hence, LCOE savings would become LCOE losses) if the prices decreased by at least 9% annually. In any case, the current energetic and geopolitical landscape is already inflating electricity prices above 3% annually in Europe, suggesting that the actual results could benefit the PVDS even more than the base case considered here.
5.2. Annual Variation in Diesel Fuel Price
For the base case of this assessment, an annual increase of 3% has been assumed for diesel fuel costs. Figure 4 shows the PI of the DDS (a), the LCOE (b), and the LCOE savings—comparing the PVDS with the DDS—(c) obtained for an annual variation in diesel fuel costs between −6% and +12%. The PI follows an exponential trend and the LCOE follows an exponential trend, tending to 7.35 (EUR/EUR) and 0.46 (cEUR/kWh) if there was no annual variation in the diesel prices. The LCOE savings, on the other hand, follow a linear trend.
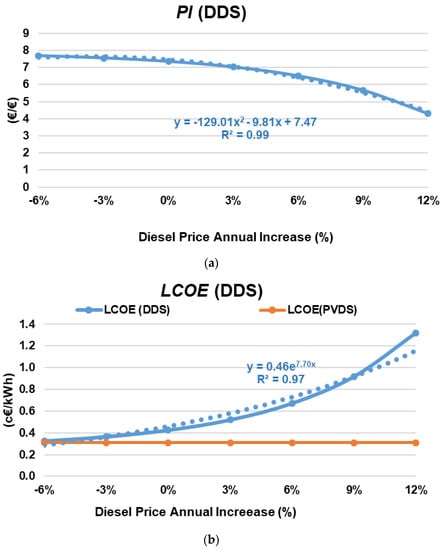
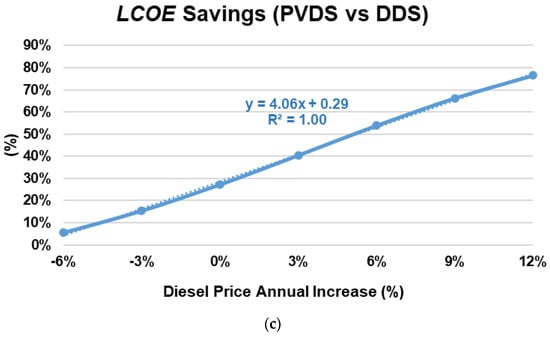
Figure 4.
Profitability index (a), levelized cost of energy (b), and LCOE savings compared to the diesel-powered drying system (c) obtained for an annual variation in diesel fuel costs between −6% and +12%.
In this case, looking again at the PI, the investment required for the DDS would remain profitable until annual diesel prices rise by more than 18.89%. Similarly, the LCOE of the DDS increases rapidly with the increase in the price of diesel. LCOE savings would become LCOE losses if the diesel prices decreased by at least 7% annually. As with electricity costs, current diesel fuel prices are increasing at a higher rate than in the base case of this study, so higher returns from PV solutions can be expected.
5.3. Interest Rate
For the base case of this assessment, the interest rate has been given an average value of 0.8%. Figure 5 shows the PI (a), LCOE (b), and LCOE savings (c) obtained for an interest rate between 0% and 10%. The PI and LCOE follow an exponential trend tending to 6.78, 7.03, and 10.11 (EUR/EUR) for GDS, DDS, and PVDS, respectively, and 0.59, 0.52, and 0.31 (cEUR/kWh) for GDS, DDS, and PVDS, respectively, when the interest rate is zero. LCOE savings, on the other hand, follow a linear trend.
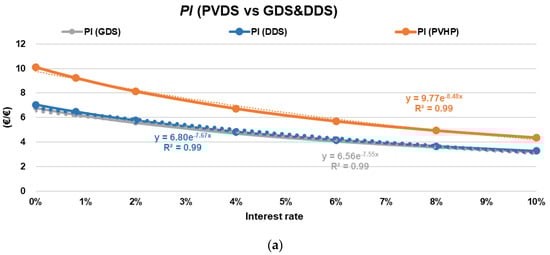
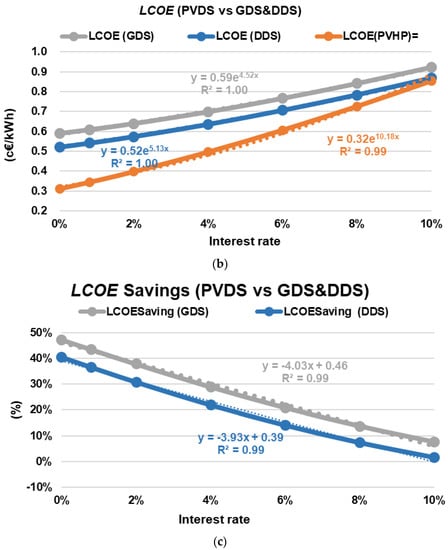
Figure 5.
Profitability index (a), levelized cost of energy (b), and LCOE savings (c) obtained for an interest rate between 0% and 10% for the cases PVDS vs. DDS and PVDS vs. GDS.
The investments required to install a GDS, DDS, or PVDS would still be profitable even if the interest rate increased to 10%. In European countries, economic disturbances of this magnitude are extremely rare. The LCOE values of the GDS and DDS systems increase with the interest rate, but the LCOE of the PVDS increases faster. Consequently, the LCOE savings decrease, reaching almost 0% in the case of PVDS vs. DDS when i = 10%.
5.4. Lifetime of the System
For the base case of this evaluation, the useful life of the system is 25 years. However, this can change if, for example, the PV array experiences annual degradation rates other than 0.8% (as assumed for this analysis). Figure 6 shows the PI (a), LCOE (b), and LCOE savings (c) obtained for a system life between 15 and 30 years. The PI and LCOE follow a linear trend, increasing by 0.20, 0.22, and 0.35 EUR/EUR for each additional year of useful life of the GDS, DDS, and PVDS, respectively. LCOE savings also follow a linear trend.
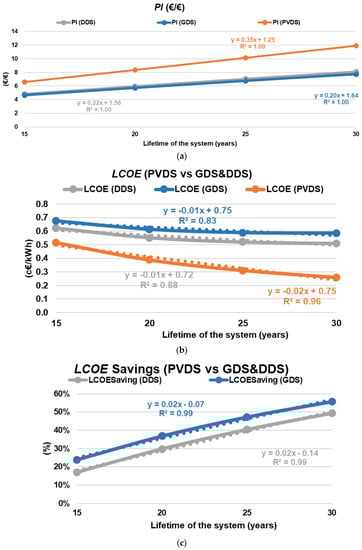
Figure 6.
Profitability index (a), levelized cost of energy (b), and LCOE savings (c) obtained for a lifetime of the system between 15 and 30 years for the cases PVDS vs. DDS and PVDS vs. GDS.
The investments required to install a GDS, DDS, or PVDS would still be profitable even if the useful life of the system were 15 years. Today’s manufacturing techniques and quality control procedures make PV systems very robust, so warranties now typically cover periods of more than 15 years. The LCOE of all three systems decreases with the system life, but to a lesser extent for PVDS. Consequently, the LCOE savings are also higher for longer lives. If the system lasted only 15 years, the PVDS would have a lower LCOE than DDS and GDS (LCOE savings would be positive).
5.5. Global Annual Irradiation
For the base case of this assessment, the size of the PV generator required for drying a certain amount of alfalfa per year has been determined for a specific location. However, other locations with different climatic conditions could require larger or smaller PV generators to generate the same AC energy. This would depend on the global solar annual radiation received in the plane of the given PV generator, which, according to Equation (1), would lead to a certain PV power, with the corresponding IIC. Figure 7 shows the PI of the PVDS obtained for variations in the annual irradiation between −30% and 30% of the base case value. Obviously, the profitability of the DDS and GDS is not affected by this input.
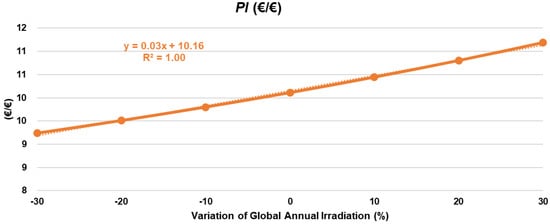
Figure 7.
Profitability index of the PVDS obtained for a variation in the global annual irradiation between −30% and 30% from the base case value.
The sensitivity of the PI to the global annual irradiation is low, following a linear trend with a slope of 0.03. The more irradiation received in a certain location, the smaller the PV generator required for drying the same amount of alfalfa and the smaller the corresponding IIC. However, the effect of this input parameter is not significant if compared to other variables, as shown in the previous sections of this sensitivity analysis. The sensitivity of the LCOE is even smaller, so the results have not been reported in this paper.
6. Conclusions
6.1. Results of the Study
The substitution of irrigated crops such as potato or beetroot with alfalfa is a good alternative for farmers in the northern region of Spain. However, drying alfalfa for its conservation during transportation is currently an expensive and polluting process, whether it is carried out using a diesel-powered or grid-powered system. This paper evaluates and compares the economic benefits of installing the traditional drying systems, DDS and GDS, with the profitability of installing a PV-powered one (PVDS), mainly composed of a PV system and an air-drying heat pump. An economic viability assessment has been performed, obtaining the profitability index (PI), internal rate of return (IRR), and payback period (PBP); the LCOE of the three drying technologies have been estimated and a sensitivity analysis has been included.
The PVDS solution reduces the energy consumed by more than 50%, and the CO2 emitted is virtually zero. This helps to mitigate the current energy crisis and climate change.
PI values are larger than 1 (indicating that the investment is profitable) whether a DDS, GDS, or PVDS is installed. The profitability is higher for PVDS (PI = 10.11), followed by DDS (PI = 7.03), and lastly, GDS (PI = 6.78), mainly due to the high prices of electricity (especially the costs of energy).
IRR values are much higher than the Spanish interest rate (with an average value of 0.8%), showing good profitability. Again, the best IRR is obtained for PVDS (IRR = 37.16%), followed by DDS (IRR = 25.66%), and finally, GDS (IRR = 24.85%). PVDS is better from an economic point of view.
PBP periods are one-eighth to one-sixth of the lifetime of the system (4 years for DDS, 4 years for GDS, and 3 years for PVDS, compared to a 25-year useful life). This means that after these 3 or 4 years of life, there are only financial benefits and no losses.
The three drying configurations present LCOE of EUR 0.59/kWh (GDS), EUR 0.52/kWh (DDS), and EUR 0.31/kWh (PVDS). This suggests that installing a photovoltaic generator and an HP dryer implies an LCOE savings of 47.34% compared to GDS and 40.45% compared to DDS.
The results of the economic evaluation are sensitive to electricity prices, diesel fuel costs, interest rates, and the useful life of the system. The scenarios in which there would be no LCOE savings with the PVDS are the following: annual variation in electricity or diesel costs at −7% or more, interest rates greater than 10%, or a system life of fewer than 9 years. However, it is likely that energy prices will continue to rise, albeit at a slow pace. Finally, photovoltaic systems are already a very mature technology, and manufacturers offer guarantees of more than 15 years for their products.
The economic viability indicators (the PI, IRR, and PBP) reflect the profitability of a monetary investment—in other words, how much money can be earned for a certain initial capital investment. The LCOE, on the other hand, reflects the economic cost of generating a certain amount of energy. The first indicators are useful for possible investors; the second indicators are useful for policymakers. In any case, the results presented in this paper show that the PVDS solution is beneficial from both points of view.
6.2. Future Lines of Work
The study presented here is a starting point and is limited to certain conditions and hypotheses, but it can be extended by means of more detailed considerations.
The location considered in this study has been selected because there is currently an actual need for drying systems that do not depend on diesel generators and turbines, which consume a lot of electricity and are very polluting. However, it would be useful to estimate the profitability of PVDS systems in regions with different climatic conditions, which could affect not only the available solar energy but also the production of alfalfa and even the drying period.
This study has only considered PV stand-alone configurations. However, there can be other situations where hybrid configurations could also be very beneficial (or even the only solution if it is necessary to dry during the night or during not-sunny periods of the year). The analysis of the feasibility of these solutions could be the subject of future research.
As mentioned in Section 4, the bankability of PV projects often relies on the values estimated for the PR of the system, which in certain applications can be affected by factors that do not depend on the quality of the PV system (i.e., the PV system is underused during periods where there is no need to dry). It would be very useful if future works included information related to the specificities of the application, such as the drying needs of the crop to be dried (alfalfa or other agricultural products).
Author Contributions
Conceptualization, C.L. and L.N.; methodology, A.Q., C.L. and L.N.; validation, C.L. and L.N.; investigation, A.Q.; resources, C.L. and L.N.; data curation, A.Q.; writing—original draft preparation, A.Q.; writing—review and editing, C.L. and L.N.; supervision, L.N.; project administration, C.L.; funding acquisition, A.Q. and L.N. All authors have read and agreed to the published version of the manuscript.
Funding
Gobierno de La Rioja: 23M_20; Comunidad de Madrid: P2018/EMT-4308.
Informed Consent Statement
Not applicable.
Data Availability Statement
The data presented in this study are available on request from the corresponding author.
Acknowledgments
This work was carried out within the framework of the HENBOCA-FV project (file 23M_20), financed by the Government of La Rioja, the Ministry of Agriculture, Fisheries and Food, and the European Commission through the Rural Development Program of La Rioja 2014–2020. This work is part of Project MADRID-PV2 (P2018/EMT-4308), funded by the Comunidad de Madrid, Spain, with support from ERDF Funds.
Conflicts of Interest
The authors declare no conflict of interest.
References
- Government of La Rioja. Historic Crops Data. Available online: https://www.larioja.org/agricultura/es/estadistica-agraria/datos-historicos-cultivos (accessed on 20 December 2022).
- 1214-Swedes, Mangolds, Fodder Roots, Hay, Alfalfa, Clover, Sainfoin, Forage Kale, Lupines, Vetches and Similar Forage Products, Whether or Not in the Form of Pellets. Available online: https://www.trademap.org/ (accessed on 20 December 2022).
- Pardo, E.D.; Garcia, C.R. Praderas y Forrajes, Producción y Aprovechamiento; Mundi-Prensa: Madrid, Spain, 1984; pp. 438–519. [Google Scholar]
- VijayaVenkataRaman, S.; Iniyan, S.; Goic, R. A review of solar drying technologies. Renew. Sustain. Energy Rev. 2012, 16, 2652–2670. [Google Scholar] [CrossRef]
- Borah, A.; Sethi, L.; Sarkar, S.; Hazarika, K. Effect of Drying on Texture and Color. J. Food Process Eng. 2015, 40, 1745–4530. [Google Scholar]
- Holt, G.; Hooker, J. Gaseous emissions from burning diesel, crude and prime. Bioresour. Technol. 2004, 92, 261–267. [Google Scholar] [CrossRef] [PubMed]
- Koşan, M.; Dolgun, G.K.; Aktekeli, B.; Sacilik, K.; Aktaş, M. Design and analysis of new solar-powered sustainable dryers: Alfalfa crop. Food Process Eng. 2023, 46, 12. [Google Scholar] [CrossRef]
- Lingayat, A.; Zachariah, R.; Modi, A. Current status and prospect of integrating solar air heating systems for drying in various sectors and industries. Sustain. Energy Technol. Assess. 2022, 52, 102274. [Google Scholar] [CrossRef]
- Ortiz-Rodríguez, N.M.; Condorí, M.; Durán, G.; García-Valladares, O. Solar drying Technologies: A review and future research directions with a focus on agroindustrial applications in medium and large scale. Appl. Therm. Eng. 2022, 215, 118993. [Google Scholar] [CrossRef]
- Bennamoun, L. Integration of Photovoltaic Cells in Solar Drying Systems. Dry. Technol. 2013, 31, 1284–1296. [Google Scholar] [CrossRef]
- Marasli, D.B.; Colak Gunes, N.; Tavman, S. A comprehensive review of solar photovoltaic hybrid food drying systems. Crit. Rev. Food Sci. Nutr. 2022, 15, 4152–4168. [Google Scholar] [CrossRef]
- Rezvani, Z.; Mortezapour, H.; Ameri, M. Energy and exergy analysis of a water bed-infrared dryer coupled with a photovoltaic-thermal collector. J. Food Process Eng. 2022, 45, e14058. [Google Scholar] [CrossRef]
- Fterich, M.; Chouikhi, H.; Bentaher, H. Numerical and Experimental Study of Solar Dryer Equipped with PV/T. Teh. Vjesn. —Tech. Gaz. 2022, 29, 896–906. [Google Scholar]
- Goh, L.J.; Othman, M.Y.; Mat, S.; Ruslan, H.; Sopian, K. Review of heat pump systems for drying application. Renew. Sustain. Energy Rev. 2011, 15, 4788–4796. [Google Scholar] [CrossRef]
- Hamid, K.; Sajjad, U.; Yang, K.S.; Wu, S.K.; Wang, C.C. Assessment of an energy aficient closed loop heat pump dryer for high moisture materials: An experimental investigation and AI based modelling. Energy 2022, 238, 121819. [Google Scholar] [CrossRef]
- Hu, Z.; Li, Y.; El-Mesery, H.S.; Yin, D.; Qin, H.; Ge, F. Design of a new heat pump dryer system: A case study in drying characteristics of kelp knots. Case Stud. Therm. Eng. 2022, 32, 101912. [Google Scholar] [CrossRef]
- Su, W.; Ma, D.; Lu, Z.; Jiang, W.; Wang, F.; Xiaosong, Z. A novel absorption-based enclosed heat pump dryer with combining liquid desiccant dehumidification and mechanical vapor recompression: Case study and perfor-mance evaluation. Case Stud. Therm. Eng. 2022, 35, 102091. [Google Scholar] [CrossRef]
- GENAQ. Ficha Técnica de GENAQ Nimbus N500, Datos de Fabricante. Available online: http://www.genaq.com/ (accessed on 29 November 2022).
- Candan, D.; Oktay, Z.; Coskun, C. Design and an instantaneous experimental analysis of photovoltaic-assisted heat pump dryer for agricultural applications using banana chips. J. Food Process Eng. 2021, 44, e13832. [Google Scholar] [CrossRef]
- Aguilar, F.J.; Aledo, S.; Quiles, P.V. Experimental analysis of an air conditioner powered by photovoltaic energy and supported by the grid. Appl. Therm. Eng. 2017, 123, 486–497. [Google Scholar] [CrossRef]
- Li, Y.; Zhao, B.Y.; Zhao, Z.G.; Taylor, R.A.; Wang, R.Z. Performance study of a grid-connected photovoltaic powered central air conditioner in the South China climate. Renew. Energy 2018, 126, 1113–1125. [Google Scholar] [CrossRef]
- El-Monem Khallaf, A.; El-Sebaii, A. Review on drying of the medical plants (herbs) using solar energy applications. Heat Mass Transf. 2022, 58, 1411–1428. [Google Scholar] [CrossRef]
- Khouya, A. Energy analysis of a combined solar wood drying system. Sol. Energy 2022, 231, 270–282. [Google Scholar] [CrossRef]
- Lorenzo, C.; Narvarte, L.; Almeida, R.H.; Cristóbal, A.B. Technical evaluation of a stand-alone photovoltaic heat pump system without batteries for cooling applications. Sol. Energy 2020, 206, 92–105. [Google Scholar] [CrossRef]
- Odarpi Sociedad Cooperativa. Cereales y Semillas; Odarpi Sociedad Cooperativa: Burgos, Spain, 2022. [Google Scholar]
- Olmedo Torre, N.; Farrerons Vidal, O.; Prieto Urbano, A. Análisis Comparativo de la Eficiencia Energética en Calderas Para Viviendas; Escola Universitària d’Enginyeria Tècnica Industrial de Barcelona: Barcelona, Spain, 2015; Available online: https://upcommons.upc.edu (accessed on 10 January 2023).
- Lorenzo, C.; Almeida, R.H.; Martínez-Núñez, M.; Narvarte, L.; Carrasco, L.M. Economic assessment of large power photovoltaic irrigation systems in the ECOWAS region. Energy 2018, 155, 992–1003. [Google Scholar] [CrossRef]
- Comisión Interdepartamental del Cambio Climático. Factores de Emisión. Registro de Huella de Carbono, Compensación y Proyectos de Absorción; Gobierno de España, Ministerio para la transición ecológica y el reto demográfico: Madrid, Spain, 2022. [Google Scholar]
- Thermal Energy vs. Electrical Energy. Available online: https://nergiza.com/energia-termica-vs-energia-electrica/ (accessed on 21 December 2022).
- Hegedus, S.; Luque, A. Handbook of Photovoltaic Science and Engineering, 2nd ed.; John Wiley and Sons, Ltd.: Hoboken, NJ, USA, 2011; p. 1166. [Google Scholar]
- Jahn, B.U.G.; Nasse, W. Analysis of Phptovoltaic Shystems. 2000. [Google Scholar]
- Reich, N.H.; Mueller, B.; Armbruster, A.; Van Sark, W.G.J.H.M.; Kiefer, K.; Reise, C. Performance ratio revisited: Is PR>90% realistic? Prog. Photovolt. Res. Appl. 2012, 20, 717–726. [Google Scholar] [CrossRef]
- Purohit, P.; Purohit, I. Perfonmance assessment of grid-interactive solar photovoltaic projects under India’s national solar mission. Appl. Energy 2018, 222, 25–41. [Google Scholar] [CrossRef]
- Lorenzo, C.; Narvarte, L. Performance indicators of photovoltaic heat-pumps. Heliyon 2019, 5, e02691. [Google Scholar] [CrossRef]
- Simulador de Sistemas Fotovoltaicos (Sisifo). Available online: https://www.sisifo.info/es/default (accessed on 10 January 2023).
- PVGIS Database. Available online: http://re.jrc.ec.europa.eu/pvgis (accessed on 14 January 2023).
- Erbs, D.G.; Klein, S.A.; Duffie, J.A. Estimation of the diffuse radiation fraction for hourly, daily and monthly-average global radiation. Sol. Energy 1982, 28, 293–302. [Google Scholar] [CrossRef]
- Perez, R.; Seals, R.; Ineichen, P.; Stewart, R. A new simplified version of the Pérez Diffuse Irradiance model for title surfaces. Sol. Energy 1987, 39, 221–231. [Google Scholar] [CrossRef]
- Herraiz, J.I.; Fernández-Ramos, J.; Almeida, R.H.; Báguena, E.M.; Castillo-Cagigal, M.; Narvarte, L. On the tuning and performance of Stand-alone Large-Power PV irrigation Systems. Energy Convers. Manag. 2022, 13, 100175. [Google Scholar] [CrossRef]
- Crundwell, F.K. Finance for Engineers, Evaluation and Funding of Capital Projects; Springer: London, UK, 2008. [Google Scholar]
- Lonja de León. Available online: https://www.lonjadeleon.es/forrajes/ (accessed on 12 January 2023).
- Jefatura de Estado. D. L.: M-1/1958-ISSN: 0212-033X, Ley 27/2014, del 27 de noviembre, del Impuesto sobre Sociedades. BOE 2014, 62, 23299. [Google Scholar]
- Trending Economics, Spain Indicators. Available online: https://tradingeconomics.com/spain/indicators (accessed on 12 January 2023).
- Utility-Scale, P.V. Available online: https://atb.nrel.gov/electricity/2022/utility-scale_pv (accessed on 4 February 2023).
- Evolución del Precio Gasoil Calefacción. Available online: https://www.clickgasoil.com/c/evolucion-del-precio-gasoil-calefaccion (accessed on 10 January 2023).
- Barata Carrêlo, I.; Hogan Almeida, R.; Narvarte, L.; Martinez-Moreno, F.; Carrasco, L.M. Comparative analysis of the economic feasibility of five large-power photovoltaic irrigation systems in the Mediterranean region. Renew. Energy 2020, 45, 2671–2680. [Google Scholar] [CrossRef]
- Ministerio de Economía. Real decreto 1164/2001, de 26 de octubre, por el que se establecen tarifas de acceso a las redes de transporte y distribución de energía eléctrica. BOE 2021, 268, 40618–40629. [Google Scholar]
- Agencia Tributaria. Impuestos Especiales, Capítulo 6 (Impuesto Especial Sobre la Electricidad); Agencia Tributaria: Barcelona, Spain, 2015.
- U.S. Energy Information Administration. Levelized Cost and Levelized Avoided Cost of New Generation Re-sources in the Annual Energy Outlook 2020; U.S. Energy Information Administration: Washington, DC, USA, 2020.
- Short-Term Energy Outlook. Available online: https://www.eia.gov/outlooks/steo/data.php?type=figures (accessed on 5 February 2023).
Disclaimer/Publisher’s Note: The statements, opinions and data contained in all publications are solely those of the individual author(s) and contributor(s) and not of MDPI and/or the editor(s). MDPI and/or the editor(s) disclaim responsibility for any injury to people or property resulting from any ideas, methods, instructions or products referred to in the content. |
© 2023 by the authors. Licensee MDPI, Basel, Switzerland. This article is an open access article distributed under the terms and conditions of the Creative Commons Attribution (CC BY) license (https://creativecommons.org/licenses/by/4.0/).