Article

Techno-Economic Evaluation of Hydrogen-Based Cooking Solutions in Remote African Communities—The Case of Kenya

by
Nikolas Schöne
1,*,
Raluca Dumitrescu
2 and
Boris Heinz
1,3
1
Department of Community Energy and Adaptation to Climate Change, Technische Universität Berlin, Ackerstr. 76, 13355 Berlin, Germany
2
Research Group Microenergy Systems, Straße des 17. Juni 135, 10623 Berlin, Germany
3
Hudara gGmbH, Rollbergstr. 26, 12053 Berlin, Germany
*
Author to whom correspondence should be addressed.
Energies 2023, 16(7), 3242; https://doi.org/10.3390/en16073242
Submission received: 10 March 2023 / Revised: 30 March 2023 / Accepted: 31 March 2023 / Published: 4 April 2023
(This article belongs to the Special Issue Hydrogen in the Energy-X-Nexus)

Abstract

:
Hydrogen has recently been proposed as a versatile energy carrier to contribute to archiving universal access to clean cooking. In hard-to-reach rural settings, decentralized produced hydrogen may be utilized (i) as a clean fuel via direct combustion in pure gaseous form or blended with Liquid Petroleum Gas (LPG), or (ii) via power-to-hydrogen-to-power (P2H2P) to serve electric cooking (e-cooking) appliances. Here, we present the first techno-economic evaluation of hydrogen-based cooking solutions. We apply mathematical optimization via energy system modeling to assess the minimal cost configuration of each respective energy system on technical and economic measures under present and future parameters. We further compare the potential costs of cooking for the end user with the costs of cooking with traditional fuels. Today, P2H2P-based e-cooking and production of hydrogen for utilization via combustion integrated into the electricity supply system have almost equal energy system costs to simultaneously satisfy the cooking and electricity needs of the isolated rural Kenyan village studied. P2H2P-based e-cooking might become advantageous in the near future when improving the energy efficiency of e-cooking appliances. The economic efficiency of producing hydrogen for utilization by end users via combustion benefits from integrating the water electrolysis into the electricity supply system. More efficient and cheaper hydrogen technologies expected by 2050 may improve the economic performance of integrated hydrogen production and utilization via combustion to be competitive with P2H2P-based e-cooking. The monthly costs of cooking per household may be lower than the traditional use of firewood and charcoal even today when applying the current life-line tariff for the electricity consumed or utilizing hydrogen via combustion. Driven by likely future technological improvements and the expected increase in traditional and fossil fuel prices, any hydrogen-based cooking pathway may be cheaper for end users than using charcoal and firewood by 2030, and LPG by 2040. The results suggest that providing clean cooking in rural villages could economically and environmentally benefit from utilizing hydrogen. However, facing the complexity of clean cooking projects, we emphasize the importance of embedding the results of our techno-economic analysis in holistic energy delivery models. We propose useful starting points for future aspects to be investigated in the discussion section, including business and financing models.

1. Introduction

1.1. Framework and Concept
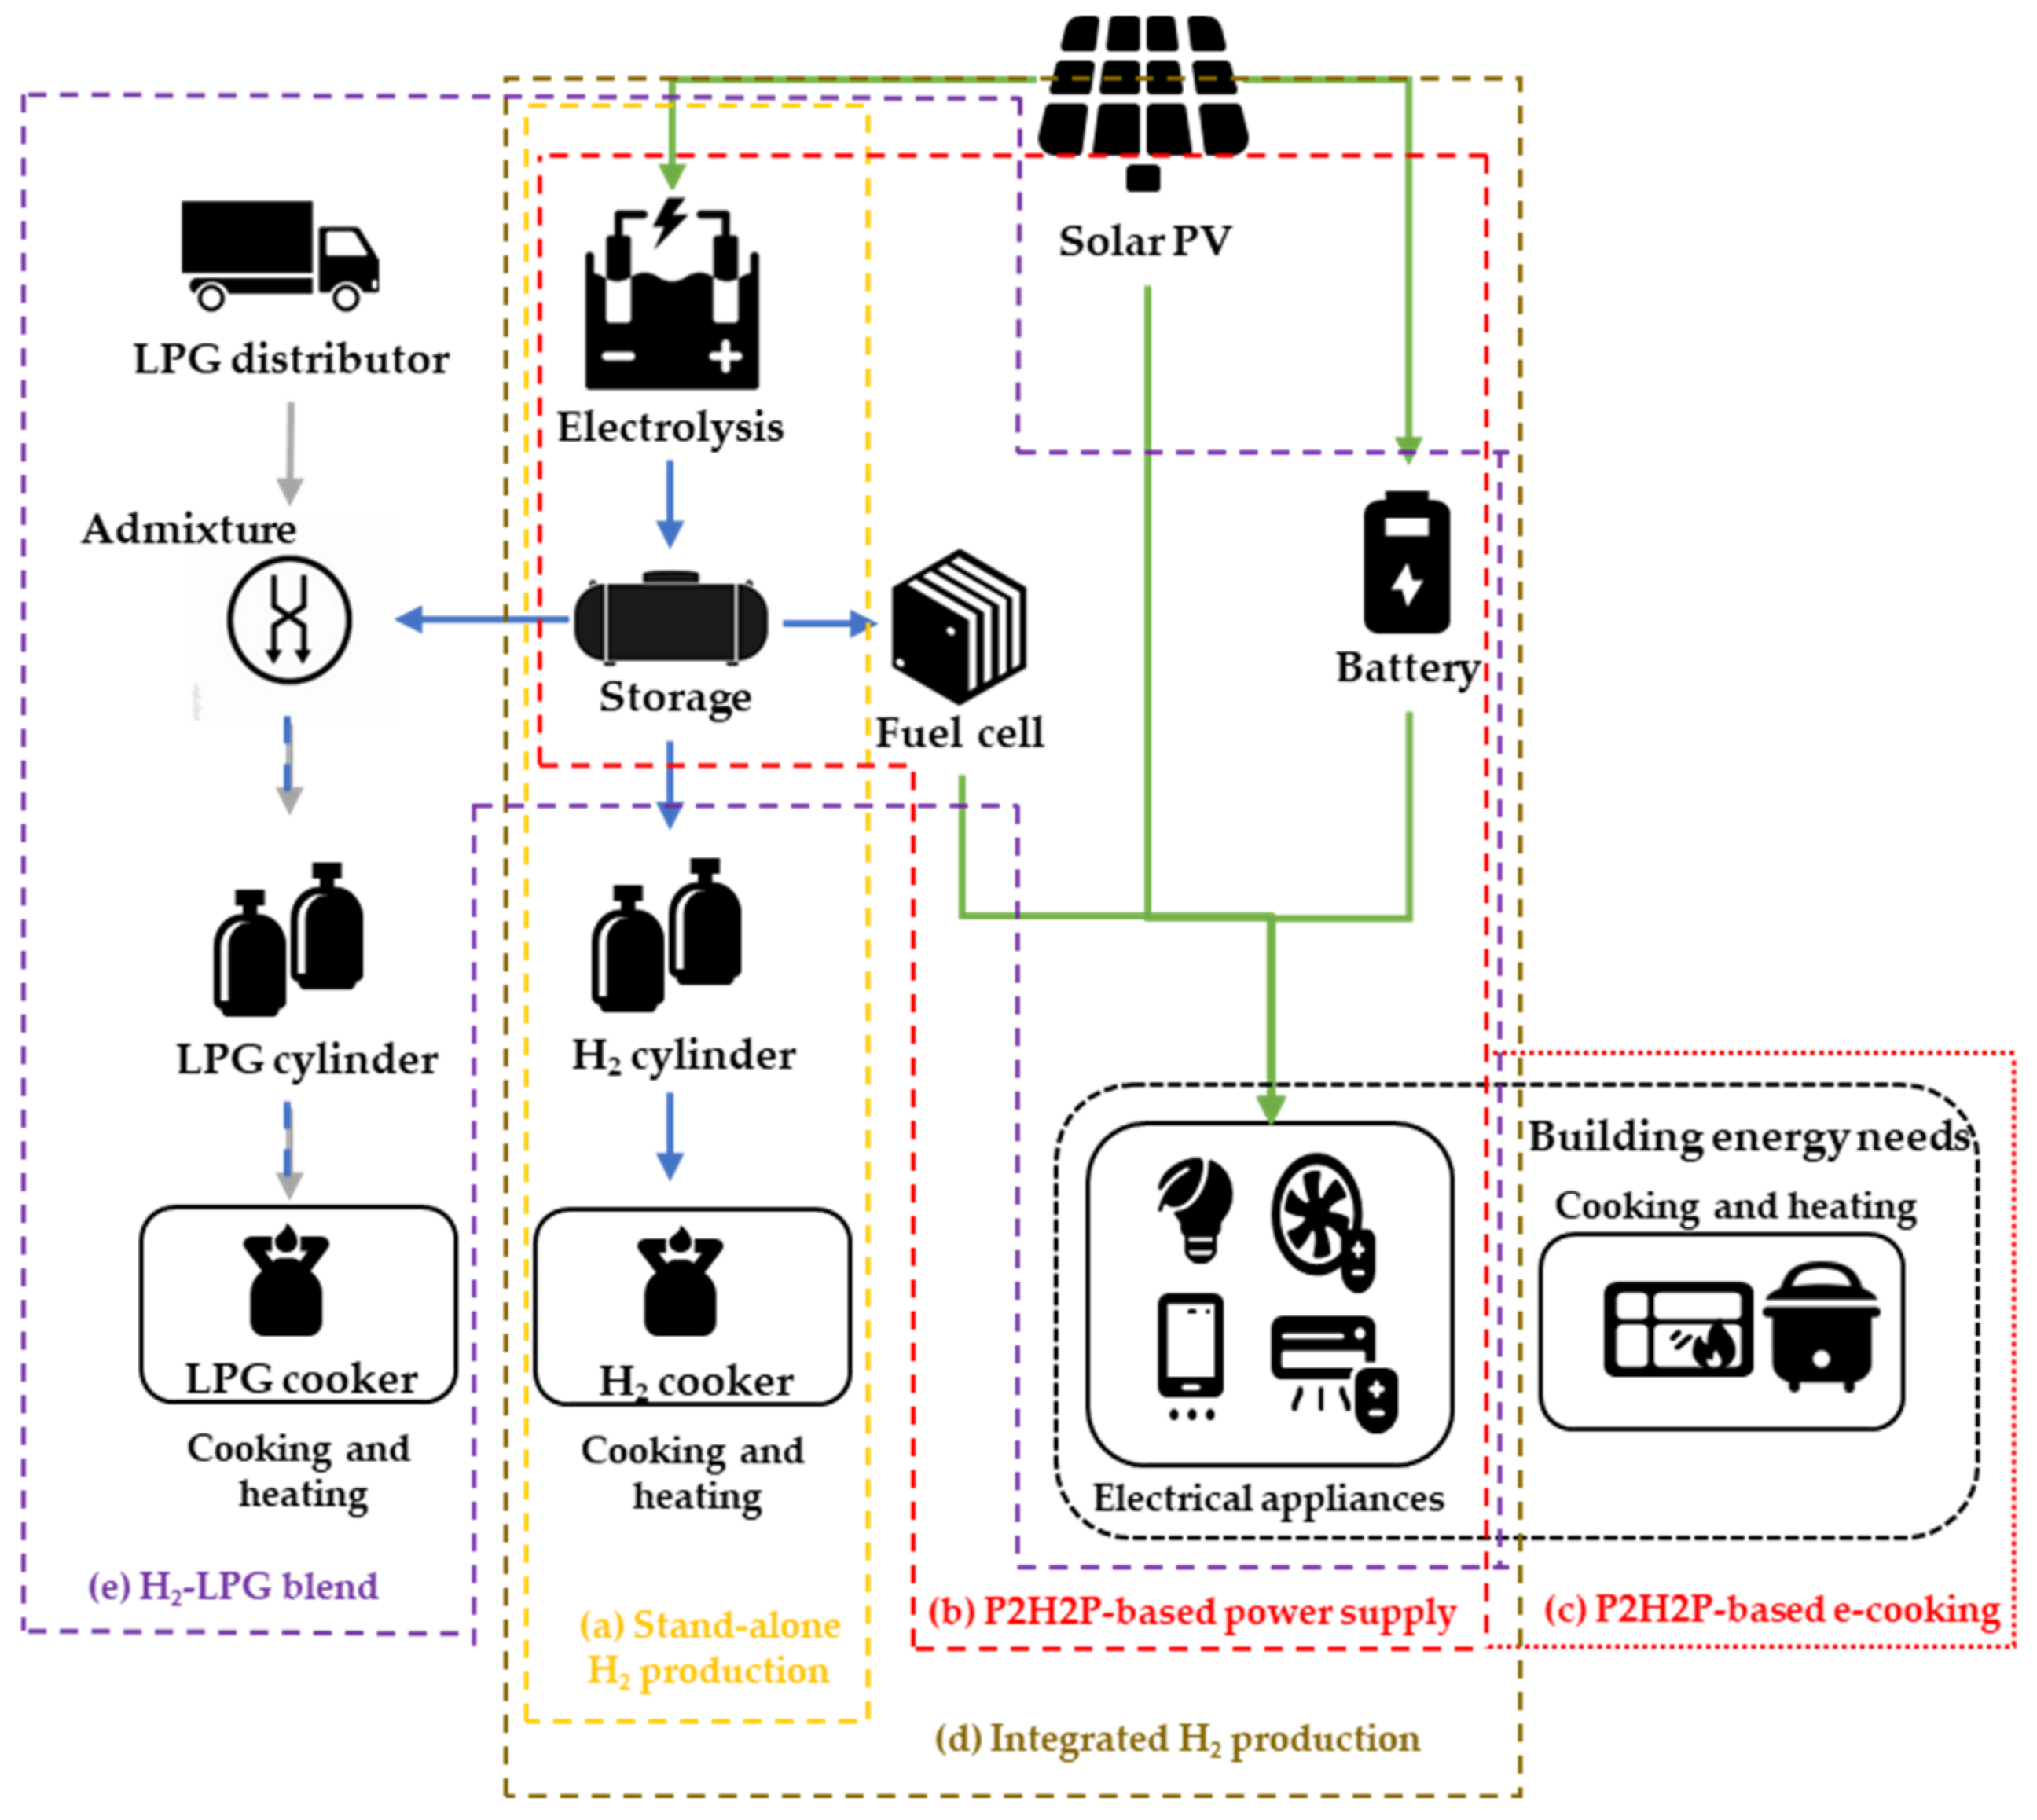
The United Nations (UN) manifested providing clean cooking to any human as one of the most pressing needs of our global society [1]. The Sustainable Development Goal 7 (SDG 7) distinctly aims to achieve universal access to clean cooking by 2030 [1]. The use of polluting fuels, including traditional solid fuels (i.e., firewood, charcoal) and kerosene is extremely harmful to the health of users [2,3]. The combustion of polluting fuels releases unsafe levels of fine particulate matter, evidently increasing the risk for several infectious and non-communicable respiratory and cardiovascular diseases [2,4]. Solid biomass combustion is accountable for 25% of the global black carbon emissions [5], estimated to have the second largest radiative forcing (behind CO2) [6]. Indoor air pollution caused by the use of traditional fuels is the fourth highest cause of death after malnutrition, HIV/AIDS, and lack of clean water [7]. The World Health Organization (WHO) estimates that annually 3.2 million deaths are attributed to household air pollution exposure from using polluting fuels and technologies for cooking [8].
By 2020, 2.4 billion people relied on polluting fuels for cooking [8]. Despite increased efforts to provide clean cooking fuels, the rate of progression has been outpaced by the population growth in Sub-Saharan Africa. The deficit in access to clean fuels there has nearly doubled since 1990, neglecting 923 million people in 2020 [8]. The problem is especially a rural one. More than 93% of the rural population lacks access to clean cooking fuels and technologies, compared with 71% in the urban counterpart [8]. Barriers to the roll-out of clean cooking in rural regions exist on both the supply and demand side. The effort of distributing fuel to isolated regions with only a few customers is a deterrent for fuel distributors [9]. In parallel, the demand for clean cooking fuel in rural regions is low, as most low-income households cannot afford clean cooking fuels [9]. Hence, serving clean cooking stoves and fuels to rural villages offers only little profits to non-local suppliers.
Hydrogen, produced by decentralized renewable energy, has been proposed to facilitate the uptake of clean cooking in rural regions. Previous work by Schöne et al. [10] has identified that hydrogen may be applied in three different solutions to facilitate clean cooking:
(I)
by supplying electricity via power-to-hydrogen-to-power (P2H2P) to serve electric cooking (e-cooking) appliances (hereinafter referred to as P2H2P-based e-cooking);
(II)
via direct combustion in hydrogen stoves;
(III)
via blending hydrogen into Liquid Petroleum Gas (LPG) by 20% on a volumetric basis for combustion in conventional LPG stoves.
Schöne et al. [10] present a thorough review of the respective technical concepts on previous related work. Here, a brief overview is provided below:
(I) P2H2P-based e-cooking: the application of hydrogen to supply power to isolated electrical loads—via P2H2P—is an established concept. Pilot projects of the last decades have demonstrated P2H2P to supply residential and village loads in Norway, Japan, Sweden, Germany, Switzerland, the USA, and the UK [11]. In countries of the Global South, P2H2P was used to supply back-up power to critical infrastructure, especially mobile telecommunication stations, substituting diesel generators (DGs) [11]. However, with declining costs, residential applications have become increasingly relevant for P2H2P even in rural communities in the Global South, with a low purchasing power (see references [12,13,14,15] for techno-economic feasibility studies of P2H2P in rural villages and [10] for a comprehensive review). Referring to the Multi-Tier framework defined by the Energy Sector Management Assistance Program (ESMAP) to measure energy access on seven distinct attributes [16], P2H2P-based power supply is capable of providing access beyond the Tier 3 level (e.g., >200 W and 1 kWh per day). Therefore, P2H2P is capable of powering e-cooking appliances. Currently, e-cooking in off-grid systems is not popular due to the high-power requirements of e-cookstoves that can usually only be satisfied by an electrical grid (>Tier 3 supply required [17]). However, Luta et al. conducted a techno-economic feasibility study of hydrogen-based power supply to satisfy electrical loads, including cooking and heating loads, in rural South Africa [18]. The authors pointed to the grid-like quality of supply that P2H2P can offer. The authors found P2H2P to be financially competitive against grid extension for regions in >4000 km distance to the current grid. Kebede et al. proposed P2H2P for the electrification of a rural village in Ethiopia [19]. The electrical loads of the system include typical low-power appliances, such as lighting (15 W), a DVD player (15 W), a direct current (DC) refrigerator (70 W), and a cell phone charger (2.5 W). In addition, the authors proposed to supply an electric stove (2.5 kW) and cookstove (1.5 kW), significantly increasing the peak power load of the system. The authors compared P2H2P against back-up power supply via batteries. While increasing the reliability of supply, cost reduction in P2H2P components is required to be cost-competitive against battery storage [19]. In summary, P2H2P might be highly suitable to provide e-cooking services. Firstly, common e-cooking appliances (e.g., electric hot plates, alternating current (AC) electric pressure-cooking stoves) require both high power and energy supply, compared to usual residential loads [11,17]. Secondly, long-term cooking energy storage might be required to grant users flexibility and reliability. Cooking patterns significantly vary across households and with social activities. For example, households are reported to host guests for dinner at irregular intervals in a cooking diaries study in Tanzania [20]. In the occurrence of such events, the host requires significantly more cooking energy than on average days. If such (arguably socially important) events must also be satisfied by e-cooking, long-term energy storage is a critical requirement.
(II) Hydrogen combustion: gaseous hydrogen can be utilized as a cooking fuel. The physical properties of hydrogen allow for flexible combustion in oxygen-mixed burners. Table 1 comprises selected properties of hydrogen, propane and methane as reference gases. Since LPG consists of >95% propane, propane approximately reflects the properties of LPG.
While the gravimetric energy content of hydrogen is approximately three times higher than the gravimetric energy content of LPG, the volumetric energy density is significantly lower. However, some key advantages of hydrogen compared to its fossil counterparts are:
  • the higher hydrogen-air flame temperature allows for quick and flexible heating;
  • the high diffusion coefficient is a great safety advantage;
  • hydrogen can be ignited within a wide flammability range with low ignition energy required.
With these properties, hydrogen combustion in oxygen–hydrogen mixing stoves meets the criteria commonly referred to as ‘ease-of-use-criteria’, which is a combination of direct ignition, systematic heat regulation, systematic fuel use, allowance for partial fuel refill, non-smoking clear flame/heat, and fuel level detection. Notably, the ‘ease-of-use’ is recognized as the second most important factor affecting the choice of cookstove and fuel within the Kenyan population (behind affordability) [25]. Further, we must consider the possibility of producing hydrogen fuel at the point of use as a significant advantage against fossil fuels that must be imported and pose a critical dependency to the rural community.
The technical concept of decentralized hydrogen production and utilization via combustion in rural communities was initially proposed by Young et al. [26] in 2007. The authors suggested the production of hydrogen by photovoltaic (PV)-powered water electrolysis in a rural village in Bhutan. The produced hydrogen was suggested to be filled in portable containers, which could be circulated to the households to fuel hydrogen for combustion in gas-stoves. Therefore, the downstream process of hydrogen cooking via combustion is notably analogous to dominant LPG models (for background information on LPG cooking we refer to, e.g., [27,28]). Similarly, Topriska et al. [29] proposed a stand-alone PV-supplied water electrolyzer (EL) to generate hydrogen cooking fuel for a rural Jamaican village. After lab-testing and simulation in [29], the authors tailored the system to three case studies in Jamaica, Ghana, and Indonesia and explored the technical potential, economic performance, and environmental benefits in [30]. The system was demonstrated in Jamaica in a research project [31,32]. Schmidt-Riveira et al. used the demonstrated technical system to conduct an environmental life-cycle assessment [33]. The authors compared the hydrogen-based cooking system against traditional fuels and LPG, finding hydrogen to significantly reduce the point-of-use emissions and climate change effects compared to its fossil counterparts.
(III) Hydrogen–LPG-blend combustion: while not yet specifically investigated in previous research, the blending of hydrogen into LPG and co-utilization of LPG infrastructures is suggested in [10]. Since they possess similar physical properties, the admixture of gaseous hydrogen and LPG and joint combustion is technically feasible. The mixing of hydrogen into other gas infrastructures, such as natural gas or methane, and its effects on the infrastructures [34] and utilization in end user appliances [23] have been explored in European settings. Makaryan et al. [35] conducted a review of studies investigating the opportunities and challenges of blending hydrogen in European natural gas infrastructures, pointing to material corrosion, safety issues, and volumetric energy density as the main restriction factors to hydrogen admixture to the natural gas grid. De Vries et al. [23] further detailed the analysis of the impact of hydrogen–natural gas blends on natural gas cookstove appliances. The Wobbe index (an indicator of the interchangeability of fuel gases), probability of a flashback, and fuel–air ratio of the gas burner were found to be decisive for the maximum fraction of hydrogen possible to mix to a reference gas without requiring any modifications to the end-user appliance. Transferring the findings and thresholds of these two analyses, Schöne et al. [10] suggested that blending hydrogen into LPG is possible to an extent of 20% by volume, without any modifications required for the LPG infrastructure in place (i.e., storage tank and burner). The authors discussed that such blending of hydrogen into LPG may serve as a market entry point for hydrogen cooking fuel, as LPG service providers in place could potentially adopt the new cooking fuel in their existing product value chains. Further, in settings in which LPG cooking is already in place, the end user would be confronted with a minimum change in used habits of fuel acquisition, and cooking habits—arguably essential when introducing new cooking fuels to communities [36].

1.2. Definition of the Research Gap and Contribution to Research

The contribution of hydrogen-based cooking to universal access to clean cooking is not well explored; see [10]. The review of the existing literature briefly summarized above essentially reveals the following research gaps:
  • While the technical concepts of decentralized P2H2P-based e-cooking and decentralized hydrogen production for utilization via combustion have been proposed for different settings, a comparison of the systems is only possible when investigating the systems in the same setting. Further, decentralized hydrogen production for utilization via combustion has for now only been proposed as a stand-alone solution. However, potentially building on the same primary energy source as the local electricity supply system when considering renewable energy supply (e.g., PV), the effect of integrating hydrogen production in the electricity supply system must be investigated.
  • In any of the previous works, the respective authors point out the substantial economic challenges of hydrogen-based cooking compared to traditional fuels. High investment costs of hydrogen technologies (e.g., [19,29]) pose a significant barrier to the uptake. However, the previous work did not explore the impact of changes in technical and economic parameters, jeopardizing the transferability of findings, and inclusion of possible future developments.
  • The previous studies focus on hydrogen-based cooking solutions on an energy system level. However, when exploring clean cooking options, it is vital to include the end-user perspective in the analysis.
This paper presents a first-pass evaluation of the different hydrogen-based cooking solutions by conducting a techno-economic investigation. We compare the different proposed pathways from both the system and the end-user perspective. Therefore, we perform a model-based techno-economic optimization to design the minimum-cost energy systems utilizing hydrogen for clean cooking in a case study in Kenya under present and future parameters. As a result, we first compare the different hydrogen-based cooking energy systems-options technical and economic metrics. As all hydrogen-based cooking systems are mutually interlinked with the electricity supply system, we additionally consider the integration in the electricity supply system. Second, we calculate the respective costs of cooking for the end user. The specific research questions addressed in this paper are:
  • What are the respective least costly (optimal) energy system topologies and system operations to facilitate hydrogen-based cooking in off-grid villages?
  • What is the least-cost energy system for hydrogen-based cooking in off-grid regions, presently and in the future?
  • What are the main influencing parameters on the costs of the respective hydrogen-based cooking solutions?
  • What are the costs of hydrogen-based cooking in rural villages for the end user compared to traditional fuels, presently and in the future?
The outline of the paper is as follows: Section 2 is a materials and methods section, which includes a description of the energy system model, components of the energy system considered, and parameters applied. Section 3 presents the results and discusses relevant implications. We point out such parameters that have sensitive influence on the model. As this paper focuses initially on assessing the potential of hydrogen-based cooking options for rural villages through a techno-economic assessment, we embed the findings in a broader cooking context and propose useful next research steps in the Section 4 discussion. The paper closes with a conclusion and summary of the findings.

2. Materials and Methods

This section covers the materials used and methodology applied to evaluate the economic performance of the three proposed integration pathways of hydrogen to supply clean cooking services in rural communities. We draft the respective energy systems in Section 2.1 as proposed in the previous literature. Section 2.2 describes the case study considered and its components. Section 2.3 describes the applied methodology to define an optimal solution to the research question and the performance indicators.

2.1. Energy Systems for Hydrogen-Based Clean Cooking Services

The respective energy system topologies for hydrogen-based cooking in isolated villages are drafted in Figure 1:
Figure 1a shows the stand-alone production of hydrogen cooking fuel to be utilized via combustion as proposed in previous literature (see Section 1), hereinafter referred to as stand-alone hydrogen production system. Renewable energy (here we consider PV) supplies primary electricity to feed water electrolysis (see [37] for a detailed overview of water electrolysis and [38] for the integration in off-grid systems), producing gaseous hydrogen. For downstream processes, it is likely to assume one large cascade storage of hydrogen, granting flexibility to both the electrolyzer and end user, and a refill of hydrogen in portable containers similar to LPG to be used in households [30]. As the water electrolysis might be supplied by the same primary energy source that also supplies electricity when considering a renewable-based supply, an integration of the electrolyzer (EL) into the electricity system as illustrated in Figure 1c is reasonable. This integrated system will hereinafter be referred to as integrated hydrogen production system. In our analysis, we will compare the integrated system to the stand-alone hydrogen production and combustion system (Figure 1a) and stand-alone P2H2P-based electricity supply system (Figure 1b). Figure 1d presents the energy system considered for P2H2P-based e-cooking. Hydrogen produced by PV-fed water electrolysis is reconverted to electricity by means of a fuel cell (FC). However, a combination of hydrogen storage and FC with short-term energy storage, such as battery storage, is economically and technically advantageous [15]. In our analysis, we will leave the solver of the mathematical optimization problem formulated (see Section 3) the freedom to choose whether to integrate or not the FC in a minimum-cost energy system. Figure 1e represents the energy system to serve hydrogen-LPG blends as a cooking fuel. In contrast to the other electricity supply systems, this considered system does not propose the integration of an FC. We aim to represent an electricity supply system as it is the status-quo today—which implies a PV-battery system. We constrain that only excess electricity of the PV-battery electricity system can be harnessed to produce hydrogen cooking fuel—preventing the option to install more PV capacity than currently required to satisfy the electricity load (see Section 2.3.2).

2.2. Materials and Case Study

In this section, we describe the setting of the case study (Section 2.2.1) and explain the main components and parameter assumptions used for our analysis (Section 2.2.2).

2.2.1. Case Study

Our assessment is based on the case study of the isolated Kadaina island, Kenya. The island has only one village with scattered buildings. Access is possible only via boat or foot at low tide. A census assessment of the energy situation identified 42 households, eight institutions (two schools and one dispensary), and 13 small businesses primarily using electricity for lighting, refrigeration, and some cell phone charging and TV use [39].

Renewable Energy Supply
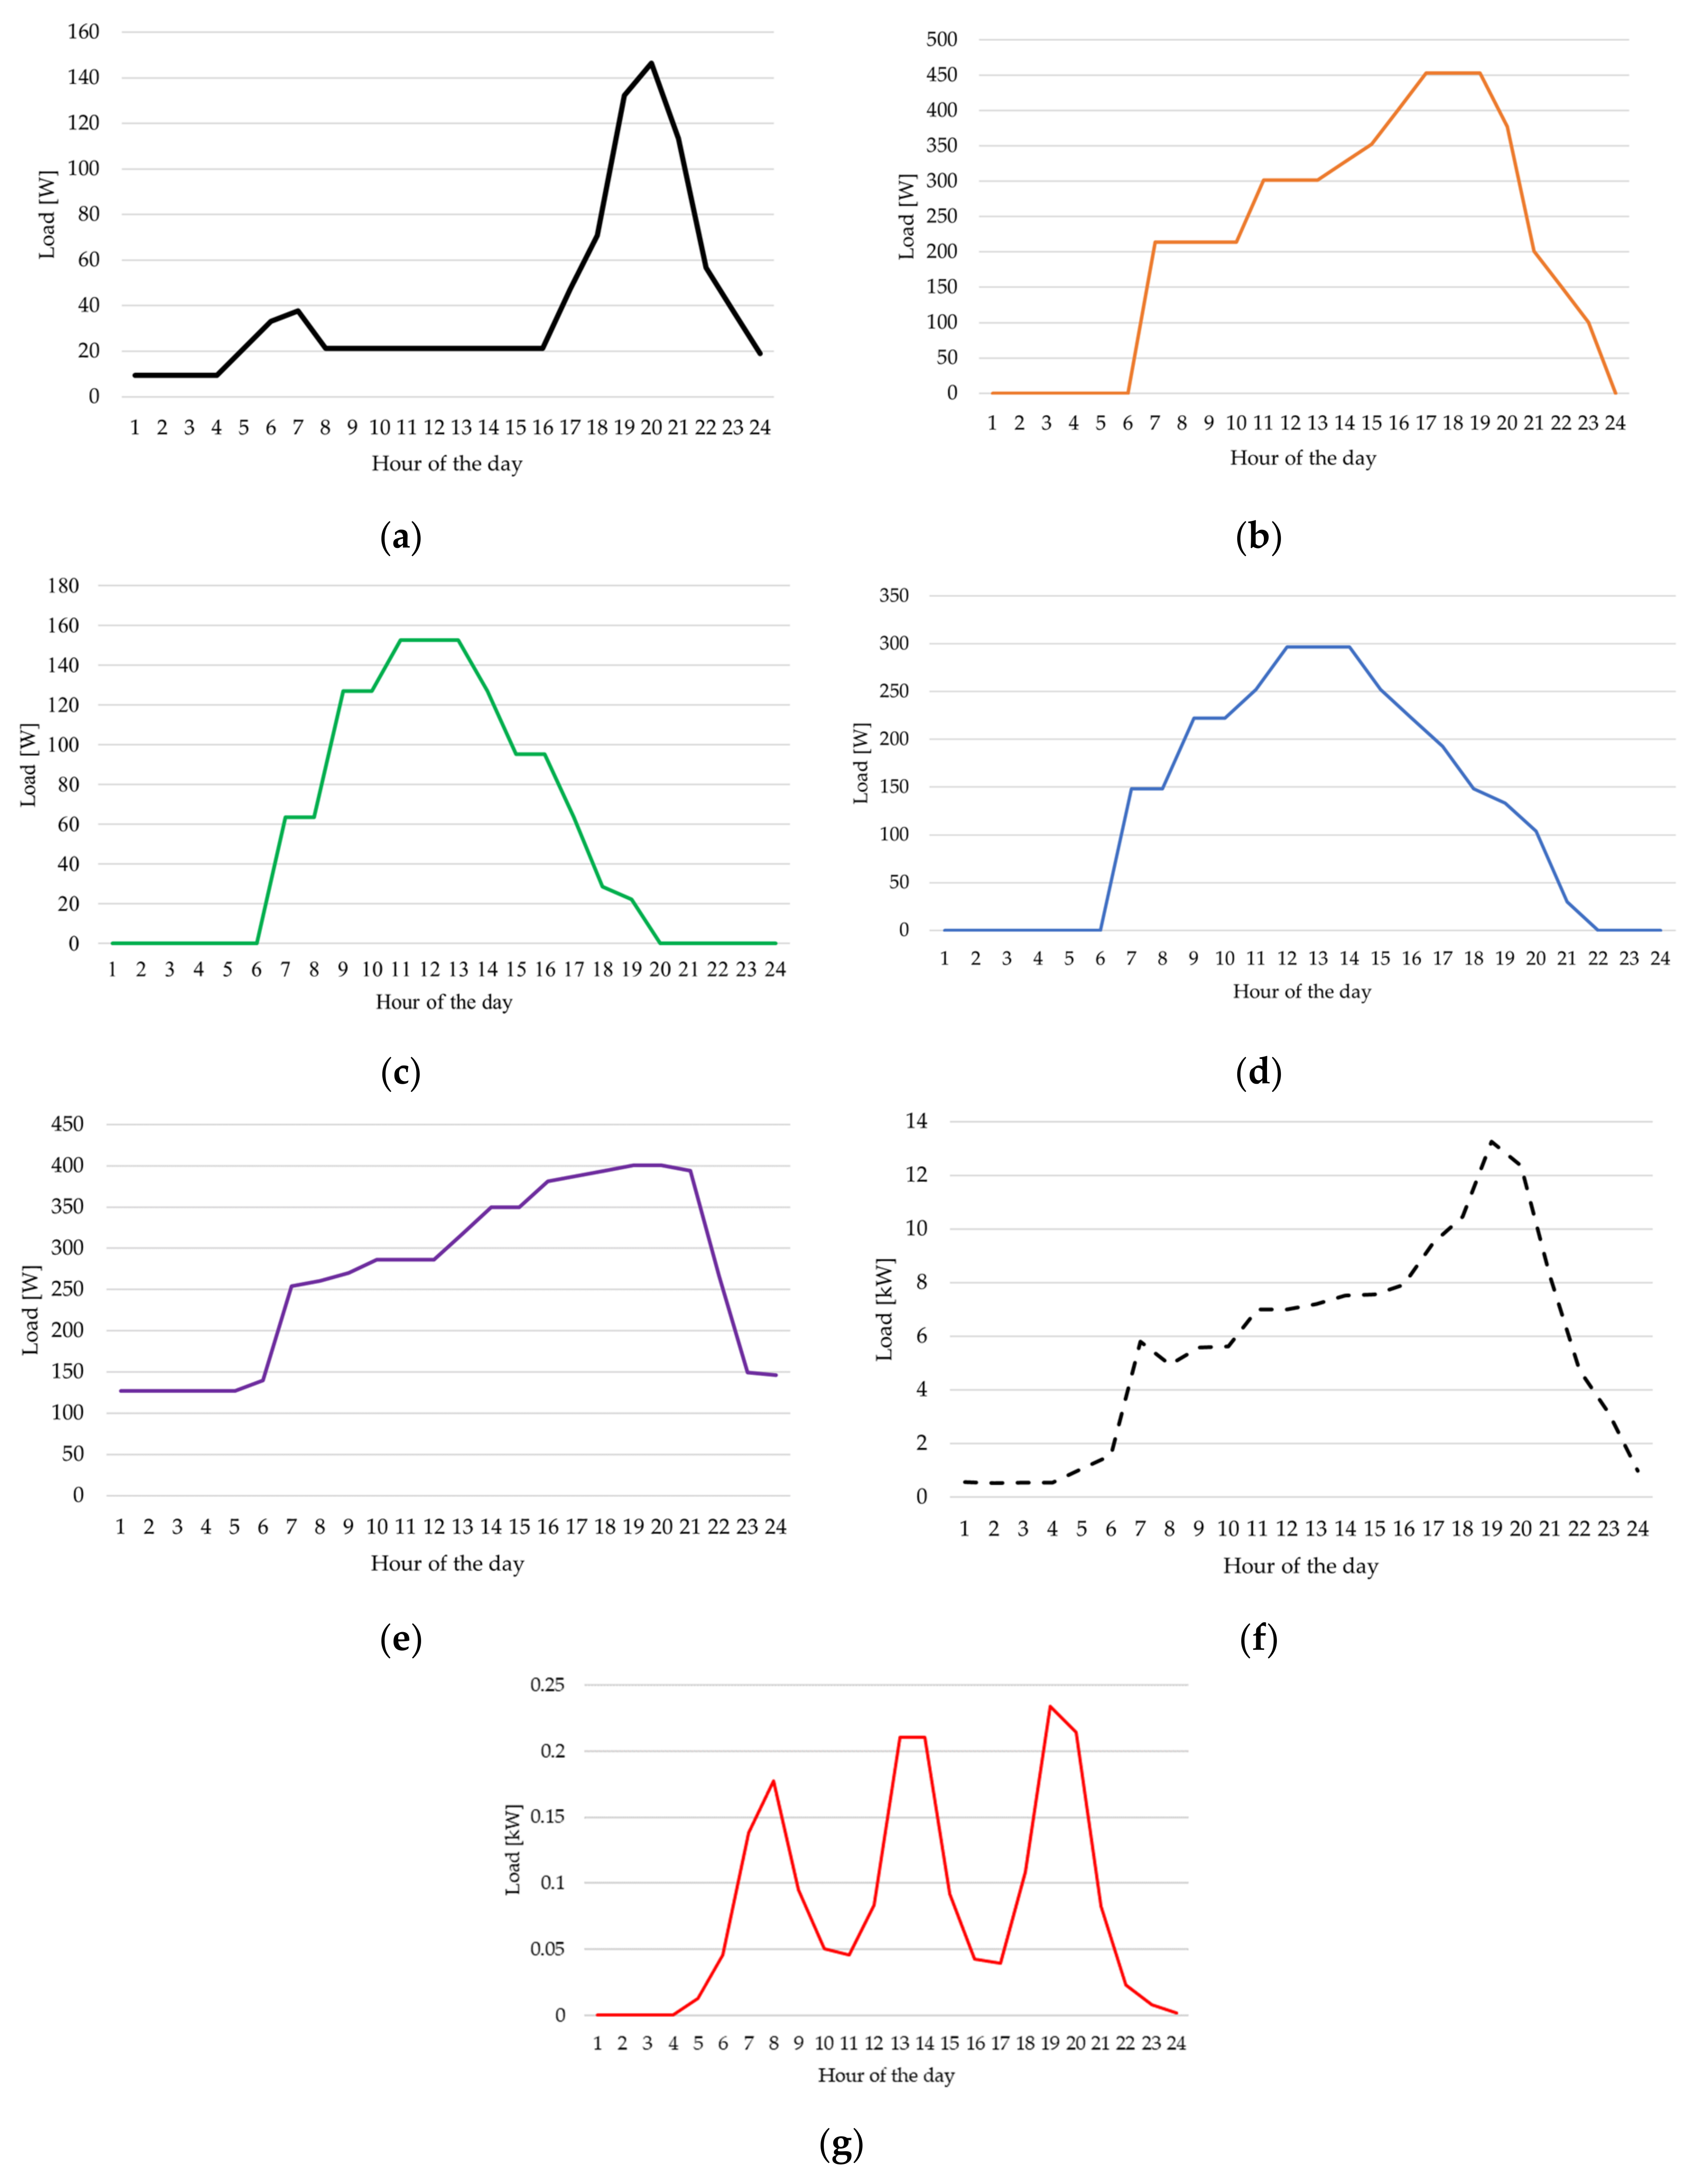
Solar PV is the only renewable energy source included in our analysis, as previous work highlighted the abundant potential of solar PV in Kenya [40] and represents the most common primary renewable electricity source in Kenyan mini-grids; thereby allowing a transfer of the results [41]. As input data for a time series of PV irradiation in hourly resolution, we chose the MERRA-2 dataset with the reference year 2019 [42] at the location of latitude −3°22′00″ S longitude 39°57′25″ E. Data was accessed via [43]. System losses including, e.g., array mismatch, dirt, and shading were assumed to be 10% [42]. We adopted a PV panel tilt of 10° as suggested by [44].

Electricity Demand

Load profiles are determined by a complex mix of appliance ownership, occupancy, and socio-economic status [45]. To generate transferable results, the appropriate method is to build on archetypal load profiles [46]. Therefore, we used a bottom-up approach to derive the electricity load curve. Blechinger et al. identified normalized archetypal load curves for different connection types in Sub-Saharan Africa, including households, businesses, schools, and dispensaries [46]. We modified the respective archetypal load profiles for each of the 42 households of the case study with a randomized 10% day-to-day and 5% timestep variability, and the two schools, one dispensary, five other institutions, and 13 businesses with a 10% day-to-day and 10% timestep variability. To combine day-to-day and time-step-to-time-step variability a year-long array of daily profiles was created. Subsequently, each timestep was multiplied with a perturbation factor p = 1 + p d + p t s , with p d and p t s being the daily and timestep perturbation values, respectively, both of which are randomly drawn from a normal distribution with a mean of zero and standard deviation equal to the respective variability value [47]. Representative daily profiles are illustrated in Figure A1a–e of the Appendix A. An example showing the effect of applying the random variability to the reference load profile is shown in Figure A2 of the Appendix A. The respective loads are scaled according to the total daily load assessed in Kadaina (household 945 Wh, business 5033 Wh, institution 2965 Wh) [39], while [46] was consulted to adjust for schools, the dispensary, and average institutions. Amongst the business customers, no higher load devices were reported [39]. Thus, we neglected a differentiation between weekend and weekday profiles [48]. A representative aggregated demand profile is illustrated in Appendix A (Figure A1f)). The resulting peak load was 13.3 kW.

Cooking Demand

Fuel stacking is prominent in rural Kenya. By 2020, 86% of rural households used fuelwood, 42% charcoal, 15% LPG, 7% kerosene and 11% crop residues as cooking fuel [25]. For example, those that use LPG as their primary fuel, and also use fuelwood, charcoal or kerosene as their secondary option, consume 144 ± 51 kg, 48 ± 9 kg and 14 ± 3 kg per household per month of the secondary fuel, respectively [25]. To reduce the complexity of our scenario analysis, we assumed a single fuel to supply the total cooking demand.
An analysis by the Energy Sector Management Assistance Program (ESMAP) estimated the amount of fuel needed in a typical Kenyan 4.2-member household to satisfy all cooking needs [49]; see Table 2. To calculate the required fuel amount for hydrogen, when assuming hydrogen combustion, we determined the daily cooking fuel demand based on the LPG usage, as we assumed a similar consumption behavior given the great physical similarities of the fuels and respective combustion behavior. With the calorific value and average conversion efficiency of the LPG fuel shown in Table 2 and Table 3, respectively, we calculated the average daily hydrogen cooking fuel demand via Equation (1) to 2.6 kWh/d/h, considering a hydrogen stove efficiency of 58% (conservative estimate in line with [30] (60%)).
C o o k i n g   d e m a n d =   i = 1 n D a i l y   c o n s u m p t i o n i   k g c a l o r i f i c   v a l u e i k W h k g c o n v e r s i o n   e f f i c i e n c y i  
Our model relies on estimations to determine the demand series for hydrogen cooking fuel with respect to our hourly resolution model (see discussion section on the impact of the simplifications towards our analysis). First, the literature on portable hydrogen containers is vague. Both technical design and user preferences towards potentially decisive characteristics, including pressure level and volume, are not yet specified. We assumed 0.5 kg of hydrogen to be portable at reasonable pressures (e.g., <300 bars) and volumes (e.g., <30 L). Second, the operation of the hydrogen refilling, and associated distribution models, have not yet been defined. This may impact the daytime and duration of refilling the portable containers. For our analysis, we simplify that users can refill their portable hydrogen storage at any time between 6 a.m. and 8 p.m. This way, we account for the case in which the user might notice they are running out of fuel while cooking and thus, refill their containers before the next cooking activity. According to our hourly resolution, we assumed that refilling containers lasts one hour. We only allowed for one user to refill at one time. Notably, by allowing the user to refill the container at any time of the day, the energy system requires the installation of cascade storage (see Hydrogen System), which increases the energy system costs (the effect of the cascade storage on the results is explored in Section 3.1.2 and more detailed in Appendix A). We may also assume that refill frequency might vary across households. Over the years, the average frequency of refills in the village would be distributed more evenly. However, technology uptake rates significantly vary with the project’s “soft” measures, such as knowledge building, and payment options for the user [50]. To simplify and maintain a conservative position, we randomly distributed the refills of the population over the course of the year based on a fixed household energy demand, which requires refilling approximately every eight days.
We calculated the amount of hydrogen required when blending hydrogen with LPG (see Figure 1e) by assuming a mix of 20% hydrogen on a volumetric basis (see Section 1). Assuming the efficiency of a Meko-stove (0.54, see Cooking Systems) and maintaining the previous supply system and patterns (required energy), the adjusted monthly hydrogen cooking fuel demand was 0.0672 kg, and 6.38 kg LPG (compared to 2.06 kg and 7.13 kg when used exclusively, respectively). The total amount of hydrogen required in this scenario amounts to 1299 kWh.
Only a few data are available that describe the electricity consumption patterns for e-cooking disaggregated from the overall electricity consumption profile. Therefore, we relied on an e-cooking electricity consumption profile published in a cooking diaries study for urban Tanzania (Dar es Salaam) [20]. Aside from “cooking”, the profile essentially includes boiling water, mainly for tea and coffee. For the methodology of profile development and limitations see [20]. Notably, the electric cooking demand profile depends on typical meals prepared and other cooking habits. However, Tanzania and Kenya are reported to have similar meal and cooking habits [49].
Unlike Leach et al. [51] who transferred the e-cooking consumption profile to a mini-grid assuming fuel stacking (which essentially avoids any e-cooking in the morning), we adopted the original e-cooking profile, but simplified. Therefore, we tailored the profile to the hourly resolution of our model by assuming the average power consumption between two hours to be constant. Further, we scaled the profile to the daily electricity demand assumed when stacking EPCs with electric hot plates, as stated in Table 2. With this, the peak consumption of our generated e-cooking electricity consumption profile per household was calculated to be 0.234 kW. An illustration of the average household profile is included in Appendix A, Figure A1g. The e-cooking load profile reported by [20] varies significantly across the users. We, therefore, apply a random variability as described in Electricity Demand to the aggregated profile of all users.

2.2.2. Component Assumptions

We describe the components of the energy system and respective parameter assumptions applied in our analysis below.

Cooking Systems

Table 3 summarizes the main characteristics of the cooking stoves included in our analysis. Notably, we excluded kerosene from our analysis. The market share of kerosene is less than 3% in rural Kenya, and no efforts are being spent to increase the use of kerosene by the government or other bodies [25]. Further, the data on kerosene and stoves are very vague.
Table 3. Typical cooking stove parameter applied in this analysis. The annual fuel demand per household is calculated based on the simplified assumption that only one fuel is exclusively used as cooking fuel, neglecting fuel stacking.
ParameterFuelwoodCharcoalLPGHydrogenAC EPC + Hot Plate
Stove efficiency [%] [25]Traditional: 17
Improved: 35
Traditional: 31
Improved: 41
5458 [29]AC EPC: 24–150 (Av. 62.5) [17]
Hot plate: 0.5 [52]
Stove investment [USD]Basic: 2–10 [49]
Improved: 30–50 [49]; 15–50 [25]
Single burner: 20–60; Double burner:30–90 [52]; “Meko”: 37.65 [25]Assumption of LPG stove refit: 50 USD single burnerHot plate: 10–30 [49] AC EPC 50–100 [49], 58 [17]
Storage investment [USD]//6 kg: 21,8 USD
13 kg: 39.36 USD [53]
0.5 kg: 25 USD (assumption)/
As stated in Cooking Demand, we assume a single fuel to serve the complete cooking demand. Therefore, we also consider only a single stove to be required when considering hydrogen combustion, LPG, charcoal, and fuelwood use. For e-cooking, however, we must assume a stacking of electric stoves. Even though the efficiency and suitability of electric pressure cookers (EPCs) for cooking have increased in recent years, they are still not suitable (or desired) to cook some foods, such as deep fried or flatbreads [49]. Thus, “dirty” fuel stacking is often observed in households with EPCs [17]. We assume a combination of AC EPC and less efficient hot plates as required devices to enable exclusive electric cooking. Presently, AC-powered EPCs dominate the market over DC EPCs. During the Global LEAP award EPC tests, only 13% of the nominated EPCs were DC-powered, and none of them passed product safety and quality tests [17]. Costs range from 24–150 USD, with an average of 58 USD adopted for our analysis [17]. Costs for the conventional electric hotplate are assumed to be 20 USD [49].
LPG cooking is recognized by the Kenyan government as a fundamental pillar to reaching the target of nationwide access to clean cooking by 2028 [54]. To support the roll-out of LPG, the government has set clear regulations and policies. Specific actions include in particular the regulation and licensing of LPG distribution supply chain stakeholders by the Energy and Petroleum Regulatory Authority (EPRA) and standardization, and the LPG cylinder exchange pool. Under the 2009 Energy Regulations, the Ministry of Energy instituted the LPG cylinder exchange pool through a subsidiary regulation; this, among other things, standardized the 1 kg, 3 kg, 6 kg, and 13 kg cylinders and valves and allowed LPG users to exchange their LPG cylinders with any dealers regardless of the brand [25]. The 6 kg complete LPG cylinder with an on-top burner and ring top (“Meko”) especially permitted LPG to be more accessible to lower-income households [25], and now dominates the market [9]. For our analysis, we assumed a popular Meko with a reported 37.65 USD investment.
Estimating the price for hydrogen cookstoves and containers is difficult, as commercial products are rare. Thus, we relied on the assumptions of previous researchers. Topriska et al. proposed and tested a hydrogen-based cooking system in rural Jamaica [30]. The authors stated that only a few modifications to a conventional LPG stove are required to refit the burner for hydrogen. We further assume portable, pressurized type 1 hydrogen containers as a storage and transport medium for households because of the significantly lower costs compared to metal hydride storage [30]. For regular (type 1) hydrogen storage, the Danish Energy Agency assumes 1881 €/kg. As this figure seems very low compared to current LPG container costs in Kenya and no supply chain currently exists, we adopted the costs for LPG containers and added 15% transport costs as an estimation. Based on the LPG container costs, we assumed a 0.5 kg portable hydrogen storage to cost 25 USD in our analysis. Assuming typical values of LPG stoves (Meko and single burner), but each multiplied with a factor of 1.15 to account for potential transport costs, we estimated that a single burner, including hydrogen storage, thus amounts to 75 USD, while a hydrogen-Meko totals 43.2 USD.

Hydrogen System

For our analysis, we assumed the hydrogen system consisted of an alkaline electrolyzer (AEL), hydrogen cascade storage and polymer membrane electrolyte fuel cell (PEMFC), as these reflect the market status. The components were discussed in detail and assumptions justified in our previous work investigating the potential of power-to-hydrogen-to-power in African mini-grids [15]. Table 4 provides an overview of the main economic and technical parameters. Selected parameters, including the specific investment costs of the electrolyzer and fuel cell, efficiency of electrolyzer and fuel cell, and project parameter were examined separately during sensitivity analysis. We neglected the auxiliaries of the electrolyzer. The description of the compressor component considered to increase the hydrogen pressure released from the electrolyzer to hydrogen storage level, was integrated in the storage component as described in [15].

Electricity System

While the costs of PV production tended to decline rapidly in the past decade, purchase costs significantly vary across countries and regions in rural Africa [55]. We assumed 1000 USD/kW investment costs for the PV panel, which is in line with field data obtained by Moner-Girona et al. for Sub-Saharan Africa (930 USD/kW) [56], data obtained by a survey of the ESMAP for 2019 in Kenya (994 USD/kW/module and 283 USD/kW for PV racks) [57], and a global market study by Jäger et al. (700 USD/kW module costs, excluding any taxes and administration costs) [55]. Operation and maintenance costs were assumed to be constant throughout the project lifetime at 15 USD/kW/year (scaled to consider investment costs according to [55]). The financial lifetime of the PV system was assumed to be 20 years [55,56].
Common lead-acid batteries dominate the African market for stationary storage applications [58]. Based on recent literature, we assumed specific investment costs of 175 USD/kWh [40], 15 USD/kW/y operational and maintenance costs [59], a C-rate of 0.1 [60], 0.80% round-trip efficiency [61], 60% depth of discharge (DoD) [40] and a lifetime of five years [62]. Cyclic aging mechanisms were neglected.
The balance of system (BoS) required to control and operate the electricity system according to the optimal dispatch, comprising a set of components that measure, monitor and control the electrical loads [63] was assumed to be proportional to the capacity of the PV array [40]. We assumed a linear cost function of 1100 USD/kWp for a system including a charge controller, inverter, protection board, and cabling [40]. Efficiency and lifetime were assumed according to the inverter component with 95 % and 10 years, respectively [64].

2.3. Methods

This section describes the methods applied to receive an optimal result (Section 2.2.1), and the metrics defined to present and evaluate the results (Section 2.2.2).

2.3.1. Model Objective

To evaluate the techno-economic performance of the mini-grid and hydrogen cooking fuel supply, we apply mathematical optimization.
We apply the open energy modeling framework (oemof) to define a linear objective function within a set of linear constraints. A detailed description of the oemof framework is provided in [65,66]. Benderes et al. compared the performance against other optimization software in [67]. Global constraints valid for our system are presented in our previous work [15].
Our optimization objective is to minimize the total annualized system costs over the time horizon T (20 years) simulated. Our objective function including all components c C can be written as:
min   c C ( c p x c v a r P c n o m i n a l C R F + O P X c f i x ) + c C t T o p x c v a r Δ t   c C ,   t T
where c p x c v a r are size specific investment costs of component c (as no fixed costs are considered), with the decision variable of the nominal capacity P c n o m i n a l , and C R F is the capital recovery factor (CRF) based on the discount factor i according to Equation (3).
C R F = ( 1 i ) τ d i ( 1 i ) τ d 1
We assume a time and technology independent weighted average cost of capital (WACC) of 10%, in accordance with suggestions provided by the International Renewable Energy Agency (IRENA) for non-OECD countries [68].
In Equation (2), O P X c f i x are fixed operating expenditures, e.g., operation and maintenance costs, while o p x c v a r are variable operating expenses linked to the associated flows of component c . The fixed operational costs O P X c f i x depend on the initial investment costs C P X c of component c :
O P X c f i x = C P X c     o p x c f i x
where o p x c f i x is a factor for the annual operation and maintenance cost as a fraction of the investment costs. Our analysis neglects further project– and organization–individual cost items, such as labor costs.

2.3.2. Economic Measures of Result

We used two different perspectives to evaluate the hydrogen cooking systems and compare them to the conventional cooking supply: (1) the energy system perspective and (2) the end user perspective.

Economic Energy System Evaluation

To compare the cooking systems from a system perspective, we adopted typical metrics from the literature. We relied on the total annualized system costs (TAC) as an economic performance indicator. Further, we measured the economic efficiency with the levelized costs of system (LCOS), levelized costs of electricity (LCOE), and levelized costs of cooking (LCOCooking) as system measures (see Appendix B for formulae and a detailed description of the calculations).
It is important to note that we calculated the LCOE and LCOCooking by accounting for a share of costs on the total energy system equal to the flow of energy through the electricity and cooking energy subsystems, respectively (see example in Appendix B). This objective definition is important to note, as the resulting key-performance indicators L C O E and L C O C o o k i n g do not necessarily imply the final costs for the end user (however, they might arguably be a reference for them). The measures express the distribution of costs of the two sub-systems for the total system. A possible alternative calculation—potentially considered by mini-grid operators interested in the effect of introducing cooking fuel loads to their existing systems—would be to calculate the current costs of electricity supply (and LCOE), and only account for any additional costs to this system as the costs for the cooking fuel system when introducing the cooking fuel load. However, the costs of delivering cooking energy might be underestimated with this approach. Nevertheless, since we assume an existing mini-grid and harnessing of excess electricity to produce small amounts of hydrogen in the hydrogen–LPG blending scenario to enrichen the results, the latter calculation method implying a certain ownership model is justifiable for this scenario and was adopted.

Economic Impact for End Users

We compared the potential average monthly household cooking costs for each hydrogen-based cooking solution and compared the costs to the use of traditional fuels. The monthly costs of cooking include fuel costs and payment installments for the cookstove considered to be acquired via a micro-finance credit. To allow for a comparison, we consistently considered a three-year financing period, 12% interest rate and 2% inflation (equals a real interest rate of 9.8%), which is in alignment with electric with a comparison of innovative cooking options in Tanzania reported by the ESMAP [49], and a conservative estimate of the currently reported 6.1% average interest rate reported in Kenya in 2021 [69]. We neglected the different lifetimes of the cookstoves. It is common practice to neglect different lifetimes of the cookstoves, but evaluate systems by the end of the financing period.
The final price of the hydrogen-based cooking energy depends on the individual entity providing the service. As a first approximation, we adopted the LCOCooking as the price of cooking energy delivered in the case of delivering gaseous hydrogen to end users. In contrast, when considering electrical energy to be delivered as cooking energy (P2H2P-based e-cooking), we applied the current electricity tariffs as the final price. In Kenya, electricity tariffs via regulation vary with the level of consumption of the individual end user, and the entity supplying electricity in the off-grid system. If electricity is supplied by the national utility, the regular uniform tariff applies. Domestic clients consuming less than 100 kWh per month (which is the case in our analysis even if assuming e-cooking; 86.34 kWh per household) are charged a lifeline tariff (0.167 USD/kWh), while the ordinary domestic tariff is set 0.216 USD/kWh including fees, levies, and charges [70]. In contrast, private mini-grid operators may charge individual cost-reflective tariffs [71]. The LCOE of an individual project may be a rough indicator for the respective final tariff and is used to negotiate the applicable tariff with the Energy Regulatory Commission of Kenya. However, aside from LCOE, project finance parameters and other items influence the final tariff. Additionally, the private investor may make up to (but not necessarily) an 18% internal rate of return on the tariff [72]. Therefore, it is not useful to use our calculated LCOE as a synonym for the end-user tariffs. We rather relied on the average reported tariffs in Kenyan mini-grids and adopted the lower border of 0.67–0.8 USD/kWh reported in 2015 [71], assuming a decline of the tariff in the last years.

2.3.3. Scenario Assumptions

Our study includes a scenario analysis. Table 5 quantifies the most important assumptions, including:
  • Improvement of renewable energies and hydrogen technologies: with ongoing research and increased production, renewable energy technologies and hydrogen technologies are expected to improve in efficiency and simultaneously decline in costs. In reference to current prices, PV module prices may fall by approximately 60% until 2030 and 75% by 2050 according to the International Renewable Energy Agency (IRENA) [73]. Similarly, electrolysis is expected to decline in CAPEX by 40% by 2030 and by more than 80% by 2050 [74]. Simultaneously, efficiency improvements of ELs of at least up to 73% are expected for low-temperature electrolysis until 2050 [74]. As analogous expectations for the FC are vague in the literature, we assume similar trends for the FC. We assume 70% efficiency for a PEMFC to be reachable in the future, referring to t maximum of 65% [74].
  • Increase in fuel costs: traditional (fossil) cooking fuel resources in Sub-Saharan Africa are limited. In Kenya, an increase in firewood prices has already been reported. In alignment with assumptions from the ESMAP, we assume a 3% annual increase in traditional and fossil fuel prices [49].
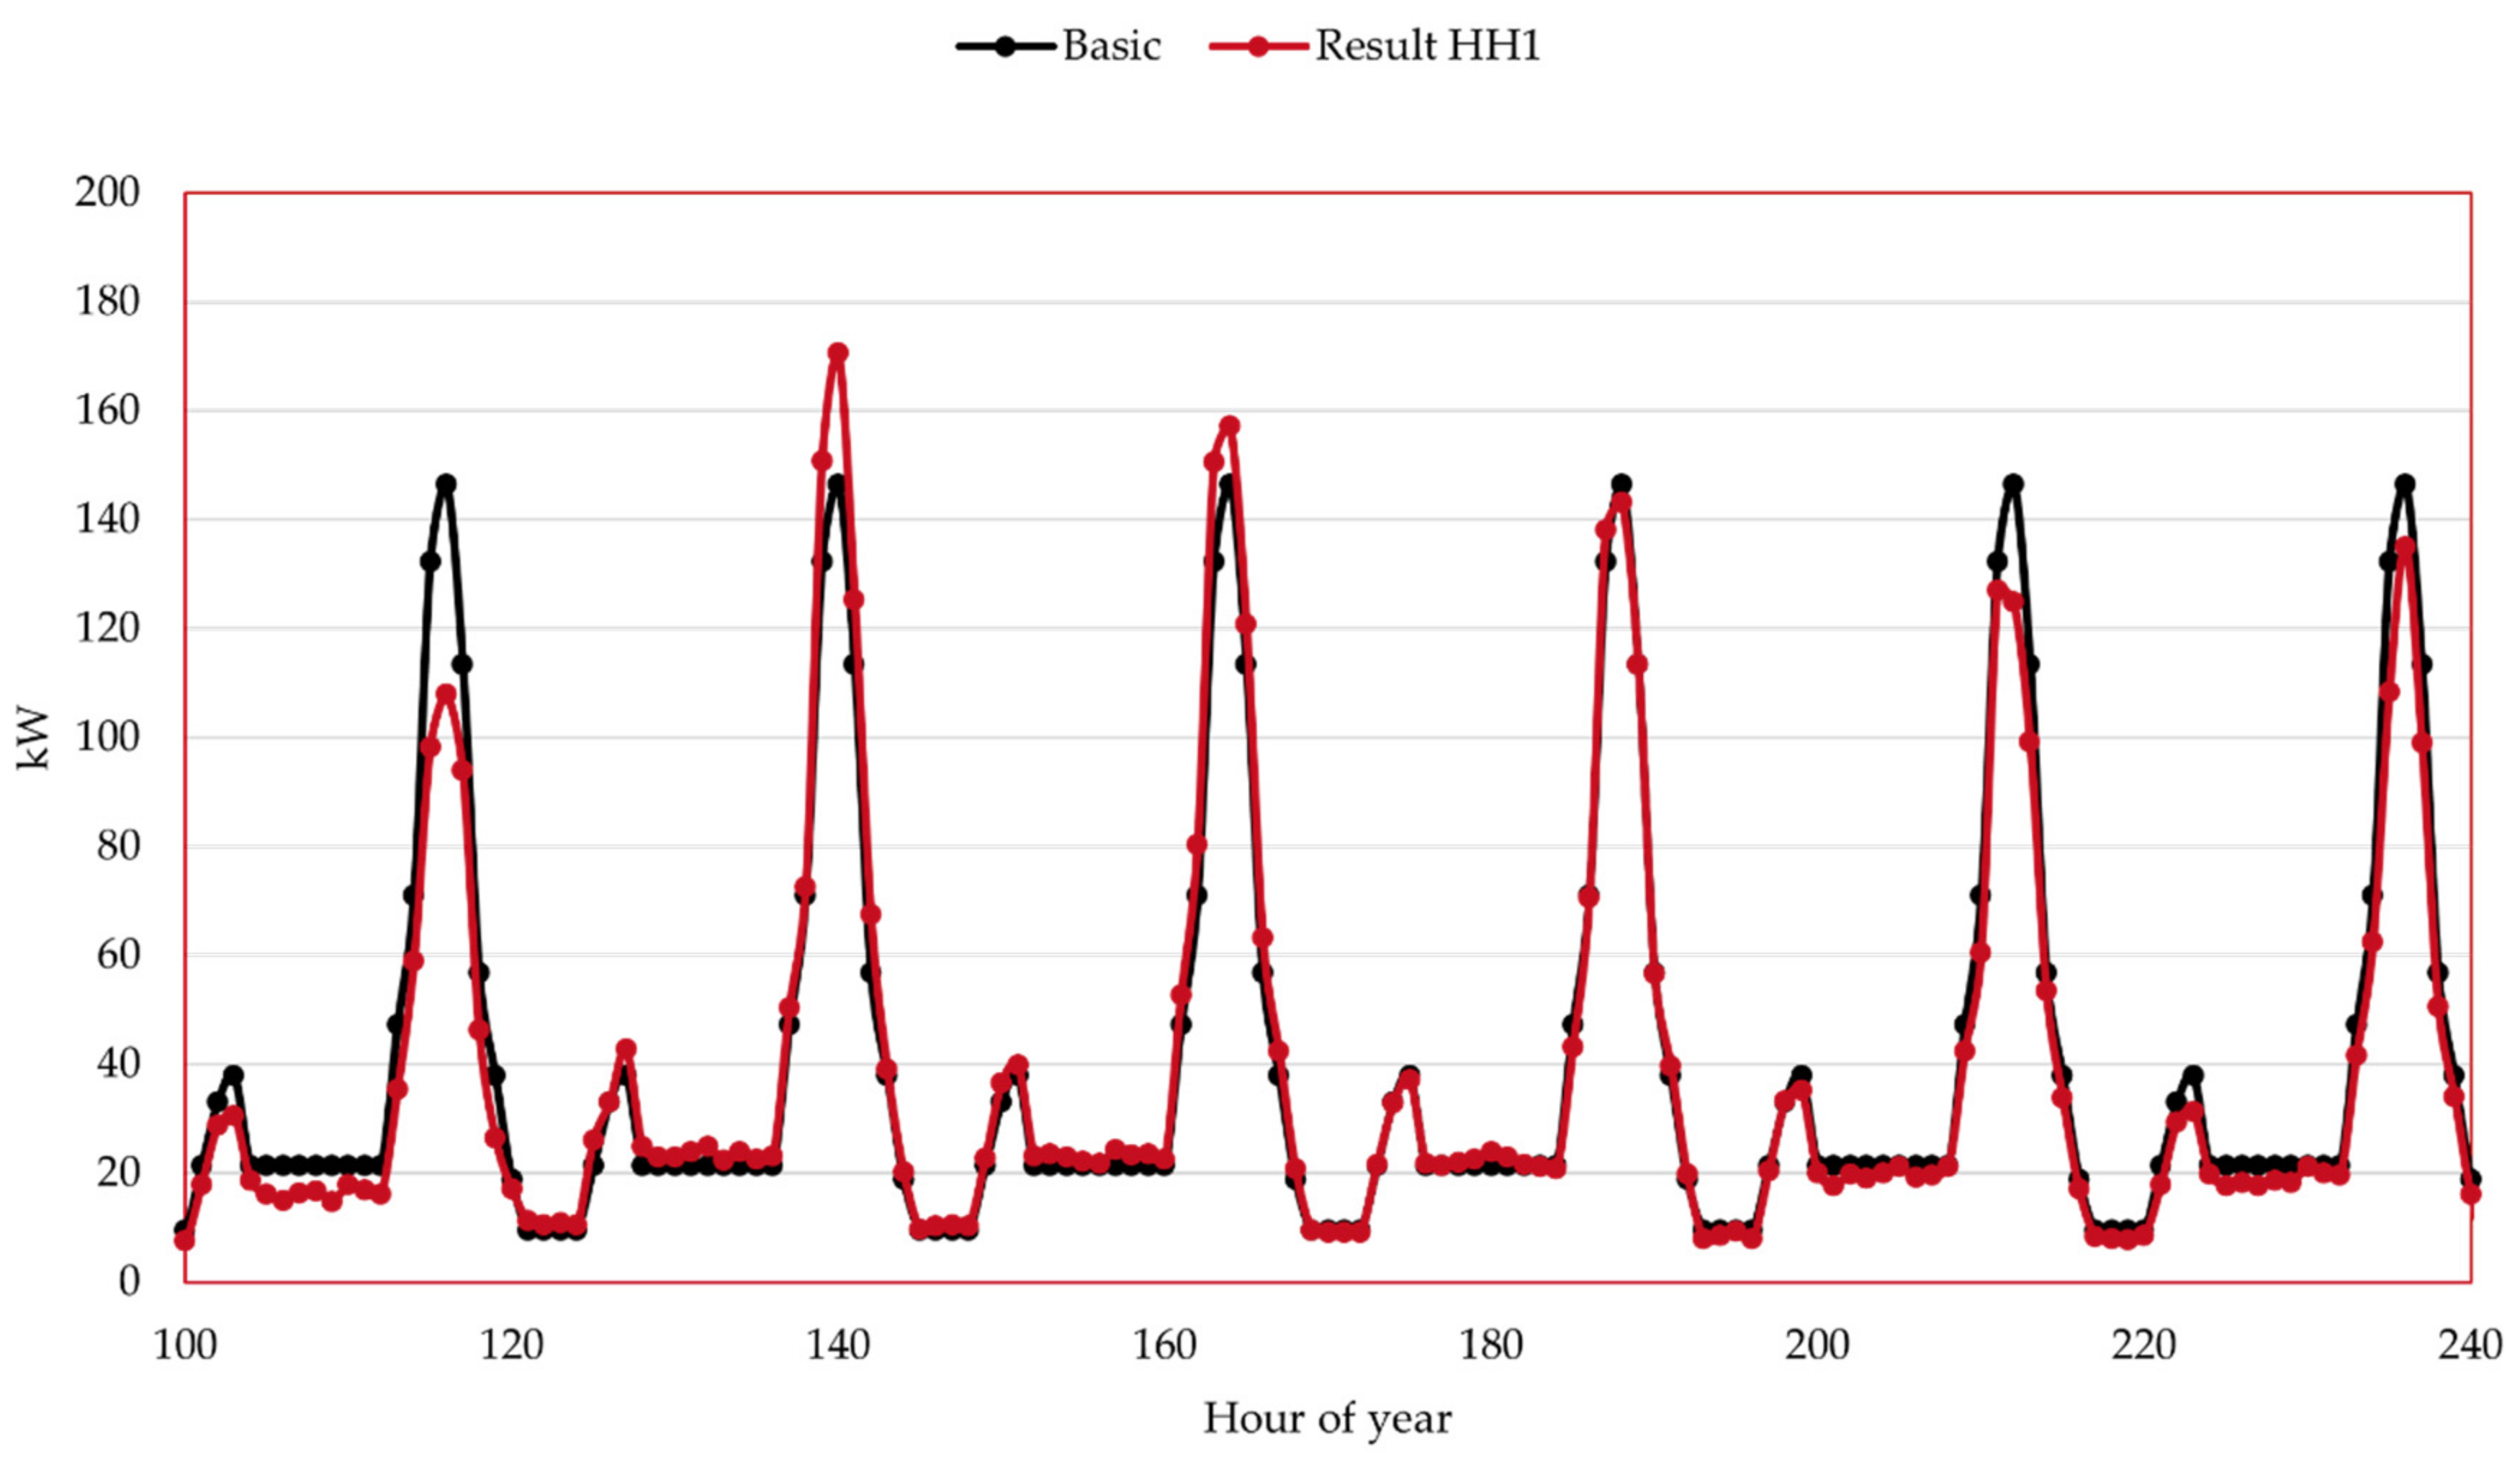
  • Switch in stoves: the government and other organizations promote the diffusion of improved efficient cooking in Kenya. Likely, improved cookstoves (ICS) (notably, there is no universally accepted definition of the term “improved cookstove”, thus we rely on the definition of ESMAP adopted by the Ministry of Energy of the Republic of Kenya [25]) are successively used even by the rural population. We assume the substitution of traditional firewood and charcoal stoves by ICSs with higher efficiencies, but notably increased costs, as stated under Cooking Systems, by 2030. We further assume more efficient DC EPCs (efficiency of 70%) to substitute AC EPC and electric hotplates from 2030 onwards [49]. Notably, this impacts the electricity demand profile; see Cooking Demand. For any cookstove, we estimate a linear cost decline of 5% between 2030 and 2040 and 10% between 2040 and 2050. In the reference case, we assume a Meko-stove for hydrogen and LPG, but analyze the costs for a more expensive conventional single-burner.
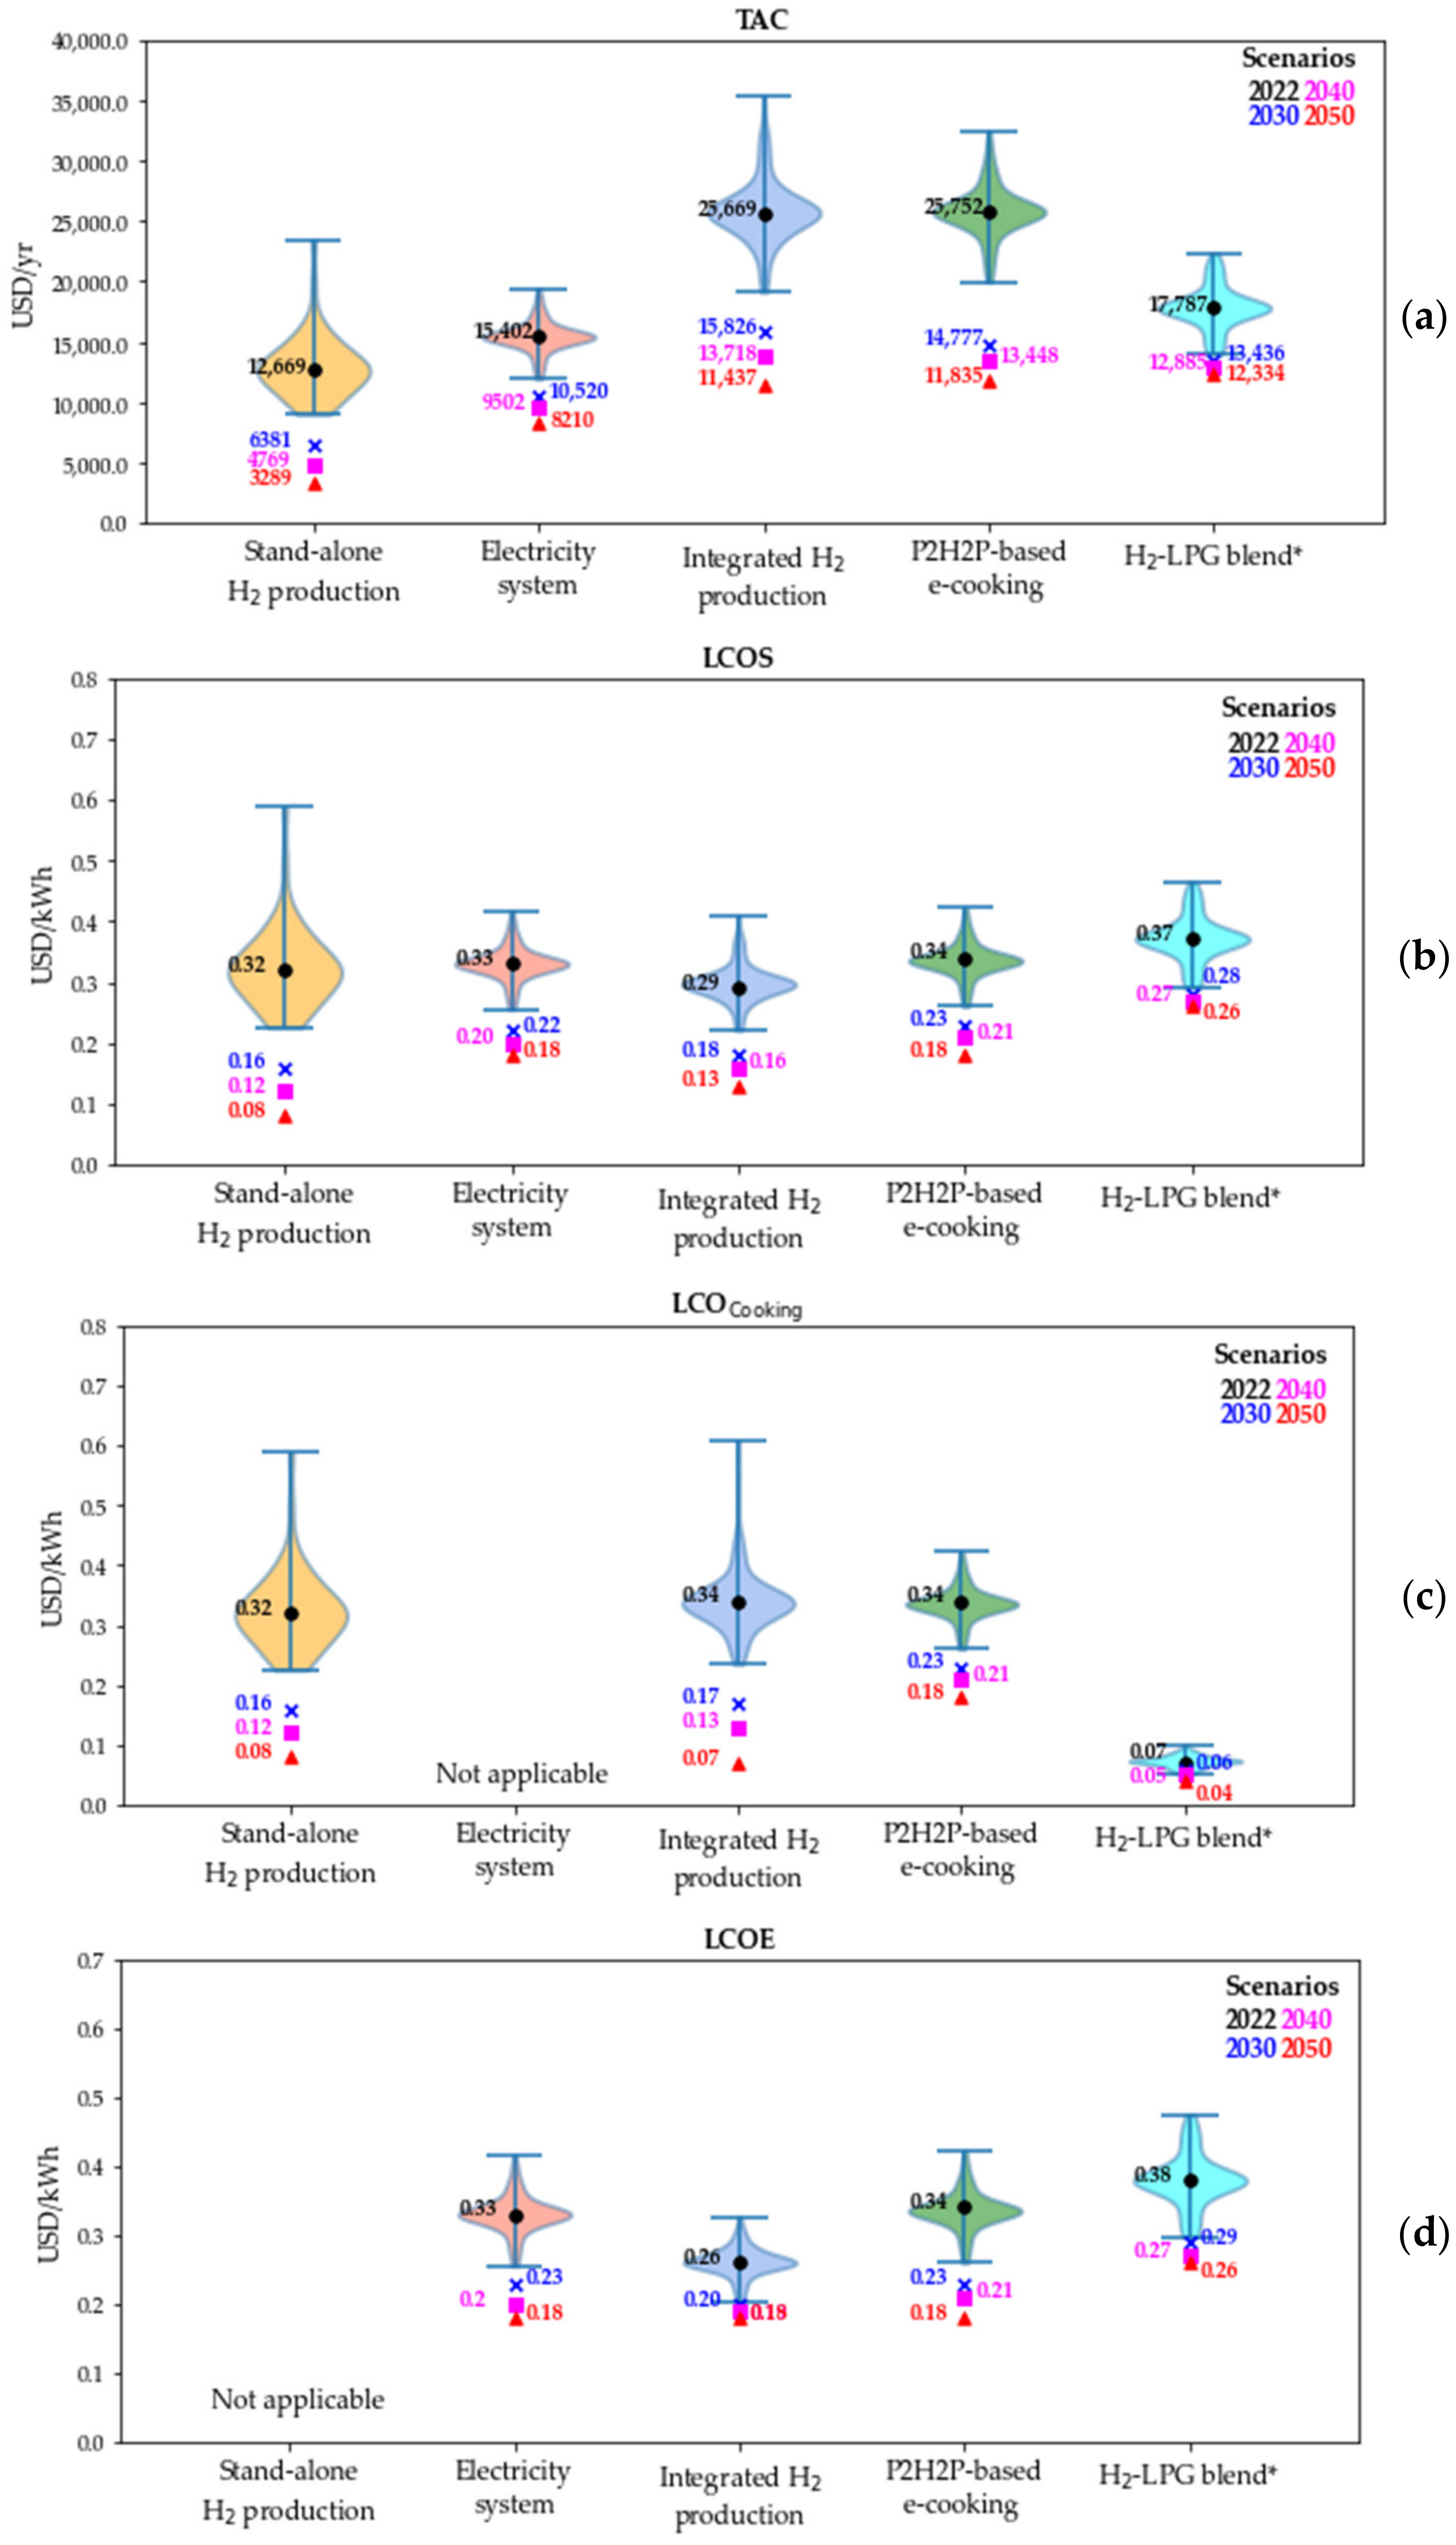
  • Electricity tariff: the regulated electricity tariffs for grid-connected customers in Kenya have slightly declined over the last years. However, a continuation of this trend is questionable and hard to predict. Thus, we maintain the uniform electricity tariff in our scenarios. Individual cost-based tariffs for isolated grids, however, will likely fall alongside the estimated cost decline of energy supply technologies. We adjust the mini-grid tariff according to the LCOE reduction observed in our analysis of a stand-alone electricity supply system (see Figure 1b).

3. Results and Implications

In this section, we evaluate the technical and economic performance of the different hydrogen-based cooking solutions proposed in Section 2.1. First, we describe the respective optimal energy system topologies in Section 3.1.1. Second, we analyze the economic energy system results in Section 3.1.2, including a sensitivity analysis towards techno-economic parameters. In Section 3.2, we quantify the resulting possible costs for the end user for each proposed hydrogen-based cooking solution and compare them to the use of traditional cooking fuels. We set the results in relation to expected future developments and draw implications.

3.1. Energy System Results

3.1.1. Optimal Energy System Topology

We analyzed the optimal results for the hydrogen-based cooking energy systems proposed in Section 2.1 under current technical parameters and prices, as well as future estimates as stated in Table 5. Table 6 summarizes the technical system results for the respective optimal energy systems.
The main findings of the technical system analysis are summarized below:
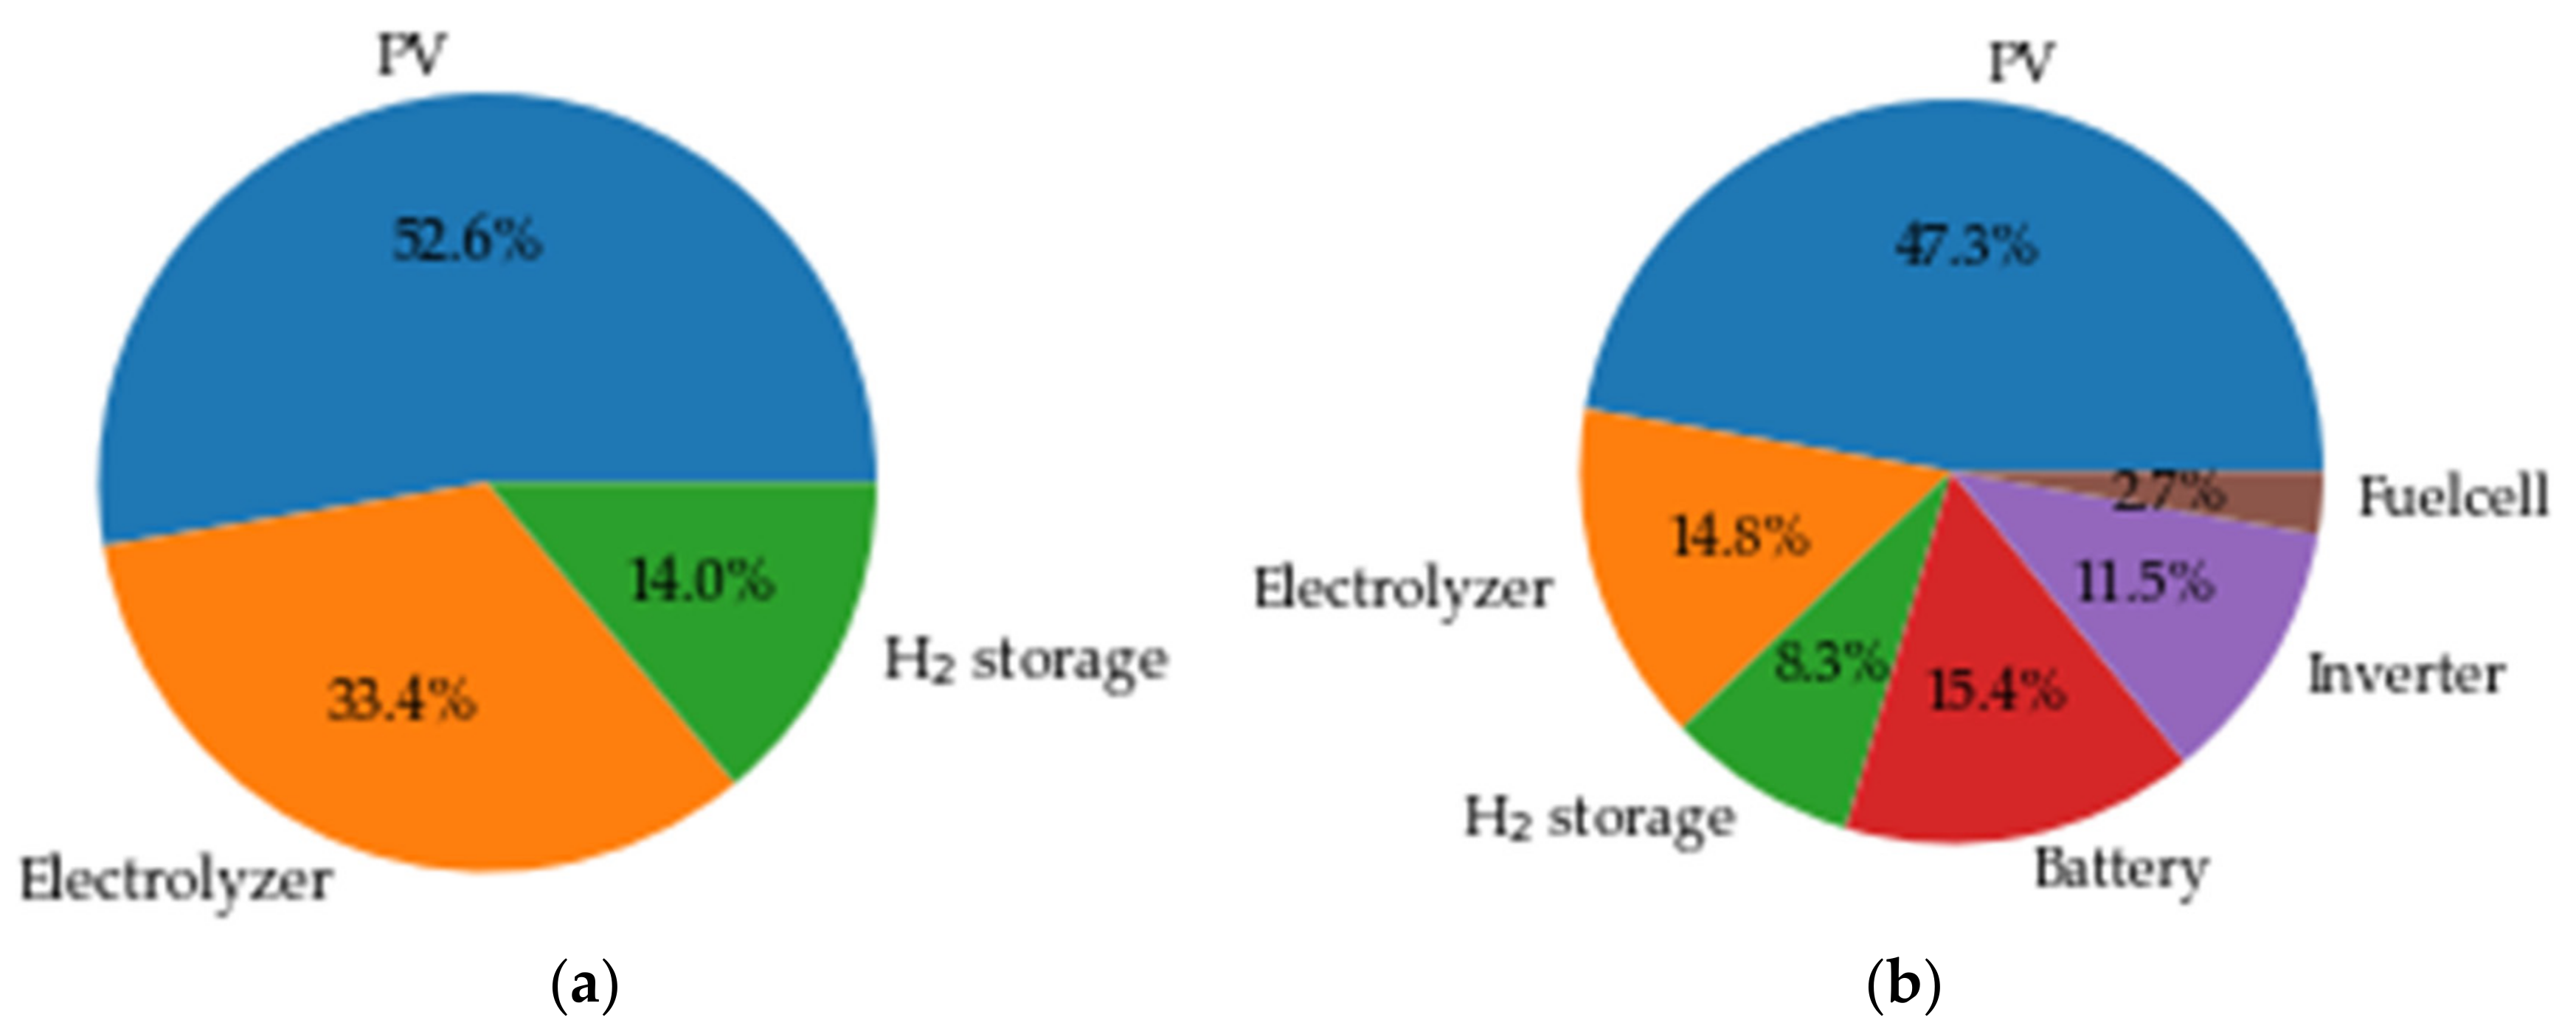
  • System integration: when integrating the EL to produce hydrogen for utilization via combustion into the electricity supply system, the resulting PV and EL component sizes are less than the sum of the respective component sizes when considering stand-alone hydrogen combustion and electricity supply. This suggests that synergies in the operation of the subsystems and co-utilization of infrastructures can be unlocked by the integration.
  • Electricity supply system: we observe that the FC becomes smaller in the optimal energy system topology in scenarios 2030 and 2040 when integrating the hydrogen production into the electricity supply system. Currently, this is explained by studying the operational behavior of the systems. Under present conditions, the FC operates during evening peaks and after days with low solar irradiation, as the hydrogen storage associated with low energy losses is a suitable long-term storage. When decreasing the investment costs of the PV in 2030 and 2040 scenarios, more of such rare events are covered directly by larger-sized PV and short-term battery storage (note that the share of excess electricity increases by 50% from 2030 to 2040). However, the expected decline in CAPEX of the EL and FC and respective efficiency increase expected by 2050 suggest to exclusively include P2H2P as back-up complementing PV, and the battery is excluded from the optimal energy system. The same trend is reflected in the stand-alone electricity supply system and hydrogen-based e-cooking system.
  • Hydrogen–LPG blend: while we suggest harnessing excess electricity of an existing PV-battery mini-grid, the excess electricity share is only reduced by 4% (10% of the total excess) when integrating the electrolyzer. An optimal electrolyzer size of <1 kW is sufficient to produce the required amount of hydrogen cooking fuel when blended into LPG by 20% on a volumetric basis. This suggests that the potential of the blending solution to decrease excess electricity of mini-grids is limited when considering the market size for cooking fuel to be restricted to the local residentials (see [75] for a related discussion of utilizing excess electricity from over-sized mini-grids in Africa).

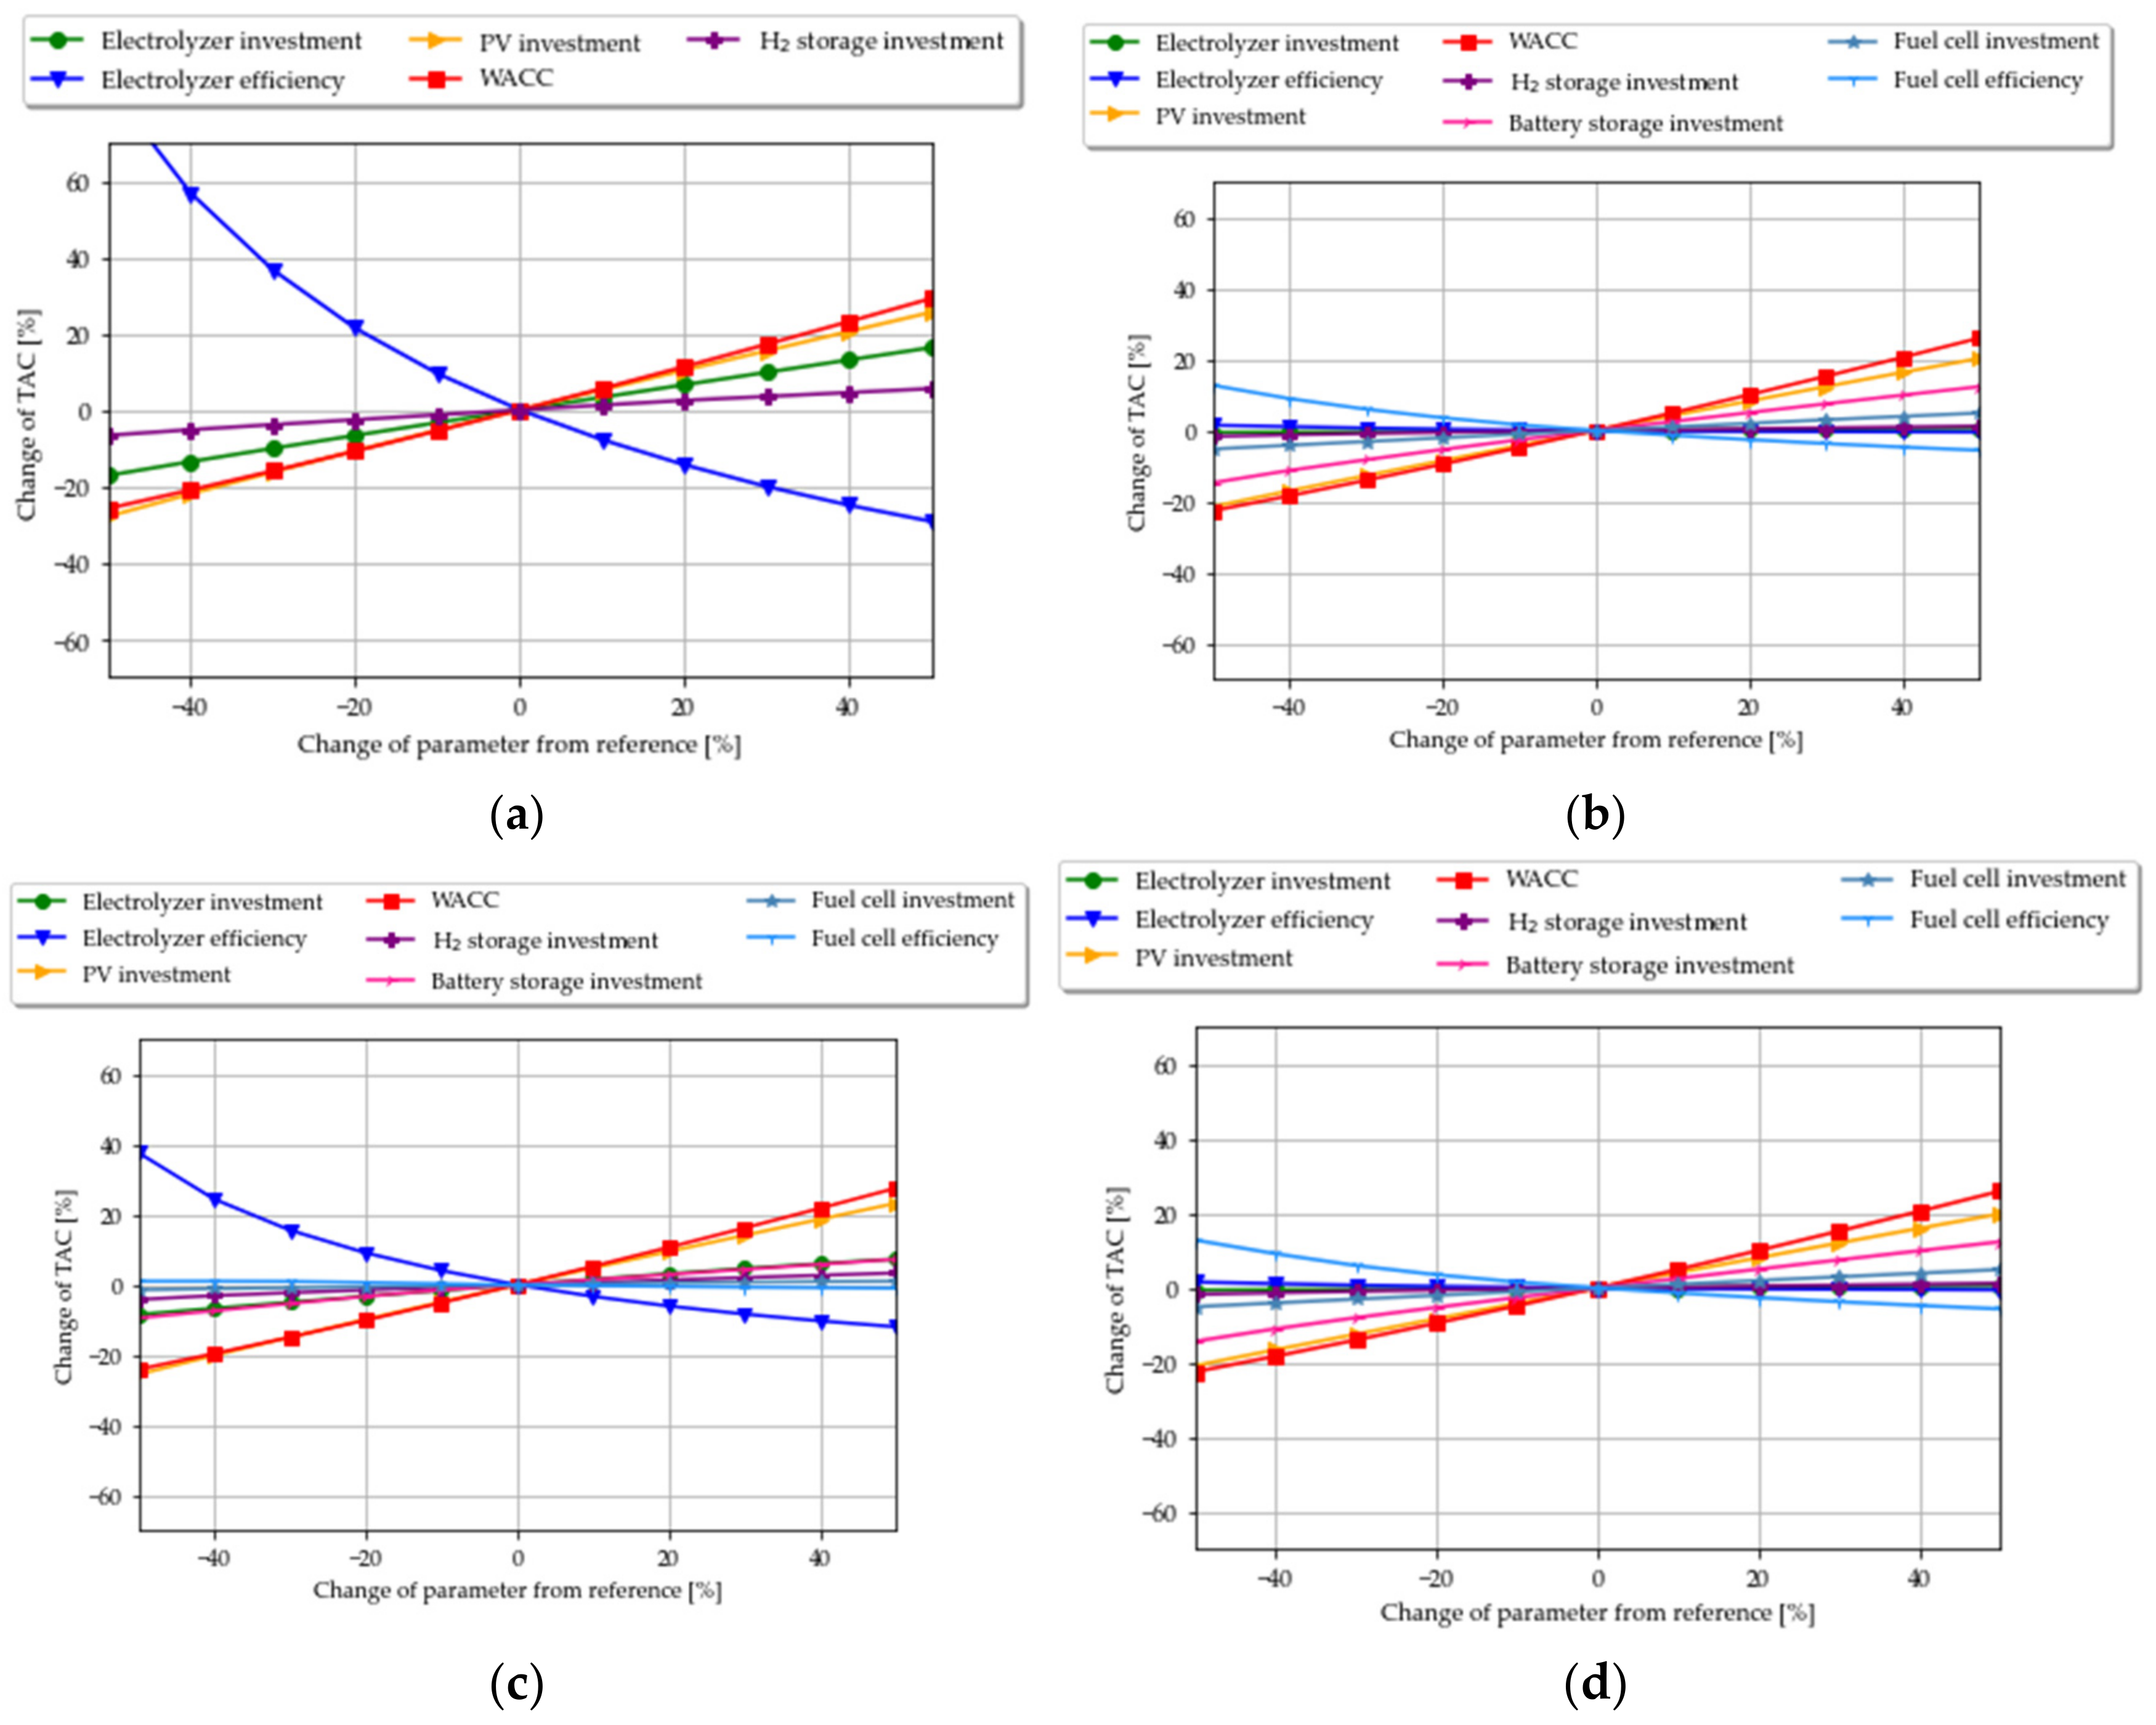
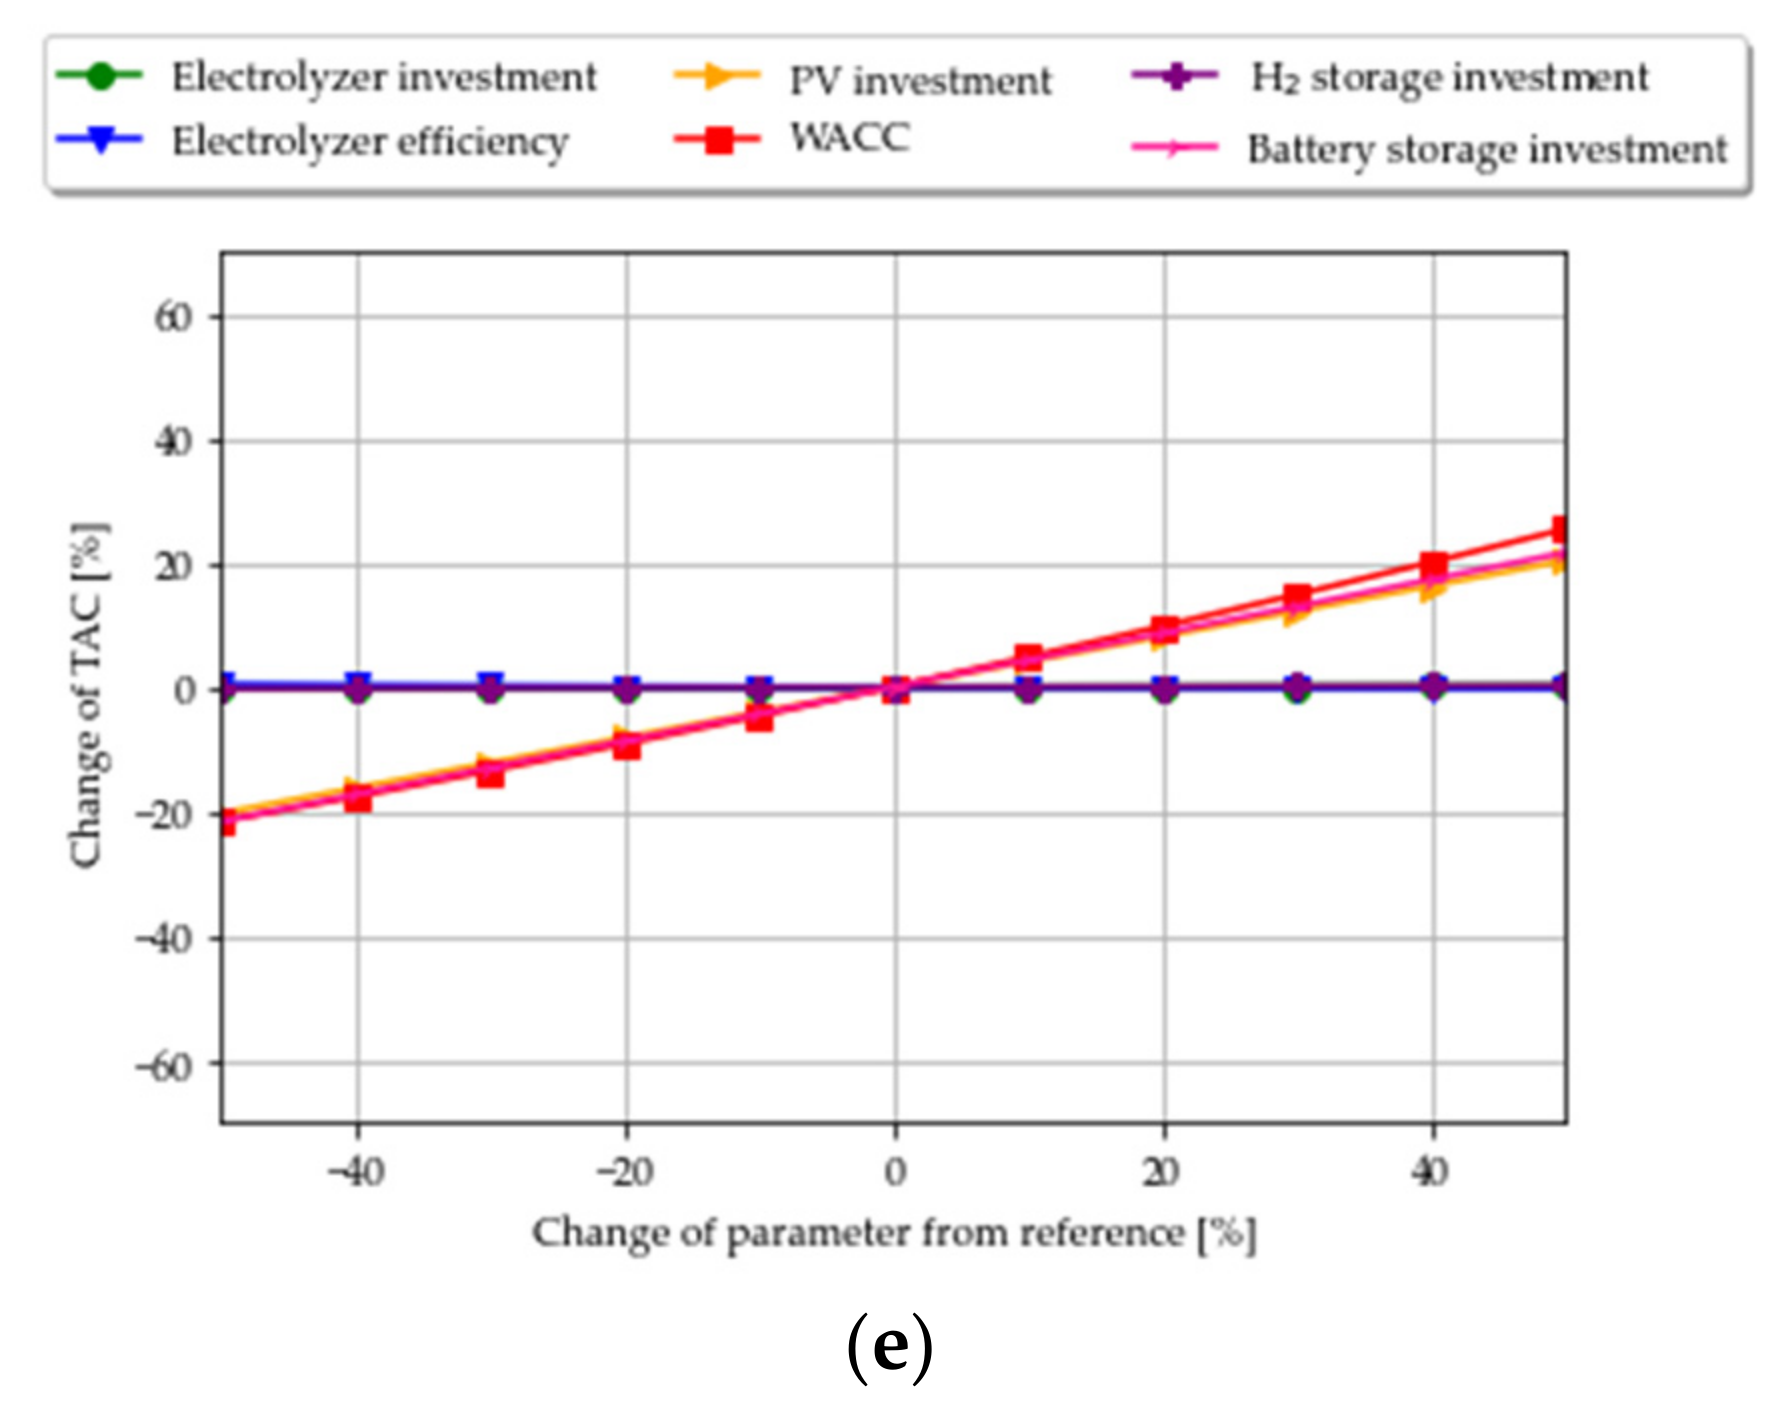
3.1.2. Economic Energy System Results

Figure 2a–d illustrates the economic assessment results of the different hydrogen-based cooking systems based on the indicators defined in Section 2.3.2. The annotated black, blue, magenta, and red markers represent the optimal solution found under the economic and technical parameter constellation of 2022, 2030, 2040, and 2050, respectively. The body of the violin plots—enclosed by the extrema—indicates the space of solutions when varying the investment costs of the system components, WACC and EL and FC efficiency by ±50% compared to the reference value of 2022 (absolute). The shape of the violines, therefore, indicates the frequency distribution across all analyses. While we report the results of the analyses applying the reference parameters, the reader must also notice the extrema of the respective plots, indicating a respective “best-case” or “worst-case” result. Figure A3 of Appendix A details the influence of the individual parameters on the TAC.
The energy system costs for serving both electricity and the total cooking energy via hydrogen when integrating hydrogen combustion into the electricity supply system for the purpose of hydrogen utilization via combustion are almost 70% higher than the exclusive provision of electricity. However, the TAC of this integrated system (25,669 USD/yr) are 10% less compared to a separated stand-alone hydrogen production (TAC = 12,669 USD/yr) and electricity supply (TAC = 15,407 USD/yr) combined (28,076 USD/yr). This effect again results from exploitable synergies of shared assets when combining both services in one energy system.
We must note that the costs of the energy systems producing hydrogen to be utilized via combustion are influenced by the assumed refill frequency of the portable hydrogen containers. The assumed demand in refills requires the integration of a hydrogen cascade storage and reduces the operational freedom of the electrolyzer. When considering the stand-alone hydrogen production, the costs for the electrolyzer and hydrogen storage account for 33% and 14% of the TAC (see Figure A4 of Appendix A). In the integrated scenario, the relative contribution to the TAC of the two assets are reduced to 14.8% and 8.3% respectively. If optimizing the demand in refills, these shares of costs might be reduced.
The TAC of an energy system producing hydrogen for the purpose of re-electrification (P2H2P) for supplying electrical loads, including e-cooking appliances, are almost equal (TAC = 25,752 USD/yr) to the TAC of the alternative hydrogen utilization via combustion. The reduction of cooking energy demand (40%) expected when substituting the current combination of AC EPCs and AC hot plates by DC EPCs by 2030 may lead to a decrease in the TAC (<20%). When combined with the likely cost decline of PV, EL, FC and EL and FC efficiency improvements, the TAC of a P2H2P-based e-cooking system may decline by 43% by the end of the current decade.
From 2030 onwards, the cost gap between the systems producing hydrogen for utilization via combustion and the P2H2P-based e-cooking system may continuously shrink. This is caused by the fact that the foreseen development of the hydrogen components has a larger impact on the economic performance in systems producing hydrogen for utilization via combustion (see Figure A3), as their relative contribution to the TAC is more significant. Figure A3c illustrates the substantial influence of the electrolyzer efficiency on the integrated hydrogen production system. Increasing the EL efficiency by 50% (equal to an absolute efficiency of 90%, which is approximately the maximum to be assumed with high-efficient high-temperature electrolysis [76]) may reduce the TAC of the system by almost 20%. Other main drivers of the TAC are the PV CAPEX and WACC—in general the two most influential parameters in any energy system considered in our analysis.
From a system perspective, the hydrogen–LPG blending scenario offers the least costs system (TAC = 17,787 USD/yr). However, as described, the system only partially satisfies the cooking energy demand of the village. Including hydrogen production increases the TAC of the system by only 1.1% compared to the exclusive production of electricity in a PV-battery hybrid mini-grid.
Dividing the TAC by the useful amount of energy delivered (electricity and thermal), the LCOS of the systems reflect the cost efficiency of energy delivery. As described in Section 2.3.2, the LCOS are composed of the LCOE and the LCOCooking, with each relative to the respective share of useful energy and costs to provide the energy.
While the TAC for the energy system producing hydrogen for combustion integrated in the electricity system are the second highest (approximately equal to P2H2P-based e-cooking), the LCOS of the system (0.29 USD/kWh) are lower compared to a stand-alone production of hydrogen (0.32 USD/kWh). This again underpins the increased economic efficiency of a combined service of electricity and cooking fuel. However, the LCOCooking of the integrated hydrogen production system (0.34 USD/kWh) exceeds the corresponding LCOE (0.26 USD/kWh) under current conditions. This implies that the costs of delivering the cooking service deteriorate the economic efficiency of the overall energy system compared to the exclusive delivery of electricity. The relative gap between LCOE and LCOCooking decreases with expected technical and economic improvements of the EL, FC, and PV, and even changes to the opposite by 2030. Conclusively, such technological developments are required to improve the economic efficiency of producing hydrogen for utilization as a cooking fuel via combustion.
By 2050, the LCOS of the integrated hydrogen production system may drop by almost 55% (to 0.13 kWh/USD)—which pose the lowest LCOS of the five systems compared. The effect is encouraged by the LCOCooking, which may decline to 0.07 USD/kWh (approximately 2.76 USD/kgHydrogen if referenced to the fuel). Given such a development, the energy system for production of hydrogen and combustion would be cost-advantageous against hydrogen-based e-cooking by 2050 (LCOS = LCOCooking = 0.18 USD/kWh).
The LCOCooking are the lowest for the hydrogen–LPG blending system, 0.07 USD/kWh. However, it must be noted that the amount of hydrogen produced in this scenario does not cover the demand of the village, but only a tiny fraction of it (see Cooking Demand). Nevertheless, the LCOCooking are lower than the LCOE (0.38 kWh/kg). This implies that harnessing small amounts of excess and unutilized electricity to produce hydrogen may improve the economic efficiency of the overall energy system.

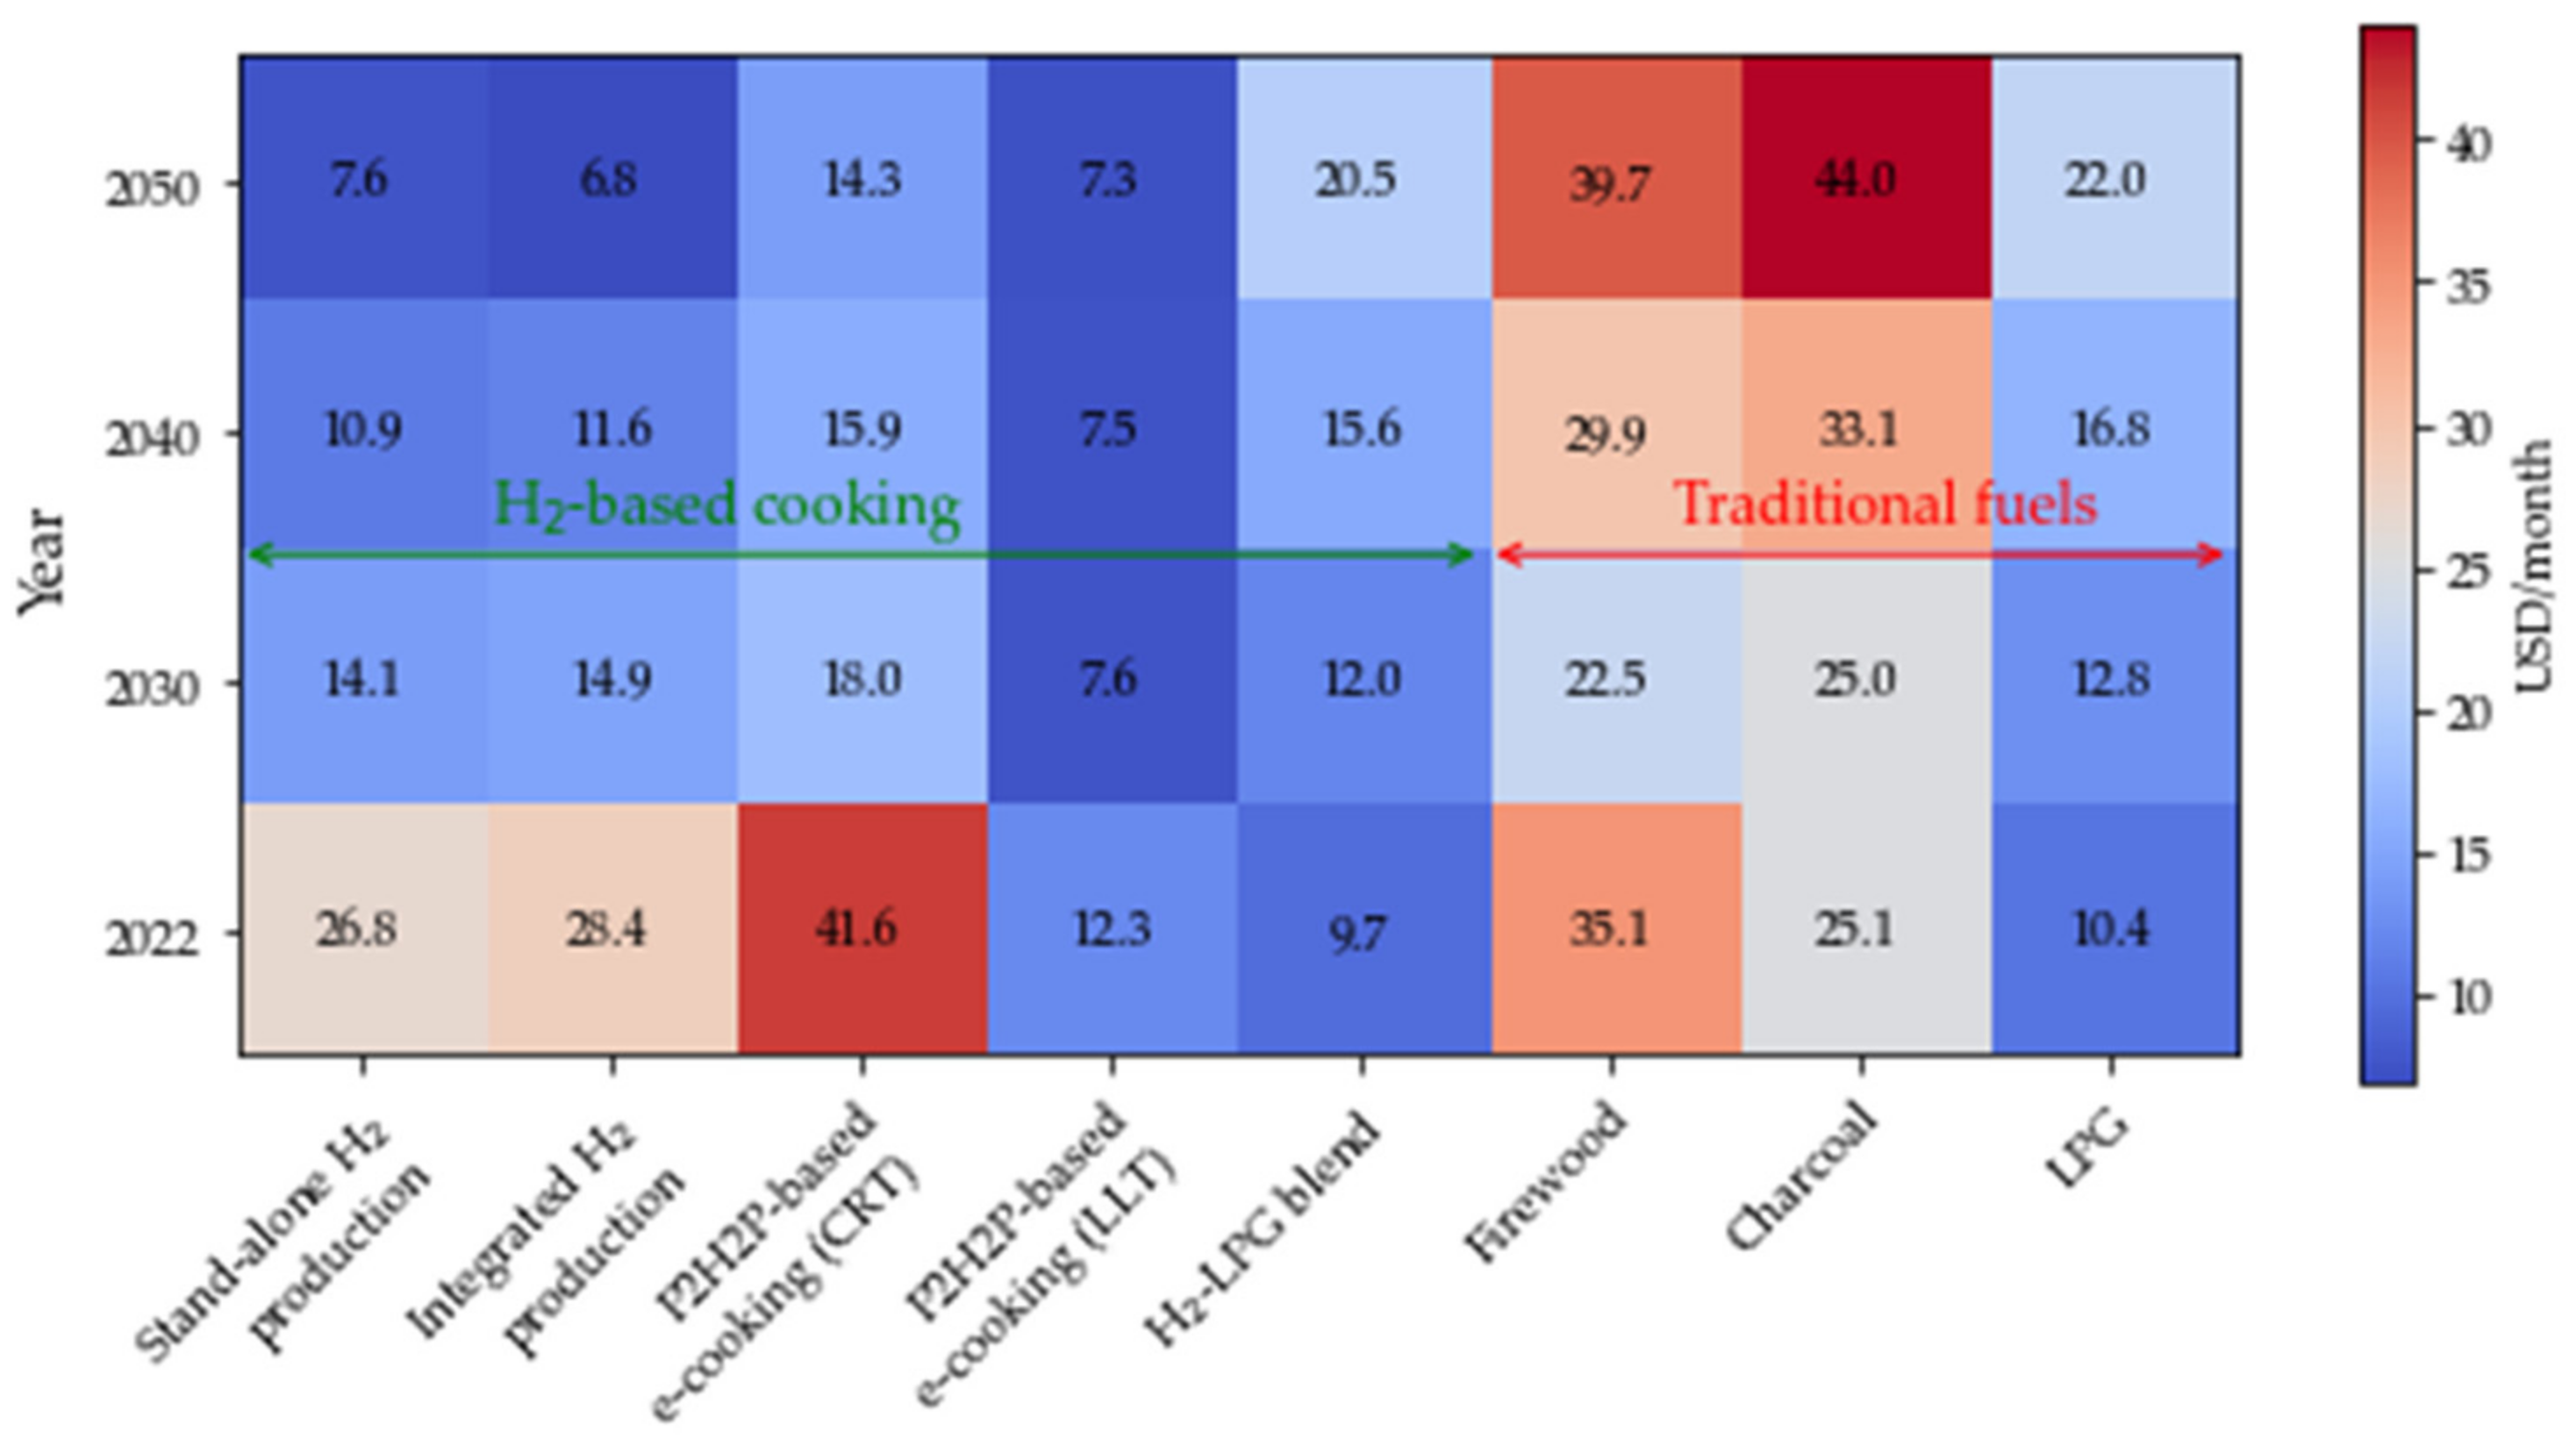
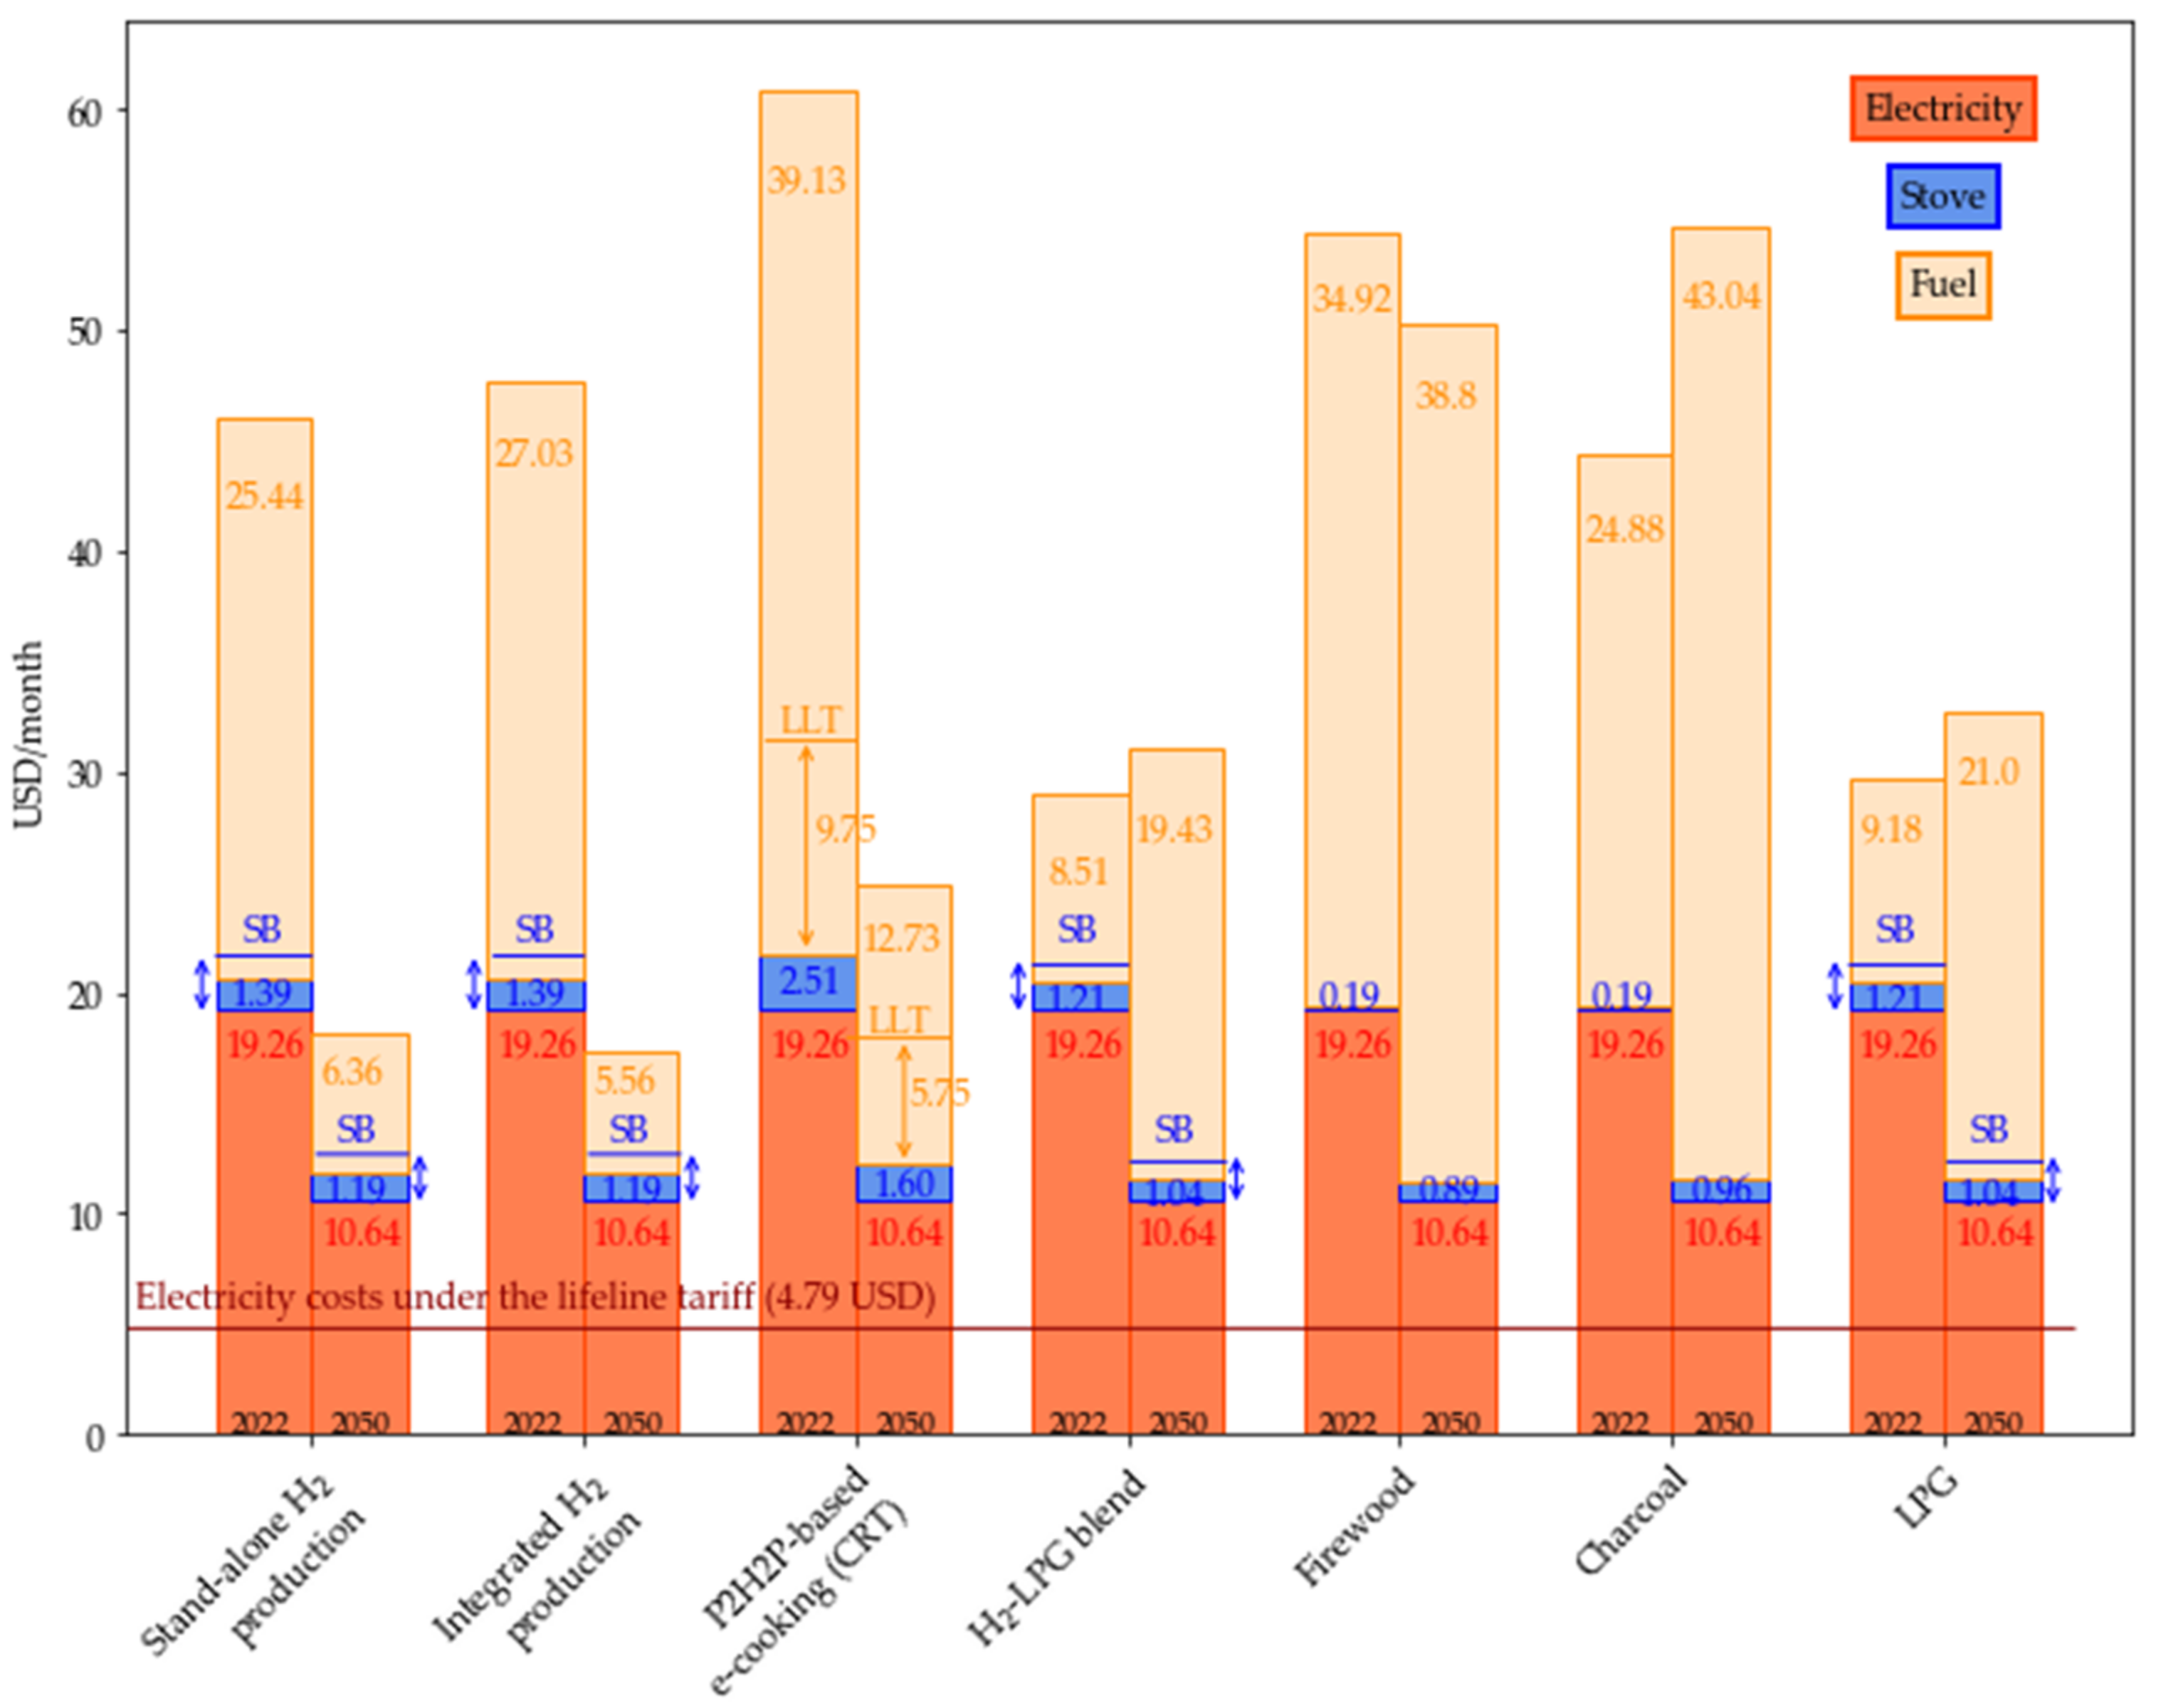
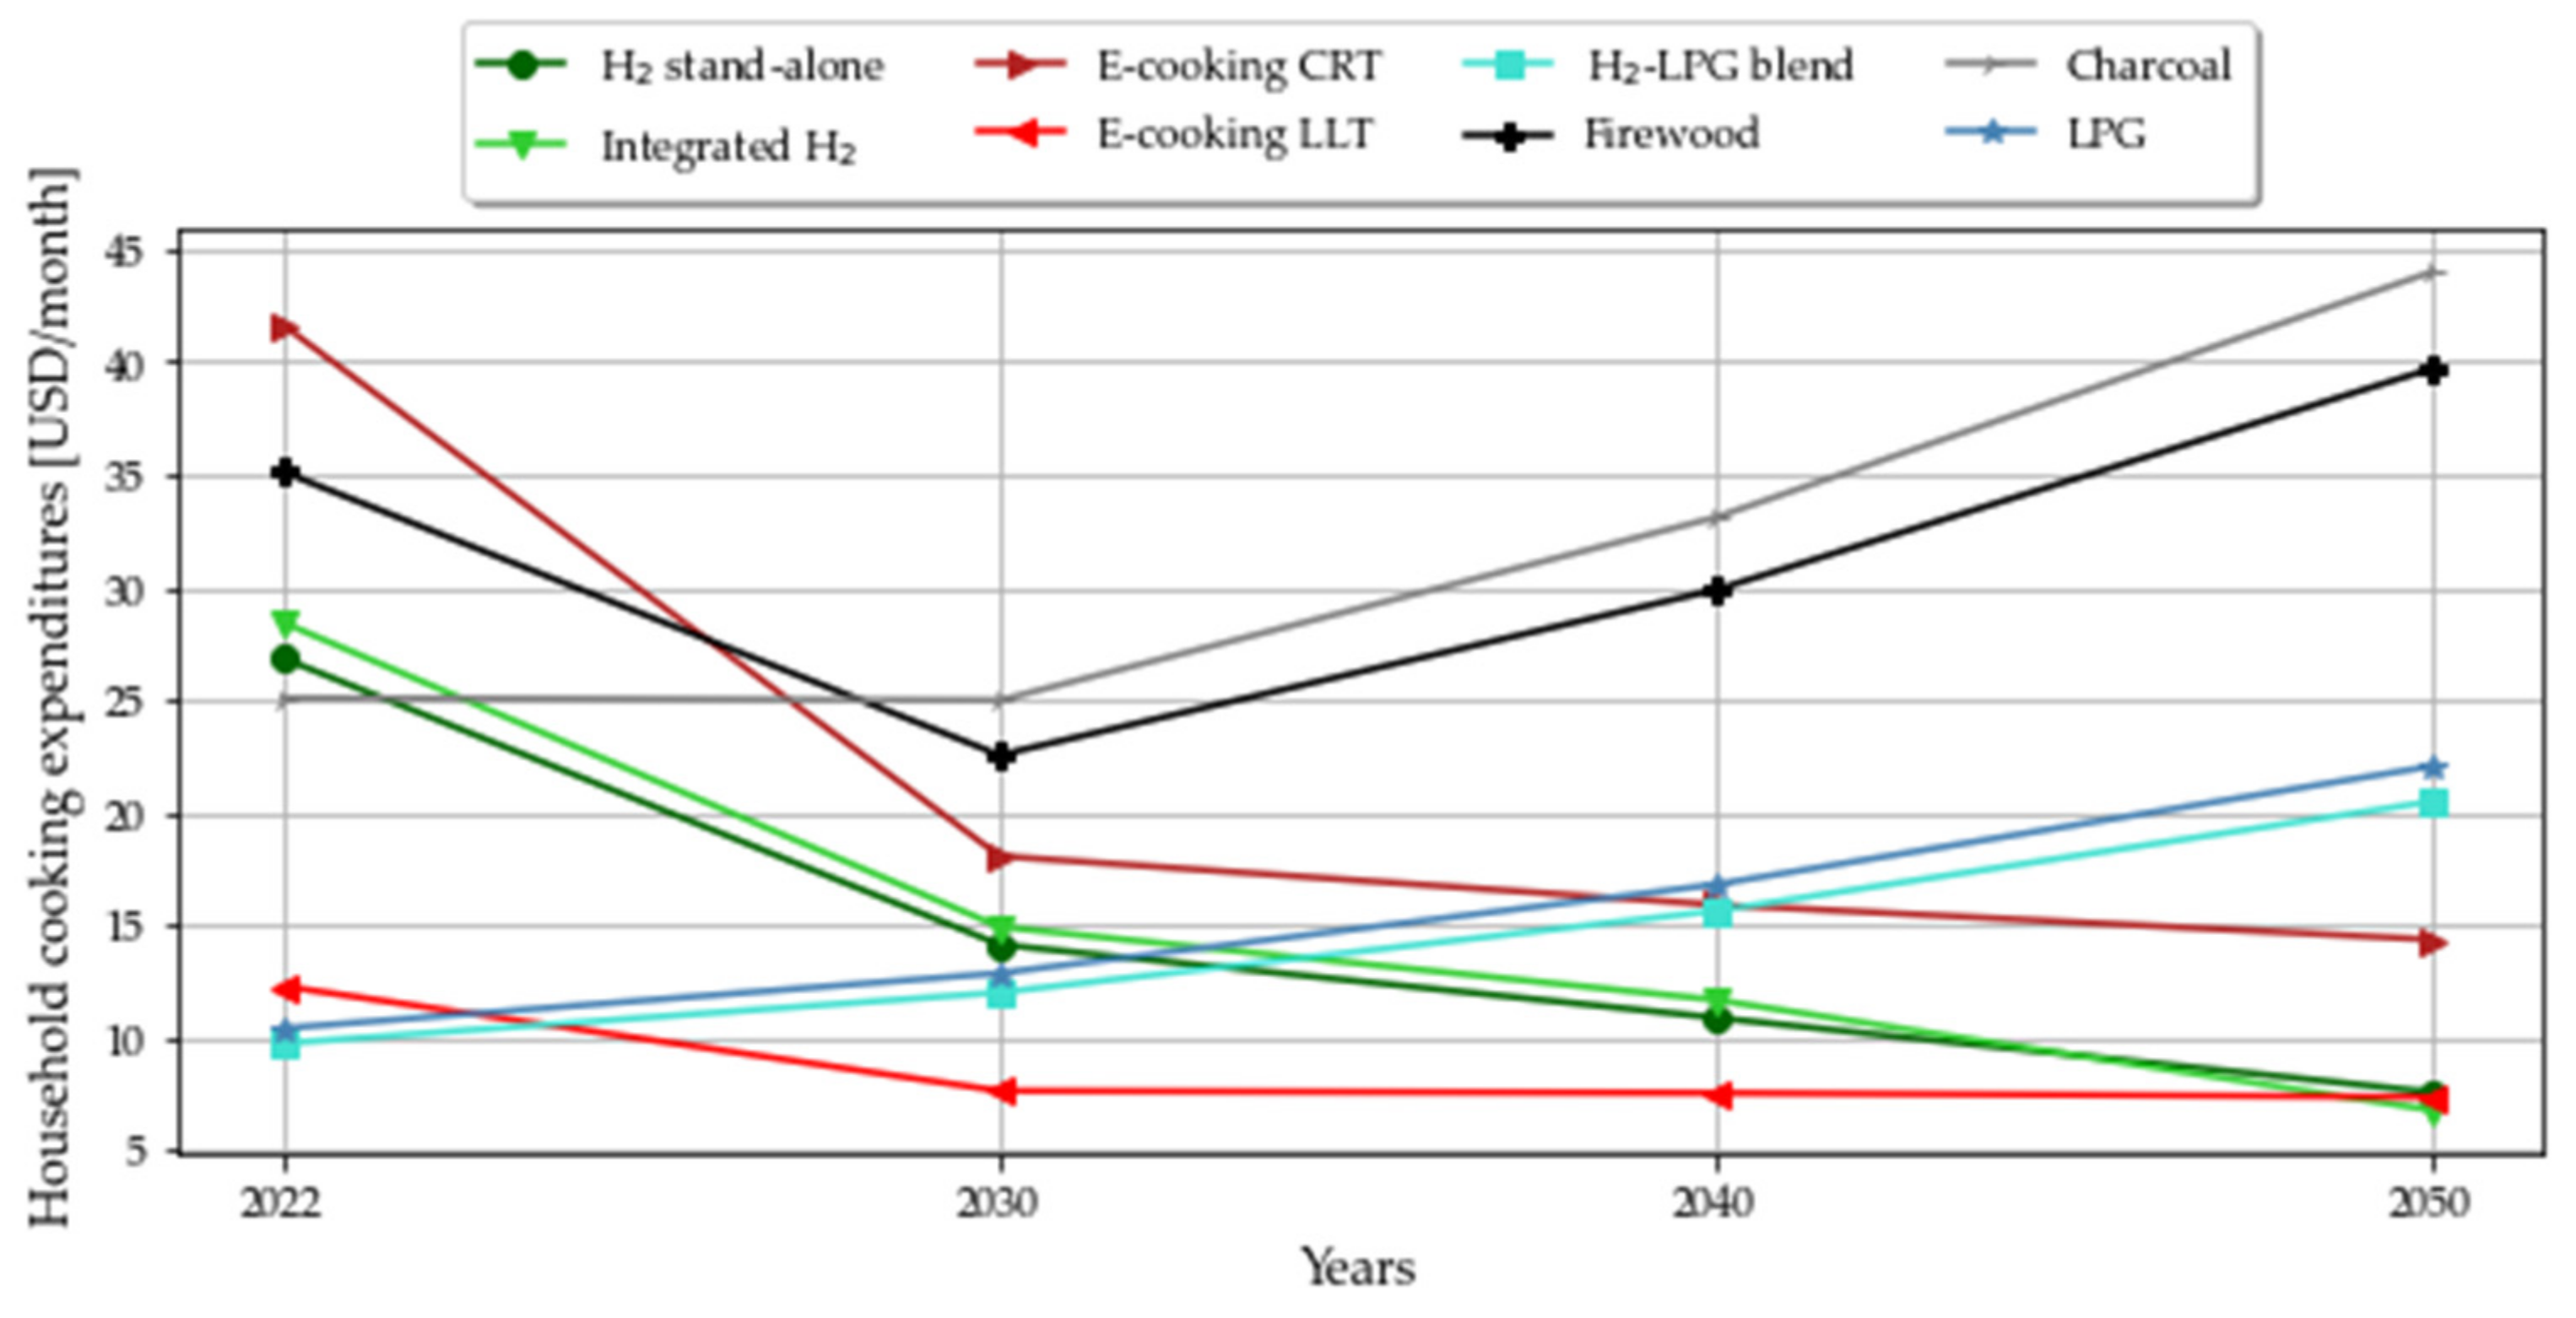
3.2. Economic Results for End Users

In this section, we analyze the potential monthly costs of cooking for the end user under present technical and future parameters and prices, as stated in Table 5. We compare the costs of the proposed hydrogen-based cooking systems with the use of traditional (fossil) fuels: firewood, charcoal, and LPG.
Figure 3 comprises the potential monthly costs of cooking per household, including fuel costs and monthly installments for the cookstove (see Economic Impact for End Users). Considering hydrogen-based cooking, utilizing hydrogen via combustion is the most expensive option for the end user under current techno-economic parameters when assuming a life-line tariff for electricity to be in place. Utilization of hydrogen produced in a stand-alone system or integrated in an electricity supply system would require monthly household expenditures of 26.8 USD and 28.4 USD, respectively. The costs of P2H2P-based e-cooking significantly varies with the electricity tariff applied. While under the average mini-grid tariff the costs of cooking would equal 41.6 USD per month and household, applying a lifeline tariff reduces the costs by 70% (12.3 USD). Using hydrogen–LPG blends (9.7 USD per month and household) currently poses the lowest costs for the end user when considering the electrolyzer to be fed with excess electricity of mini-grids granted for free (see Section 2.3.2).
Our analysis suggests the use of traditional firewood (35.1 USD per month and household) to be the most expensive traditional fuel-based cooking option. The monthly costs are driven by high fuel costs occurring from high fuel consumption at high prices. Spreading the high investment costs of relatively expensive LPG stoves over a financing period of three years results in monthly household costs of 10.4 USD—yet another indication that the uptake of LPG in Kenya can be economically advantageous against firewood and charcoal when introducing financing mechanisms to reduce one-time payments (see [9,77]).
A likely future decline in hydrogen production costs (see Section 3.1.2) may improve the financial viability of hydrogen-based cooking for the end user. The monthly household costs may decline by 72–76% by 2050 when assuming the utilization of hydrogen via combustion. Driven by the adoption of efficient DC EPCs, hydrogen technology and PV improvements, P2H2P-based e-cooking may become cost competitive even when assuming a cost-reflective mini-grid tariff. The costs of e-cooking under a cost reflective tariff may decrease from 41.6 USD per month per household to 14.3 USD. With this, e-cooking may pose lower costs for the end user than utilizing any fossil fuel by 2040, even when not benefitting from a lifeline tariff (see also Figure A5 for a detailed comparison of the household cooking costs evolution from 2030 until 2050). Blending hydrogen in LPG may face an opposite trend of increasing costs, as increasing LPG prices outpace decreasing costs of hydrogen production. More extreme, the costs of using firewood or charcoal may significantly increase in the long run, after expecting a temporary cost decline shortly driven by the decreased amount of fuel required when using more efficient ICS. However, expected increase in fossil fuel prices on the one hand and future hydrogen technology improvements on the other hand may lead to any hydrogen-based cooking pathway being cheaper for end users than charcoal and firewood by 2030 and LPG by 2040 respectively, see Figure A5.
We set the respective costs of cooking in relation to the total monthly energy costs per household in Figure 4. Today, the costs for utilizing hydrogen via combustion surpass the monthly household electricity costs by 40% and 440% when assuming an average mini-grid tariff or lifeline tariff for the electricity consumption, respectively. This relation decreases to accounting for approximately 70% and 160% by 2050, respectively, when maintaining the current lifeline tariff. The monthly financing costs of the hydrogen combustion stove are marginal, ca. 4% (1.39 USD per month and household) and ca. 7% (2.41 USD per month and household) of the total energy expenses under a lifeline tariff in 2022 when assuming a hydrogen-based Meko or single burner, respectively.
When assuming P2H2P-based e-cooking under a lifeline tariff (monthly cooking costs of 9.75 USD per household) and a combination of an AC EPC and electric hotplate (monthly financing costs of 2.51 USD per household), the overall cooking costs account for 71% of the total monthly energy expenditures—compared to a share of 87%, 83% and 67% when using firewood, charcoal, and LPG, respectively.

4. Discussion

This paper presents a techno-economic analysis of hydrogen-based cooking solutions with the rationale of providing clean cooking services to hard-to-reach isolated rural populations. The framework of our analysis is transferable and may be tailored to other rural settings in the African context. We demonstrate the assessment in a case study in rural Kenya, applying a bottom-up approach to design the specific energy systems delivering clean hydrogen-based cooking. As the two essential assumptions of the electricity demand profile and cooking demand patterns match with typical profiles reported in the previous literature (see [41] for electricity profiles, [30] for hydrogen cooking fuel demand, and [51] for e-cooking profiles), we expect the findings of the study, including sensitivity analysis, to be transferable to a wide spectrum of rural settings in East Africa with similar cooking preferences.
The results of our techno-economic analysis present the optimal technical system topology to facilitate hydrogen-based cooking, including hydrogen utilization via combustion and P2H2P-based e-cooking. Furthermore, the interpretation of the economic system results from both an energy system and an end-user perspective suggest that delivering clean cooking to rural households can economically benefit from utilizing hydrogen, compared to the use of traditional fuels. Expected near-future developments are likely to reinforce the benefit. Therefore, hydrogen may contribute to achieving the pressing goal of providing universal access to clean cooking stated in the UN SDG target 7.1, and beyond. As a consequential next and imperative step in assessing hydrogen as a potential energy carrier to contribute to clean cooking, the findings of our techno-economic analysis must be embedded in a holistic assessment of the comprehensive energy delivery model. Thereby, we must supplement the techno-economic findings with research from other essential dimensions and disciplines. Required research essentially includes, but is not limited to, assessing the enabling environment, the socio-cultural context, the market structure and dynamics, and financial availabilities [78,79] (note that the literature on holistic energy delivery models for cooking solutions proposes different aspects to include; see Ref. [80] for an overview). To close the gap of this study towards a holistic energy delivery model assessment, we use this section to propose starting points for further analyses in business models, financing models, environmental assessment, and sociocultural considerations, which must be evaluated in local contexts in further research.
Companies in the clean cooking sector need to adapt their business models to meet the currently prevailing demands. Historically, companies focused on the supply of the cooking fuel since the cooking appliances were cheap (compare Table 3). However, modern cookstoves including e-cooking appliances, LPG burner, and potentially hydrogen burner, require higher upfront investment costs. Today, cookstoves—even expensive LPG stoves—are most commonly purchased via cash-based one-time payments in Kenya (98%) [25]. However, high one-time payments pose a financial barrier to low-income households [77]. Introducing operational and financing schemes that reduce the burden of one-time payments can significantly improve the economic competitiveness of modern cookstoves compared to traditional stoves, and thereby, facilitate the uptake of cleaner fuels [77]. This hypothesis is supported by our results. Assuming a typical microfinancing scheme with a payback duration of three years, the monthly costs of financing a stove are marginal compared to the fuel costs. With this, we found the use of firewood—which is characterized by low stove costs, but high fuel costs—to be the most expensive traditional fuel option for end users today. Yet, firewood is still the dominant fuel used in rural Kenya (84% of rural households use firewood as primary or secondary fuel [25]). An evolving successful financing scheme to reduce initial payments for the end users is the Pay-as-You-Go (PAYGO) model. In PAYGO models, customers can purchase a certain amount of credit to use energy or unlock an energy asset for a limited duration (e.g., mobile phone charging for one day, lights for 10 h) [81]. In this way, end users can obtain incremental amounts of energy, and decide based on their current financial situation, without owning the energy asset. Historically applied in the electrification sector—thereby, first adopted by e-cooking services—the PAYGO model has more recently successfully been transferred to gaseous fuels, such as LPG [9]. In PAYGO LPG, the service provider supplies the user with branded LPG cylinders and a monitoring system, remotely controlling a valve. Consumers only pay for the valve and monitoring system as an upfront investment and can make pre-payments for the gas via mobile money. The valve only releases as much gas as is paid for before shutting down via the smart monitoring system. Thus, a user can decide on incrementally small purchase units of gas [9]. The concept has been reported as immensely successful, for example in urban Nairobi [9]. However, the penetration of rural areas with LPG remains a challenge due to the high effort in fuel transportation. Even though innovative LPG delivery services (e.g., through motorcycles or sister supply chains) have recently emerged [25], the effort for private companies to serve rural regions remains too high considering the expected low revenue in such areas [9]. Arguably, hydrogen produced decentralized may overcome this logistical challenge and support penetrating rural markets—reducing the barrier for cooking service providers.
Yet another challenge for cooking service providers offering innovative PAYGO or lease-to-own-models (that is, the user pays small installments over a defined period until owning the technology [81]) to reduce the initial investment barrier for the stove, is that the company itself must cover the CAPEX risk of the cookstove. This implies that the service provider itself needs sufficient capital resources to invest in the stove and potential further equipment of the end users. Therefore, the issue of financing has revitalized the clean cooking sector. Drawing an analogy to the typical S-curve which innovative businesses follow (that is, growth over time starting slowly (seed stage), picking up speed (early and late growth stage), and then tapering off as growth slows (mature stage)), the Modern Energy Cooking Services (MECS) program observed a change in the predominant funding structures of companies involved in the clean cooking sector—from only grants and equity to a variety of combinations of grants, equity, impact-based financing (i.e., results-based financing, see [82]), and more complex products (i.e., crowdfunding and peer-to-peer lending, see [83]). However, one fundamental financing instrument at the seed of a company (grant) in clean cooking services remains carbon credits. Here, certified agencies offer standards on voluntary carbon markets to mediate between two parties trading on carbon credit certificates on a bilateral basis. The exact price of a standardized ton of CO2-equivalents (CO2-eq.) amongst others is determined by the type of project, SDGs impacted, the location, and age volume traded [83]. Recently, prices for clean cooking projects have ranged between 6 USD–9 USD per ton CO2-eq. saved [83]. Depending on the amount of emissions saved, carbon credit financing may be a significant financial resource for project developers. To illustrate this, we estimate the potential monetization from carbon credit financing for the case study considered in our analysis. To simplify, we neglect fuel stacking, but assume an exclusive fuel to satisfy the entire cooking energy demand, respectively. Based on the CO2, CH4, and N2O emissions occurring during fuel combustion (see Table 7), we calculate the CO2-equivalents (CO2-eq.) using the 100-year global warming potential factors stated by [84].
In the most conservative case, households only use firewood as a cooking fuel. The use of firewood in Sub-Saharan countries often happens in an unsustainable manner [85]. Open biomass burning, including uncontrolled wildfire and biofuel use for household cooking and heating, are significant primary sources of brown carbon or light-absorbing organic carbon [86]. For our simplified approach and case study, the annual emissions from firewood use amount to 658.79 t CO2-eq.—equaling a potential monetarization from carbon financing of 3936–5904 USD/yr when substituting unsustainable firewood with clean hydrogen-based alternatives.
Table 7. Emissions occurring from the combustion of conventional cooking fuels. Factors for calculating the CO2-equivalents (100-year global warming potential factors are 25 and 298 for CH4 and N2O, respectively [84].
Cooking FuelFirewoodCharcoalLPG
CO2 [g/kg]1548 [87]2385 [87]2728 [84]
CH4 [g/kg]4.86 [87]5.29 [87]134.5 [84]
N2O 35.6 [84]0.24 [87]28.82 [84]
CO2-equivalents [g/kg]12,278258814,678 [84]
Total household annual emissions [kg CO2-eq./yr]15,68516531232
Annual village emissions [t CO2-eq./yr]658.7969.4551.75
As described, these funds may be allocated to financing end-user devices. Even in the most expensive stove configuration included in our analysis (50 USD per hydrogen stove and 25 USD per 0.5 kg hydrogen container), the lower estimate of funds available would be sufficient to finance the stoves and 1.5 cylinders per household to establish a circulation pool for cylinders (total costs of 3675 USD). However, our calculation must be reviewed after conducting sophisticated tests on the emissions occurring from hydrogen combustion. While no carbon emissions occur, it must be noted that the combustion of hydrogen might lead to the thermal formation of nitrogen oxides, which must be reduced by appropriate lean burn conditions and/or after-treatment [88]. Further, it must be noted that when mixing hydrogen with LPG, the emissions released during the combustion of the blend do not necessarily linearly follow the volumetric share of hydrogen of the blend, when maintaining a constant heat throughput. As hydrogen has a lower volumetric heating value than LPG, more LPG is required to achieve the same temperature rise of the meal during cooking. De Vries et al. empirically showed the correlation between CO2 reduction and the fraction of hydrogen blended into methane, when maintaining the same thermal throughput. At 20% of hydrogen, the CO2 reduction would be less than 10% [23]. Even when neglecting this non-proportional relationship—notably accepting a decreasing thermal throughput and user comfort—the hydrogen–LPG usage as proposed in our analysis would only save approximately 6 t CO2-eq. per year compared to the exclusive use of LPG. However, as the technical system results (see Section 3.1.1) show that only a little less than 10% of the excess electricity generated by the representative mini-grid was used to generate sufficient hydrogen to satisfy the village demand in a hydrogen–LPG blending scenario, one might argue that additional hydrogen could be produced when exploiting more excess electricity. Given that more consumers would be available in the surroundings, the environmental impact could be improved.
Essential to follow in future research are the sociocultural aspects associated with the use of hydrogen-based cooking services. Cooking is known to be a central community activity, thus extremely sensitive to the social context, norms, and traditions [89]. Previous work has shown that it is of crucial importance for alternative cooking systems to be easy to adopt and that they should not pose a disruption to the daily habits and cooking schedule of residents compared to their known fuel [36]. Thereby, arguably, hydrogen utilization via combustion may meet this prerequisite in households, which already use LPG. Further, hydrogen combustion may meet other ‘ease-of-use’ criteria reported in the literature (direct ignition, systematic heat regulation, systematic fuel use, allowance for partial fuel refill, non-smoking clear flame/heat, and fuel level detection)—essentially influencing the perception of users [25]. However, we are not aware of any evidence from the field reporting user experience of hydrogen cooking via combustion, and strongly suggest conducting field tests with potential end users. Useful starting points to investigate the factors of hydrogen acceptance during such studies may be found in previous research conducted in European countries, in which various scholars have investigated the acceptance of hydrogen substituting natural gas as a cooking fuel. Essentially, these studies suggest that at least safety, costs, usability, and environmental benefits play a crucial role in the perception of end users towards utilizing hydrogen as cooking fuel [90,91]. Other studies have assessed the perception of people utilizing hydrogen–natural gas blends at home in the United Kingdom, finding an overall positive perception on the effects of home appliance use, safety, and energy performance amongst others [92]. However, so far, relying on the great similarities of physical properties of hydrogen and LPG, we can only assume that hydrogen may find great acceptance when utilized via combustion in Kenya, as users of LPG are evidently highly satisfied [25].
In contrast, estimating the acceptance of P2H2P-based e-cooking in Kenya can already build on more experience. Customer experience from EPC end users was assessed in [93]. The overall reported satisfaction was high with increased time savings (31%) and efficiency gains, reduced expenses (35%), and improved quality of life (45%) reported as positive values experienced by survey respondents. However, as the market for EPCs is still new, the users stated trouble with finding EPC products on the market and the low quality of the available products. Further, a significant limitation of EPCs lies in their (perceived) inability to cook certain dishes. In a study reported by [93], only 9% of a trial group equipped with an EPC exclusively used an EPC. The majority relied on fuel stacking with LPG (74%) or charcoal (43%). The most prominent reason for this is that the users liked other fuels better to cook traditional food, such as ugali or chapati (59%) [93]. Similar results are reported in Tanzania [94]. This is critical, as ‘dirty fuel stacking’ takes place when a clean fuel is not suitable to fulfill the entire cooking energy demand. The Kenyan government, however, strongly promotes the enabling environment for e-cooking in Kenya with national awareness-raising campaigns, amongst others organized by the national electric power distribution company (Kenya Power and Lighting Power). Proactive campaigns, such as the ‘Pika na Power’ campaign, showcase the compatibility of e-cooking with Kenyan cuisine and address other concerns of the population [95]. An arguably critical contribution of hydrogen in e-cooking compared to batteries may be the long-term storability of hydrogen. This may facilitate end users to satisfy the entire cooking demand with a clean cooking appliance even when hosting guests at irregular events. Such social events may arguably be important for the user, and the performance of a cooking fuel during these may be important to shape the end user’s perception [36]. However, for any cooking solution we must remember that end-user acceptance (market acceptance) alone only partly contributes to the uptake of a cooking solution. The more complex interplay at the level of community acceptance, however, highly depends on contextual factors, such as location, heritage, and history of a specific community, and must, therefore, be considered on a case-by-case basis. The mode of refill of portable hydrogen containers will significantly depend on the preferences of the community. For our analysis, we assumed weekly refills of portable pressurized containers of hydrogen to be circulated to the households for providing clean cooking fuel. While we assumed 0.5 kg of hydrogen to be portable at reasonable pressure levels and volumes every eight days, we must note that this is a rough estimation influencing our results. Both the (socially) acceptable pressure levels (note that safety concerns can be assumed for hydrogen cooking amongst the population), and the design of the pressurized tank itself are not yet defined. However, for our hourly resolution model, our assumption implies that every household demands 22 kWh of hydrogen approximately every eight days to be discharged from a cascade storage. Thus, the assumption of the transporting medium influences the hydrogen demand series, and thereby influences the system design and costs. For example, when assuming only quarterly refills of approximately 235 kWh, a much larger cascade storage and additional electrolyzer capacities would be required, leading to 25% increased TAC in the example case of a stand-alone hydrogen production for combustion. Consequently (and obviously), following the real-time hydrogen production via electrolysis closely to refill the portable containers can reduce the required size of a cascade storage and system costs. This may be induced via building on a pool of portable containers and introducing circular models. However, to optimize the intersection of the user and the hydrogen delivery, it requires a detailed analysis of (i) available portable hydrogen storage technologies, (ii) the flexibility of users in their charging behavior, and (iii) business models and operation of the energy system operator, including cylinder recirculation models.

5. Conclusions

Our work evaluates hydrogen-based cooking solutions in a rural Kenyan village based on technical and economic measures. The different cooking energy supply systems considered include (i) the stand-alone production of hydrogen by PV electricity and hydrogen utilization via combustion, (ii) hydrogen production integrated into a PV-battery–FC electricity supply system with hydrogen utilization via combustion, (iii) P2H2P to serve e-cooking appliances, and (iv) the use of excess electricity generated by a PV-battery mini-grid to generate small amounts of hydrogen to be blended into LPG. The paper develops linear-problem-based energy system models of the respective energy systems and investigates the effects of varying technical and economic parameters on the technical and economic measures. We compare the potential resulting costs of cooking for end users of each hydrogen-based cooking solution with the cooking costs when using traditional fuels of firewood, charcoal, and LPG.
The results of the techno-economic analysis suggest that providing clean cooking in rural areas could economically and environmentally benefit from utilizing hydrogen. Under current techno-economic parameters in Kenya, the energy system costs for integrating hydrogen production into the electricity supply system to use hydrogen via combustion approximately equal the system costs for P2H2P-based e-cooking. However, introducing energy-efficient DC EPCs, thus reducing the energy demand for cooking, may lead to cost-advantageous P2H2P-based e-cooking systems by 2030. When following the approach of producing gaseous hydrogen and using it in households via direct combustion, the integration of the hydrogen production and storage into the electricity supply system decreases the overall system costs compared to a stand-alone separated hydrogen production and electricity supply and improves economic efficiency. However, envisaged technology developments, including efficiency increases of the EL and FC, and cost decline of the EL, FC, and PV as expected by 2050 are required for the integrated production pathway to yield in lower energy system costs compared to P2H2P-based e-cooking. Further, cost minimization is likely when optimizing the intersection between user and energy system, including (i) portable hydrogen storage technology, (ii) user preferences in storage design and refill frequency, and (iii) business and operation of the hydrogen refill system.
During the evaluation of potential monthly costs of cooking from an end-user perspective, our analysis assumes a micro-financing scheme to reduce the costs of the cookstoves to a marginal share of a household’s total energy expenditures. However, currently, only blending small amounts (20% based on volume) of hydrogen produced by excess electricity from renewable mini-grids—considered as granted for free—into LPG is cost-competitive compared to the cheapest fossil fuel option (LPG) for end users. The household costs for cooking with P2H2P-based e-cooking significantly depend on the applicable electricity tariff. While under a lifeline tariff the monthly household costs of P2H2P-based e-cooking are comparable to the use of LPG, applying a cost-reflective mini-grid tariff results in quadrupled costs. Utilizing gaseous hydrogen delivered in portable containers via combustion is not economically competitive today but will benefit from expected technology improvements the most. The likely future technology improvements and the expected increase in fossil fuel prices will lead to any hydrogen-based cooking pathway being cheaper for end users than charcoal and firewood by 2030, and LPG by 2040, respectively.
The fundamental results of this very first evaluation of different hydrogen-based cooking solutions must imperatively be embedded in the development of a holistic cooking delivery model, including market chains, enabling environment, financing mechanisms, regulatory assessment, and many other crucial aspects. As cooking is known to be a crucial socio-cultural activity at the center of a community, the conceptualization of suitable delivery models is highly driven by the local context. Thus, we must highlight the importance of the necessary next step—conducting case studies in the field—in order to widen the understanding of the potential hydrogen-based cooking solutions.

Author Contributions

Conceptualization, N.S. and R.D.; methodology, N.S. and R.D.; software, N.S.; validation, N.S. and R.D.; formal analysis, N.S.; investigation, N.S. and R.D.; data curation, N.S.; writing—original draft preparation, N.S.; writing—review and editing, N.S., R.D. and B.H.; visualization, N.S.; supervision, B.H.; project administration, B.H.; funding acquisition, B.H. All authors have read and agreed to the published version of the manuscript.

Funding

This research was funded by the Horizon 2020 research program under the grant agreement No. 101037428 (ENERGICA). The outcomes will feed into full reports submitted to the European Commission and available on www.energica-h2020.eu.

Data Availability Statement

Not applicable.

Acknowledgments

We express our gratitude to Lukas Otte and Tim Ronan Britton for iterative discussions, and Tapan Kumar for support in data acquisition and literature review. We acknowledge support by the German Research Foundation and the Open Access Publication Fund of TU Berlin.

Conflicts of Interest

The authors declare no conflict of interest.

Nomenclature

ACAlternating current
AELAlkaline electrolysis
CAPEXCapital expenditure
DCDirect current
DGDiesel generator
ELElectrolysis
EPRAEnergy and Petroleum Regulatory Authority
ESMAPEnergy Sector Management Assistance Program
FCFuel cell
H2Hydrogen
IRENAInternational Renewable Energy Agency
LCOCookingLevelized costs of cooking energy
LCOELevelized costs of electricity
LEAPLong term Europe Africa Partnership
MECSModern Energy Cooking Services
OPEXOperational expenditure
PVPhotovoltaic
PEMFCPolymer membrane exchange fuel cell
P2H2PPower-to-hydrogen-to-power
SOELSolid oxide electrolysis
SOFCSolid oxide fuel cell
WACCWeighted average costs of capital
WHOWorld Health Organization

Appendix A

Figure A1. Average daily load profiles of (a) household load, (b) business load, (c) school load, (d) institutional load, (e) dispensary load, (f) aggregated load profile, and (g) single household e-cooking profile.
Energies 16 03242 g0a1
Figure A2. Example of applying the random day-to-day and time-step-to-time-step variability to the load profile of a household consumer.
Energies 16 03242 g0a2
Figure A3. Sensitivity analysis for the respective optimal energy systems (see Section 3.1.1). The values are set in relation to the reference parameters assumed in 2022. (a) Stand-alone hydrogen production and utilization via combustion, (b) stand-alone electricity supply, (c) integrated hydrogen production and utilization via combustion and electricity supply, (d) P2H2P-based e-cooking, (e) hydrogen–LPG blending system. The exponential dependency of systems on the EL and FC efficiency occurs because changing the efficiency impacts both the required system size, and therefore, investment costs, as well as the required primary electricity supply, affecting the required PV investment.
Energies 16 03242 g0a3aEnergies 16 03242 g0a3b
Figure A4. Share of TAC of the energy system assets for the respective optimal energy systems of (a) stand-alone hydrogen production and utilization via combustion, and (b) integrated hydrogen production and utilization via combustion and electricity supply.
Energies 16 03242 g0a4
Figure A5. Household cooking expenditure evolution from 2030 to 2050.
Energies 16 03242 g0a5

Appendix B

We define the total annualized system costs (TAC), the levelized costs of system (LCOS), levelized costs of electricity (LCOE) and levelized costs of cooking (LCOCooking) as system measures.
1.
Levelized costs of system (LCOS): average costs per kWh of useful energy produced by the system to serve energy as
L C O S =   T A C E n e r g y s e r v e d
The terminus E n e r g y s e r v e d includes only electricity in the case of electric cooking, but electricity to serve the electric loads and hydrogen energy in case of hydrogen cooking.
2.
Levelized Costs of Electricity (LCOE): we define the levelized costs of electricity (LCOE) as the average cost per kWh of useful electricity energy produced by the system to serve electric loads. Thereby, we divide the annualized costs of producing electricity (notably excluding any cost associated with the potential cooking system loads) by the total electric load served.
L C O E =   T A C c C o o k i n g   L o a d E C o o k i n g   L o a d E l s e r v e d
With c C o o k i n g   L o a d [USD/yr] as marginal costs of the system components required to serve the amount of energy for the cooking load, and E C o o k i n g   L o a d [kWh/yr], and E l s e r v e d as total electric power served to electric loads [kWh/yr]. Analogous, we calculate the levelized costs of the cooking service as
L C O C o o k i n g =   T A C c e l e c t i c i t y   s y s t e m E l s e r v e d E C o o k i n g
With c e l e c t i c i t y   s y s t e m [USD/yr] as marginal costs of the system components required to serve the electricity loads E l s e r v e d , and E C o o k i n g as the required energy delivered to satisfy the thermal cooking load.
We must further detail the methodology applied to calculate the marginal costs of the cooking fuel production sub-system c C o o k i n g   L o a d and electricity supply sub-system c e l e c t i c i t y   s y s t e m , respectively (analogous for L C O C o o k i n g and L C O E ). In our analysis, we apply an objective technical perspective, considering the share of costs of installation and use of the total system from the bottom up. We, therefore, calculate the fraction of asset costs, e.g., PV investment costs, that are required to feed the cooking fuel production or electricity supply sub-systems, respectively, by relying on the share of PV electricity flows through each sub-system. For example, to calculate the costs of PV required to satisfy cooking loads T A C   P V C o o k i n g S y s t e m , we divide the energy flows passing via the electrolyzer to satisfy cooking loads E P V , e l e c t r o l y z e r , and the fraction passing the inverter, and multiply with the total costs of the PV system to be.
T A C   P V C o o k i n g S y s t e m =   E P V ,       e l e c t r o l y z e r E P V ,   i n v e r t e r +   E P V ,       e l e c t r o l y z e r T A C P V

References

  1. United Nations. Sustainable Development Goals Knowledge Platform. Available online: https://sustainabledevelopment.un.org (accessed on 11 July 2022).
  2. Kurmi, O.P.; Semple, S.; Simkhada, P.; Smith, W.C.S.; Ayres, J.G. COPD and Chronic Bronchitis Risk of Indoor Air Pollution from Solid Fuel: A Systematic Review and Meta-Analysis. Thorax 2010, 65, 221–228. [Google Scholar] [CrossRef] [PubMed] [Green Version]
  3. Yu, K.; Qiu, G.; Chan, K.-H.; Lam, K.-B.H.; Kurmi, O.P.; Bennett, D.A.; Yu, C.; Pan, A.; Lv, J.; Guo, Y.; et al. Association of Solid Fuel Use With Risk of Cardiovascular and All-Cause Mortality in Rural China. JAMA 2018, 319, 1351–1361. [Google Scholar] [CrossRef] [PubMed]
  4. James, B.S.; Shetty, R.S.; Kamath, A.; Shetty, A. Household cooking fuel use and its health effects among rural women in southern India-A cross-sectional study. PLoS ONE 2020, 27, e0231757. [Google Scholar] [CrossRef] [PubMed]
  5. Bond, T.C.; Doherty, S.J.; Fahey, D.W.; Forster, P.M.; Berntsen, T.; DeAngelo, B.J.; Flanner, M.G.; Ghan, S.; Kärcher, B.; Koch, D.; et al. Bounding the Role of Black Carbon in the Climate System: A Scientific Assessment: Black Carbon in the Climate System. J. Geophys. Res. Atmos. 2013, 118, 5380–5552. [Google Scholar] [CrossRef]
  6. Grieshop, A.P.; Marshall, J.D.; Kandlikar, M. Health and Climate Benefits of Cookstove Replacement Options. Energy Policy 2011, 39, 7530–7542. [Google Scholar] [CrossRef]
  7. IEA—International Energy Agency. World Energy Outlook 2018; IEA: Washington, DC, USA, 2019; p. 661. [Google Scholar]
  8. IEA; IRENA; UNSD; WB; WHO. Tracking SDG7: The Energy Progress Report 2022; IEA: Washington, DC, USA, 2022. [Google Scholar]
  9. Shupler, M.; O’Keefe, M.; Puzzolo, E.; Nix, E.; de Cuevas, R.A.; Mwitari, J.; Gohole, A.; Sang, E.; Čukić, I.; Menya, D.; et al. Pay-as-You-Go Liquefied Petroleum Gas Supports Sustainable Clean Cooking in Kenyan Informal Urban Settlement during COVID-19 Lockdown. Appl. Energy 2021, 292, 116769. [Google Scholar] [CrossRef]
  10. Schöne, N.; Heinz, B. Semi-Systematic Literature Review on the Contribution of Hydrogen to Universal Access to Energy in the Rationale of Sustainable Development Goal Target 7.1. Energies 2023, 16, 1658. [Google Scholar] [CrossRef]
  11. Maestre, V.M.; Ortiz, A.; Ortiz, I. Challenges and Prospects of Renewable Hydrogen-Based Strategies for Full Decarbonization of Stationary Power Applications. Renew. Sustain. Energy Rev. 2021, 152, 111628. [Google Scholar] [CrossRef]
  12. Das, H.S.; Tan, C.W.; Yatim, A.H.M.; Lau, K.Y. Feasibility Analysis of Hybrid Photovoltaic/Battery/Fuel Cell Energy System for an Indigenous Residence in East Malaysia. Renew. Sust. Energ. Rev. 2017, 76, 1332–1347. [Google Scholar] [CrossRef]
  13. Jahangiri, M.; Haghani, A.; Shamsabadi, A.A.; Mostafaeipour, A.; Pomares, L.M. Feasibility Study on the Provision of Electricity and Hydrogen for Domestic Purposes in the South of Iran Using Grid-Connected Renewable Energy Plants. Energy Strategy Rev. 2019, 23, 23–32. [Google Scholar] [CrossRef]
  14. Brenna, M.; Foiadelli, F.; Longo, M.; Abegaz, T.D. Integration and Optimization of Renewables and Storages for Rural Electrification. Sustainibility 2016, 8, 982. [Google Scholar] [CrossRef] [Green Version]
  15. Schöne, N.; Khairallah, J.; Heinz, B. Model-Based Techno-Economic Evaluation of Power-to-Hydrogen-to-Power for the Electrification of Isolated African off-Grid Communities. Energy Sustain. Dev. 2022, 70, 592–608. [Google Scholar] [CrossRef]
  16. ESMAP; SE4All. Beyond Connections: Energy Access Redefined; World Bank: Washington, DC, USA, 2016. [Google Scholar]
  17. Efficiency for Access Coalition. Solar Appliance Technology Brief: Electric Pressure Cookers. Available online: https://storage.googleapis.com/e4a-website-assets/EforA_Solar_Appliance_Technology_Brief_EPCs_July-2021.pdf (accessed on 24 January 2023).
  18. Luta, D.N.; Raji, A.K. Decision-Making between a Grid Extension and a Rural Renewable off-Grid System with Hydrogen Generation. Int. J. Hydrogen Energy 2018, 43, 9535–9548. [Google Scholar] [CrossRef]
  19. Hailu Kebede, M.; Bekele Beyene, G. Feasibility Study of PV-Wind-Fuel Cell Hybrid Power System for Electrification of a Rural Village in Ethiopia. J. Electr. Comput. Eng. 2018, 2018, 4015354. [Google Scholar] [CrossRef]
  20. Leary, J.; Scott, N.; Sago, S.; Minja, A.; Batchelor, S.; Chepkurui, K.; Sawe, E. eCook Tanzania Cooking Diaries—October 2019 Working Paper; EAM, Loughborough University, University of Surrey & Gamos Ltd. supported by Innovate UK, UK Aid (DfID) & Gamos Ltd. 2019. Available online: https://mecs.org.uk/wp-content/uploads/2020/12/eCook-Tanzania-Cooking-Diaries-Working-Paper-13-10-19-JL-COMPRESSED.pdf (accessed on 12 December 2022).
  21. Singh, V.K.; Chauhan, N.S. Fundamentals and Use of Hydrogen as a Fuel. J. Mech. Eng. 2015, 6, 63–68. [Google Scholar]
  22. Kobayashi, H.; Hayakawa, A.; Somarathne, K.; Okafor, E.C. Science and Technology of Ammonia Combustion. Proc. Combust. Inst. 2019, 37, 109–133. [Google Scholar] [CrossRef]
  23. de Vries, H.; Mokhov, A.; Levinsky, H. The Impact of Natural Gas/Hydrogen Mixtures on the Performance of End-Use Equipment: Interchangeability Analysis for Domestic Appliances. Appl. Energy 2017, 208, 1007–1019. [Google Scholar] [CrossRef]
  24. The Engineering ToolBox. Fuels—Higher and Lower Calorific Values. Available online: https://www.engineeringtoolbox.com/fuels-higher-calorific-values-d_169.html (accessed on 23 January 2023).
  25. Ministry of Energy Kenya. Kenya Cooking Sector Study Compressed; Ministry of Energy Kenya: Nairobi, Kenya, 2019. [Google Scholar]
  26. Young, D.; Mill, G.; Wall, R. Feasibility of Renewable Energy Storage Using Hydrogen in Remote Communities in Bhutan. Int. J. Hydrogen Energy 2007, 32, 997–1009. [Google Scholar] [CrossRef]
  27. WLPGA; GLPGP. Sustainable Development Goals: Contributions of LPG; WLPGA: Neuilly-sur-Seine, France, 2019. [Google Scholar]
  28. Puzzolo, E.; Cloke, J.; Evans, A.; Pope, D. National Scaling Up of LPG to Achieve SDG 7: Implications for Policy, Implementation, Public Health and Environment; MECS. 2020. Available online: https://mecs.org.uk/wp-content/uploads/2020/02/MECS-LPG-Briefing-Paper_Jan-2020.pdf (accessed on 12 December 2022).
  29. Topriska, E.; Kolokotroni, M.; Dehouche, Z.; Wilson, E. Solar Hydrogen System for Cooking Applications: Experimental and Numerical Study. Renew. Energy 2015, 83, 717–728. [Google Scholar] [CrossRef] [Green Version]
  30. Topriska, E. Experimental and Computational Study of a Solar Powered Hydrogen Production System for Domestic Cooking Applications in Developing Economies. Ph.D. Thesis, Brunel University London, Uxbridge, UK, 2016. [Google Scholar]
  31. University of Technology, Jamaica. Sustainable Hydrogen Cooking Gas. Available online: https://www.utech.edu.jm/cseii/event-3.html (accessed on 25 November 2022).
  32. Jamaica Information Service. Utech Launches Project to Develop Hydrogen Gas for Cooking. Available online: https://jis.gov.jm/utech-launches-project-to-develop-hydrogen-gas-for-cooking/ (accessed on 25 November 2022).
  33. Schmidt Rivera, X.C.; Topriska, E.; Kolokotroni, M.; Azapagic, A. Environmental Sustainability of Renewable Hydrogen in Comparison with Conventional Cooking Fuels. J. Clean. Prod. 2018, 196, 863–879. [Google Scholar] [CrossRef]
  34. Topolski, K.; Reznicek, E.; Erdener, B.; San Marchi, C.; Ronevich, J.; Fring, L.; Simmons, K.; Fernandez, O.; Gidge, B.-M.; Chung, M. Hydrogen Blending into Natural Gas Pipeline Infrastructure: Review of the State of Technology; NREL: Golden, CO, USA, 2022. Available online: https://www.nrel.gov/docs/fy23osti/81704.pdf2022 (accessed on 30 January 2023).
  35. Makaryan, I.A.; Sedov, I.V.; Salgansky, E.A.; Arutyunov, A.V.; Arutyunov, V.S. A Comprehensive Review on the Prospects of Using Hydrogen–Methane Blends: Challenges and Opportunities. Energies 2022, 15, 2265. [Google Scholar] [CrossRef]
  36. Foell, W.; Pachauri, S.; Spreng, D.; Zerriffi, H. Household Cooking Fuels and Technologies in Developing Economies. Energy Policy 2011, 39, 7487–7496. [Google Scholar] [CrossRef]
  37. Buttler, A.; Spliethoff, H. Current Status of Water Electrolysis for Energy Storage, Grid Balancing and Sector Coupling via Power-to-Gas and Power-to-Liquids: A Review. Renew. Sust. Energ. Rev. 2018, 82, 2440–2454. [Google Scholar] [CrossRef]
  38. Akinyele, D.; Olabode, E.; Amole, A. Review of Fuel Cell Technologies and Applications for Sustainable Microgrid Systems. Inventions 2020, 5, 42. [Google Scholar] [CrossRef]
  39. Carbon Africa Limited. Kenya Market Assessment for Off-Grid Electrification; Carbon Africa Limited: Nairobi, Kenya, 2014. [Google Scholar]
  40. Moner-Girona, M.; Bódis, K.; Morrissey, J.; Kougias, I.; Hankins, M.; Huld, T.; Szabó, S. Decentralized Rural Electrification in Kenya: Speeding up Universal Energy Access. Energy Sustain. Dev. 2019, 52, 128–146. [Google Scholar] [CrossRef]
  41. Lorenzoni, L.; Cherubini, P.; Fioriti, D.; Poli, D.; Micangeli, A.; Giglioli, R. Classification and Modeling of Load Profiles of Isolated Mini-Grids in Developing Countries: A Data-Driven Approach. Energy Sustain. Dev. 2020, 59, 208–225. [Google Scholar] [CrossRef]
  42. Pfenninger, S.; Staffell, I. Long-Term Patterns of European PV Output Using 30 Years of Validated Hourly Reanalysis and Satellite Data. Energy 2016, 114, 1251–1265. [Google Scholar] [CrossRef] [Green Version]
  43. Renewables. Ninja. Simulations of the Hourly Power Output from Wind and Solar Power Plants. Available online: https://www.renewables.ninja (accessed on 11 July 2022).
  44. Jacobson, M.Z.; Jadhav, V. World Estimates of PV Optimal Tilt Angles and Ratios of Sunlight Incident upon Tilted and Tracked PV Panels Relative to Horizontal Panels. Sol. Energy 2018, 169, 55–66. [Google Scholar] [CrossRef]
  45. Scott, N.; Coley, W. Understanding Load Profiles of Mini-Grid Customers in Tanzania. Energies 2021, 14, 4207. [Google Scholar] [CrossRef]
  46. Blechinger, P.; Cader, C.; Bertheau, P. Least-Cost Electrification Modeling and Planning—A Case Study for Five Nigerian Federal States. Proc. IEEE 2019, 107, 1923–1940. [Google Scholar] [CrossRef]
  47. HOMER Energy. Generating Synthetic Load Data, HOMER Pro. Available online: https://www.homerenergy.com/products/grid/docs/1.4/generating_synthetic_load_data.html (accessed on 11 July 2022).
  48. Hartvigsson, E.; Ahlgren, E. Comparison of Load Profiles in a Mini-Grid: Assessment of Performance Metrics Using Measured and Interview-Based Data. Energy Sustain. Dev. 2018, 43, 186–195. [Google Scholar] [CrossRef]
  49. ESMAP. Cooking with Electricity: A Cost Perspective; World Bank: Washington, DC, USA, 2020. [Google Scholar]
  50. Lindgren, S.A. Clean Cooking for All? A Critical Review of Behavior, Stakeholder Engagement, and Adoption for the Global Diffusion of Improved Cookstoves. Energy Res. Soc. Sci. 2020, 68, 101539. [Google Scholar] [CrossRef]
  51. Leach, M.; Mullen, C.; Lee, J.; Soltowski, B.; Wade, N.; Galloway, S.; Coley, W.; Keddar, S.; Scott, N.; Batchelor, S. Modelling the Costs and Benefits of Moving to Modern Energy Cooking Services—Methods & Application to Three Case Studies; Modern Energy Cooking Services 2021. Available online: https://mecs.org.uk/wp-content/uploads/2021/05/Modelling-the-costs-and-benefits-of-moving-to-Modern-Energy-Cooking-Services-–-methods-application-to-three-case-studies.pdf (accessed on 12 December 2022).
  52. Couture, T.; Jacobs, D. Beyond Fire; E3 Analytics, International Energy Transition GmbH: Berlin, Germany, 2019; p. 83. [Google Scholar]
  53. Total Energies. Total Energies Gas Prices Cylinders & Accessories. Available online: https://totalenergies.ke/products/totalenergies-gas/totalenergies-gas-prices-cylinders-accessories (accessed on 28 March 2023).
  54. Ambition to Action. The Kenyan Cooking Sector Opportunities for Climate Action and Sustainable Development; New Climate Institute: Berlin, Germany, 2021. [Google Scholar]
  55. Jäger-Waldau, A. PV-Status Report 2019; Joint Reseearch Centre: Luxembourg, 2019. [Google Scholar]
  56. Moner-Girona, M.; Solano-Peralta, M.; Lazopoulou, M.; Ackom, E.K.; Vallve, X.; Szabó, S. Electrification of Sub-Saharan Africa through PV/Hybrid Mini-Grids: Reducing the Gap between Current Business Models and on-Site Experience. Renew. Sust. Energ. Rev. 2018, 91, 1148–1161. [Google Scholar] [CrossRef]
  57. ESMAP. Mini Grids for Half a Billion People: Market Outlook and Handbook for Decision Makers; World Bank: Washington, DC, USA, 2019. [Google Scholar]
  58. Se4all. State of the Global Mini-Grids Market Report 2020; Se4all: Washington, DC, USA, 2020. [Google Scholar]
  59. Ghandi, O.; Srinivasan, D. Sustainable Energy Solutions for Remote Areas in the Tropics (Green Energy and Technology; Springer: Berlin/Heidelberg, Germany, 2020; ISBN 978-3-030-41951-6. [Google Scholar]
  60. Sen, R. A Detailed Manual on Lead Acid Battery Operation and Maintenance for Solar PV Plants; USAID: Washington, DC, USA, 2018. [Google Scholar]
  61. Spataru, C.; Bouffaron, P. Chapter 22—Off-Grid Energy Storage. In Storing Energy; Letcher, T., Ed.; Springer: Berlin/Heidelberg, Germany, 2016. [Google Scholar]
  62. Agenbroad, J.; Carlin, K.; Ernst, K.; Doig, S. Minigrids in the Money: Six Ways to Reduce Minigrid Costs by 60% for Rural Electrification; Rocky Mountain Institute: Basalt, CO, USA, 2018. [Google Scholar]
  63. Louie, H. Off-Grid Renewable Energy Systems in Developing Countries; Springer: Berlin/Heidelberg, Germany, 2018. [Google Scholar]
  64. Reber, T.; Booth, S.; Cutler, D.; Li, X.; Salasovich, J. Tariff Considerations for Micro-Grids in Sub-Saharan Africa; NREL USAID Power Africa: Bryanston, South Africa, 2018; p. 30. [Google Scholar]
  65. Hilpert, S.; Kaldemeyera, C.; Krien, U.; Günther, S.; Wingenbach, C.; Plessmann, G. The Open Energy Modelling Framework (Oemof)—A New Approach to Facilitate Open Science in Energy System Modelling. Energy Strategy Rev. 2018, 22, 16–25. [Google Scholar] [CrossRef] [Green Version]
  66. Krien, U.; Schönfeldt, P.; Launer, J.; Hilpert, S.; Kaldemeyer, C.; Pleßmann, G. Oemof.Solph—A Model Generator for Linear and Mixed-Integer Linear Optimisation Ofenergy Systems. Softw. Impacts 2020, 6, 100028. [Google Scholar] [CrossRef]
  67. Benderes, S.; Bertheau, P.; Blechinger, P. Sizing and Optimization of Hybrid Mini-Grids with MicrOgridS—An Open-Source Modelling Tool. In Proceedings of the 3rd International Hybrid Power Systems Workshop, Tenerife, Spain, 8–9 May 2018. [Google Scholar]
  68. IRENA. Renewable Power Generation Costs in 2019, Technical Report; IRENA: Abu Dhabi, United Arab Emirates, 2020. [Google Scholar]
  69. Kibet, H. Association for Microfinance Institutions—AMFI Kenya Sector Report; AMFI: Mumbai, India, 2021. [Google Scholar]
  70. Stima. Electricity Cost in Kenya. Available online: https://www.stimatracker.com (accessed on 30 January 2023).
  71. The World Bank; ESMAP. Mini Grids in Kenya: A Case Study of a Market at a Turning Point; World Bank: Washington, DC, USA, 2017. [Google Scholar]
  72. Meister Consultants Group, Inc. Exploring Africa’s Mini-Grid Tariff Methodologies; U.S. AID: Washington, DC, USA, 2020. [Google Scholar]
  73. IRENA. Future of Solar PV; IRENA: Abu Dhabi, United Arab Emirates, 2019. [Google Scholar]
  74. IRENA. Green Hydrogen Cost Reduction—Scaling up Electrolysers to Meet the 1.5 °C Climate Goal; IRENA: Abu Dhabi, United Arab Emirates, 2020. [Google Scholar]
  75. Louie, H.; Dauenhauer, P. Effects of Load Estimation Error on Small-Scale off-Grid Photovoltaic System Design, Cost and Reliability. Energy Sustain. Dev. 2016, 34, 30–43. [Google Scholar] [CrossRef] [Green Version]
  76. Smolinka, T.; Günther, M.; Garche, J. Stand Und Entwicklungspotenzial Der Wasserelektrolyse Zur Herstellung von Wasserstoff Aus Regenerativen Energien; Fraunhofer ISE, FCBAT: Breisgau, Germany, 2011. [Google Scholar]
  77. Hsu, E.; Forougi, N.; Gan, M.; Muchiri, E.; Pope, D.; Puzzolo, E. Microfinance for Clean Cooking: What Lessons Can Be Learned for Scaling up LPG Adoption in Kenya through Managed Loans? Energy Policy 2021, 154, 112263. [Google Scholar] [CrossRef]
  78. Little, M.; Blanchard, R. Pre-Feasibility Methodology to Compare Productive Uses of Energy Supplied by Stand-Alone Solar Photovoltaic Systems: A Tanzanian Case Study. Energy Sustain. Dev. 2022, 70, 497–510. [Google Scholar] [CrossRef]
  79. Matthey-Junod, A. Leaving No Aspect of Sustainability behind: A Framework for Designing Sustainable Energy Interventions Applied to Refugee Camps. Energy Res. Soc. Sci. 2022, 90, 102636. [Google Scholar] [CrossRef]
  80. Shuma, J.C.; Sawe, E.; Clements, A.; Meena, S.B.; Aloyce, K.; Ngaya, A.E. ECooking Delivery Models: Approach to Designing Delivery Models for Electric Pressure Cookers with Case Study for Tanzania. Energies 2022, 15, 771. [Google Scholar] [CrossRef]
  81. Bisaga, I.; To, L.S. Funding and Delivery Models for Modern Energy Cooking Services in Displacement Settings: A Review. Energies 2021, 14, 4176. [Google Scholar] [CrossRef]
  82. Stritzke, S.; Sakyi-Nyarko, C.; Bisaga, I.; Bricknell, M.; Leary, J.; Brown, E. Results-Based Financing (RBF) for Modern Energy Cooking Solutions: An Effective Driver for Innovation and Scale? Energies 2021, 14, 4559. [Google Scholar] [CrossRef]
  83. Bricknell, M.; Stritzke, S.; Brown, E.; Batchelor, S.; Weston, P.; Gopalan, A. Modern Energy Cooking: Review of the Funding Landscape—Reports of 5 Clean Cooking Series. Energy 4 Impact, MECS. 2022. Available online: https://energy4impact.org/modern-energy-cooking-review-funding-landscape-0 (accessed on 12 December 2022).
  84. EPA. Emission Factors for Greenhouse Gas Inventories. Available online: https://www.epa.gov/sites/default/files/2018-03/documents/emission-factors_mar_2018_0.pdf (accessed on 24 January 2022).
  85. Cerutti, P.O.; Sola, P.; Chenevoy, A.; Iiyama, M.; Yila, J.; Zhou, W.; Djoudi, H.; Atyi, R.E.; Gautier, D.J.; Gumbo, D.; et al. The Socioeconomic and Environmental Impacts of Wood Energy Value Chains in Sub-Saharan Africa: A Systematic Map Protocol. Environ. Evid. 2015, 4, 12. [Google Scholar] [CrossRef] [Green Version]
  86. Forrister, H.; Liu, J.; Scheuer, E.; Dibb, J.; Ziemba, L.; Thornhill, K.L.; Anderson, B.; Diskin, G.; Perring, A.E.; Schwarz, J.P.; et al. Evolution of Brown Carbon in Wildfire Plumes. Geophys. Res. Lett. 2015, 42, 4623–4630. [Google Scholar] [CrossRef] [Green Version]
  87. Akagi, S.K.; Yokelson, R.J.; Wiedinmyer, C.; Alvarado, M.; Reid, J.S.; Karl, T.; Crounse, J.D.; Wennberg, P.O. Emission Factors for Open and Domestic Biomass Burning for Use in Atmospheric Models. Atmos. Chem. Phys. 2011, 11, 4039–4072. [Google Scholar] [CrossRef] [Green Version]
  88. Lewis, A.C. Optimising Air Quality Co-Benefits in a Hydrogen Economy: A Case for Hydrogen-Specific Standards for NO x Emissions. Environ. Sci. Atmos. 2021, 1, 201–207. [Google Scholar] [CrossRef]
  89. Scott, N.; Barnard-Tallier, M.; Clements, A.; Inston, R.; Lapworth, S.; Price, M. Landscaping Study—Modern Foods (Working Paper). Modern Energy Cooking Services. Available online: https://mecs.org.uk/wp-content/uploads/2020/12/Landscape-Study-Modern-Foods-and-Eating-Habits.pdf (accessed on 8 February 2023).
  90. Gordon, J.A.; Balta-Ozkan, N.; Nabavi, S.A. Beyond the Triangle of Renewable Energy Acceptance: The Five Dimensions of Domestic Hydrogen Acceptance. Appl. Energy 2022, 324, 119715. [Google Scholar] [CrossRef]
  91. Flynn, R.; Bellaby, P.; Ricci, M. Environmental Citizenship and Public Attitudes to Hydrogen Energy Technologies. Environ. Politics 2008, 17, 766–783. [Google Scholar] [CrossRef] [Green Version]
  92. Scott, M.; Powells, G. Towards a New Social Science Research Agenda for Hydrogen Transitions: Social Practices, Energy Justice, and Place Attachment. Energy Res. Soc. Sci. 2020, 61, 101346. [Google Scholar] [CrossRef]
  93. Efficiency for Access; 60 Decibels. Uses and Impacts of Electric Pressure Cookers—Insights from Kenya. 2021. Available online: https://efficiencyforaccess.org/publications/uses-impacts-of-electric-pressure-cookers (accessed on 8 February 2023).
  94. Clements, A.; Fodio Todd, J. Tanzania ECooking Market Assessment. MECS. 2022. Available online: https://mecs.org.uk/wp-content/uploads/2022/08/Tanzania-eCooking-Market-Assessment-2022-Final.pdf (accessed on 8 February 2023).
  95. Modern Energy Cooking Services; UK Aid. Cooking with Electricity in Kenya—A Culinary Tour of a Transformative Opportunity. Available online: https://mecs.org.uk/blog/cooking-with-electricity-in-kenya-a-culinary-tour-of-a-transformative-opportunity/ (accessed on 8 February 2023).
Figure 1. Different energy systems considered in this paper with integration routes of hydrogen to provide cooking services in off-grid communities: (a) stand-alone hydrogen production and utilization via combustion in hydrogen stoves; (b) stand-alone electricity supply system; (c) integrated hydrogen production system in the electricity supply system and utilization via combustion; (d) P2H2P-based e-cooking; (e) blending of hydrogen with LPG and combustion of the gas mix in an LPG burner.
Energies 16 03242 g001
Figure 2. Economic measures of results ((a) TAC, (b) LCOS, (c) LCOCooking, (d) LCOE) of the respective energy system topology for parameter constellation assumed in 2022, 2030, 2040, and 2050. The body of the violine plot and its extrema show the space of solutions for when varying PV CAPEX, EL CAPEX, FC CAPEX, battery CAPEX, hydrogen storage CAPEX, WACC, EL efficiency and FC efficiency ±50% compared to the reference case of 2022 (absolute). Potential increases in the LCOE (e.g., in the integrated hydrogen combustion system) are explained by assumed increases in the efficiency of the electrolysis, decreasing the energy flow via the EL, and thereby, the relative share of PV investment costs accounted for the cooking service system (see Economic Energy System Evaluation). * Note that the H2–LPG blending scenario only partly satisfies the cooking energy demand; see Cooking Demand.
Energies 16 03242 g002
Figure 3. Monthly household costs of cooking (including fuel costs and stove financing). CRT = cost-reflective tariff (average privately owned mini-grid tariff); LLT = lifeline tariff.
Energies 16 03242 g003
Figure 4. Monthly household energy costs in 2022 and 2050 (costs of cooking include fuel costs and stove financing). CRT = cost-reflective tariff (average privately owned mini-grid tariff); LLT = lifeline tariff; SB = single burner stove.
Energies 16 03242 g004
Table 1. Selected properties of hydrogen, propane, and methane. As the main compound of LPG and natural gas, the properties of propane and methane approximate LPG and natural gas properties, respectively. Originally published in [10].
PropertyUnitHydrogen (H2)Propane (C3H8)Methane (CH4)
Molecular weightu2.01594 [21]44.116.4
Gravimetric energy content MJ/kg120 [22]46.4 [22]50 [22]
Higher heating value (HHV)MJ/Nm3
(MJ/l Propane)
12.75 [23]26.5 [24]39.82 [23]
Flammability range (Equivalence ratio) 0.1~7.1 [22]0.51~2.5 [22]0.5~1.7 [22]
Max. laminar burning velocitym/s2.91 [22]0.43 [22]0.37 [22]
Adiabatic flame temperature in air°C2.110 [22]2.000 [22]1.950 [22]
Diffusion coefficient in airCm2/s0.61 [21]0.1318 [S]0.221 [S]
Minimum auto ignition temperature °C520 [22]450 [22]630 [22]
Table 2. Typical cooking fuel parameter applied in this analysis [25,30]. The annual fuel demand per household is calculated based on the simplified assumption that only one fuel exclusively is used as cooking fuel, neglecting fuel stacking.
ParameterFuelwoodCharcoalLPGHydrogenEPC + Hot Plate
Calorific value [kWh/kg]4.128.6113.1439.4/
Fuel costs [USD/kg] 1 [25]0.330.471.31See analysisLifeline tariff (<100 kWh/m): 0.17 USD/kWh
Domestic ordinary tariff: 0.23 USD/kWh [49]
Average cost reflective mini-grid tariff: 0.67–0.8 USD/kWh
Daily fuel demand per household [kg] 1 [49]3.51.750.230.0661.92
1 Values for e-cooking appliances per kWh.
Table 4. Hydrogen system component parameter assumptions. The discussion of the parameters and literature sources consulted are provided in [15].
ParameterUnitAELH2 StoragePEMFC
Specific investment costsUSD/kWel100020 USD/kWh2600
O&M costs% invest30.3 USD/kWh/a3
Lifetimey10 (stack)
20 (system)
2010 (stack)
20 (system)
Efficiency%60 (LHV)0.88 155 (LHV)
1 Including compression.
Table 5. Scenario assumptions for future development of hydrogen technology improvement and cost decline, fossil fuel price increase and change in electricity tariff. CRF tariff = cost reflective tariff.
YearCAPEX
[USD/kWel]
Efficiency
[% System, LHV]
PV CAPEX [USD/kW]Firewood Price [USD/kg]Charcoal Price [USD/kg]LPG Price
[USD/kg]
Lifeline Tariff [USD/kWh]CRF Tariff
[USD/kWh]
ELFCELFC
202210002600605510000.330.471.310.1670.67
2030600156064.5594000.420.591.660.1670.47
204040010406963.253250.560.82.230.1670.41
205020052073672500.751.073.00.1670.37
Table 6. Least costly (optimal) system topologies of the hydrogen-based energy systems. * The demand of electricity required for e-cooking decreases with the substitution of AC EPCs and electric hotplates in 2030 by approximately 40%, as explained in Cooking Demand. ** Note that we assume a standard PV–battery electricity supply system with fixed component sizes and only use excess electricity for hydrogen production, as explained in Section 2.1 and Cooking Demand.
ParameterYearStand-Alone H2 ProductionStand-Alone Electricity SupplyIntegrated H2 ProductionP2H2P-Based e-Cooking *H2–LPG Blend **
PV power [kWp]202250.2548.8191.1180.1754.46
203053.5153.45105.2272.1154.46
204053.4952.45100.7369.8154.46
205054.8268.02121.493.2354.46
Battery capacity [kWh]2022 140.79134.72234.24272.72
2030 117.88136.83174.63272.72
2040 117.39135.43173.6272.72
2050 000272.72
Electrolyzer power [kWel]202225.020.9724.351.720.29
203022.532.0822.852.160.27
204022.521.9521.72.040.25
205024.0721.2746.5529.510.24
Fuel cell power [kWel]2022 1.980.673.23
2030 2.20.32.82
2040 2.240.442.93
2050 13.9813.9920.28
H2 storage capacity [kWh]2022648.53164.21801.69272.3617.81
2030482.27143.21437.73189.8317.64
2040360.69144.33447.71204.9817.63
2050251.59230.4408.02314.9317.62
Excess electricity share [%]202215.231.219.0230.8935.6
203026.0736.2531.3434.9635.86
204031.0934.5830.6132.6936.04
205036.833.3735.5633.1936.19
Disclaimer/Publisher’s Note: The statements, opinions and data contained in all publications are solely those of the individual author(s) and contributor(s) and not of MDPI and/or the editor(s). MDPI and/or the editor(s) disclaim responsibility for any injury to people or property resulting from any ideas, methods, instructions or products referred to in the content.

