

Potential Domestic Energy System Vulnerabilities from Major Exports of Green Hydrogen: A Case Study of Australia


Abstract
:1. Introduction
1.1. Hydrogen Sources
1.2. Electrolyser Technology
1.3. Hydrogen Carrier
1.4. Hydrogen Export Literature Review
1.5. Methodology and Structure
1.6. Limitations of This Study
2. What Would Being a Hydrogen Export Superpower Look like for Australia?
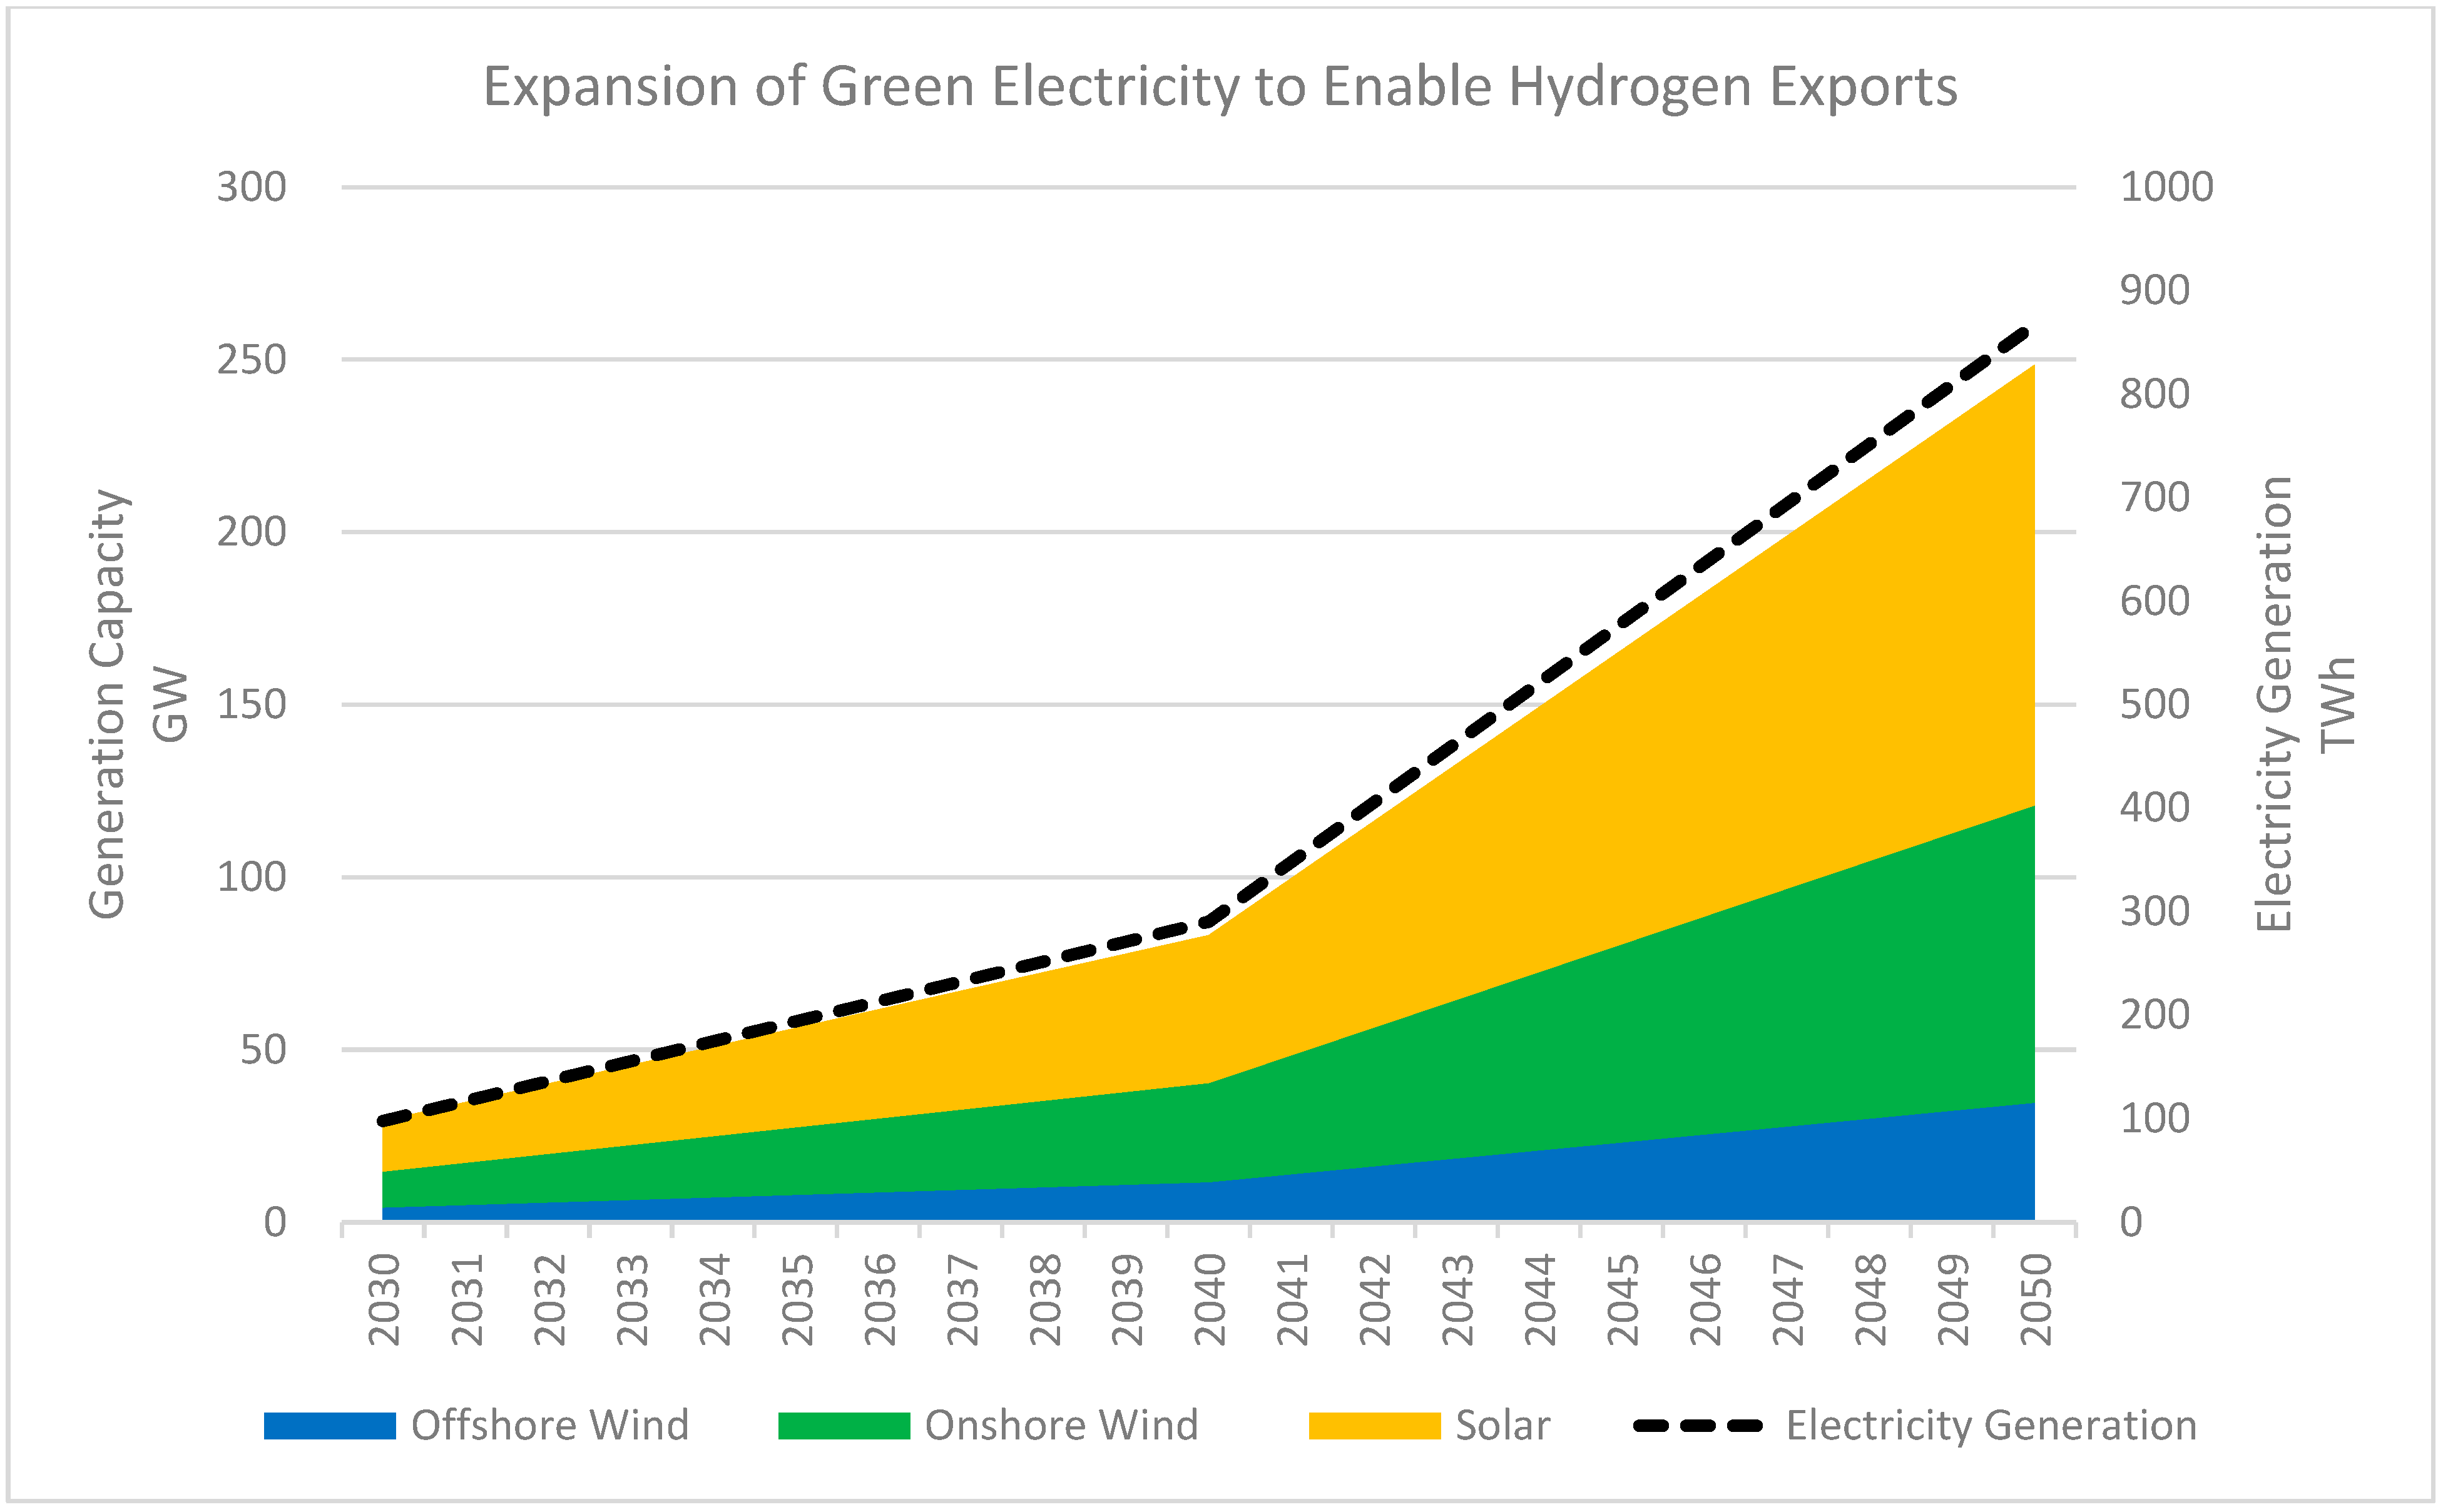
2.1. Electricity Generation Requirements
- -
- Two to three new wind farms per year of 200 MW per site;
- -
- The first two 2 GW offshore wind farms begin operation by 2030;
- -
- Three to four new solar farms per year of 400 MWp per site.
- -
- Nine new wind farms per year of 200 MW each year;
- -
- A new 2 GW offshore wind farm every 3 years;
- -
- Seven new solar farms per year of 400 MWp per site.
- -
- Twenty-nine new wind farms per year of 200 MW each year;
- -
- A new 2 GW offshore wind farm every 14 months;
- -
- Fourteen new solar farms every 18 months of 400 MWp per site.
2.2. Hydrogen Export Quantity Validation with Major Trading Partners
2.3. Hydrogen Export Price Validation with Major Trading Partners
2.4. Operating Mode Considerations
3. Comparative Resources
3.1. Resource Curse Framework: Applicability to Hydrogen Exports?
- 0
- The factor is not applicable to hydrogen exports;
- 1
- The factor is applicable to hydrogen exports, but the impact is mitigated compared to the classic resource curse;
- 2
- The factor is applicable to hydrogen exports the same as with the classic resource curse;
- 3
- The factor is applicable to hydrogen exports with a more severe impact than for the classic resource curse.
3.2. LNG Exports Framework: Lessons for Hydrogen?
3.2.1. Competition between Domestic Use and Export for Gas, and Possibly Hydrogen?
3.2.2. Competition between Domestic Use and Export-Oriented Electrolysers for Electricity?
3.3. Aluminium Exports Framework: Lessons for Hydrogen?
3.3.1. Significance of Electricity in Aluminium Smelting
3.3.2. Aluminium as a Means of Exporting Low-Cost Electricity
3.3.3. Aluminium Producer Interactions with the Domestic Electricity System
Effects on Electricity Pricing
Grid Stability
3.3.4. Aluminium Smelting and Applicable Factors to a Hydrogen-Exporting Framework
4. Evaluation of the Hydrogen Superpower Scenario
4.1. Energy Exporter Economic Vulnerability Metrics
- M1—Customer Energy Import Dependence;
- M2—Customer Energy Mix Diversity;
- M3—Export Customer Diversification.
- M4—Energy Exports Significance to GDP;
- M5—Resource-to-Production Ratio;
- M6—Carbon Intensity of Energy Export Blend.
M1—Customer Energy Import Dependence
- Q = quantity of energy exports to country A, B, n, or the total energy export (in PJ);
- E = energy imports by country A, B, n (in PJ);
- TPES = total primary energy supply of country A, B, n (in PJ).
M2—Customer Energy Mix Diversity
- Q = quantity (in PJ) of energy exports to country 1, 2, …, n, or the total energy export quantity;
- HHITPES = HHI diversity index for total primary energy supply for country 1, 2, n = (xcoal)2 + (xgas)2 + (xoil)2 + (xnuclear)2 + (xhydro)2 + (xwind)2 + (xsolar)2 + (xbiomass)2 + (xgeothermal)2;
- Xfuel type A = consumption of fuel type A/TPES.
M3—Export Customer Diversification
- CER = the export customer country’s CO2 emissions reduction rating index (0–100), adopted from the Climate Change Performance Index [78];
- xFF = fossil fuels exported to country 1, 2, n, as a fraction of total energy (PJ) exports;
- xZCF = zero-carbon fuels exported to country 1, 2, n, as a fraction of total energy (PJ) exports.
M4—Energy Exports Significance to GDP
- R = revenue;
- GDP = gross domestic product;
M5—Resource-to-Production Ratio
- RPR = the resource-to-production ratio for each energy resource type (years), with an upper limit to RPR of 100. i.e., for RPR ≥ 100; M5 = 0.
- RPRaggregated = resource-to-production ratio (aggregated);
- Q = total demonstrated resource of each energy resource type, in petajoules;
- P = annual production rate of energy resource type, in petajoules per year;
- S = export quantity from each energy type, in petajoules per year;
- X = total export quantity from all energy types, in petajoules per year.
M6—Carbon Intensity of Energy Export Blend
- S = export quantity from each energy type, in PJ;
- X = total export quantity from all energy types, in PJ;
- f = CO2 emissions adjustment factor for each energy type, as per Table 14.
Export Vulnerability Metrics Scaled and Compared
4.2. Energy Exporter Domestic Energy Security Metrics
Ex.PESS—Exporter’s Primary Energy Self-Sufficiency
- Ex.PESS = Exporter Primary Energy Self-Sufficiency;
- TES = total energy supply in each category;
- DSS = domestic supply self-sufficiency, capped at 100%, being the maximum rate of production that can be applied for domestic use;
- TPES = total primary energy supply (sum of all TES categories: electricity, oil, gas and green hydrogen);
Ex.DES—Exporter Domestic Energy System Exposure to Export Impacts
- Ex.DES(energy type) = 1 minus the ratio of domestic energy supply of that energy type that is physically linked to an export market;
- TES(energy type) = total energy supply of the given energy type.
5. Framework Summary
6. Discussion and Implications
7. Conclusions and Further Research
- -
- A deeper study of the relevance of detailed aspects of the resource curse hypothesis to large-scale green hydrogen exports can be continued from the initial review provided in this paper.
- -
- As the extent of energy infrastructure construction (renewable electricity generation, transmission lines, hydrogen electrolysers and conversion plants for exportable carriers) required for the anticipated transition has been demonstrated, questions immediately arise on the shortages of critical minerals to manufacture the equipment required. Further research on potential supply shortages and alternative materials is proposed.
- -
- The potential opportunities and benefits for reducing import customer energy demand by the relocation of energy-intensive activities closer to low-cost renewable energy resources, in a similar manner to the relocation of aluminium production from Japan to Australia, such as green steel production, rather than transforming renewable electricity into hydrogen, then into a carrier, for shipping to a distant customer.
Author Contributions
Funding
Data Availability Statement
Conflicts of Interest
Glossary
| AE | Alkaline electrolysis |
| AEMO | Australian Energy Market Operator |
| APPEA | Australian Petroleum Production and Exploration Association |
| CEFC | Clean Energy Finance Corporation (Australia) |
| CO2 | Carbon dioxide |
| COAG | Coalition of Australian Government (National and State Governments body) |
| CSG | Coal Seam Gas |
| CSIRO | Commonwealth Scientific and Industrial Research Organisation (Australia) |
| e-LNG | Liquefied natural gas produced from synthesised methane using hydrogen produced from electrolysis |
| GA | Geoscience Australia |
| HESC | Hydrogen Energy Supply Chain Project (Australia Japan cooperation) |
| LH2 | Liquefied Hydrogen |
| LNG | Liquefied Natural Gas |
| MeOH | Methanol |
| NEM | Australia’s National Electricity Market |
| NH3 | Ammonia |
| PEM | Polymer electrolyte membrane (sometimes also called proton exchange membrane) |
Appendix A

| Project | State | Domestic | Export |
|---|---|---|---|
| Abel Energy Bell Bay | Tasmania | ✓ | ✓ |
| Arrowsmith Hydrogen | Western Australia | ✓ | |
| Australian Renewable Energy Hub (Pilbara) | Western Australia | ✓ | ✓ |
| Bristol Spring Solar Hydrogen | Western Australia | ✓ | |
| Cape Hardy Green Hydrogen | South Australia | ✓ | |
| Central Queensland Hydrogen Energy | Queensland | ✓ | ✓ |
| Collie Battery and Hydrogen Industrial Hub Project | Western Australia | ✓ | |
| Darwin Green Liquid Hydrogen Export | Northern Territory | ✓ | ✓ |
| Darwin H2 Hub | Northern Territory | ✓ | |
| Desert Bloom Hydrogen | Northern Territory | ✓ | ✓ |
| Altona Renewable Hydrogen Plant | Victoria | ✓ | |
| Edify Green Hydrogen (Townsville) | Queensland | ✓ | ✓ |
| Energys Renewable Hydrogen Production Facility | Victoria | ✓ | |
| Fortescue Green Hydrogen and Ammonia Plant Bell Bay | Tasmania | ✓ | ✓ |
| Swanbank Future Energy and Hydrogen Precinct | Queensland | ✓ | |
| Fortescue Geelong Hydrogen Hub | Victoria | ✓ | ✓ |
| Geraldton Export-scale Renewable Investment (GERI) | Western Australia | ✓ | ✓ |
| Gibson Island Green Ammonia | Queensland | ✓ | |
| Good Earth Green Hydrogen and Ammonia (Moree) | New South Wales | ✓ | |
| Goondiwindi Hydrogen | Queensland | ✓ | |
| Grange Resources Renewable Hydrogen (Port Latta) | Tasmania | ✓ | |
| Great Southern (Georgetown) | Tasmania | ✓ | |
| Origin Green Hydrogen Export | Queensland | ✓ | ✓ |
| Green Springs (off-grid) | Northern Territory | ✓ | ✓ |
| H2-Hub (Gladstone) | Queensland | ✓ | ✓ |
| Woodside H2TAS | Tasmania | ✓ | ✓ |
| Han-Ho H2 Hub | Queensland | ✓ | |
| Hay Point Hydrogen Export | Queensland | ✓ | |
| HIF Carbon Neutral eFuels Manufacturing Facility | Tasmania | ✓ | |
| Hunter Energy Hub (AGL + Fortescue) | New South Wales | ✓ | ✓ |
| Hunter Valley Hydrogen Hub (Origin + Orica) | New South Wales | ✓ | |
| Hydrogen Brighton | Tasmania | ✓ | |
| Hydrogen Launceston | Tasmania | ✓ | |
| Hydrogen Park Murray Valley | Victoria | ✓ | |
| Hydrogen Park South Australia | South Australia | ✓ | |
| Hydrogen Portland | Victoria | ✓ | ✓ |
| HyEnergy | Western Australia | ✓ | |
| Melbourne Hydrogen Hub | Victoria | ✓ | |
| Murchison Hydrogen Renewables | Western Australia | ✓ | |
| Neoen-ENEOS Export | South Australia | ✓ | |
| Ord Hydrogen | Western Australia | ✓ | ✓ |
| Origin ENEOS Gladstone | Queensland | ✓ | |
| Origin Bell Bay Green Hydrogen and Ammonia | Tasmania | ✓ | ✓ |
| Pacific Solar Gladstone Hydrogen | Queensland | ✓ | |
| Port Bonython Hydrogen Hub | South Australia | ✓ | |
| Port Pirie Green Hydrogen | South Australia | ✓ | |
| Project Haber | Western Australia | ✓ | |
| SM1 Port Augusta | South Australia | ✓ | |
| South Australian Government Hydrogen Facility | South Australia | ✓ | |
| Sumitomo Rio Tinto Green Hydrogen Yarwun | Queensland | ✓ | |
| SunHQ Hydrogen Hub | Queensland | ✓ | |
| Tiwi H2 | Northern Territory | ✓ | |
| Torrens Island Green Hydrogen Hub | South Australia | ✓ | |
| Western Green Energy Hub | Western Australia | ✓ | |
| Whaleback Energy Park | Tasmania | ✓ | ✓ |
| Yuri Renewable Hydrogen to Ammonia | Western Australia | ✓ |
References
- Curtis, A.; McLellan, B. Framework for Assessment of the Economic Vulnerability of Energy-Resource-Exporting Countries. Resources 2023, 12, 27. [Google Scholar] [CrossRef]
- BP Statistical Review of World Energy 2021. 2021. Available online: https://www.bp.com/en/global/corporate/energy-economics/statistical-review-of-world-energy.html (accessed on 7 September 2021).
- Ministry of Economy Trade and Industry Japan Agency for Natural Resources and Energy. Outline of Strategic Energy Plan; Agency for Natural Resources and Energy: Tokyo, Japan, 2021. [Google Scholar]
- Japan to Invest 15 tril. Yen in Hydrogen Supply for Decarbonization. 2023. Available online: https://mainichi.jp/english/articles/20230606/p2g/00m/0na/019000c (accessed on 6 June 2023).
- Smith, M.; Hargroves, K. Energy superpower-or sustainable energy leader? CSIRO ECOS 2007, 2007, 20–26. Available online: http://www.ecosmagazine.com/?act=view_file&file_id=EC140p22.pdf (accessed on 11 June 2023).
- Garnaut, R. Australia: Energy Superpower of the Low-Carbon World; University of Adelaide: Adelaide, Australia, 2015. [Google Scholar]
- Bruce, S.; Temminghoff, M.; Hayward, J.; Schmidt, E.; Munnings, C.; Palfreyman, D.; Hartley, P. National Hydrogen Roadmap—Pathways to an Economically Sustainable Hydrogen Industry in Australia. 2018. Available online: https://www.csiro.au/en/research/environmental-impacts/fuels/hydrogen/Hydrogen-Roadmap (accessed on 17 May 2023).
- COAG Energy Council Hydrogen Working Group. Australia’s National Hydrogen Strategy. Available online: https://www.dcceew.gov.au/sites/default/files/documents/australias-national-hydrogen-strategy.pdf (accessed on 17 May 2023).
- Labor Has Won the Election and These Are Their Policies. 2022. Available online: https://www.abc.net.au/news/2022-05-22/labor-won-federal-election-albanese-policies/101088720 (accessed on 29 June 2023).
- Department of Climate Change Energy the Environment and Water (Australia). National Hydrogen Strategy Review. Available online: https://www.dcceew.gov.au/energy/publications/australias-national-hydrogen-strategy (accessed on 29 June 2023).
- International Energy Agency. Korea Hydrogen Economy Roadmap 2040. 2020. Available online: https://www.iea.org/policies/6566-korea-hydrogen-economy-roadmap-2040 (accessed on 17 May 2023).
- ACIL ALLEN. Opportunities for Australia from Hydrogen Exports—Report for ARENA. 2018. Available online: https://acilallen.com.au/uploads/projects/149/ACILAllen_OpportunitiesHydrogenExports_2018pdf-1534907204.pdf (accessed on 24 May 2023).
- Brown, F.; Roberts, D. Green, Blue, Brown: The Colours of Hydrogen Explained. CSIROscope. 27 May 2021. Available online: https://blog.csiro.au/green-blue-brown-hydrogen-explained/ (accessed on 18 May 2023).
- The Hydrogen Energy Supply Chain Project. Available online: https://www.hydrogenenergysupplychain.com/ (accessed on 26 May 2023).
- AGL. AGL Loy Yang Power Station. Available online: https://www.agl.com.au/about-agl/how-we-source-energy/loy-yang-power-station (accessed on 26 May 2023).
- International Energy Agency. 2022. Available online: https://www.iea.org/reports/electrolysers (accessed on 26 May 2023).
- Australian Energy Market Operator. 2021 Inputs, Assumptions and Scenarios Report Final Report; Australian Energy Market Operator: Melbourne, Australia, 2021. [Google Scholar]
- Deloitte. Australian and Global Hydrogen Demand Growth Scenario Analysis COAG Energy Council—National Hydrogen Strategy Taskforce, 2019. Available online: https://www2.deloitte.com/content/dam/Deloitte/au/Documents/future-of-cities/deloitte-au-australian-global-hydrogen-demand-growth-scenario-analysis-091219.pdf (accessed on 17 May 2023).
- Reedman, L. Multi-Sector Energy Modelling 2022: Methodology and Results Final Report. 2022. Available online: https://publications.csiro.au/rpr/pub?pid=csiro:EP2022-5553&expert=false&sb=RECENT&q= (accessed on 25 May 2023).
- Rasool, M.A.; Khalilpour, K.; Rafiee, A.; Karimi, I.; Madlener, R. Evaluation of alternative power-to-chemical pathways for renewable energy exports. Energy Convers. Manag. 2023, 287, 117010. [Google Scholar] [CrossRef]
- Wang, F.; Swinbourn, R.; Li, C. Shipping Australian sunshine: Liquid renewable green fuel export. Int. J. Hydrogen Energy 2023, 48, 14763–14784. [Google Scholar] [CrossRef]
- Australian Transport Safety Bureau. Gas Control Equipment Malfunction on Board the Gas Tanker Suiso Frontier at Western Port, Hastings, Victoria on 25 January 2022. Available online: https://www.atsb.gov.au/publications/investigation_reports/2022/mair/mo-2022-001 (accessed on 23 May 2023).
- Hatfield, O. Country Traded Ammonia Logistics and Storage, Present and Future. 2021. Available online: https://www.ammoniaenergy.org/paper/country-traded-ammonia-logistics-and-storage-present-and-future/ (accessed on 23 May 2023).
- Gallardo, F.I.; Ferrario, A.M.; Lamagna, M.; Bocci, E.; Garcia, D.A.; Baeza-Jeria, T.E. A Techno-Economic Analysis of solar hydrogen production by electrolysis in the north of Chile and the case of exportation from Atacama Desert to Japan. Int. J. Hydrogen Energy 2021, 46, 13709–13728. [Google Scholar] [CrossRef]
- Burdack, A.; Duarte-Herrera, L.; López-Jiménez, G.; Polklas, T.; Vasco-Echeverri, O. Techno-economic calculation of green hydrogen production and export from Colombia. Int. J. Hydrogen Energy 2023, 48, 1685–1700. [Google Scholar] [CrossRef]
- Kakavand, A.; Sayadi, S.; Tsatsaronis, G.; Behbahaninia, A. Techno-economic assessment of green hydrogen and ammonia production from wind and solar energy in Iran. Int. J. Hydrogen Energy 2023, 48, 14170–14191. [Google Scholar] [CrossRef]
- Galván, A.; Haas, J.; Moreno-Leiva, S.; Osorio-Aravena, J.C.; Nowak, W.; Palma-Benke, R.; Breyer, C. Exporting sunshine: Planning South America’s electricity transition with green hydrogen. Appl. Energy 2022, 325, 119569. [Google Scholar] [CrossRef]
- Armijo, J.; Philibert, C. Flexible production of green hydrogen and ammonia from variable solar and wind energy: Case study of Chile and Argentina. Int. J. Hydrogen Energy 2020, 45, 1541–1558. [Google Scholar] [CrossRef]
- Khan, M.I.; Al-Ghamdi, S.G. Hydrogen economy for sustainable development in GCC countries: A SWOT analysis considering current situation, challenges, and prospects. Int. J. Hydrogen Energy 2023, 48, 10315–10344. [Google Scholar] [CrossRef]
- Bhandari, R. Green hydrogen production potential in West Africa—Case of Niger. Renew. Energy 2022, 196, 800–811. [Google Scholar] [CrossRef]
- Hjeij, D.; Bicer, Y.; Al-Sada, M.B.S.; Koç, M. Hydrogen export competitiveness index for a sustainable hydrogen economy. Energy Rep. 2023, 9, 5843–5856. [Google Scholar] [CrossRef]
- Downie, C. Geopolitical leverage in the energy transition: A framework for analysis and the case of Australian electricity exports. Energy Res. Soc. Sci. 2022, 93, 102826. [Google Scholar] [CrossRef]
- Cremonese, L.; Mbungu, G.K.; Quitzow, R. The sustainability of green hydrogen: An uncertain proposition. Int. J. Hydrogen Energy 2023, 48, 19422–19436. [Google Scholar] [CrossRef]
- Hancock, L.; Ralph, N. A framework for assessing fossil fuel ‘retrofit’ hydrogen exports: Security-justice implications of Australia’s coal-generated hydrogen exports to Japan. Energy 2021, 223, 119938. [Google Scholar] [CrossRef]
- Curtis, A.; McLellan, B. Exposing the Blind Spots in Domestic Energy Security of Major Energy Exporters. (unpublished work).
- Australian Energy Market Operator. 2022 Integrated System Plan for the National Electricity Market. 2022. Available online: https://aemo.com.au/energy-systems/major-publications/integrated-system-plan-isp/2022-integrated-system-plan-isp (accessed on 1 June 2023).
- Commonwealth of Australia. Australian Energy Statistics 2020. 2020. Available online: https://www.energy.gov.au/publications/australian-energy-update-2020 (accessed on 8 May 2023).
- Aurecon. 2020 Costs and Technical Parameter Review Consultation Report for Australian Energy Market Operator (AEMO). 2020. Available online: https://www.aemo.com.au/-/media/files/electricity/nem/planning_and_forecasting/inputs-assumptions-methodologies/2021/aurecon-cost-and-technical-parameters-review-2020.pdf?la=en#page=59&zoom=100,91,64 (accessed on 26 May 2023).
- Austrade. Korean Hydrogen Market Update. 2022. Available online: https://www.austrade.gov.au/news/publications/korean-hydrogen-market-update-2022 (accessed on 26 May 2023).
- International Gas Union. World LNG Report 2022. 2022. Available online: https://www.igu.org/resources/world-lng-report-2022/ (accessed on 26 May 2023).
- The Institute of Energy Economics Japan. IEEJ Newsletter No. 242. 2023. Available online: https://eneken.ieej.or.jp/en/jeb/230221.pdf (accessed on 27 May 2023).
- The Institute of Energy Economics Japan. IEEJ Newsletter No. 171. 2019. Available online: https://eneken.ieej.or.jp/en/jeb/191021.pdf (accessed on 27 May 2023).
- Advisian. Australian Hydrogen Market Study—Sector Analysis Summary (Report for CEFC); Advisian: Adelaide, Australia, 2021. [Google Scholar]
- Badeeb, R.A.; Lean, H.H.; Clark, J. The evolution of the natural resource curse thesis: A critical literature survey. Resour. Policy 2017, 51, 123–134. [Google Scholar] [CrossRef]
- Leonard, A.; Ahsan, A.; Charbonnier, F.; Hirmer, S. The resource curse in renewable energy: A framework for risk assessment. Energy Strategy Rev. 2022, 41, 100841. [Google Scholar] [CrossRef]
- Lotrič, A.; Sekavčnik, M.; Kuštrin, I.; Mori, M. Life-cycle assessment of hydrogen technologies with the focus on EU critical raw materials and end-of-life strategies. Int. J. Hydrogen Energy 2021, 46, 10143–10160. [Google Scholar] [CrossRef]
- Viebahn, P.; Soukup, O.; Samadi, S.; Teubler, J.; Wiesen, K.; Ritthoff, M. Assessing the need for critical minerals to shift the German energy system towards a high proportion of renewables. Renew. Sustain. Energy Rev. 2015, 49, 655–671. [Google Scholar] [CrossRef] [Green Version]
- Zimmermann, T.; Rehberger, M.; Gößling-Reisemann, S. Material flows resulting from large scale deployment of wind energy in Germany. Resources 2013, 2, 303–334. [Google Scholar] [CrossRef]
- Madsen, H.T. Water Treatment for Green Hydrogen: What You Need to Know. 2022. Available online: https://hydrogentechworld.com/water-treatment-for-green-hydrogen-what-you-need-to-know (accessed on 25 May 2023).
- Ward, S. The Coal Seam Gas (CSG) Industry in Queensland. 2014. Available online: https://www.ehaqld.org.au/documents/item/725 (accessed on 3 May 2023).
- Zhao, L.; Ren, T.; Wang, N. Groundwater impact of open cut coal mine and an assessment methodology: A case study in NSW. Int. J. Min. Sci. Technol. 2017, 27, 861–866. [Google Scholar] [CrossRef]
- Wulf, C.; Linßen, J.; Zapp, P. Review of power-to-gas projects in Europe. In Energy Procedia; Elsevier Ltd.: Amsterdam, The Netherlands, 2018; pp. 367–378. [Google Scholar] [CrossRef]
- Paul, S. Australia Starts Piping Hydrogen-Gas Blend into Homes. 2021. Available online: https://www.reuters.com/business/energy/australia-starts-piping-hydrogen-gas-blend-into-homes-2021-05-19/ (accessed on 31 May 2023).
- Siemens Energy. Zero Emission Hydrogen Turbine Center. Available online: https://www.siemens-energy.com/global/en/priorities/future-technologies/hydrogen/zehtc.html (accessed on 31 May 2023).
- General Electric. Hydrogen Fueled Gas Turbines. Available online: https://www.ge.com/gas-power/future-of-energy/hydrogen-fueled-gas-turbines (accessed on 31 May 2023).
- Simshauser, P.; Nelson, T. Australia’s coal seam gas boom and the LNG entry result. Aust. J. Agric. Resour. Econ. 2015, 59, 602–623. [Google Scholar] [CrossRef]
- CSIRO. HyResource—Australian Hydrogen Projects List. Available online: https://research.csiro.au/hyresource/projects/facilities/ (accessed on 31 May 2023).
- Turton, H. The Aluminium Smelting Industry Structure, Market Power, Subsidies and Greenhouse Gas Emissions. 2002. Available online: https://australiainstitute.org.au/wp-content/uploads/2020/12/DP44_8.pdf (accessed on 17 May 2023).
- Brooks, G. The Trouble with Aluminium. 2012. Available online: https://theconversation.com/the-trouble-with-aluminium-7245 (accessed on 22 May 2023).
- Geoscience Australia. Aluminium. Available online: https://www.ga.gov.au/education/classroom-resources/minerals-energy/australian-mineral-facts/aluminium (accessed on 31 May 2023).
- Rankin, J. Energy Use in Metal Production. 2012. Available online: https://publications.csiro.au/rpr/download?pid=csiro:EP12183&dsid=DS3 (accessed on 22 May 2023).
- Usui, E. The Status of the Aluminium Industry in Japan. 1998, pp. 15–24. Available online: http://www.icaa-conference.net/ICAA6/Aluminium%20Alloys%20Volume%201/15-24.pdf (accessed on 18 May 2023).
- International Energy Agency. Energy Balance Data (Japan). Available online: https://www.iea.org/sankey/#?c=Japan&s=Balance (accessed on 9 November 2022).
- Nippon Light Metal Company Ltd. Kambara Complex. Available online: https://www.nikkeikin.com/company/seizou/ (accessed on 18 May 2023).
- Aluminium Council of Australia. Australia Aluminium Production. Available online: https://aluminium.org.au/australian-aluminium/ (accessed on 30 May 2023).
- Gill, M. Déjà vu All over again—Electricity-Hungry Aluminium Smelters Continue to Push for More Coal-Fired Power Stations. Inside Story. 16 August 2018. Available online: https://insidestory.org.au/deja-vu-all-over-again/ (accessed on 7 June 2023).
- Thornton, K. The Electricity Commission of New South Wales and Its Place in the Rise of Centralised Coordination of Bulk Electricity Generation and Transmission 1888–2003. University of Newcastle, 2015. Available online: https://nova.newcastle.edu.au/vital/access/services/Download/uon:21089/ATTACHMENT01?view=true (accessed on 7 June 2023).
- Kelly, M. Tomago Aluminium Expects to Play a Bigger Role in Propping up the Energy Grid. 2023. Available online: https://www.newcastleherald.com.au/story/8213869/there-is-a-limit-tomago-braces-for-more-shut-down-orders-due-to-grid-instablilty/ (accessed on 29 May 2023).
- Potter, B. Alcoa’s Portland Smelter Faces Uncertainty after Blackout. 2016. Available online: https://www.afr.com/politics/alcoas-portland-smelter-faces-uncertainty-after-blackout-20161202-gt2hmm (accessed on 7 June 2023).
- International Energy Agency. Net Zero by 2050—A Roadmap for the Global Energy Sector, 2050. Available online: https://iea.blob.core.windows.net/assets/deebef5d-0c34-4539-9d0c-10b13d840027/NetZeroby2050-ARoadmapfortheGlobalEnergySector_CORR.pdf (accessed on 1 June 2023).
- Republic of Korea Ministry of Trade Industry and Energy. Third Energy Master Plan; Ministry of Trade Industry and Energy: Sejong, Republic of Korea, 2020. [Google Scholar]
- National Development Council. Taiwan’s Pathway to Net-Zero Emissions in 2050. 2022. Available online: https://www.ndc.gov.tw/en/Content_List.aspx?n=B154724D802DC488 (accessed on 12 June 2023).
- Kruyt, B.; van Vuuren, D.P.; de Vries, H.J.M.; Groenenberg, H. Indicators for energy security. Energy Policy 2009, 37, 2166–2181. [Google Scholar] [CrossRef]
- Martchamadol, J.; Kumar, S. An aggregated energy security performance indicator. Appl. Energy 2013, 103, 653–670. [Google Scholar] [CrossRef]
- Murakami, T.; Motokura, M.; Kutani, I. An Analysis of Major Countries’ Energy Security Policies and Conditions—Quantitative Assessment of Energy Security Policies. IEEJ Energy J. 2011, 6. Available online: https://eneken.ieej.or.jp/data/3719.pdf (accessed on 1 January 2023).
- Dike, J.C. Measuring the security of energy exports demand in OPEC economies. Energy Policy 2013, 60, 594–600. [Google Scholar] [CrossRef]
- Kanchana, K.; McLellan, B.C.; Unesaki, H. Energy dependence with an Asian twist? Examining international energy relations in Southeast Asia. Energy Res. Soc. Sci. 2016, 21, 123–140. [Google Scholar] [CrossRef]
- Burck, J.; Hagen, U.; Bals, C.; Hohne, N.; Nascimento, L.; Essop, T. Climate Change Performance Index 2021 Results. Available online: https://ccpi.org/download/the-climate-change-performance-index-2021/ (accessed on 1 September 2021).
- Cariolle, J. The Economic Vulnerability Index 2010 Update, 2011. Available online: https://www.researchgate.net/publication/261035539_The_Economic_Vulnerability_Index_2010_Update (accessed on 21 January 2019).
- The World Bank. Australia GDP Data. Available online: https://data.worldbank.org/indicator/NY.GDP.MKTP.KD?locations=AU (accessed on 1 January 2023).
- Australia Government. Value of Australian Mineral Exports. Available online: https://www.ga.gov.au/digital-publication/aimr2020/value-of-australian-mineral-exports (accessed on 1 January 2023).
- Production, A.P.; Association, E. APPEA Key Statistics 2021. Available online: https://www.appea.com.au/wp-content/uploads/2021/06/2021-APPEA_Key-Statistics-1.pdf (accessed on 1 January 2023).
- ElSayed, M.; Aghahosseini, A.; Caldera, U.; Breyer, C. Analysing the techno-economic impact of e-fuels and e-chemicals production for exports and carbon dioxide removal on the energy system of sunbelt countries—Case of Egypt. Appl. Energy 2023, 343, 121216. Available online: https://www.sciencedirect.com/science/article/pii/S0306261923005809 (accessed on 28 July 2023). [CrossRef]


| Technology | Current (kWh/kgH2) | Best Case (kWh/kgH2) |
|---|---|---|
| PEM | 54 | 45 |
| AE | 58 | 49 |
| Fuel | Calorific Value (LHV) MJ/kg | Density kg/m3 | Energy Density MJ/m3 | Temperature (Liquid State) |
|---|---|---|---|---|
| LNG | 45 | 450 | 20,250 | −162 °C |
| LH2 | 120 | 71 | 8520 | −283 °C |
| NH3 | 19 | 680 | 12,920 | −33 °C |
| Scenario and Parameter | 2030 | 2040 | 2050 |
|---|---|---|---|
| COAG (2019) “Hydrogen—Energy of the Future” scenario [8,18] | |||
| Green H2 produced (Australia) | 0.5 Mt (60 PJ) | - | 18 Mt (2160 PJ) |
| Electricity for Green H2 production (Australia) | 19 TWh | - | 912 TWh |
| AEMO (July 2021) “Hydrogen Superpower” scenario [17] (all figures NEM only) | |||
| Total Green H2 produced (domestic + export) | 1.0 Mt (120 PJ) | 5.0 Mt (600 PJ) | 15.0 Mt (1800 PJ) |
| Green H2 exported | 0.6 Mt (73 PJ) | 3.4 Mt (408 PJ) | 12.3 Mt (1474 PJ) |
| Total electricity demand, including Green H2 production | - | 614 TWh | - |
| Electricity for Green H2 production (% of total electricity demand) | 57 TWh | 285 TWh (46.4%) | 795 TWh |
| Electricity for Green H2 exports (% of total electricity demand) | 41 TWh | 221 TWh (36.0%) | 774 TWh |
| AEMO (June 2022) “Hydrogen Superpower” scenario [36] (all figures NEM only) | |||
| Total Green H2 produced (domestic + export) | 0.9 M t (107 PJ) | - | 17.0 Mt (2038 PJ) |
| Green H2 exported | 0.7 Mt (84 PJ) | - | 11.5 Mt (1376 PJ) |
| Total electricity demand, including Green H2 production | 294 TWh | - | 1278 TWh |
| Electricity for Green H2 production (% of total electricity demand) | 51 TWh (17.3%) | - | 900 TWh (70.4%) |
| Electricity for Green H2 exports (% of total electricity demand) | 49 TWh (16.7%) | - | 768 TWh (60.1%) |
| CSIRO and Climateworks for AEMO (Dec 2022) “Hydrogen Export” scenario [19] | |||
| Total Green H2 produced (domestic + export) | 1.9 Mt (233 PJ) | 6.3 Mt (757 PJ) | 20.2 Mt (2426 PJ) |
| Green H2 exported | 1.7 MT (204 PJ) | 5.4 Mt (648 PJ) | 17.4 Mt (2088 PJ) |
| Total electricity demand, including Green H2 production | 455 TWh | 790 TWh | 1550 TWh |
| Electricity for Green H2 production (% of total electricity demand) | 112 TWh (24.6%) | 339 TWh (42.9%) | 1008 TWh (65.0%) |
| Electricity for Green H2 exports (% of total electricity demand) | 98 TWh (21.6%) | 290 TWh (36.7%) | 867 TWh (55.9%) |
| 2030 | 2040 | 2050 | ||
|---|---|---|---|---|
| Hydrogen production | PJ | 204 | 648 | 2088 |
| Electricity generation | TWh | 98 | 290 | 867 |
| Onshore Wind | ||||
| Share of export green H2 generation | % | 40% | 40% | 40% |
| Share of export green H2 generation | TWh | 39 | 116 | 347 |
| Capacity factor | % | 43.0% | 46.0% | 46.0% |
| Installed capacity required | GW | 10.4 | 28.8 | 86.1 |
| Offshore Wind | ||||
| Share of export green H2 generation | % | 20% | 20% | 20% |
| Share of export green H2 generation | TWh | 20 | 58 | 173 |
| Capacity factor | % | 51.0% | 57.0% | 57.0% |
| Installed capacity required | GW | 4.4 | 11.6 | 34.7 |
| Solar | ||||
| Share of export green H2 generation | % | 40% | 40% | 40% |
| Share of export green H2 generation | TWh | 39 | 116 | 347 |
| Capacity factor | % | 30.5% | 31.0% | 31.0% |
| Installed capacity required | GW | 14.7 | 42.8 | 127.7 |
| 2021 LNG Trade | Japan | South Korea |
|---|---|---|
| Total LNG imports from all sources (Mt) | 74.35 | 46.92 |
| LNG imports from Australia (Mt) | 26.77 | 9.69 |
| Share of LNG from Australia | 36% | 21% |
| Share of Australia’s LNG exports | 34.1% | 12.3% |
| Case | Capacity Factor | LCOH (USD/kg) |
|---|---|---|
| Grid connected renewables | 85% | 4 |
| Dedicated renewables | 35% | 7 |
| Excess renewable generation | 10% | 17 |
| Causes | Reference | Relevance to Hydrogen | Rating |
|---|---|---|---|
| Badeeb [44] Leonard [45] |
| 2 2 2 |
| Badeeb [44] Leonard [45] |
| 2 |
| Badeeb [44] |
| 0 1 1 |
| Badeeb [44] Leonard [45] |
| 1 2 |
| Badeeb [44] |
| 2 |
| Badeeb [44] |
| 2 |
| Badeeb [44] |
| 2 |
| Leonard [45] |
| 3 3 0 |
| Leonard [45] |
| 2 |
| Leonard [45] |
| 3 |
| Leonard [45] |
| 2 |
| Leonard [45] |
| 3 |
| Leonard [45] |
| 2 |
| Aluminium Industry Domestic Impacts | Reference | Green Hydrogen Application |
|---|---|---|
Investors threaten relocation offshore to leverage electricity price reductions/subsidies. | Oil shock effects driving Japan’s smelter shut down, growth in Australia’s industry in 1980s [62,65]. Electricity supply contract renegotiation in Australia [58]. | A. Lowest cost of green electricity will be a primary driver for location of projects. B. Potential for hydrogen producers to relocate production for lower $/MWh, greater risk than for aluminium as technology development continues to reduce green electricity costs for newer installations. |
| Smelters operate baseload and are willing to accept take-or-pay electricity contracts [58]. | Highest capacity factor operations provide the best return for invested capital in hydrogen production. Grid electricity is preferred over dedicated renewable generation [38]. |
| Aluminium production assets are severely affected by electricity supply [69] interruptions. | Electrolysers are much less sensitive to electricity supply disruptions than smelters and can operate as interruptible loads in case of supply demand imbalance on the grid [7]. |
| 2019 | 2050 | |
|---|---|---|
| M1 | 0.744 | 0.413 |
| 2019 | 2050 | |
|---|---|---|
| M2 | 0.329 | 0.228 |
| 2019 | 2050 | |
|---|---|---|
| M3 | 10.171 | 6.335 |
| Year | 2019 | 2050 |
|---|---|---|
| GDP [80] | 1490 | 5300 |
| Coal export revenue [81] | 14.7 | 0.0 |
| LNG export revenue [82] | 30.9 | 0.0 |
| Oil export revenue [82] | 8.3 | 0.0 |
| Hydrogen export revenue [18] | 0.0 | 65.0 |
| Total energy export revenue | 53.9 | 65.0 |
| M4 | 0.036 | 0.012 |
| Year | 2019 | 2050 | Reference |
|---|---|---|---|
| Resource | |||
| Gas | 86,399 | 0 | APPEA [82] |
| Oil | 13,749 | 0 | APPEA [82] |
| Coal | 1,959,417 | 1,798,446 | GA [81] |
| Hydrogen | 0 | very high | CSIRO [19] |
| Production | |||
| Gas | 4938 | 0 | APPEA [82] |
| Oil | 719 | 0 | APPEA [82] |
| Coal | 12,596 | 0 | GA [81] |
| Hydrogen | 0 | 2088 | CSIRO [19] |
| M5 | 0.0 | 0.0 | |
| Energy Type | Emissions Factor (t CO2/TJ) | “f” CO2 Emissions Adjustment Factor |
|---|---|---|
| Coal | 96.3 | 1.00 |
| Crude oil | 73.3 | 0.76 |
| Natural gas | 56.1 | 0.58 |
| Green hydrogen | 0.0 | 0.00 |
| Year | 2019 | 2050 |
|---|---|---|
| Gas exports (PJ) | 3686 | 0 |
| Oil exports (PJ) | 518 | 0 |
| Coal exports (PJ) | 10,629 | 0 |
| Hydrogen exports (PJ) | 0 | 2088 |
| Total exports (PJ) | 14,833 | 2088 |
| M6 | 0.86 | 0.00 |
| 2019 | 2050 | 2019 | 2050 | |
|---|---|---|---|---|
| Raw Scores | Normalised and Scaled | |||
| M1 | 0.744 | 0.413 | 1.000 | 0.555 |
| M2 | 0.329 | 0.228 | 1.000 | 0.693 |
| M3 | 10.171 | 6.335 | 1.000 | 0.623 |
| M4 | 0.036 | 0.015 | 1.000 | 0.423 |
| M5 | 0.000 | 0.000 | 0.000 | 0.000 |
| M6 | 0.860 | 0.000 | 1.000 | 0.000 |
| 2019 | 2050 | |||
|---|---|---|---|---|
| TES | % DOM | TES | % DOM | |
| Oil | 2307 | 31.4% | 0 | - |
| Electricity source | 2404 | 98.6% | 5652 | 100.0% |
| Gas | 922 | 100.0% | 790 | 100.0% |
| Hydrogen | 0 | - | 2088 | 100.0% |
| Ex.PESS (aggregate) | 0.71 | 1.00 | ||
| 2019 | 2050 | |
|---|---|---|
| Gas (domestic use) (PJ) | 922 | 790 |
| Electricity (domestic use) (PJ) | 950 | 5652 |
| Hydrogen (domestic use) (PJ) | 0 | 338 |
| Ex.DES (gas) | 0.37 | 1.00 |
| Ex.DES (electric) | 0.59 | 0.00 |
| Ex.DES (hydrogen) | 0.00 | 0.42 |
| Ex.DES (aggregate) | 0.48 | 0.14 |
| 2019 | 2050 | Comment | |
|---|---|---|---|
| Exporter Internal Vulnerability | |||
| M1 | 0.744 | 0.413 | Less vulnerable (improved) |
| M2 | 0.329 | 0.228 | Less vulnerable (improved) |
| M3 | 10.171 | 6.335 | Less vulnerable (improved) |
| M4 | 0.036 | 0.012 | Less vulnerable (improved) |
| M5 | 0.00 | 0.00 | Unchanged (negligible vulnerability) |
| M6 | 0.860 | 0.00 | Less vulnerable (improved) |
| Exporter Domestic Energy Security | |||
| Ex.PESS | 0.71 | 1.00 | More secure (improved) |
| Ex.DES | 0.48 | 0.14 | Less secure (deteriorated) |
Disclaimer/Publisher’s Note: The statements, opinions and data contained in all publications are solely those of the individual author(s) and contributor(s) and not of MDPI and/or the editor(s). MDPI and/or the editor(s) disclaim responsibility for any injury to people or property resulting from any ideas, methods, instructions or products referred to in the content. |
© 2023 by the authors. Licensee MDPI, Basel, Switzerland. This article is an open access article distributed under the terms and conditions of the Creative Commons Attribution (CC BY) license (https://creativecommons.org/licenses/by/4.0/).
Share and Cite
Curtis, A.J.; McLellan, B.C. Potential Domestic Energy System Vulnerabilities from Major Exports of Green Hydrogen: A Case Study of Australia. Energies 2023, 16, 5881. https://doi.org/10.3390/en16165881
Curtis AJ, McLellan BC. Potential Domestic Energy System Vulnerabilities from Major Exports of Green Hydrogen: A Case Study of Australia. Energies. 2023; 16(16):5881. https://doi.org/10.3390/en16165881
Chicago/Turabian StyleCurtis, Andrew J., and Benjamin C. McLellan. 2023. "Potential Domestic Energy System Vulnerabilities from Major Exports of Green Hydrogen: A Case Study of Australia" Energies 16, no. 16: 5881. https://doi.org/10.3390/en16165881
APA StyleCurtis, A. J., & McLellan, B. C. (2023). Potential Domestic Energy System Vulnerabilities from Major Exports of Green Hydrogen: A Case Study of Australia. Energies, 16(16), 5881. https://doi.org/10.3390/en16165881