Article

Reduction in CO2 Emissions with Bivalent Heat Pump Systems

1
Department of Mineralogy and Geology, Institute of Earth Sciences, Faculty of Science and Technology, University of Debrecen, Egyetem tér 1, H-4032 Debrecen, Hungary
2
Institute of Water and Environmental Management, Faculty of Agricultural and Food Sciences and Environmental Management, University of Debrecen, Böszörményi út 138, H-4032 Debrecen, Hungary
*
Author to whom correspondence should be addressed.
Energies 2023, 16(7), 3209; https://doi.org/10.3390/en16073209
Submission received: 13 January 2023 / Revised: 6 March 2023 / Accepted: 30 March 2023 / Published: 2 April 2023
(This article belongs to the Topic Geothermal Energy Technology and Current Status)

Abstract

:
Utilizing heat pumps has varied benefits, including decreasing the proportion of fossil fuels in the energy mix and reducing CO2 emissions compared with other heating modes. However, this effect greatly depends on the type of external energy and the type of the applied heat pump system. In our study, two different types of heat pumps, three different modes of operation, three different types of auxiliary energy, and three different CO2 emission values from electricity generation were selected to calculate the CO2 emissions related to heating a theoretical house and calculate the CO2 emissions reduction compared with gas firing. According to the calculations, a wide range of CO2 emission reductions can be achieved, from scenarios where there is no reduction to scenarios where the reduction is 94.7% in monovalent mode. When operating in a bivalent mode, the values are less favorable, and several systems show no reduction, particularly when operating in an alternate mode at a bivalent temperature of 2 °C. However, the reduction in fossil CO2 emissions can be kept at a high value (up to 56.7% with Hungary’s electricity mix) in a bivalent system by using biomass as a resource of auxiliary energy and geothermal heat pumps, which is very similar to the CO2 emission reduction in monovalent systems (54.1%).

1. Introduction

In the EU, which is the world’s third largest primary energy consumer [1], energy production for heating and cooling accounts for almost half of the total energy consumption [2]. The energy demand for heating and cooling purposes can be supplied in several ways, and the current trend shows the massive use of non-renewables in many countries. For instance, even in the so-called developed countries forming the European Union, 77% of the energy used is non-renewable [1]. This entails a significant amount of CO2 emissions, which must be reduced by increasing the share of renewables in the energy mix of this sector. The pressure is high on the decision-makers, and within the frame of the European Green Deal, a major goal is clearly stated, which is to make Europe the world’s first climate-neutral continent by 2050, while in the meantime, by the end of this decade, the EUs greenhouse gas emissions must be reduced by at least 55% of the total emissions of 1990 [3]. The means of this reduction cannot be implied without detailed knowledge of the possibilities in all the related fields, and calculations of CO2 emissions from heat production solutions are part of that.
Geothermal energy is a widely used renewable energy source. Ground-source heat pumps (GSHPs) are the dominant sector of geothermal energy in terms of installed capacity, produced energy, and increasing intensity [4]. Heat pumps use an external energy source to transport heat from sources with lower temperatures to spaces with higher temperatures [5]. Ambient energy is stored in the elements of the environment: the air, surface water, groundwater, or underground space (Figure 1). In the case of air and water, the fluid containing the heat flows directly through the heat pump as an open system, and the cooled fluid is returned to the reservoir without significant cooling. Heat carrier fluids in closed pipes are required when the stored energy in the solid underground space is used in the heat pump system. In these systems, the cooled heat carrier fluid returns to the zone of heat extraction, and the reservoir around the underground heat exchanger cools significantly. Using heat pumps does not require ideal geothermal conditions in the conventional sense, as air sources and closed systems can be installed almost anywhere, unlike groundwater-based systems, which depend on aquifers. Therefore, assessments of the planning options encompass the majority of geological regions, particularly those near settlements [6,7,8,9,10,11,12], where most of the population uses approximately 75% of natural resources. A wide range of environmental problems must therefore be handled, including the environmentally friendly heat supply of buildings [13].
Calculating the heat demand of buildings is a complicated design task because the calculated value strongly depends on the difference between the inner and outer temperatures [14,15]. Therefore, the heat demand duration curve, which is the green line in Figure 2, is derived from the temperature duration curve of the daily mean temperature values. In the so-called monovalent mode, the heat pump is supplying all of the heat demand, even on the coldest days. As a result, the system only operates at full capacity on a few days of the year.
In the bivalent mode, an auxiliary heating system, such as a natural gas or electric boiler, is used to increase the amount of heat produced. In bivalent-alternate mode, the auxiliary heating provides all of the heat demand below a certain set temperature, which is also known as the bivalent point, so the heat pump cannot operate. In the bivalent-parallel mode, the heat pump operates at its full capacity below the bivalent point, and the remaining heat demand is covered by the auxiliary heating below this temperature (Figure 2). Above this temperature, the heat pump supplies the heat demand in both cases. Consequently, the heat demand duration curve can be used to determine the number of days in a year when the daily mean temperature is below the bivalent points, which means that supplementary heating is needed. The use of the two systems together can be applied throughout the entire year in both parallel and alternating modes. In such cases, the operation unit is usually more complex, and the current weather, economic environment, environmental impacts, and the owner’s choice of systems will determine the proportion of the systems that will be used. The pattern of how such systems will work cannot be predetermined by the heat demand duration curve. The bivalent mode can produce higher temperatures in the heating space than monovalent systems and is usually installed during renovation or by supplementing ASHP systems [5]. Another advantage of bivalent systems is that the maximum power required is significantly less than the power needed in the monovalent mode; hence, the smaller heat pump, the underground heat exchanger unit, and the smaller well yield are enough. They are beneficial in a variety of situations, such as when investors aim to reduce the payback period or when resources, such as the transmissivity of the aquifer, are limited. In addition to the economic advantages, well-planned, complex systems have fewer negative environmental effects, and they can be customized to the geological, topographical, and meteorological conditions of the investment site [16,17].
The efficiency of heat pumps can be described by the coefficient of performance (COP), which is the ratio of the delivered energy and the external energy used in the heat pump [5]. Thus, a higher COP value means a smaller amount of required external energy for a given heat demand, causing lower operational costs and fewer environmental effects on the surface. The seasonal performance factor (SPF) is a similar parameter, but in this case, the annual energy values are used.
Based on the life cycle analysis (LCA) of heat pump systems, the most significant environmental effect of using electric heat pumps is the CO2 emissions during electricity generation, and most of the CO2 emissions are related to the operation and not to the manufacturing or disposal phases [18,19,20,21]. Moreover, monovalent heat pump systems have a proven ability to reduce CO2 emissions compared with other heating systems. Jenkins et al. [22] studied shallow GSHP systems that were installed in the United Kingdom (UK) and the effect of the operating system on the CO2 savings, as opposed to gas boiler systems. Their calculations have an hourly temporal resolution. This study concluded that a 0–40% CO2 emission reduction can be achieved depending on the heating system’s inlet temperature. With an inlet temperature of 55 °C and an unfavorable energy mix (above 0.55 kg CO2/kWh), it may be possible that the GSHP will not perform better than the gas boiler in terms of CO2 emission savings or financially. The calculations of Jenkins et al. [22] were based on the characteristic curve of one chosen heat pump device.
Blum et al. [23] were examining CO2-saving rates achieved by using borehole heat exchangers in the region of Baden-Württemberg (BW), Germany. The calculations were carried out based on the data of 1105 installed GSHP systems. The CO2 emissions associated with the heat pump operation were calculated at an average annual operating time of 2000 h and a COP value of 4. The calculated CO2 savings were estimated at 35% based on the German federal state electricity mix, but if the BW state mix is taken into account, the savings reach 72%.
In a Europe-scale overview, Bayer et al. [24] estimated how much CO2 emission savings each country could achieve by using GSHPs with an SPF value of 3.5. They based their calculations on the data of the registered heat pump systems in each country. The share of CO2 savings associated with heating in the national energy mix was not significant in the last year studied (2008), except for Sweden (35.85%). According to their estimates, GSHP systems can reduce CO2 emissions in Europe’s heating sector by up to 30%.
Leerbeck et al. [25] assessed the CO2-saving effect of heat pump heating based on the detailed hourly heat demand of reference buildings in Denmark. The model calculated expected emission reductions between 0 and 20%. In the study, not only were the national-specific emissions calculated, but also the specific value of the marginal generator, which can differ significantly from the average. Sevindik et al. [21] compared the environmental impacts of heat pumps and gas boilers in the UK by performing LCA. The estimated SPF values were 2.8 for ASHP and 3.2 for GSHP, and they concluded that heat pump solutions provide CO2 savings of over 50%, which can increase if the specific values of the electricity mix of the UK are reduced. However, LCAs also show that heat pump systems are less efficient than gas boilers in some respects, for example, due to the ozone-depleting effect of the refrigerant.
Recently, several studies have evaluated the advantages of heat pump systems in Poland. Sewastianik and Gajewski [26] studied the effects of various heat pump systems in several large cities. The heat demand was defined as a linear function of the outdoor temperature. The results of the SPF calculations, into which a buffer tank loss was included, ranged between 3 and 3.8 for ASHPs, 4 and 5.5 for GSHPs, and 4 and 6 for groundwater-source heat pumps (GWSHPs). Higher values were obtained for buffer tank temperatures that were adjusted to ambient temperature. The results show that, at the current energy mix in Poland, heat pump systems do not provide CO2 savings compared with gas firing. However, Fidorów-Kaprawy and Stefaniak [27] indicated that the basis of comparison for GSHPs for cooling should be electric air conditioning systems instead of gas boilers, which would provide comparative CO2 savings. Gradziuk et al. [28] emphasized the financial benefits of installing heat pump systems, which are realized regardless of whether or not the systems perform CO2 savings.
Analyses of bivalent systems are mainly concerned with a given type of ambient, external, and auxiliary energy. In the case of hybrid systems, the bivalent point is not fixed, but it is optimized for the current economic and energy conditions of operation [29,30,31]. Studies on them are scarce, and they usually focus on ASHPs with gas boilers. The primary energy cost and CO2 emissions range from 0% to 50%. Klein et al. [32] provided the heat demand of reference buildings using ASHPs and gas water heaters; they performed software-based energy calculations, and the heat pump data was read from the characteristic curves of the different heat pumps. It was found that primary energy savings, which can be achieved using heat pumps in the cases of original houses and retrofitted houses, are 12% and 26%, respectively, compared with conventional gas boiler heating. In addition, it was concluded that the bivalent operation solution was even beneficial for the heat pump.
Bagarella et al. [33] used TRNSYS to determine the energy and cost ratios for the parallel operation of an ASHP and a boiler at different bivalence temperatures, defining the parameter values needed to optimize the systems. Mondot et al. [34] suggested a detailed heat demand calculation with hourly values, and the COP was derived from a table as a function of the outlet water temperature and the outdoor temperature. A sensitivity analysis was carried out using 5000 case studies with different model variants, and the results helped increase the adoption of hybrid systems. Neubert et al. [35] measured and simulated the operating conditions of a hybrid system in a multifamily house in Germany for different operating strategies, e.g., predefined bivalent point, cost-optimized operation for CO2 emissions, and primary energy use. The heat demand is modeled in detail, the ASHPs COP calculation is curve-based, and its average value is 2.65. In the studied system, CO2 emissions can be reduced by 22% with the current energy mix, which could be increased to 61% in the future carbon-neutral grid. Dongellini et al. [36] investigated an ASHP, an electric boiler, and a gas boiler heating system with TRNSYS, testing several control modes under the climate of Italy. The primary energy minimum was determined, and they concluded that savings of 22% can be achieved in comparison with the gas boiler.
Hackel and Pertzborn [37] studied the advantages of GSHP hybrid systems based on three case study sites compared with monovalent heat pump systems. The results indicate that similar CO2 emission-saving hybrid systems are cost-effective compared to the monovalent system.
Further deployments of bivalent heat pump systems are possible, especially in areas where a gas network system is not available or cost prohibitive; it is also necessary to spatially extend the studies if the role of heat pump systems in Europe is to be increased. This present research aims to analyze the CO2 emissions of theoretical bivalent systems, both air source heat pump and groundwater-source heat pump (GWSHP) systems, with different auxiliary energy sources, bivalent points, and energy mixes in a location with a continental climate in Hungary, based on heat demand determination with a daily frequency. The calculations help determine the CO2 savings that can be achieved with different deployments, which is increasingly considered a design priority.
Neither monovalent nor bivalent GWSHP systems have been analyzed from the aspect of CO2-saving potential in previous studies; thus, the results obtained are valid for most EU countries.

2. Methods

Energy demand and heating of real and theoretical buildings with renewable energy (biomass and monovalent heat pump systems with different sources) were discussed in our previous studies [38,39], while the analysis of bivalent systems is presented here.
The heat demand of a building is based on several parameters, such as heat loss through the walls, ceiling, basement, air ventilation, solar gain, internal heat production, etc. [14,15,40]. In an older, non-renovated house, the proportions of solar gain and internal heat production are low, and the losses mainly depend on the difference between the indoor and outdoor temperatures, as a linear function. In the calculations, indoor temperature (Tin) was 20 °C, as heating is needed when the outdoor temperature drops below the base temperature (Tb), which is 12 °C based on Hungarian regulations. The temperature distribution of East Hungary was studied between 1961 and 2010 and was derived from the CARPATCLIM Database © [41] and the annual distribution parameters of daily mean temperature were calculated for Debrecen, East Hungary (Figure 3).
Heating degree day of a certain day can be calculated by applying Equation (1).
H D D i = 0 , T o , i > T b T i n T o , i , T o , i T b
where HDDi is the daily heating degree days of the i-th day, °C·d; Tin is the indoor temperature (here, 20 °C), °C; To,i is the daily outdoor temperature on the i-th day, °C; and Tb is the base temperature (here, 12 °C), °C.
H D D = i = 1 365 H D D i
where HDD is heating degree days in a heating season, °C·d; i is the count of the day. The calculated HDDi values are presented in Figure 3, while the annual sum was determined as 3156.4 °C·d.
Daily heat demand (Qi, MJ) is the sum of the energy for space heating and energy for domestic hot water (DHW) production each day. Assuming a linear function between energy for space heating and the heating degree day, a specific heat demand (q, MJ/°C) can be defined. Daily energy demand of DHW production (QDWH,i, MJ) was calculated for 4 people as the amount of heat required to increase the temperature of m = 264 kg of water by ΔT = 40 °C on each day of the year; the specific heat capacity c = 4.175 kJ/(kg°C).
Q D W H , i = c · m · T = 44.09   M J
and
Q i = q · H D D i + Q D H W , i
The sum of the daily heat demands is the annual heat demand (Q, MJ), as in Equation (5).
Q = i = 1 365 Q i = i = 1 365 q · H D D i + Q D H W , i
In the study area, the minimum outdoor temperature (To,min) for designing is −15 °C. Based on the previous analyses, a heat pump with a power of 10 kW is suitable to heat the theoretical building. The specific heat demand is taken as 23.426 MJ/°C and is calculated by applying Equation (6).
q = Q i , m a x Q D H W , i H D D i , m a x = P · τ Q D H W , i T i n T o , m i n = 23.426   M J / ° C
where Qi,max is the maximum daily heat demand, MJ; HDDi,max is the daily heating degree days of the coldest day, °C·d; P is the power of the heat pump, MW; τ is one day in seconds, s/d; Tin is the indoor temperature, °C; and To,min is the daily outdoor temperature on the coldest day, °C.
Equation (4) was used to calculate the daily heat demand for each day of the heating season with this specific heat demand value, and the annual heat demand of this building was calculated based on Equation (5), which was determined to be 90.00 GJ/y (73.91 GJ/y for space heating and 16.09 GJ/y for DHW production).
The calculation of the CO2 emissions associated with the operating heat pumps was based on the technical data of two real heat pumps [42,43]. These data depend on the temperature of the heat source, so the general application of a COP value is needed.
C O P i = Q H P , i Q e x t , i
thus
Q e x t , i = Q H P , i C O P i
where COPi is the coefficient of performance of the heat pump on the i-th day (dimensionless); QHP,i is the energy delivered by the heat pump on the i-th day, MJ; and Qext,i is the external energy needed for the heat pump on the i-th day, MJ.
Data of a WPL 13 E cool-type air/water heat pump and a WPF 10 M-type brine/water heat pump were used; the inlet temperature of the indoor loop was 50 °C in both cases. The dependence of the air source heat pumps’ operation parameters on the air temperature read from a chart of [42] is presented in Figure 4 and Equation (9).
C O P i = 2.9 + ( T o , i 7.8 ) · 0.035 | T o , i < 7.8 2.9 + ( T o , i 7.8 ) · 0.083 , | 15.0 > T o , i 7.8 3.5 + ( T o , i 15 ) · 0.060 , | T o , i 15.0
where COPi is the coefficient of performance of the heat pump on the i-th day, and To,i is the daily outdoor temperature on the i-th day, °C.
The COP value is derived from the characteristic curve of WPF 10 M at the temperature of the groundwater (10 °C). In this case, the COP value of the GWSHP is 3.67, which is independent of the outdoor temperature.
For each day the daily heat demand, Qi was determined based on the HDDi (Equation (4)). In monovalent mode or in bivalent mode above the bivalent point, all of the heat is supplied by the heat pump (Equation (10)); hence, the required auxiliary energy is zero. In the case of bivalent-parallel systems, the heat pump supplies constant heat below the bivalent point, which is equal to the heat demand exactly at the bivalent point (Qi,B), which is determined on the basis of Equation (11).
Q H P , i = Q i , | m o n o v a l e n t Q i , | b i v a l e n t   T o , i > T B Q i , B , | b i v a l e n t p a r a l l e l   T o , i < T B 0 , | b i v a l e n t a l t e r n a t e   T o , i < T B
Q i , B = q · T i n T B
where TB is the temperature of the bivalent point, °C; Qi,B is the heat demand at the bivalent point, MJ.
The required external energy is calculated using Equation (8). The heat demand supplied by auxiliary energy is calculated as the difference between the daily heat demand and the heat delivered by the heat pump (Equation (12)).
Q a u x , i = Q i Q H P , i
where Qaux,i is the heat demand supplied by auxiliary energy, MJ.
In bivalent-alternate mode below the bivalent temperature or in systems without heat pump, the entire amount of heat is regarded as auxiliary heat. For each source and heat demand, the specific CO2 emissions are used for calculating the daily heating-related CO2 emissions. These specific emissions (Table 1) are calculated using the following methods.
In the case of electric heating, the heat demand is multiplied by the specific CO2 emissions from the electricity generation. The specific CO2 emissions strongly depend on the energy mix of power generation; a high percent of renewable and nuclear power means low specific emissions, while a high percent of fossil fuels means high specific emissions. The CO2 emissions and the produced electricity data were downloaded from Eurostat and EEA [44,45] for several countries. Their quotient is regarded as the specific CO2 emission, which was 307.5 g CO2/kWh in the case of the Hungarian grid in 2019, which was the latest year that had a complete available data series and was unaffected by the COVID-19 pandemic in the EU. For comparison, two other specific values were used: 35.6 g CO2/kWh as the emissions of a near-carbon-free electricity mix (values of Sweden), and 861.1 g CO2/kWh as the emissions of a fossil fuel–based economy (values of Estonia). These examples are used for further calculations, and the Hungarian example is referred to as “middle” model, while the Swedish and Estonian examples are “low” and “high” models, respectively. Based on the Hungarian grid data, the losses were estimated at 10%, which was taken into account during the calculations in all cases.
CO2 emissions from natural gas firing were calculated with 35 MJ/m3 low heating value and 1.775 kg CO2/m3 specific CO2 emissions. In the calculations, the furnace efficiency value was 90%.
Biomass firing, usually considered a carbon-neutral process, could be used in heat pump systems as solid, liquid, or gas state; however, in this paper, only wood and biogas utilizations were studied. As in parallel studies [39], 17 MJ/kg low heating value and 1.466 kg CO2/kg specific emission values were assumed in wood firing; in addition, 90% furnace efficiency was also used, and the CO2 emissions of the plantation and transportation were either not calculated or negligible in some cases.
The main combustible element in biogas is methane; thus, its specific CO2 emission value by volume is around the value of natural gases. Considering the 60% methane content of the biogas and the 40% CO2 content, the specific heat of the biogas is 60% of the methane’s value (low heating value of 21 MJ/m3), while the specific CO2 emissions are similar (1.791 kg CO2/m3). Additional CO2 emissions derive from biomass production and transportation, with an estimated specific CO2 emission of 35 g CO2/m3 [46]. In the case of direct firing, 90% furnace efficiency was used. In both cases, the carbon content of the biomass was considered in the calculations but handled separately from other emissions.
Annual CO2 emissions can be calculated as the sum of daily CO2 emissions (Equation (13)).
E = i = 1 365 Q e x t , i · e e + Q a u x , i · e a u x
where E is the annual heat pump–related CO2 emission, g/year; ee is power generation–related specific CO2 emission, g/MJ; eaux is the specific CO2 emissions of the auxiliary heating, g/MJ (Table 1).

3. Results

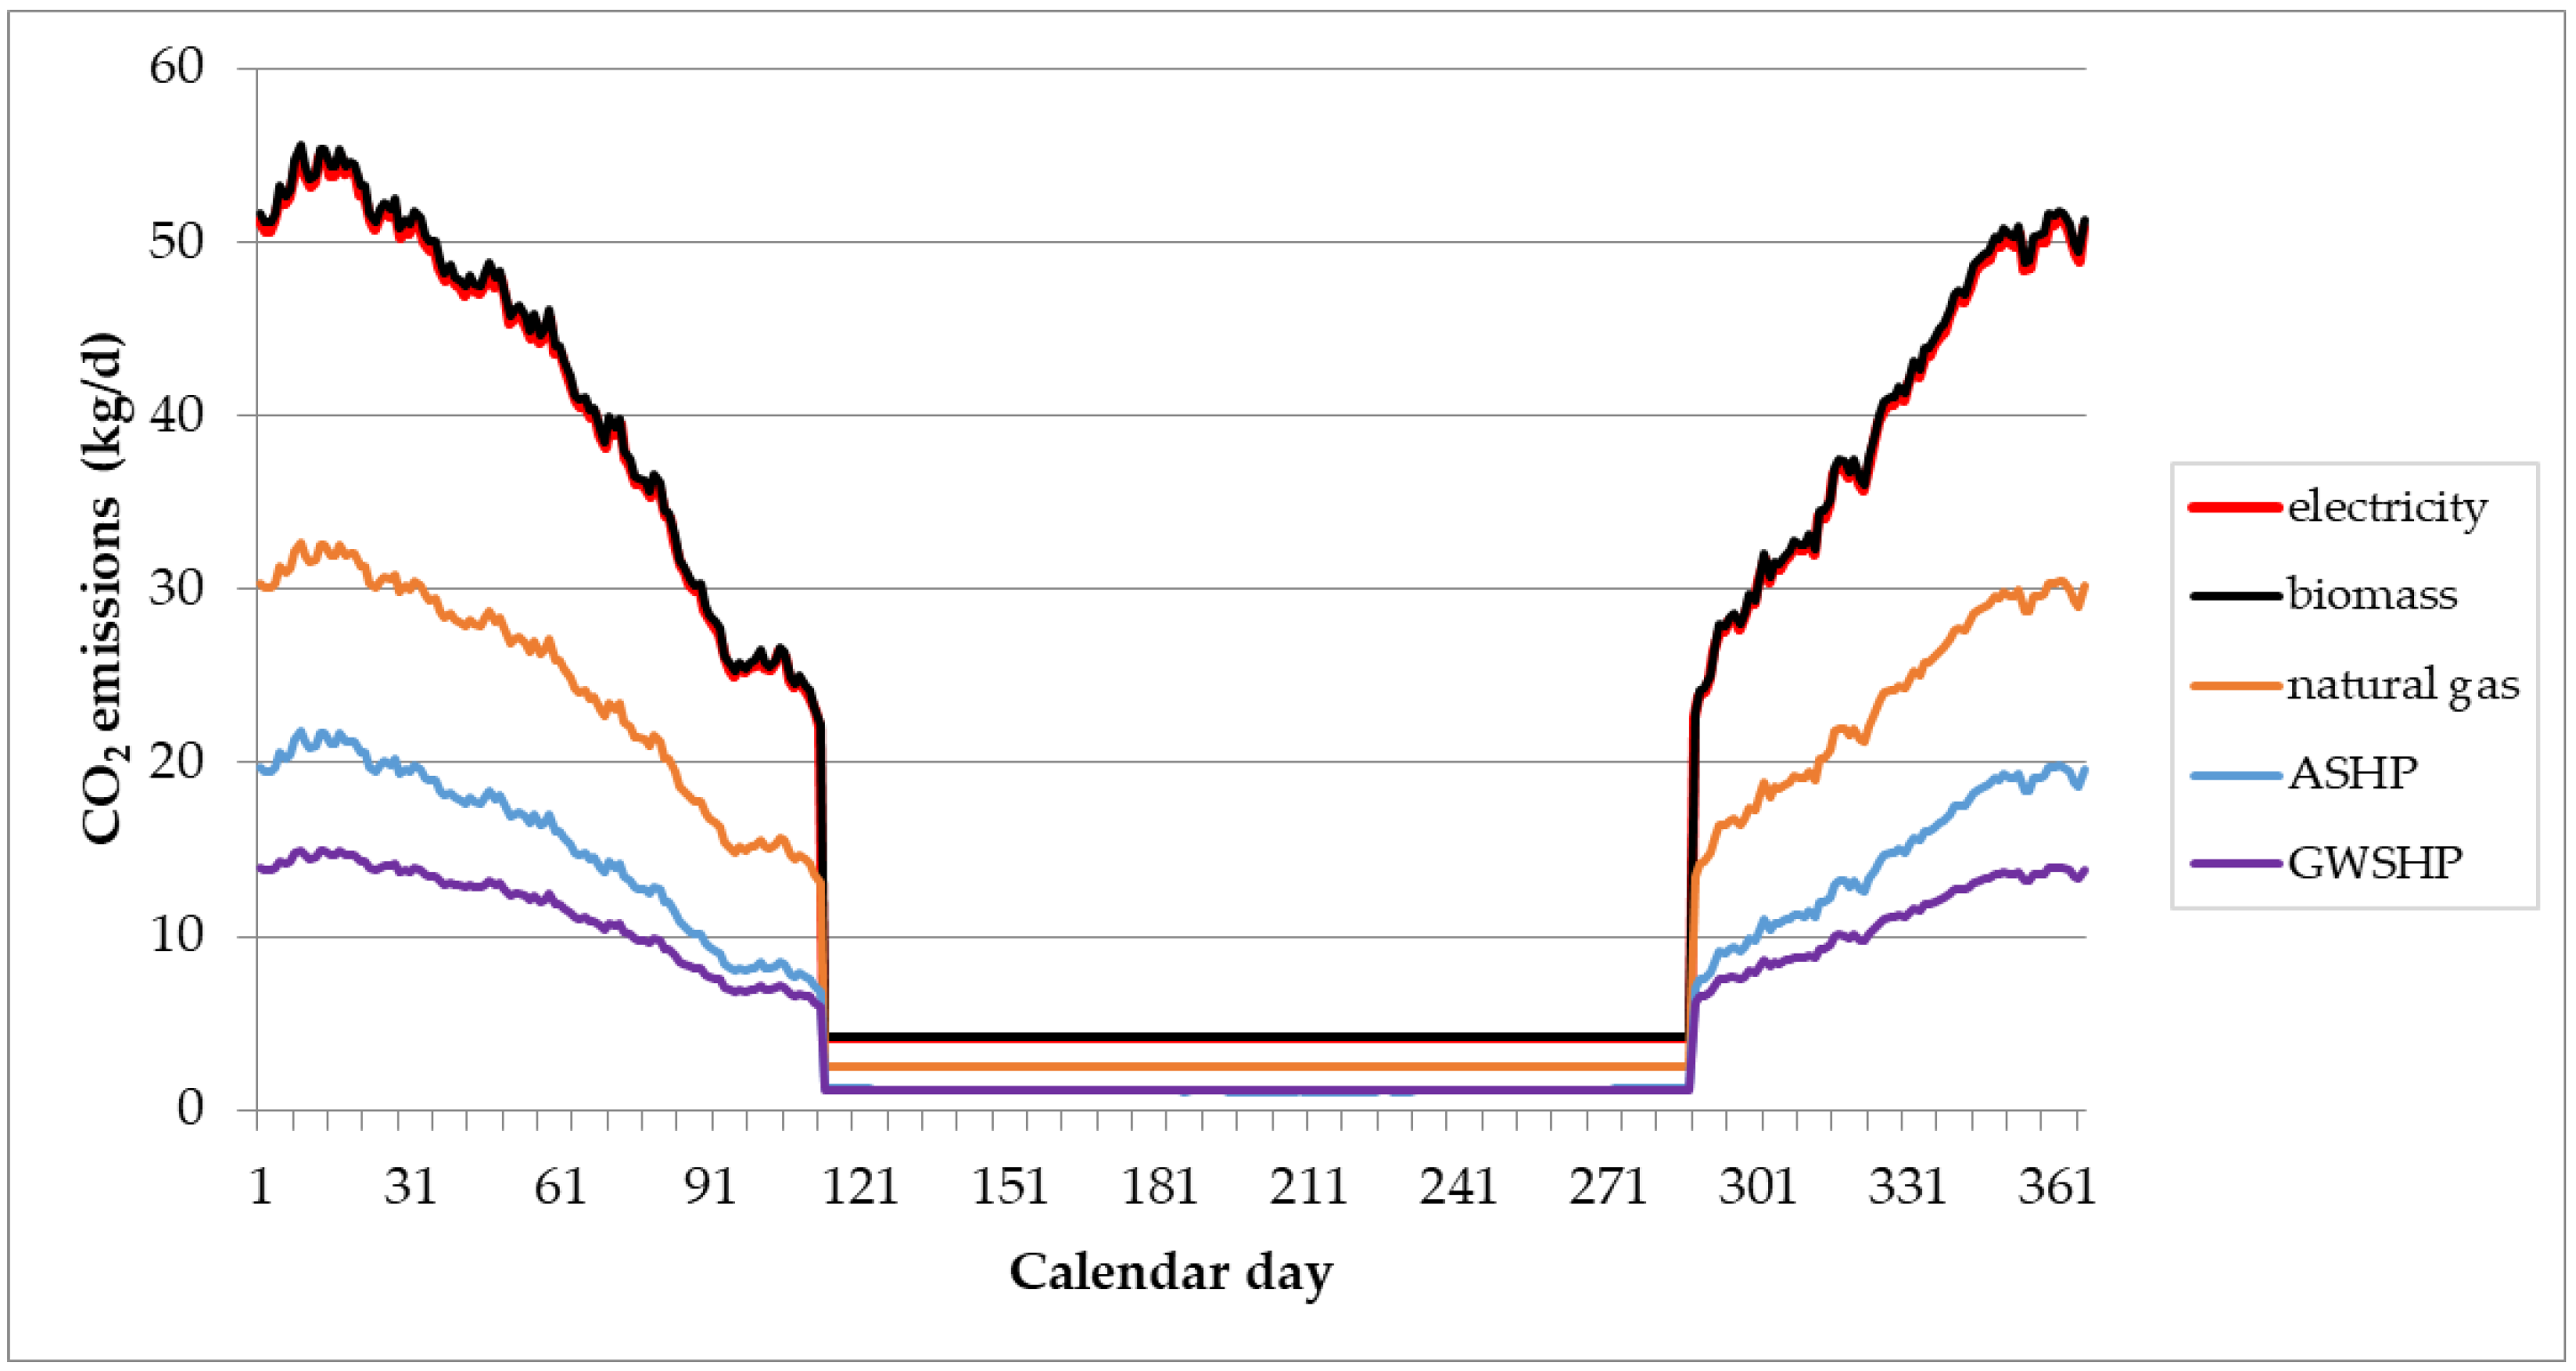
3.1. CO2 Emissions of Monovalent Heat Pump Systems during Heating Season

The daily CO2 emissions of some conventional heating modes and monovalent heat pump systems are given in Figure 5, and the annual sums are shown in Table 2 and Table 3. The specific values of the heating types are insensitive to the outer temperature in the monovalent mode, except for the air source heat pump. In that case, the specific CO2 emissions depend on the climate, since the COP value depends on the ambient temperature.
In the case of electric heating, only the “low” model provides carbon savings, while in countries with middle and high specific CO2 emissions from electricity generation, electric heating has greater CO2 emissions than gas firing. The specific value of biomass firing is similar to the value of “middle” electric heating; hence, their daily values are also similar. However, compared with electric heating and gas firing, biomass firing results in fossil carbon savings (Figure 5).
The CO2 emissions associated with the heat pump systems are strongly dependent on the emissions from electricity generation and the heat source type as well. GWSHP systems have lower CO2 emissions than ASHPs. High CO2 emissions from electricity generation mean zero or low carbon savings even with heat pump systems, while low CO2 emissions from electricity generation can provide more than 90% carbon savings. Furthermore, the CO2 emissions associated with GWSHPs are 24% lower than those associated with ASHPs.

3.2. Daily Energy Demand and CO2 Emissions of Bivalent Systems

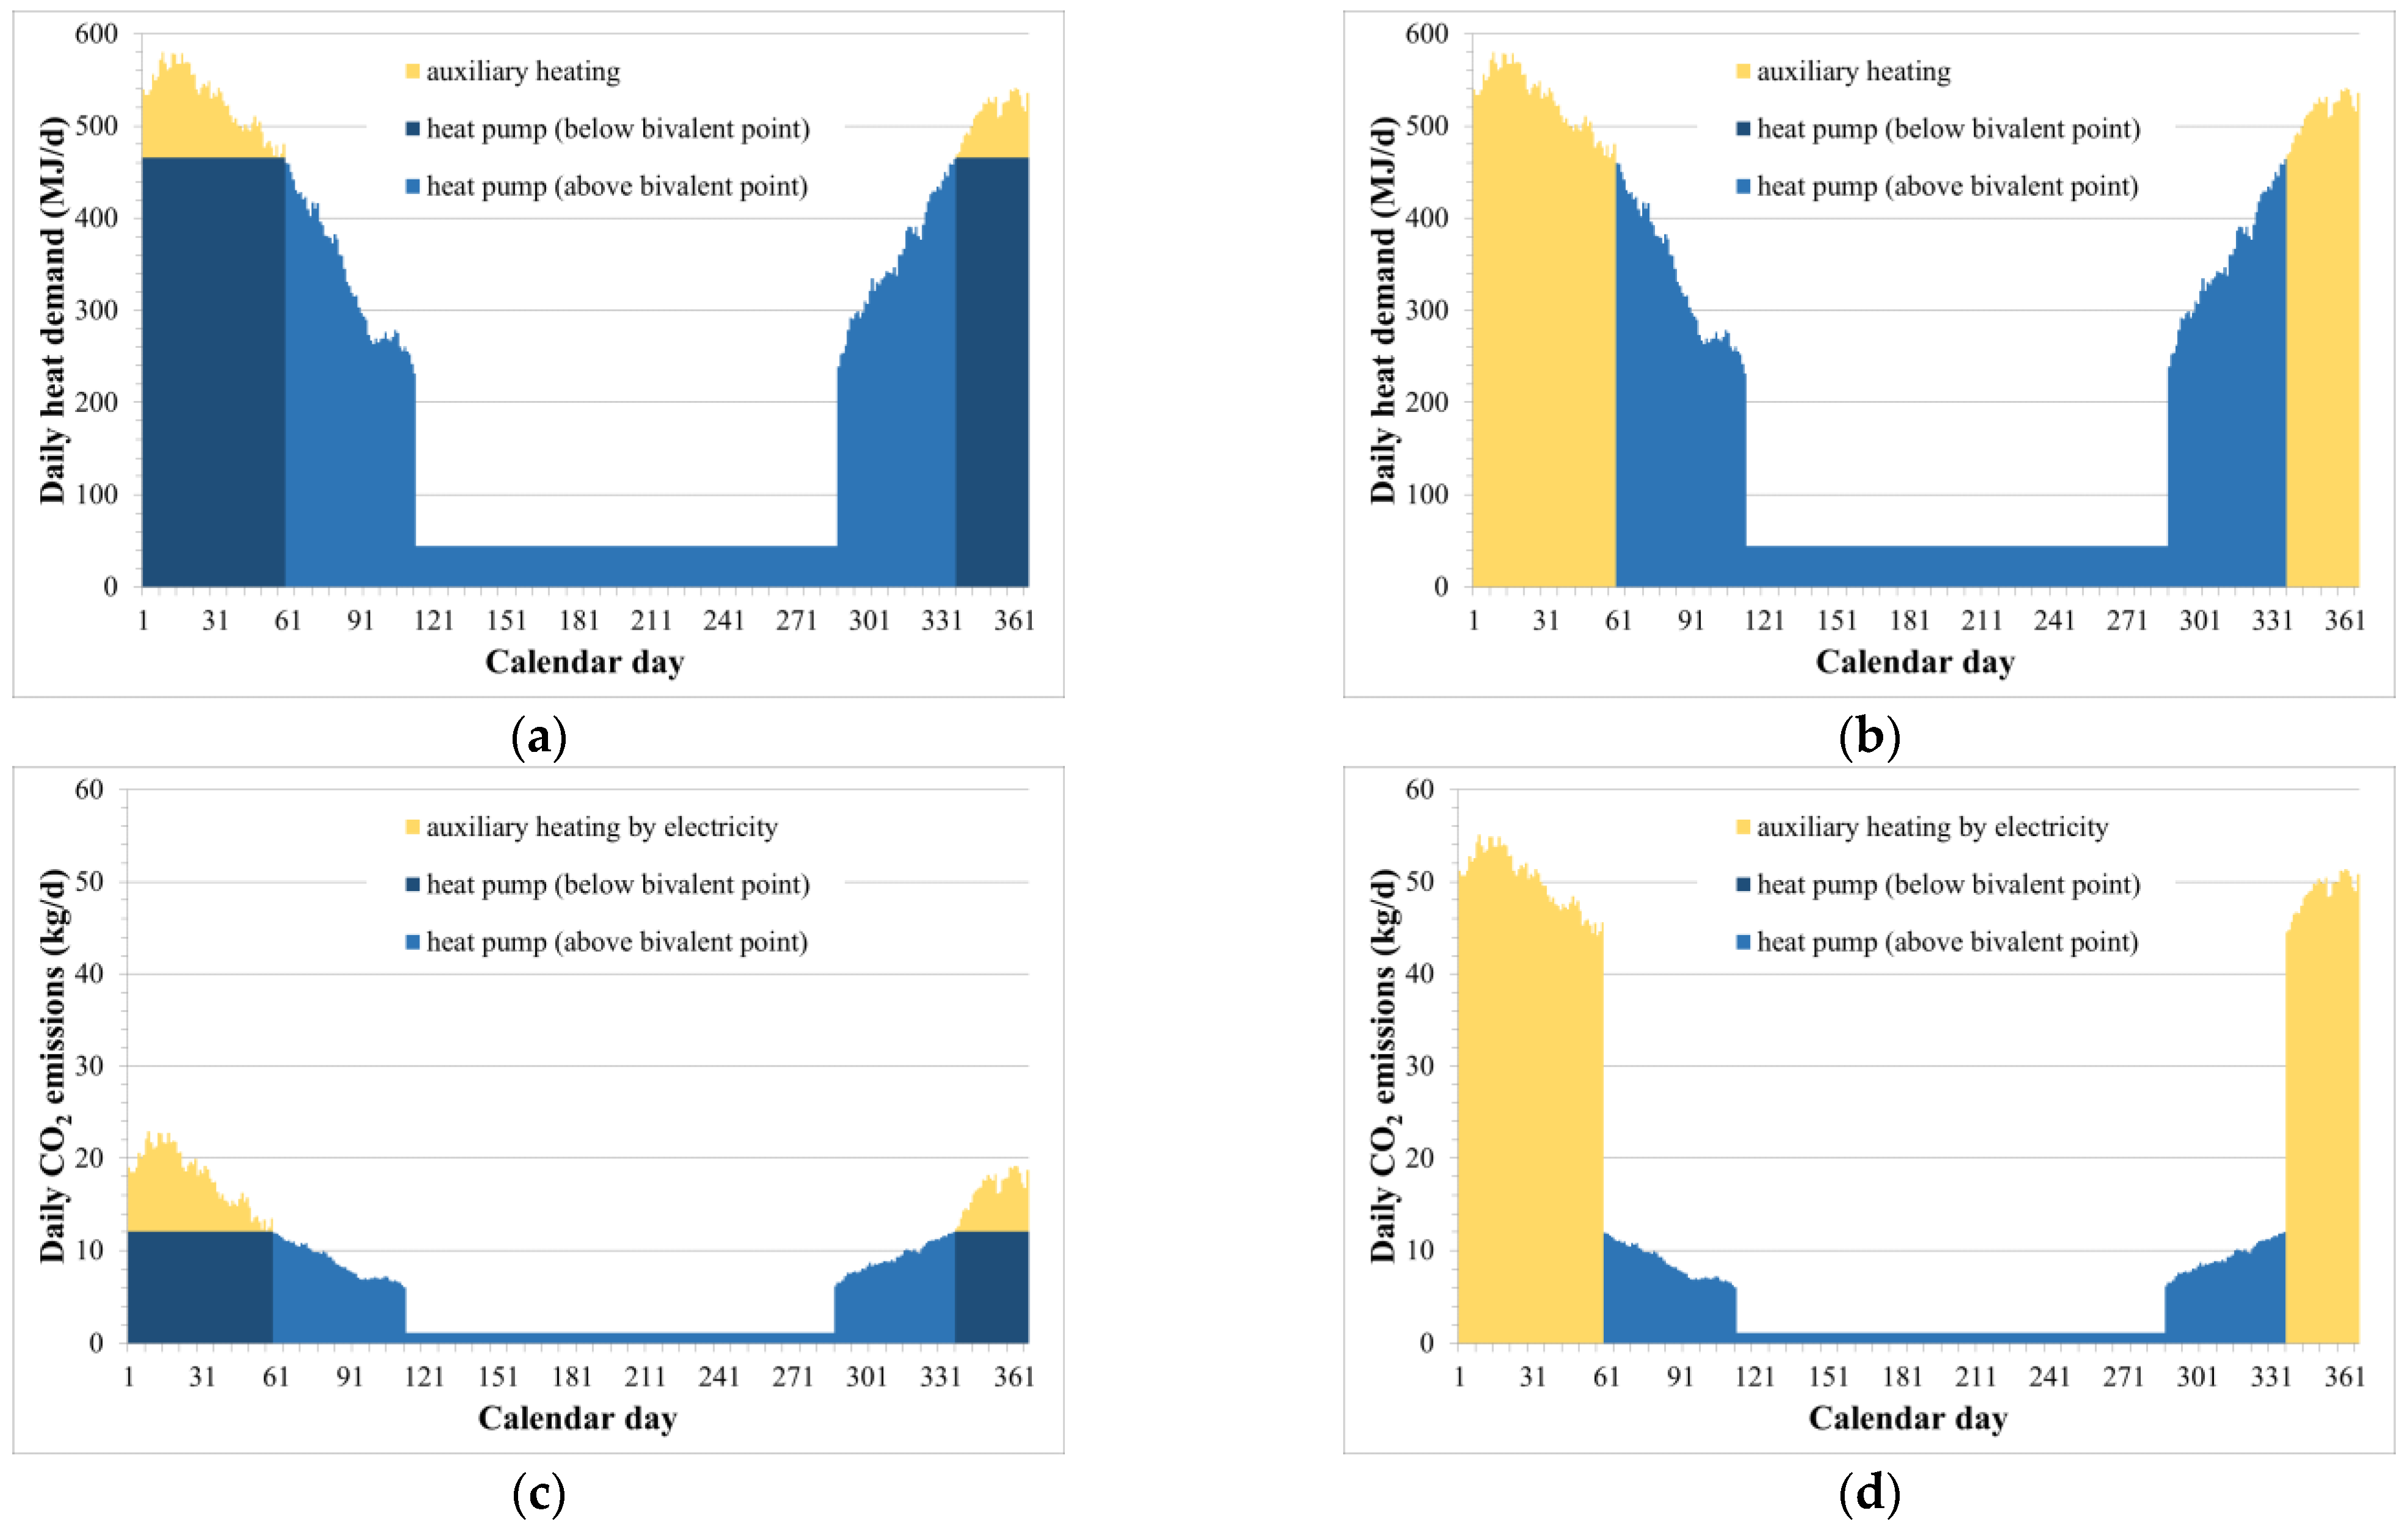
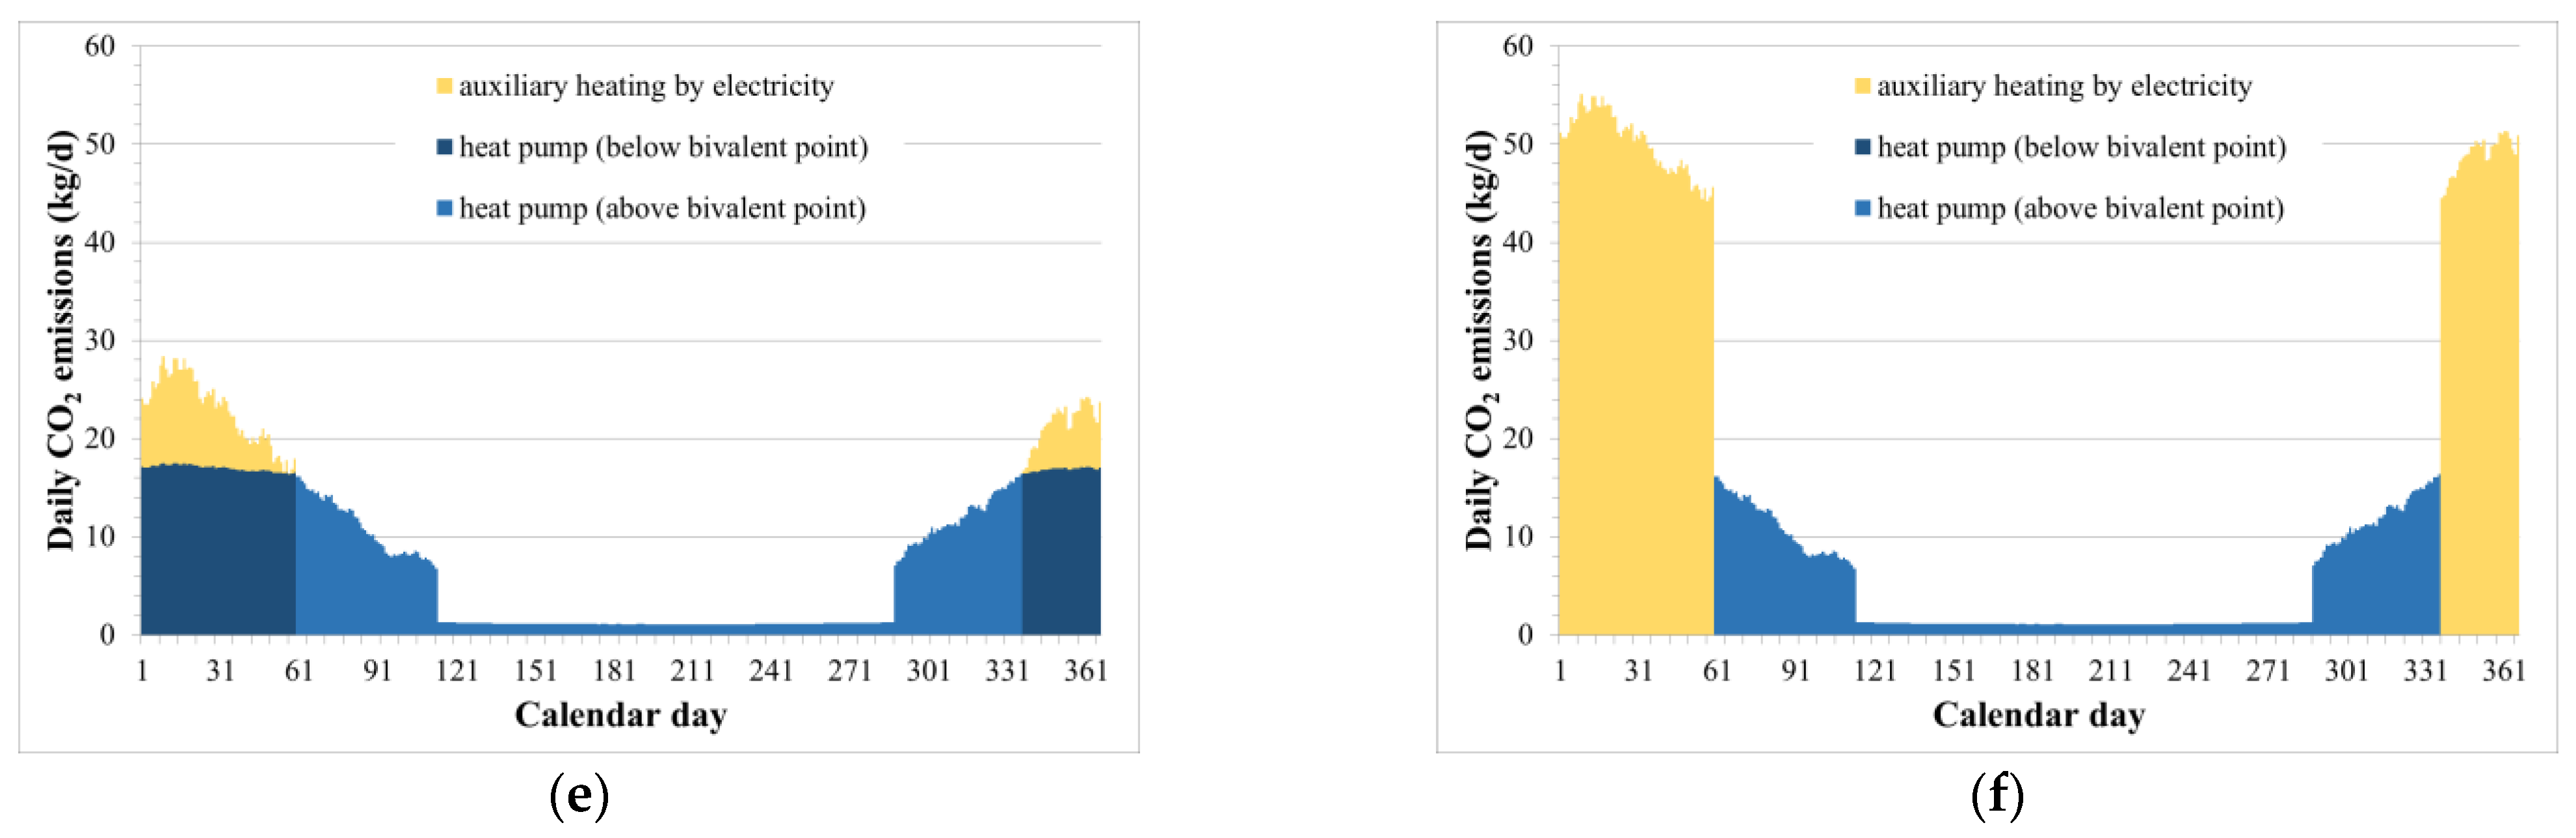
3.2.1. Daily Energy Demand and CO2 Emissions in Systems with Different Source Heat Pump Types: Alternate and Parallel Mode (TB = 2 °C)

The calculated daily heat demand and CO2 values of the different systems are presented in Figure 6. In parallel systems with a bivalent point of 2 °C, 94.2% of the heat demand is provided by the heat pump, but the required power is 51.43% of the required power of a monovalent system performing the same amount of heat. The remaining 5.8% of the heat demand is provided by the auxiliary heating; therefore, the CO2 emissions from electricity are dominant and independent of the auxiliary heat source. In the alternate mode, the heat pump supplies about 48.2% of the demands and auxiliary heating supplies around 51.8%. Therefore, the environmental impact of the latter is more significant.
The important difference between the usage of the two sources is that the COP of an ASHP varies with the outdoor temperature, while it does not vary with a GWSHP, and the COP of a GWSHP is higher due to the higher temperature on the primary side. For these reasons, the CO2 emissions associated with the operations of GWSHP systems supplying the same heat demand are lower. In parallel systems, the QHP and COP values are constant below the bivalent point; therefore, the GWSHPs operation is associated with constant CO2 emissions, while for ASHPs, the CO2 emissions vary. For a parallel operation, there is no significant change in the daily CO2 emissions around the bivalent point, but for an alternate system, if the specific values differ significantly, a significant jump in the curves appears (Figure 6d,f).

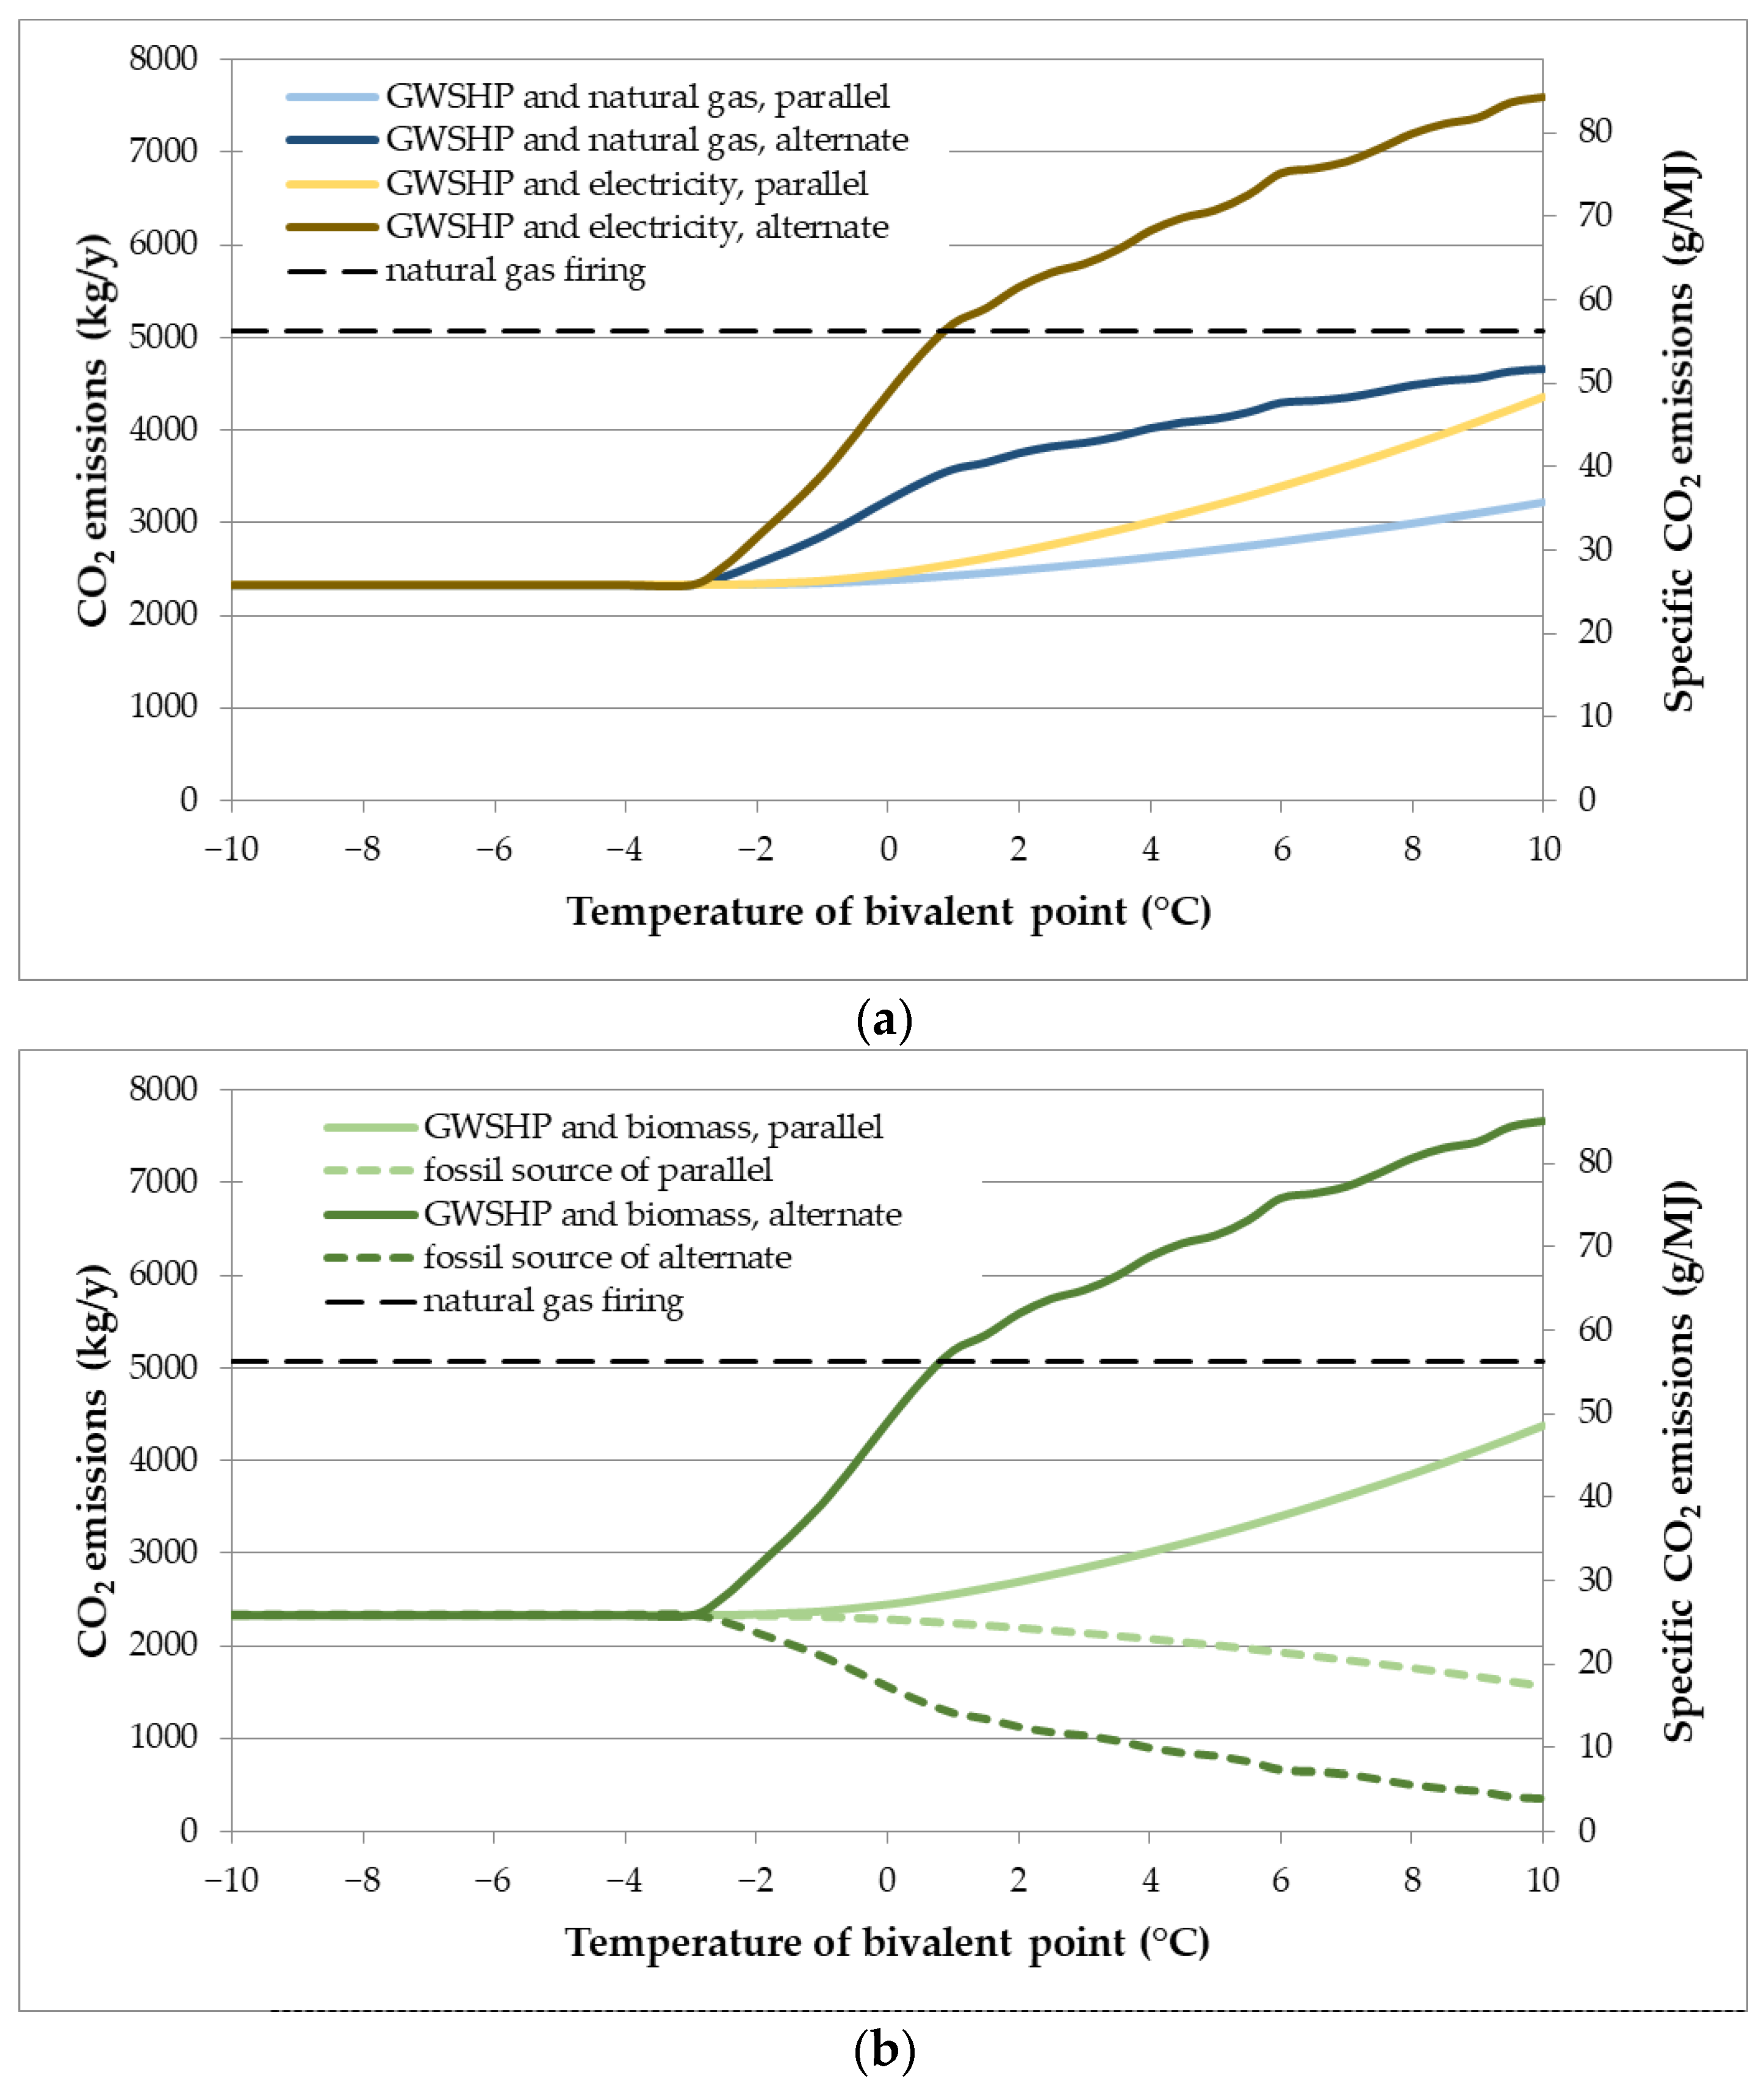
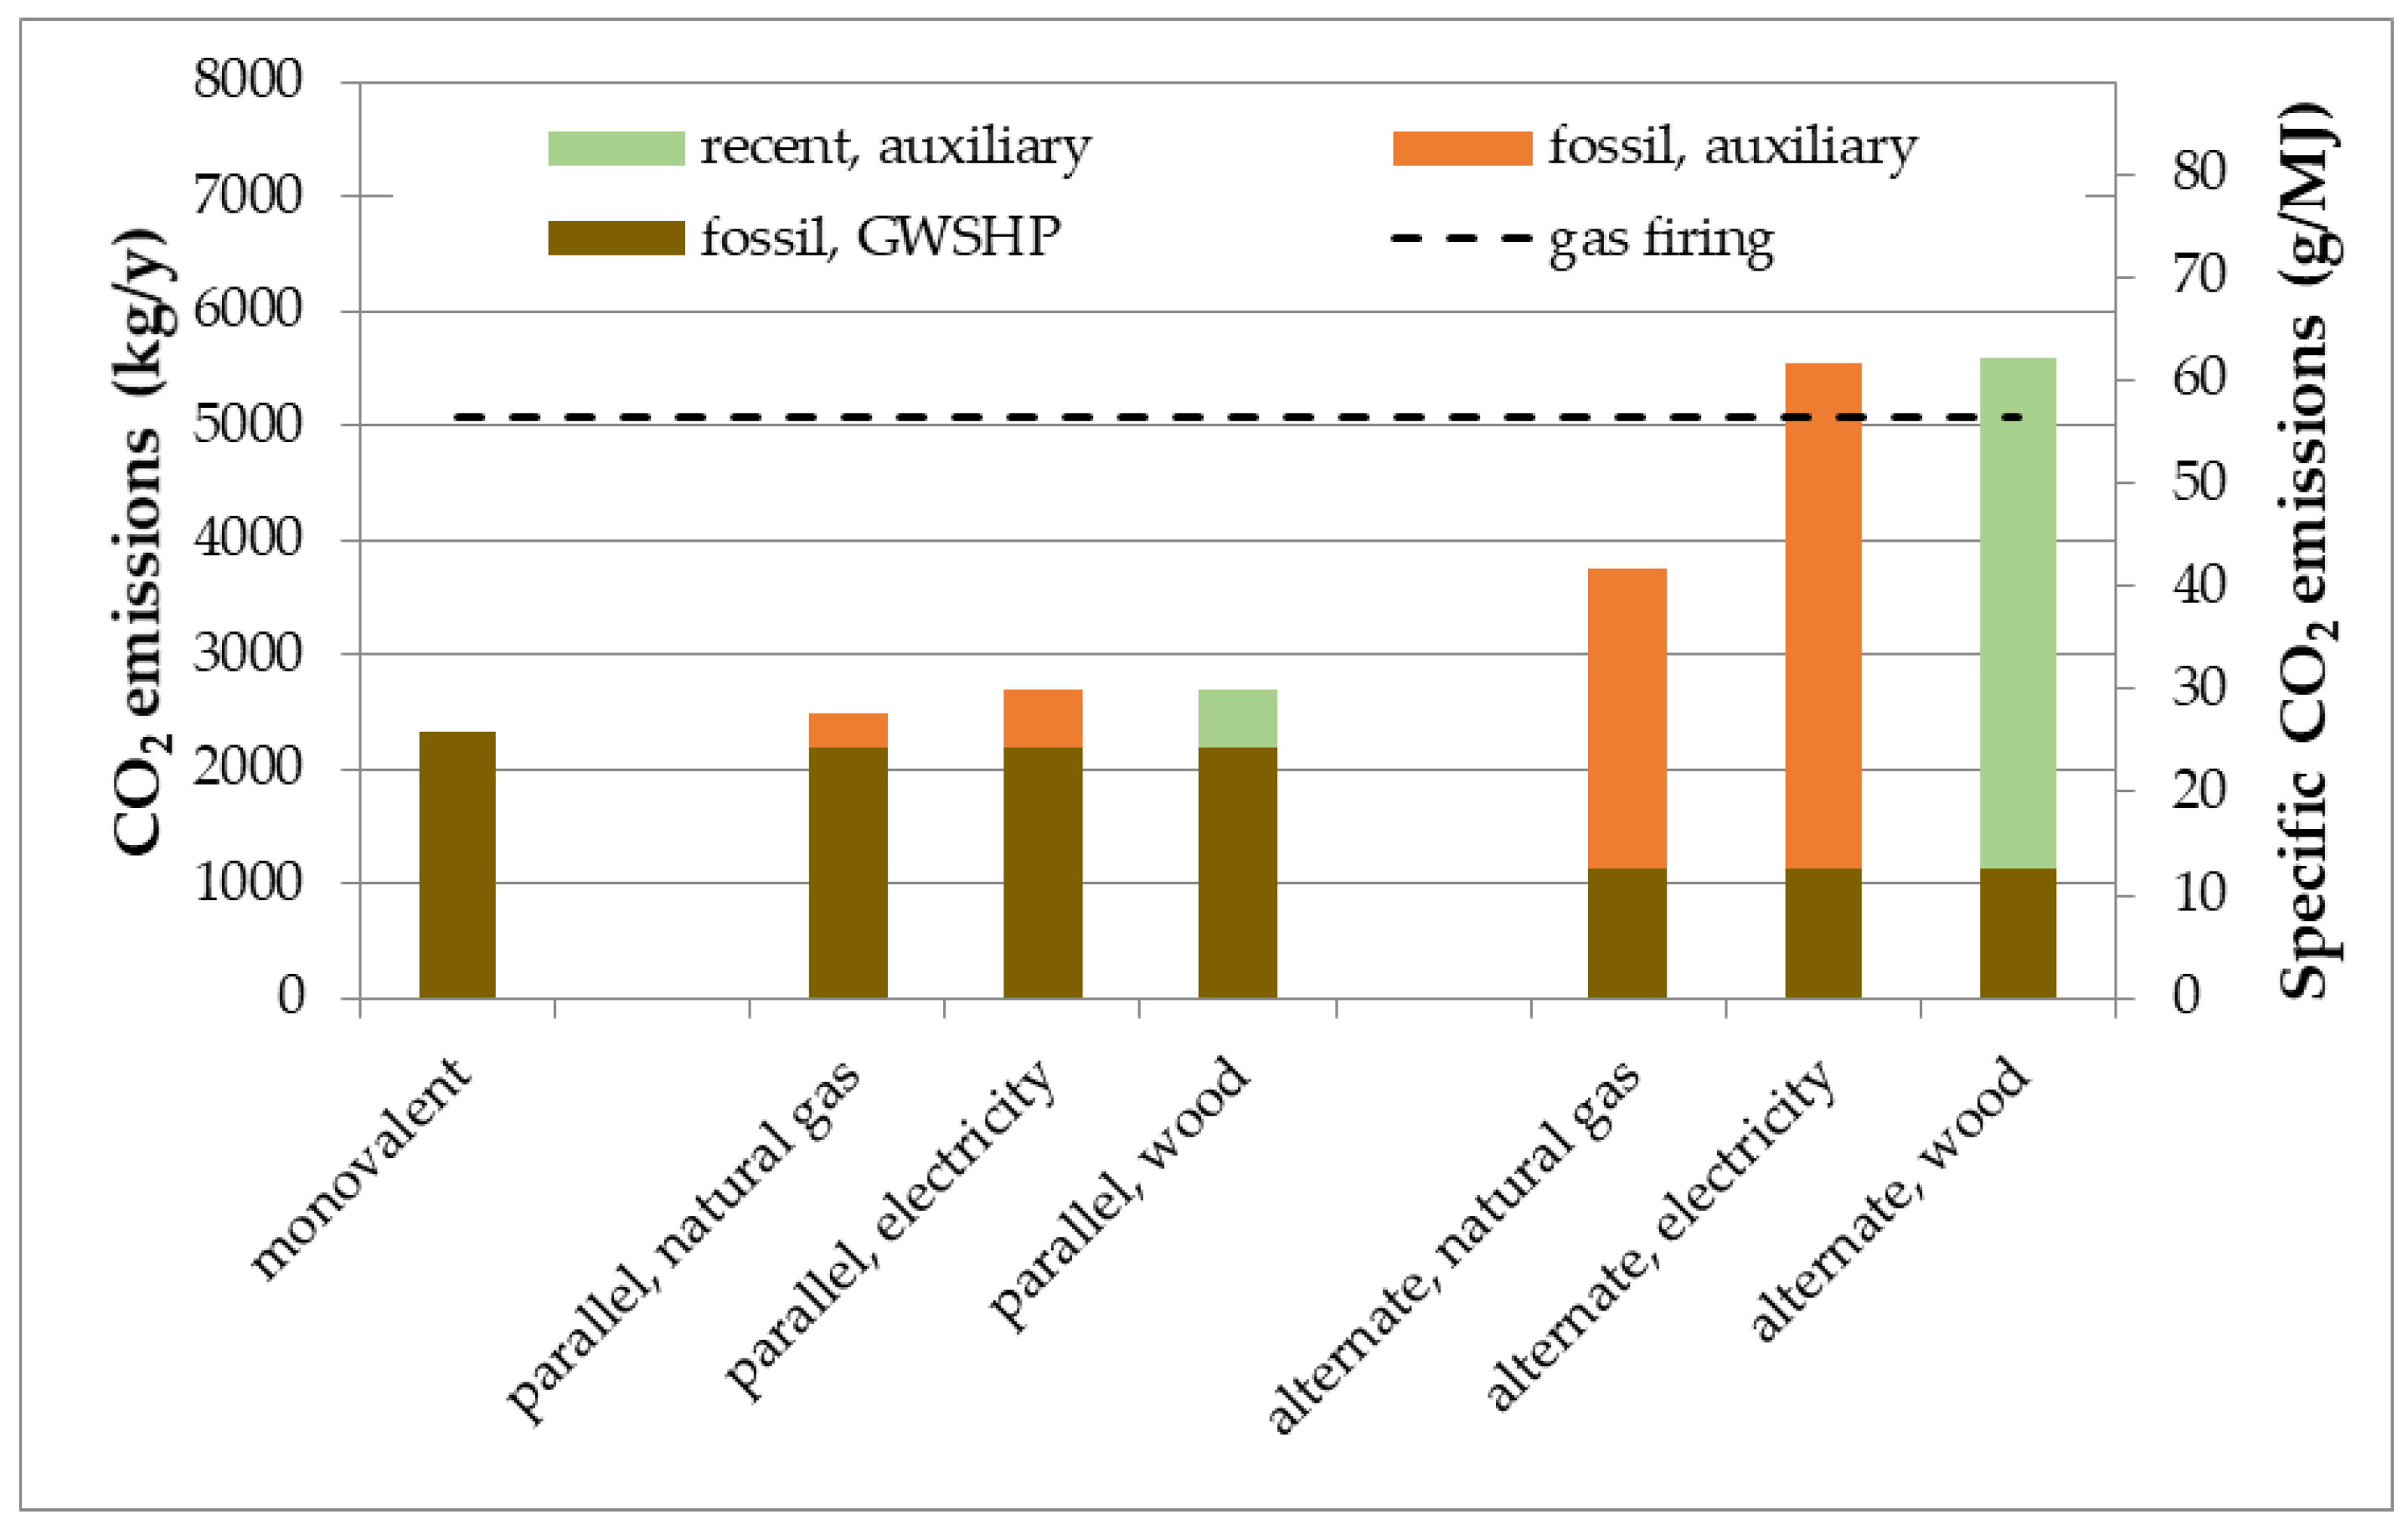
3.2.2. CO2 Emissions in HP Systems with Different Types of Auxiliary Energy in Alternate and Parallel Modes as the Function of the Bivalent Temperature

The application of different types of HPs and auxiliary energy results in noticeably different heating-related CO2 emissions (Table 4). ASHP systems use more electricity, so the associated CO2 emissions are higher. The difference between them is that they are smaller in bivalent systems than in monovalent systems; the difference is 20–22% in the parallel mode and only 4–7% in the alternate mode.
Changes in the bivalent point result in a shift in the proportion of the various heating modes, which also affects the CO2 emissions (Figure 7). A higher bivalent point means a higher dominance of CO2 emissions from auxiliary heating, especially in the alternate mode where this increase is more significant. Usually, the specific CO2 emissions of the auxiliary energy are higher than this value of the HP; hence, the higher bivalent temperature means higher CO2 emissions and, thus, a lower CO2-saving potential. For instance, the CO2-reduction potential in a GWSHP electric heating parallel system changes from 47.1% to 33.2% when the temperature of the bivalent point is 6 °C instead of 2 °C, while in the case of gas firing, this results in a change from 51% to 44.9%. However, utilizing renewable sources such as wood and biogas can reduce the CO2 emissions from fossil sources, even at high levels of total CO2 emissions (Figure 7b); in this aspect, the alternate mode has a higher fossil CO2-saving potential than the parallel mode.

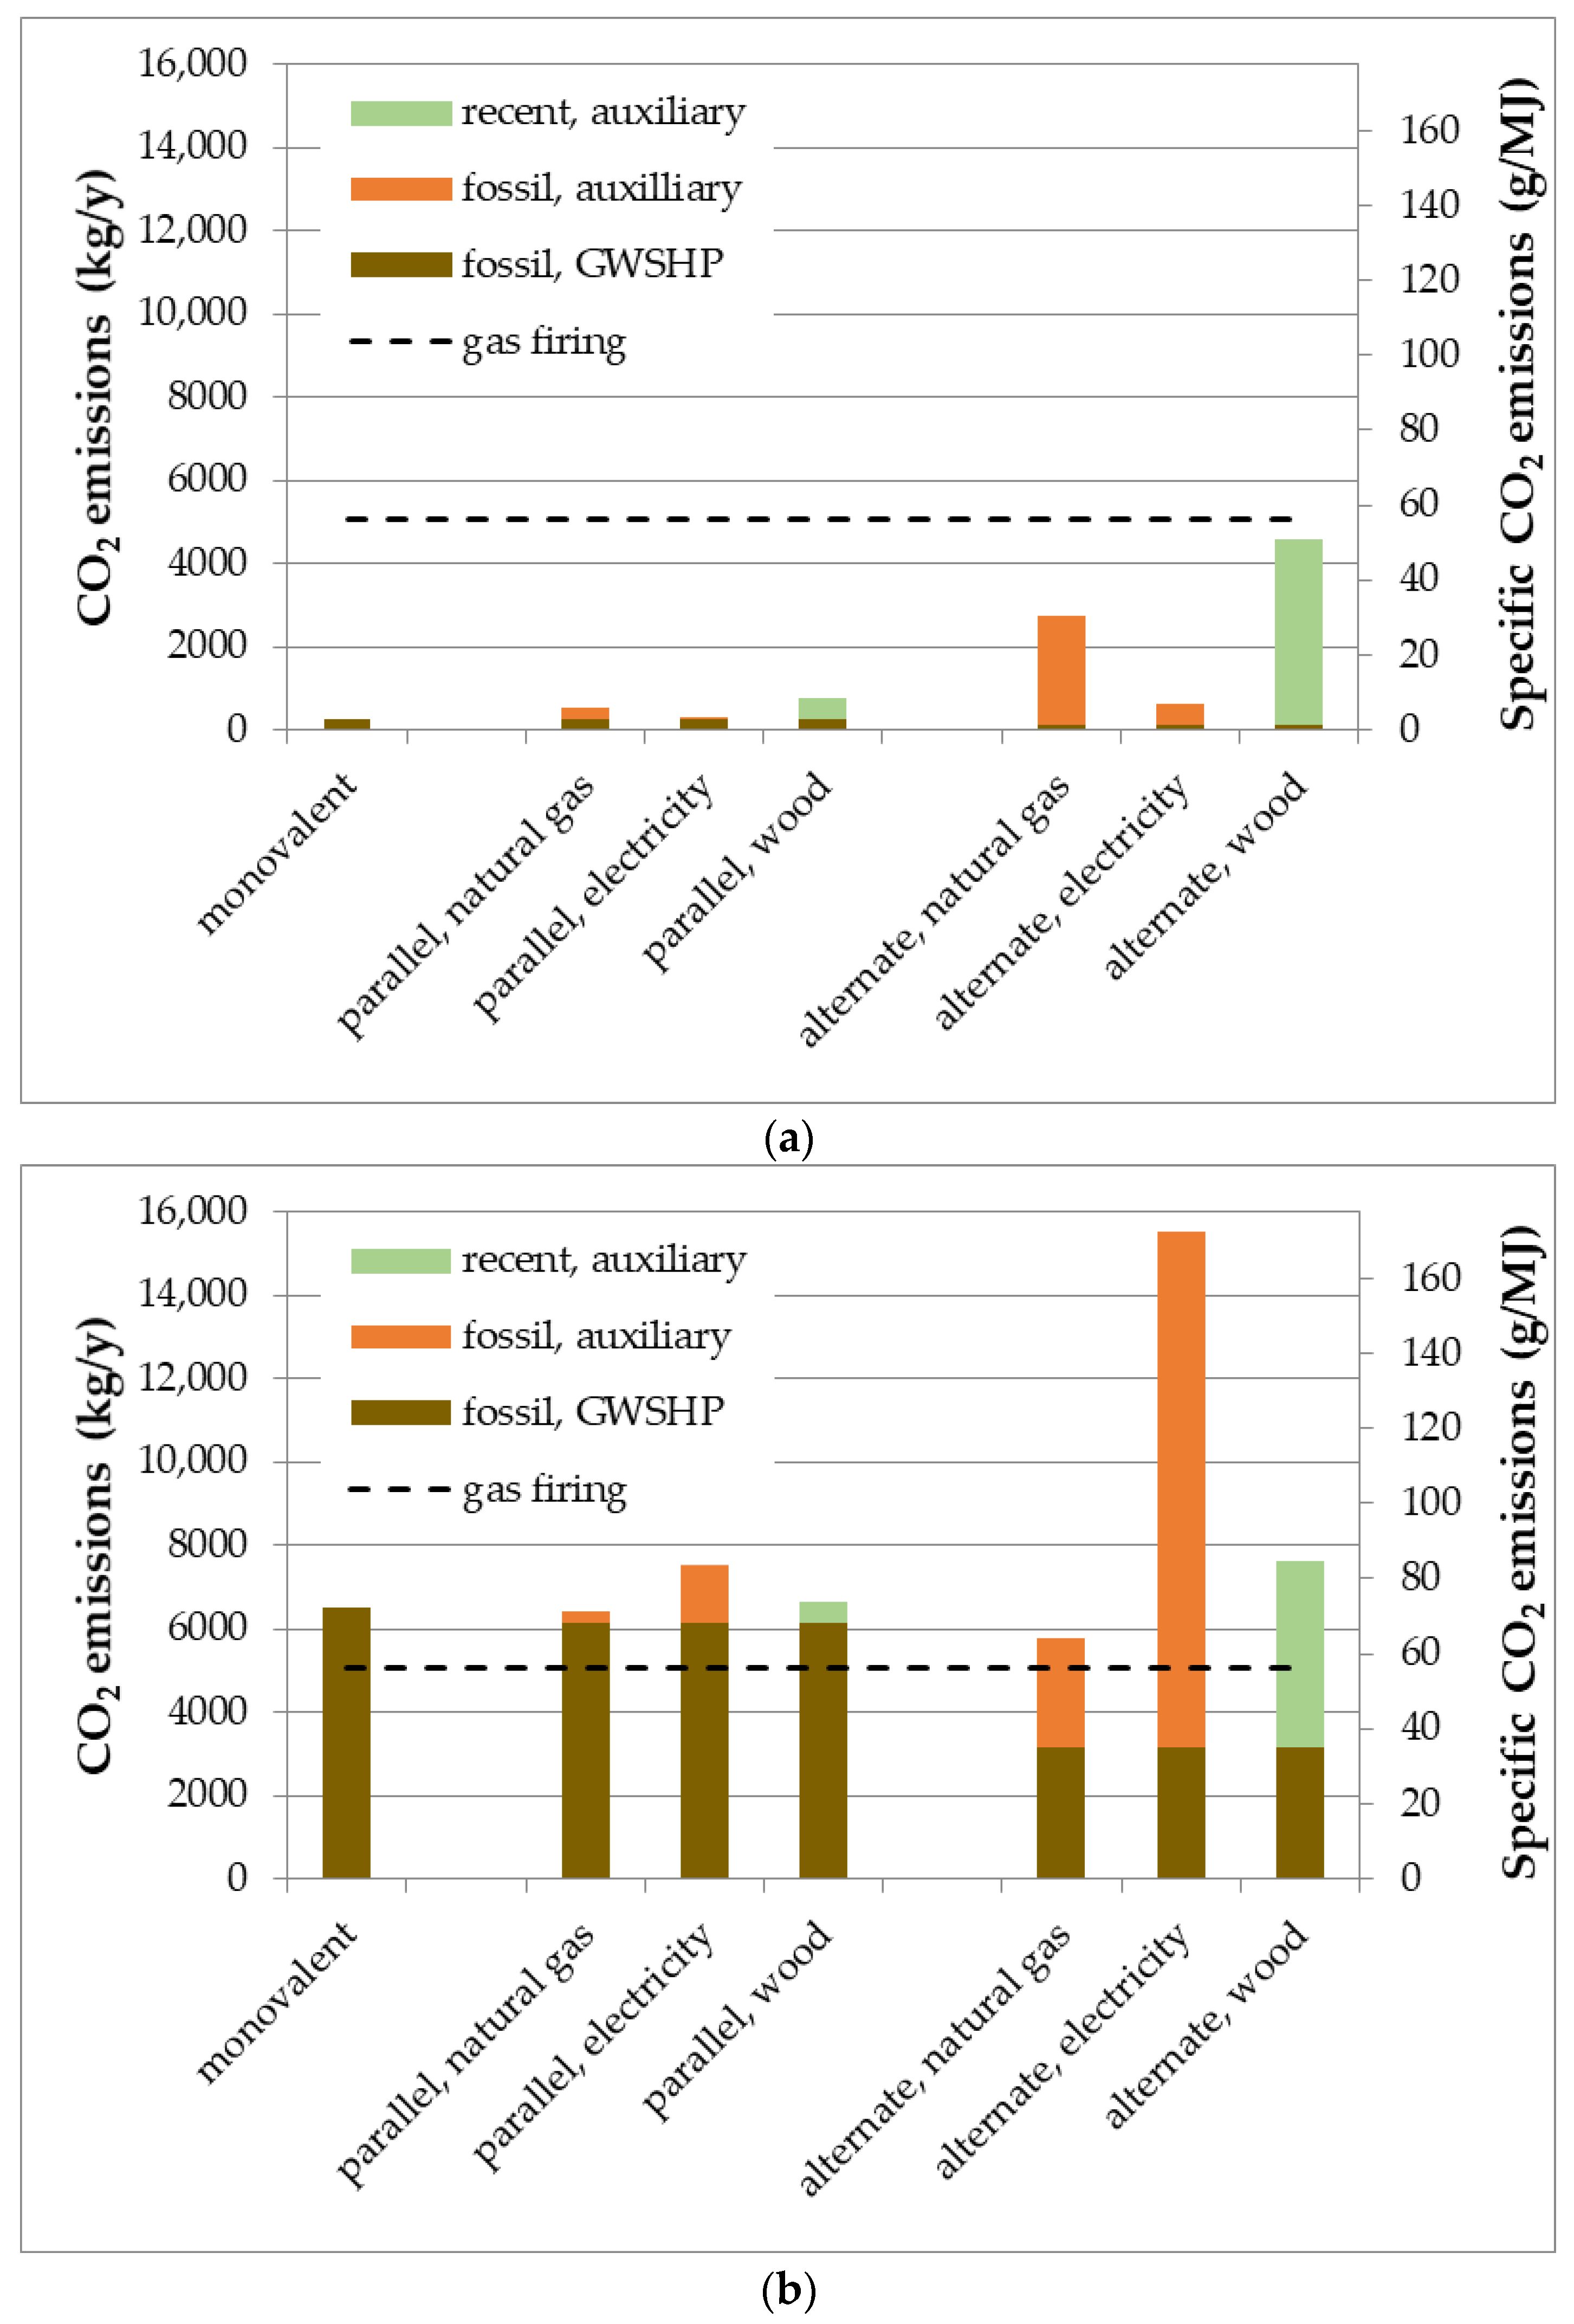
3.2.3. CO2 Emissions in GSHP Systems with Different Electricity Mixes

In the case of the Hungarian data, using solely electricity for heating has slightly lower CO2 emissions than using biomass, and its value is significantly higher than using gas for combustion (Table 1). Therefore, among the variants that have been investigated, electric heating is the worst choice in terms of its impact on the environment. CO2 emissions are favorable with heat pumps; using 2 °C as the bivalent point, the parallel systems can reduce CO2 emissions by 47–51% compared with gas firing (Figure 8 and Table 5). In the alternate mode, the natural gas firing as auxiliary heat has a CO2-reduction potential of 26.1%. In all other scenarios, the CO2 emissions are higher than the reference value. The increase in CO2 emissions compared with monovalent systems is approximately 6–15% in the parallel mode, while more than double the amount of emissions are produced in the alternate mode.
A near-carbon natural electricity generation results in extremely low CO2 emissions in the monovalent and bivalent modes with electric auxiliary heating (Figure 9a). In that case, the use of electricity is recommended compared with the use of gas or biomass as auxiliary energy. The CO2 emissions reduction with these systems is very high; in most cases, it is higher than 85% (the bivalent point temperature is 2 °C). Alternate use of natural gas causes a 45.6% reduction in CO2 emissions, while biomass firing causes the same CO2 emissions, but mainly from recent sources.
High CO2 intensity in electricity production can cause very high annual emission values even if using heat pumps, which are close to the specific value of natural gas firing or higher than it (Figure 9b). Thus, the use of heat pumps in the bivalent mode with natural gas as the auxiliary energy results in similar CO2 emissions to only firing with natural gas, and the CO2-saving potential does not exist except in the case of the alternate use of wood, where the fossil CO2 emissions could be reduced by 38% (Table 5).

4. Conclusions

Although heat pump systems possess a considerable potential to reduce carbon dioxide emissions, this potential greatly depends on the power generation mix and the energy source to be replaced. CO2 emissions of ASHP systems are higher in all scenarios than those of GSHP systems due to the lower COP and the lower source-side temperature. Both monovalent and bivalent systems can represent CO2 savings, but the bivalent systems’ CO2-reduction rate is always lower and is zero in some cases. From the point of view of total CO2 emissions reduction, bivalent-parallel systems are preferable, but if biomass is used for auxiliary heating, the bivalent-alternate solution is preferable in terms of the fossil CO2 emissions.
The use of electricity from an average energy mix results in CO2 emission reductions between 26 and 51%, and close to carbon-free electricity results in reduction values greater than 85%. However, when electricity generation results in high CO2 emissions, bivalent heat pump systems may not lead to CO2 emission reductions compared with natural gas-based heating. The results indicate that the CO2 emission reduction in the bivalent heat pump systems strongly depends on the factors studied here and varies in a wide range; therefore, the real potential needs to be calculated for each individual heating system.
The results are impacted by the temporal trend changes in some of the studied parameters. The most important changes are due to climate change [47,48,49,50], which will make the heat demand smaller, especially in urban areas, where the phenomenon of urban heat islands increases the regional-scale effects [51,52]. This has an impact on the source’s temperature (both air and groundwater), leading to higher COP values and hence, smaller CO2 emissions. Due to the steadily rising COP value of the units, the development of heat pumps has a similar impact.
Most countries make an effort to reduce the negative environmental effects of generating electricity, including CO2 emissions, by using more renewable energy sources and nuclear power to generate electricity. This has been a common process in the EU for years and can be proved by the statistical data of the studied countries [44,45], since Hungary, Sweden, and Estonia can reduce the specific CO2 emissions of their electricity generation by 28.4%, 25.0%, and 18.8%, respectively, and the importance of renewable sources in the electricity mix is increasing every year. In this context, the average specific CO2 emission values decrease and carbon savings increase. As a result, systems, which are currently not saving CO2, can turn into CO2-saving solutions, consequently, providing better alternatives than gas firing systems in the near future. Moreover, the values obtained in our calculations are more favorable than the data cited in the introduction, which is due to both the improved efficiency of HP systems and the reduction in CO2 emissions, which are associated with electricity generation.
GWSHP systems are more favorable than other systems in terms of energy demand, operating costs, and CO2 emissions, but they require more favorable geological conditions for their deployment as a monovalent system. The importance of this precondition can be lessened if these systems are built as bivalent system. Utilizing heat pumps and other local energy sources, especially biomass, can be a very efficient way for space heating since the necessary energy can be provided primarily by air or geothermal sources, while the auxiliary energy can help to avoid both the overcooling of the source and other negative environmental effects. Since both user- and environmentally friendly solutions may be devised, bivalent heat pump systems can be deployed in places where monovalent systems cannot.

Author Contributions

Conceptualization, T.B. and E.B.-B.; methodology, T.B. and E.B.-B.; software, T.B. and E.B.-B.; validation, T.B.; formal analysis, E.B.-B.; investigation, T.B. and E.B.-B.; resources, T.B. and E.B.-B.; data curation, T.B. and E.B.-B.; writing—original draft preparation, T.B. and E.B.-B.; writing—review and editing, T.B. and E.B.-B.; visualization, T.B. and E.B.-B.; supervision, T.B.; project administration, T.B.; funding acquisition, T.B. All authors have read and agreed to the published version of the manuscript.

Funding

This research received no external funding.

Data Availability Statement

Publicly available datasets were analyzed in this study. The data presented in this study are available on request from the corresponding author.

Conflicts of Interest

The authors declare no conflict of interest. The funders had no role in the design of the study; in the collection, analyses, or interpretation of data; in the writing of the manuscript, or in the decision to publish the results.

Nomenclature

List of Symbols with Description and Unit
cspecific heat capacity (kJ/(kg°C))
COPicoefficient of performance of the heat pump on the i-th day
Eannual heat pump-related CO2 emissions (g/year)
eauxspecific CO2 emissions of the auxiliary heating (g/MJ)
eepower generation-related specific CO2 emissions (g/MJ)
HDDidaily heating degree days of the i-th day (°C·d)
HDDi,maxdaily heating degree days of the coldest day (°C·d)
icount of the day
mmass (kg)
Ppower of the heat pump (MW)
Qannual heat demand (MJ)
qspecific heat demand (MJ/°C)
Qaux,iheat demand supplied by auxiliary energy on the i-th day (MJ)
QDWH,idaily energy demand of DHW production on the i-th day (MJ)
Qext,iexternal energy needed for the heat pump on the i-th day (MJ)
QHP,ienergy delivered by the heat pump on the i-th day (MJ)
Qidaily heat demand on the i-th day (MJ)
Qi,Bdaily heat demand at the bivalent point (MJ)
Qi,maxmaximum daily heat demand (MJ)
Tbbase temperature (°C)
TBtemperature of the bivalent point (°C)
Tinindoor temperature (°C)
To,idaily outdoor temperature on the i-th day (°C)
To,mindaily outdoor temperature on the coldest day (°C)
ΔTtemperature difference (°C)
τone day in seconds (s/d)
Abbreviations
ASHPair source heat pump
BWBaden-Württemberg
CO2carbon dioxide
COPcoefficient of performance
DHWdomestic hot water
EUEuropean Union
GSHPground-source heat pump
GWSHPgroundwater-source heat pump
HDDheating degree day
HPheat pump
LCAlife cycle analysis
SPFseasonal performance factor
TRNSYStransient system simulation tool
UKUnited Kingdom

References

  1. Energy Statistics Data Browser 2022, IEA, Paris. Available online: https://www.iea.org/data-and-statistics/data-tools/energy-statistics-data-browser (accessed on 27 February 2023).
  2. European Commission. Heating and Cooling. 2021. Available online: https://ec.europa.eu/energy/topics/energy-efficiency/heating-and-cooling_en (accessed on 27 February 2023).
  3. European Commission, Directorate-General for Communication. European Green Deal: Delivering on Our Targets. 2021. Available online: https://data.europa.eu/doi/10.2775/373022 (accessed on 25 February 2023).
  4. Lund, J.W.; Tóth, A.N. Direct utilization of geothermal energy 2020 worldwide review. Geothermics 2021, 90, 101915. [Google Scholar] [CrossRef]
  5. Ochsner, K. Geothermal Heat Pumps. A Guide for Planning and Installing, 1st ed.; Earthscan from Routledge: London, UK, 2007; 146p. [Google Scholar]
  6. Rybach, L. Geothermal Heat Pump Production Sustainability—The Basis of the Swiss GHP Success Story. Energies 2022, 15, 7870. [Google Scholar] [CrossRef]
  7. Bayer, P.; Attard, G.; Blum, P.; Menberg, K. The geothermal potential of cities. Renew. Sustain. Energy Rev. 2019, 106, 17–30. [Google Scholar] [CrossRef]
  8. Miglani, S.; Orehounig, K.; Carmeliet, J. A methodology to calculate longterm shallow geothermal energy potential for an urban neighbourhood. Energy Build. 2018, 159, 462–473. [Google Scholar] [CrossRef] [Green Version]
  9. Schiel, K.; Baume, O.; Caruso, G.; Leopold, U. GIS-based modelling of shallow geothermal energy potential for CO2 emission mitigation in urban areas. Renew. Energy 2016, 86, 1023–1036. [Google Scholar] [CrossRef]
  10. Kammen, D.M.; Sunter, D.A. City-integrated renewable energy for urban sustainability. Science 2016, 352, 922–928. [Google Scholar] [CrossRef] [Green Version]
  11. Sarbu, I.; Mirza, M.; Muntean, D. Integration of Renewable Energy Sources into Low-Temperature District Heating Systems: A Review. Energies 2022, 15, 6523. [Google Scholar] [CrossRef]
  12. Rose, J.; Thomsen, K.E.; Balslev-Olesen, O. The Balance between Energy Efficiency and Renewable Energy for District Renovations in Denmark. Sustainability 2022, 14, 13605. [Google Scholar] [CrossRef]
  13. Kerényi, A.; McIntosh, R.W. Sustainable Development in Changing Complex Earth Systems, 1st ed.; Springer: Cham, Switzerland, 2020; 292p. [Google Scholar]
  14. Ruhnau, O.; Hirth, L.; Praktiknjo, A. Time series of heat demand and heat pump efficiency for energy system modeling. Sci. Data 2019, 6, 189. [Google Scholar] [CrossRef] [PubMed] [Green Version]
  15. Pacheco, R.; Ordóñez, J.; Martínez, G. Energy efficient design of building: A review. Renew. Sustain. Energy Rev. 2012, 6, 3559–3573. [Google Scholar] [CrossRef]
  16. Scoccia, R.; Toppi, T.; Aprile, M.; Motta, M. Absorption and compression heat pump systems for space heating and DHW in European buildings: Energy, environmental and economic analysis. J. Build. Eng. 2018, 16, 94–105. [Google Scholar] [CrossRef]
  17. Weeratunge, H.; Aditya, G.R.; Dunstall, S.; de Hoog, J.; Narsilio, G.; Halgamuge, S. Feasibility and performance analysis of hybrid ground source heat pump systems in fourteen cities. Energy 2021, 234, 121254. [Google Scholar] [CrossRef]
  18. Saner, D.; Juraske, R.; Kübert, M.; Blum, P.; Hellweg, S.; Bayer, P. Is it only CO2 that matters? A life cycle perspective on shallow geothermal systems. Renew. Sustain. Energy Rev. 2010, 14, 1798–1813. [Google Scholar] [CrossRef]
  19. Smith, M.; Bevacqua, A.; Tembe, S.; Lal, P. Life cycle analysis (LCA) of residential ground source heat pump systems: A comparative analysis of energy efficiency in New Jersey. Sustain. Energy Technol. Assess. 2021, 47, 101364. [Google Scholar] [CrossRef]
  20. Greening, B.; Azapagic, A. Domestic heat pumps: Life cycle environmental impacts and potential implications for the UK. Energy 2012, 39, 205–217. [Google Scholar] [CrossRef]
  21. Sevindik, S.; Spataru, C.; Domenech Aparisi, T.; Bleischwitz, R. A Comparative Environmental Assessment of Heat Pumps and Gas Boilers towards a Circular Economy in the UK. Energies 2021, 14, 3027. [Google Scholar] [CrossRef]
  22. Jenkins, D.P.; Tucker, R.; Rawlings, R. Modelling the carbon-saving performance of domestic ground-source heat pumps. Energy Build. 2009, 41, 587–595. [Google Scholar] [CrossRef]
  23. Blum, P.; Campillo, G.; Münch, W.; Kölbel, T. CO2 savings of ground source heat pump systems—A regional analysis. Renew. Energy 2010, 35, 122–127. [Google Scholar] [CrossRef]
  24. Bayer, P.; Saner, D.; Bolay, S.; Rybach, L.; Blum, P. Greenhouse gas emission savings of ground source heat pump systems in Europe: A review. Renew. Sustain. Energy Rev. 2012, 16, 1256–1267. [Google Scholar] [CrossRef]
  25. Leerbeck, K.; Bacher, P.; Junker, R.G.; Tveit, A.; Corradi, O.; Madsen, H.; Ebrahimy, R. Control of Heat Pumps with CO2 Emission Intensity Forecasts. Energies 2020, 13, 2851. [Google Scholar] [CrossRef]
  26. Sewastianik, S.; Gajewski, A. An Environmental Assessment of Heat Pumps in Poland. Energies 2021, 14, 8104. [Google Scholar] [CrossRef]
  27. Fidorów-Kaprawy, N.; Stefaniak, Ł. Potential of CO2 Emission Reduction via Application of Geothermal Heat Exchanger and Passive Cooling in Residential Sector under Polish Climatic Conditions. Energies 2022, 15, 8531. [Google Scholar] [CrossRef]
  28. Gradziuk, P.; Siudek, A.; Klepacka, A.M.; Florkowski, W.J.; Trocewicz, A.; Skorokhod, I. Heat Pump Installation in Public Buildings: Savings and Environmental Benefits in Underserved Rural Areas. Energies 2022, 15, 7903. [Google Scholar] [CrossRef]
  29. Beccali, M.; Bonomolo, M.; Martorana, F.; Catrini, P.; Buscemi, A. Electrical hybrid heat pumps assisted by natural gas boilers: A review. Appl. Energy 2022, 322, 119466. [Google Scholar] [CrossRef]
  30. Vering, C.; Wüllhorst, F.; Mehrfeld, P.; Müller, D. Towards an integrated design of heat pump systems: Application of process intensification using two-stage optimization. Energy Convers. Manag. 2021, 250, 114888. [Google Scholar] [CrossRef]
  31. Vering, C.; Maier, L.; Breuer, K.; Krützfeldt, H.; Streblow, R.; Müller, D. Evaluating heat pump system design methods towards a sustainable heat supply in residential buildings. Appl. Energy 2022, 308, 118204. [Google Scholar] [CrossRef]
  32. Klein, K.; Huchtemann, K.; Müller, D. Numerical study on hybrid heat pump systems in existing buildings. Energy Build. 2014, 69, 193–201. [Google Scholar] [CrossRef]
  33. Bagarella, G.; Lazzarin, R.; Noro, M. Annual simulation, energy and economic analysis of hybrid heat pump systems for residential buildings. Appl. Therm. Eng. 2016, 99, 485–494. [Google Scholar] [CrossRef]
  34. Mondot, M.; Caillet, J.; Tang, C. Design optimization of hybrid heat pumps for new and existing buildings in France. In Proceedings of the 12th IEA Heat Pump Conference 2017, Rotterdam, The Netherlands, 15–18 May 2017. [Google Scholar]
  35. Neubert, D.; Glück, C.; Schnitzius, J.; Marko, A.; Wapler, J.; Bongs, C.; Felsmann, C. Analysis of the Operation Characteristics of a Hybrid Heat Pump in an Existing Multifamily House Based on Field Test Data and Simulation. Energies 2022, 15, 5611. [Google Scholar] [CrossRef]
  36. Dongellini, M.; Naldi, C.; Morini, G.L. Influence of sizing strategy and control rules on the energy saving potential of heat pump hybrid systems in a residential building. Energy Convers. Manag. 2021, 235, 114022. [Google Scholar] [CrossRef]
  37. Hackel, S.; Pertzborn, A. Effective design and operation of hybrid ground-source heat pumps: Three case studies. Energy Build. 2011, 43, 3497–3504. [Google Scholar] [CrossRef]
  38. Buday, T.; Szabó, G.; Fazekas, I.; Paládi, M.; Szabó, S.; Szabó, G.; Kerényi, A. Annual pattern of the coefficient of performance considering several heat pump types and its environmental consequences. Int. Rev. Appl. Sci. Eng. 2014, 5, 173–179. [Google Scholar] [CrossRef]
  39. Paládi, M.; Szabó, S.; Megyeriné Runyó, A.; Kerényi, A. Firewood consumption and CO2 emission of detached houses in rural environment, NE-Hungary. Carpathian J. Earth Environ. Sci. 2014, 9, 199–208. [Google Scholar]
  40. Verbai, Z.; Lázár, I.; Kalmár, F. Heating degree day in Hungary. Environ. Eng. Manag. J. 2014, 13, 6. [Google Scholar] [CrossRef]
  41. Szalai, S.; Auer, I.; Hiebl, J.; Milkovich, J.; Radim, T.; Stepanek, P.; Zahradnicek, P.; Bihari, Z.; Lakatos, M.; Szentimrey, T.; et al. Climate of the Greater Carpathian Region. Final Technical Report. 2003. Available online: www.carpatclim-eu.org (accessed on 12 October 2022).
  42. Stiebel Eltron Magyarország. Available online: https://www.stiebel-eltron.hu/content/dam/ste/cdbassets/historic/bedienungs-_u_installationsanleitungen/WPL_13-23_E_cool__e74043d2-34ab-11e7-a4d3-005056a95add.pdf (accessed on 24 October 2022).
  43. Stiebel Eltron Magyarország. Available online: https://www.stiebel-eltron.hu/content/dam/ste/cdbassets/current/bedienungs-_u_installationsanleitungen/instructionandinstallationmanual_doc-00082424.pdf (accessed on 24 October 2022).
  44. EUROSTAT Data Browser. Gross and Net Production of Electricity and Derived Heat by Type of Plant and Operator. Available online: https://ec.europa.eu/eurostat/databrowser/view/NRG_IND_PEH__custom_5175824/default/table?lang=en (accessed on 26 February 2023).
  45. Greenhouse Gas Inventories (UNFCCC). EEA. Available online: https://www.eea.europa.eu/data-and-maps/data/national-emissions-reported-to-the-unfccc-and-to-the-eu-greenhouse-gas-monitoring-mechanism-18/national-greenhouse-gas-inventories-ipcc-common-reporting-format-sector-classification/microsoft-access-format-zip-2/at_download/file (accessed on 25 February 2023).
  46. Szabó, G.; Fazekas, I.; Szabó, S.; Szabó, G.; Buday, T.; Paládi, M.; Kisari, K.; Kerényi, A. The carbon footprint of a biogas power plant. Environ. Eng. Manag. J. 2014, 13, 2867–2874. [Google Scholar] [CrossRef]
  47. Verbai, Z.; Lakatos, Á.; Kalmár, F. Prediction of energy demand for heating of residential buildings using variable degree day. Energy 2014, 76, 780–787. [Google Scholar] [CrossRef]
  48. Kurylyk, B.L.; Kerry, T.B.; Jeffrey, M.M. McKenzie Climate change impacts on groundwater and soil temperatures in cold and temperate regions: Implications, mathematical theory, and emerging simulation tools. Earth Sci. Rev. 2014, 138, 313–334. [Google Scholar] [CrossRef]
  49. Headon, J.; Banks, D.; Waters, A.; Robinson, V.K. Regional distribution of ground temperature in the Chalk aquifer of London, UK. Q. J. Eng. Geol. Hydrogeol. 2009, 42, 313–323. [Google Scholar] [CrossRef]
  50. Deroubaix, A.; Labuhn, I.; Camredon, M.; Gaubert, B.; Monerie, P.-A.; Popp, M.; Ramarohetra, J.; Ruprich-Robert, Y.; Silvers, L.G.; Siour, G. Large uncertainties in trends of energy demand for heating and cooling under climate change. Nat. Commun. 2021, 12, 5197. [Google Scholar] [CrossRef]
  51. Menberg, K.; Bayer, P.; Zosseder, K.; Rumohr, S.; Blum, P. Subsurface urban heat islands in German cities. Sci. Total Environ. 2013, 442, 123–133. [Google Scholar] [CrossRef]
  52. Buday, T.; Buday-Bódi, E.; Csákberényi-Nagy, G.; Kovács, T. Subsurface Urban Heat Island Investigation in Debrecen, Hungary Based on Archive and Recently Measured Data. In Proceedings of the European Geothermal Congress 2019, Den Haag, The Netherlands, 11–14 June 2019. [Google Scholar]
Figure 1. Main classification of heat pump systems by source (ASHP: air source heat pump; GSHP: ground-source heat pump).
Energies 16 03209 g001
Figure 2. Schematic figures of heat supply in different modes of heat pump systems based on the heat demand duration curve and the bivalent point.
Energies 16 03209 g002
Figure 3. Daily mean temperature and daily heating degree day values throughout a year in Debrecen based on the mean values in the reference period of 1961–2010.
Energies 16 03209 g003
Figure 4. COP values of the heat pumps as a function of the temperature of the heat source based on [42,43].
Energies 16 03209 g004
Figure 5. Daily CO2 emissions of different heating solutions in the case of a theoretical house with a heat demand of 90.00 GJ/y.
Energies 16 03209 g005
Figure 6. Daily heat demand and CO2 emissions data of some studied systems with electricity as auxiliary heat: (a) heat demand in parallel mode (both GWSHPs and ASHPs); (b) heat demand in alternate mode (both GWSHPs and ASHPs); (c) CO2 emissions in parallel mode, GWSHPs; (d) CO2 emissions in alternate mode, GWSHPs; (e) CO2 emissions in parallel mode, ASHPs; and (f) CO2 emissions in alternate mode, ASHPs.
Energies 16 03209 g006aEnergies 16 03209 g006b
Figure 7. Annual CO2 emissions as a function of the temperature of bivalent point in GWSHP systems: (a) natural gas and electricity as auxiliary heat, and (b) biomass as auxiliary heat.
Energies 16 03209 g007
Figure 8. Annual CO2 emissions of different bivalent GSHP systems.
Energies 16 03209 g008
Figure 9. Annual CO2 emissions of different bivalent GWSHP systems where (a) shows “low”, while (b) shows “high” CO2 emissions from electricity generation.
Energies 16 03209 g009
Table 1. CO2 emissions and carbon savings per heat demand values used in the calculations.
e, Specific CO2 Emissions (g/MJ)Carbon Savings Compared with Gas Firing (g/MJ)
TotalFrom Fossil Fuels From Carbon-Neutral Fuels
gas firing56.3556.350.00-
electric heating (“low”)10.9910.990.0045.36
electric heating (“middle”)94.9194.910.00no savings
electric heating (“high”)265.77265.770.00no savings
electric heat pump (COP = 3.67, “low”)2.992.990.0053.36
electric heat pump (COP = 3.67, “middle”)25.8625.860.0030.49
electric heat pump (COP = 3.67, “high”)72.4272.420.00no savings
wood firing95.820.0095.8256.35
biogas firing96.611.8594.7654.50
Table 2. CO2 emissions of electric heating and combustion in kg/y in the case of a theoretical house with a heat demand of 90.00 GJ/y.
Fossil CO2 Emissions (kg/y)Recent CO2 Emissions (kg/y)CO2 Reduction (Compared with Gas Firing)
gas firing5071.560.000.0%
electric heating (“low”)988.910.0080.5%
electric heating (“middle”)8541.880.00no savings
electric heating (“high”)23920.050.00no savings
biomass firing0.008624.02100.00%
biogas firing166.678528.7996.71%
Table 3. CO2 emissions of the studied heat pump systems in kg/y in the case of a theoretical house with a heat demand of 90.00 GJ/y.
CO2 Emissions of ElectricityCO2 Emissions (kg/y)CO2 Reduction
(Compared with Gas Firing)
CO2 emissions, electric GWSHP (kg/y)“low”269.4594.7%
“middle”2327.4354.1%
“high”6517.56no savings
CO2 emissions, electric ASHP (kg/y)“low”355.6993.0%
“middle”3072.3039.4%
“high”8603.44no savings
Table 4. Absolute and specific CO2 emissions in the studied bivalent systems, TB = 2 °C.
ASHPGSHP
ParallelAlternateParallelAlternate
+natural gas3174.0 kg/y4001.9 kg/y2485.2 kg/y3748.7 kg/y
35.27 g/MJ44.46 g/MJ27.61 g/MJ41.65 g/MJ
+electricity3373.4 kg/y5799.2 kg/y2684.6 kg/y5546.0 kg/y
37.48 g/MJ64.43 g/MJ29.83 g/MJ61.62 g/MJ
+wood3378.1 kg/y5841.6 kg/y2689.3 kg/y5588.4 kg/y
37.53 g/MJ64.90 g/MJ29.88 g/MJ62.09 g/MJ
Table 5. CO2 emissions reduction rates, GWSHP.
“Middle”“Low”“High”
monovalent 54.1%94.7%no savings
bivalent-parallel
TB = 2 °C
+natural gas51.0%89.2%no savings
+electricity47.1%93.9%no savings
+wood47.0% (56.7% *)85.2% (95.0% *)no savings
bivalent-alternate
TB = 2 °C
+natural gas26.1%45.6%no savings
+electricityno savings87.6%0
+woodno savings (77.9% *)9.4% (97.4% *)no savings (38.0% *)
* CO2 emission reduction rates if CO2 emissions due to biomass firing are not taken into account.
Disclaimer/Publisher’s Note: The statements, opinions and data contained in all publications are solely those of the individual author(s) and contributor(s) and not of MDPI and/or the editor(s). MDPI and/or the editor(s) disclaim responsibility for any injury to people or property resulting from any ideas, methods, instructions or products referred to in the content.

