Abstract
The techniques for releasing thermal energy accumulated in periods of high availability to meet the demand in periods of low energy supply contribute to the continuity of the cycles involved in thermodynamic processes. In this context, phase change materials are capable of absorbing and releasing large amounts of energy in relatively short periods of time and under specific operating conditions. However, phase change materials have low thermal conductivity and need to be coupled with high-thermal-conductivity materials so that the heat flux can be intensified and the energy absorption and release times can be controlled. This work aims to numerically study the solidification process of a phase change material inserted into a triplex tube heat exchanger with finned copper walls to intensify the thermal exchange between the phase change material and the cooling heat transfer fluid, water, that will receive the energy accumulated in the material. This work proposes the 3D numerical modeling of the triplex tube heat exchanger with finned walls and meets the need for numerical models that allow for the analysis of the full geometry of the latent heat thermal energy storage system and the thermal and fluid dynamic phenomena that are influenced by this geometry. Results of the temperature, liquid fractions and velocity fields during phase transformations are presented, analyzed and validated with experimental data, presenting average errors of below 5%. The total material discharge time was approximately 168 min, necessary for the complete solidification of the phase change material, with water injected into the triplex tube heat exchanger at a flow rate of 8.3 L/min and a temperature of 68 °C. The solidification process occurred more slowly in the same direction as the length of the triplex tube heat exchanger, and from 80% of the material in the solid state, the difference between the solidification time for z = 0 and z = 480 mm was 30 min. The fluid dynamic conditions developed in the latent heat thermal energy storage system promoted a maximum negative heat flux of −6423 w/m2 to the annular internal surface and −742 w/m2 to the annular external surface, representing a heat removal process nine times less intense on the external surface. The total energy released to the cooling heat transfer fluid was 239.56 kJ/kg.
1. Introduction
The shortage and intermittency of renewable energy sources and the pollution generated by the use of fossil fuels drives the search for energy process optimization methods. In this sense, the storage and release of thermal energy make a relevant contribution to the continuity and efficiency of thermodynamic processes. Within this scope, phase change materials (PCMs) have the characteristic of absorbing or releasing large amounts of energy in certain periods of time and under controlled operating conditions. These materials store this amount of thermal energy as latent heat during phase change processes. PCMs can store 5 to 14 times more energy per unit volume than other materials that store thermal energy by sensible heat, and they have a small ranges of phase change temperatures during the transformation of matter, allowing the storage process to be controlled within the loading and unloading cycles of these materials [1]. However, the low thermal conductivity of PCMs limits their applicability, requiring the development of thermal flux enhancement systems in which PCMs interact with materials of a high thermal conductivity to intensify the heat flux [2]. In this sense, several research studies have been carried out in order to develop methods to increase the heat flux to or from PCMs during thermal cycles [3,4,5,6,7,8].
Therefore, extended surfaces are applied to increase the interaction area between the PCM and the associated charge or discharge source. Beginning from the PCM container walls, thin structures are extended to increase the heat exchange area, intensifying the storage system’s heat transfer. Several research studies have been carried out to determine the influence of the fin geometry and type of material used to intensify the PCM thermal cycles [9,10,11,12].
Triplex tube heat exchangers (TTHXs) have been frequently applied in industry processes [13] and are built with three concentric tubes (internal, intermediate and external). The volumes formed between these tubes are used to store the PCM and to drain the thermal exchange fluids that absorb or release energy into the material, causing it to melt or solidify during the charging and discharging processes [10,14,15]. Fins made of materials with a high thermal conductivity are applied on the surfaces of these tubes so that the thermal interaction with the confined PCM intensifies the heat exchange process. Al-Abidi et al. [15,16] applied a TTHX in an energy storage system to thermally charge a PCM (paraffin), using a hot water flow from a storage tank connected to a solar collector.
To physically describe the thermal energy storage process via latent heat, it is necessary to develop a mathematical formulation that characterizes the transient phenomenon of phase change in which a phase transition zone is governed by a partial differential equation that can be solved analytically or numerically. The analytical solution of the governing equations for this process is problematic because of the nonlinear interfaces at the phase change boundary, which present a complex geometry and boundary condition; the few analytical studies available in this area are about one-dimensional cases with regular geometries and well-known boundary conditions [9].
The conservation of energy, which governs the heat transfer phenomena in PCMs during the solid–liquid transition, can be solved based on temperature or enthalpy. In the first case, the temperature is treated as the main variable, the conservation equations are written separately for the solid and liquid phases and the interfaces between these phases can be traced to obtain an accurate solution. In the second case, the positions of the solid–liquid interfaces are not tracked, and the governing equations are treated as single-phase equations, with no explicit conditions at the solid–liquid interface; this enthalpy-based formulation involves the solution inside a transition mushy zone (MZ) in which both phases are present [17].
In this sense, several research studies in the area of CFD have made efforts to characterize latent heat thermal energy storage systems (LHTESs), define optimal operating conditions and direct the applications of PCMs in the most varied applications [9,10,14,18,19,20,21].
Mastani Joybari et al. [14] realized a numerical analysis in order to evaluate the performance of a TTHX when it was subjected to simultaneous charge and discharge. The authors analyzed the continuous operating condition of the LHTES in which the PCM (Rubitherm® RT31) was subjected to a melting process in part of its volume and a solidification process in elsewhere. This type of LHTES is a denominated simultaneous charging and discharging (SCD) system. The authors used Ansys FLUENT® software, version 16.2, to numerically solve the governing equations, and the numerical results obtained were in accordance with the experimental results that consider the charging and discharging separately. The authors concluded that the initial condition of the PCM (completely in a liquid state or completely in a solid state) has a great impact on the final solid–liquid interface. They also observed that the only diffusive model presented low levels of error for the initial condition when considering a PCM in a completely liquid state, but neglecting natural convection in the case of a completely solidified initial condition produced relevant errors in the process description.
Youssef et al. [21], who carried out an extensive numerical analysis of a PCM heat exchanger (HX), developed another example that is presented in the literature. This PCM HX was built with eight tubes and presents the external surfaces linked to spiral copper wires. Inside a metal container, these wires interact with an organic paraffin, PlusICE® A16 (melts at 16 °C). The eight connected tubes form a serpentine structure which is used by the heat exchange fluid (air) to heat and cool the PCM. The conservation equations of the 3D model proposed to evaluate the performance of the PCM heat exchanger were solved using Ansys FLUENT® software, and the numerical results obtained were in accordance with the experimental results. Moreover, the authors observed another important result: the PCM discharge time presented higher values than the PCM charge time. This heat transfer phenomenon is explained by the effect of natural convection, which is more effective during the melting process. The authors also found that the material charging and discharging times were inversely proportional to the cooling heat transfer fluid (CHTF) inlet velocity and the temperature difference between the fluid and the PCM.
Alkaabi et al. [22] presented a numerical study to obtain the detailed heat transfer rate and pressure drop magnitude variations associated with changes in the demand for electrical energy that is produced through the operation of a nuclear reactor. The author proposed the optimization of the thermal energy generation system through coupling with an LHTES that releases or receives heat from the heat transfer fluid circulating in the nuclear reactor in accordance with the electric energy demand variation. This PCM-based LHTES works as a simple heat exchanger, receiving energy during periods of constant reactor operation, and operates in a secondary process as a supplier of thermal energy to the reactor heat transfer fluid to overcome the electrical power demand variations.
Mohamed et al. [23] analyzed the coupled system of nuclear thermal energy generation with an LHTES in the Rankine and Brayton cycles of supercritical carbon dioxide (SCO2). The authors presented results that indicated approximately 50% of the exergy was lost during the operation of the nuclear power plant without coupling, while less than 10% of the energy was lost when the system was coupled with the LHTES. They also noted that the advanced Brayton cycle (SCO2) is more efficient than the Rankine cycle by up to 50%, depending on the effectiveness of the cycle components.
Mohamed et al. [24] carried out a numerical investigation to evaluate the integration of a triplex-tube-type LHTES into a nuclear power plant system. In this research, the TTHX containers were vertically oriented in order to using the buoyancy forces developed during the PCM phase change to enhance the material melting/solidification cycles. The authors analyzed separate and simultaneous charging and discharging modes, evaluating the capacity of the LHTES to follow the nuclear power generation plant’s energic demand variations and avoid significant impacts on the operation of the reactor. For this purpose, two different heat transfer fluids were used for circulation in the TTHX: one for extreme charge/discharge conditions and another for the normal operating conditions of the nuclear power plant. The results showed that the LHTES with adaptive charging and discharging modes allowed the PCM to change from the solid to the liquid phase and vice versa in accordance with the plant’s energy demand variations.
Mohamed et al. [25] numerically analyzed an LHTES based on vertically positioned axisymmetric triplex tube heat exchangers in which a PCM was stored that was simultaneously charged and discharged (SCD) through a thermal exchange with a hot heat transfer fluid (HHTF) and a CHTF that circulated simultaneously within the LHTES. This charging came from the interaction of the LHTES with a thermal nuclear power generation system that provided a constant load. With this load, the authors presented results in which an equilibrium between the melting and solidification (charge and discharge) of the PCM was established in a liquid fraction of 20%. Under conditions of variable loads that occurred as a function of the energy demand, the LHTES system was able to follow the variation through the variation in the PCM’s liquid fraction, filling the gap between the energy supplied by the reactor and the power demand and allowing for the constant operation of the reactor at its full rated capacity.
Therefore, the CFD technique is crucial for evaluating and improving thermal energy storage systems via latent heat. The number of works that analyze the LHTES in 3D geometries is small, given the complexity of the model and the generation of meshes for the heat exchangers. The works have shown that the models which consider the natural convection in the PCM along the phase change process present more accurate results than those that consider the process to be purely diffusive. As the numerical data are validated, they can be used in the development and improvement of phase change heat exchangers.
In this sense, unlike the numerical works that analyze the PCM solidification process with simplified, two-dimensional modeling, the present work presents a 3D numerical analysis that considers the entire LHTES, using a triplex tube heat exchanger with fins on the tubular surfaces during its discharging. The model considers the flows of heat transfer fluids, which exchange heat by forced convection through the walls of the pipes, and the conduction heat transfer through the finned pipes and the phase change process, considering the natural convection, buoyancy effects and thermal conduction. Thus, the three-dimensional analysis allows for a numerical analysis of all energetic and fluid dynamic phenomena occurring during the operation of the LHTES in all physical problem geometry.
2. Materials and Methods
The thermal energy release system analyzed in this work consisted of a triplex tube heat exchanger (TTHX) constructed with copper tubes and longitudinal fins installed on the walls in contact with the PCM, Rubitherm® RT-82, which was completely in a liquid state after having stored thermal energy during periods of high availability (Figure 1). The cooling heat transfer fluid (CHTF-Water) flowed in the pipes with a temperature lower than the PCM so that the energy contained in the material was released to the CHTF through the material’s solidification process. To physically describe this system, the TTXH was subdivided into five physical domains: the fluid volume (water), the solid material of the copper tubes (internal, intermediate and external) and the PCM, located between the intermediate tube and the inner tube.
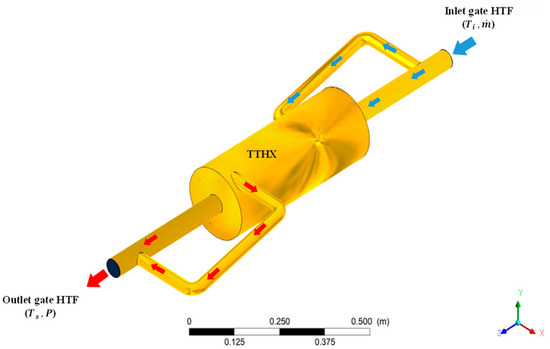
Figure 1.
TTHX geometric configuration.
During the energy release process, the water, which has a prescribed temperature (Ti) and mass flow rate (), enters the exchanger through a copper tube with a diameter of 50.8 mm and a thickness of 1.2 mm. This tube is branched by another tube with a diameter of 32 mm and a thickness of 1.2 mm. In this way, the thermal energy is extracted from the PCM by the finned pipes which, through a process of thermal conduction, transfer this energy to the outer surfaces of the intermediate tube and the inner surface of the internal tube. These are in contact with the CHTF, which receives the energy through the thermal convection process. As the CHTF receives energy from the system, its outlet temperature (Ts) is increased, and the PCM solidifies over time. Furthermore, the external surfaces of the TTXH are considered isolated, causing the heat exchange with the external environment to be negligible. In Figure 2, Figure 3 and Figure 4, the fluid domains, the inner and intermediate tubes and the PCM are illustrated with their respective geometric measurements.
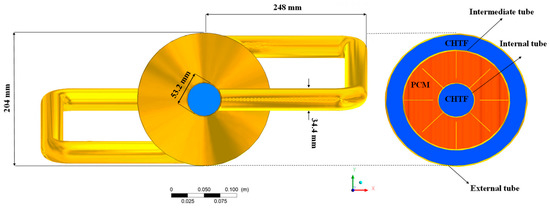
Figure 2.
Front view and cross section of the TTXH.
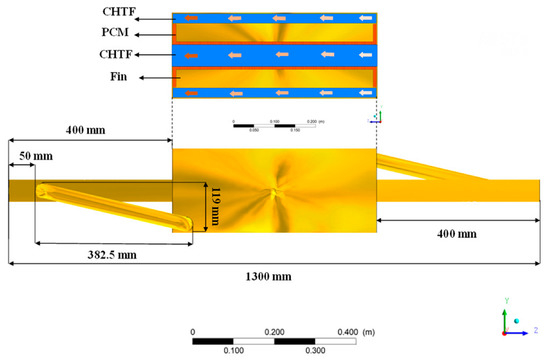
Figure 3.
Side view and longitudinal section of the TTXH.
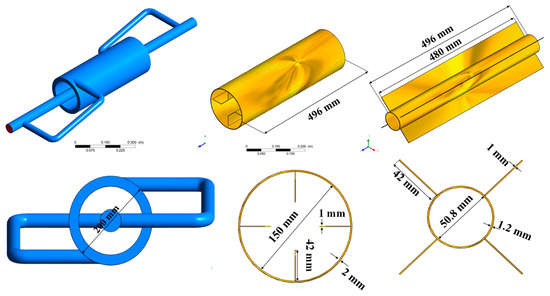
Figure 4.
Isometric and frontal views of the fluid domain of the CHTF: inner and intermediate tubes.
Due to the small thickness of the pipe and the isolation considered on the external surfaces of the TTHX, the solid material referring to the external pipe was neglected in the model for simplification purposes. Thus, as illustrated in Figure 5, only the CHTF, PCM, internal piping and intermediate piping were considered. Furthermore, the variation of 16 mm between the pipe length and the fins was also neglected, leaving only 480 mm of the TTHX length, which corresponded to the fins, considered in the simulation. These simplifications promoted the production of mesh of a reasonable quality.
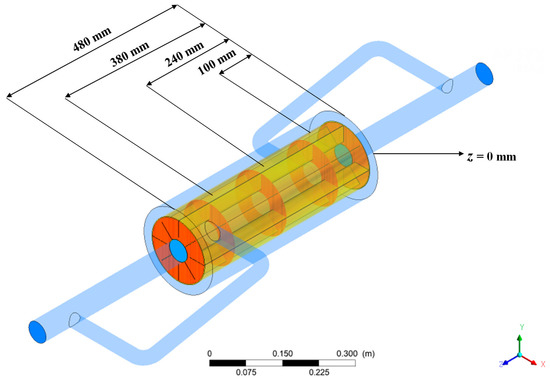
Figure 5.
Domains studied and indication of plans analyzed.
Thus, the thermal exchange area (the surfaces of the finned pipes in contact with the PCM) was 308,832 mm2, and the PCM volume was 0.00725707 m3. Converting these values to mass as a function of the PCM density, there was 6.89 kg of phase change material stored in the TTHX. Figure 5 also indicates the five planes (z = 0, 100, 240, 380 and 480 mm) in the z direction which were used to analyze the results obtained.
2.1. Mathematical Modeling
The CHTF flow in TTHX pipes occurs in turbulent, laminar and transition flow regimes, according to the considered fluid domain. As the PCM’s temperature changes, it presents density variations which first occur in the regions closest to the pipe walls. These variations, in the midst of the gravitational field, are expressed as buoyancy forces, which promote low velocity variations in the PCM particles. Therefore, the k-ω SST (shear stress transport) turbulence model, with corrections for low Reynolds numbers (Re), was used to analyze the flow in all fluid domains.
Therefore, the following equations were used:
- (a)
- Mass conservation
- (b)
- Linear momentum conservation
In these equations, ρ is the density of the fluid, μ is the dynamic viscosity, t is the time, P is the pressure, X is the position vector, u is the velocity vector, the sub-indices i and j represent the components (x, y and z) of the coordinate axes and the term represents the Reynolds stresses, derived from turbulent flow.
- (c)
- Turbulence model: shear stress transport, k-ω SST
The stress transport model (shear stress transport, k-ω SST) applied in the Ansys FLUENT® software was developed by Menter [26]. The objective of the model is to unite the robustness and accuracy of the standard k-ω model for the results close to the wall [27] with the accuracy and simplicity of the k-ε model [28] in regions far from the wall. For this purpose, coupling functions are used so that the equations of the k-ω and k-ε models are activated in the cells near and far from the walls, respectively, in the computational domain. In short, the variable k represents the turbulent kinetic energy of a flow, and the variable ω represents the dissipation rate of this energy. Equations 3 and 4 describe the transport of these variables:
In these equations, k is the term referring to the turbulent kinetic energy, and ω represents the dissipation of this energy; Gk and Gω represent the generation of k and ω, and Γk and Γω represent the effective diffusivity; Yk and Yω represent the dissipation of k and ω; the term Dω represents cross-diffusion; and Wk and Wω represent the source terms of the referred equations.
- (d)
- Energy conservation
To model the heat transfer between the thermal exchange fluid and the walls of the tubes and between the PCM in the liquid state and the walls of the tubes, the energy model used by Ansys FLUENT® was applied, which deals with the conservation of energy as follows.
- (e)
- Phase change model
To solve the transient problem of PCM solidification, the enthalpy–porosity model developed by Voller and Prakash [29] was used. In this model, the calculated liquid fraction is what indicates the interface position along the phase transition. PCM heat transfer occurs by thermal diffusion by natural convection, which is a function of density variations, temperature and the PCM liquid fraction.
where:
- (f)
- Fluid Properties: Density
In these equations, T represents the temperature, Wh represents the energy source term, E represents the total energy and γeff represents the effective thermal conductivity. The term ψ represents the liquid fraction; H represents the total enthalpy, the sum of the sensible enthalpy h and the latent enthalpy variation ∆H; L represents the latent heat of fusion; TS represents the solidification temperature; Tl represents the melting temperature; ρS and ρl are the material densities in the solid and liquid state, respectively, and η is the thermal expansion coefficient.
This mathematical modeling is another innovation of this research and was crucial to carrying out the LHTES simulations. For T < TS, the density was considered constant (ρ = ρS); for Tl ≥ T ≥ TS, the density was modeled as a mixing model that is a function of the liquid fraction calculated in the enthalpy model; for T > Tl, the Boussinesq natural convection model [30], which is specific to buoyant flows in which the density variation is driven only by small temperature variations, was applied. Finally, the values obtained with Equation (10) and applied in the numerical simulations were ρl = 778.47 kg/m3 and ρS = 950 kg/m3.
2.2. Boundary Conditions
The mass flow rate at the CHTF inlet was defined as an inlet condition. In addition, the absolute reference system, the flow direction normal to the inlet surface, the turbulence intensity, I = 5%, and the viscosity ratio turbulent, Rμ = 10, were established. The output boundary condition defined for the CHTF was the outflow, which corresponded to a neglected diffusive flow at the output. Therefore, the outflow boundary conditions were extrapolated from the internal domain, and these conditions had no influence on the upstream flow. Furthermore, this boundary condition imposed a general mass balance correction for all flow variables. Wall boundary conditions (non-slip and negligible roughness) were used for the fluid–solid interfaces and the insolated external surfaces.
For the heat transfer, (a) a wall with non-heat flux at the CHTF domain external surfaces and (b) a wall coupled condition for the solid–liquid were considered. Thus, the heat flux was calculated at the interfaces as a function of the neighboring cell temperatures.
The initial moment of the solidification process occurs with the final condition of the melting process, which was presented by Porto et al. [31]. In this situation, the PCM was brought to complete melting by being heated by water at a temperature of 90 °C. Thus, the solidification process initially occurred with the CHTF at 68 °C and 8.3 L/min, expelling the hot fluid found in the TTHX at the end of the melting process. In all simulations, a time step of 0.5 s was used.
The boundary conditions used in the simulations are described in Table 1.

Table 1.
Boundary conditions.
2.3. Numerical Mesh
The finite volume discretization method was applied. Hybrid meshes were developed using the Ansys Meshing® software. This mesh allowed for the association of the molding capacity of the complex geometries of the tetrahedral elements, allocated in the CHTF domain, with the good quality of the results related to the hexahedral elements at the wall regions. The finned structures and the PCM domain were constructed only with hexahedral elements, maintaining the mesh quality for these geometries. Figure 6 illustrates the isometric and frontal views of the mesh used for the heat exchanger, with all domains mounted.
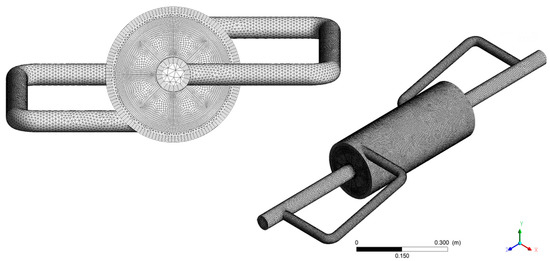
Figure 6.
Isometric and front view of the TTHX representative mesh.
Figure 7 illustrates the mesh for the PCM, internal and intermediate finned pipes: structured hexahedral elements in the pipes and unstructured hexahedral elements in the PCM volume.
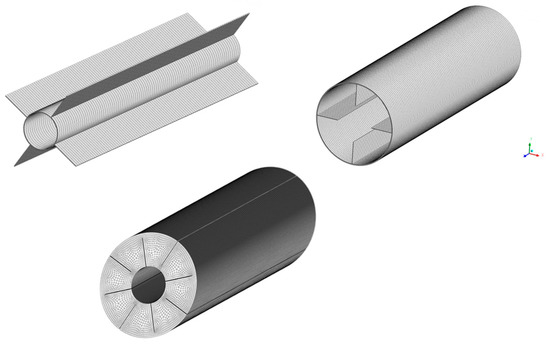
Figure 7.
Mesh used for intermediate tube domain, inner tube domain, and PCM domain.
The results were compared for two meshes, one with 1,155,528 elements and the other with 2,902,682 elements, and did not present significant variations. Therefore, the mesh with 1,155,528 elements was chosen. It presented a minimum and average orthogonality of 0.179 and 0.891, respectively, and a maximum and average deformation of 0.849 and 0.220, respectively. The influence of the time step was also verified by comparing the results obtained with ∆t = 0.1, 0.5 and 1.0. No significant variations between the results obtained for the three time steps were verified. Therefore, the 0.5 s time step was chosen. The results of numerical mesh and time step analyses were presented by Porto et al. [31].
2.4. Physical Properties
The thermo-physical properties used in this research were experimentally obtained by Al-Abidi et al. [32]. In this experimental work, the PCM density in the liquid state was obtained at 93 °C, and the PCM density in the solid state was obtained at 27 °C. In addition, the PCM latent heat of fusion (L = 201,643.8 J/kg) was also experimentally obtained for the phase change temperature range in which the solid temperature (TS) was 343.2775 K and liquid temperature (Tl) was 355.3263 K. These data are shown in Table 2.

Table 2.
Thermo-physical data used in the simulation.
3. Results and Discussion
3.1. Validation
The numerical results were validated with the experimental results presented by Al-Abidi et al. [15] that used RT82 paraffin as a PCM. The authors built an LHTES using a TTHX with the same dimensions modeled in the present research. The experimental results were obtained with K-type thermocouples (0.5% accuracy), a data logger and a computer. The CHTF flow was measured by a rotameter with an accuracy of 5%. Two thermocouples were also installed at the TTHX inlet and outlet to measure the CHTF temperatures in these sections. The TTHX was isolated with glass wool (70 mm thick), and fifteen thermocouples were installed in the PCM at 10 mm intervals, mounted in different angular directions and radial positions and located 100 mm from the inlet face. The PCM solidification process began when all the material melted. The discharge tank temperature was maintained at 68 °C, which was considered the minimum temperature to discharge the PCM. The numerical results for the average temperature in the z = 100 mm section were compared with the experimental data that described the same average temperature. Figure 8 illustrates that the obtained numerical results reproduced the tendency of the experimental data of the average temperature in the discharge of the phase change material, presenting a maximum error of 5.02 °C (7.17%) and an average error of 3.09 °C (4.2%). Despite of the various simplifications used in the numerical model and the precision errors of the experimental measurements, a good approximation between the results was verified.
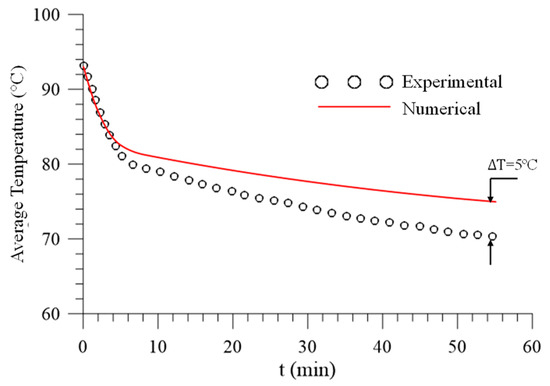
Figure 8.
Comparison between numerical and experimental results of the average temperature of the PCM at z = 100 mm during the solidification process.
3.2. Thermo-Fluid Dynamic Analysis
3.2.1. Temperature of the Fluids inside the Heat Exchanger
The beginning of the solidification process occurs with the final state of the melting process. The temperature, liquid fraction, pressure and velocity distributions reached in the melting process are the conditions under which the PCM discharging process must be conducted.
As shown in Figure 9, the total time required for the hot heat thermal fluid (HHTF) present in the TTHX to be removed from the exchanger was 512 s. In the first 8 s of the process, the CHTF entered the tubes and reached the volume comprised by the inner tube of the TTHX, z = 0 mm.
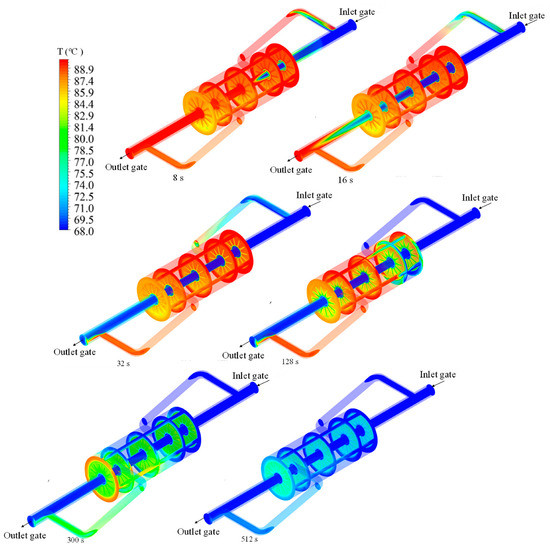
Figure 9.
Temperature distribution during the time required to remove the HHTF from the TTHX.
In the T-joint, which was intended to separate the CHTF to cool the external surface of the PCM, mixtures between the HHTF and CHTF were observed at values of approximately 80 °C. In 16 s of processing, it was observed that the internal part of the volume was completely filled with cold fluid, while it was still possible to find fluid remaining from the melting process in the external part. In 32 s, the fluid flowing inside the exchanger was 100% cold. In 128 s of processing, the CHTF reached the external annular of the heat exchanger and began to expel the HHTF present at that volume. With this process, the fluid domain was completely filled with only the CHTF in 512 s.
3.2.2. Temperature Fields during the Solidification Process
In Figure 10, Figure 11, Figure 12 and Figure 13, the temperature distributions for the CHTF, the pipes and the PCM are shown at four instants of time during the solidification process: when the fraction of liquid in the volume of the PCM reached 80 (4942 s), 50 (6522 s), 10 (10,293 s) and 0% (14,343 s), beginning from the condition of a 100% (4375 s) liquid state (which was obtained by heating the PCM), as described in Porto et al. [31]. All instants chosen for analysis occurred after extracting the HHTF that occurred in 512 s.
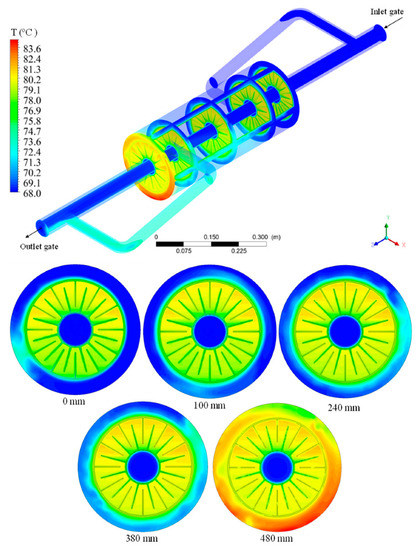
Figure 10.
Temperature distribution in TTHX domains for 80% of the PCM in a liquid state (t = 4942 s).
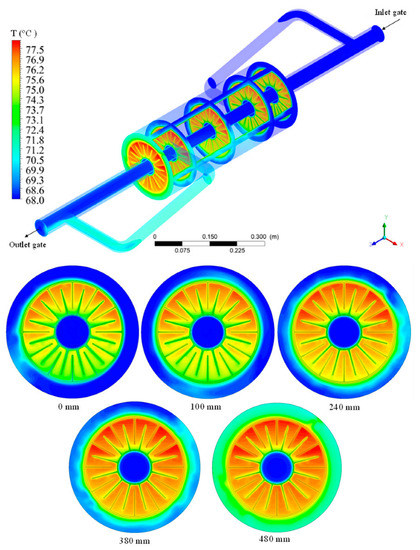
Figure 11.
Temperature distribution in TTHX domains for 50% of the PCM in a liquid state (t = 6522 s).
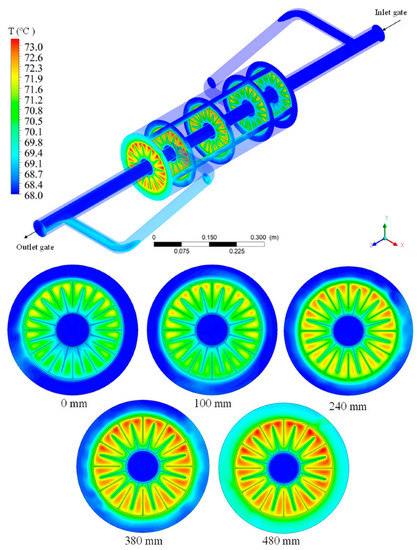
Figure 12.
Temperature distribution in TTHX domains for 10% of the PCM in a liquid state (t = 10,293 s).
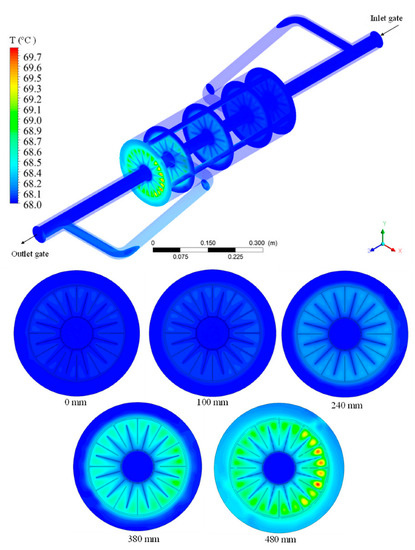
Figure 13.
Temperature distribution in TTHX domains for 0% of the PCM in a liquid state (t = 14,343 s).
Initially, a general analysis of the solidification process was carried out: the CHTF entered at 68 °C at the external and internal inlets of the TTHX and left the exchanger at higher temperatures as it absorbed thermal energy from the PCM. The PCM then gradually reduced its temperature until it reached a completely solidified state. Along the length of the TTHX, the CHTF increased its temperature, receiving energy along the PCM length.
Figure 10 shows that the CHTF entered the TTHX at 68 °C and left the fluid domain external region with a temperature of approximately 75 °C. In the internal domain, in only the regions very close to the internal surface of the internal tube, the temperatures were increased from 68 °C to values of around 75 °C. This behavior indicates the thin thermal boundary layer in this region. In the same direction of the melting process, in the external region of the PCM annular, there was a larger area of thermal exchange and a larger contact time of the CHTF with the tube wall, which led to the thermal exchange fluid leaving in a more heated state than the external annular of the TTHX.
In the internal volume, there was a smaller contact area but considerably higher velocity levels, as shown in Porto et al. [32], which analyzed the velocity fields of the CHTF. Therefore, there was a greater convection heat flux from the PCM annular internal surface.
Regarding the PCM, the highest levels of solidification were observed in the TTHX section z = 0 mm, along the length of the PCM. The regions close to the lower part of the annular external surface and the upper part of its internal surface were characterized by accumulations of material fractions with temperatures close to 75 °C due to the heavier fractions tending to be deposited in these regions; this behavior was reduced in intensity along the length of the material, with sections at z = 100 and 240 mm presenting similar temperature fields that were predominantly maintained at values close to 80 °C. There was also a reasonable proximity between the temperature distributions corresponding to the sections at z = 380 and 480 mm, where an accumulation of fluids with temperatures close to 81 °C was observed in the upper half of the annular.
In Figure 11, the CHTF can be seen leaving the external annular and the internal tube of the TTHX with temperatures around 73 °C. This is because as the PCM is cooled, the temperature gradient between it and the CHTF was reduced. In relation to the PCM, higher fractions were found in regions close to the lower part of the external annular surface and at the upper part of its internal surface, exactly in regions with lower temperatures of around 73 °C. This was due to increases in the density that corresponded to decreases in the PCM temperature. The intensity of this phenomenon was reduced along the length due to the heating of the CHTF.
For 10% of the PCM volume in a liquid state (Figure 12), the CHTF was removed from the external annular and in the thermal boundary layer of the internal tube with temperatures close to 69 °C. As for the PCM, it can be observed that along the planes of analysis, it exhibited temperatures corresponding to the phase transition region and below the solidification temperature of the PCM. Up to the length z =100 mm, it is possible to observe regions of the PCM close to the annular internal surface with temperature levels below the solidification temperature and values above this temperature in regions close to the upper part of the annular external surface. For the sections with z = 240, 380 and 480, there was an accumulation of PCM fractions with high temperatures close to 73 °C and more homogeneity in relation to the sections closer to the entrance.
With the PCM having a liquid fraction of 0% in its volume (Figure 13), we observed the CHTF leaving the TTHX external region and on the internal region surface at 68 °C with all planes with the PCM below 70 °C. The sections at z = 380 and z = 480 mm had temperatures closer to 69 °C, and the others had temperatures practically stabilized at 68 °C. It can be observed that the total time to melt the PCM at 90 °C, presented by Porto et al. [32], and to solidify the material at 68 °C was 14,343 s (about 4 h); this time was only 9968 s (2 h and 46 min) for the solidification process.
3.2.3. Liquid Fraction throughout the Solidification Process
Figure 14, Figure 15, Figure 16 and Figure 17 show the distribution of liquid fractions throughout the solidification process with 90 (4942 s), 50, 80 and 10% of the PCM volume in the liquid state.
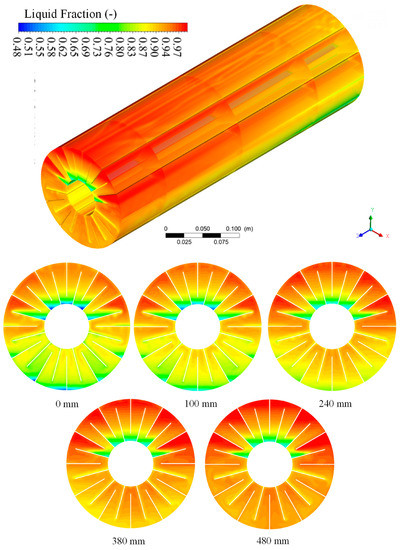
Figure 14.
PCM liquid fraction distribution for 90% of volume in a liquid state (t = 4942 s).
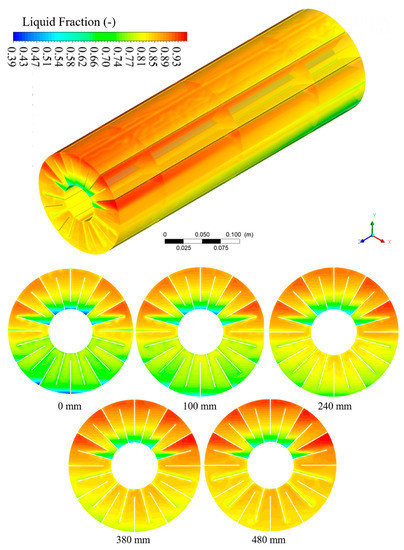
Figure 15.
PCM liquid fraction distribution for 80% of volume in a liquid state (t = 5272 s).
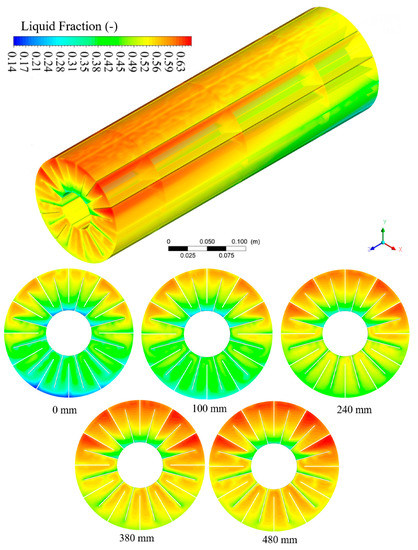
Figure 16.
PCM liquid fraction distribution for 50% of volume in a liquid state (t = 6522 s).
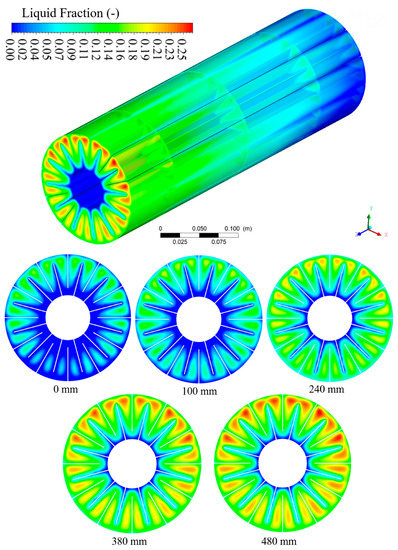
Figure 17.
PCM liquid fraction distribution for 10% of volume in a liquid state (t = 10,293 s).
In Figure 14, within a range of 48 to 100% liquid fraction, the following characteristics can be observed: in the TTHX inlet section (z = 0 mm), fractions with 48% in a liquid state were deposited in regions close to the upper face of the internal surface and the lower face of the external surface of the annular; in the section at z = 100 mm, these fractions were only found in the regions close to the upper face of the annular internal surface; in the section at z = 240 mm, only liquid fraction values greater than 62% are found; for the sections at z = 380 and 480 mm, values were above 70%. This distinct behavior along the material length is due to the CHTF heating process, which decreases the temperature gradient between it and the PCM as it crosses the sections of the TTHX. The last two sections (z = 380 and 480 mm) presented very similar configurations, indicating that for this instance in the process, this reduction in the solidification potential has no significant effect on the lengths of the referred sections.
In Figure 15, within a liquid fraction range of 39 to 100%, the following characteristics were observed: in the TTHX inlet section (z = 0 mm), the regions close to the upper face of the internal surface and the lower face from the external surface of the annular accumulated fractions of the PCM with 39% liquid in its composition; in the section z = 100 mm, this was restricted only to the regions close to the upper face of the annular internal surface. A behavior similar to a PCM flow in the regions close to the fins presented in these first two sections due to the variations in densities subjected to the gravitational field. At the position z = 240 mm, in the annular lower half, there were liquid fraction values of above 75% and below 81%, values around 93% in the regions closer to the upper part of the external surface and around 60% in the regions closer to the upper part of the internal surface of the annular which, even with heavier fractions, were retained in the upper half due to the geometry of the fins. In the z = 380 and 480 mm sections, the minimum levels of liquid fraction were around 70%. The slight difference between them was because at z = 380 mm, there was an initial appearance of these fraction levels in the middle bottom of the annular, while they were limited to the top at z = 480 mm.
In Figure 16, within a liquid fraction range of 14 to 63%, the following characteristics can be observed: in the TTHX inlet section (z = 0 mm), the regions close to the upper face of the internal surface and the lower face from the external surface of the annular accumulated fractions of the PCM with 14% liquid in its composition; in the section with z = 100 mm, there were more homogeneous values along the entire section, varying between 25 and 45%. Only in the regions close to the upper face of the annular external surface were values above this range found. A similar behavior occurred in the z = 240 mm section, with more regions filled with fractions above 50% in the annular upper half. The behavior of the heavier fractions with smaller amounts of liquid in their composition was observed in the last two sections, z = 380 and 480 mm, which were still the most heated sections, presenting a large part of their geometry filled with liquid value of above 50%.
In Figure 17, within a liquid fraction range of 0 to 25%, the following characteristics can be observed: in the z = 0 mm, the regions close to the annular internal surface were already completely solidified, while in the regions close to the external surface, mainly in the upper half, fractions of liquid around 10% are found. In the section z =100 mm, a smaller number of regions close to the annular internal surface had a liquid fraction of 0%. This extended to the section at z = 240 mm, which appeared with fractions of liquid of around 20% near the upper surface of the annular. In the sections with z = 380 and 480 mm, it was observed that fractions with 25% liquid were distributed almost symmetrically around the annular external surface; this occurred due to the restriction of movement that the solidified fractions imposed on those still in the liquid state, which in the previous instants could move to the annular upper half.
3.2.4. Pressure in the PCM
Figure 18 illustrates the pressure fields along the PCM volume for the instants at which 90% (t = 4942 s), 80% (t = 5272 s), 50% (t = 6522 s) and 40% (7112 s) of the material was in a liquid state. Figure 19, Figure 20 and Figure 21 show the results in which 30% (t = 7852 s), 20% (t = 8862 s) and 10% of the material were in liquid state, respectively. Due to the increase in the material density during the solidification process, reductions in the pressure variation can be observed within the PCM volume. Initially, with the all the material in a liquid state, pressure variations inside the PCM were at a maximum (approximately ± 130 Pa). As the material solidified, it tended to contract its volume, reducing the pressure variation levels inside it. With the TTHX axis line as the zero-gauge pressure, pressures along the y axis developed positively below this line and negatively above the axis with smaller variations until there were no more differences in the pressure levels between the annular upper and lower half.
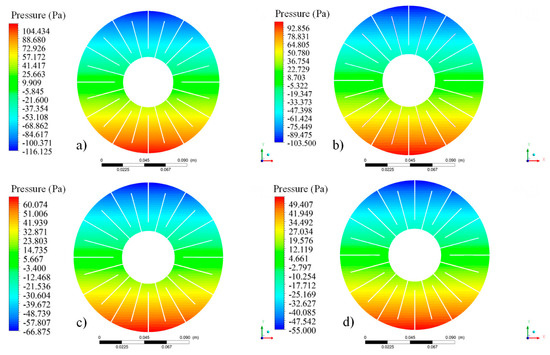
Figure 18.
Pressure fields in the PCM domain for (a) 90% (t = 4942 s), (b) 80% (t = 5272 s), (c) 50% (t = 6522 s) and (d) 40% (t = 7112 s) of its volume in a liquid state.
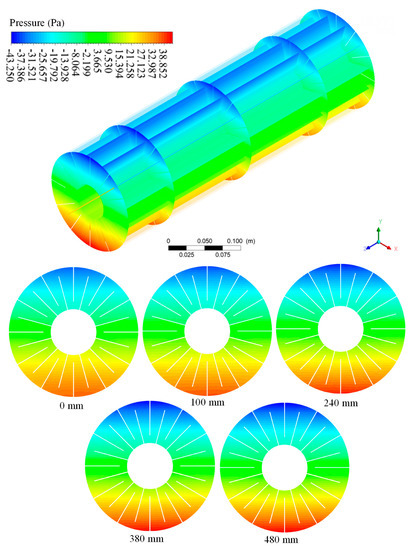
Figure 19.
Pressure distribution in the PCM domain for 30% (t = 7852 s) of its volume in liquid state.
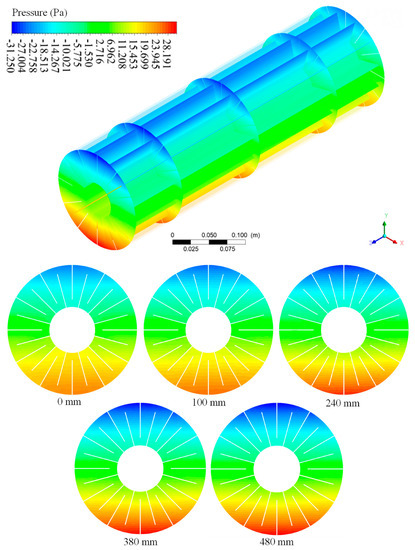
Figure 20.
Pressure distribution in the PCM domain for 20% (t = 8862 s) of its volume in a liquid state.
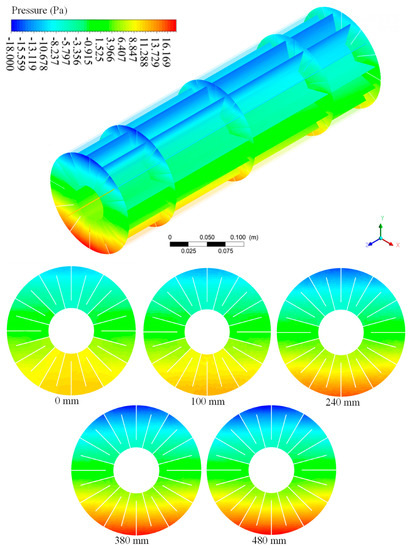
Figure 21.
Pressure distribution in the PCM domain for 10% (t = 10,293 s) of its volume in a liquid state.
With the material having 90, 80, 50 and 40% of its volume in a liquid state, no variations in pressure levels were observed along the material length. Thus, Figure 18 illustrates a pressure field that did not change along the length for the instants where 90% (range between −116 and 120 Pa), 80% (range between −104 and 114 Pa), 50% (range between −66 and 70 Pa) and 40% (range between −55 and 55 Pa) of the PCM volume was in a liquid state. The negative intervals are smaller than the positive ones because the heaviest fractions were found in the annular lower half, which provided greater columns of hydrostatic pressure in this region. This difference was reduced as the material solidified as the entire annular became filled with denser fractions of PCM.
Figure 19, Figure 20, and Figure 21 show the pressure distribution in the PCM domain for 30% to 10%, respectively. In Figure 19, the first variations in pressure levels can be observed along the length of the PCM. Within a range between −43 to 44 Pa, sections from z = 0 mm to z = 480 mm are observed with more defined contours. That is, as the sections closer to the inlet cooled more quickly, pressure variations along the length of the PCM were less intense in subsequent sections. Comparing the z = 0 mm section with that of z = 480 mm, negative pressures, tended toward values close to −25 Pa and −43 Pa, respectively, can be observed in the annular upper part. In the annular lower half, for z = 0 mm, positive pressures tended toward values close to 33 Pa, and values approached 39 Pa in z = 480 mm.
Figure 21 shows negative pressures tending to values close to −8 Pa and −18 Pa in the annular upper half and positive pressures tending toward values close to 8 Pa and 18 Pa in the annular lower half, showing the reach of pressure symmetry in relation to the reference axis at this moment of solidification.
3.2.5. Velocity in the PCM
In Figure 22, Figure 23, Figure 24 and Figure 25, we have the velocities developed in the PCM due to the buoyancy forces promoted in the material structure due to the density variations that resulted from the cooling process. The PCM started the solidification process when it was in a totally liquid state, with velocities in the order of 10−4 m/s. As the material had its temperature reduced, the density increased under the action of gravitational force, which was converted into displacements that varied according to the degree of material solidification. These displacements caused the heat transfer process to occur by natural convection in addition to thermal diffusion.
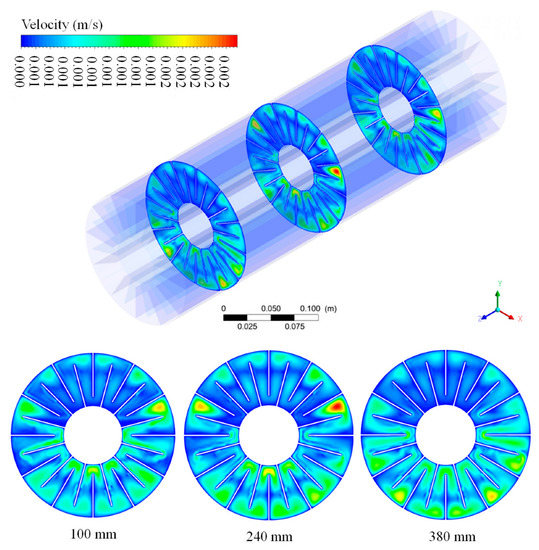
Figure 22.
Distribution of velocities in the PCM domain for 90% (t = 4942 s) of its volume in a liquid state.
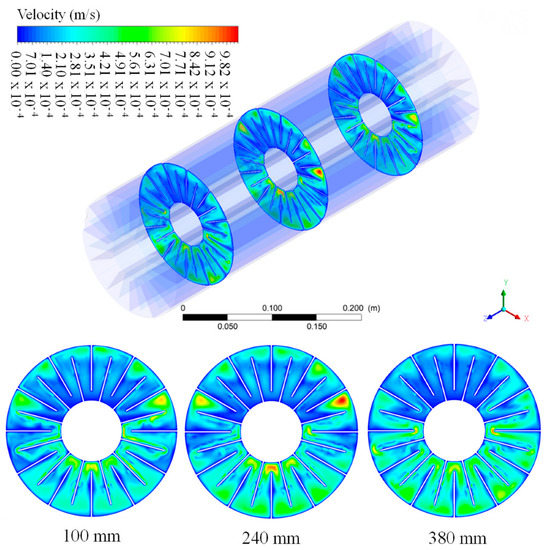
Figure 23.
Distribution of velocities in the PCM domain for 80% (t = 5272 s) of its volume in a liquid state.
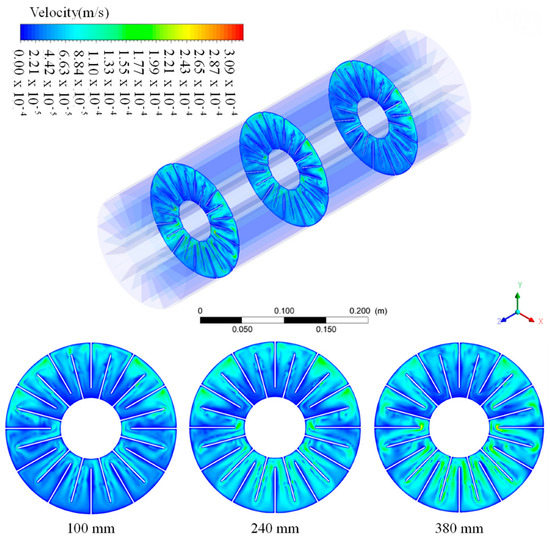
Figure 24.
Distribution of velocities in the PCM domain for 50% (t = 6522 s) of its volume in a liquid state.
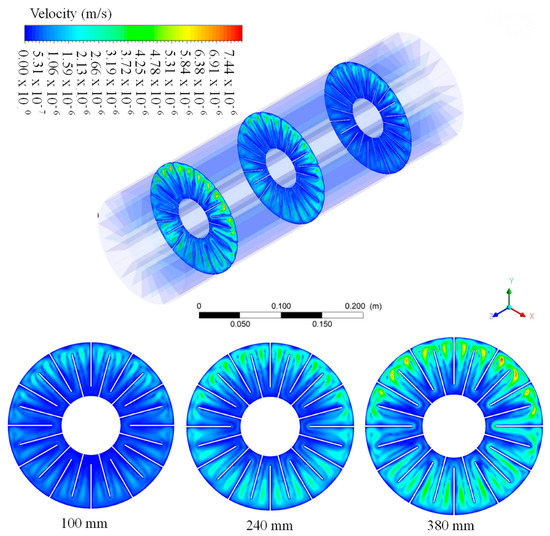
Figure 25.
Distribution of velocities in the PCM domain for 10% (10,293 s) of the melt volume.
In Figure 22, velocities that varied between 0 and 2 × 10⁻³ m/s can be observed. Comparing these results to those presented by Porto et al. [32], it appears that the disturbance of the melting final state generated velocity levels lower than those found for the same amount of liquid during the solidification process for 90% of the liquid fraction. This occurred because the physical stability of the liquid fractions in the melting process was achieved closer to the end, equivalent to the initial values of the solidification process. The three analyzed sections presented similar values in their configurations, and regions with zero velocities were observed distributed along the section due to the fact that the liquid fractions were practically stopped at the end of the melting process as there were few solidly formed fractions at that moment.
In Figure 23, it can be observed that the velocity range was reduced to maximum values close to 9.8 × 10⁻⁴ m/s. The velocities equal to 0 m/s were concentrated in the lower part of the annular upper half, which was due to the fact that at this time, the heavier fractions were being deposited in this region, restricting the movement of the fluids. Higher levels of velocities are found in the z = 240 mm because this was characterized as a transition between the two velocities’ sink mechanisms: the initial stability of the liquid phase and its change into the solid phase.
In Figure 24, it can be observed that the velocity range was reduced to average values of 1.7 × 10⁻⁴ m/s. These values were more homogeneously distributed at z = 240 and z = 380 mm than at z =100 mm, where an accumulation of velocities greater 0 m/s can be clearly observed at the annular upper half because the solidification process developed more intensely there than at the annular lower half in this section.
When the PCM reached 10% in a liquid state, shown in Figure 25, maximum velocities in the order of 1.0 × 10⁻⁶ m/s can be observed. Therefore, the material returned to being practically static at this moment of the solidification process.
3.3. Average Transient Behavior of Temperature, Thermal Flow and Liquid Fraction
Figure 26 shows the evolution of the average temperature in the PCM throughout the solidification process starting from 72 min, which was the time needed to completely melt the PCM. Due to the injection of the CHTF at a temperature of 68 °C, which is very close to the material solidification point, there was a slower process than the melting, with more accentuated differences between the initial temperature of the PCM (27 °C) and the HHTF temperature (90 °C) [32]. Thus, the following stages were found throughout the complete solidification process: (1) cooling from the final melting temperature, 87.2 °C, to the liquid temperature of the PCM; (2) the solidification of the material, which occurred in the aforementioned range of temperatures; (3) cooling the PCM until all the fractions contained in its volume reached the solid state. In this case, step 4 took place in less than 10 min of cooling, which is equivalent to 80 min of the total cycle time (fusion–solidification). Step 5 took place between 80 and 170 min at section z = 0 mm and between 80 and 200 min at z = 480 mm; step 6 took place until, after 240 min, at z = 480 mm the downstream section reached the solidification temperature in all regions, which had already occurred for the other sections. In Figure 27, the same variable is shown for the PCM cooling process. In this case, due to the injection of the cold fluid (CHTF) and with the exchanger pipes filled with hot water from the end of the melting process, there was a sudden initial drop in the outlet temperature from 90 to 71 °C. Additionally, in the first 10 min of discharging, the CHTF reached values close to 69 °C which were slowly reduced to 68 °C at the end of solidification process.
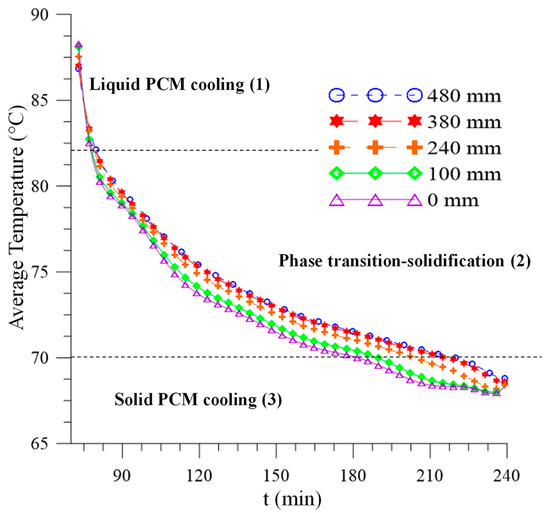
Figure 26.
Average temperature during the PCM solidification process.
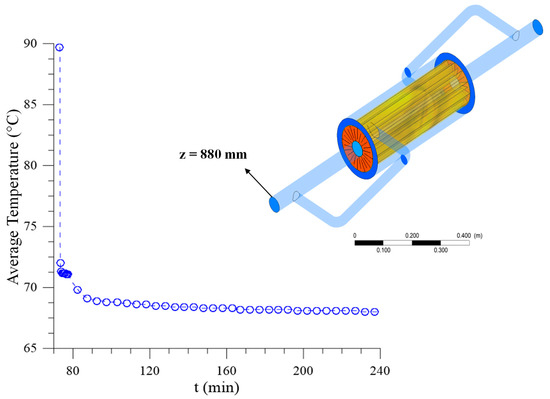
Figure 27.
Average temperature of the CHTF at the heat exchanger outlet.
In Figure 28, the heat fluxes occurred in the negative direction, removing thermal energy from the PCM. This is expected from the discharge process. Initially, there was a negative heat flux peak (−6423 W/m2) towards the inner surface due to the temperature difference between the CHTF and the referred surface. For the external surfaces, the negative flux gradually developed up to a maximum value of −742 W/m2 that occurred in 85 min; this is about nine times lower than the peak negative heat flux verified on the inner surface of the annular. This shows that the fluid dynamic conditions developed on the LHTES promoted a heat removal process nine times less intense on the external surface. This condition was also due to the process of removing the hot fluid from the TTHX slowly on the outside of the fluid domain, where there was a mixture of the hot liquid fractions with cold fractions until the HHTF was completely repelled from the TTHX after approximately 510 s of the discharging process. Comparing the absolute values of the energy fluxes in the fusion process presented by PORTO et al. [32] with those of the solidification process, it appears that these were approximately five times smaller due to the difference in temperatures of the CHTF in relation to the PCM being equivalent to 25% of the difference between the temperatures of the HHTF and the PCM in their respective processes. In this case, it can be observed that the absolute values of the negative heat flux were reduced to zero throughout the solidification process.
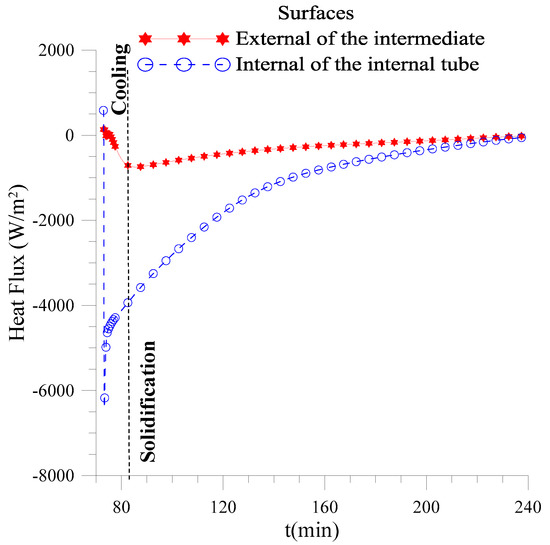
Figure 28.
Heat flux for the external surface of the intermediate tube and the internal surface of the internal tube throughout the solidification process.
In Figure 29, we have the transient profiles of the average liquid fraction, measured in different sections, throughout the solidification process. Having initially reached about 80 min of discharging, the PCM presented the first fractions of a solid, reducing them from 100% of the liquid in the material. This occurred in a more stable way than melting because the previously mentioned differences in temperature between the CHTF and PCM were relatively lower than the difference in the melting process, causing the material to cool slowly. In the case of solidification, the greatest variations in the average liquid fractions along the length were approximately 20%. At z = 0 mm, this value was reached in approximately 130 min and at z = 480 mm, this same value was reached after 160 min. These differences were carried over to the end of the process, when a liquid fraction of 0% was reached at z = 0 mm in 210 min and in 240 min at z = 480 mm. That is, the solidification process occurred more slowly in the same direction as the length of the TTHX, and from 80% of the material in the solid state, the difference between the solidification time for z = 0 and z = 480 mm was 30 min.
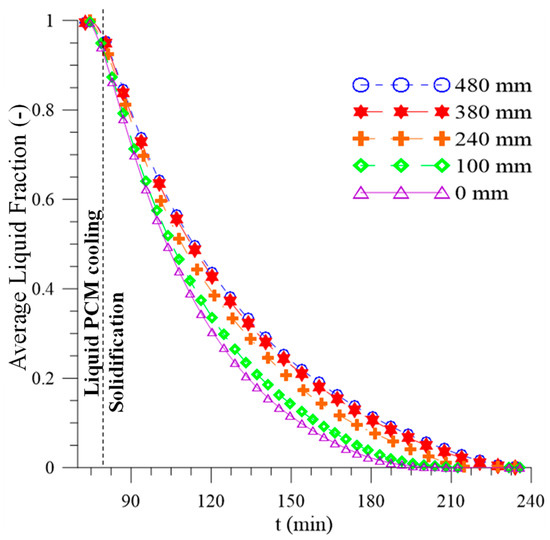
Figure 29.
Average liquid fraction for different PCM sections throughout the solidification process.
As illustrated on Figure 30, at the beginning of the solidification process, the PCM had 322.5 kJ/kg accumulated in its volume, of which 201.64 kJ/kg was latent heat and 120.41 kJ/kg was sensible heat. At the end of the solidification process, all the latent heat and 37.89 kJ/kg of sensible heat, totaling 239.56 kJ/kg, was released into the CHTF, and the PCM presented only 82.52 kJ/kg of accumulated sensible heat. The PCM finalized the melting process with an average temperature of 87.2 °C. During solidification, it quickly returned to the phase transition interval, 82 °C–70 °C, in which the reduction of the latent energy accumulated at the start of and in parallel to this interval, the accumulated sensible energy, was reduced from 120 kJ/kg to approximately 110 kJ/kg within the first 7 min of cooling, from the instant at which the sensible energy was reduced with very low rates until 82.52 kJ/kg at the end of the 240 min process. This phenomenon occurred because of the small difference between the temperature of the CHTF (68 °C) in relation to the PCM’s solid temperature (70 °C).
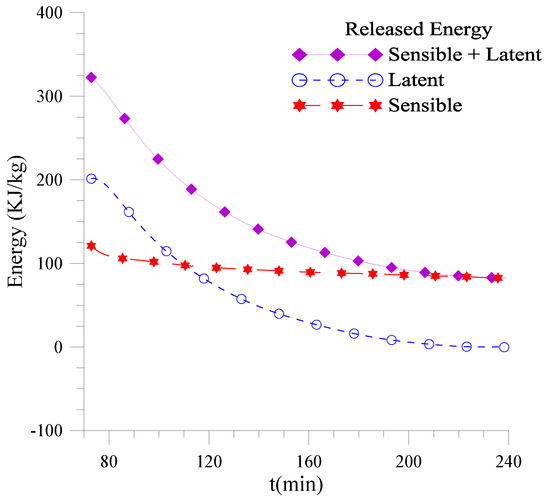
Figure 30.
Latent and sensible thermal energy released by the PCM during the solidification process.
4. Conclusions
The present work proposed a numerical analysis able to predict the behavior of a PCM inserted into a triplex tube heat exchanger with finned walls, working as a latent heat thermal energy storage system, during the discharge process (solidification). The novelty of this research consists of the three-dimensional analysis of the solidification process, which proved to be efficient for describing the behavior of the entire LHTES and presented variations in the results along the volume that more simplified models, which consider constant boundary conditions along the material length, cannot determine. The numerical results were validated through a comparison with the experimental data of the mean temperature in the section at z = 100 mm from the entrance, which showed a maximum error of 5.02 °C (7.17%) and a mean error of 3.09 °C (4.2%).
When the solidification process begins, the TTHX is completely filled by the cold heat exchange fluid (CHTF), thus completely replacing, from its volume, the hot heat exchange fluid (HHTF) from the melting process of the material. This process causes the solidification of the PCM to occur in the first 512 s through an interaction with a mixture of the CHTF and HHTF. From that moment, the cooling starts to occur only through the interaction with the CHTF.
During the operation of the energy release system, it was verified that the CHTF heats up along the length of the heat exchanger and that the discharge potentials are also reduced in this direction, causing the sections most downstream from z = 0 mm to be the last to solidify. It was also verified that the cooling increased the PCM fraction densities and as the regions closest to the annular surface were cooled, the material fractions with a higher density were deposited in the lower parts of the lower and upper halves of the annular. However, the geometry of the fins retained some of the heavier fractions of PCM in the upper part of the annular throughout the solidification process. Finally, close to the state of complete solidification, the velocities developed with the buoyancy forces were reduced to negligible values. This occurred because all the fractions along the volume of the material presented very similar densities.
Quantitatively, it was possible to describe the heat exchange process along the PCM length and its corresponding influence on the heat exchange fluid coming out of the TTXH. While the PCM releases heat to the thermal heat exchange fluid and develops the solidification process, the CHTF begins to leave the heat exchanger more heated, reaching a temperature of 90 °C at the beginning of the process due to the presence of the mixture with hot fluid in the exchanger at the end of the melting process. It then drops to 69 °C within the first 10 min of unloading. The material is then slowly discharged until it reaches thermal equilibrium with the CHTF.
Regarding the heat fluxes, it was found that the temperature difference between the PCM (87 °C) and the CHTF (68 °C) promoted heat fluxes from the PCM to the CHTF of −6423 W/m2 towards the inner surface of −742 W/m2 for the external surface of the PCM annular. This deference shows that the fluid dynamic conditions developed on the LHTES promote different heat removal process for the annular surfaces, indicating that the TTHX modeling must be carried out using three-dimensional mesh to capture the boundary conditions that are modified as a function of the CHTF flow regime. Comparing the solidification heat flux with the melting heat flux presented by Porto et al. [32] during the melting process, it was verified that the solidification heat fluxes were five times smaller due to the small difference between the CHTF temperature (68 °C) and the PCM solid temperature (70 °C), while the HHTF temperature was 90 °C and the PCM liquid temperature was 82 °C during the melting process.
The latent energy accumulated in the PCM is completely released to the CHTF during the solidification process, making the energy accumulated in the phase change material after complete solidification approximately 82.52 kJ/kg relative to the sensible heat of the PCM after complete solidification.
In this way, depending on the TTHX geometry, the three-dimensional numerical model must be used to describe the boundary conditions that are modified as a function of the CHTF flow regime. Symmetry simplifications using 2D numerical models and fixed boundary conditions for the external and internal surfaces of the PCM annular do not describe the fluid dynamic variations that promote the different boundary conditions during the solidification process.
The model used in this research did not consider some effects, such as the volumetric contraction due to temperature variation and the creation of air spaces at the exchange surfaces, which create resistant cavities at the heat exchange. These effects occur during the solidification and are verified in experimental works. Numerical modeling aims to describe, as reliably as possible, the real physical phenomenon for validation with experimental data. In this sense, in future research, these phenomena can be evaluated in order to continuously improve numerical models and reduce errors in relation to experimental data.
Author Contributions
Conceptualization, T.R.N.P. and A.G.B.L.; methodology, T.R.N.P., T.H.F.A. and A.G.B.L.; software T.R.N.P., J.A.L. and T.H.F.A.; validation, T.R.N.P., J.A.L. and A.G.B.L.; formal analysis, T.R.N.P., J.A.L. and A.G.B.L.; investigation, T.R.N.P. and A.G.B.L.; writing—original draft preparation, T.R.N.P. and A.G.B.L.; writing—review and editing, T.R.N.P., A.G.B.L. and J.M.P.Q.D.; visualization, T.R.N.P., T.H.F.A. and A.G.B.L.; supervision, A.G.B.L.; funding acquisition, J.M.P.Q.D. All authors have read and agreed to the published version of the manuscript.
Funding
This research was funded by FAPESQ-PB, CNPq, CAPES and FINEP (Brazilian Research Agencies). In addition, this work was financially supported by Base Funding—UIDB/04708/2020 and Programmatic Funding—UIDP/04708/2020 of the CONSTRUCT—Instituto de I&D em Estruturas e Construções—funded by national funds through the FCT/MCTES (PIDDAC); and by FCT—Fundação para a Ciência e a Tecnologia through the individual Scientific Employment Stimulus 2020.00828.CEECIND.
Data Availability Statement
The data that support the findings of this study are available upon request from the authors.
Conflicts of Interest
The authors declare no conflict of interest.
References
- Sharma, A.; Chen, C. Solar Water Heating System with Phase Change Materials. Int. Rev. Chem. 2009, 1, 297–307. [Google Scholar]
- Su, W.; Darkwa, J.; Kokogiannakis, G. Review of solid-liquid phase change materials and their encapsulation technologies. Renew. Sustain. Energy Rev. 2015, 48, 373–391. [Google Scholar] [CrossRef]
- Hasnain, S.M. Review on sustainable thermal energy storage technologies, part I: Heat storage materials and techniques. Energy Convers. Manag. 1998, 39, 1127–1138. [Google Scholar] [CrossRef]
- Peng, S.; Fuchs, A.; Wirtz, R.A. Polymeric phase change composites for thermal energy storage. J. Appl. Polym. Sci. 2004, 93, 1240–1251. [Google Scholar] [CrossRef]
- Sharma, S.D.; Buddhi, D.; Sawhney, R.L.; Sharma, A. Design, development and performance evaluation of a latent heat storage unit for evening cooking in a solar cooker. Energy Convers. Manag. 2000, 41, 1497–1508. [Google Scholar] [CrossRef]
- Liu, L.; Su, D.; Tang, Y.; Fang, G. Thermal conductivity enhancement of phase change materials for thermal energy storage: A review. Renew. Sustain. Energy Rev. 2016, 62, 305–317. [Google Scholar] [CrossRef]
- Ibrahim, N.I.; Al-Sulaiman, F.A.; Rahman, S.; Yilbas, B.S.; Sahin, A.Z. Heat transfer enhancement of phase change materials for thermal energy storage applications: A critical review. Renew. Sustain. Energy Rev. 2017, 74, 26–50. [Google Scholar] [CrossRef]
- Lin, Y.; Jia, Y.; Alva, G.; Fang, G. Review on thermal conductivity enhancement, thermal properties and applications of phase change materials in thermal energy storage. Renew. Sustain. Energy Rev. 2018, 82, 2730–2742. [Google Scholar] [CrossRef]
- Al-Abidi, A.A.; Mat, S.; Sopian, K.; Sulaiman, M.Y.; Mohammed, A.T. CFD applications for latent heat thermal energy storage: A review. Renew. Sustain. Energy Rev. 2013, 20, 353–363. [Google Scholar] [CrossRef]
- Jmal, I.; Baccar, M. Numerical study of PCM solidification in a finned tube thermal storage including natural convection. Appl. Therm. Eng. 2015, 84, 320–330. [Google Scholar] [CrossRef]
- Pizzolato, A.; Sharma, A.; Maute, K.; Sciacovelli, A.; Verda, V. Design of effective fins for fast PCM melting and solidification in shell-and-tube latent heat thermal energy storage through topology optimization. Appl. Energy 2017, 208, 210–227. [Google Scholar] [CrossRef]
- Abdulateef, A.M.; Mat, S.; Abdulateef, J.; Sopian, K.; Al-Abidi, A.A. Geometric and design parameters of fins employed for enhancing thermal energy storage systems: A review. Renew. Sustain. Energy Rev. 2018, 82, 1620–1635. [Google Scholar] [CrossRef]
- García-Valladares, O. Numerical simulation of triple concentric-tube heat exchangers. Int. J. Therm. Sci. 2004, 43, 979–991. [Google Scholar] [CrossRef]
- Joybari, M.M.; Haghighat, F.; Seddegh, S. Numerical investigation of a triplex tube heat exchanger with phase change material: Simultaneous charging and discharging. Energy Build. 2017, 139, 426–438. [Google Scholar] [CrossRef]
- Al-Abidi, A.A.; Mat, S.; Sopian, K.; Sulaiman, M.Y.; Mohammad, A.T. Experimental study of melting and solidification of PCM in a triplex tube heat exchanger with fins. Energy Build. 2014, 68, 33–41. [Google Scholar] [CrossRef]
- Al-Abidi, A.A.; Mat, S.; Sopian, K.; Sulaiman, M.Y.; Mohammad, A.T. Numerical study of PCM solidification in a triplex tube heat exchanger with internal and external fins. Int. J. Heat. Mass. Transf. 2013, 61, 684–695. [Google Scholar] [CrossRef]
- Manual, U.D.F. Ansys Fluent 12.0. Theory Guide; Ansys Inc.: Canonsburg, PA, USA, 2009; Volume 5. [Google Scholar]
- Jian-you, L. Numerical and experimental investigation for heat transfer in triplex concentric tube with phase change material for thermal energy storage. Sol. Energy 2008, 82, 977–985. [Google Scholar] [CrossRef]
- Li, W.Q.; Qu, Z.G.; He, Y.; Tao, W. Experimental and numerical studies on melting phase change heat transfer in open-cell metallic foams filled with paraffin. Appl. Therm. Eng. 2012, 37, 1–9. [Google Scholar] [CrossRef]
- Kong, X.; Lu, S.; Li, Y.; Huang, J.; Liu, S. Numerical study on the thermal performance of building wall and roof incorporating phase change material panel for passive cooling application. Energy Build. 2014, 81, 404–415. [Google Scholar] [CrossRef]
- Youssef, W.; Ge, Y.T.; Tassou, S.A. CFD modelling development and experimental validation of a phase change material (PCM) heat exchanger with spiral-wired tubes. Energy Convers. Manag. 2018, 157, 498–510. [Google Scholar] [CrossRef]
- Alkaabi, A.K.; Addad, Y.; Alameri, S.A. Optimization of heat transfer rate around cylindrical PCM containers in energy storage coupled with nuclear power plant. In Proceeding of the 18th International Topical Meeting on Nuclear Reactor Thermal Hydraulics (NURETH 2019), Portland, OR, USA, 18–23 August 2019. [Google Scholar]
- Ali, M.; Alkaabi, A.K.; Alameri, S.A.; Addad, Y. Overall efficiency analysis of an innovative load-following nuclear power plant-thermal energy storage coupled cycle. Int. J. Exergy 2021, 36, 98–122. [Google Scholar] [CrossRef]
- Ali, M.; Alkaabi, A.K.; Addad, Y. Numerical investigation of a vertical triplex-tube latent heat storage/exchanger to achieve flexible operation of nuclear power plants. Int. J. Energy Res. 2022, 46, 2970–2987. [Google Scholar] [CrossRef]
- Ali, M.; Alkaabi, A.K. and Jeong Ik Lee. CFD simulation of an integrated PCM-based thermal energy storage within a nuclear power plant connected to a grid with constant or variable power demand. Nucl. Eng. Des. 2022, 394, 111819. [Google Scholar] [CrossRef]
- Menter, F.R. Two-equation eddy-viscosity turbulence models for engineering applications. AIAA J. 1994, 32, 1598–1605. [Google Scholar] [CrossRef]
- Wilcox, D.C. Turbulence Modeling for CFD.; DCW Industries: La Canada, CA, USA, 1998. [Google Scholar]
- Launder, B.E.; Spalding, D.B. Mathematical Models of Turbulence; Academic press: Cambridge, MA, USA, 1972. [Google Scholar]
- Voller, V.R.; Prakash, C. A fixed grid numerical modelling methodology for convection-diffusion mushy region phase-change problems. Int. J. Heat. Mass. Transf. 1987, 30, 1709–1719. [Google Scholar] [CrossRef]
- Schmitt, F.G. About Boussinesq’s turbulent viscosity hypothesis: Historical remarks and a direct evaluation of its validity. Comptes Rendus Mécanique 2007, 335, 617–627. [Google Scholar] [CrossRef]
- Porto, T.N.; Delgado, J.M.P.Q.; Guimarães, A.S.; Magalhães, H.L.F.; Moreira, G.; Correia, B.B.; Andrade, T.F.; Lima, A.G.B. Phase change material melting process in a thermal energy storage system for applications in buildings. Energies 2020, 13, 3254. [Google Scholar] [CrossRef]
- Al-Abidi, A.A.; Mat, S.; Sopian, K.; Sulaiman, M.Y.; Mohammad, A.T. Experimental study of PCM melting in triplex tube thermal energy storage for liquid desiccant air conditioning system. Energy Build. 2013, 60, 270–279. [Google Scholar] [CrossRef]
Disclaimer/Publisher’s Note: The statements, opinions and data contained in all publications are solely those of the individual author(s) and contributor(s) and not of MDPI and/or the editor(s). MDPI and/or the editor(s) disclaim responsibility for any injury to people or property resulting from any ideas, methods, instructions or products referred to in the content. |
© 2023 by the authors. Licensee MDPI, Basel, Switzerland. This article is an open access article distributed under the terms and conditions of the Creative Commons Attribution (CC BY) license (https://creativecommons.org/licenses/by/4.0/).