Article

On the Adoption of Rooftop Photovoltaics Integrated with Electric Vehicles toward Sustainable Bangkok City, Thailand

1
Graduate School of Environmental Studies, Tohoku University, 468-1 Aoba, Aramaki, Aoba-ku, Sendai 980-8572, Japan
2
Division of Spatial Information Analysis, Center for Spatial Information Science, The University of Tokyo, 5-1-5 Kashiwanoha, Kashiwa 277-8568, Japan
*
Authors to whom correspondence should be addressed.
Energies 2023, 16(7), 3011; https://doi.org/10.3390/en16073011
Submission received: 27 February 2023 / Revised: 21 March 2023 / Accepted: 23 March 2023 / Published: 25 March 2023

Abstract

:
Realizing urban energy systems with net-zero CO2 emissions by 2050 is a major goal of global societies in building sustainable and livable cities. Developing cities hold a key to meeting this goal, as they will expand rapidly in the next decades with increasing energy demand, potentially associated with rising CO2 emissions and air pollution if fossil fuels continue to be utilized. Therefore, identifying equitable, cost-effective, and deep decarbonization pathways for developing cities is essential. Here, we analyzed Bangkok City, Thailand, using the System Advisor Model (SAM) for techno-economic analysis to evaluate the decarbonization potential of rooftop photovoltaics (PV) integrated with electric vehicles (EVs) as batteries on a city scale. The analyses took into consideration hourly local weather conditions, electricity demand, electricity tariffs, feed-in-tariffs, degradation, declining costs of PV and EV, etc., specific to Bangkok. As the prices of PV and EVs decrease over the next several decades, the “PV + EV” system may provide a basis for new urban power infrastructure with high energy efficiency, low energy cost, and large CO2 emission reduction. The results show that the “PV + EV” scenario in 2030 has the highest CO2 emission reduction of 73% from electricity and vehicle usage, supplying 71% of the electricity demand of the city. The “PV + EV” system may reduce energy costs by 59% with estimated technology costs in 2030. Most of the energy generated from rooftop PV is consumed owing to large EV battery capacities, which can contribute to the rapid decarbonization of Bangkok City by 2050.

1. Introduction

According to IPCC reports [1,2,3], limiting global warming to 1.5 °C compared to the pre-industrial temperature by reaching global carbon neutrality by 2050 is critical to minimizing the impacts of climate change on society. As a part of the Paris Agreement, many countries have pledged to set plans for climate action known as “Nationally Determined Contributions (NDCs)” to quickly reach the global peak of greenhouse gas emissions. An NDC provides a long-term framework for deep decarbonization to achieve carbon neutrality. Countries start by estimating emission reduction pathways in order to meet climate goals and build action plans to achieve the proposed targets. Urban decarbonization remains to be one of the challenging goals for many developing countries, where a growing urban population necessitates large new investments in infrastructure first to fulfill basic needs [4,5]. On the other hand, falling costs of renewable energy and advancing decarbonization technologies [6] are opening new windows of opportunity for developing countries to set their actions to combat climate change along with their development goals [7,8].
Rooftop PV is expected to play a critical role in future urban power systems, along with other socio-technical advancements in cities, such as digitization, decentralization, ICT, and EVs [9,10]. In addition, “rooftop PV” is known as the least invasive renewable energy (LiRE), meaning that little natural land is sacrificed for the spaces needed for PV installation [11,12]. Therefore, rooftop PV should be given the highest priority among all the renewable energies for urban decarbonization. However, PV generation is highly variable and produces electricity only when the Sun is shining, necessitating energy storage. Kobashi et al. found that rooftop PV integrated with EVs as batteries has a high potential to reduce CO2 emissions with large energy cost savings [13,14]. The effects of “PV + EV” systems on urban decarbonization have been analyzed for Japanese [13,14] and Korean cities [12], Shenzhen, China [15], and Jakarta, Indonesia [8]. As the decarbonization potential of the “PV + EV” system is highly variable between cities owing to climate, regulation, vehicle usage, building shapes and distributions, electricity tariffs, etc., the effects of “PV + EV” need to be analyzed for each city. In this study, we investigated Bangkok City, the capital of Thailand, for the potential of the “PV + EV” system, as none of the previous studies have analyzed it. Bangkok is one of the key developing cities in the world, located in a tropical climate at a low latitude (13.73° N, 100.56° E). Thus, incorporating PV and EV technologies can aid the city in devising future plans to meet the growing energy demand and population while also reducing its dependence on fossil fuels, ultimately leading to a sustainable city by 2050. Thailand is one of the most rapidly developing countries in Southeast Asia and has been part of the Party to the United Nation Framework Convention on Climate Change (UNFCC) since 1991. Thailand ratified the Kyoto Protocol in 2002 and later the Paris Agreement in 2016 [16]. Thailand, with USD 18,760 GDP per capita (PPP) [17], is facing the challenges of limited resources and the increasing impacts of climate change, as exemplified by large floods in Bangkok in 2011. The Thai government has pledged to reach carbon neutrality by 2050 and net-zero GHG emissions by 2065 [18]. As Thailand is located on land with abundant solar radiation [19,20], the Thai government has prioritized solar energy for decarbonization [21]. However, there are various barriers to increasing the PV capacity [20], such as variable PV generation [8] and the perceived risks of the impacts of climate change on PV plants [22].
With 10.5 million people in 2020, Bangkok City has a large energy demand with associated CO2 emissions. The transportation sector is the largest source of CO2 emissions (39% of the total CO2 emissions in 2015) and air pollution [23]. Reportedly, 41.5 million new vehicles, including 5658 EVs (0.01%), were registered in 2020, compared to 24.8 million in 2006 [24]. Premature deaths by air pollution were estimated to be 4446 in Bangkok in 2021 [25]. Therefore, urban decarbonation has significant benefits for the citizens of Bangkok. This study attempted to analyze the rooftop PV potential integrated with EVs as batteries in Bangkok using techno-economic analysis and identified policy implications.
This paper is organized as follows. Section 2 introduces a literature review on renewable energy in Thailand. In Section 3, methods are explained, including the model. In Section 4, a summary of technology adoption is presented. In Section 5, the discussion encompasses urban decarbonization, the effects of the feed-in-tariff (FIT) policy in Bangkok City, etc. Section 6 concludes this study.

2. EVs in Thailand: A Key Development and Decarbonization Strategy

Thailand is a major producer of pick-up trucks and compact cars for both domestic and international markets, ranking as the world’s tenth-largest car-producing country in 2021 with 1,685,705 vehicles produced [26]. At a time of a global EV shift, the Thai government plans to make Thailand an EV production base for the ASEAN region, aiming for 30% of the production to be EVs by 2030 [27]. The government is also promoting domestic EV sales by providing subsidies (THB 70,000 to 150,000 in 2022), tax breaks, etc. (Figure 1) [28]. Over 10,000 battery electric vehicles (BEVs) were sold in Thailand in 2022, which was a large jump from 2021, although it is still only about 1% of the total sales (850,000 vehicles) [29,30]. Therefore, EVs are part of important national strategies for the development of Thailand.
EVs are considered to be the most efficient decarbonization technology for light-duty vehicles [10], and they are rapidly replacing internal combustion engine (ICE) vehicles, reaching nearly 10% of global sales in 2021 [31]. The penetration of EVs will significantly affect the demand curve of urban power through uncontrolled EV charging [32]. However, EVs can also be used as a flexibility measure to mitigate the variability of renewable energy if charging is adequately controlled [33]. “Vehicle to Home (V2H)” is a bidirectional EV charger at home, allowing households to use EVs as batteries for rooftop PV [14,34,35]. The system has been commercially available in Japan since 2012, and more than 10,000 units had been sold by 2022 [36]. The aggregation of the V2H and V2B (vehicle to building) systems by ICT technology can produce virtual power plants (VPP), increasing dispatchable and affordable CO2-free electricity within cities [37].

3. Methodology

3.1. Techno-Economic Analysis

Techno-economic analysis is widely used to evaluate the viability of renewable energy projects, considering the climate, tariffs, various technologies, and degradation [13]. We used publicly available energy-economic software, the System Advisor Model (SAM; version 2020.2.29 r3 [38]), to analyze the decarbonization potential of rooftop PV integrated with EVs in Bangkok City. SAM was developed by the National Renewable Energy Laboratory (NREL) in the USA [39] and has multiple functions to analyze various renewable energy projects (PV, wind, geothermal, fuel cell, biomass, etc.) in different conditions (climate, location, costs, electricity tariff, technology degradation, financing, etc.). All the SAM files used for the analyses were made available at “Mendeley Data”. We used a methodology developed for the analysis of Japanese cities [13,14]. For the details of the methodology, please refer to [13,14]. When an EV is part of the rooftop PV system, additional parameters for the EV need to be considered in the analysis, which includes the cost of the EV and V2H system, the electricity demand for the EV, the gasoline price, and driving behavior [40]. Net present value (NPV) was used as a primary financial parameter to evaluate the project with a 3% discount rate and a 25-year project lifetime (PV lifetime). NPV can be expressed as:
PV a , b , t = n = 1 N Cashflow a , b , n , t 1 + R d n Systemcost a , b , t
where, a = PV capacity; b = battery capacity; N = project period; n = project year; t = first year of the project; and Rd = discount rate.
Decarbonization indicators such as CO2 emission reduction, cost savings, self-consumption, self-sufficiency, and energy sufficiency were calculated for each scenario (see later discussion). CO2 emission reduction from electricity consumption and driving was calculated using a grid emission factor of 0. 572 kgCO2·kWh−1 in 2018 for Thailand (operating margin value) [41]. The hourly electricity load of the city was calculated using SAM, constrained by the hourly weather file (typical year) obtained from [42] and the annual electricity consumption of the city [43]. The base CO2 emissions include those generated by electricity generation and gasoline combustion (40.9 MtCO2·year−1) from 5.07 million registered gasoline-powered four-wheeled vehicles such as sedans, passenger vans, and urban taxis in Bangkok City [44].
CO 2   emission   reduction = 1 Base   CO 2   emission 0.572 × imported   electricity   Base   CO 2   emission
Cost savings were calculated by dividing the base energy expense (electricity and gasoline) by the annualized NPV of the system as:
Cos t   Saving   = 1 Base   energy   expenses     Annualized   NPV   Base   energy   expenses
Energy sufficiency (%) indicates how annual PV-generated electricity compares with the annual electricity demand of the city. Self-consumption (%) indicates how much PV-generated electricity was consumed within the city. Self-sufficiency (%) indicates how much PV electricity can meet the electricity demand of the city considering the demand/supply balance at an hourly resolution. These indicators can be expressed in equations as:
Energy   sufficiency = Annual   PV   energy   generated Annual   electricity   demand × 100
Self consumption   = Electricity   to   load   from   system   and   battery Annual   PV   energy   generated × 100
Self sufficeincy   = Electricity   to   load   from   system   and   battery Lifetime   electric   load   × 100
Using the function “Parametric” in SAM, the optimal PV capacities that give the maximum NPV were calculated for each scenario. The optimal PV capacities were utilized for the simulation of 2020 and 2030, and decarbonization indicators were calculated (Supplementary File). the currency exchange rate in June 2022, 36.70 THB·USD−1, was used.

3.2. Data and Parameters Utilized in the Assessment of SAM

The determination of hourly electricity demand was achieved through the utilization of the “Building Energy Load Profile Estimator” function. The default values for building characteristics, electric appliances, and temperature settings were employed. The monthly electricity demand of the city [43] was inputted into the corresponding months and exported as a CSV file for use in subsequent SAM calculations. A weather data file (a typical year’s data) for Bangkok was obtained using an online tool, PVGIS (Photovoltaic Geographical Information System; version 5.2) [42], which contained global horizontal irradiance (GHI; W/m2), diffuse horizontal irradiance (DHI; W/m2), direct normal irradiance (DNI; W/m2), and temperature (°C). Thailand has three seasons, the monsoon season (from July to October), the cool season (November to February), and the hot season (March to June). The input parameters for SAM are shown in Table 1. Bangkok is located at a low latitude (13.825° N, 100.622° E, elevation 6 m) with rather constant solar insolation and thus PV generation (Figure 2). The tilt angle of the PV module in the SAM model was set to be equal to the latitude (13.8° N) and azimuth at 180°. The electricity generation from PV depends on the amount of solar irradiance reaching PV modules and temperature, which vary depending on the season in Bangkok.
Driving-related data (Table 1) are essential to evaluate the decarbonization potential of the “PV + EV” system [50]. We used the gasoline price averaged over the past 10 years [48]. The average annual driving distance in Bangkok City was reported by Phonrattanasak et al. [49] as 15,632 km·yr−1. An EV efficiency of 5.3 km·kWh−1 was used according to Nissan Leaf as a representative EV model [51]. The annual electricity demand of Bangkok City in 2020 was 50.7 TWh [43]. If all the registered ICEs are converted to EVs, it would lead to a 29.5% increase in the annual electricity demand. In addition, the total EV battery capacity in the city can be calculated as 202.9 GWh. If the discharge rate of an EV is 6 kW, all the EVs in the city can supply 30.4 GW power.

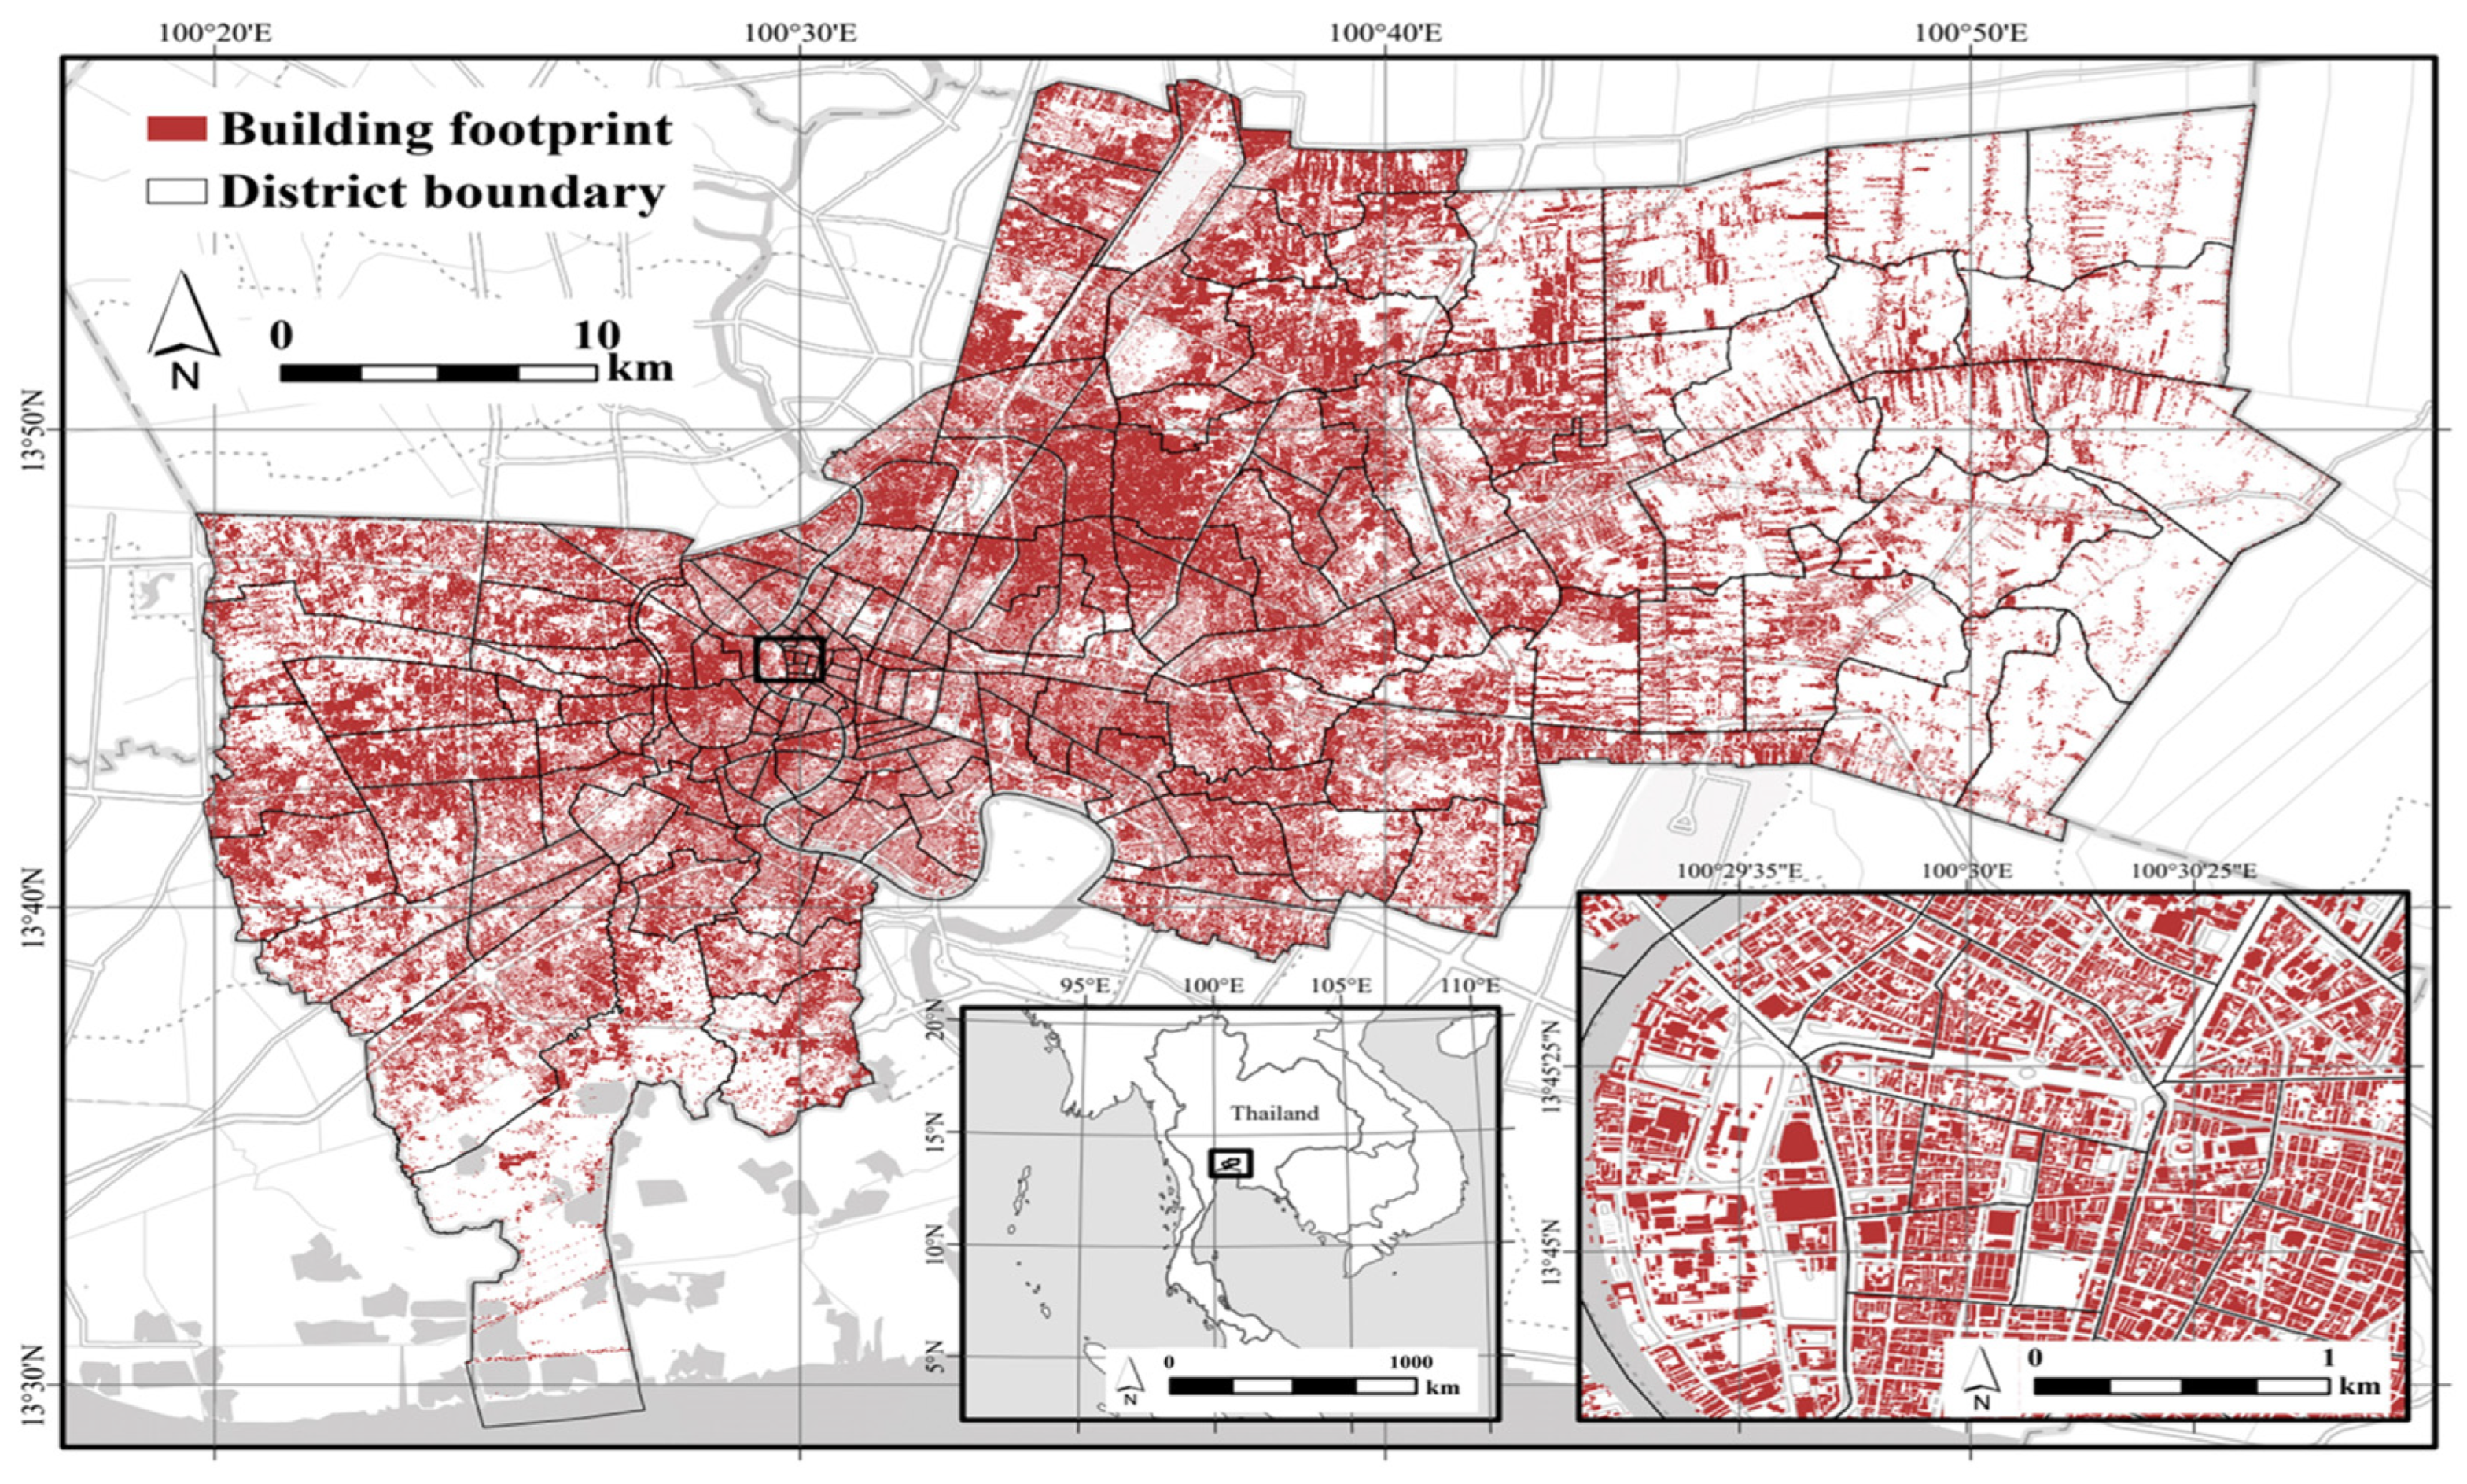
3.3. Rooftop Area and Maximum PV Capacity

The study area is Bangkok City, Thailand (Figure 3). The study area covers an area of about 1568.7 km2 and includes 1,105,299 buildings with a total rooftop area of 257.3 km2 based on Microsoft Building Footprint data [47]. In 2022, Microsoft detected building footprints around the world from their Bing Maps imagery between 2014 and 2022, including Airbus, IGN France, and Maxar imagery, using deep learning methods for object classification. The classification has two phases: (1) semantic segmentation to recognize building pixels in an aerial image using deep neural networks and (2) polygonization to convert detected building pixels into polygons. The main goal of this product is to increase the coverage of building footprints available for OpenStreetMap. In fact, the number of buildings in Bangkok based on OpenStreetMap in 2022 is only 85,031, sparsely covering the suburban area. We used the Microsoft data as estimates of rooftop areas in Bangkok City. We assumed 70% of the rooftop area as the maximum space for PV installation [14]. Thus, we estimated 36.8 GW (=257.3 (km2)/7 (m2/kW)) as the maximum PV capacity for Bangkok City.

3.4. System Cost and Operation

The cost of a PV system has declined globally in the past several decades, and it is expected to continue to decrease over the next several decades [10]. The price of residential PV system installation in Thailand was reportedly USD 4065/kW in 2013. Then, it further decreased to USD 3156/kW in 2014, USD 2830/kW in 2015, and USD 1966/kW in 2018 [52]. The investment cost for a rooftop PV system was set at 1350 USD·kW−1 in 2020. The cost of PV in 2030 was set at 470 USD·kW−1, which is close to the current price in India, the cheapest price in the world at present [52,53,54]. The estimated cost of PV maintenance has been determined to be 0.68% of the investment cost on a first-year basis [55]. The maintenance cost includes both the operational cost and the cost of a one-time inverter replacement over a period of 20 years. As a result, the total cost can be expressed as 9.18 USD·kW−1·yr−1 (Table 2), as described in [52,55].
In this analysis, the “PV + EV” system was only considered in 2030 because the number of EVs in the city was too small in 2020 [13,14,40]. The battery state of charge (SOC) was set to a minimum value of 50% and a maximum value of 95% (Figure 4). A total battery capacity of 202.9 GWh was used, assuming that all light-duty vehicles are converted to EVs. The discharge rate of EVs was set as 30.4 GW (6 kW for each vehicle). When the batteries degrade to 80% of the initial capacity, they were replaced at a cost of 91 USD·kWh−1. A price of 22 USD·kWh−1 was used as the additional cost of EV installation (Table 2) [14].

3.5. Electricity Demand and Tariffs

In this study, hourly electricity demand was estimated using SAM with the “Electric Load” function, constrained by monthly electric consumption data [45]. The yearly electricity consumption of the household sector was 15.3 TWh and the industry sector’s consumption was 35.4 TWh in Bangkok City in 2021 [45] (Table 3). Electricity tariffs in Thailand are generally subdivided into household and industry sectors, and we used a weighted electricity tariff of 0.14 USD·kWh−1 for the analyses (Table 3). The FIT price for the residential sector was 0.06 USD·kWh−1, while the FIT for other sectors was 0.03 USD·kWh−1 [57]. Thus, we used a weighted FIT price of 0.04 USD·kWh−1 (Table 3). Since electricity tariffs in Thailand are infrequently adjusted, these tariffs were applied in all the analyses.

4. Result

4.1. Scenarios

Six scenarios were analyzed for Bangkok with rooftop PV plus EV combinations with or without FITs (Table 4). As the prices of PV and EV are expected to drop substantially over the next several decades, scenarios were considered for 2020 and 2030 with actual costs in 2020 and estimated costs in 2030. The PV-only system was considered in Scenarios A, B, C, and D for 2020 and 2030, while “PV + EV” in Scenarios E and F was considered only for 2030.

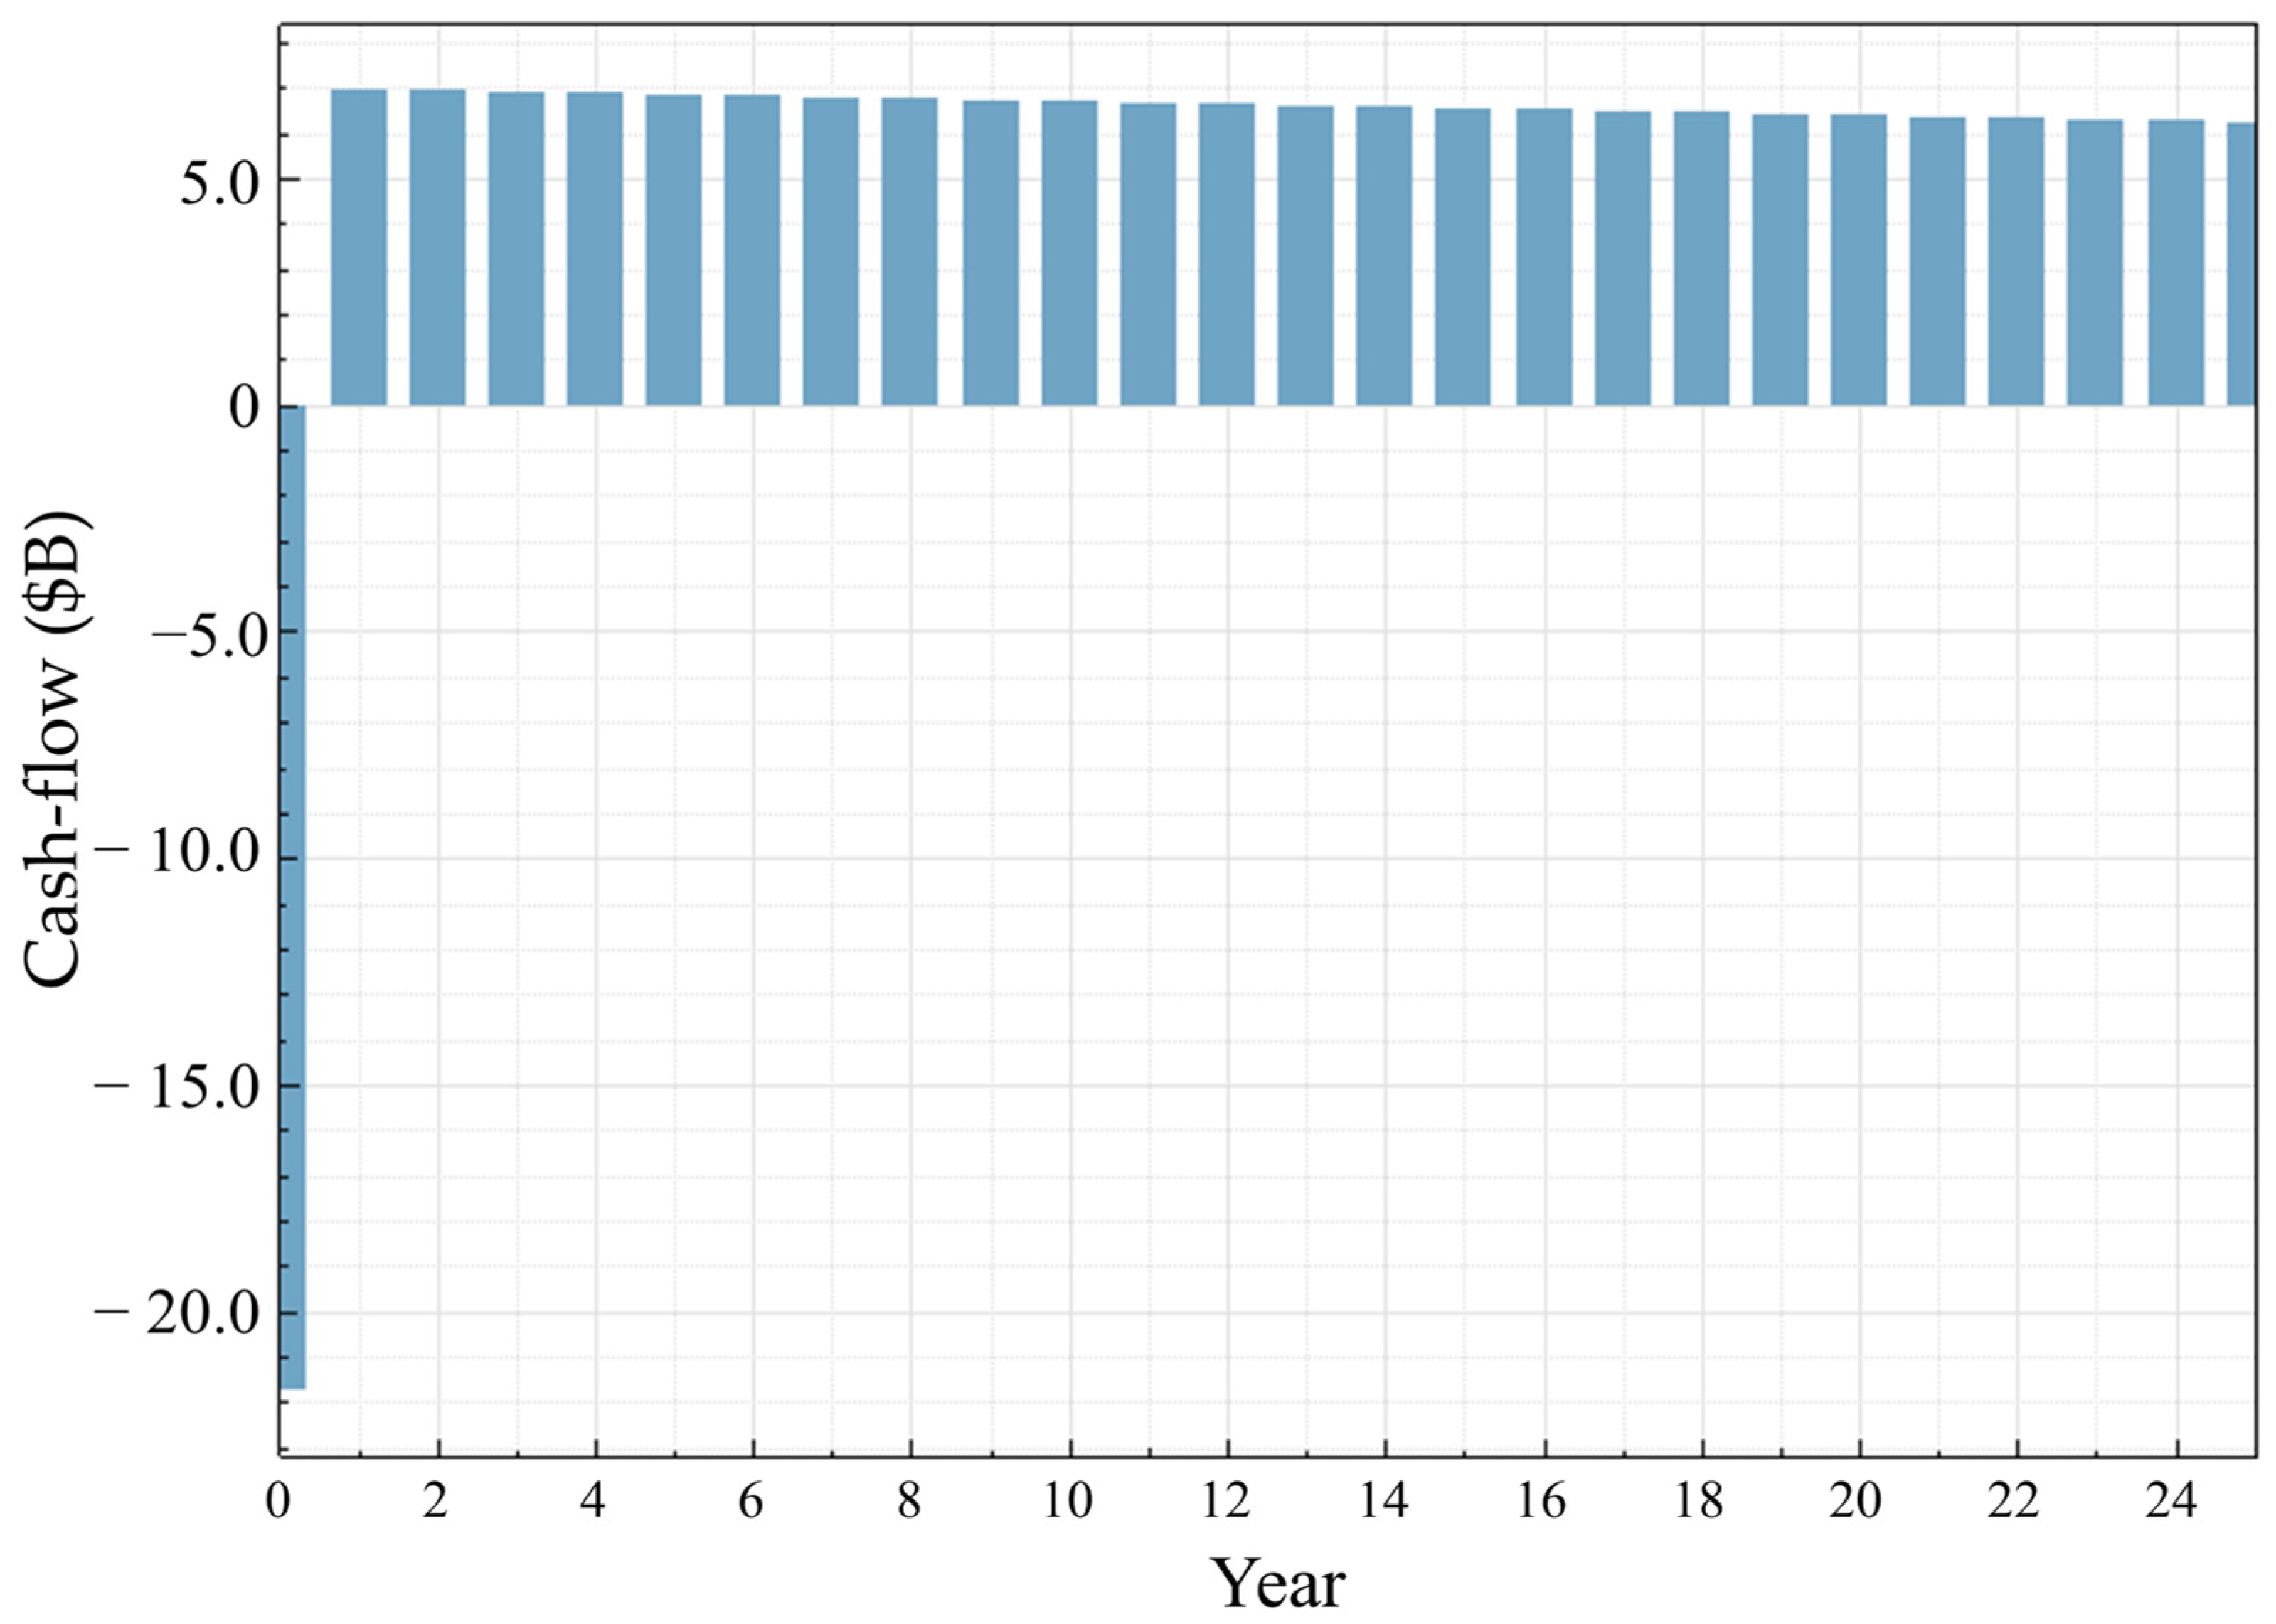
4.2. Techno-Economic Assessments

The NPVs of all the scenarios are positive, indicating that the PV projects in all scenarios were already viable in 2020. Scenario E (PV + EV with FIT in 2030) has the highest NPV, but it is close to Scenario F (PV + EV without FIT in 2030) (Table 5). NPVs in 2030 become significantly higher than those of 2020 because the costs of PV and EV in 2030 are cheaper than those in 2020, and optimal PV capacities are larger in 2030. In all the scenarios, the cash flow in the first year is negative and large because initial investments at the beginning of the project are large for PV installation (Table 2). However, in the following years, the cash flow becomes constantly positive because no fuel is necessary, and maintenance costs are smaller than fossil fuel power plants (Figure 5). In the study of Bangkok City, EV battery degradation was relatively minor (no replacement during the project period (Figure 5)) owing to the low surplus electricity to be used for the battery (Table 5).

4.3. Impacts of FITs on Decarbonization Potential

Electricity tariffs and FITs play important roles in defining the decarbonization potential of rooftop PV systems. In 2020, the results of “PV only” with FITs indicate that the PV capacity increases to 22.1 GW and obtains about a 15% higher NPV than that of “PV only” without FITs, with a PV capacity of 14.4 GW. However, the self-consumption of “PV only” with FITs decreases to 64% compared to the self-consumption (86%) of “PV only” without FITs (Table 5). In 2030, the cost of EVs is estimated to be lower than that of ICEs. Discounted payback periods for Scenarios C and D decreased to 4 years with FITs and without FITs. Scenario D reaches the maximum PV capacity of 24.7 GW in 2030. When “PV only” cases are compared between 2020 and 2030, the cost savings in 2030 increase to more than twice the 2020 value (Table 5). These results indicate that the FIT policy will play a smaller role in 2030 than will the decreasing cost of PV. In the case of “PV + EV”, self-consumption increases, reducing the amount of electricity sold to the grid. It is notable that optimal PV capacities in all the scenarios of “PV + EV” grow at its maximum capacity of 36.8 GW. Consequently, the cost savings and energy sufficiency both with and without FITs in the “EV + PV” scenarios did not significantly differ (Table 5).

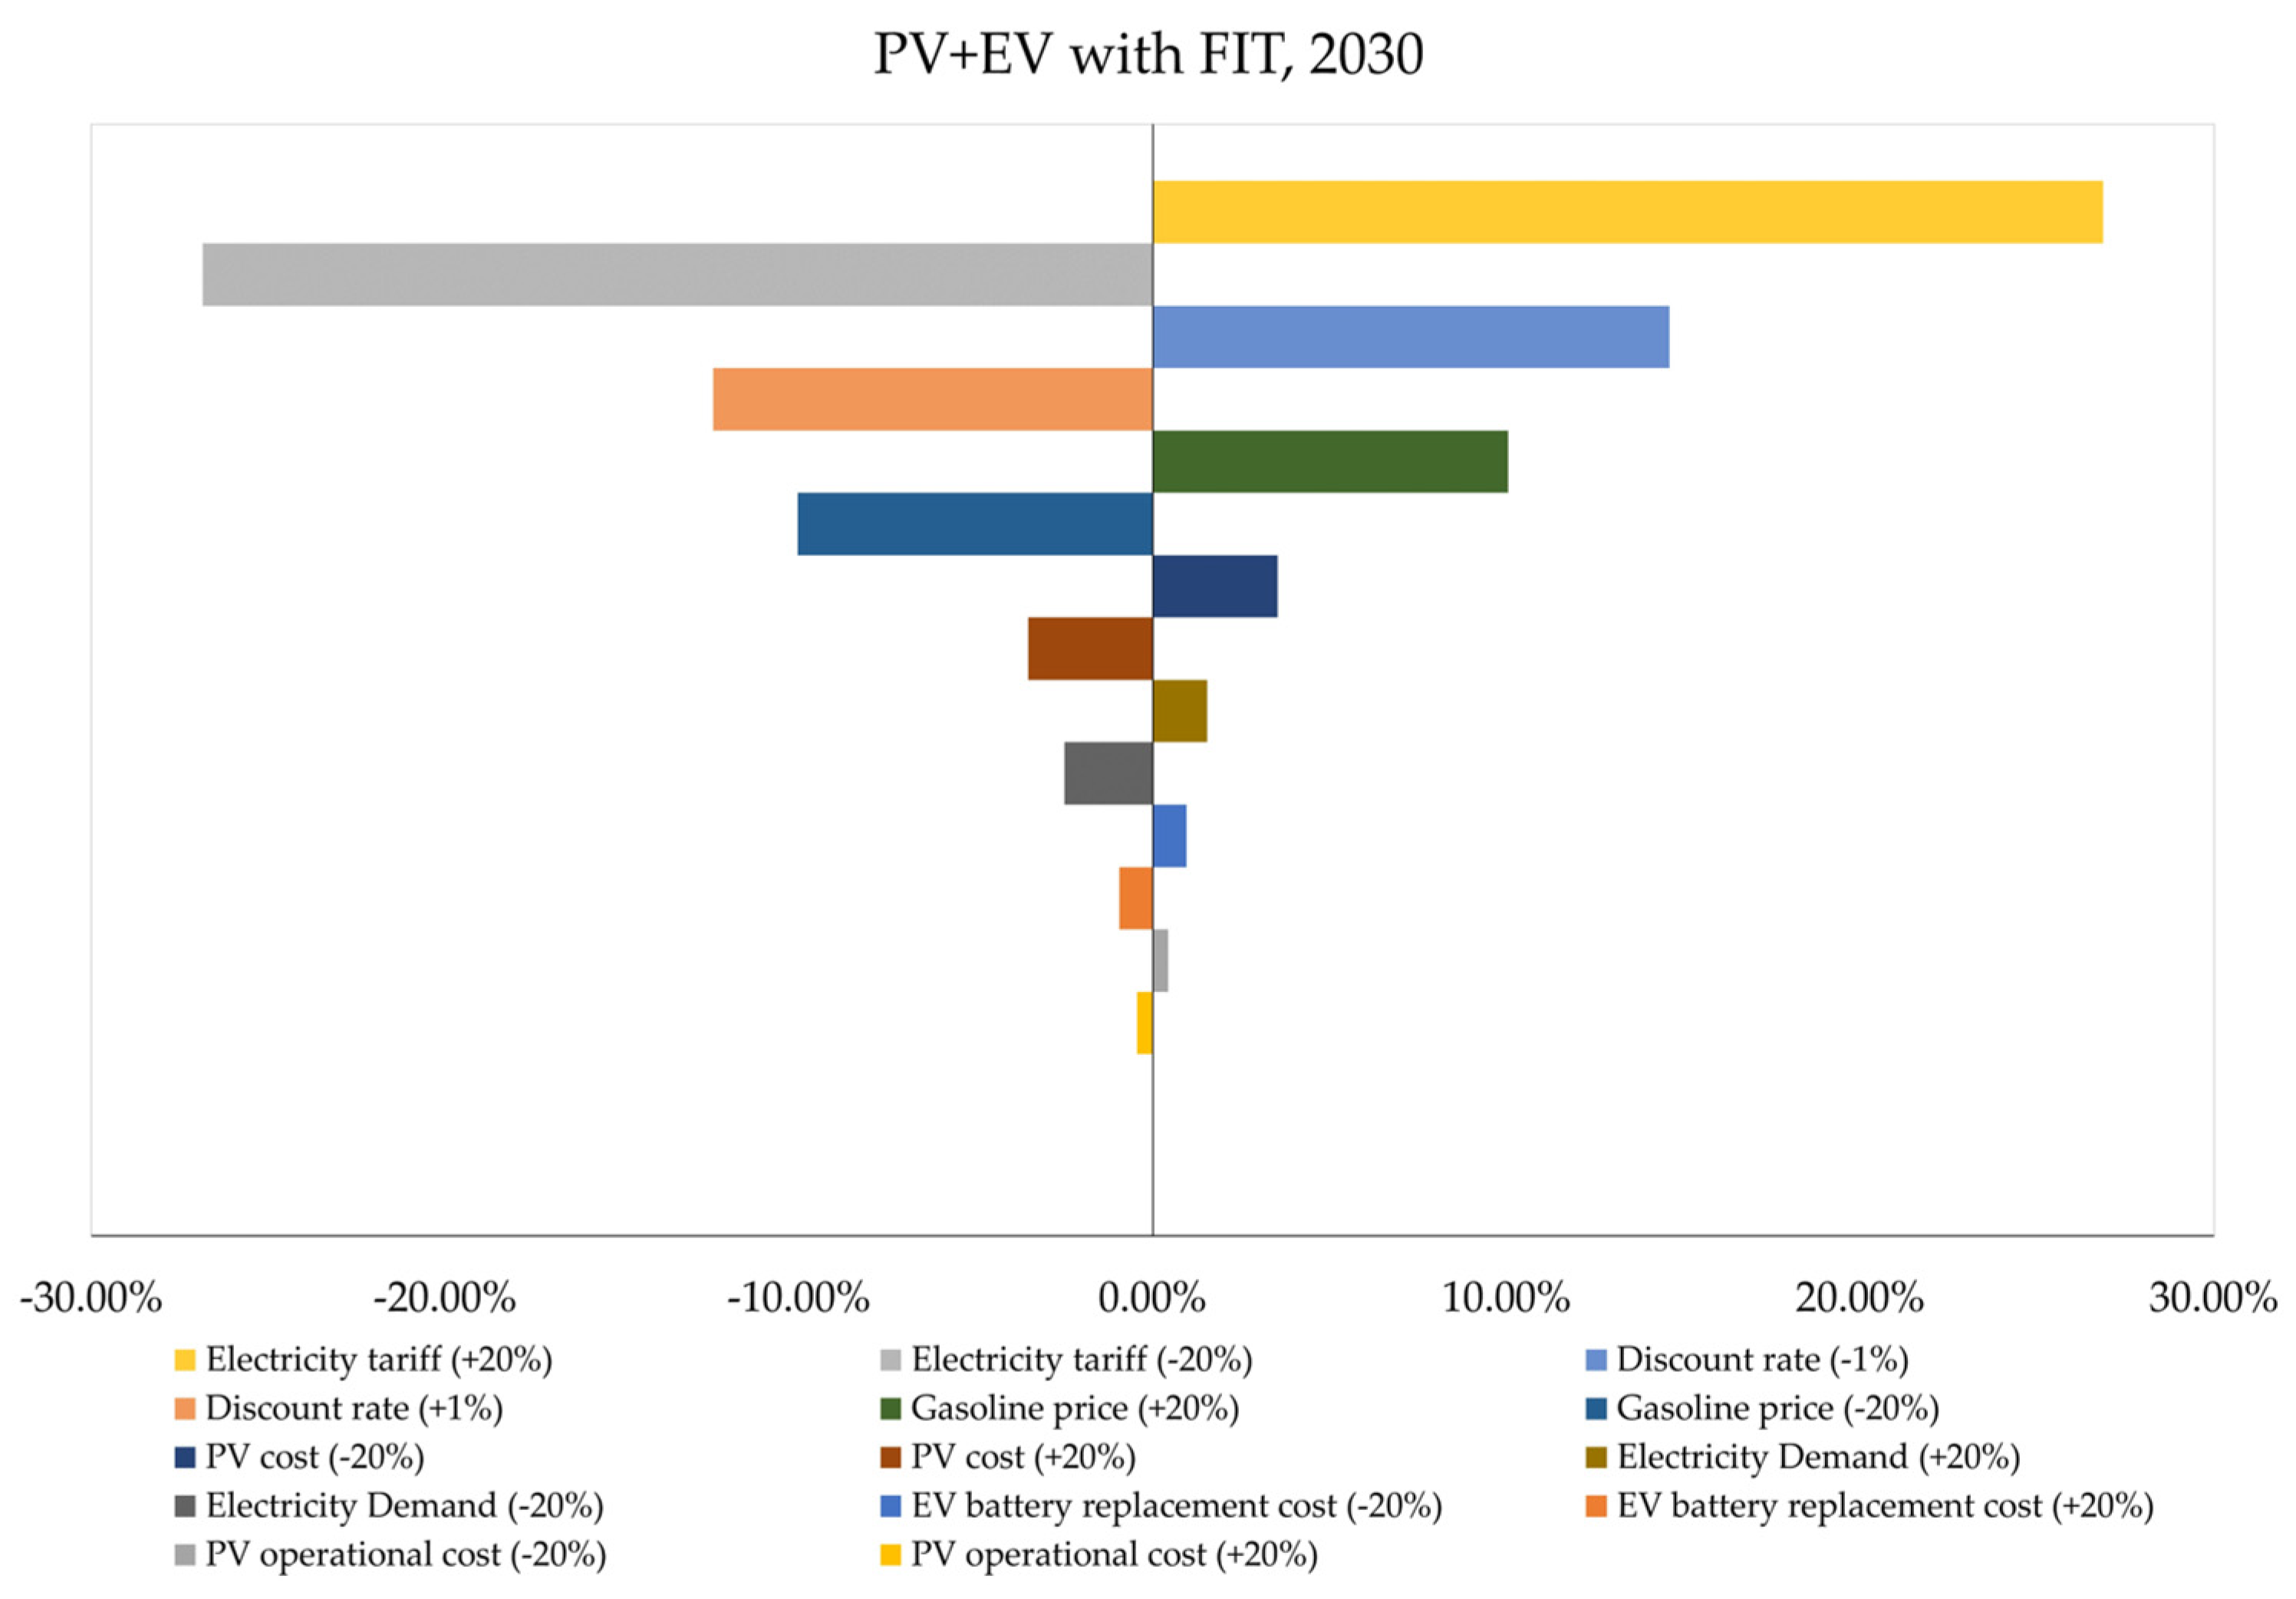
4.4. Sensitivity Analysis

NPV calculations depend on various parameters with assumptions. Hence, sensitivity analyses are necessary to evaluate whether these assumptions are valid to reach conclusions. Sensitivity analyses were conducted for the electricity tariff, discount rate, gasoline price, PV installation cost, electricity demand, EV battery replacement cost, PV operational cost, and FIT price using the one-way sensitivity analysis method (Figure 6). In conducting the sensitivity analysis, we ensured that these parameters were tested in a range of ±20% and used Scenario E (“PV + EV” for the year 2030), which produced the highest reduction in CO2 emissions (73%) among all the scenarios with the maximum PV capacity of 36.8 GW and an associated NPV of USD 9404 million (Table 5). The model was run with changes in each parameter, with the resulting NPV being calculated for each respective model iteration. After the resultant NPV values were obtained, the percentages between the model outputs and the initial NPVs were calculated to determine the sensitivities of the parameters (Figure 6).
The largest change of ±27% in NPVs occurred when the “electricity tariff” was changed by ±20% (Figure 6). The discount rate represents another critical parameter. Changes in the discount rate to 4% and 2% from 3% result in corresponding variations of −12% and +14% in NPVs, respectively. Then, changing the gasoline price by ±20% results in a ±10% change in NPVs. A 20% increase and 20% decrease in electricity demand resulted in +1.5% and −2.5% changes in NPVs, respectively. Changing the PV installation cost by ±20% resulted in a ±3.52% change in NPVs. Changes of ±20% in PV operation costs result in a ±0.44% change in NPVs. Changing EV battery replacement costs by ±20% results in a ±0.95% change in NPVs. Lastly, changes of ±20% in the FIT price result in a nearly 0% change in NPVs due to little electricity sold to the grid in this scenario (95% self-consumption) (Table 5).

5. Discussion

5.1. Deep Decarbonization of Bangkok City Using Rooftop PV and EVs

We have shown that compared to the “PV only” system, the “PV + EV” system has a substantially higher potential to reduce CO2 emissions as well as energy costs in Bangkok City. The reduction in CO2 emissions is estimated to be about 73% regardless of FIT availability, or approximately 29.7 MtCO2 from electricity consumption and driving. On the other hand, the “PV only” system can only reduce 20% to 30% of CO2 emissions in Bangkok City. The results also show that approximately 11.9 MtCO2 will be reduced if all the cars in Bangkok City are shifted to EVs with energy supplied from renewable energy (e.g., PV). The “PV + EV” system will not only help reduce CO2 emissions but also reduce energy costs by up to 59% in 2030. The Bangkok Metropolitan Administration (BMA) is dedicated to promoting sustainability within the city. As part of this effort, the BMA has established a goal of reducing CO2 emissions by 50% by the year 2030. This goal is part of a larger plan called the “Bangkok Climate Change Adaptation Plan”, which aims to mitigate climate change and its impacts on Bangkok City [61]. The EV penetration in Bangkok City is still in the beginning stage. To achieve carbon neutrality by 2065, it is necessary to introduce more supporting policies for the purchase of EVs or enforce more stringent regulations on CO2 emissions from vehicles in Bangkok City.
The development of a distributed energy system requires the participation of the government, industry, and citizens (Figure 1). Although rooftop PV and EVs would provide substantial benefits to Bangkok society, the promotion of these technologies in an actual environment may face numerous barriers, including complex existing policies and regulations, capital-intensive investment, the current unsupportable grid system, etc. For example, according to building control regulations in Bangkok, a rooftop area ≤ 160 m2 with a weight ≤ 20 kg∙m−2 requires an approval document from the government for PV installation, while a rooftop area ≥ 160 m2 with a weight ≥ 20 kg∙m−2 requires the submission of a plan from the civil engineering company [62]. In addition, the upfront costs of rooftop PV are high for citizens in Bangkok (Table 5). Similarly, EVs are associated with financial barriers such as high purchase costs and low resale values. Moreover, the short driving ranges of EVs [63] create the perception that it is difficult to use for long trips owing to a limited number of charging stations. In order to make PV and EVs more attractive, sufficient financial support through subsidies, tax breaks, etc., should be provided until the costs of these technologies decline. Another barrier would be the grid system in Thailand. High penetration of PV and EVs is expected to cause problems for power grid operation. Thus, the digitalization of the power system, updates of grids, and deregulation need to be performed with increasing PV and EV penetration.

5.2. Decarbonization Comparison between Bangkok and Kyoto Cities

In order to highlight the characteristics of the “PV + EV” system in Bangkok, we compared the results with those of Kyoto City, Japan (35° N, 135.7° E) [14]. The total area of Bangkok is 1569 km2, which is almost twice that of Kyoto City (828 km2). In addition, the population of Bangkok is more than 3 times larger than that of Kyoto (1.5 million). Kyoto receives an average of 1780 h of sunlight per year, whereas Bangkok City (13.8° N, 100.6° E) receives approximately 2630 h of sunlight annually, indicating that Bangkok receives 50% more sunlight than Kyoto in terms of hours [64,65]. Kyoto has a maximum rooftop capacity of 7.37 GW using 70 % of the total rooftop area, whereas Bangkok has a maximum of 36.8 GW owing to the larger size of the city. The maximum use of rooftop PV in Kyoto is capable of producing the same amount of annual electricity demand. If the demand/supply balance is considered at an hourly resolution, the “PV + EV” system in Kyoto can meet 70% of its demand. On the other hand, the “PV + EV” system in Bangkok with the maximum rooftop PV capacity can produce about 75% of its annual demand, including EV charging (Figure 7c), which provides little excess electrical power. Therefore, Bangkok is increasingly more energy-intensive, with higher buildings and more driving than Kyoto. For a carbon-neutral energy system, Bangkok will need to import energy from outside of the city. Alternatively, it can develop less-intensive urban energy systems, for example, with low-rise buildings, higher energy efficiency, and public transport, which is more similar to Kyoto’s system.
Kyoto and cities in Japan are facing the challenge of population decline over the next decades [40]. A decreasing population will limit financial resources to the city government for decarbonization, but the energy demand will decrease as well. On the other hand, Bangkok’s population has been increasing since the 1950s, and it is estimated to increase by about 10% over the next 10 years [66], which could result in greater financial resources available to the city government for building new infrastructure. However, the population increase will create a rise in energy demand. Therefore, different management strategies for decarbonization will be necessary for Bangkok and Kyoto.

5.3. Policy Implications for Bangkok City

The Thai government has implemented the Solar Incentive Program with the primary objective of promoting the use of PV systems for self-consumption and, to a lesser extent, for the supply of excess electricity back to the grid. However, the program has not been widely adopted, with an accomplishment of less than 5 MWp since its inception in 2019 [57]. The results presented in Table 5 suggest that the FIT policy has a significant impact on PV capacity when EV is not taken into account, and thus, given the crucial role that PV and EV technologies play in decarbonizing Bangkok City, the policy should be optimized. Therefore, the government should focus on increasing the FIT price to incentivize people to use PV while the EV transition remains slow. This approach can encourage people to invest in PV systems, thereby increasing PV capacity and its contribution to decarbonization efforts. It is also important to revisit and adjust the FIT policy to reflect changing market conditions and the evolving needs of the renewable energy sector, in tandem with supplementary financial incentives such as tax credits or low-interest-rate loans. These incentives can be tailored to leverage the choices for high- and low-income individuals and enhance the rate of PV installations in Bangkok. While the affordability of EVs is predicted to increase in the near future, the incentives to promote EVs and V2H systems, such as investments in charging station infrastructure or subsidies for EV and/or V2H purchases, must not be neglected to expedite the proliferation of “PV + EV” technology by 2030.

5.4. Limitations of the Study

There are a few important points to be discussed as limitations of the study. First, the current study focused on assessing the potential of rooftop PV systems in conjunction with EVs for Bangkok City owing to the high priority of rooftop PV in urban decarbonization. However, to reach carbon neutrality in Bangkok, other sources of renewable energy, such as hydro, wind, biomass, and hydrogen, will play important roles as well. Therefore, future studies should include these technologies to identify more detailed decarbonization pathways toward carbon neutrality. Second, the costs of PV and EV technologies are subject to decrease, but the speed of the decline may not be as fast as we described in this study, requiring further analyses regarding the costs in future studies. Third, recently, the Thai government has been rapidly updating its decarbonization plans. To further investigate the feasibility of the “PV + EV” system, future studies should explore necessary policy changes, market reforms, and their effects on the adoption of PV and EV technologies, taking into consideration the latest policies. Fourth, given the significance of social and political factors in shaping the implementation of the “PV + EV” system, it is necessary to include public opinion, politics, and regulatory frameworks for future research.

6. Conclusions

In conclusion, the declining costs of renewable energy and EVs offer new opportunities to decarbonize energy systems not only for developed but also for developing countries. Our analysis demonstrated how rooftop “PV only” and “PV + EV” systems may play roles in the decarbonization of energy systems in Bangkok City, Thailand, to realize carbon neutrality. The “PV + EV” system with the FIT policy emerged as the most promising scenario, providing optimal economic and environmental benefits. By 2030, the NPV of the “PV + EV” system would reach USD 94 billion with an estimated first-year energy production of 50 TWh. CO2 emissions could be reduced by 73% from electricity and driving, contributing significantly to the rapid decarbonization of Bangkok City. To build the new power system with rooftop PV integrated with EVs in Bangkok, several steps need to be taken. Currently, PV and EV penetration policies are being targeted independently by the government. Governments should also adopt policies to support integrated “PV + EV” systems (e.g., V2H systems) that are economically and environmentally more efficient. According to the analysis of this study, highly efficient and technologically advanced “PV + EV” may spread quickly once the prices of PV and EVs are sufficiently low. In order to facilitate the transition, it is necessary to reform the regulatory environment and pricing structure for electricity to create new business models. However, as rooftop PV plus EVs in Bangkok City can support at most 71% of the annual electricity demand of the city in the conditions we considered, energy supply from outside of the city and/or further technologies such as hydrogen need to be considered to reach carbon neutrality in Bangkok City.

Supplementary Materials

The following supporting information can be downloaded at: https://www.mdpi.com/article/10.3390/en16073011/s1, Figure S1: Scenario A: PV only with FIT in 2020; Figure S2: Scenario B: PV only without FIT in 2020; Figure S3: Scenario C: PV only with FIT in 2030; Figure S4: Scenario D: PV only without FIT in 2030; Figure S5: Scenario E: PV+EV with FIT in 2030; Figure S6: Scenario F: PV+EV without FIT in 2030.

Author Contributions

Conceptualization, T.J. and T.K.; methodology, T.K.; software, T.J.; validation, T.J. and T.K.; formal analysis, T.J., M.S. and T.Y.; investigation, T.J., M.S. and T.Y.; data curation, T.J.; writing—original draft preparation, T.J., M.S. and T.Y.; writing—review and editing, T.K.; visualization, T.J.; supervision, T.K.; project administration, T.K. All authors have read and agreed to the published version of the manuscript.

Funding

This research received no external funding.

Data Availability Statement

SAM data is available at Jittayasotorn, Thiti; Kobashi, Takuro (2023), “Bangkok SAM files”, Mendeley Data, V1: https://data.mendeley.com/datasets/h564pys4w5/1 (accessed on 21 March 2023).

Conflicts of Interest

The authors declare no conflict of interest.

Nomenclature

PVPhotovoltaic
SAMSystem Advisor Model
FITFeed-in-tariff
EVElectric vehicle
BEVBattery electric vehicle
DoDDepth of discharge
NPVNet present value
SOCState of charge
V2HVehicle to Home
V2BVehicle to Building
ICEInternal combustion engine
ICTInformation and Communication Technology
VPPVirtual power plant

References

  1. IPCC Climate Change 2022: Impacts, Adaptation, and Vulnerability. Contribution of Working Group II to the Sixth Assessment Report of the Intergovernmental Panel on Climate Change. 2022. Available online: https://www.ipcc.ch/report/ar6/wg2/ (accessed on 10 February 2023).
  2. IPCC Climate Change 2022: Mitigation of Climate Change. Contribution of Working Group III to the Sixth Assessment Report of the Intergovernmental Panel on Climate Change. 2022. Available online: https://www.ipcc.ch/report/ar6/wg3/ (accessed on 10 February 2023).
  3. IPCC Climate Change 2021: The Physical Science Basis. Contribution of Working Group I to the Sixth Assessment Report of the Intergovernmental Panel on Climate Change. 2021. Available online: https://www.ipcc.ch/report/ar6/wg1/ (accessed on 10 February 2023).
  4. Jackson, R.B.; Le Quéré, C.; Andrew, R.M.; Canadell, J.G.; Korsbakken, J.I.; Liu, Z.; Peters, G.P.; Zheng, B. Global energy growth is outpacing decarbonization. Environ. Res. Lett. 2018, 13, 120401. [Google Scholar] [CrossRef]
  5. Echeverri, L.G. Investing for rapid decarbonization in cities. Curr. Opin. Environ. Sustain. 2018, 30, 42–51. [Google Scholar] [CrossRef]
  6. IRNEA. Renewable Power Generation Costs in 2021; IRENA: Masdar City, United Arab Emirates, 2022; ISBN 978-92-9260-244-4. [Google Scholar]
  7. Vanegas Cantarero, M.M. Of renewable energy, energy democracy, and sustainable development: A roadmap to accelerate the energy transition in developing countries. Energy Res. Soc. Sci. 2020, 70, 101716. [Google Scholar] [CrossRef]
  8. Gumilang, R.; Welo, U.; Siagian, R.; Asmara, B.; Dyah, S.; Ichihara, J.; Kobashi, T. Equitable, affordable, and deep decarbonization pathways for low-latitude developing cities by rooftop photovoltaics integrated with electric vehicles. Appl. Energy 2023, 332, 120507. [Google Scholar] [CrossRef]
  9. Di Silvestre, M.L.; Favuzza, S.; Riva Sanseverino, E.; Zizzo, G. How Decarbonization, Digitalization and Decentralization are changing key power infrastructures. Renew. Sustain. Energy Rev. 2018, 93, 483–498. [Google Scholar] [CrossRef]
  10. IEA. World Energy Outlook 2022; IEA: Vienna, Austria, 2022. [Google Scholar]
  11. Kobashi, T.; Choi, Y.; Hirano, Y.; Yamagata, Y.; Say, K. Rapid rise of decarbonization potentials of photovoltaics plus electric vehicles in residential houses over commercial districts. Appl. Energy 2022, 306, 118142. [Google Scholar] [CrossRef]
  12. Chang, S.; Cho, J.; Heo, J.; Kang, J.; Kobashi, T. Energy infrastructure transitions with PV and EV combined systems using techno-economic analyses for decarbonization in cities ☆. Appl. Energy 2022, 319, 119254. [Google Scholar] [CrossRef]
  13. Kobashi, T.; Jittrapirom, P.; Yoshida, T.; Hirano, Y.; Yamagata, Y. SolarEV City concept: Building the next urban power and mobility systems. Environ. Res. Lett. 2021, 16, 024042. [Google Scholar] [CrossRef]
  14. Kobashi, T.; Yoshida, T.; Yamagata, Y.; Naito, K.; Pfenninger, S.; Say, K.; Takeda, Y.; Ahl, A.; Yarime, M.; Hara, K. On the potential of “Photovoltaics + Electric vehicles” for deep decarbonization of Kyoto’s power systems: Techno-economic-social considerations. Appl. Energy 2020, 275, 115419. [Google Scholar] [CrossRef]
  15. Liu, J.; Li, M.; Xue, L.; Kobashi, T. A framework to evaluate the energy-environment-economic impacts of developing rooftop photovoltaics integrated with electric vehicles at city level. Renew. Energy 2022, 200, 647–657. [Google Scholar] [CrossRef]
  16. United Nations Framework Convention on Climate Change (UNFCCC). Mid-Century, Long-Term Low Greenhouse Gas Emission Development Strategy. 2021. Available online: https://unfccc.int/sites/default/files/resource/Thailand_LTS1.pdf. (accessed on 13 September 2022).
  17. World Bank. GDP per Capita, PPP—Thailand. Available online: https://data.worldbank.org/indicator/NY.GDP.PCAP.PP.CD?locations=TH (accessed on 1 February 2023).
  18. Chandler, M.H.M. Thailand’s First Climate Change Bill to be Submitted for Approval. 2022. Available online: https://www.lexology.com/account/login?ReturnUrl=%2flibrary%2fdetail.aspx%3fg%3d07c23552-5798-47d4-b986-0dbc96690c9f (accessed on 11 September 2022).
  19. Solargis. Solar Resource Maps of Asia. Available online: https://solargis.com/maps-and-gis-data/download/asia (accessed on 1 February 2023).
  20. Junlakarn, S.; Kittner, N.; Tongsopit, S.; Saelim, S. A cross-country comparison of compensation mechanisms for distributed photovoltaics in the Philippines, Thailand, and Vietnam. Renew. Sustain. Energy Rev. 2021, 145, 110820. [Google Scholar] [CrossRef]
  21. Sagulpongmalee, K.; Therdyothin, A.; Nathakaranakule, A. Analysis of feed-in tariff models for photovoltaic systems in Thailand: An evidence-based approach. J. Renew. Sustain. Energy 2019, 11, 045903. [Google Scholar] [CrossRef]
  22. Silva, K.; Janta, P.; Chollacoop, N. Points of Consideration on Climate Adaptation of Solar Power Plants in Thailand: How Climate Change Affects Site Selection, Construction and Operation. Energies 2022, 15, 171. [Google Scholar] [CrossRef]
  23. Khamchiangta, D.; Yamagata, Y. Mapping urban carbon emissions in relation to local climate zones: Case of the building sector in Bangkok Metropolitan Administration, Thailand. Energy Built Environ. 2022. [Google Scholar] [CrossRef]
  24. Department of Land and Transport (DLT). Transport Statistics Report 2020. 2020. Available online: https://web.dlt.go.th/statistics/load_file_select.php?tmp=1978.031081990883&data_file=1190 (accessed on 11 September 2022).
  25. Farrow, A.; Anhauser, A.; Moun-Ob, A. The Burden of Air Pollution in Thailand 2021 The Burden of Air Pollution in Thailand 2021. 2022. Available online: https://www.greenpeace.org/static/planet4-southeastasia-stateless/2022/06/67375e28-the-burden-of-air-pollution-in-thailand_2021.pdf (accessed on 11 September 2022).
  26. OICA. 2021 Production Statistics. Available online: https://www.oica.net/category/production-statistics/2021-statistics/ (accessed on 1 February 2023).
  27. The Nation Thailand Government Pushing for Thailand’s Emergence as EV Hub in Asean. Available online: https://www.nationthailand.com/thailand/general/40022681 (accessed on 7 February 2023).
  28. Marklines Thailand: EV Promotion, Subsidy, etc. Available online: https://www.marklines.com/ja/report/rep2401_202212 (accessed on 7 February 2023).
  29. The Nation Thailand EV. Available online: https://www.nationthailand.com/special-edition/ev/40023978 (accessed on 8 February 2023).
  30. Marklines Automotive Sales in Thailand 2022. Available online: https://www.marklines.com/ja/statistics/flash_sales/automotive-sales-in-thailand-by-month (accessed on 8 February 2023).
  31. International Energy Agency. Global EV Outlook 2022 Securing Supplies for an Electric Future; OECD Publishing: Paris, France, 2022. [Google Scholar]
  32. Kaewpasuk, S.; Intiyot, B.; Jeenanunta, C. Impact of Electric Vehicles and Solar PV on Future Thailand’s Electricity Daily Demand. Int. Sci. J. Eng. Technol. (ISJET) 2020, 4, 21–33. [Google Scholar]
  33. Kikusato, H.; Mori, K.; Yoshizawa, S.; Fujimoto, Y.; Asano, H.; Hayashi, Y.; Kawashima, A.; Inagaki, S.; Suzuki, T. Electric Vehicle Charge-Discharge Management for Utilization of Photovoltaic by Coordination between Home and Grid Energy Management Systems. IEEE Trans. Smart Grid 2019, 10, 3186–3197. [Google Scholar] [CrossRef]
  34. Tan, K.M.; Ramachandaramurthy, V.K.; Yong, J.Y. Integration of electric vehicles in smart grid: A review on vehicle to grid technologies and optimization techniques. Renew. Sustain. Energy Rev. 2016, 53, 720–732. [Google Scholar] [CrossRef]
  35. Chen, J.; Zhang, Y.; Li, X.; Sun, B.; Liao, Q.; Tao, Y.; Wang, Z. Strategic integration of vehicle-to-home system with home distributed photovoltaic power generation in Shanghai. Appl. Energy 2020, 263, 114603. [Google Scholar] [CrossRef]
  36. Furuya, K. V2H system and energy management. In Urban Decarbonization; Kobashi, T., Ed.; Taiga Publishing: Tokyo, Japan, 2021. (in press) [Google Scholar]
  37. Fan, S.; Liu, J.; Wu, Q.; Cui, M.; Zhou, H.; He, G. Optimal coordination of virtual power plant with photovoltaics and electric vehicles: A temporally coupled distributed online algorithm. Appl. Energy 2020, 277, 115583. [Google Scholar] [CrossRef]
  38. National Renewable Energy Laboratory (NREL). System Advisor Model (SAM). 2021. Available online: https://sam.nrel.gov/ (accessed on 22 April 2022).
  39. Blair, N.; Diorio, N.; Freeman, J.; Gilman, P.; Janzou, S.; Neises, T.W.; Wagner, M.J. System Advisor Model (SAM) General Description. 2018. Available online: https://www.nrel.gov/docs/fy18osti/70414.pdf (accessed on 22 April 2022).
  40. Kobashi, T.; Yamagata, Y. Techno-economic assessment on PV systems integrated with batteries and electric vehicles in residential area and urban district in Japan. In Proceedings of the International Conference on Applied Energy 2020, Virtual, 1–10 December 2020. [Google Scholar] [CrossRef]
  41. Takahashi, K.; Louhisuo, M. IGES List of Grid Emission Factors; Institute for Global Environmental Strategies: Hayama, Japan, 2022. [Google Scholar] [CrossRef]
  42. European Commission. Photovoltaic Geographical Information System. 2022. Available online: https://re.jrc.ec.europa.eu/pvg_tools/en/ (accessed on 16 June 2022).
  43. Energy Policy and Planning Office (EPPO). Energy Statistic: Electricity. 2021. Available online: http://www.eppo.go.th/index.php/en/en-energystatistics/electricity-statistic (accessed on 17 August 2022).
  44. Department of Land and Transport (DLT). Total Vehicle Registration Data. 2019. Available online: http://www.dlt.go.th/minisite/m_upload/m_download/singburi/file_7cf81db11863f882ac1e6814fbb16c02.pdf (accessed on 30 June 2022).
  45. Metropolitan Electricity Authority (MEA). Statistic Data on Electricity Consumption in 2021. 2021. Available online: https://www.mea.or.th/ (accessed on 30 June 2022).
  46. Bangkok Metropolitan Administration (BMA). The Residential Area Statistic Report in 2018. 2019. Available online: https://webportal.bangkok.go.th/upload/user/00000354/plan/report/07.pdf (accessed on 11 September 2022).
  47. Microsoft. Building Footprint Data. 2021. Available online: https://github.com/microsoft/GlobalMLBuildingFootprints (accessed on 4 November 2022).
  48. Trading Economics. Thailand Gasoline Prices. 2022. Available online: https://tradingeconomics.com/thailand/gasoline-prices (accessed on 22 September 2022).
  49. Phonrattanasak, P.; Nopbhorn, L. Development of Fast Charging Station for Thailand. Int. J. Innov. Manag. Technol. 2014, 3, 668–674. [Google Scholar]
  50. Zhang, R.; Zhang, J.; Long, Y.; Wu, W.; Liu, J.; Jiang, Y. Long-term implications of electric vehicle penetration in urban decarbonization scenarios: An integrated land use–transport–energy model. Sustain. Cities Soc. 2021, 68, 102800. [Google Scholar] [CrossRef]
  51. Nissan Motor Inc. Nissan Begins Testing Energy Supply Demand Management System Using LEAF EVs and “LEAF to Home” Power System. 2014. Available online: https://www.nissanglobal.com/EN/NEWS/2014/_STORY/141016-02-e.html (accessed on 16 September 2022).
  52. IRENA. Renewable Power Generation Costs 2020. 2021. Available online: https://www.irena.org/-/media/Files/IRENA/Agency/Publication/2021/Jun/IRENA_Power_Generation_Costs_2020.pdf (accessed on 27 December 2022).
  53. Energy Policy and Planning Office (EPPO). A FIT Policy for Purchasing Energy Generated from Renewable Sources. 2015. Available online: http://www.eppo.go.th/images/Power/pdf/FT-history/FiT_2558.pdf (accessed on 27 December 2022).
  54. Diorio, N.; Dobos, A.; Janzou, S.; Nelson, A.; Lundstrom, B. Technoeconomic Modeling of Battery Energy Storage in SAM. Technical Report; National Renewable Energy Laboratory: Golden, CO, USA, 2015. [Google Scholar]
  55. Department of Alternative Energy Development and Efficiency (DEDE). Solar PV Rooftop (TH). 2014. Available online: https://webkc.dede.go.th/testmax/sites/default/files/kb00_a109_Solar%20PV%20Rooftop%20%28TH%29.pdf (accessed on 10 September 2022).
  56. CleanTechnica. Just the Facts: The Cost of Solar Has Fallen More Quickly Than Experts Predicted. 2022. Available online: https://cleantechnica.com/2022/06/08/just-the-facts-the-cost-of-solar-has-fallen-more-quickly-than-experts-predicted/#:~:text=For%20more%20than%204%20decades,rate%20near%2010%25%20per%20year (accessed on 10 September 2022).
  57. International Energy Agency (IEA). National Survey Report of PV Power Applications in Thailand: 2021. 2021. Available online: https://iea-pvps.org/wp-content/uploads/2022/09/NSR-of-PV-Power-Applications-in-Thailand-2021.pdf (accessed on 27 December 2022).
  58. Ministry of Economy, Trade and Industry (METI). Roadmap for Variable Renewable Energy (VRE): Integration to Power Grid in Thailand. Technical Report. 2018. Available online: https://www.meti.go.jp/meti_lib/report/H30FY/000664.pdf (accessed on 22 April 2022).
  59. Metropolitan Electricity Authority (MEA). Electricity Rate for Household and Industry. Technical Report. 2021. Available online: https://www.mea.or.th/upload/download/file_0cbe47e5f271ef298469220a52ae00d8.pdf (accessed on 22 April 2022).
  60. Pongprasert, P.; Kubota, H. Why TOD Residents Still Use Car? Urban Reg. Plan. Rev. 2017, 4, 231–250. [Google Scholar] [CrossRef] [Green Version]
  61. Japan International Cooperation Agency (JICA). Bangkok Metropolitan Administration’s Initiative Zero Carbon. 2022. Available online: https://www.jica.go.jp/activities/issues/env_manage/jcci/uurjcd000000fdje-att/presentation_15.pdf (accessed on 20 December 2022).
  62. Department of Local Administration (DLA). Standard for Building Control Administration. 2015. Available online: http://www.dla.go.th/work/e_book/eb1/stan13/stan13.html (accessed on 25 September 2022).
  63. Weiss, M.; Patel, M.K.; Junginger, M.; Perujo, A.; Bonnel, P.; van Grootveld, G. On the electrification of road transport—Learning rates and price forecasts for hybrid-electric and battery-electric vehicles. Energy Policy 2012, 48, 374–393. [Google Scholar] [CrossRef]
  64. Weather and Climate. Average Monthly Hours of Sunshine in Kyoto (Kyoto). 2023. Available online: https://weather-and-climate.com/average-monthly-hours-Sunshine,kyoto,Japan (accessed on 22 February 2023).
  65. Weather and Climate. Average Monthly Hours of Sunshine in Bangkok (Bangkok Province). 2023. Available online: https://weather-and-climate.com/average-monthly-hours-Sunshine,Bangkok,Thailand (accessed on 22 February 2023).
  66. Suwanmontri, C.; Kawashima, H. Trailing and Projecting the Real Population of Bangkok to 2030. J. Sustain. Dev. 2015, 8, 121. [Google Scholar] [CrossRef] [Green Version]
Figure 1. The flowchart shows processes of rooftop PV and EV penetration in Bangkok City (adapted from [14]). 1. Techno-economic assessments are carried out; 2., 3. Bangkok City and local people planning is accelerated for the future design; 4. implementation of new technologies is supported by government incentive policies; 5. the policies incentivize citizens to use EVs and rooftop PV; 6. new technologies are expanded to the city scale.
Energies 16 03011 g001
Figure 2. Temperature, electricity demand, and PV generation at an hourly resolution in Bangkok City. Data for demand and PV generation were calculated using SAM, according to the typical year’s weather file.
Energies 16 03011 g002
Figure 3. Building footprint data for Bangkok, Thailand.
Energies 16 03011 g003
Figure 4. Battery degradation in SAM in relation to the depth of discharge (DoD) and battery cycle. The blue line indicates the degradation rate at a DoD of 20% (80% of its initial state remaining at a minimum), and the green line indicates a DoD of 80% (20% of its initial state remaining at a minimum).
Energies 16 03011 g004
Figure 5. Cash flow in Scenario E. The project starts in 2030: the first negative bar indicates the capital cost, while the horizontal axis represents the year of the project period.
Energies 16 03011 g005
Figure 6. Sensitivity analysis for 20% increase with FITs in 2030 for various parameters.
Energies 16 03011 g006
Figure 7. Results of the analysis for Scenario E. (a) Energy loss. (b) Annual PV generation over the project period (PV capacity: 36.8 GW). (c) Monthly PV generation in comparison to electricity demand in Bangkok City.
Energies 16 03011 g007
Table 1. Input parameters for the analyses of Bangkok City.
Input ParameterUnitValueSource
Latitude, longitude° N, ° E13.83, 100.62[42,45]
Elevationmeter6[42]
Tiltdegree13.8-
Azimuthdegree180-
Populationperson5,666,264[46]
Rooftop areakm2257.3This study and [47]
Maximum PV capacityGW36.8-
PV utilization rate%17.6From SAM’s calculation
Registered passenger vehiclescar5,073,396[44]
Gasoline priceUSD·L1.05[48], 10-year average
Gasoline CO2 emission factorkgCO2·L2.3[14]
EV efficiencykm·kWh−15.3[14]
Annual driving distancekm·yr−115,633Adapted from [49]
Table 2. System cost estimates in 2020 and 2030 were adapted from [6,14,55,56].
ItemsUnitsCosts
PV maintenance cost in 2020 1,2USD·kW−1·yr−19.18
PV maintenance cost in 2030 1,2,3USD·kW−1·yr−13.20
Rooftop PV system in 2020 1USD·W−11.35
Rooftop PV system in 2030 1,2,3USD·W−10.47
EV additional cost in 2030 4USD·kWh−122
EV battery replacement cost in 2030 4USD·kWh−191
1 The cost of rooftop PV was determined based on 2020 residential price data of Thailand [6]. 2 The operation and maintenance cost was derived by modifying Thailand’s residential rooftop PV operation and maintenance price [55]. 3 An estimation was made that the price of PV would decrease annually by 10% until the year 2030 [56]. 4 The parameters for the remaining EV prices were assumed to be the same as those used in the study conducted in Kyoto City [14].
Table 3. Annual electricity consumption, electricity tariffs, and FITs in Bangkok City in 2020. Data are from [57,58,59,60]. A fuel adjustment charge was added at a rate of 0.025 USD·kWh−1. In addition, a 7% tax fee was added to the tariff. Weighted tariff and FIT prices were calculated from electricity consumption.
Yearly Electricity ConsumptionTariffsFITs
(TWh)(USD/kWh)(USD/kWh)
Household (0–10 kW)15.30.130.06
Small business (10–250 kW) 0.140.03
Medium–large business (250–1000 kW)35.40.150.03
Total or weighted50.70.140.04
Table 4. Different scenarios considered for the analyses with FITs in Bangkok City in 2020 and 2030.
ScenarioTechnologiesYearFITs
ARooftop PV2020Applied
BRooftop PV2020Not applied
CRooftop PV2030Applied
DRooftop PV2030Not applied
ERooftop PV + EV2030Applied
FRooftop PV + EV2030Not applied
Table 5. Results of the analyses for “PV only” and “PV + EV” in 2020 and 2030 with FITs and without FITs. USD 1B is equal to USD 1,000,000,000. N/A represents no analyses performed.
With FITWithout FIT
2020PV OnlyPV + EVPV OnlyPV + EV
Optimal PV capacity (GW)22.1N/A14.4N/A
NPV over project period (USD B)26.6N/A23.3N/A
Discounted Payback Period (yr)10.3N/A8.7N/A
Cost Saving (%)8N/A7N/A
CO2 Emission Reduction (%)28N/A24N/A
Self-consumption (%)64N/A86N/A
Self-sufficiency (%)42N/A36N/A
Energy sufficiency (%)65N/A42N/A
2030
Optimal PV capacity (GW)36.836.824.736.8
NPV over project period (USD B)59.994.041.194.0
Discounted payback period (yr)4.03.24.03.2
Cost savings (%)19591359
CO2 emission reduction (%)32732973
Self-consumption (%)43955995
Self-sufficiency (%)46714371
Energy sufficiency (%)109757375
Disclaimer/Publisher’s Note: The statements, opinions and data contained in all publications are solely those of the individual author(s) and contributor(s) and not of MDPI and/or the editor(s). MDPI and/or the editor(s) disclaim responsibility for any injury to people or property resulting from any ideas, methods, instructions or products referred to in the content.

