Article

Analysis of Investments in RES Based on the Example of Photovoltaic Panels in Conditions of Uncertainty and Risk—A Case Study

by
Anna Wojewnik-Filipkowska
1,*,
Paweł Filipkowski
2 and
Olaf Frąckowiak
1
1
Department of Investment and Real Estate, Faculty of Management, University of Gdańsk, Armii Krajowej 101, 81-824 Sopot, Poland
2
Department of Food Chemistry, Technology and Biotechnology, Faculty of Chemistry, Gdańsk University of Technology, Gabriela Narutowicza 11/12, 80-233 Gdańsk, Poland
*
Author to whom correspondence should be addressed.
Energies 2023, 16(7), 3006; https://doi.org/10.3390/en16073006
Submission received: 28 January 2023 / Revised: 9 March 2023 / Accepted: 23 March 2023 / Published: 25 March 2023
(This article belongs to the Section A2: Solar Energy and Photovoltaic Systems)

Abstract

:
The aim of this study is to examine the profitability of investment in a photovoltaic microinstallation, to analyze the impact of legal changes on its profitability, and to perform a sensitivity analysis of the investment profitability to energy price changes. The novelty of the research applies to the financial analysis of two legal systems of discount called net-metering and net-billing. The two systems and the change in energy prices present legal and macroeconomic risks. Climate neutrality strategy implementation is the analysis background. The authors formulate the hypothesis that, firstly, the solar panel installations in Poland are aimed at reducing the operating costs of the building; secondly, the investment motivation is environmental. The main research conclusion is that taking into consideration the solar panel ‘boom’ in Poland, the ‘regulator’ has achieved its intended goal connected with progress toward climate neutrality. This research used the method of logical design, experiment, and comparative analysis. The tools applied to calculate project profitability included the internal rate of return (IRR) and net present value (NPV). The case study method has been applied. The analysis uses real-world assumptions and is conducted for weather conditions in Gdańsk, Poland.

1. Introduction

Sustainable development has shaped ways of thinking about development and has gained high-level policy recognition both worldwide and locally [1]. The “triple bottom line” shows the interrelationship between and co-dependence of social, economic, and environmental dimensions. The determinants of sustainable development have become mainstream in research, policy, and practice [2]. A milestone in sustainable development is the 2030 agenda and a set of 17 sustainable development goals (SDGs) accepted by UNIDO in 2015. The 2030 agenda is linked to Global New Green Deal (presented in 2008) and the European Green Deal (approved in 2020), originating from the Kyoto protocol from 1997 and the global and European action plan for sustainable economy, focusing on climate neutrality and a modern, resource-efficient, and competitive economy. The goal of a sustainable development should then drive the decision making in the urban transformation strategy [3], as urban areas consume 75% of the natural resources and emit 60–80% of the global greenhouse gases and future population in the cities will increase [4,5,6].
On 14 July 2021, the European Union announced a new set of climate regulations “Fit for 55”—meaning a 55% reduction in emissions in the EU by 2030. The entire Union wants to become climate neutral by 2050. Is this realistic, especially in the context of recent geopolitical events and the interests of non-EU countries? Many indications suggest not. Is it necessary? Everything points to it being so. In practice, the actions will include a reform of the current emissions trading system (ETS), new carbon tariffs/duties, and stricter emission standards. The new renewable energy sources (RES) directive project provides for an increase in renewable energy in the energy mix [7,8]. As the example from Poland shows, both companies and individual consumers are willing to participate in this on a wide scale. There have been changes in the social awareness of the views of Poles on the current shape of the energy sector and the proposed changes in this sector [9,10,11,12]. The results of the EIB (European Investment Bank) research on climate change shows that 75% of Poles surveyed (compared to 78% of European Union average) are concerned about climate change and its consequences [13]. According to the report prepared by Energetyka24.com and IBRiS (Market and Social Research Institute), approximately 41% of respondents want to switch to renewable sources as soon as possible [14].
Concern for the environment increased social awareness, and the constant rise in electricity prices are causing interest in energy systems based on renewable energy sources to grow [15,16]. Among them, solar energy is particularly noteworthy. It is a renewable energy source with significant potential. There are many ways to convert solar energy [17]. One of the more common technologies for using solar energy is photovoltaics. It allows for the direct conversion of solar radiation energy into electrical energy. The generated electrical energy translates into savings in the form of reduced electricity bills. An investment in a photovoltaic installation may be interesting as a form of long-term investment.
The aim of this study is to examine the profitability of investment, the impact of legal changes on profitability, and the analysis of selected factors that affect the profitability of investing in a photovoltaic microinstallation for a typical single-family house in Poland. Poland is a parliamentary republic; it is a country on the coast of the Baltic Sea in Central Europe, a member of the European Union. The climate of Poland is temperate transitional and varies from oceanic in the north-west to continental in the south-east. Considerable day-to-day weather fluctuations, thermal anomalies, and the differences in the arrival of a particular season are present [18,19]. The time frame of the study covers 25 years, which is a typical period of the warranty for the installation’s efficiency given by manufacturers. Case study research is an accepted form of social science research. It is a preferred method, compared to others, particularly in situations when the focus of the study is a contemporary phenomenon [20]. The case study approach has been applied in renewable energy resources related research (e.g., [21,22,23,24,25]). The novelty of research applies to financial analysis of two legal systems of discount called net-metering and net-billing, which present the legal and macroeconomic risk in the context of investor financial and non-financial motivation and implementation of the strategy of climate neutrality.
Authors formulate the hypothesis that, firstly, the solar panel installations in Poland are aimed at reducing the operating costs of the building; secondly, the investment motivation is environmental. The main research conclusion is that taking into consideration the solar panel “boom” in Poland, the “regulator” has achieved its intended goal—connected with progress toward climate neutrality.
The research used the method of logical design, experiment, and comparative analysis to discuss the motivation and profitability of photovoltaic microinstallation for a single-family house. The tools applied to calculate project profitability included the internal rate of return (IRR) and net present value (NPV). IRR and NPV are discounted cash flow (DCF) methods used to evaluate the economic profitability of investment (project) [26]. For instance, it has been used in research evaluating scenarios concerning photovoltaic panels and storage systems in a residential building in Italy [21]. The authors claim that the increase in the share of self-consumption is the main critical variable. The profitability of photovoltaic and battery systems was also calculated with DCF methods in the research based on Switzerland case study [27]. The authors proposed a machine learning algorithm which predicts optimal configuration, profitability, and self-sufficiency ratios with good accuracy. Another research shows that positive NPV of flexible storage photovoltaic investments due to the high electricity prices were confirmed in Germany and in Spain, but not in France and Italy [22]. Finally, the research over economic performance of photovoltaic panels in Iran shows that, even under subsidized prices, the cash generated by investment cannot cover the costs that the investment requires and the NPV is negative [23]. The mentioned research used the same methods, and they were all subordinated to the specified original research aims. They provide general conclusion that photovoltaic panels investment is sensitive to technical, natural, and legal conditions.

2. Materials and Methods

2.1. Specificity of Photovoltaics—Technical Conditions

Photovoltaics use a phenomenon that involves the direct conversion of solar radiation energy into electricity. It is not a source of energy adapted to power loads continuously. The use of solar radiation in the photovoltaic conversion process has a positive effect on the energy balance of the Earth; moreover, it is a renewable source. Photovoltaic panels, which are the basic element of a photovoltaic installation, are divided into three basic generations, but their presented efficiency in the literature differs. According to Dasari, Balaraman & Kohli (2018) [28], the first-generation panels, which currently dominate the market, are made of cells made of mono- and polycrystalline silicon. Their efficiency can reach up to 25.6%. Second-generation panels are characterized by a very thin semiconductor layer that absorbs light. The highest reported efficiency is 28%. Third generation panels are based on many technologies, e.g., non-toxic organic materials and graphene. The advantage of such cells is their low production cost and light absorption of up to 90%, while the main disadvantage is the efficiency (which was unsatisfactory), and no advances were reported (although theoretical calculations indicated efficiency over 80% [28]). Different ratios of efficiency are presented by other authors (e.g., [25]).
Frequently mentioned advantages of photovoltaic panels include: no contamination with products of incineration, redundancy of fuel, operator, transport, inexhaustible resources of solar energy, and direct conversion of radiation energy into electricity. Other features are as follows: cost-effectiveness of use, as they do not require overhauls and repairs; a relatively short investment period; low operating costs; energy independence (in the case of off-grid systems); and a determined dynamic increase in installed photovoltaic capacity in Poland. At the end of September 2021, the installed capacity in photovoltaics exceeded 6.3 GW. Prosumers (producers and consumers) [17,25] are responsible for such dynamic growth, whose share in the total capacity exceeds 70% [29]. The factors that revived the photovoltaic market were subsidy programs, an increase in electricity prices (Figure 1), and an expected change in the energy discount system.
At the same time, the disadvantages of the installation are their high price, the fact that the amount of energy produced depends on the season, and the toxic compounds used to build cells—cadmium, selenium, arsenic, and tellurium. Additionally, the panels do not produce energy at night, and it is difficult to store the energy produced. The issues of utilization of this multi-composite material after the period of operation have been also raised recently, showing both threats and possibilities (e.g., recovery of rare earth metals) [31].
The first step in designing a photovoltaic installation is to choose where to install the panels on the roof of the building. This must consider the surface, exposure to sunlight, and obstacles that can shade the installation. The next step is to determine the method of installation of photovoltaic panels and the selection of the supporting structure. Next, it is necessary to analyze the precise location of photovoltaic panels on the roof of the building and analyze the shading of the panels—this will allow for the determination of specific models of photovoltaic panels and inverters, energetically matched to the number of panels and their placement. Inverters are used to change current and DC voltage into current and AC voltage with grid parameters. They also keep statistics on energy production and perform a control function [32]. Photovoltaic installations do not require much attention from the investor during the period of operation, but they may be exposed to damage (galvanic, magnetic, and electrical couplings) [33].
The selection of the type and size of a photovoltaic installation consists of determining the demand for power and correlating it with the power of the generator. The energy needs of the building should be met as much as possible, and only surplus energy should be fed into the power grid to minimize losses related to possible transmission or storage of energy [34]. Another important factor is the way the installation works with the power grid. The following types of systems are distinguished [24]:
  • On-grid system—the system returns the generated electricity to the public grid through a separate meter. The energy necessary for operation is taken by the second meter directly from the power grid. The settlement takes place with the energy company by issuing an invoice based on the measurements of both meters.
  • Off-grid system (autonomous)—the system has no connection to the public grid, and the generated energy is usually stored in batteries. It produces energy for consumers assuming adequate energy demand. This system is used when energy consumption is low or when it is not possible to connect to the power grid.

2.2. Specificity of Photovoltaics—Economic and Legal Conditions

Capital expenditures (CAPEX) incurred for the photovoltaic installation include costs related to the purchase of photovoltaic panels, inverter, assembly accessories, and all electrical equipment and labor. The financial analysis is part of the documentation for the photovoltaic installation project. It should consider the financing structure, i.e., the share of equity, credit with subsequent repayment of installments, and possible subsidies. Each type of financing is associated with its specific costs. Basically, EU or government funds are non-repayable funds, but they may involve the costs of employing an adviser or preparing documentation. Typically, grants are implemented in the form of reimbursement of part of the costs incurred or repayment of a loan taken out and are therefore transferred to the investor at a later date, which requires securing other funds to cover part of the investment expenditures. According to the current provisions of the Personal Income Tax Act [35], subsidies and other free benefits received to cover costs or as reimbursement of expenses are included in other revenues from business activity and are therefore subject to income tax. It is also possible to use the thermo-modernization tax relief enabling the deduction of the costs of purchasing a photovoltaic installation up to a certain amount from the tax base. However, it does not cover the cost of funding under grants. Programs financed from EU funds offer co-financing at the level of about 60% to even 80% of CAPEX. When looking for a non-returnable subsidy or a low-interest loan, it is worth searching beyond popular, domestic supporting projects. There are co-financing programs for photovoltaic panels for entities from in selected region [25].
The discount system is also a key factor in photovoltaics investment decision-making [25]. The discount system allows to treat the power grid as a “virtual energy storage” in which surplus electricity produced by photovoltaic installations and not consumed as part of self-consumption is stored. The system is called net-metering. In Poland, a proconsumer who provides 1 kWh into the distribution network can collect 0.8 kWh (for installations up to 10 kW) or 0.7 kWh (when the size of the installation is from 10 kW to 50 kW). At the same time, the distribution system operator collects distribution fees from the prosumer for retransmission of energy [36]. The transparency of the net-billing system is beneficial for prosumers and the systematically increasing price of electricity has caused a significant increase in interest regarding photovoltaic installations. However, the amendment to the act on renewable energy sources of 29 October 2021 changed the existing rules for the energy discount [37]. The new system of discount, the so-called net-billing system, consists of a separate settlement of electricity introduced into the distribution network and electricity taken from the network based on the value of a unit of energy determined according to the exchange price on an hourly basis. The prosumer will receive a market price for electricity introduced into the network from its own photovoltaic installation, and it would pay for the energy consumed in the same way as other consumers. The amount for electricity introduced into the network goes to the “prosumer deposit,” which is intended for the settlement of liabilities of the renewable energy prosumer for the purchase of electricity from the seller maintaining the prosumer’s account. The unused surplus from the “prosumer deposit” is returned, but its amount may not exceed 20% of the value of electricity introduced by the prosumer into the network.
The net-billing model in Poland applies, in principle, to prosumer photovoltaic installations whose generation and introduction of electricity to the grid took place starting on 1 April 2022. In turn, photovoltaic installations that have started generating and introducing electricity into the distribution network through 31 March 2022 will still be able to use the system of net-metering. This is linked to the principle of protection of acquired rights, as changing the discount system may result in a change in the payback period. Changes to the discount system are important sources of legal risk for a photovoltaic installation project.
Installations up to 40 kW can be installed without any need to apply for a building permit—only a notification with the necessary attachments is needed. Large installations must apply for a building permit, which involves additional mapping for design purposes, mapping the micro-power plant, and an excerpt from the local spatial development plan [38]. A starting of the operation of photovoltaic microinstallation should be announced at least 30 days before the planned connection to the network of a given operator. The application must contain the relevant documents. After a positive substantive and formal assessment, the operator checks the technical condition of the microinstallation and sets up a security system and two-way remote reading meters, which are currently still free of charge [39].

2.3. Parameters of the Investment

The investment is a photovoltaic microinstallation with a capacity of 5.04 kWp, which was installed on a typical single-family house, whose average annual energy consumption was 4200 kWh. The price of a complete installation (12 IBC SOLAR solar panels, photovoltaic inverter, security cost, connection to the power grid, assembly) is 25,000 PLN (approx. 5500 €, 1 €~4.71 PLN, for 28 February 2023). In Polish climate conditions, an optimally located and constructed photovoltaic installation can produce 1000 kWh from each installed kWh of power [40]. The forecast of energy production from the panels considers the decrease in efficiency every year to be 0.5%. The analysis assumes a 25-year period of economically useful life of the panel system (Table 1). The analysis was carried out in variable prices for the purpose of real-life investment performed in 2022 just before the change in the law regarding the discount system to analyze the profitability before and after the changes, as well as under the conditions of an unstable political and economic situation representing legal and macroeconomic risk.
This is not a typical income project, so the 4.0% discount rate recommended by the European Commission was used to discount cash flows [41]. The price of energy for a household customer included a fee for the provision of electricity distribution services. The analysis assumes an increase in electricity prices by an inflation rate of 2.5%, which is the formal inflation target of the National Bank of Poland [42].
In net-metering(Table A1), current consumption (daily system exploitation) is about 30% of the energy produced during the day. The remaining energy goes to the grid, where it is stored. The stored energy can be used within 12 months. In this system of discounts, knowing the amount of energy tariffs, the savings on bills that the investor will gain in individual years can be easily calculated. Regardless of the time of the day, year, or month the prosumer introduces energy to the grid, it will always have the same value, reduced by 20% for installations below 10 kW. Therefore, knowing the prices at which we can recover energy from our operator, we are able to determine the financial cash flows (Table A2) and the profitability of investments in the basic scenario in the net-metering system.
The second option is the settlement of produced energy using the net-billing system (Table A3). The surplus energy produced is sold at the price of the day and goes to the prosumer deposit. The amount from this deposit can be settled in the account for 12 months from the date it is credited as a deposit. From the purchase price of energy with all fees from the distributor, the amount from the deposit is deducted. Unused money within 12 months will be returned only up to 20% of the value of electricity fed into the grid. Thus, the net-billing system assumes a separate settlement of energy introduced into the electricity network and electricity taken from the power grid, based on a value determined according to the exchange price. In this system, the prosumer bears the costs of the distribution fee, because they buy the collected energy with all fees (including VAT), in accordance with the tariff of their seller. In this system, knowing the amount of energy tariffs, savings, financial cash flows (Table A4) and profitability of investments can also be calculated in the basic scenario in the net-billing system.
The tools applied to calculate project profitability in both discount systems were the payback period, the discounted payback period, the internal rate of return (IRR) and the net present value (NPV). The sensitivity analysis (taking into consideration the forecasted price increase of energy) was performed. The calculations were performed using Excel spreadsheets. The scenario analyzed included annual energy price increase of 2.5%, 5%, 10%, 20%, 30%, and 40% from the basic price (Table 1) and was performed for both discount systems—net-metering and net-billing. The other assumptions remained the same (Table 1).

3. Results

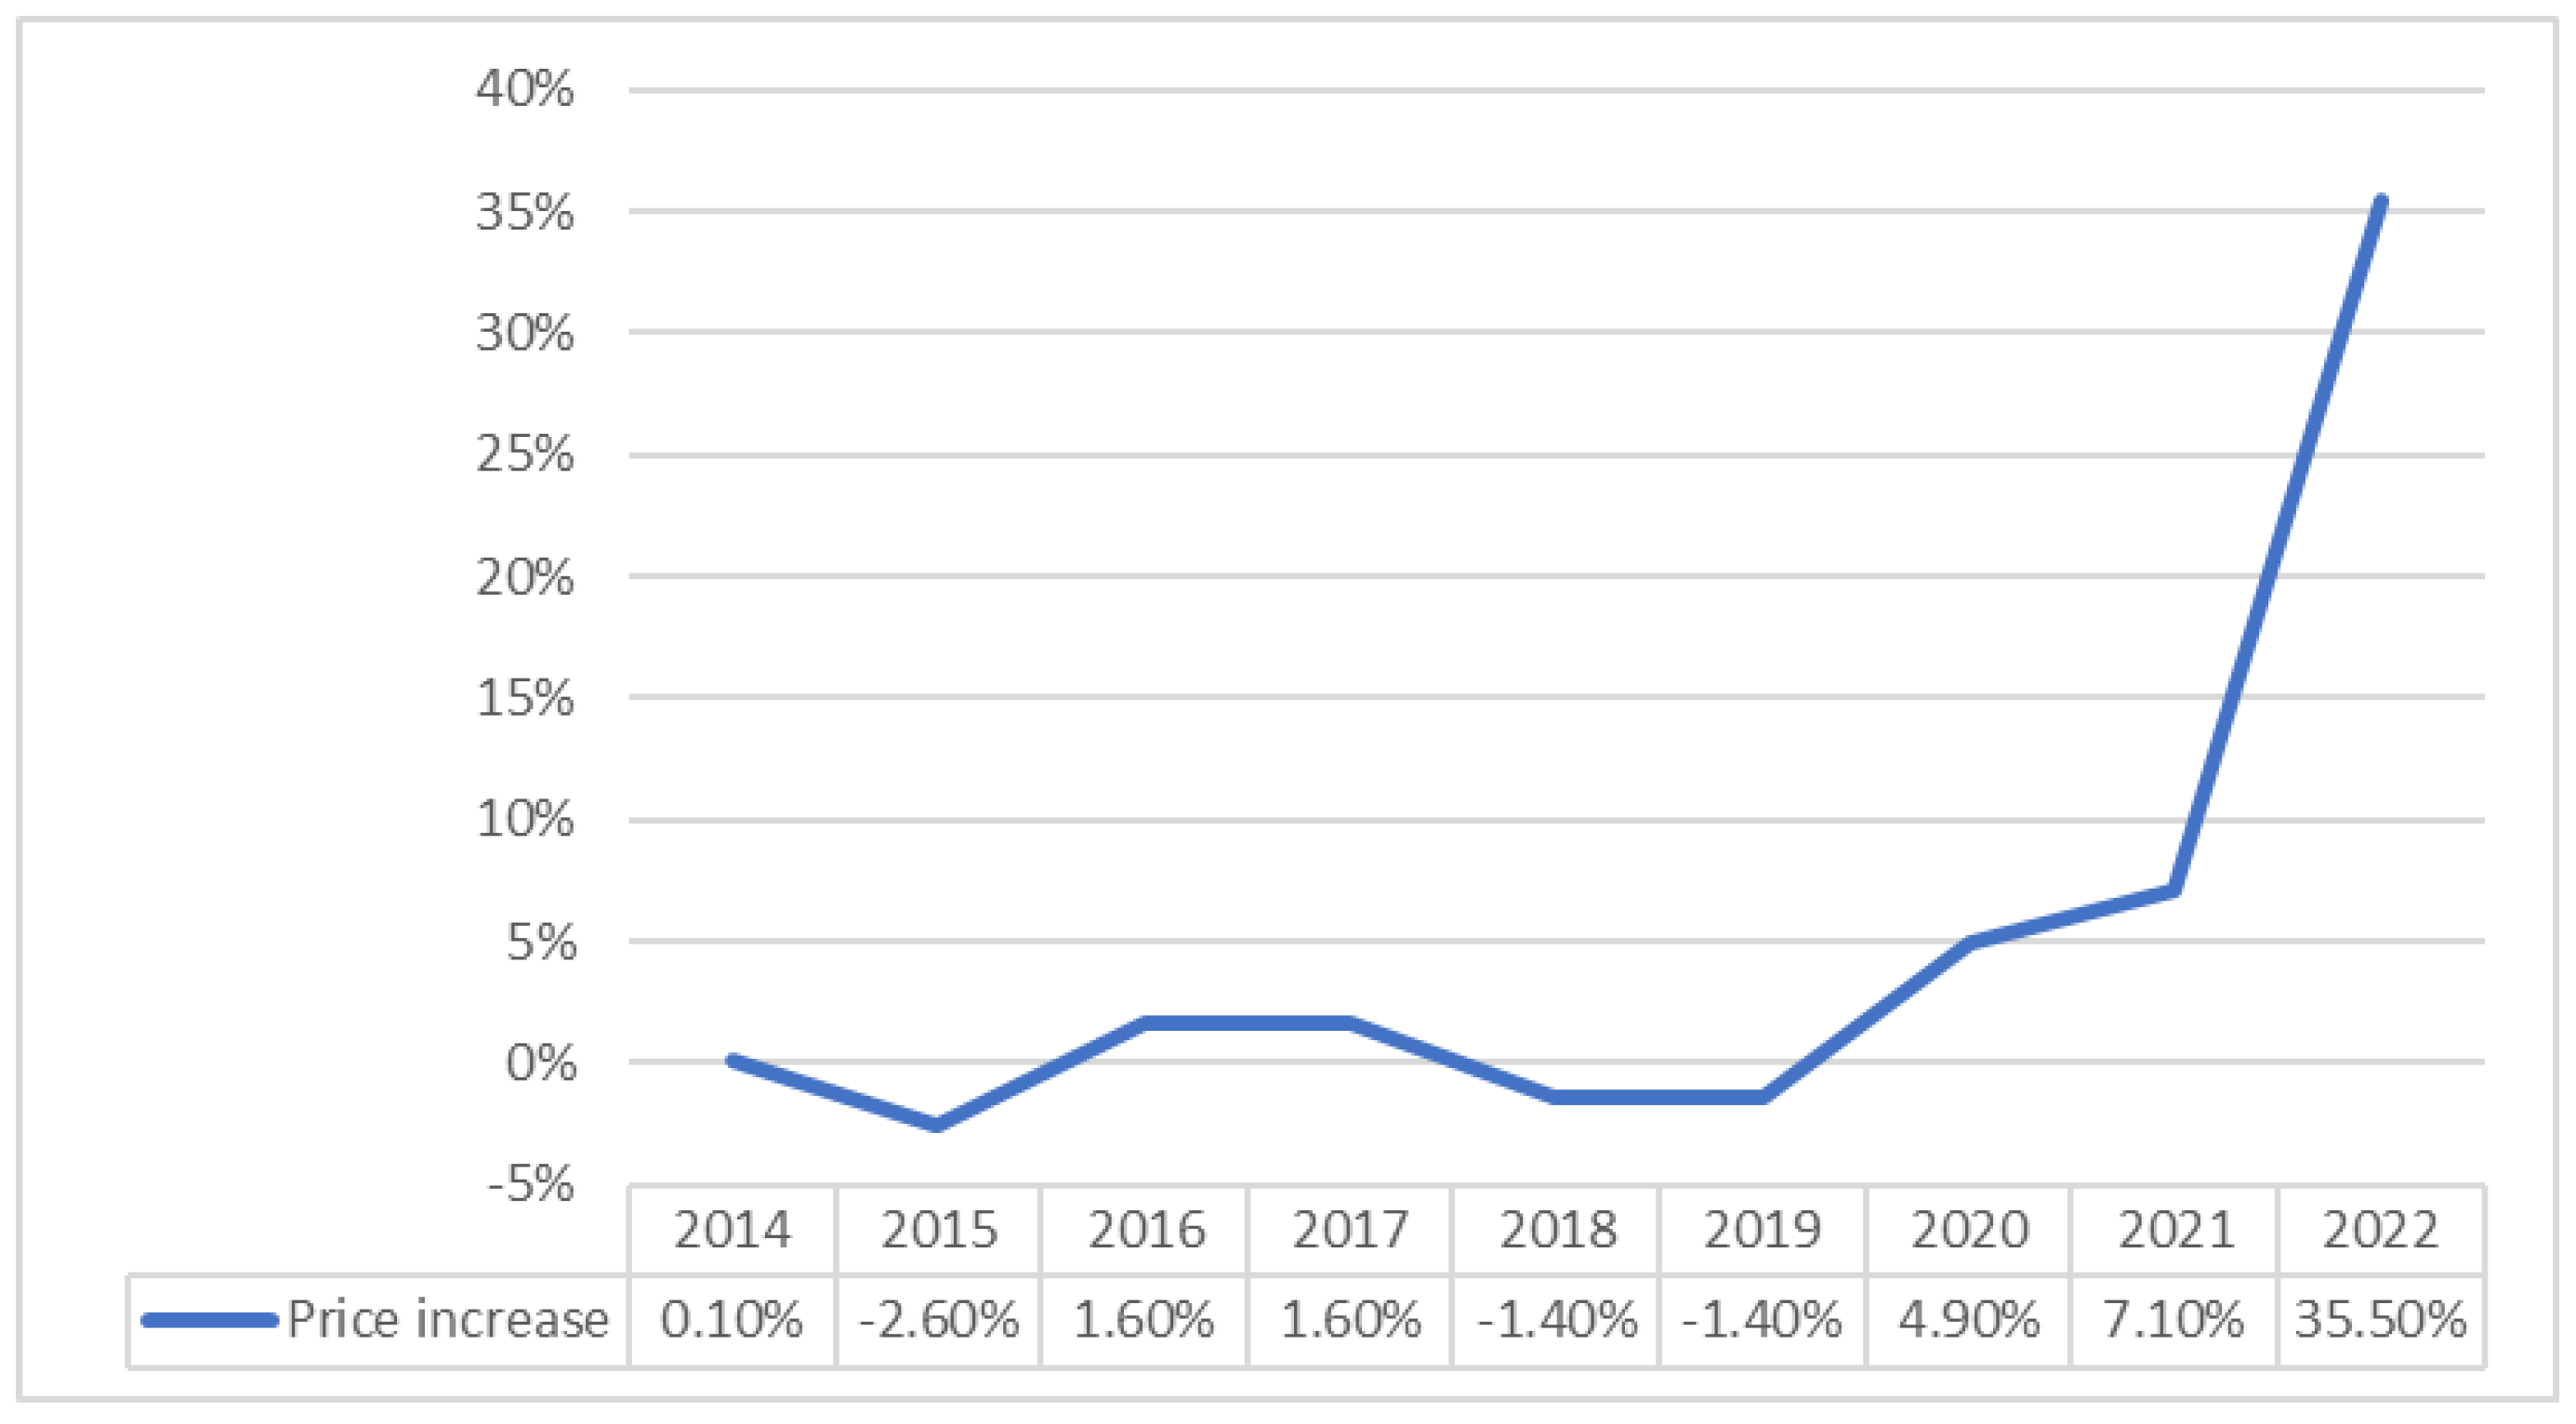
Installing a photovoltaic system on a building can bring many benefits, ranging from generating own energy (thereby becoming independent of the distributor) through reducing the pollutants emitted into the atmosphere and ending with the economic aspect, i.e., reducing electricity bills. Both methods of discount for the analyzed case are profitable. However, the net-billing system indicated lower values compared to the net-metering system. The payback period and the discounted payback period are longer for the “new” system. A profitability analysis for a 5.04 kW photovoltaic installation in conditions of higher energy price growth was also carried out. The price increase was simulated up to 40%, as the current prices of energy increased by about 45%, while inflation has been recorded officially as 14%. The results of analysis are presented for net-metering and net-billing system of discount (Table 2 and Table 3).
Comparing the profitability of investments in both settlement systems, net-billing is characterized by lower profitability under other unchanged conditions because the seller will return the money not used within 12 months only up to 20% of the value of electricity introduced into the network in the calendar month to which the refund of the overpayment relates to. It can be concluded that, from a financial point of view, it is not profitable to oversize the installation. In conditions of energy price increases higher than the NPB inflation target, the profitability of investments increases.
The change in the profitability of the investment (both because of the change in the assumptions of the project (change in the energy price growth rate) and changes in the method of discount) illustrates the risk of the project. The risk of an investment project is considered independently of other investment and financial decisions of the owners. It is caused by the degree of accuracy of the adopted technical, economic, and financial assumptions. The scope of risk depends mainly on the type of investment project, as well as the phase of its development. As the investor proceeds to the next phases of the project cycle, the degree of risk generally decreases. Greater risk accompanies the pre-investment phase and lowers in the operational phase, while the cost of risk mitigation increases over time. Risk may have positive or negative outcomes or may simply result in uncertainty. Therefore, risks may be related to an opportunity or a loss or the presence of uncertainty [43]. In the case study, the legal risk in the form of a change of law and the discount system decreases investment profitability, while the macroeconomic risk in the form of an increase in energy price results in profitability increases.
In the case study presented, the risk is related, among other factors, to meteorological conditions and technical issues such as the type of photovoltaic panels, but the analysis took the macroeconomic risk exemplified by the change of energy prices and the legal risk associated with a change in the method of discount under special consideration. The case study limitations relate to the fact that it is impossible to accurately predict the price level over the 25-year life of the investment. It is worth taking a safe level and correcting it for the trend of price increases as the case study showed. Finally, the situation of neutral profitability of the project was also assessed. It is a decrease in energy prices of about 7.55% for net-metering and about 6.3% for net-billing so that NPV = 0 and IRR equals the discount rate, which represents the neutral profitability of the investment.

4. Discussion and Conclusions

Investments in renewable energy sources increase the energy security of many regions of our country, and contribute to the improvement of energy supply in areas with poorly developed energy infrastructure. The development of RES also contributes to creating new jobs and, above all, reducing carbon dioxide emissions. The RES was installed as close as possible to the consumer results in the reduction of losses generated by energy transmission and allows for better control and improvement of network parameters in the vicinity of their connection.
One of the advantages of photovoltaic systems is decentralization—direct proximity to the consumer compared to other renewable energy sources. This is due to the relatively easy installation and operation of photovoltaic systems and the possibility of integration with other energy systems. Another argument in favor of photovoltaic systems refers to environmental aspects. This method of obtaining electricity is the most beneficial for the natural environment due to the lack of by-products in the form of waste, gases, or other pollutants. The main advantage of photovoltaics over other sources of renewable energy is its general availability. These systems can be installed in many sunny places. Unlike other RES, it does not need special conditions to function (such as a water or wind power plant). Low sound intensity also builds the advantage of these systems over other sources. Working panels are quiet, which makes them an ideal solution in built-up areas. Photovoltaic panels can be disposed of and, therefore, materials from the manufacturing process can be reused. These mean a positive impact on the environment and allow for a reduction in the amount of energy needed in the production process. All of the advantages mentioned above make photovoltaics an important element of renewable energy sources.
However, the rapid growth of micro-installations in Poland has not been accompanied by a modernization of electrical transmission networks or development of systems for storage of the produced energy. There are no systemic solutions (at the national level) regarding the storage of energy generated in this way, e.g., through the construction of new pumped-storage tanks, the appropriate stimulation of investments in energy storage facilities, etc. Experts also raise the problem of providing a stable or easy starting base source of energy (used instead of coil and/or gas). It is hoped that the announcements of the launch of the first nuclear power plant in Poland will not meet the same fate as the “Żarnowiec” in the 1990s (which was started but never completed) [44].
In the case of Poland, the new EU RES directive will reduce the importance of coal, but also biomass—in connection with which Poland, being largely forested, has had high hopes for in the past [45]. In general, experts weigh two parameters: the cost of energy transformation (and in the long term: generated savings) versus increased operating costs based on the current model. The latter was mercilessly revealed by the geopolitical situation of the last year and associated with increases in energy prices. Somewhere in the background, the cost of non-measurable changes in climate, its impact on our health, and more and more frequent extreme weather events are rarely mentioned.
The emission of greenhouse gases in energy (electricity and heat production together) is the largest part of pollution—25%. In second place is widely understood to be “Agricultural” (24%). According to a 2014 EPA and IPCC/USA report, 14% of pollution comes from transportation [46]. According to other sources and different approach to pollution calculation, livestock (including, among others, farming, feeding, transportation, and slaughtering) accounts for 37% of gas emissions. In terms of the type of pollutants, methane is the primary sources of greenhouse gases [47] and more than half of the greenhouse gases are carbon emission. Fossil fuels and industry are responsible for 89% of carbon emission. The development of micro-installations, aimed at reducing emissions concerns the construction industry, which, according to the report, is responsible for only 6% of greenhouse gas emissions. Polish cities are still developing “outwards”. Reducing emissions related to transportation and construction will be a big challenge as a significant portion of houses are energy inefficient, the weather is not favorable to bicycles or public transport users for approximately half a year, and every third car is 20 years old. Moreover, the purchasing power in Poland is still one of the lowest in the EU. Probably, all of those factors are also responsible for the scale of investment in photovoltaic installations in Poland. The cost of the installation is still lower than the cost of building thermal modernization or buying a new, more efficient, and cleaner car, and temporarily helps to reduce current living costs. However, does such a sequence/order of support make sense?
All large-scale investments in macroeconomics have a sinusoidal character over time—whether we are talking about energy or biotechnology. Fuel crisis? Development of alternative fuels. Lack of rare earth metals? Bio-metallurgy/Bioleaching. Expensive gas and oil… Will the answer be renewable energy sources (RES)?
Fit 55 is ambitious—that’s true. In the case of Poland, it is difficult to achieve and is definitely too expensive to bear without pain at the assumed pace of change, but above all, it is a change in the economic model and lifestyle. The European Union has always tried to “introduce innovative solutions with a human face” in contrast to strongly capitalist, liberal economies. Will “running/escape forward” be good for the EU this time? Time will show.
For now, the authors conclude that, regardless of the degree of incentives (e.g., in the form of subsidies) or changes in regulations to less favorable methods, installed photovoltaic installations in Poland are motivated by reducing the costs of exploitation of the building—and environmental benefits are forced into the background. The main research conclusion shows that the “boom” for photovoltaics in Poland suggests that the “regulator” is achieving its intended goal relating the implementation of solutions supporting sustainable development and a triple bottom line. Sustainable development and the climate neutrality created a starting point for the research, while the triple helix could be also a research context [48]. The triple helix model of university–industry–government interaction (which refers to innovation-driven development and knowledge-based economies) might be a concept to develop the research focused on social returns on RES projects funded by government decision-makers.

Author Contributions

Conceptualization, A.W.-F. and O.F.; methodology, A.W.-F. and O.F.; validation, A.W.-F.; formal analysis, A.W.-F. and O.F.; investigation, A.W.-F., O.F. and P.F.; writing—original draft preparation, A.W.-F. and P.F.; writing—review and editing, A.W.-F. and P.F.; supervision, A.W.-F.; project administration, A.W.-F. All authors have read and agreed to the published version of the manuscript.

Funding

This research received no external funding.

Conflicts of Interest

The authors declare no conflict of interest.

Appendix A

Table A1. The energy settlement with the net-metering system.
YearAnnual Energy Production from Panels Taking into Account the Decrease in Efficiency (kWh)Estimated Annual Energy Coverage of Panels During the Day (kWh)Annual Surplus Production to be Used (for Installations below 10 kWp 0.8)Energy Purchased from the Energy Company (kWh)Annual Cost of Purchase of Purchased Energy (PLN)Annual Cost of Purchasing Energy without Panels (PLN)Difference between Bills (Savings) (PLN)
1504015122822--24782478
2501515042808--25402540
3499014972794--26032603
4496514892780--26692669
5494014822766--27352735
6491514752753--28042804
7489114672739--28742874
8486614602725151129462935
9484214532711362630192993
10481814452698574230953053
11479414382684785931723114
12477014312671987632513175
134746142426581199433333239
1447221417264413911334163303
1546981410263115913335013369
1646751402261818015335893435
1746521395260520017536793504
1846281388259222019737713573
1946051382257924022038653644
2045821375256625924539613717
2145591368255327927040603791
2245361361254029929641623866
2345141354252831832342663943
2444911347251533835143734021
2544691341250235738144824101
Table A2. Cash flows for net-metering system.
YearDifference between Bills (Savings) (PLN)CAPEX (PLN)SubsidyCash FlowDiscounted Cash FlowCumulated Cash FlowCumulated Discounted Cash Flow
0 −25,0005000−20,000−20,000−20,000−20,000
12478 24782383−17,522−17,617
22540 25402348−14,982−15,269
32603 26032314−12,379−12,955
42669 26692281−9710−10,673
52735 27352248−6975−8425
62804 28042216−4171−6210
72874 28742184−1297−4026
82935 293521451638−1881
92993 299321034631222
103053 3053206276842284
113114 3114202210,7974307
123175 3175198313,9736290
133239 3239194517,2118235
143303 3303190720,51410,142
153369 3369187023,88312,013
163435 3435183427,31813,847
173504 3504179930,82215,646
183573 3573176434,39517,410
193644 3644173038,03919,139
203717 3717169641,75620,836
213791 3791166345,54722,499
223866 3866163149,41324,131
233943 3943160053,35625,730
244021 4021156957,37727,299
254101 4101153861,47828,838
Table A3. The energy settlement with the net-billing system.
YearAnnual Energy Production from Panels Taking into Account the Decrease in Efficiency (kWh)Estimated Annual Energy Coverage of Panels during the Day (kWh)Annual Surplus Production (kWh)Sale of Surplus (PLN)Energy Demand not Covered by Panels (kWh)The Purchase Price of Energy not Covered by Panels (PLN)Energy Purchase Price—Sales Surplus (PLN)Annual Cost of Purchasing Energy without Having Panels (PLN)Difference between Bills (Savings) (PLN)
150401512352814152688158617124782307
250151504351014432696163018725402353
349901497349314722703167620426032399
449651489347515012711172222126692447
549401482345815312718177024027352496
649151475344115612725181925828042545
748911467342315922733187027828742596
848661460340616242740192229829462648
948421453338916562747197531930192700
1048181445337216892755203034130952754
1147941438335617222762208636431722809
1247701431333917572769214438732512864
1347461424332217922776220341133332921
1447221417330518272783226443734162979
1546981410328918642790232646335013039
1646751402327219012798239049035893099
1746521395325619382805245651836793161
1846281388324019772812252454737713223
1946051382322420162818259457738653287
2045821375320820562825266560939613353
2145591368319120972832273864140603419
2245361361317621392839281367541623487
2345141354316021812846289170942663557
2444911347314422252853297074543733627
2544691341312822692859305178344823699
Table A4. Cash flows for net-billing system.
YearDifference between Bills (Savings) (PLN)CAPEX (PLN)SubsidyCash FlowDiscounted Cash FlowCumulated Cash FlowCumulated Discounted Cash Flow
0 −25,0005000−20,000−20,000−20,000−20,000
12307 23072218−17,693−17,782
22353 23532175−15,341−15,607
32399 23992133−12,941−13,474
42447 24472092−10,494−11,382
52496 24962051−7998−9331
62545 25452012−5453−7319
72596 25961973−2857−5346
82648 26481935−209−3412
92700 270018972491−1515
102754 275418605244346
112809 2809182480532170
122864 2864178910,9173959
132921 2921175413,8395714
142979 2979172116,8187434
153039 3039168719,8579121
163099 3099165522,95610,776
173161 3161162326,11612,398
183223 3223159129,33913,990
193287 3287156032,62715,550
203353 3353153035,98017,080
213419 3419150139,39918,581
223487 3487147242,88620,052
233557 3557144346,44321,495
243627 3627141550,07022,910
253699 3699138853,77024,298

References

  1. WCED. Our Common Future; Oxford University Press: Oxford, UK; New York, NY, USA, 1987. [Google Scholar]
  2. De Jong, M.; Joss, S.; Schraven, D.; Zhan, C.; Weijnen, M. Sustainable–smart–resilient–low carbon–eco–knowledge cities; making sense of a multitude of concepts promoting sustainable urbanization. J. Clean. Prod. 2015, 12, 25–38. [Google Scholar] [CrossRef] [Green Version]
  3. Quijano, A.; Hernández, J.L.; Nouaille, P.; Virtanen, M.; Sánchez-Sarachu, B.; Pardo-Bosch, F.; Knieilng, J. Towards sustainable and smart cities: Replicable and KPI-driven evaluation framework. Buildings 2022, 12, 233. [Google Scholar] [CrossRef]
  4. Wendling, L.; Huovila, A.; zu Castell-Rüdenhausen, M.; Hukkalainen, M.; Airaksinen, M. Benchmarking nature-based solution and smart city assessment schemes against the sustainable development goal indicator framework. Front. Environ. Sci. 2018, 6, 69. [Google Scholar] [CrossRef] [Green Version]
  5. Abu-Rayash, A.; Dincer, I. Development of integrated sustainability performance indicators for better management of smart cities. Sustain. Cities Soc. 2021, 67, 102704. [Google Scholar] [CrossRef]
  6. United Nations. Department of Economic and Social Affairs Population Division. World Urbanization Prospects: The 2018 Revision; United Nations: New York, NY, USA, 2019. [Google Scholar]
  7. Wilson, A. Revision of the Renewable Energy Directive: Fit for 55 Package; European Parliament: Strasbourg, France, 2022. [Google Scholar]
  8. Olabi, A.G.; Abdelkareem, M.A. Renewable energy and climate change. Renew. Sustain. Energy Rev. 2022, 158, 112111. [Google Scholar] [CrossRef]
  9. Łucki, Z.; Byrska-Rąpała, A.; Soliński, B.; Stach, I. Badanie świadomości energetycznej społeczeństwa polskiego. Polityka Energetyczna 2006, 9, 5–63. [Google Scholar]
  10. Chomać-Pierzecka, E.; Sobczak, A.; Urbańczyk, E. RES market development and public awareness of the economic and environmental dimension of the energy transformation in Poland and Lithuania. Energies 2022, 15, 5461. [Google Scholar] [CrossRef]
  11. Wójcik, A.; Byrka, K. Energia od Nowa Raport z Badań Opinii Społecznej Dotyczącej Energetyki w Polsce; WWF Polska: Warsaw, Poland, 2018; pp. 1–8. [Google Scholar]
  12. Woźniak, M.; Badora, A.; Kud, K.; Woźniak, L. Renewable Energy Sources as the Future of the Energy Sector and Climate in Poland—Truth or Myth in the Opinion of the Society. Energies 2022, 15, 45. [Google Scholar] [CrossRef]
  13. European Investment Bank. Ankieta EBI Dotycząca Klimatu—Polacy są Mniej Zaniepokojeni Zmianą; European Investment Bank: Luxembourg, 2018; pp. 1–2. [Google Scholar]
  14. PolskieRadio24.pl. TPV Word. 6 April 2021. Available online: https://tvpworld.com/53160575/poles-ready-for-energy-sector-transformation-report (accessed on 7 March 2023).
  15. Héjj, D.; Kilijanek-Cieślik, A.; Kostrzewski, A.; Smogorzewski, K. Transformacja energetyczna w percepcji Polaków i Europejczyków; IBRiS: Warsaw, Poland, 2022; pp. 1–152. Available online: https://ibris.pl/wp-content/uploads/2022/08/Transformacja-energetyczna-w-percepcji-PL-i-UE_RAPORT-GLOWNY_FIN-1.pdf (accessed on 13 January 2023).
  16. GUS. Energy Warszawa. 2020; pp. 1–26. Available online: https://stat.gov.pl/en/topics/environment-energy/energy/energy-2020,1,8.html (accessed on 13 January 2023).
  17. Marks-Bielska, R.; Bielski, S.; Pik, K.; Kurowska, K. The importance of renewable energy sources in Poland’s energy mix. Energies 2020, 13, 4624. [Google Scholar] [CrossRef]
  18. Korzeniewska, E.; Harnisz, M. Polish River Basins and Lakes—Part Hydrology and Hydrochemistry; Springer International Publishing: Cham, Switzerland, 2020; pp. 4–5. [Google Scholar]
  19. Ustrnul, Z.; Wypych, A.; Jakusik, E.; Biernacik, D.; Czekierda, D.; Chodubska, A. Climate of Poland (Report); Institute of Meteorology and Water Management—National Research Institute (IMGW): Warsaw, Poland, 2020; pp. 1–24. [Google Scholar]
  20. Yin, R.K. Case Study Research: Design and Methods; Sage: Thousand Oaks, CA, USA, 2009. [Google Scholar]
  21. Cucchiella, F.; D’Adamo, I.; Gastaldi, M.; Stornelli, V. Solar Photovoltaic Panels Combined with Energy Storage in a Residential Building: An Economic Analysis. Sustainability 2018, 10, 3117. [Google Scholar] [CrossRef] [Green Version]
  22. Zsiborács, H.; Hegedűsné Baranyai, N.; Vincze, A.; Háber, I.; Pintér, G. Economic and technical aspects of flexible storage photovoltaic systems in Europe. Energies 2018, 11, 1445. [Google Scholar] [CrossRef] [Green Version]
  23. Korsavi, S.S.; Zomorodian, Z.S.; Tahsildoost, M. Energy and Economic Performance of rooftop PV Panels in the Hot and Dry climate of Iran. J. Clean. Prod. 2018, 174, 1204–1214. [Google Scholar] [CrossRef]
  24. Hassan, Q. Evaluation and optimization of off-grid and on-grid photovoltaic power system for typical household electrification. Renew. Energy 2021, 164, 375–390. [Google Scholar] [CrossRef]
  25. Kijo-Kleczkowska, A.; Bruś, P.; Więciorkowski, G. Profitability analysis of a photovoltaic installation—A case study. Energy 2022, 261, 125310. [Google Scholar] [CrossRef]
  26. Damodaran, A. Applied Corporate Finance; John Wiley & Sons: Hoboken, NJ, USA, 2014. [Google Scholar]
  27. Schopfer, S.; Tiefenbeck, V.; Staake, T. Economic assessment of photovoltaic battery systems based on household load profiles. Appl. Energy 2018, 223, 229–248. [Google Scholar] [CrossRef]
  28. Dasari, M.; Balaraman, R.; Kohli, P. Photovoltaics and Nanotechnology as Alternative Energy. Environ. Nanotechnol. 2018, 1, 211–241. [Google Scholar]
  29. Instytut Energi Odnawialnej. Available online: https://ieo.pl/pl/aktualnosci/1566-ieo-podnosi-prognoze-nowych-mocy-dla-fotowoltaiki (accessed on 20 January 2023).
  30. National Statistical Office. Komunikat Prezesa GUS z Dnia 13 Stycznia 2023. Available online: https://stat.gov.pl/sygnalne/komunikaty-i-obwieszczenia/lista-komunikatow-i-obwieszczen/komunikat-w-sprawie-sredniorocznego-wskaznika-cen-konsumpcyjnych-nosnikow-energii-w-2021-roku,291,7.html (accessed on 13 January 2023).
  31. Klugmann-Radziemska, E.; Kuczyńska-Łażewska, A. The use of recycled semiconductor material in crystalline silicon photovoltaic modules production-A life cycle assessment of environmental impacts. Sol. Energy Mater. Sol. Cells 2020, 205, 1102. [Google Scholar] [CrossRef]
  32. Trzmiel, G. Układy śledzące punkt maksymalnej mocy w inwerterach stosowanych w instalacjach fotowoltaicznych. Electr. Eng. 2016, 87, 23–35. [Google Scholar]
  33. Szczerbowski, R. Instalacje fotowoltaiczne-aspekty techniczno-ekonomiczne. Przegląd Elektrotechniczny 2014, 90, 31–36. [Google Scholar]
  34. Jain, S.; Agarwal, V. A single-stage grid connected inverter topology for solar PV systems with maximum power point tracking. EEE Trans. Power Electron. 2007, 22, 1928–1940. [Google Scholar] [CrossRef] [Green Version]
  35. Ustawa o Podatku Dochodowym od Osób Fizycznych, Dz.U. z 2022 r. poz. 2647. Available online: https://isap.sejm.gov.pl/isap.nsf/download.xsp/WDU19910800350/U/D19910350Lj.pdf (accessed on 20 December 2022).
  36. Ustawa z Dnia 20 Lutego 2015 r. o Odnawialnych źródłach Energii, Dz. U. 2015, poz. 478, Rozdział 2, Art. 4. Available online: https://isap.sejm.gov.pl/isap.nsf/download.xsp/WDU20150000478/U/D20150478Lj.pdf (accessed on 20 December 2022).
  37. Ustawa z Dnia 29 Października 2021 r. o Zmianie Ustawy o Odnawialnych źródłach Energii Oraz Niektórych Innych Ustaw, Dz.U. 2021 poz. 2376. Available online: https://isap.sejm.gov.pl/isap.nsf/download.xsp/WDU20210002376/U/D20212376Lj.pdf (accessed on 20 December 2022).
  38. Wiśniewski, G. Analiza Możliwości Wprowadzenia Systemu Feed-in Tariff dla Mikro i Małych Instalacji OZE; Instytut Energetyki Odnawialnej: Warsaw, Poland, 2012. [Google Scholar]
  39. Ministerstwo Klimatu i Środowiska. Available online: https://www.biznes.gov.pl/pl/opisy-procedur/-/proc/287 (accessed on 12 December 2022).
  40. Soleko Polska. Available online: https://www.kolektory.com/images/zestawy-ceny/karty/IBC%20MonoSol%20375%20CS9-HC.pdf (accessed on 20 December 2022).
  41. European Comission. Guide to Cost-Benefit Analysis of Investment Projects; European Comission: Brussels, Belgium, 2008. [Google Scholar]
  42. Narodowy Bank Polski. Available online: https://www.nbp.pl/home.aspx?f=/polityka_pieniezna/polityka_pieniezna.html (accessed on 12 June 2022).
  43. Hopkin, P. Fundamentals of Risk Management: Understanding, Evaluating, and Implementing Effective Risk Management; The Institute of Risk Management: London, UK, 2010. [Google Scholar]
  44. Gallo, A.B.; Simões-Moreira, J.R.; Costa, H.K.; Santos, M.M.; Dos Santos, E.M. Energy storage in the energy transition context: A technology review. Renew. Sustain. Energy 2016, 65, 800–822. [Google Scholar] [CrossRef]
  45. Mirowski, T.; Kubica, K. Rola biomasy w lokalnych klastrach energetycznych. Energy Policy J. 2016, 19, 125–138. [Google Scholar]
  46. IPCC. Cimate Change, Synthesis Report. Contribution of Working Groups I, II and III to the Fifth Assessment Report of the Intergovernmental Panel on Climate Change; IPCC: Geneva, Switzerland, 2014. [Google Scholar]
  47. Hanif, S.; Lateef, M.; Hussain, K.; Hyder, S.; Usman, B.; Zaman, K.; Asif, M. Controlling air pollution by lowering methane emissions, conserving natural resources, and slowing urbanization in a panel of selected Asian economies. PLoS ONE 2022, 17, e0271387. [Google Scholar] [CrossRef]
  48. Galvao, A.; Mascarenhas, C.; Marques, C.; Ferreira, J.; Ratten, V. Triple helix and its evolution: A systematic literature review. J. Sci. Technol. Policy Manag. 2019, 10, 812–833. [Google Scholar] [CrossRef]
Figure 1. Increase in energy prices in Poland (2014–2022) [30].
Energies 16 03006 g001
Table 1. Financial analysis assumptions.
AssumptionsValue
CAPEX 25,000 PLN
Installation power5.04 kW
Increase of energy prices2.5%
Decrease of effectiveness of the system0.5%
Average energy price0.401 PLN/kWh
Energy price0.59 PLN/kWh
Daily system exploitation 30%
Discount rate4%
Table 2. Financial analysis results for net metering.
AssumptionsNet-Metering
Annual energy price increase2.5%5%10%20%30%40%
IRR13.8%16.3%21.1%30.8%40.4%50.0%
NPV (PLN)28,837.5244,681.21101,015.31487,272.242,325,227.3410,760,467.76
Discount rate4%4%4%4%4%4%
Payback period877655
Discounted payback period998665
Table 3. Financial analysis results for net-billing.
AssumptionsNet-Billing
Annual energy price increase2.5%5%10%20%30%40%
IRR 12.5%15.0%19.8%29.4%39.0%48.5%
NPV (PLN)24,298.0338,600.4689,439.64437,916.482,095,909.449,704,996.16
Discount rate4%4%4%4%4%4%
Payback period987655
Discounted payback period1098765
Disclaimer/Publisher’s Note: The statements, opinions and data contained in all publications are solely those of the individual author(s) and contributor(s) and not of MDPI and/or the editor(s). MDPI and/or the editor(s) disclaim responsibility for any injury to people or property resulting from any ideas, methods, instructions or products referred to in the content.

