Article

Hydrogen Production from Biogas: Development of an Efficient Nickel Catalyst by the Exsolution Approach

The Federal Research Center of Coal and Coal Chemistry, SB RAS, 650000 Kemerovo, Russia
*
Author to whom correspondence should be addressed.
Energies 2023, 16(7), 2993; https://doi.org/10.3390/en16072993
Submission received: 27 February 2023 / Revised: 22 March 2023 / Accepted: 23 March 2023 / Published: 24 March 2023
(This article belongs to the Section A: Sustainable Energy)

Abstract

:
Hydrogen production from biogas over alumina-supported Ce1−xNixO2−x catalysts was studied in a temperature range of 600–850 °C with an initial gas composition of CH4/CO2/H2O of 1/0.8/0.4. To achieve a high and stable hydrogen yield, highly dispersed Ni catalysts were prepared through the exsolution approach. A solid solution of Ce1−xNixO2−x was firstly formed on the surface of Al2O3 and then activated in H2/Ar at 800 °C. The genesis and properties of the Ce1−xNixO2−x/Al2O3 catalysts were established using X-ray fluorescence analysis, thermal analysis, N2 adsorption, ex situ and in situ X-ray diffraction, Raman spectroscopy, electron microscopy, EDX analysis, and temperature-programmed hydrogen reduction. The performance of Ce1−xNixO2−x/Al2O3 catalysts in biogas conversion was tuned by regulation of the dispersion and reducibility of the active component through variation of content (5–20 wt.%) and composition (x = 0.2, 0.5, 0.8) of Ce1−xNixO2−x as well as the mode of its loading (co-impregnation (CI), citrate sol–gel method (SG)). For the 20 wt.% Ce1−xNixO2−x/Al2O3 catalyst, the rate of the coke formation decreased by a factor of 10 as x increased from 0.2 to 0.8. The optimal catalyst composition (20 wt.% Ce0.2Ni0.8O1.8/80 wt.% Al2O3) and preparation mode (citrate sol–gel method) were determined. At 850 °C, the 20 wt.% Ce0.2Ni0.8O1.8/Al2O3-SG catalyst provides 100% hydrogen yield at full CH4 conversion and 85% CO2 utilization.

1. Introduction

Human civilization consumes a huge amount of energy. According to the Statistical Review of World Energy [1], over the past decade, global primary energy consumption has increased from 520.90 to 595.15 EJ. The International Energy Agency estimates that by 2030, this parameter will be from 550 to 670 EJ, depending on the scenario for further development [2]. Fossil fuels now account for 82% of primary energy use. Of these, natural gas accounts for 145.35 EJ (24%), oil—184.21 EJ (31%), and coal—160.10 EJ (27%) per year. It is predicted that by 2030 the share of fossil fuels in the global energy mix will remain at a high level of 60–75% [3]. Extraordinary fossil fuel consumption and the resultant vast environmental impacts have changed the Earth’s system and its climate [4]. In particular, energy-related CO2 emissions have increased from 32.9 to 36.6 Gt over the past decade [3]. Many studies point to a relationship between rising levels of atmospheric carbon dioxide and climate change, manifested by changes in temperature and precipitation patterns, ocean warming and acidification, sea level rise, melting glaciers and sea ice, and changes in the frequency, intensity, and duration of extreme weather events [5,6,7]. Renewable primary energy (solar, wind, hydroelectric, biomass, and geothermal power) can provide energy without the greenhouse effects of fossil fuels. So, to achieve environmental sustainability, clean energy technologies are being developed such as low-emission electricity (including solar and wind), low-emission hydrogen (including technology supply chains for electrolyzers and natural gas-based plants with carbon capture and storage), and low-emission synthetic hydrocarbon fuels (including technology supply chains for direct air capture and bioenergy with carbon capture to provide CO2, connected to the low-emission hydrogen supply chain) [8,9,10,11,12,13,14]. For example, in the Net Zero Emissions (NZE) by 2050 Scenario, low-emission fuels (including solid, liquid, and gaseous modern bioenergy, hydrogen, and hydrogen-based fuels) will comprise 20% of all liquid, solid, and gaseous fuels used worldwide in 2030 and 65% by 2050 [3].
Hydrogen is an ecofriendly source of energy and the development of sustainable H2 production technology is essential to achieve clean energy and climate goals. In 2021, low-emission hydrogen production (LEHP) amounted to 1 Mt, which is 0.7% of the total world hydrogen production (94 Mt) [15]. The main path for LEHP is the conversion of fossil fuels with carbon capture, utilization, and storage. The amount of renewable hydrogen produced using renewable electricity through water electrolysis is very small and is equal to 35 kt H2. An additional way to produce renewable hydrogen is biogas reforming (instead of natural gas) or biochemical conversion of biomass [16,17,18,19,20]. Emissions of CO2 from biogas conversion or its upgrading are partly offset by its consumption for photosynthesis during plant growth. Biogas is derived from anaerobic digestion of organic matter in an oxygen-free environment. Various feedstocks such as seeds, grains, sugars, crop residues, woody crops, algae, and industrial or animal wastes are used [17,21,22]. It typically consists of methane (35–75%), carbon dioxide (25–55%), water vapor (1–5%), nitrogen (<1%), hydrogen sulfide (0–200 ppm), and ammonia (0–100 ppm) [23,24]. According to thermodynamics, the use of a mixture of CH4 + CO2 with a molar ratio of CH4/CO2 ≥ 1 as a raw material for production of H2 (reaction (1)) causes significant coke formation due to the realization of several side reactions (reactions (2)–(5)) in addition to the target reaction at temperature range of 600–900 °C [20,25,26]:
CH4 + CO2 ↔ 2H2 + 2CO
CH4 ↔ 2H2 + C
2CO ↔ CO2 + C
CO + H2 ↔ C + H2O
CO2 + 2H2 ↔ C + 2H2O
Therefore, to prevent coking and subsequent plugging of the reactor, steam or oxygen should be added to the initial gas stream [20,27,28,29]. In the case of steam addition, a steam reforming (6) and a water gas shift (7) reaction take place, resulting in an increase in the H2 concentration in the downstream, which is advantageous.
CH4 + H2O ↔ 3H2 + CO
CO + H2O ↔ H2 + CO2
Various catalysts are being developed to efficiently convert biogas to H2: Cu-Ni-Al-layered double hydroxides (LDHs) [30], Ni-M-CaO-ZrO2 (M = Fe, Cu, Co) [31], Ni/MgO-Al2O3 [32], Ni/CaO-Al2O3 [32], Ni-Co/La2O3-γ-Al2O3 [33], Ni/SiO2 [28,34,35], Mo-Ni/γ-Al2O3 [36], Ni/M-CaO (M = Zr, Ce, La) [29], La-NiMgAl catalysts derived from a hydrotalcite-like structure [37], Ni/γ-Al2O3 [38], and Ni supported on alumina modified with CeO2 and/or La2O3 [39,40,41]. The positive role of copper in the reducibility of the nickel active component is shown, which makes it possible to use the Cu-Ni-Al-LDH catalyst without preliminary activation in a reducing medium [30]. At 600 °C and a CH4/CO2 ratio of 1.5, a methane conversion of 75% was achieved. A comparative study of the effects of Fe, Cu, and Co additions on the properties of the Ni-CaO-ZrO2 catalyst showed that only the introduction of cobalt has a positive effect on catalyst activity and stability but does not decrease the coke content [31]. Formation of the NiCo alloy improves particle dispersion and enhances metal–support interaction, which changes the type of carbonaceous deposits. At 750 °C and a CH4/CO2 ratio of 1.0, a Ni-Co-CaO-ZrO2 sample provides a methane conversion of 85% and CO2 conversion of 89% during 50 h on stream. A similar result was obtained in [33]. It was revealed that the improvement in the functional properties of Ni/La2O3-γ-Al2O3 catalyst upon the promotion of Co correlated with the better dispersion and reducibility of Ni particles due to the enrichment of their surface with Co. Optimization of the cobalt content allowed achieving consistently high CH4 and CO2 conversions of 94% for 30 h on stream at 800 °C. It was demonstrated that the modification of Al2O3 support by MgO or CaO improves catalyst performance at T < 750 °C due to the basic properties of these oxides, which enhance the chemisorption of CO2 and facilitate the coke elimination reactions [32]. The inclusion of Ce and La oxides in the composition of Ni/Al2O3 improved the catalytic performance in dry reforming of biogas because of their high oxygen mobility and storage capacity [39]. The presence of cerium oxide also significantly reduced carbon deposition in biogas steam reforming [41]. Application of Zr- or Ce-modified CaO materials as Ni catalyst support provided the sorption of unreacted CO2 and production of H2 with purities of 85–90% in the steam reforming of biogas at 600 °C [29]. The importance of choosing the calcination temperature is shown, since it affects the genesis of the material, its activity, stability, and resistance to carbon formation [37]. For La-NiMgAl catalysts derived from a hydrotalcite-like structure, an increase in their calcination temperature up to 750 °C results in less carbon formation during the biogas conversion process at 700 °C. The presence of hydrogen sulfide in biogas is very critical. It has been found that even at 5–10 ppm hydrogen sulfide in biogas composition, catalyst deactivation is faster [38]. At 750 °C, in the presence of H2S (0.5–1.5%), the CH4 and CO2 conversions over Ni-K/magnesium aluminate (commercial CH4 reforming catalyst Reformax® 250), decrease from 67% and 87% to 19% and 22%, respectively [22], that can be connected with formation of surface or bulk nickel sulfides [34]. Bimetallic Mo-Ni/γ-Al2O3 catalyst offers better stability in the presence of sulfur, activity, and resistance towards coking compared to monometallic Mo and Ni samples [36]. To regenerate the sulfur-poisoned Ni species, a special treatment in O2 can be carried out [34].
Thus, according to literature data, nickel is widely used as an active component in biogas reforming catalysts. Nickel content ranges from 2 to 15 wt.%, while the most commonly used method of preparation is wet impregnation followed by calcination in the temperature range from 250 to 900 °C and reduction in the temperature range from 600 to 850 °C. Various approaches to increasing the activity and stability of Ni catalysts have been reported: promotion of the active component, modification of the support, optimization of preparation and calcination modes. The biogas reforming catalyst must meet the requirements of high activity, thermal stability, and resistance to deactivation caused by sulfur poisoning and carbon deposition. The issues of developing new catalytic systems and methods of their synthesis for obtaining catalytic materials with improved properties remain topical. Our recent work revealed that the use of bulk (CeM)1−xNixOy (M = Al, La, Mg) mixed oxides as catalyst precursors is beneficial to the catalytic properties of Ni catalysts [42]. So, in this study, in order to achieve a high and stable yield of hydrogen in the process of steam reforming of biogas, highly dispersed nickel catalysts were prepared using the exsolution approach. Unlike previous works [42,43,44], not bulk, but Ce1−xNixO2−x solid solution supported on γ-Al2O3 granules was formed and then activated in H2/Ar at 800 °C. The performance of Ce1−xNixO2−x/Al2O3 catalysts in biogas conversion was tuned by adjusting the dispersion and reducibility of the active component by varying the content (5–20 wt.%) and composition (x = 0.2, 0.5, 0.8) of Ce1−xNixO2−x as well as the mode of its loading (co-impregnation, citrate sol–gel method). The catalyst performance in H2 production from biogas was studied and correlated with structural, morphological, and ox-red material characteristics obtained by X-ray fluorescence analysis, thermal analysis, N2 adsorption, ex situ and in situ X-ray diffraction, Raman spectroscopy, electron microscopy, EDX analysis, and temperature-programmed hydrogen reduction. Specially developed chemical composition and nanostructure of the catalyst, combined with an advanced approach to its synthesis, provided the creation of a highly efficient catalyst for the conversion of biogas to hydrogen.

2. Materials and Methods

2.1. Catalyst Preparation

Ce1−xNixO2−x/Al2O3 catalysts were prepared by the co-impregnation method (CI) or citrate sol–gel method (SG) with variation of content (5–20 wt.%) and composition (x = 0.2, 0.5, 0.8) of Ce1−xNixO2−x. Ni/Al2O3 samples without a Ce component were also synthesized and used for comparison. Spherical Al2O3 with a grain size of 0.3–0.8 mm was preliminarily calcined at 850 °C for 6 h in air and used as a support for catalysts. Metal nitrate salts (Ce(NO3)3∙6H2O, Ni(NO3)2∙6H2O) and citric acid (CA, C6H8O7∙H2O) were used as starting chemicals. Chemicals of 99.9% purity were purchased from the commercial supplier SoyuzKhimProm and used as such, without any additional purification. In the case of the co-impregnation method, the required amounts of metal salts were dissolved in water and the resulting solution was introduced into Al2O3 by the incipient wetness impregnation technique. After that, the samples were thoroughly dried at 90 °C for 24 h and calcined at 500 °C for 4 h in air. The rate of temperature rise was 2 degrees per minute, with the exposure for 30 min at a constant temperature with an interval of 50 °C. Before testing the samples in the catalytic process, they were reduced in situ at 800 °C for 1 h in an H2/Ar gas flow.
In the case of the sol–gel method, an aqueous solution of citric acid was prepared, in which the required amount of metal salts was dissolved. The molar ratio CA/(Ce + Ni) was equal to 0.25. The resulting solution was mixed with alumina. The drying, calcination, and reduction procedures for the SG-series samples were similar to those described above for the CI-series samples.

2.2. Catalyst Characterization

The samples after calcination, reduction, and testing in the catalytic process were studied by X-ray fluorescence analysis in an ARL ADVANT’X analyzer (ThermoTechno Scientific, Ecublens, Switzerland), thermogravimetry (TG) and differential thermogravimetry (DTG) with differential thermal analysis (DTA) in air in a simultaneous thermal analyzer (NETZSCH STA 449C, Selb, Germany), N2 adsorption in an ASAP 2400 automated volumetric instrument (Micromeritics, Norcross, GA, USA), ex situ X-ray diffraction with CoKα radiation (λ = 1.79021 Å) in an HZG-4C diffractometer (Freiberger Präzisionmechanik, Freiberg, Germany), in situ X-ray diffraction with CuKa radiation (λ = 1.5406 Å) in an AXS D8 diffractometer (Bruker, Karlsruhe, Germany), Raman spectroscopy using an excitation wavelength of 514.5 nm in a Renishaw Invia Raman spectrometer (Renishaw plc., Wotton-under-Edge, Gloucestershire, UK), scanning electron microscopy in a JEOL JSM-6390 LA (JEOL, Tokyo, Japan) electron microscope with a JED 2300 X-ray energy dispersive detector, and temperature-programmed hydrogen reduction (TPR) in a setup equipped with a flow reactor and a thermal conductivity detector. A description of devices and conditions for studying materials by physicochemical methods can be found in our earlier publications [44,45,46].

2.3. Catalyst Testing

The steam conversion of biogas was studied in a fixed-bed quartz flow reactor with an inner diameter of 10 mm, in the temperature range of 600–850 °C, at 1 atm, a gas flow rate of 200 mlN/min, and a molar ratio of reagents of CH4:CO2:H2O:He = 1:0.8:0.4:2.8. For the catalytic activity testing, a 0.5 g sample with a grain size of 0.3–0.8 mm was used.
The analysis of reaction mixtures was performed using the Kristall 2000 m online automatic gas chromatography system (Yoshkar-Ola, Russia) with a flame ionization detector and a thermal conductivity detector. The catalyst performance was characterized by CH4 conversion (XCH4), CO2 conversion (XCO2), yield of H2 (YH2), and yield of CO (YCO).

3. Results and Discussion

3.1. Synthesis of Catalysts

Table 1 shows the chemical compositions of prepared Ce1−xNixO2−x/Al2O3 catalysts. The nickel content in the catalysts ranged from 1.5 to 10.0 wt.% and the cerium content from 1.5 to 14.7 wt.%. Note that different contents of metals were achieved either by changing the content of the Ce1−xNixO2−x component (5–20 wt.%) at a constant Ni/Ce molar ratio (x = 0.8) or by varying the Ni/Ce molar ratio (x = 0.2–0.8) at a constant content of the mixed oxide additive (20 wt.%).
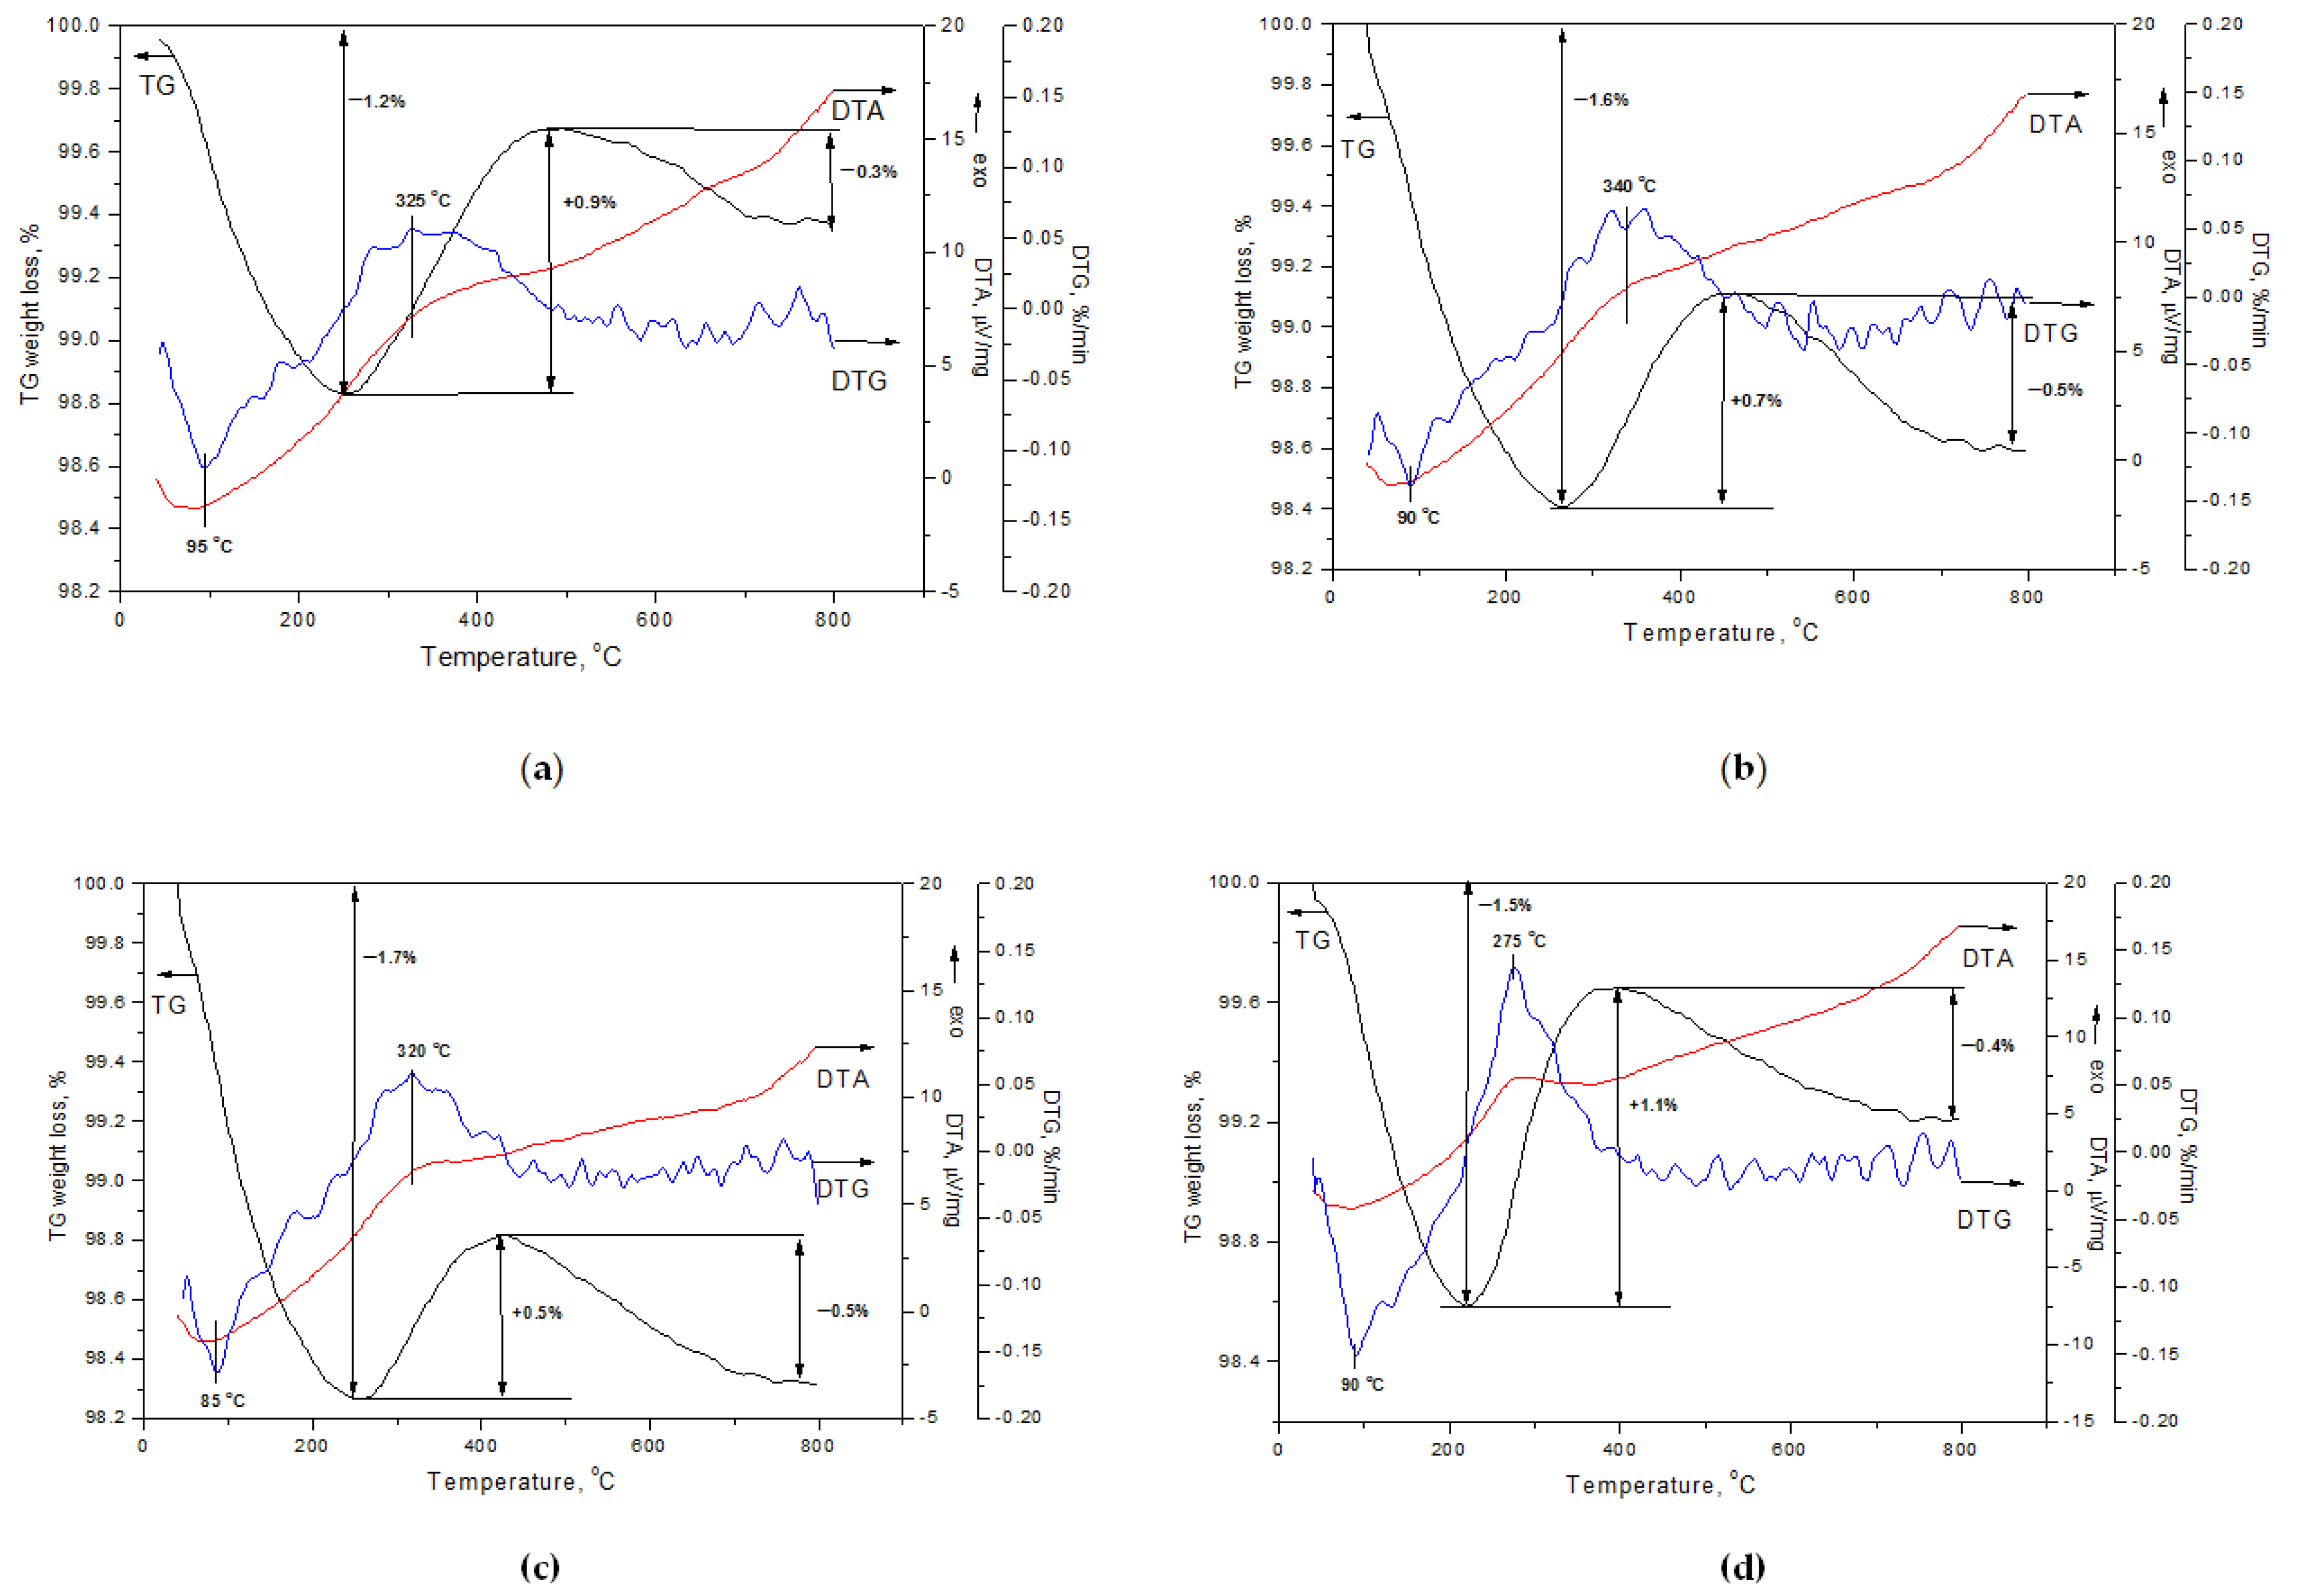
The comparative study of the genesis features of catalysts obtained by various preparation methods was carried out by thermal analysis. Figure 1 shows typical derivatograms of dried samples from CI- and SG-series. Common to all samples is the presence of weight loss in the low-temperature region (T < 200 °C). It is accompanied by an endothermic effect and should be attributed to adsorbed water elimination.
For samples of the CI-series, in the medium-temperature region (200 °C < T < 500 °C), one or two peaks are observed on the DTG pattern, corresponding to a weight loss (Figure 1, Table 1). This process is endothermic and should be associated with the decomposition of impregnated metal nitrate salts. At a high concentration of Ce0.2Ni0.8O1.2 (20 wt.%), two peaks were clearly observed with maxima (TDTG) at 209 and 286 °C, which, according to the data for individual salts [47,48], can be attributed to the decomposition of cerium and nickel nitrates, respectively. It can be seen that the presence of the cerium salt does not affect the decomposition temperature of the nickel salt: for 10Ni/Al2O3-CI and 20Ce0.2Ni0.8O1.2/Al2O3-CI samples, its values are very close and amount to 286–289 °C. A decrease in the salt decomposition temperature (TDTG) from 286 to 221 °C was observed with a decrease in the Ce0.2Ni0.8O1.2 content from 20 to 5 wt.% (Table 1).
For samples of the SG-series, the DTG patterns have one strong peak in the medium-temperature region (Figure 1). It corresponds to a weight loss, proceeds with pronounced exothermic effects, and can be attributed to the decomposition of metal citric acid complexes and citric acid [49,50]. Decomposition behaviors of 10Ni/Al2O3-SG and 20Ce0.2Ni0.8O1.2/Al2O3-SG samples are very similar. With a decrease in the Ni/Ce molar ratio, the decomposition temperature of complexes decreases: TDTG shifts from 242 to 212 °C.
Thus, in both methods, the decomposition of precursors deposited on Al2O3 occurs in the temperature range of 200–500 °C. As the Ni content decreases, TDTG shifts towards lower temperatures, which may be caused by the higher dispersion of the deposited salt particles [48]. Comparing the two methods, the endothermal two-step decomposition scheme takes place at catalyst preparation by the CI method, while the exothermal one-step decomposition occurs at using the SG method. It may contribute to the formation of a supported Ce-Ni-O solid solution. In addition, in the case of the SG method, the decomposition of precursors proceeds at lower temperatures. Differences in TDTG values (ΔTDTG) are more pronounced at higher Ni content (10 wt.%) and they are equal to 40 °C. So, the heat released from oxidative decomposition of organics promotes simultaneous transformation of Ni and Ce precursors, which can effectively suppress their aggregation [51], resulting in smaller particle size and solid solution formation.

3.2. Characterization of the Catalysts before Reaction

The textural and structural properties of Ce1−xNixO2−x/Al2O3 catalysts before the reaction are listed in Table 2.
All the catalysts before the reaction show specific surface area values (SBET) ranging from 71 to 99 m2/g, pore volume (Vp) around 0.29–0.39 cm3/g, and mean pore size (Dp) between 12.8 and 18.0 nm. The obtained values of textural characteristics for Ce1−xNixO2−x/Al2O3 are typical for Al2O3-based nickel samples [51] and significantly exceed those for reduced bulk nickel–cerium catalysts [42,52]. The comparison between catalysts and Al2O3 support shows that the addition of Ce1−xNixO2−x leads to smaller SBET and Vp because of the blockage of some pores. This trend increases with increasing the additive content and when the CI method is used instead of the SG method (Table 2). It can be seen that the samples from the SG-series have a smaller mean pore size compared to the samples of the CI-series, which may be due to a different mode of the distribution of Ce1−xNixO2−x in the support matrix. Probably in the case of the SG method, the lower Dp can be attributed to the fact that the internal surface area of the support pore system is uniformly covered with the dispersed Ce1−xNixO2−x species.
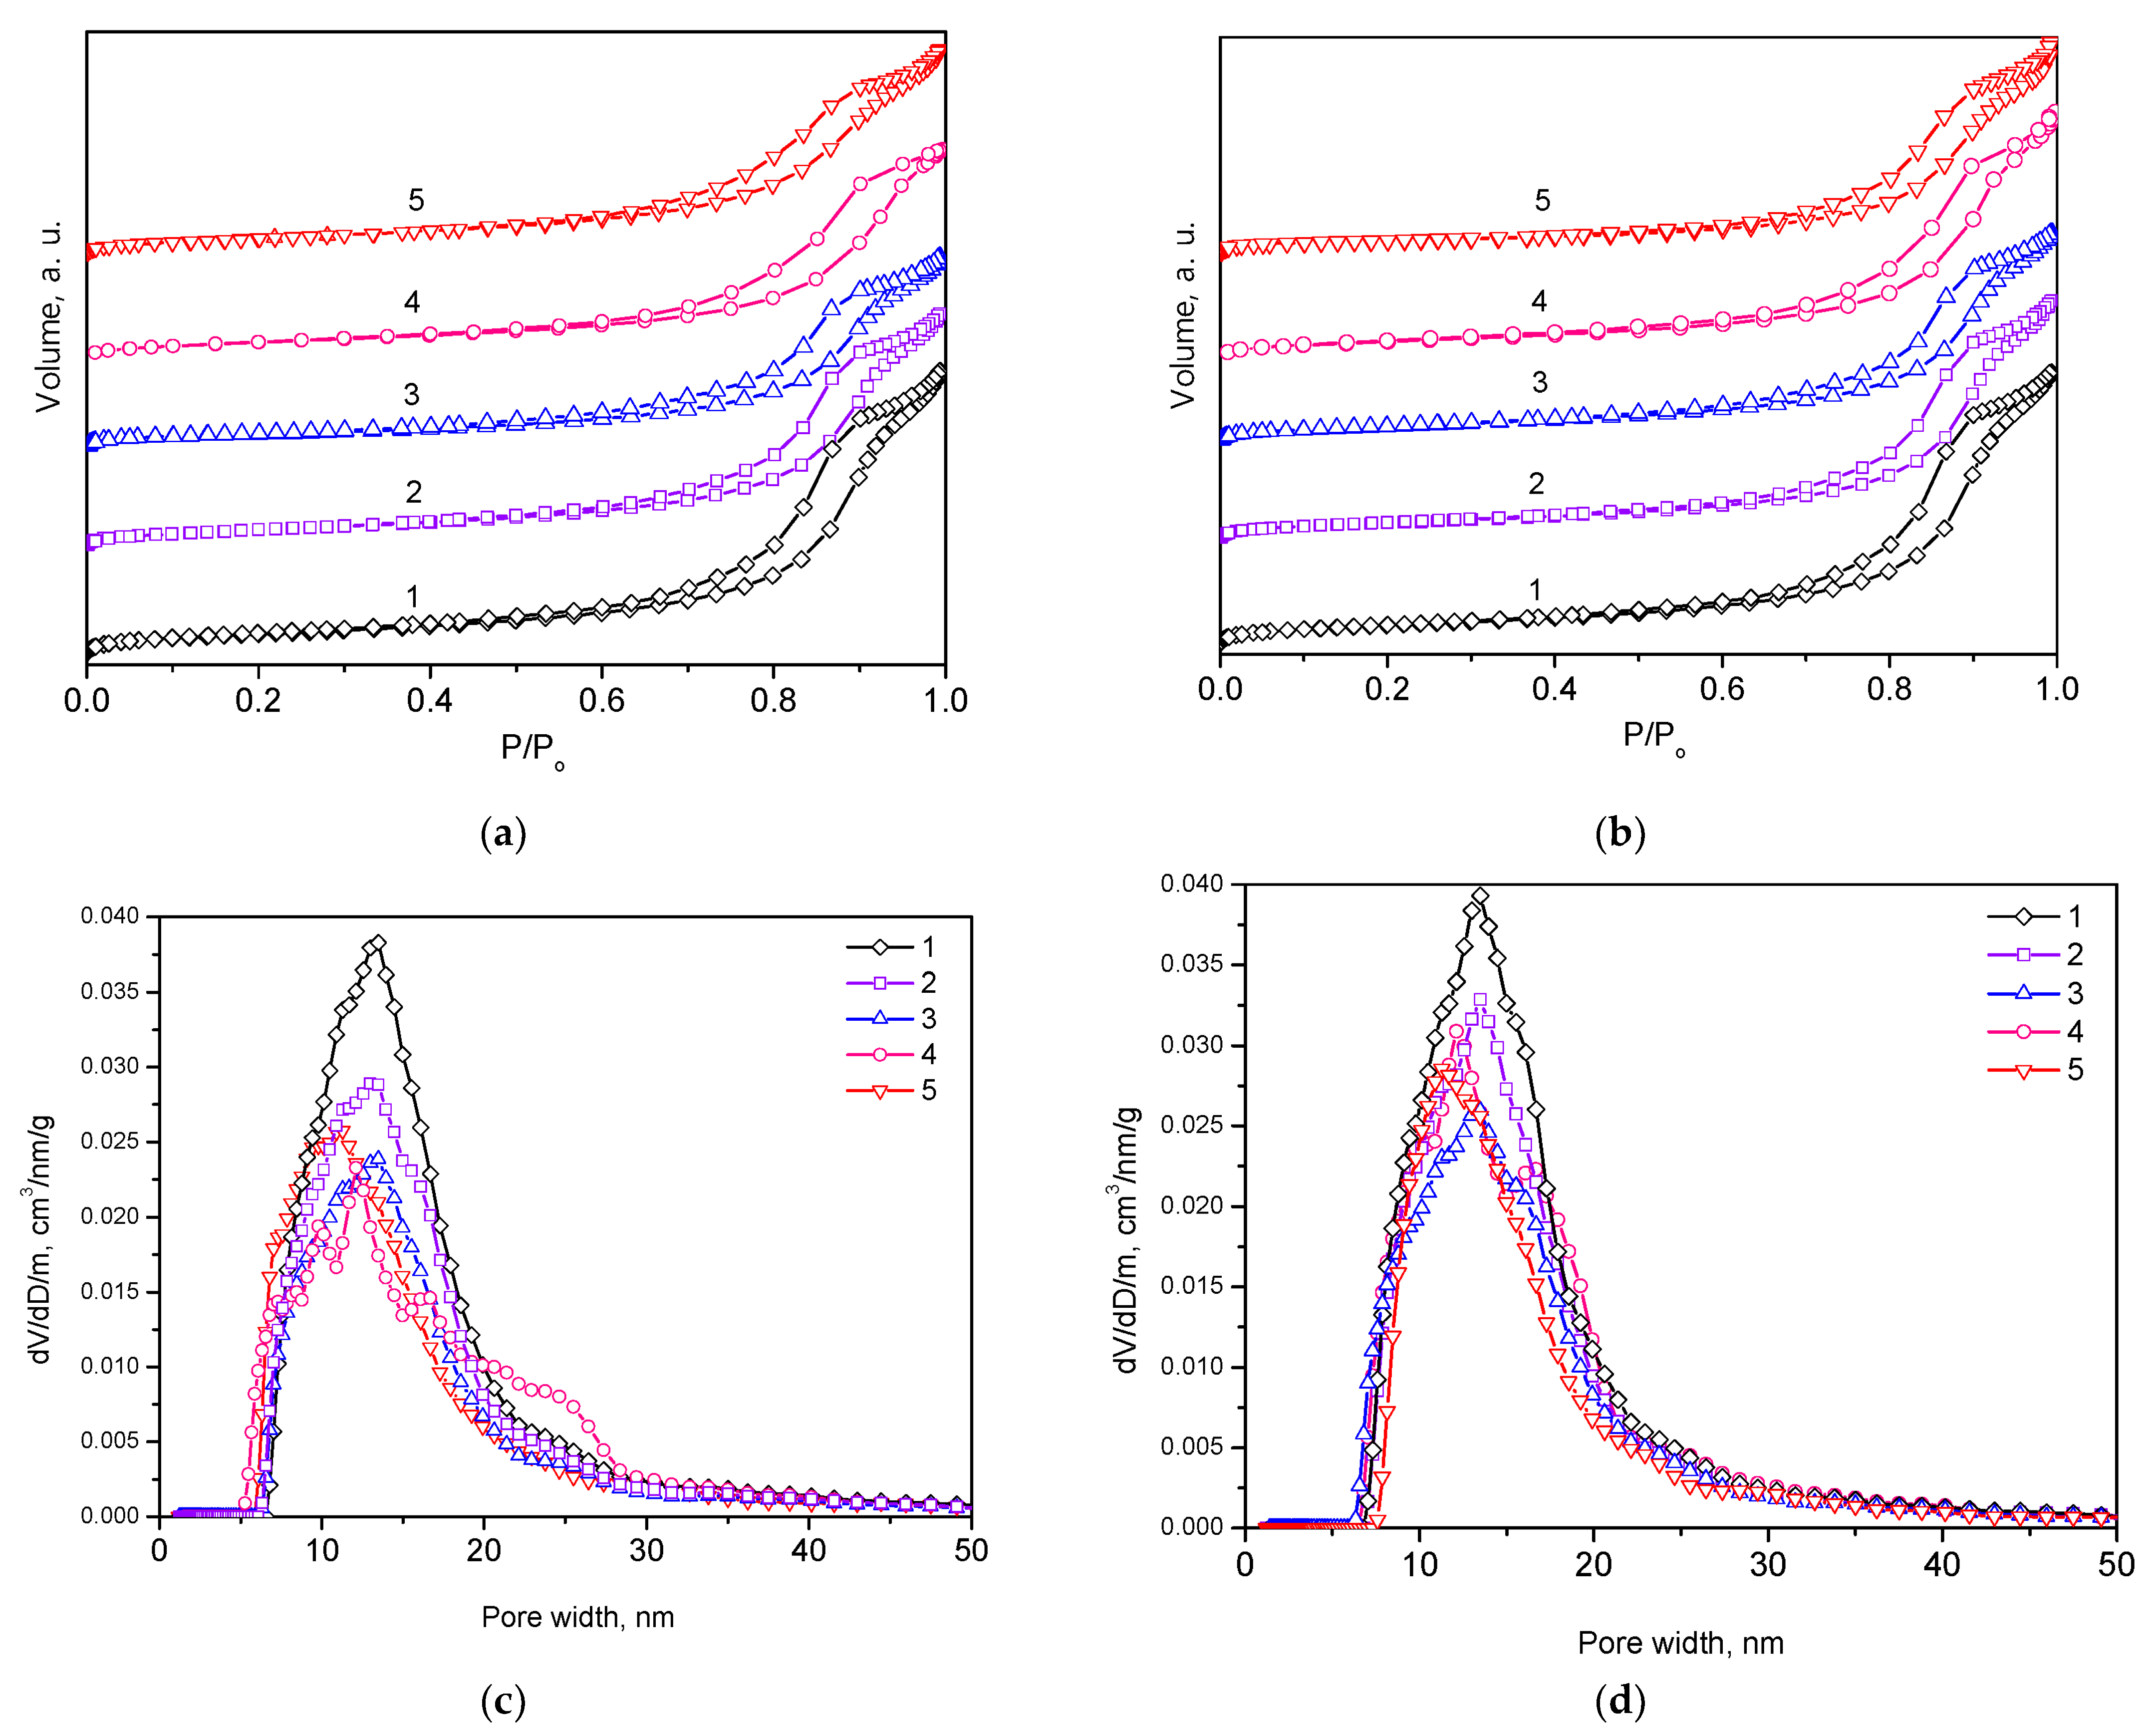
Figure 2 shows the nitrogen adsorption–desorption curves and the distribution of pores for Al2O3 support and Ce1−xNixO2−x/Al2O3 catalysts after calcination and reduction.
The isotherms are of type IV according to the IUPAC classification, characteristic of a mesoporous material, with H2-type hysteresis, characteristic of materials with pores lacking any defined shape [53]. Most pore sizes are distributed in a narrow range of 10–20 nm. Note that the reduction of samples at 800 °C has little effect on their textural characteristics, which points to their high thermal stability. Samples with a low Ni/Ce molar ratio turned out to be the least resistant to high-temperature treatments. A decrease in the specific surface area and an increase in the average pore diameter after reduction may be caused by the sintering of the thinnest pores.
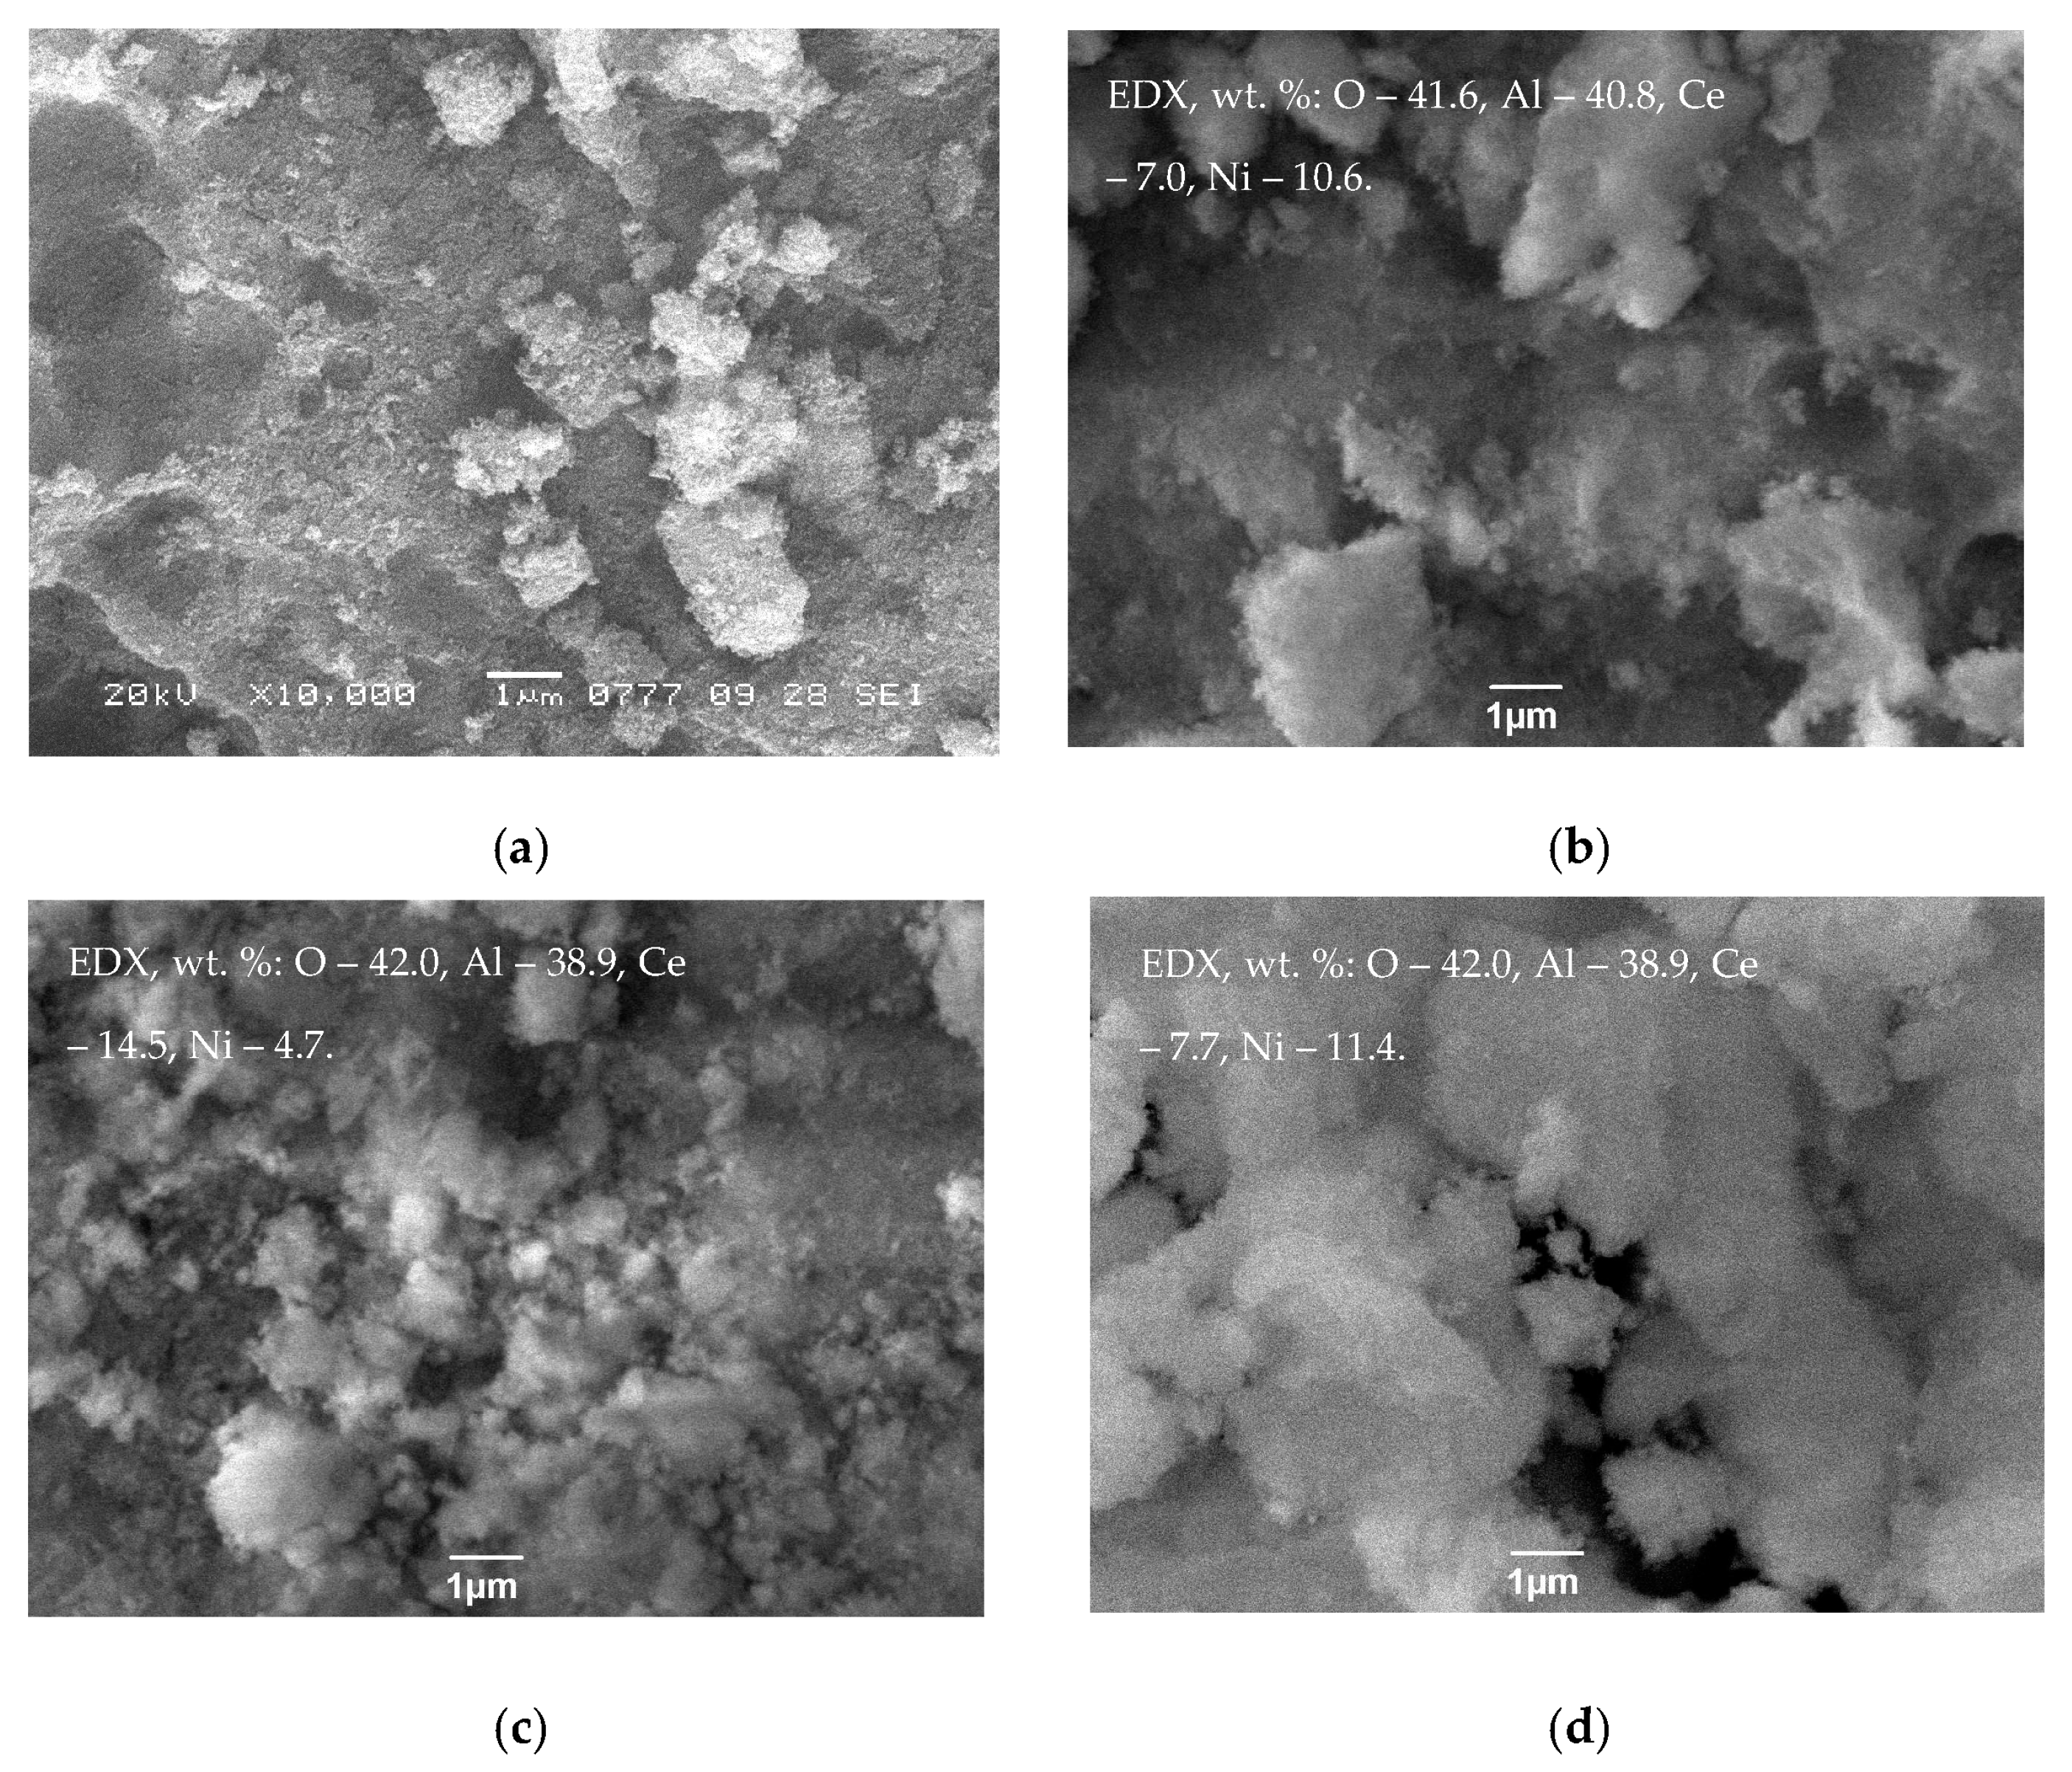
The SEM study showed that the morphological properties of the samples after calcination and subsequent reduction are close and are determined by the morphology of the initial support (Figure 3). The samples consist of agglomerates of particles of irregular shape and different sizes. The EDX analysis shows that the surface Ni and Ce contents (Figure 3) are close to those in the bulk (Table 1). This points to a fairly uniform distribution of Ni and Ce over the Al2O3 support.
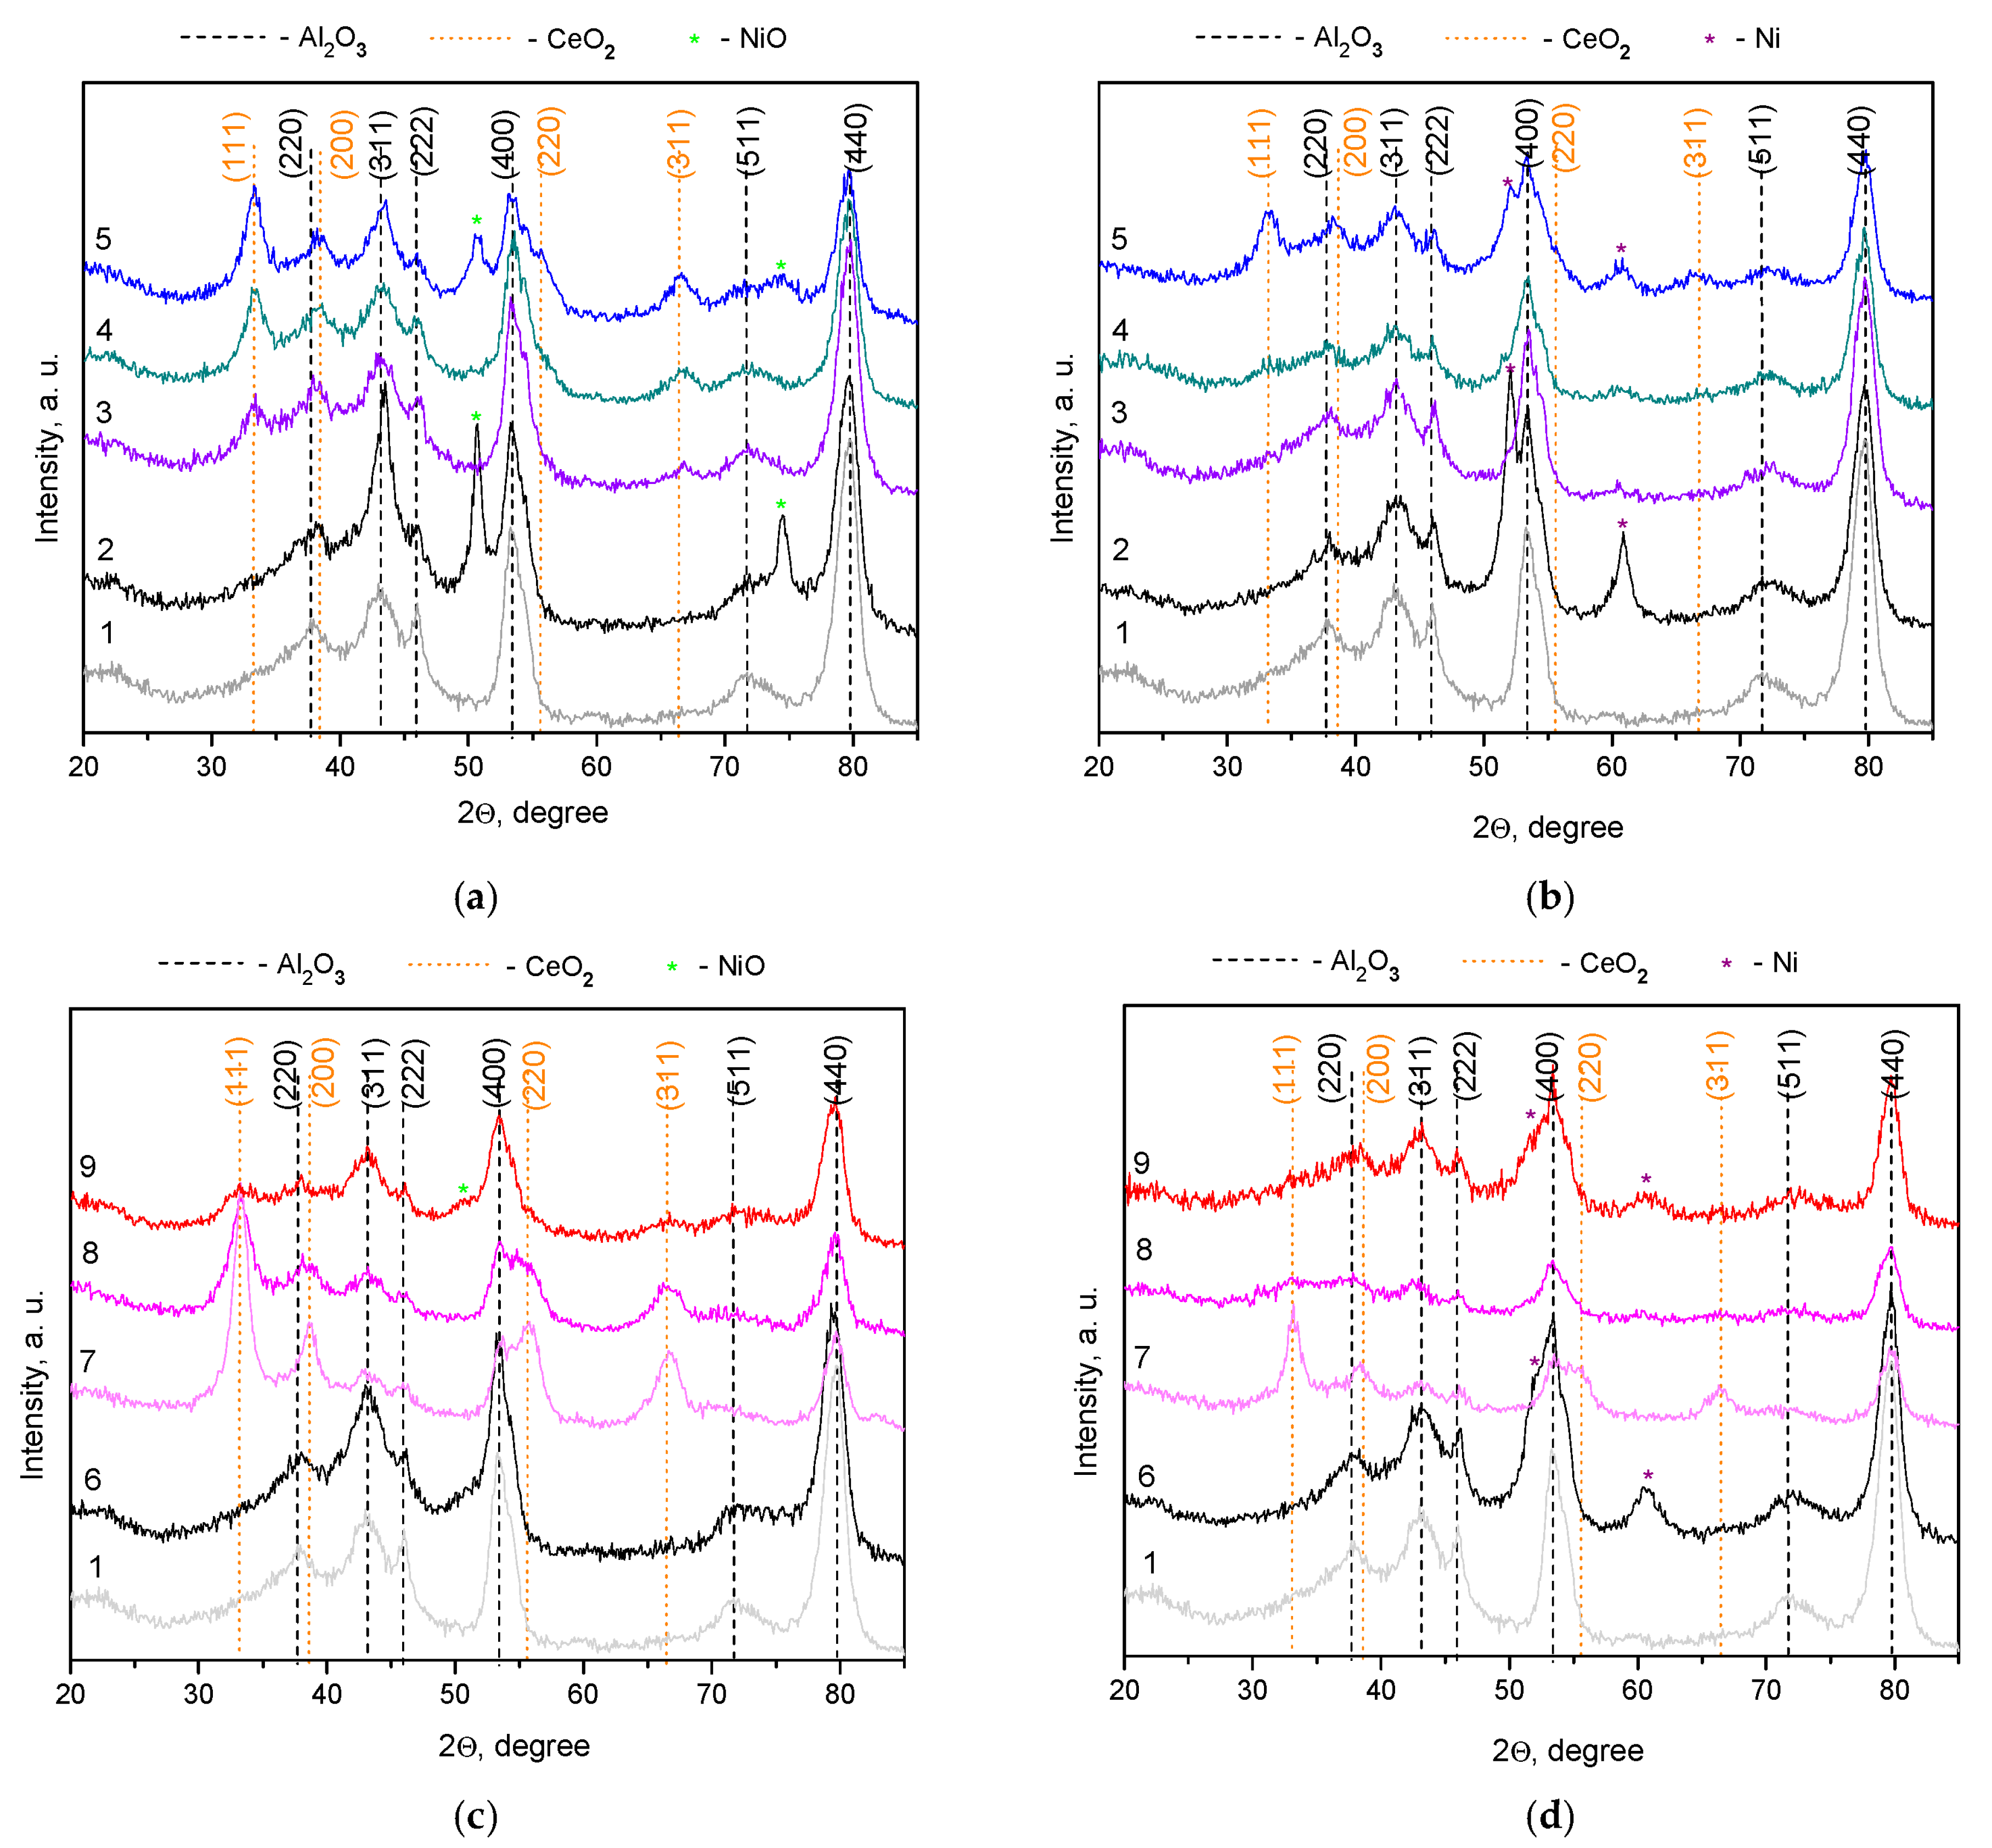
The XRD patterns of Al2O3 support and Ce1−xNixO2−x/Al2O3 catalysts before the reaction are displayed in Figure 4. XRD results show that the Al2O3 support contains mainly the γ-Al2O3 phase and a small amount of the δ-Al2O3 phase, the formation of which is intensified with an increase in the calcination temperature. All the Ce1−xNixO2−x/Al2O3 catalysts before the reaction present the (γ + δ)-Al2O3 phases. Peaks at 2θ of 37.6°, 43.3°, 45.9°, 53.3°, 71.7°, and 79.5° correspond to the (220), (311), (222), (400), (511), and (440) crystallographic planes, respectively. With variation of the preparation method and catalyst composition, the structural characteristics of Al2O3 practically do not change: the formal unit cell parameter remains equal to 7.911 ± 0.004 Å. The only exception is the 10Ni/Al2O3-SG sample after calcination, for which an increase in the formal unit cell parameter (7.909 → 7.922 Å) may point to the interaction of alumina with nickel oxide to form a Ni–Al–O solid solution with a spinel structure. Typically, such a deep interaction between NiO and the Al2O3 support occurs at a higher calcination temperature [39]. In our case, exothermic effects accompany the decomposition of precursors in the SG synthesis method (Figure 1). This can lead to a high local temperature on the catalyst grain sufficient for the formation of a Ni–Al–O solid solution.
For the 10Ni/Al2O3-CI sample after calcination, reflections of Al2O3 and NiO were detected (Figure 4). Two sharp peaks were clearly visible at 50.7 ° and 74.5°, which corresponded to the (200) and (220) reflections of the crystal NiO structure, respectively. The average particle size of NiO is 25.0 nm. The phase composition of the Ce1−xNixO2−x/Al2O3-CI samples after calcination depends on the content of Ce1−xNixO2−x. When the content of Ce1−xNixO2−x is 5–10 wt.%, besides the Al2O3 phase, only the CeO2 phase is present with a crystallite size of 6.5–7.5 nm. Peaks at 2θ of 33.3°, 38.6°, 55.8°, and 66.5° corresponded to the (111), (200), (220), and (311) crystallographic planes, respectively. The parameter of the CeO2 unit cell (a) is 5.410 Å which is close to reference data (a = 5.411, JCPDS 43-1002). The NiO phase of 10 nm in particle size appears at only a high Ce1−xNixO2−x content of 20 wt.%. During the reduction of samples of the CI-series, the Al2O3 and CeO2 phases were preserved, while the NiO phase was transformed into the Ni phase with peaks at 2θ of 52.2° and 61.1° corresponding to the (111) and (200) reflections. The dispersion of the Ni-containing phase was improved due to the redispersion associated with a much lower molar volume of Ni compared to NiO. It was found to be in the typical range for alumina-based Ni catalysts [39]. Note, however, that Ni-containing phases may be present in the 5Ce1−xNixO2−x/Al2O3-CI and 10Ce1−xNixO2−x/Al2O3-CI catalysts as small nanoparticles well dispersed on the support and thus undetectable by XRD.
For the 10Ni/Al2O3-SG sample after calcination, only reflections of Al2O3 are observed (Figure 4). As mentioned above, the formal unit cell parameter of Al2O3 has an increased value, which may be associated with the formation of a Ni–Al–O solid solution with a spinel structure. After the reduction of 10Ni/Al2O3-SG, the value of the formal unit cell parameter decreases (7.922 → 7.907 Å), and the Ni phase is formed with an average particle size of 13.5 nm. These data point to the destruction of the Ni–Al–O solid solution in a reducing medium. All Ce1−xNixO2−x/Al2O3-SG samples after calcination contain, besides the Al2O3 phase, the CeO2 phase (Figure 4). The unit cell parameter of CeO2 has lower values compared to the tabular one (5.400 vs. 5.411 Å), which is assigned to the incorporation of Ni2+ with a smaller ion radius (0.72 Å) into the lattice of ceria (0.94 Å). The average size of its crystallites decreases (25.0 → 5.5 nm) with a decreasing Ce/Ni molar ratio (Table 2), which is connected with the inhibition of crystallite growth at doping [54]. So, the observed structural behavior of the CeO2-based phase may indicate the formation of a Ni–Ce–O solid solution [55]. The X-ray diffraction patterns of the Ce1−xNixO2−x/Al2O3-SG samples before the reaction lack clear peaks corresponding to the Ni-containing phase (Figure 4). Traces of the Ni-containing phase were observed only in the 20Ce0.2Ni0.8O1.8/Al2O3-SG sample with a maximum Ni content of 10.0 wt.%, indicating the high dispersion of the active component.
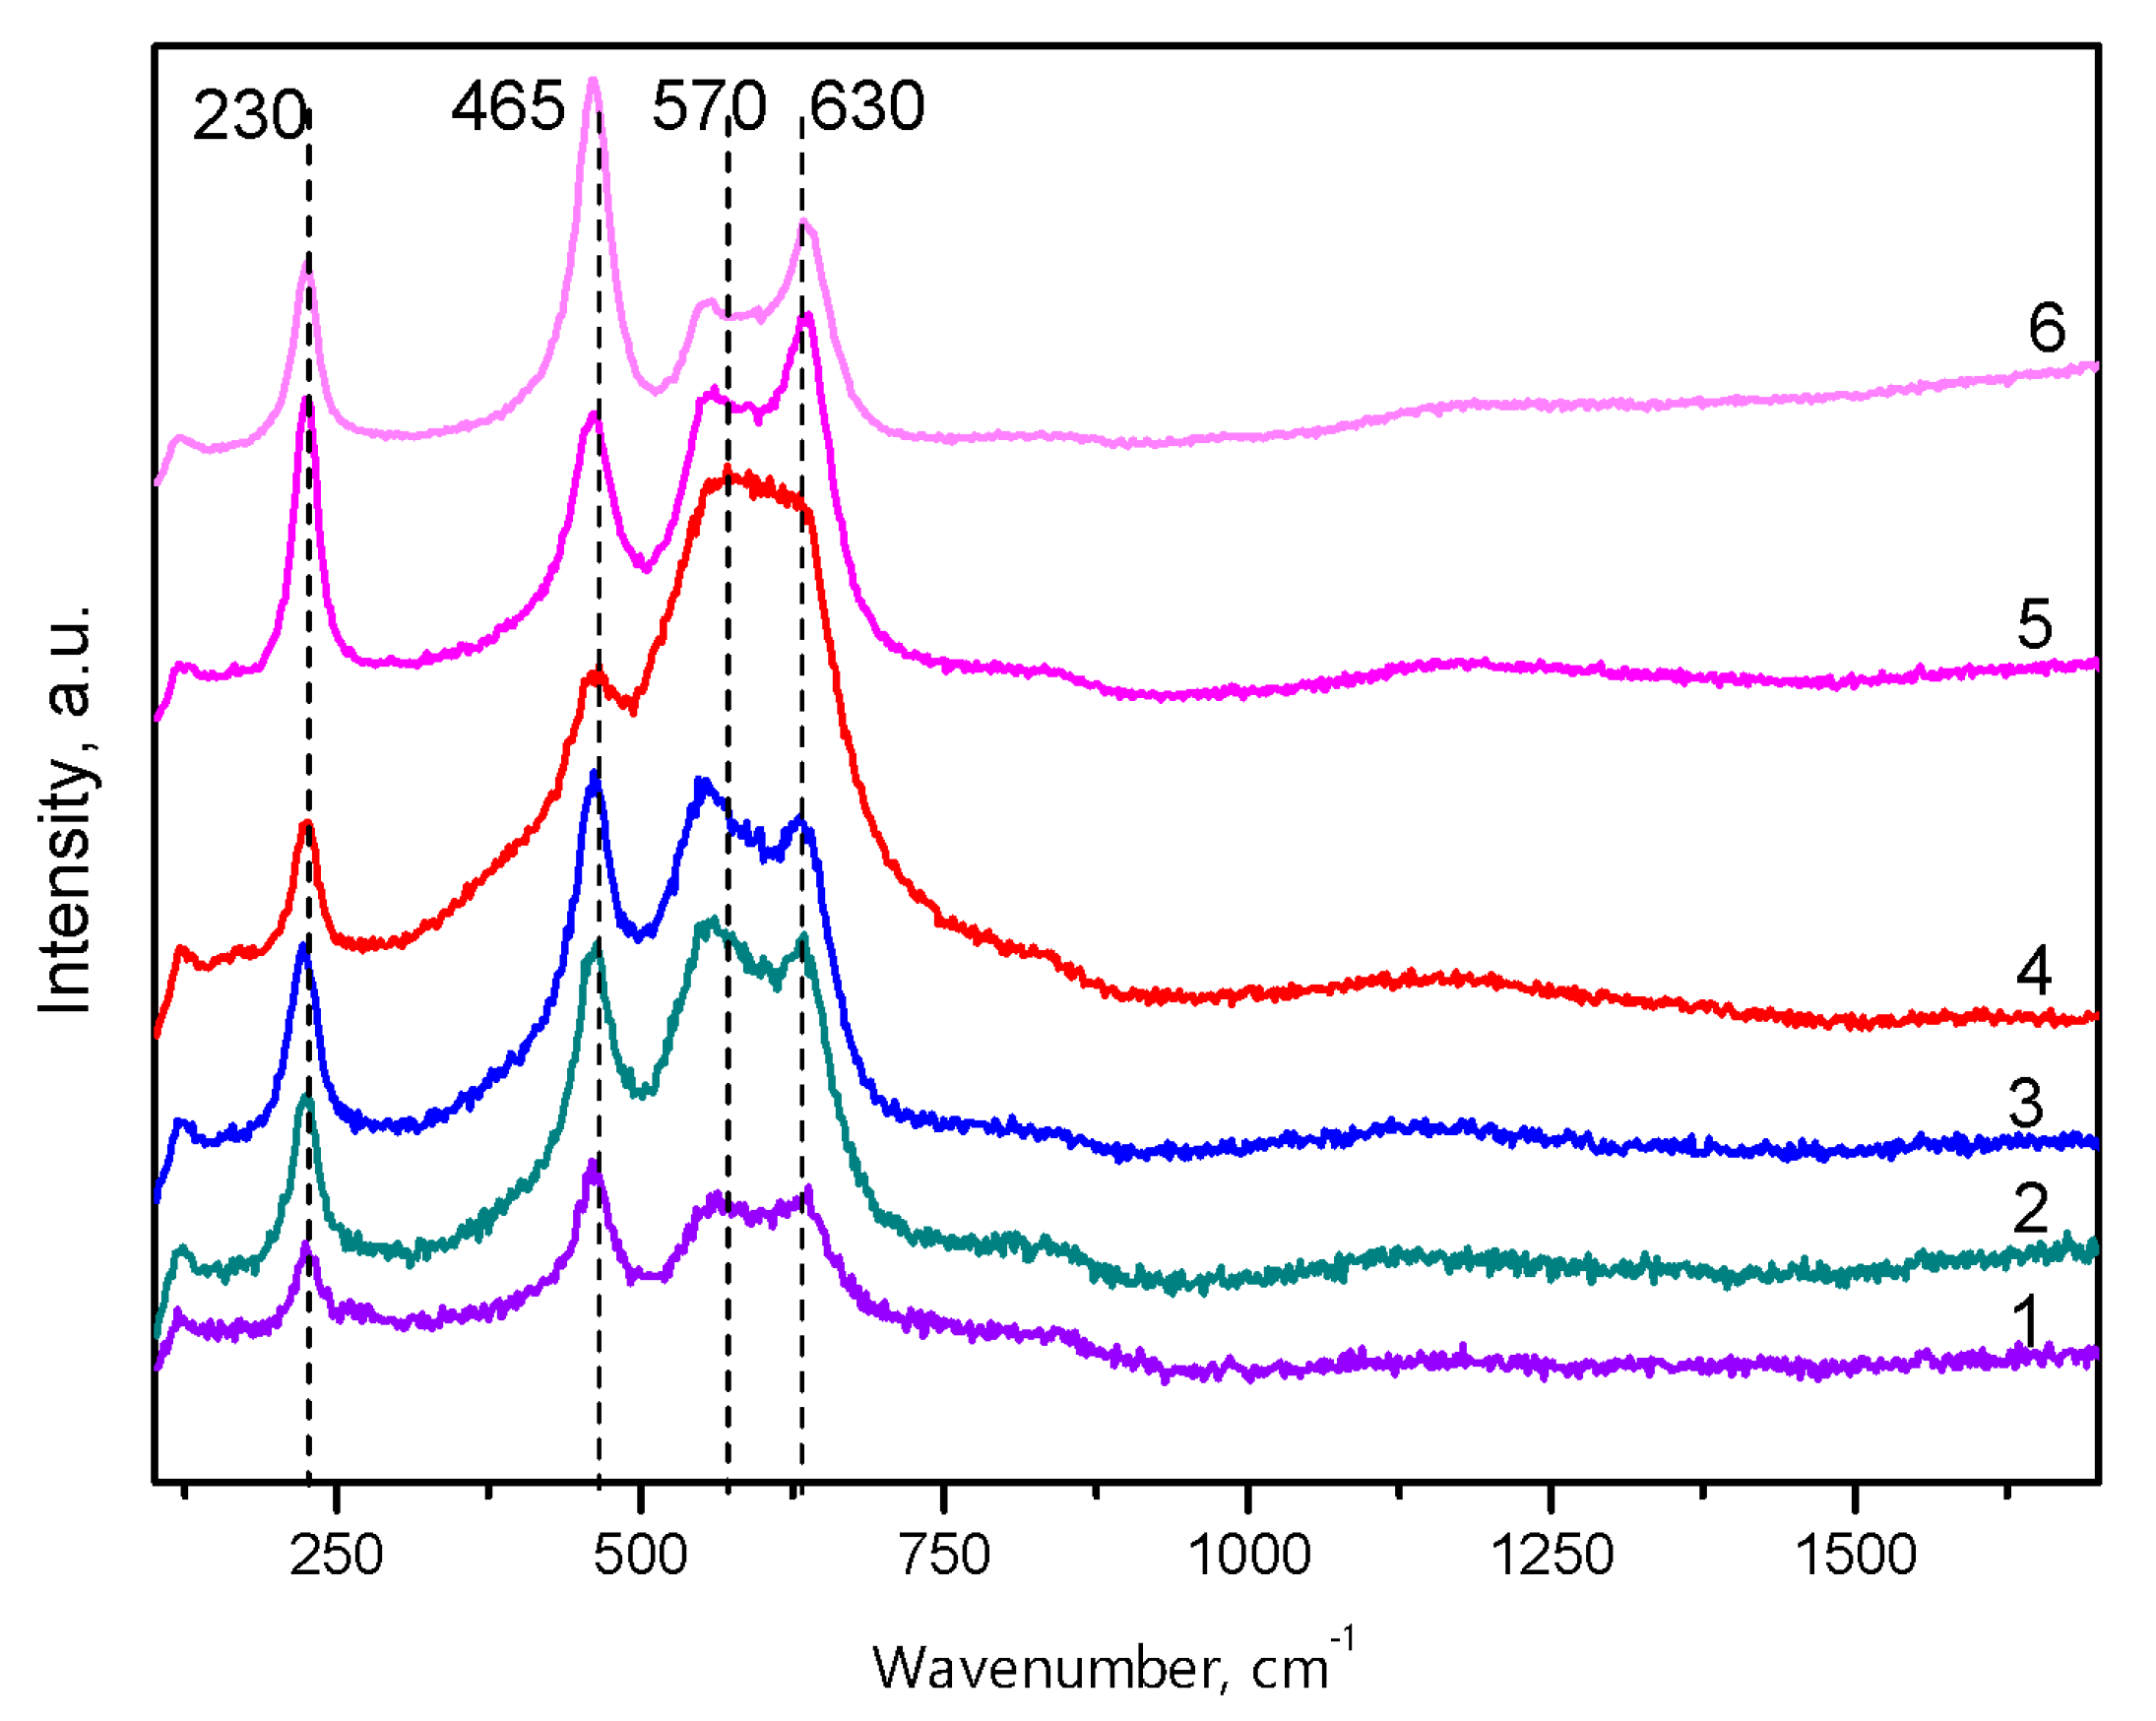
The Raman spectroscopic study of Ce1−xNixO2−x/Al2O3 catalysts revealed four peaks at 230, 465, 570, and 630 cm−1, shown in Figure 5. The strong peak at 465 cm−1 is associated with the first-order F2g symmetry of CeO2 and can be viewed as a symmetric breathing vibrational mode of the O ions around each cation [56]. The other three peaks were assigned to the second-order transverse acoustic mode (2TA, 230 cm−1) and defect-induced mode (D1, 570 cm−1; D2, 630 cm−1) of the cubic fluorite phase of CeO2, respectively. The ratio between the integrated area of the D1 peak and the F2g peak (marked as I570/I465) represents the relative concentration of oxygen vacancies introduced into ceria in order to maintain charge neutrality when Ce4+ ions are replaced by cations with different oxidation states [57]. Compared with the bulk CeO2 support (I570/I465 = 0.02), the I570/I465 ratio of Ce1−xNixO2−x/Al2O3 catalysts increases, which points to the replacement of Ce4+ cations by Ni2+ cations and the formation of a Ni–Ce–O solid solution (Table 2). This process is intensified by decreasing the Ce/Ni molar ratio and using the SG preparation method instead of CI.
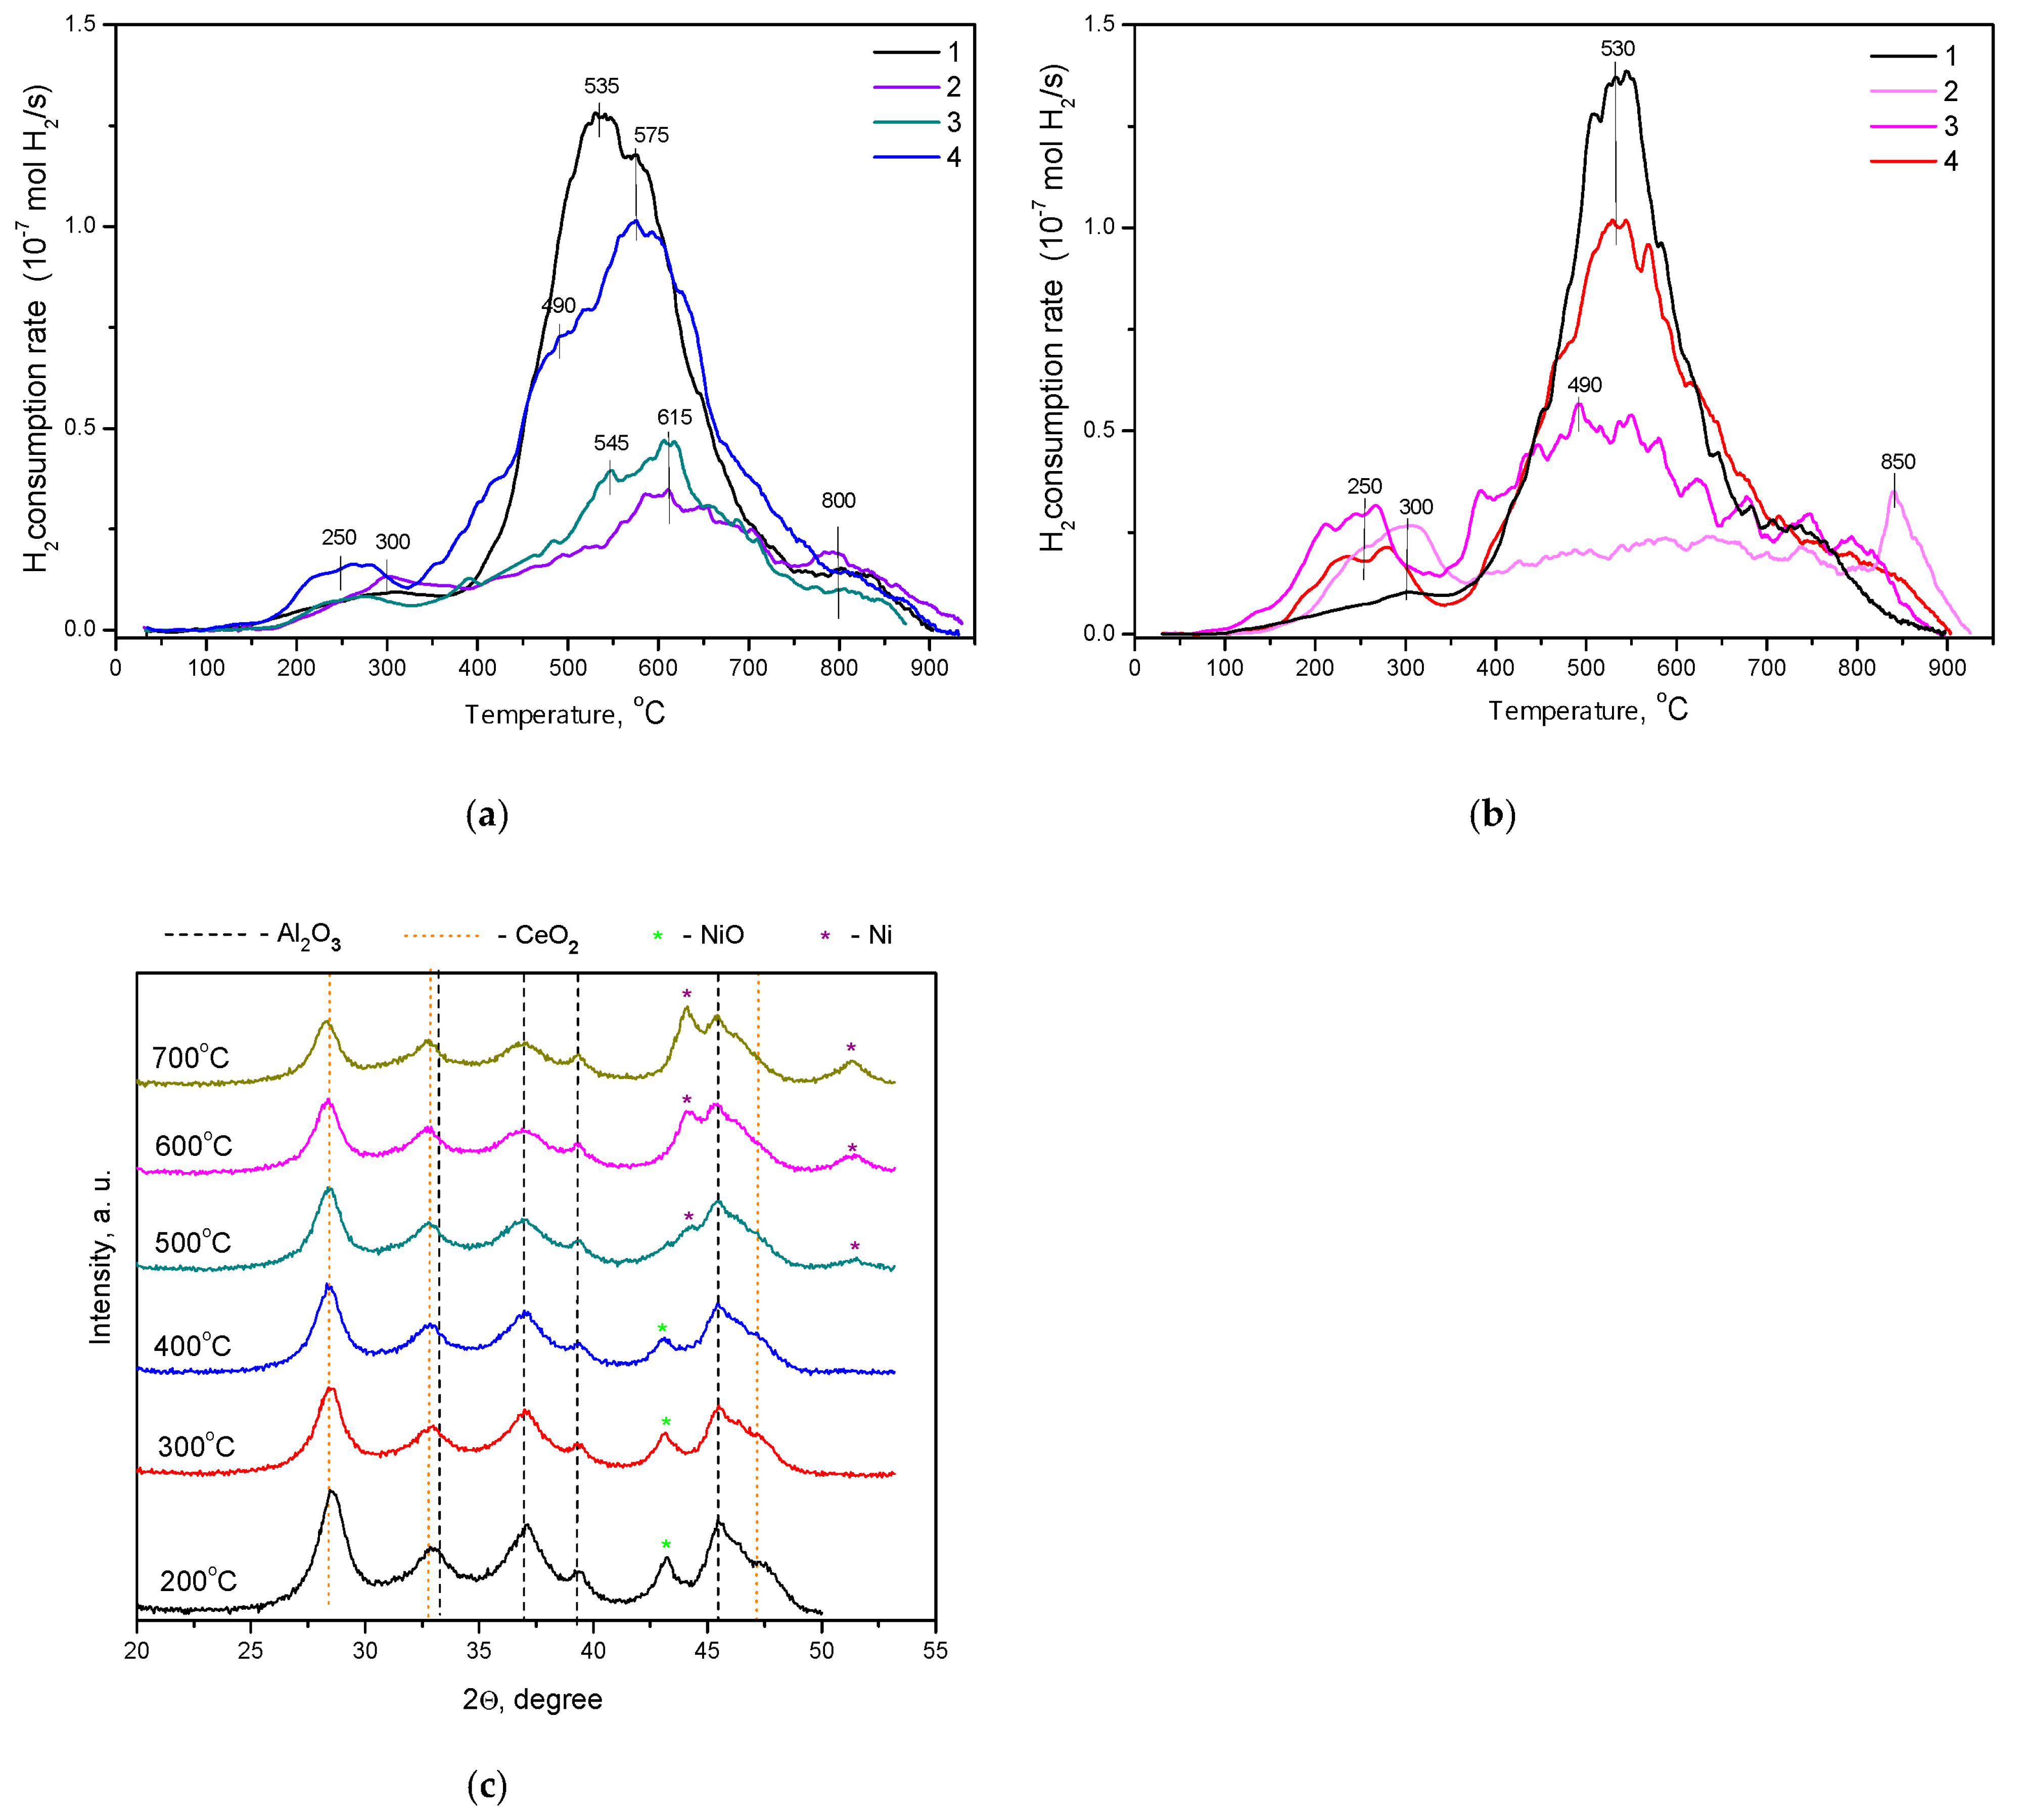
To investigate the reduction behavior of the material, TPR with hydrogen and in situ XRD during the reduction were performed. It can be seen from Figure 6a,b that the TPR profiles from the Ce1−xNixO2−x/Al2O3 catalysts have three peaks: (i) at a low temperature of 200–300 °C which refers to nickel species with weak nickel–support interaction, (ii) at a medium temperature of 450–650 °C pointing to the presence of nickel species with medium to strong interaction with the support, and (iii) at a high temperature of 800 °C caused by the presence of a NiAl2O4 spinel structure. Most Ni2+ cations are reduced in the region of medium temperatures. Indeed, the significant phase transformations during the reduction of the sample begin at a temperature of 400 °C, where a decrease in the intensity of the (200) NiO peak is noticeable (Figure 6c). At T = 450–500 °C, the appearance of the (111) reflection of the Ni metal phase is observed, the intensity of which subsequently increases due to an increase in the proportion of this phase. The resulting system is sufficiently dispersed, and the average size of the CSR of the CeO2 and Ni phases does not exceed 7–8 nm even after treatment at 700 °C.
A decrease in the reduction temperature of Ni2+ is observed at an increase in the content of the Ce1−xNixO2−x additive or the use of the SG method instead of CI (Figure 6). In the first case, enlargement of nickel particles can be the cause of a decrease in the degree of their interaction with the Al2O3 support. In the latter case, the formation of a Ni–Ce–O solid solution can prevent the interaction of Ni2+ with Al2O3 and, accordingly, facilitate the formation of a metallic Ni ° phase during reduction.
Thus, Ce1−xNixO2−x/Al2O3 catalysts prepared by both methods are thermally stable mesoporous materials before the reaction. At a low content of the additive Ce1−xNixO2−x (5–10 wt %), the textural properties of the samples weakly depend on the method of preparation. With a high content of Ce1−xNixO2−x (20 wt.%), it is advisable to use the SG method, which provides higher textural characteristics. The Ce1−xNixO2−x/Al2O3 catalysts after calcination, in addition to the (γ+δ)-Al2O3 phase of support, contain highly dispersed CeO2 phase. In the case of the SG preparation method, this phase is significantly doped with Ni2+ cations, i.e., a Ni–Ce–O solid solution forms that facilitates Ni2+ cation reduction during the catalyst activation. In the case of the CI method, the Ni2+ cations are preferentially stabilized in the NiO phase. After reduction, a metal Ni ° phase is formed, the dispersion of which is much higher when using the SG preparation method. It is expected that these differences in the textural, structural, and redox properties of the catalysts will affect their functional properties in the biogas reforming reaction.

3.3. Catalytic Measurements

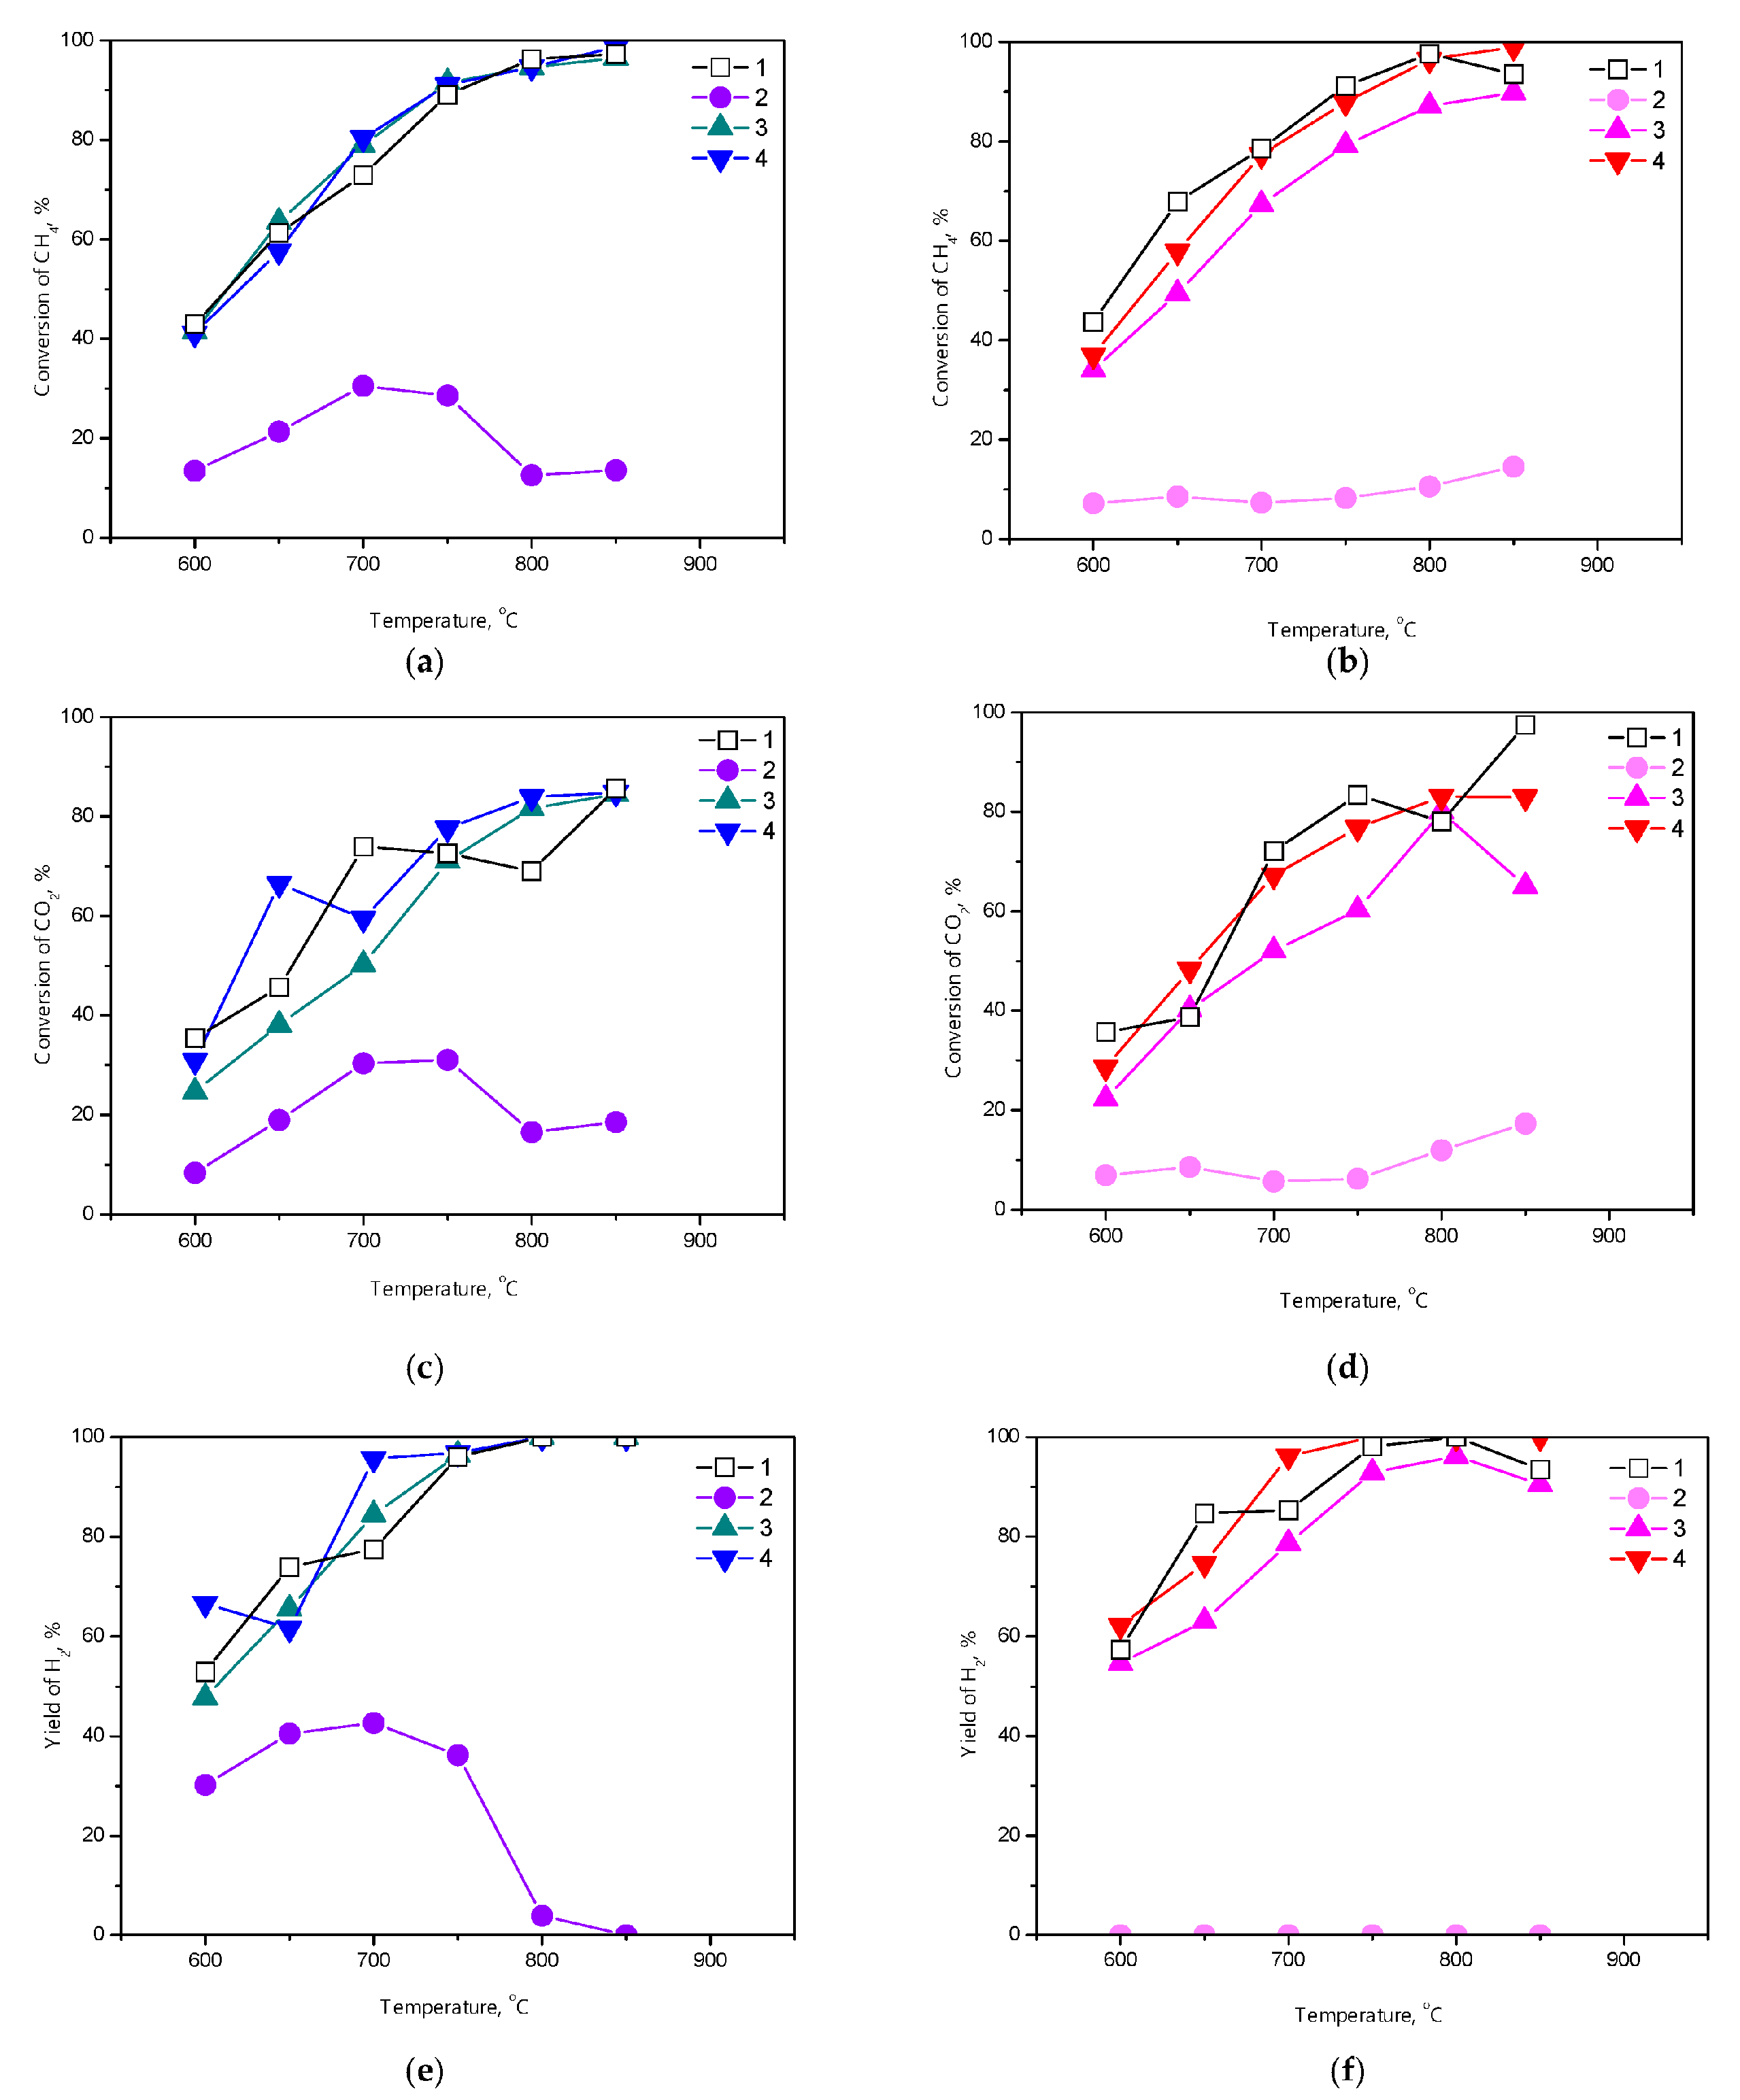
Figure 7 shows the results of the catalytic measurements.
Except for samples with a low Ni content (1.5–2.5 wt.%), conversions of both CH4 and CO2 and the yield of H2 in biogas reforming over the Ce1−xNixO2−x/Al2O3 catalysts are favored by an increase in the temperature (Figure 7), since steam and dry reforming are highly endothermic reactions. For 10Ni/Al2O3-CI catalyst, the CH4 conversion increased from 43% at 600 °C to 97% at 850 °C, while the CO2 conversion increased from 35% at 600 °C to 86% at 850 °C. Note that, additionally, the water gas shift reaction occurs that increases the concentration of CO2, thus lowering its conversion. The contribution of this reaction decreases with an increase in the process temperature, since it is exothermic.
It can be seen that the catalytic activity changes according to the content of Ce1−xNixO2−x additive, Ce/Ni molar ratio, and method of catalyst preparation (Figure 7). In the case of the CI-series, the 5Ce0.2Ni0.8O1.2/Al2O3-CI catalysts showed the lowest reagent conversions and H2 yield. At 700 °C, the values of XCH4 and XCO2 are equal to ~30%, while YH2 is ~40%. In the presence of this sample, an unusual temperature dependence of the activity is observed. Namely, the activity of this sample improves with increasing temperature from 600 to 700 °C and then decreases with a further increase in temperature (Figure 7). This behavior of the sample is apparently associated with its rapid deactivation. Since 5Ce0.2Ni0.8O1.2/Al2O3-CI is characterized by low Ni content (2.5 wt.%), high dispersion of Ni species (Table 2), and strong metal–support interaction (Figure 6), the formation of NiO or Ni–Al–O phases inactive in reforming reactions may be a likely reason for the deterioration of the catalyst activity in the high-temperature region. The observed effect is more pronounced for the 20Ce0.8Ni0.2O1.8/Al2O3-SG catalyst with an even lower Ni content (1.5 wt.%). This sample has no activity in reforming reactions (Figure 7). It is assumed that in this sample both nickel content (1.5 wt.%) and Ni/Ce molar ratio (x = 0.2) are suboptimal. Deep interaction with the oxide matrix and high Ce content lead to Ni re-oxidation under reaction conditions. The absence of Ni metal centers required for reforming affects the functional properties of 20Ce0.8Ni0.2O1.8/Al2O3-SG sample.
An increase in the content of the Ce0.2Ni0.8O1.2 additive from 5 to 20 wt.% leads to an increase in the XCH4 from 31 to 80%, the XCO2 from 30 to 60%, and the YH2 from 43 to 96% (at reaction temperature of 700 °C). A similar trend is also observed at a decrease in the Ni/Ce molar ratio. A decrease in the x from 0.8 to 0.2 leads to an increase in the XCH4 from 7 to 77%, the XCO2 from 6 to 67%, and the YH2 from 0 to 96% (at reaction temperature of 700 °C). These dependences are expected because an increase in the Ni content occurs. Note that for both CI- and SG-series, at 800–850 °C, the differences in the activity of samples with 4.8–10.0 wt.% Ni and 0–14.7 wt.% Ce become insignificant. Process indicators at 850 °C reach thermodynamic equilibrium values equal to 99, 89, and 94% for XCH4, XCO2, and YH2, respectively [26].
The advantage of Ce1−xNixO2−x/Al2O3 over the Ni/Al2O3 catalytic system is manifested in the low-temperature region and is more typical for the CI-series. In particular, at 700 °C YH2 is equal to 96 and 77% for 20Ce0.2Ni0.8O1.2/Al2O3-CI and Ni/Al2O3-CI catalysts, respectively. Apparently, this is caused by the high activity of CeO2 and Ni/CeO2 in the water gas shift reaction [58].
Thus, an increase in the concentration of the Ce1−xNixO2−x additive and a decrease in the Ce/Ni molar ratio positively affect the efficiency of the biogas reforming process, while the preparation method does not significantly affect the process parameters. At Ni content of 10.0 wt.% for both CI- and SG-series, a high H2 yield is achieved with full methane conversion and CO2 utilization of 85%. However, catalysts can have different anti-sintering and anti-coking ability. According to [39], the modified Ni/Al2O3 catalysts could retain their activity for more than 20 h, while the unmodified catalyst was stable for only up to 5 hours of operation. The presence of CeO2 in the composition of the samples, as well as the method of their preparation, can also affect the performance of the catalyst in durability tests. Therefore, it is important to perform cyclic tests to determine the stability of the developed catalysts and their durability, which will be the subject of our further research. Conducting stability and durability tests will allow us to proceed to large-scale testing and techno-economic assessment of the biogas steam reforming process to produce hydrogen with a small carbon footprint.

3.4. Characterization of the Catalysts after Reaction

The textural and structural properties of the Ce1−xNixO2−x/Al2O3 catalysts after the reaction and the content of carbon deposits in them are shown in Table 3.
For both the CI- and SG-series, the specific surface area of the samples after the reaction is slightly different from that of the samples after activation, remaining at a high level (Table 1 and Table 2). A high value of the Ni/Ce molar ratio improves the thermal stability of the system. In particular, at x = 0.2, the value of SBET decreased by 20 % (from 96 m2/g for a fresh sample to 74 m2/g for a used one), while at x = 0.8, only by ~3%.
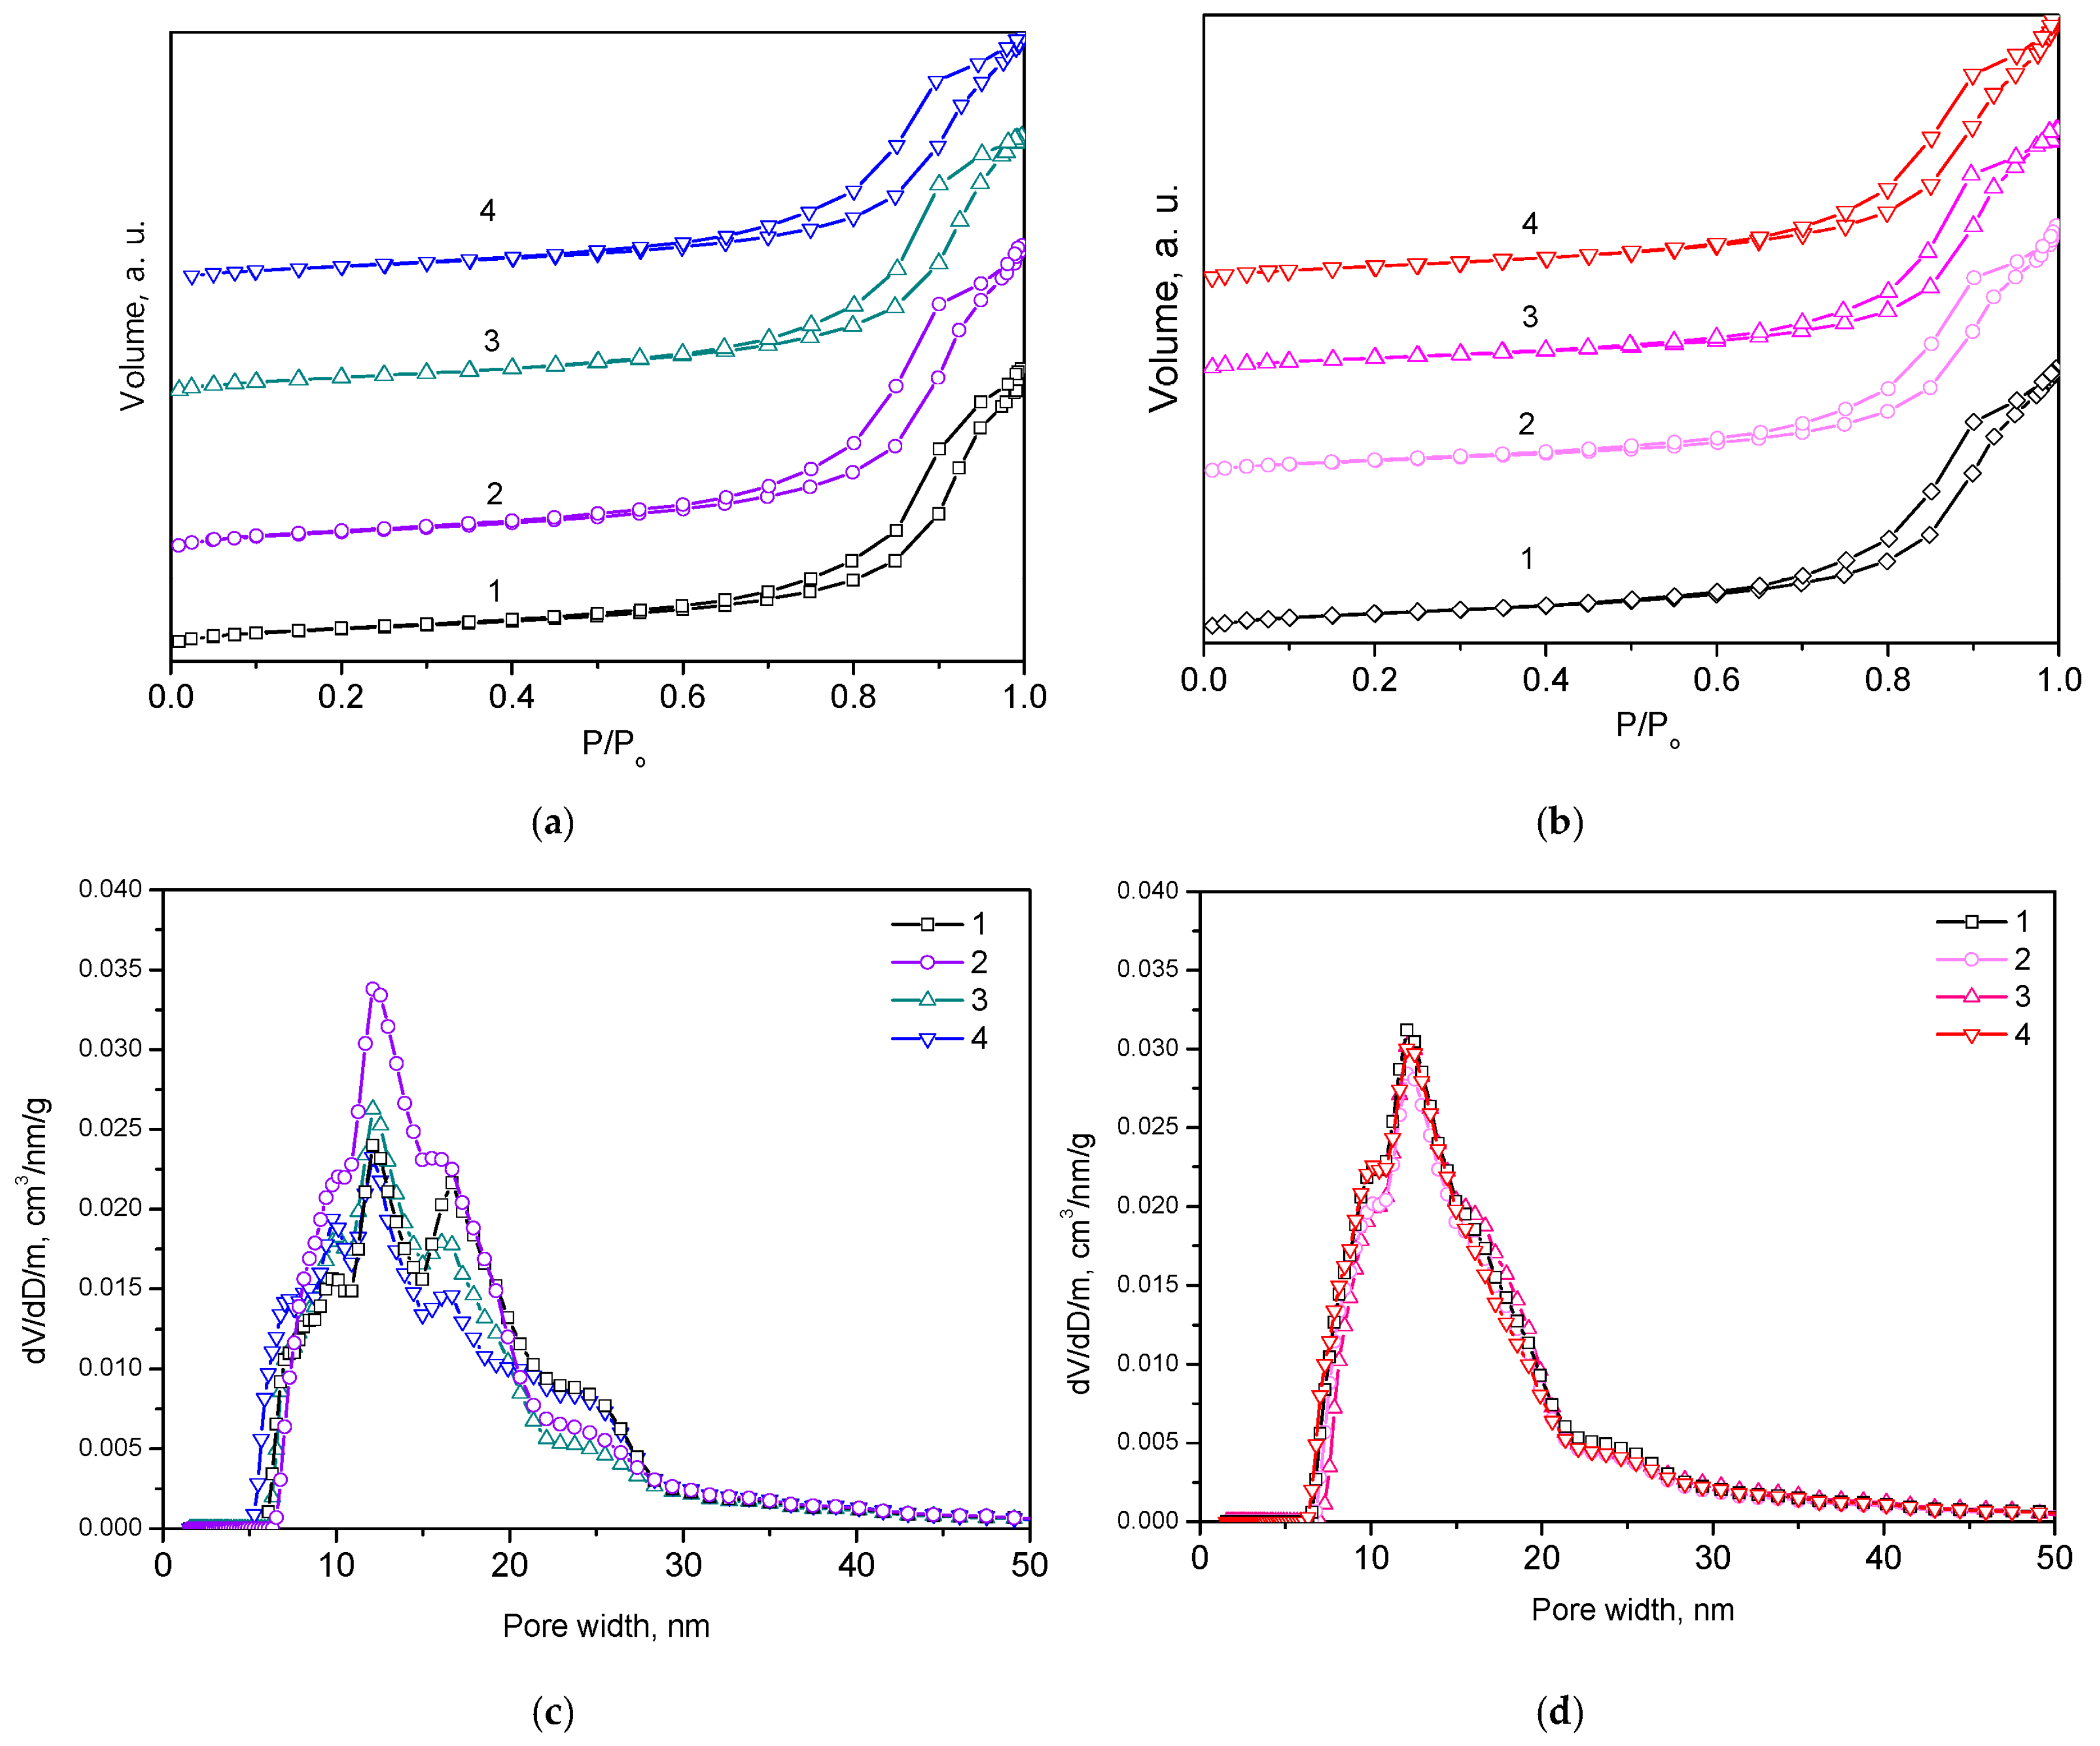
The samples after the reaction retained a mesoporous pore system, as shown by the type IV adsorption isotherm with an H2-type hysteresis loop (Figure 8). However, for samples from the CI-series, significant differences were observed for the size distribution of pores. The pore size distribution becomes wider and polymodal instead of monomodal; while for samples from the SG-series, the pore size distribution for samples before and after the reaction has the same character (Figure 2 and Figure 8). It is proposed that the observed effect is due to several factors: (1) the initial support has already been subjected to high-temperature treatment, (2) the samples contain comparable metal content (Ce + Ni = 10–16 wt.%, Table 1), (3) the formation of a Ni–Ce–O solid solution due to the synthesis by the citrate sol–gel method protects against undesirable interaction of the supported components with the alumina and, accordingly, phase transformations.
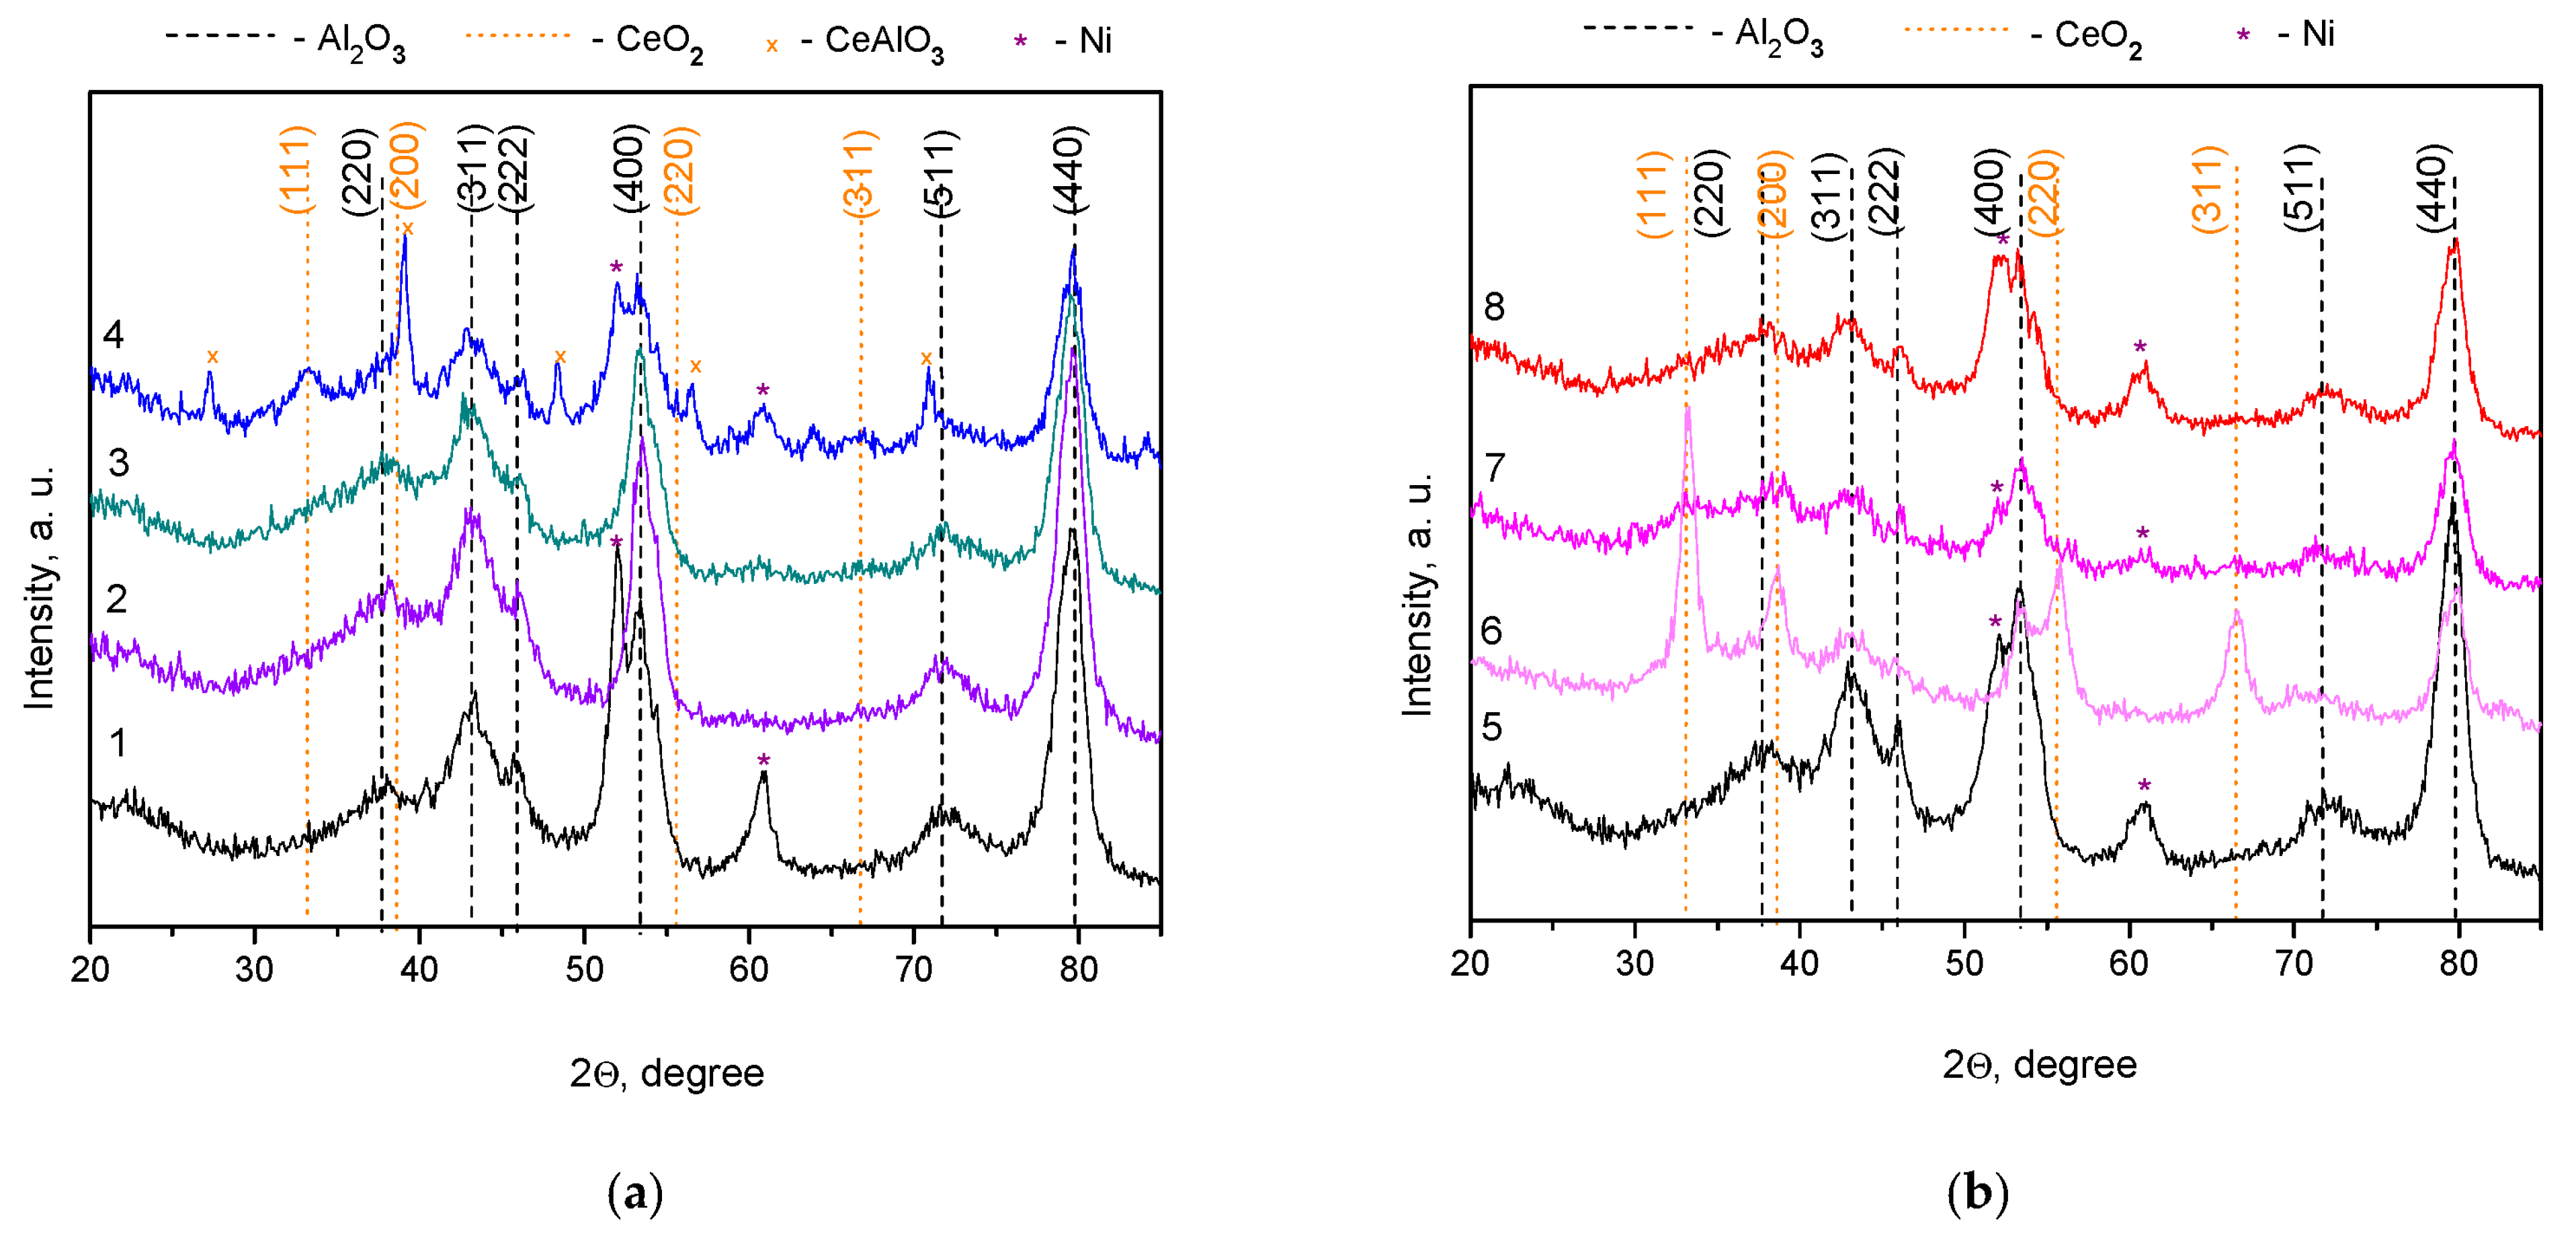
For Ce1−xNixO2−x/Al2O3 catalysts after the reaction, the phase of the initial support (alumina) is retained (Table 3, Figure 9). However, for samples without cerium or with a low content of it (< 3.0 wt.%), an increase in the formal unit cell parameter of alumina is noted (Table 2 and Table 3). This may point to the formation of a solid solution based on the Al2O3 spinel structure. The Ce-containing phase is observed only in samples with a high cerium content (6–15 wt.%), except for the 20Ce0.2Ni0.8O1.2/Al2O3-SG sample. Its type depends on the method of catalyst synthesis. In the case of the CI-series, the CeAlO3 phase is formed, while in the case of the SG-series, the CeO2 phase is formed. In samples for which the Ce-containing phase was not detected by XRD, its presence in a highly dispersed form, in the form of CeO2 or CeAlO3, cannot be ruled out. A similar trend is also found for the Ni-containing phase, which is clearly observed in the form of metallic Ni ° only in samples with a nickel content of 10 wt %. The average crystallite size of the nickel phase is large and is ~6 nm, except for the Ni/Al2O3-CI sample with an average particle size of ~9 nm. The obtained particle size of the active component is favorable in terms of resistance to coking. According to [59], the maximum rate of carbonaceous deposits is achieved at a nickel particle size of 20–40 nm.
To determine the amount of carbonaceous deposits formed during the reaction, the samples were examined by thermal analysis in the air (Figure 10). In the low-temperature region (T < 250 °C), a weight loss is observed, accompanied by an endothermic effect and associated with the desorption of water and volatile intermediates. Then, in the temperature range of 300–500 °C, weight gain occurs, which is due to the oxidation of nickel metal to nickel oxide. The slight decrease in weight as the temperature rises further can be attributed to the burnout of carbonaceous deposits. It is accepted [60] that carbon oxidation starts with amorphous carbon at a low temperature (up to 450 °C), followed by carbon nanotubes. The content of carbonaceous deposits is slightly different among the samples and is low (0.3–0.7 wt.%) in comparison with literature data: the content of coke (C) is equal to 50 wt.% for 12Ni/Al2O3 catalyst [61], 2 wt.% for 12Ni–5Ce–5Fe/Al2O3 [61], 3 wt.% for 5Ni/MgAl2O4 [62], 1.5 wt.% for 3B-Ni/SBA-15 [63], and 0.2–47.9 wt.% for 10Ni/ZrO2 with different properties of ZrO2 support [64] in the bi-reforming of CH4. It should also be noted that, according to thermodynamic calculations, the maximum yield of carbon in the CH4-CO2-H2O system is observed in the temperature range of 500–800 °C [25]. Thus, the fact that the catalysts contain low coke content after testing under adverse conditions testifies to their excellent anti-coking properties. Both the high Ni dispersion and cerium compounds play a positive role in biogas reforming. In particular, CeAlO3 can react with CO2 to form CO and CeO2, which oxidizes the precursors of carbonaceous residues on the Ni–support interface, restoring the CeAlO3 sites [39].
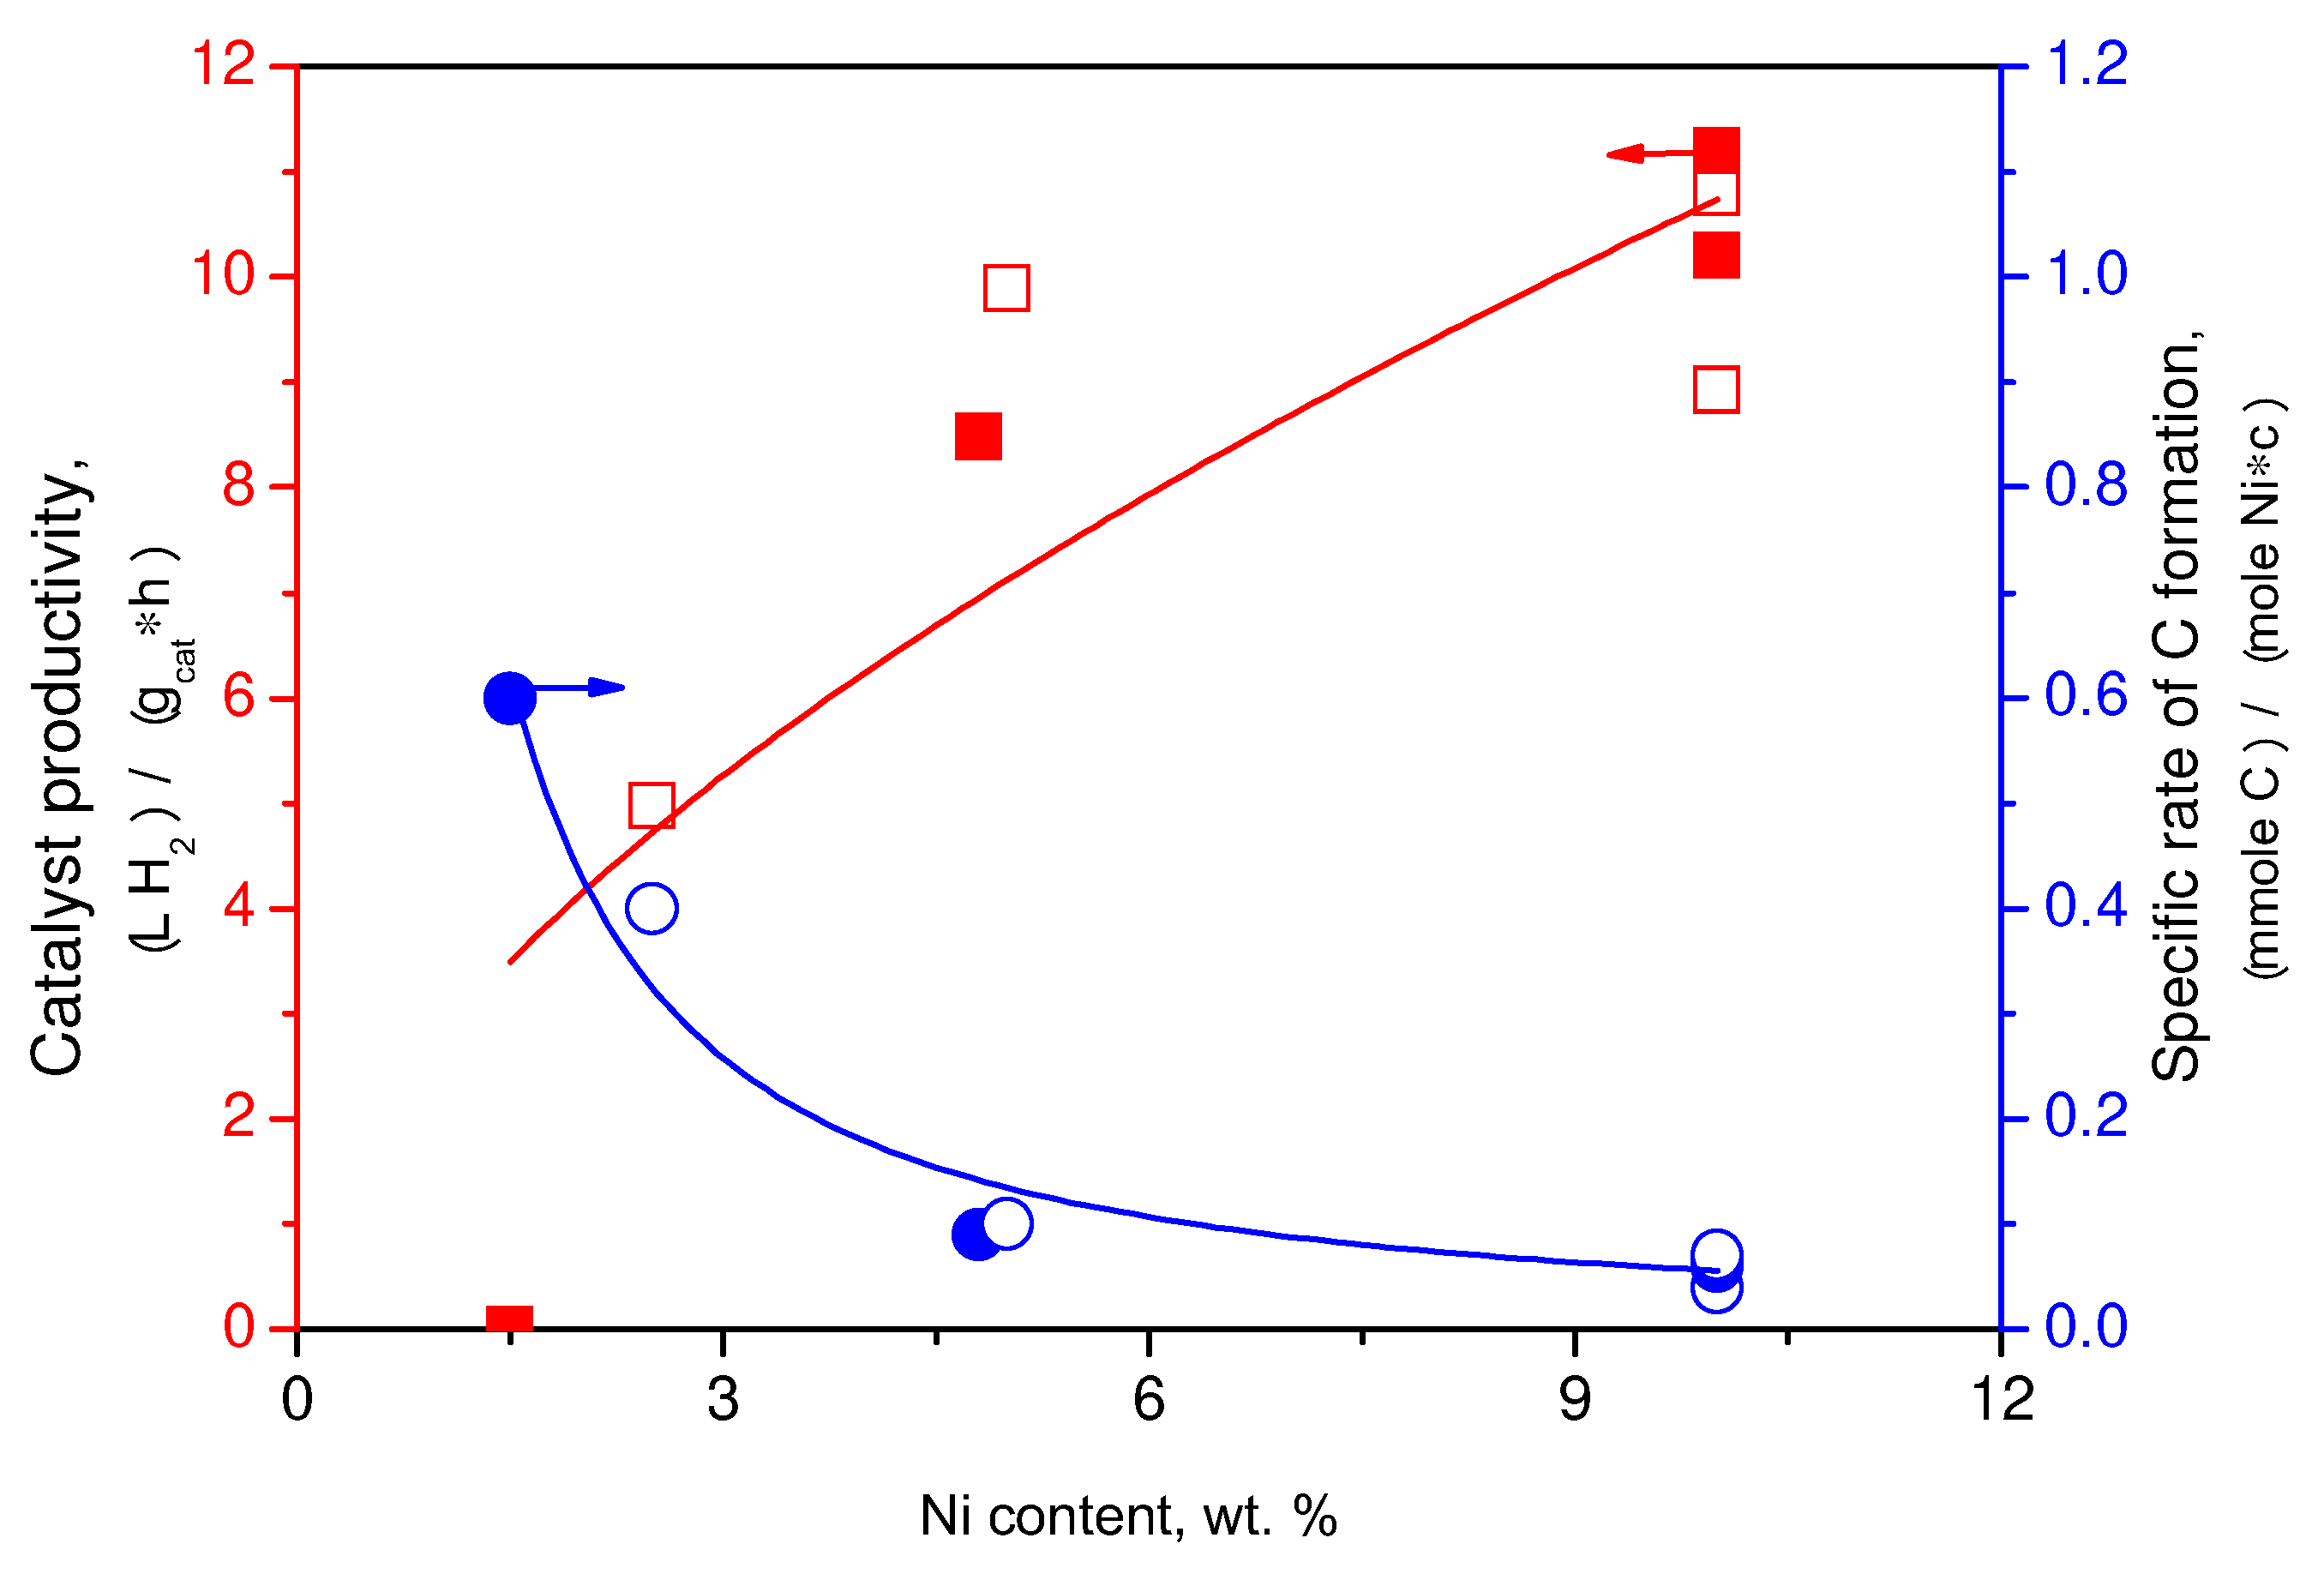
Thus, the textural and structural properties of the Ce1−xNixO2−x/Al2O3 catalysts change under the reaction condition. The degree and behavior of the change depend on the composition and method of preparation of the catalytic system. Catalysts from the SG-series proved to be more resistant to the action of the reaction medium. For them, in contrast to samples from the CI-series, structural transformations are less noticeable: the pore size distribution and the formal cell parameter of Al2O3 do not change, and the formation of such new phases as CeAlO3 is not observed. The catalysts of both series were characterized by a low rate of carbon accumulation, decreasing with an increase in the Ni content. In particular, it decreases from 0.4 to 0.07 mmoleC∙moleNi−1∙c−1 with an increase in the Ni content from 2.5 to 10 wt.% in Ce1−xNixO2−x/Al2O3-CI catalysts and from 0.6 to 0.06 mmoleC∙moleNi−1∙c−1 with an increase in the Ni content from 1.5 to 10 wt.% in the case of Ce1−xNixO2−x/Al2O3-SG catalysts. This can point to the predominant contribution of the acid sites of the Al2O3 support to carbon formation.
Figure 11 shows the correlation between nickel content, preparation method, catalyst productivity, and specific coking rate.
The hydrogen productivity of the catalyst increases from 0 to 11 LH2∙gcat−1∙h−1 with an increase in the nickel content from 1.5 to 10 wt.%, which is due to an increase in the number of active nickel species (Figure 11). Note that according to our previous studies of Ni/CeO2 catalysts in the methane bi-reforming reaction [52], with a further increase in the nickel content (10 → 15 wt %), the productivity of the catalysts reaches a plateau. With an increase in the Ni content there is also a significant reduction in the rate of coke formation, which is apparently determined by a smaller contribution of the coke-forming acid sites of the Al2O3 support. The functional properties of the catalysts of both series are similar. The developed catalysts are characterized by a large specific surface area and dispersion of the active component, which are retained during the catalytic reaction due to the thermal stability of Al2O3 support and strong Ni–support interaction. However, there are some differences regarding the structural characteristics and reducibility of the samples of CI- and SG-series. In particular, in the catalysts of SG-series, interaction of nickel with cerium reduces their interaction with aluminum oxide with the formation of new mixed phases (NiAl2O4, CeAlO3). This facilitates the formation of active metal Ni species, their stability to spinel formation, and high hydrogen yield. Longer-term testing of catalysts will be carried out to further identify the advantages and disadvantages of the developed catalysts.

4. Conclusions

Two series of Ce1−xNixO2−x/Al2O3 catalysts for the conversion of biogas to hydrogen were prepared using the impregnation method and the citrate sol–gel method with variation of the Ce1−xNixO2−x content and the Ni/Ce molar ratio. Properties of the prepared catalyst were studied using various characterization methods. The citrate sol–gel method ensures the formation of Ce1−xNixO2−x solid solution supported on alumina, after the reduction of which Ni ° nanoparticles are formed. The use of the exsolution approach prevents undesired Ni-Al interaction with the formation of NiAl2O4 under reaction conditions. It is shown that the biogas conversion and hydrogen yield increase with an increase in the content of the Ce1−xNixO2−x additive (5 → 20 wt.%) or Ni/Ce molar ratio (0.2:0.8 → 0.8:0.2), which correlates with an increase in the number of available Ni ° active sites under reaction conditions and their stability to sintering, re-oxidation, and coking. The optimal composition of the 20Ce0.2Ni0.8O1.2/Al2O3-SG catalyst was found, which, due to the combination of the thermal stability of the modified (γ + δ)-Al2O3, the strong Ni–support interaction, and the anti-coking properties of CeO2, provides high values of the biogas conversion and the yield of H2. At 850 °C, the 20 wt.% Ce0.2Ni0.8O1.8/Al2O3-SG catalyst provides 100% hydrogen yield at full CH4 conversion and 85% CO2 utilization. The results of the work contribute to the development of the scientific basis for the preparation of catalysts and the technology for producing hydrogen with a small carbon footprint.

Author Contributions

Conceptualization, Z.I. and E.M.; methodology, E.M.; synthesis, E.M.; formal analysis, A.N. and S.S.; investigation, I.I., A.N. and S.S.; data curation, E.M.; writing—original draft preparation, E.M.; writing—review and editing, E.M. and M.K.; supervision, Z.I. All authors have read and agreed to the published version of the manuscript.

Funding

The investigation was carried out with support from the Russian Science Foundation under Project No. 22-13-20040, https://rscf.ru/project/22-13-20040/» (accessed on 26 February 2023) and from the Kemerovo Region—Kuzbass.

Data Availability Statement

Data are contained within the article.

Acknowledgments

The authors are grateful to A. Leonova, V. Ushakov, E. Gerasimov, A. Kapishnikov, and S. Yashnik, for the help with catalyst characterization.

Conflicts of Interest

The authors declare no conflict of interest.

References

  1. BP World Energy. BP Statistical Review of World Energy, 71st ed.; BP Stat Rev World Energy: London, UK, 2022; pp. 1–60. [Google Scholar]
  2. IEA. World Energy Outlook 2021; IEA: Paris, France, 2021. [Google Scholar]
  3. IEA. World Energy Outlook 2022; IEA: Paris, France, 2022. [Google Scholar]
  4. Syvitski, J.; Waters, C.N.; Day, J.; Milliman, J.D.; Summerhayes, C.; Steffen, W.; Zalasiewicz, J.; Cearreta, A.; Gałuszka, A.; Hajdas, I.; et al. Extraordinary human energy consumption and resultant geological impacts beginning around 1950 CE initiated the proposed Anthropocene Epoch. Commun. Earth Environ. 2020, 1, 1–13. [Google Scholar] [CrossRef]
  5. The Royal Society; U.S. National Academy of Sciences. Climate Change; National Academies Press: Washington, DC, USA, 2020. [Google Scholar] [CrossRef]
  6. Singh, D.B.R. Global Warming—Impacts and Future Perspectives; InTech: London, UK, 2012. [Google Scholar] [CrossRef]
  7. Solomon, S.; Plattner, G.-K.; Knutti, R.; Friedlingstein, P. Irreversible climate change due to carbon dioxide emissions. Proc. Natl. Acad. Sci. USA 2009, 106, 1704–1709. [Google Scholar] [CrossRef] [PubMed] [Green Version]
  8. IEA. Energy Technology Perspectives 2023; IEA: Paris, France, 2023. [Google Scholar] [CrossRef]
  9. Benghanem, M.; Mellit, A.; Almohamadi, H.; Haddad, S.; Chettibi, N.; Alanazi, A.M.; Dasalla, D.; Alzahrani, A. Hydrogen Production Methods Based on Solar and Wind Energy: A Review. Energies 2023, 16, 757. [Google Scholar] [CrossRef]
  10. Liu, H.; Ampah, J.D.; Zhao, Y.; Sun, X.; Xu, L.; Jiang, X.; Wang, S. A Perspective on the Overarching Role of Hydrogen, Ammonia, and Methanol Carbon-Neutral Fuels towards Net Zero Emission in the Next Three Decades. Energies 2022, 16, 280. [Google Scholar] [CrossRef]
  11. Hren, R.; Vujanović, A.; Van Fan, Y.; Klemeš, J.J.; Krajnc, D.; Čuček, L. Hydrogen production, storage and transport for renewable energy and chemicals: An environmental footprint assessment. Renew. Sustain. Energy Rev. 2023, 173, 113113. [Google Scholar] [CrossRef]
  12. Hosseini, S.E.; Wahid, M.A. Hydrogen production from renewable and sustainable energy resources: Promising green energy carrier for clean development. Renew. Sustain. Energy Rev. 2016, 57, 850–866. [Google Scholar] [CrossRef]
  13. Matus, V.; Ismagilov, I.; Mikhaylova, E.; Ismagilov, Z. Hydrogen Production from Coal Industry Methane. Eurasian Chem. J. 2022, 24, 69–91. [Google Scholar] [CrossRef]
  14. Ismagilov, Z.R.; Matus, E.V.; Li, L. Catalytic methods of converting carbon dioxide into useful products to reduce the impact of coal generation on global climate change. Uspekhi Fiz Nauk 2022, 65, 1139–1154. [Google Scholar] [CrossRef]
  15. IEA. Global Hydrogen Review 2022; IEA: Paris, France, 2022. [Google Scholar] [CrossRef]
  16. Tian, Q.-Q.; Liang, L.; Zhu, M.-J. Enhanced biohydrogen production from sugarcane bagasse by Clostridium thermocellum supplemented with CaCO3. Bioresour. Technol. 2015, 197, 422–428. [Google Scholar] [CrossRef] [PubMed]
  17. Kaparaju, P.; Serrano, M.; Thomsen, A.B.; Kongjan, P.; Angelidaki, I. Bioethanol, biohydrogen and biogas production from wheat straw in a biorefinery concept. Bioresour. Technol. 2009, 100, 2562–2568. [Google Scholar] [CrossRef] [PubMed]
  18. Agyekum, E.B.; Nutakor, C.; Agwa, A.M.; Kamel, S. A Critical Review of Renewable Hydrogen Production Methods: Factors Affecting Their Scale-Up and Its Role in Future Energy Generation. Membranes 2022, 12, 173. [Google Scholar] [CrossRef] [PubMed]
  19. Gao, Y.; Gao, R.; Zhang, G.; Zheng, Y.; Zhao, J. Oxidative desulfurization of model fuel in the presence of molecular oxygen over polyoxometalate based catalysts supported on carbon nanotubes. Fuel 2018, 224, 261–270. [Google Scholar] [CrossRef]
  20. Hajjaji, N.; Martinez, S.; Trably, E.; Steyer, J.-P.; Helias, A. Life cycle assessment of hydrogen production from biogas reforming. Int. J. Hydrogen Energy 2016, 41, 6064–6075. [Google Scholar] [CrossRef]
  21. Gao, Y.; Jiang, J.; Meng, Y.; Yan, F.; Aihemaiti, A. A review of recent developments in hydrogen production via biogas dry reforming. Energy Convers. Manag. 2018, 171, 133–155. [Google Scholar] [CrossRef]
  22. Chattanathan, S.A.; Adhikari, S.; McVey, M.; Fasina, O. Hydrogen production from biogas reforming and the effect of H2S on CH4 conversion. Int. J. Hydrogen Energy 2014, 39, 19905–19911. [Google Scholar] [CrossRef]
  23. Awe, O.W.; Zhao, Y.; Nzihou, A.; Minh, D.P.; Lyczko, N. A Review of Biogas Utilisation, Purification and Upgrading Technologies. Waste Biomass- Valorization 2017, 8, 267–283. [Google Scholar] [CrossRef] [Green Version]
  24. Rasi, S.; Veijanen, A.; Rintala, J. Trace compounds of biogas from different biogas production plants. Energy 2007, 32, 1375–1380. [Google Scholar] [CrossRef]
  25. Matus, E.; Ismagilov, Z. Promising Directions in Chemical Processing of Methane from Coal Industry. Part 1. Thermodynamic analysis. Eurasian Chem. J. 2022, 24, 203–214. [Google Scholar] [CrossRef]
  26. Matus, E.V.; Sukhova, O.B.; Ismagilov, I.Z.; Kerzhentsev, M.A.; Li, L.; Ismagilov, Z.R. Bi-reforming of methane: Thermodynamic equilibrium analysis and selection of preferable reaction conditions. J. Phys. Conf. Ser. 2021, 1749, 012023. [Google Scholar] [CrossRef]
  27. Liu, J.; Zhu, X.; Li, X.; Li, K.; Shi, C.; Zhu, A. Effect of O2/CH4 ratio on the optimal specific-energy-input (SEI) for oxidative reforming of biogas in a plasma-shade reactor. J. Energy Chem. 2013, 22, 681–684. [Google Scholar] [CrossRef]
  28. Chen, X.; Jiang, J.; Li, K.; Tian, S.; Yan, F. Energy-efficient biogas reforming process to produce syngas: The enhanced methane conversion by O2. Appl. Energy 2017, 185, 687–697. [Google Scholar] [CrossRef]
  29. Phromprasit, J.; Powell, J.; Wongsakulphasatch, S.; Kiatkittipong, W.; Bumroongsakulsawat, P.; Assabumrungrat, S. H2 production from sorption enhanced steam reforming of biogas using multifunctional catalysts of Ni over Zr-, Ce- and La-modified CaO sorbents. Chem. Eng. J. 2017, 313, 1415–1425. [Google Scholar] [CrossRef]
  30. Rosset, M.; Féris, L.A.; Perez-Lopez, O.W. Biogas reforming to syngas over cu-modified Ni-Al-LDH catalysts. Int. J. Energy Res. 2022, 46, 22664–22678. [Google Scholar] [CrossRef]
  31. Wang, C.; Zhang, Y.; Wang, Y.; Zhao, Y. Comparative Studies of Non-noble Metal Modified Mesoporous M-Ni-CaO-ZrO2(M = Fe, Co, Cu) Catalysts for Simulated Biogas Dry Reforming. Chin. J. Chem. 2016, 35, 113–120. [Google Scholar] [CrossRef]
  32. Charisiou, N.D.; Baklavaridis, A.; Papadakis, V.G.; Goula, M.A. Synthesis Gas Production via the Biogas Reforming Reaction Over Ni/MgO–Al2O3 and Ni/CaO–Al2O3 Catalysts. Waste Biomass-Valoriz. 2016, 7, 725–736. [Google Scholar] [CrossRef]
  33. Xu, J.; Zhou, W.; Li, Z.; Wang, J.; Ma, J. Biogas reforming for hydrogen production over nickel and cobalt bimetallic catalysts. Int. J. Hydrogen Energy 2009, 34, 6646–6654. [Google Scholar] [CrossRef]
  34. Chen, X.; Jiang, J.; Yan, F.; Li, K.; Tian, S.; Gao, Y.; Zhou, H. Dry Reforming of Model Biogas on a Ni/SiO2 Catalyst: Overall Performance and Mechanisms of Sulfur Poisoning and Regeneration. ACS Sustain. Chem. Eng. 2017, 5, 10248–10257. [Google Scholar] [CrossRef]
  35. Chen, X.; Jiang, J.; Tian, S.; Li, K. Biogas dry reforming for syngas production: Catalytic performance of nickel supported on waste-derived SiO2. Catal. Sci. Technol. 2014, 5, 860–868. [Google Scholar] [CrossRef]
  36. Gaillard, M.; Virginie, M.; Khodakov, A.Y. New molybdenum-based catalysts for dry reforming of methane in presence of sulfur: A promising way for biogas valorization. Catal. Today 2017, 289, 143–150. [Google Scholar] [CrossRef]
  37. Serrano-Lotina, A.; Rodríguez, L.; Muñoz, G.; Martin, A.; Folgado, M.; Daza, L. Biogas reforming over La-NiMgAl catalysts derived from hydrotalcite-like structure: Influence of calcination temperature. Catal. Commun. 2011, 12, 961–967. [Google Scholar] [CrossRef]
  38. Pawar, V.; Appari, S.; Monder, D.S.; Janardhanan, V.M. Study of the Combined Deactivation Due to Sulfur Poisoning and Carbon Deposition during Biogas Dry Reforming on Supported Ni Catalyst. Ind. Eng. Chem. Res. 2017, 56, 8448–8455. [Google Scholar] [CrossRef]
  39. Charisiou, N.; Siakavelas, G.; Papageridis, K.; Baklavaridis, A.; Tzounis, L.; Avraam, D.; Goula, M. Syngas production via the biogas dry reforming reaction over nickel supported on modified with CeO2 and/or La2O3 alumina catalysts. J. Nat. Gas Sci. Eng. 2016, 31, 164–183. [Google Scholar] [CrossRef]
  40. Chava, R.; Bhaskar, A.V.D.; Roy, B.; Appari, S. Reforming of model biogas using Ni/CeO2/γ-Al2O3 monolith catalyst. Mater. Today Proc. 2023, 72, 134–139. [Google Scholar] [CrossRef]
  41. Dan, M.; Mihet, M.; Barbu-Tudoran, L.; Lazar, M.D. Biogas upgrading to syngas by combined reforming using Ni/CeO2–Al2O3 with bimodal pore structure. Microporous Mesoporous Mater. 2022, 341, 112082. [Google Scholar] [CrossRef]
  42. Matus, E.; Sukhova, O.; Kerzhentsev, M.; Ismagilov, I.; Yashnik, S.; Ushakov, V.; Stonkus, O.; Gerasimov, E.; Nikitin, A.; Bharali, P.; et al. Hydrogen Production through Bi-Reforming of Methane: Improving Ni Catalyst Performance via an Exsolution Approach. Catalysts 2022, 12, 1493. [Google Scholar] [CrossRef]
  43. Matus, E.V.; Nefedova, D.V.; Sukhova, O.B.; Ismagilov, I.Z.; Ushakov, V.A.; Yashnik, S.A.; Nikitin, A.P.; Kerzhentsev, M.A.; Ismagilov, Z.R. Formation and Properties of Ni–Ce–La–O Catalysts of Reforming. Kinet. Catal. 2019, 60, 496–507. [Google Scholar] [CrossRef]
  44. Matus, E.V.; Ismagilov, I.Z.; Ushakov, V.A.; Nikitin, A.P.; Stonkus, O.A.; Gerasimov, E.Y.; Kerzhentsev, M.A.; Bharali, P.; Ismagilov, Z.R. Genesis and Structural Properties of (Ce1–xMx0.8Ni0.2Oy (M = La, Mg) Oxides. J. Struct. Chem. 2020, 61, 1080–1089. [Google Scholar] [CrossRef]
  45. Ismagilov, Z.R.; Matus, E.V.; Efimova, O.S.; Khitsova, L.M.; Popova, A.N.; Nikitin, A.P.; Sozinov, S.A. The Development of Metal-Carbon Catalysts for Oxidative Desulfurization of Diesel Fractions. Eurasian Chem. J. 2020, 22, 81–88. [Google Scholar] [CrossRef]
  46. Matus, E.; Sukhova, O.; Ismagilov, I.; Kerzhentsev, M.; Stonkus, O.; Ismagilov, Z. Hydrogen Production through Autothermal Reforming of Ethanol: Enhancement of Ni Catalyst Performance via Promotion. Energies 2021, 14, 5176. [Google Scholar] [CrossRef]
  47. Strydom, C.A.; van Vuuren, C.P.J. The thermal decomposition of cerium(III) nitrate. J. Therm. Anal. Calorim. 1987, 32, 157–160. [Google Scholar] [CrossRef]
  48. Małecka, B.; Łącz, A.; Drożdż, E.; Małecki, A. Thermal decomposition of d-metal nitrates supported on alumina. J. Therm. Anal. Calorim. 2014, 119, 1053–1061. [Google Scholar] [CrossRef] [Green Version]
  49. Da Silva, M.F.P.; Matos, J.R.; Isolani, P.C. Synthesis, characterization and thermal analysis of 1:1 and 2:3 lanthanide(iii) citrates. J. Therm. Anal. Calorim. 2008, 94, 305–311. [Google Scholar] [CrossRef]
  50. Wei, Y.; Wang, H.; Li, K.; Zhu, X.; DU, Y. Preparation and characterization of Ce1−x NixO2 as oxygen carrier for selective oxidation methane to syngas in absence of gaseous oxygen. J. Rare Earths 2010, 28, 357–361. [Google Scholar] [CrossRef]
  51. Matus, E.V.; Vasiliev, S.D.; Ismagilov, I.Z.; Ushakov, V.A.; Kerzhentsev, M.A.; Ismagilov, Z.R. Development of Supported Ni Catalysts for Autothermal Reforming of Methane. Chem. Sustain. Dev. 2020, 28, 403–411. [Google Scholar] [CrossRef]
  52. Matus, E.V.; Sukhova, O.; Ismagilov, I.; Ushakov, V.; Yashnik, S.; Kerzhentsev, M.; Ismagilov, Z. Steam/CO2 Reforming of Methane Over Impregnated Ni/CeO2 Catalysts: Effect of Sample Composition on Their Activity and Stability. Eurasian Chem. J. 2022, 24, 191–202. [Google Scholar] [CrossRef]
  53. Sing, K.S.W. Reporting physisorption data for gas/solid systems with special reference to the determination of surface area and porosity (Recommendations 1984). Pure Appl. Chem. 1985, 57, 603–619. [Google Scholar] [CrossRef]
  54. Matus, E.V.; Okhlopkova, L.B.; Sukhova, O.B.; Ismagilov, I.Z.; Kerzhentsev, M.A.; Ismagilov, Z.R. Effects of preparation mode and doping on the genesis and properties of Ni/Ce1-xMxOy nanocrystallites (M = Gd, La, Mg) for catalytic applications. J. Nanoparticle Res. 2019, 21, 11. [Google Scholar] [CrossRef]
  55. Matus, E.V.; Shlyakhtina, A.S.; Sukhova, O.B.; Ismagilov, I.Z.; Ushakov, V.A.; Yashnik, S.A.; Nikitin, A.P.; Bharali, P.; Kerzhentsev, M.A.; Ismagilov, Z.R. Effect of Preparation Methods on the Physicochemical and Functional Properties of Ni/CeO2 Catalysts. Kinet. Catal. 2019, 60, 221–230. [Google Scholar] [CrossRef]
  56. Kostić, R.; Aškrabić, S.; Dohčević-Mitrović, Z.; Popović, Z. Low-frequency Raman scattering from CeO2 nanoparticles. Appl. Phys. A 2007, 90, 679–683. [Google Scholar] [CrossRef]
  57. Li, L.; Chen, F.; Lu, J.-Q.; Luo, M.-F. Study of Defect Sites in Ce1–xMxO2−δ (x = 0.2) Solid Solutions Using Raman Spectroscopy. J. Phys. Chem. A 2011, 115, 7972–7977. [Google Scholar] [CrossRef]
  58. Ebrahimi, P.; Kumar, A.; Khraisheh, M. A Review of CeO2 Supported Catalysts for CO2 Reduction to CO through the Reverse Water Gas Shift Reaction. Catalysts 2022, 12, 1101. [Google Scholar] [CrossRef]
  59. Da Fonseca, R.O.; Ponseggi, A.R.; Rabelo-Neto, R.C.; Simões, R.C.; Mattos, L.V.; Noronha, F.B. Controlling carbon formation over Ni/CeO2 catalyst for dry reforming of CH4 by tuning Ni crystallite size and oxygen vacancies of the support. J. CO2 Util. 2022, 57, 101880. [Google Scholar] [CrossRef]
  60. Al–Swai, B.M.; Osman, N.B.; Ramli, A.; Abdullah, B.; Farooqi, A.S.; Ayodele, B.V.; Patrick, D.O. Low-temperature catalytic conversion of greenhouse gases (CO2 and CH4) to syngas over ceria-magnesia mixed oxide supported nickel catalysts. Int. J. Hydrogen Energy 2020, 46, 24768–24780. [Google Scholar] [CrossRef]
  61. Li, P.; Park, Y.H.; Moon, D.J.; Park, N.C.; Kim, Y.C. Carbon Deposition onto Ni-Based Catalysts for Combined Steam/CO2 Reforming of Methane. J. Nanosci. Nanotechnol. 2016, 16, 1562–1566. [Google Scholar] [CrossRef]
  62. Wysocka, I.; Mielewczyk-Gryń, A.; Łapiński, M.; Cieślik, B.; Rogala, A. Effect of small quantities of potassium promoter and steam on the catalytic properties of nickel catalysts in dry/combined methane reforming. Int. J. Hydrogen Energy 2020, 46, 3847–3864. [Google Scholar] [CrossRef]
  63. Siang, T.J.; Pham, T.L.; Van Cuong, N.; Phuong, P.T.; Phuc, N.H.H.; Truong, Q.D.; Vo, D.-V.N. Combined steam and CO2 reforming of methane for syngas production over carbon-resistant boron-promoted Ni/SBA-15 catalysts. Microporous Mesoporous Mater. 2018, 262, 122–132. [Google Scholar] [CrossRef]
  64. Zhao, Z.; Ren, P.; Li, W.; Miao, B. Effect of mineralizers for preparing ZrO2 support on the supported Ni catalyst for steam-CO2 bi-reforming of methane. Int. J. Hydrog. Energy 2017, 42, 6598–6609. [Google Scholar] [CrossRef]
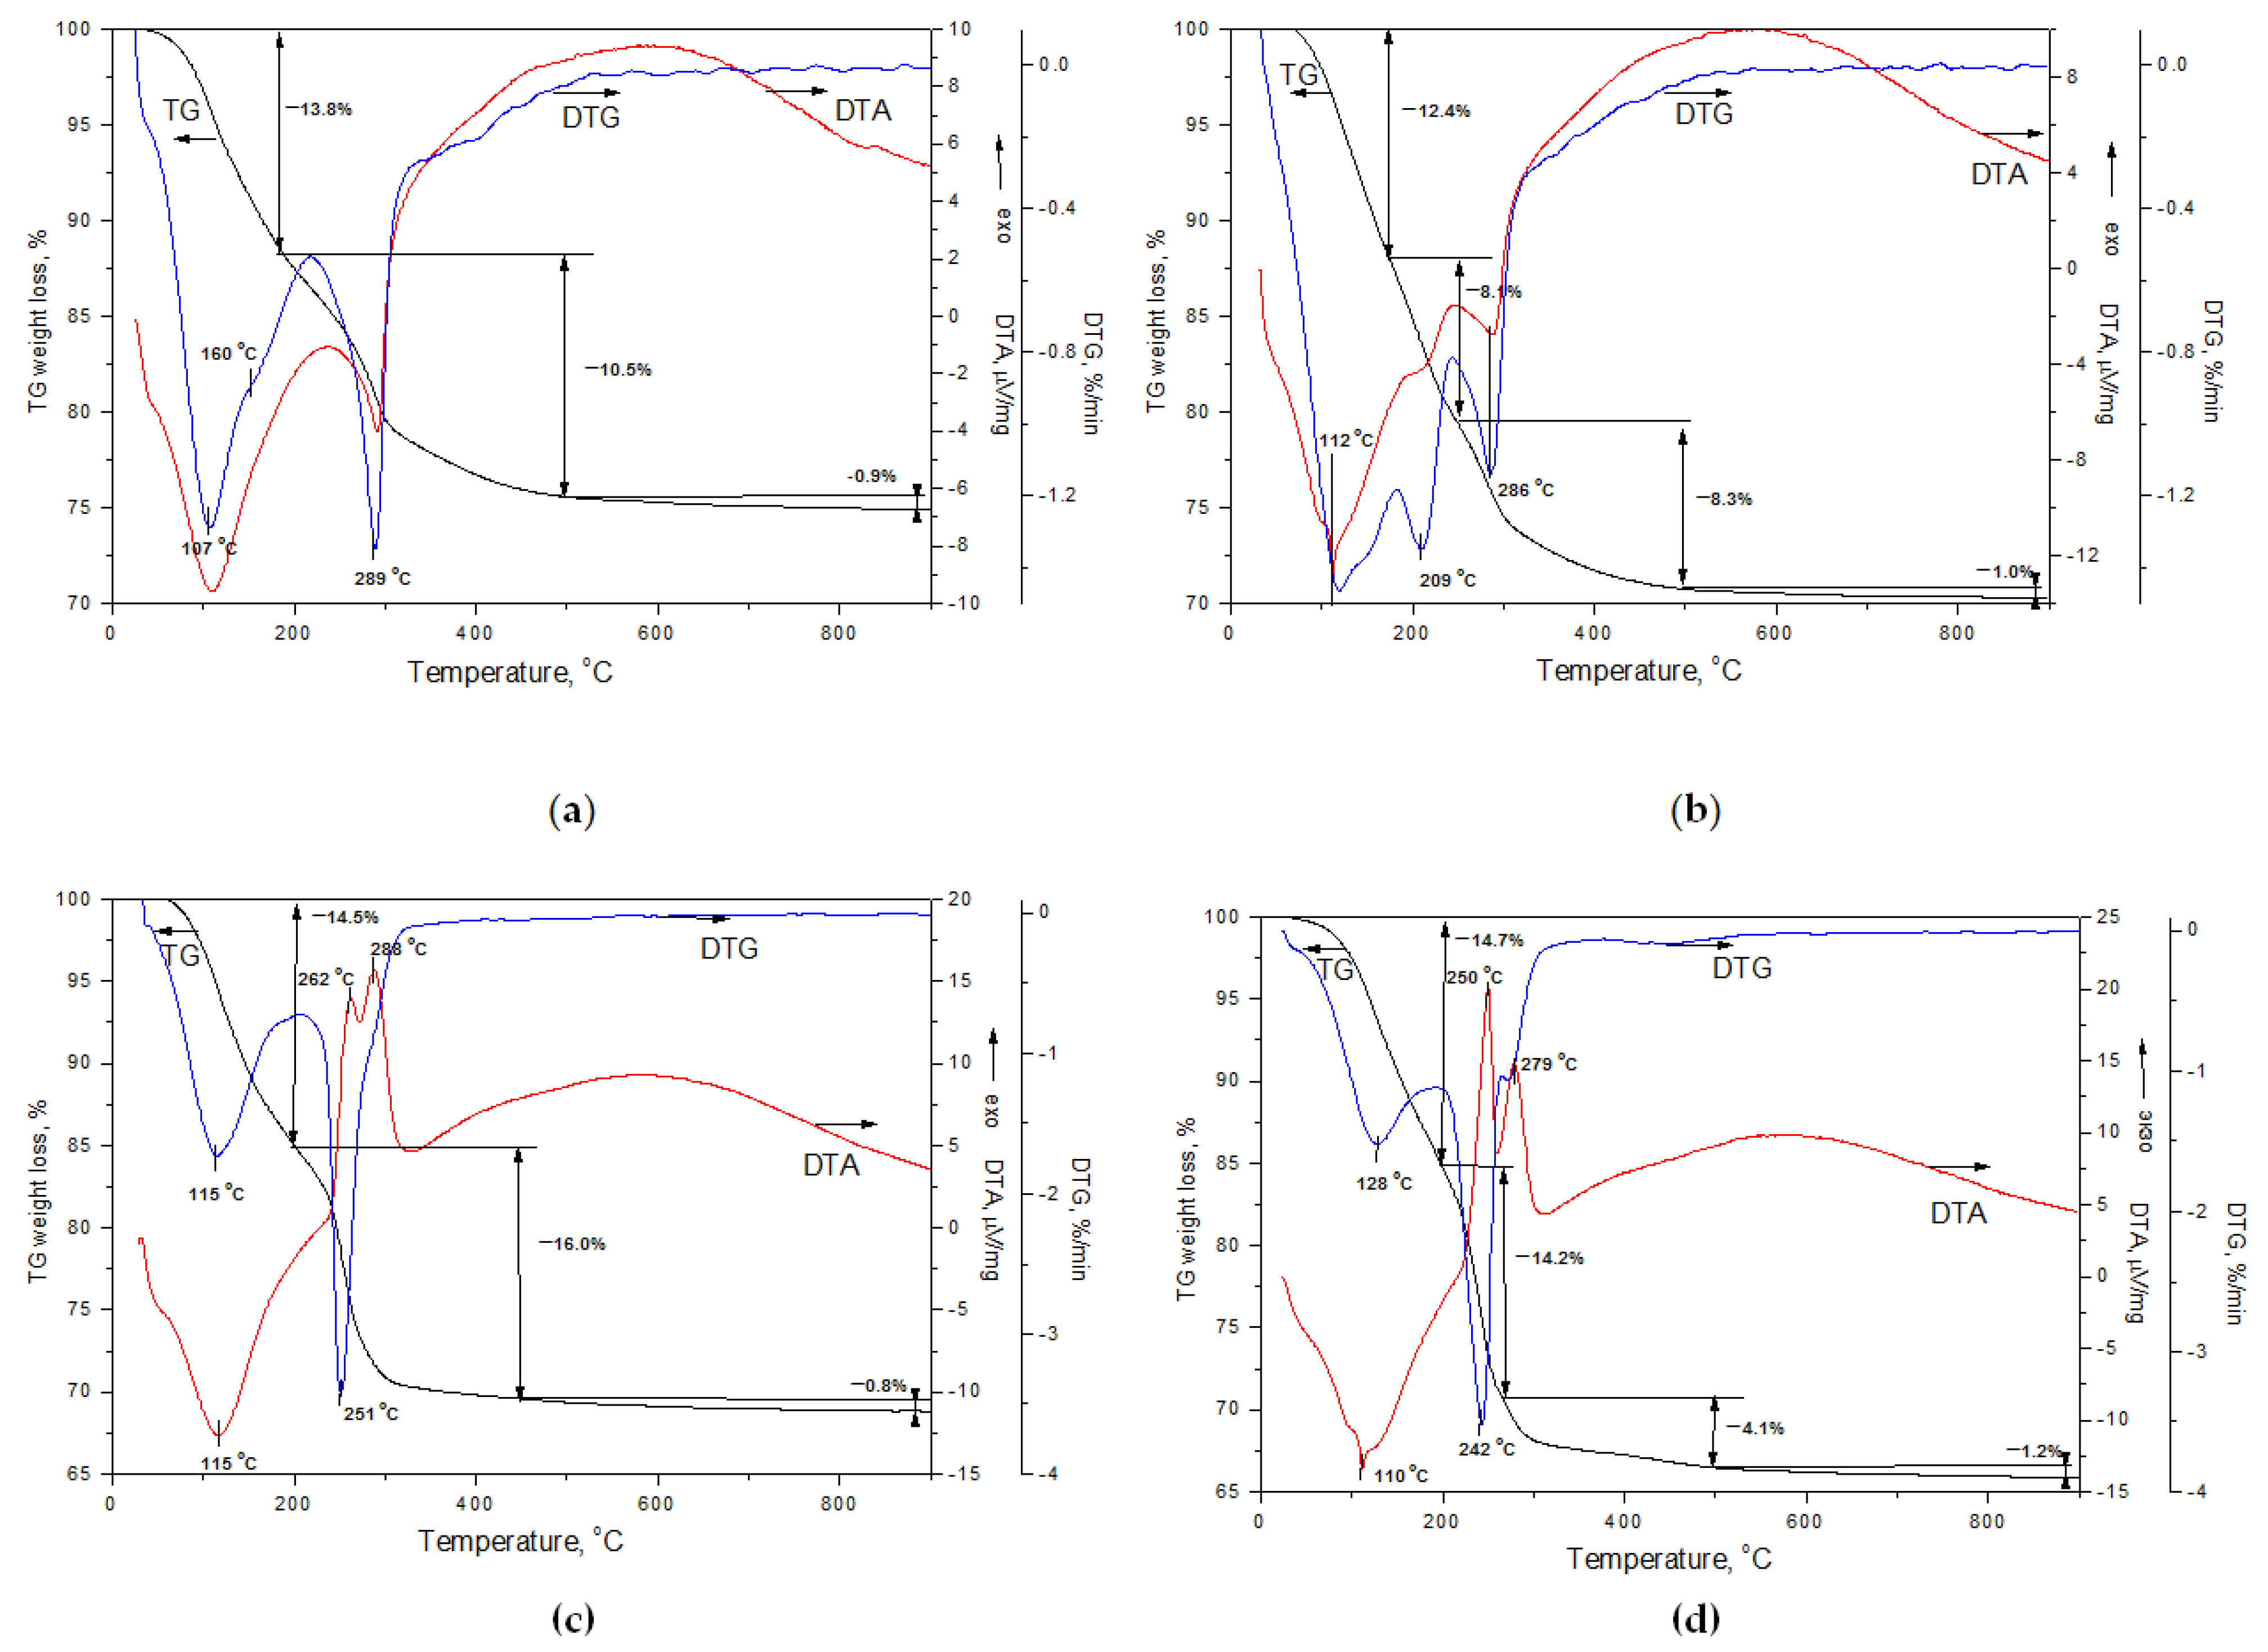
Figure 1. TG, DTG, and DTA curves for dried 10Ni/Al2O3-CI (a), 20Ce0.2Ni0.8O1.2/Al2O3-CI (b), 10Ni/Al2O3-SG (c), and 20Ce0.2Ni0.8O1.2/Al2O3-SG (d) catalysts.
Energies 16 02993 g001
Figure 2. N2 adsorption–desorption curves (a,b) and distribution of pore size (c,d) for Al2O3 support (1), 10Ni/Al2O3-CI (2), 20Ce0.2Ni0.8O1.2/Al2O3-CI (3), 10Ni/Al2O3-SG (4), and 20Ce0.2Ni0.8O1.2/Al2O3-SG (5) catalysts after calcination (a,c) and following reduction (b,d).
Energies 16 02993 g002
Figure 3. SEM images of Al2O3 support (a), 20Ce0.2Ni0.8O1.2/Al2O3-CI (b), 20Ce0.5Ni0.5O1.5/Al2O3-SG (c), and 20Ce0.2Ni0.8O1.2/Al2O3-SG (d) catalysts after calcination (ac) and subsequent reduction (d). The calculation of the content of each element in the analyzed substance was carried out from the obtained X-ray spectra using the Analysis Station software version 3.62.07 from JEOL Engineering using the non-standard ZAF method.
Energies 16 02993 g003
Figure 4. XRD patterns of Al2O3 support (1), 10Ni/Al2O3-CI (2), 5Ce0.2Ni0.8O1.2/Al2O3-CI (3), 10Ce0.2Ni0.8O1.2/Al2O3-CI (4), 20Ce0.2Ni0.8O1.2/Al2O3-CI (5), 10Ni/Al2O3-SG (6), 20Ce0.8Ni0.2O1.8/Al2O3-SG (7), 20Ce0.5Ni0.5O1.5/Al2O3-SG (8), and 20Ce0.2Ni0.8O1.2/Al2O3-SG (9) catalysts after calcination (a,c) and following reduction (b,d).
Energies 16 02993 g004
Figure 5. Raman analysis of 5Ce0.2Ni0.8O1.2/Al2O3-CI (1), 10Ce0.2Ni0.8O1.2/Al2O3-CI (2), 20Ce0.2Ni0.8O1.2/Al2O3-CI (3), 20Ce0.2Ni0.8O1.2/Al2O3-SG (4), 20Ce0.5Ni0.5O1.5/Al2O3-SG (5), and 20Ce0.8Ni0.2O1.8/Al2O3-SG (6) catalysts after calcination.
Energies 16 02993 g005
Figure 6. Reduction behavior of catalysts. TPR with hydrogen for catalysts from CI- (a) and SG-series (b) and XRD patterns of 20Ce0.2Ni0.8O1.2/Al2O3-CI catalyst during the reduction (c). (a) 10Ni/Al2O3-CI (1), 5Ce0.2Ni0.8O1.2/Al2O3-CI (2), 10Ce0.2Ni0.8O1.2/Al2O3-CI (3), and 20Ce0.2Ni0.8O1.2/Al2O3-CI (4). (b) 10Ni/Al2O3-SG (1), 20Ce0.8Ni0.2O1.8/Al2O3-SG (2), 20Ce0.5Ni0.5O1.5/Al2O3-SG (3), and 20Ce0.2Ni0.8O1.2/Al2O3-SG (4).
Energies 16 02993 g006
Figure 7. Performance of the Ce1−xNixO2−x/Al2O3 catalysts in biogas conversion to hydrogen. (a,c,e) 10Ni/Al2O3-CI (1), 5Ce0.2Ni0.8O1.2/Al2O3-CI (2), 10Ce0.2Ni0.8O1.2/Al2O3-CI (3), and 20Ce0.2Ni0.8O1.2/Al2O3-CI (4). (b,d,f) 10Ni/Al2O3-SG (1), 20Ce0.8Ni0.2O1.8/Al2O3-SG (2), 20Ce0.5Ni0.5O1.5/Al2O3-SG (3), and 20Ce0.2Ni0.8O1.2/Al2O3-SG (4). Each experimental point is the arithmetic mean found from the results of five measurements with a standard deviation of ±5%.
Energies 16 02993 g007
Figure 8. N2 adsorption–desorption curves (a,b) and distribution of pore size (c,d) for catalysts after reaction. (a,c) 10Ni/Al2O3-CI (1), 5Ce0.2Ni0.8O1.2/Al2O3-CI (2), 10Ce0.2Ni0.8O1.2/Al2O3-CI (3), and 20Ce0.2Ni0.8O1.2/Al2O3-CI (4). (b,d) 10Ni/Al2O3-SG (1), 20Ce0.8Ni0.2O1.8/Al2O3-SG (2), 20Ce0.5Ni0.5O1.5/Al2O3-SG (3), and 20Ce0.2Ni0.8O1.2/Al2O3-SG (4).
Energies 16 02993 g008
Figure 9. XRD patterns of (a) 10Ni/Al2O3-CI (1), 5Ce0.2Ni0.8O1.2/Al2O3-CI (2), 10Ce0.2Ni0.8O1.2/Al2O3-CI (3), 20Ce0.2Ni0.8O1.2/Al2O3-CI (4), (b) 10Ni/Al2O3-SG (5), 20Ce0.8Ni0.2O1.8/Al2O3-SG (6), 20Ce0.5Ni0.5O1.5/Al2O3-SG (7), and 20Ce0.2Ni0.8O1.2/Al2O3-SG (8) catalysts after the reaction.
Energies 16 02993 g009
Figure 10. TG, DTG, and DTA curves for 10Ni/Al2O3-CI (a), 20Ce0.2Ni0.8O1.2/Al2O3-CI (b), 10Ni/Al2O3-SG (c), and 20Ce0.2Ni0.8O1.2/Al2O3-SG (d) catalysts after the reaction.
Energies 16 02993 g010
Figure 11. The effect of Ni content on the Ce1−xNixO2−x/Al2O3 catalysts’ productivity (red) and the specific rate of coke formation (blue). Open symbols—CI-series; filled symbols—SG-series.
Energies 16 02993 g011
Table 1. Chemical composition of Ce1−xNixO2−x/Al2O3 catalysts and data of the thermal analysis of dried samples.
Sample *Chemical Composition, wt.%Weight Loss (Δmi, %) at Different Temperature Ranges
(ΔTi, °C)
Temperature of DTG Peak Maxima (TDTG ) and Type of Thermal Effect (exo/endo), °C
NiCeΔm1Δm2Δm3T1T2T3
10Ni/Al2O3-CI10.0013.8
(25–220)
10.5
(220–500)
0.9
(500–1000)
107
endo
289
endo
5Ce0.2Ni0.8O1.2/Al2O3-CI2.51.55.3
(25–170)
7.4
(170–500)
1.0
(500–1000)
90
endo
221
endo
10Ce0.2Ni0.8O1.2/Al2O3-CI5.03.0n.d. **n.d.n.d.n.d.n.d.n.d.
20Ce0.2Ni0.8O1.2/Al2O3-CI10.05.912.4
(25–170)
16.4
(170–500)
1.0
(500–1000)
112
endo
209
endo
286
endo
10Ni/Al2O3-SG10.0014.5
(25–190)
16.0
(190–500)
0.8
(500–1000)
115
endo
251
exo
20Ce0.8Ni0.2O1.8/Al2O3-SG1.514.79.1
(25–190)
18.5
(190–500)
0.8
(500–1000)
112
endo
212
exo
20Ce0.5Ni0.5O1.5/Al2O3-SG4.811.4n.d.n.d.n.d.n.d.n.d.n.d.
20Ce0.2Ni0.8O1.2/Al2O3-SG10.05.914.7
(25–200)
18.3
(190–500)
1.2
(500–1000)
128
endo
242
exo
* In the designation of the samples, the number in front of the formula corresponds to the weight content of the component used, and the abbreviation at the end indicates the method of sample synthesis. ** No data.
Table 2. Characteristics of the Ce1−xNixO2−x/Al2O3 catalysts before reaction *.
SampleType of TreatmentSBET, m2/gVp, cm3/gDp, nmPhase CompositionCell Parameter, ÅCSR,
nm
I570/I465
Al2O3O2/850 °C1080.4416.1(γ + δ)-Al2O37.909
H2/800 °C1050.4316.5(γ + δ)-Al2O37.909
10Ni/Al2O3-CIO2/500 °C910.3615.7(γ + δ)-Al2O3
NiO
7.909

25.0
H2/800 °C900.3816.7(γ + δ)-Al2O3
Ni
7.907

21.0
5Ce0.2Ni0.8O1.2/Al2O3-CIO2/500 °C990.3915.8(γ + δ)-Al2O3 CeO2 7.914

0.85
H2/800 °C870.3917.8(γ + δ)-Al2O3 7.905
10Ce0.2Ni0.8O1.2/Al2O3-CIO2/500 °C950.3816.3(γ + δ)-Al2O3
CeO2
7.914
5.410

6.5
1.32
H2/800 °C910.3816.8(γ + δ)-Al2O3 7.905
20Ce0.2Ni0.8O1.2/Al2O3-CIO2/500 °C760.2915.5(γ + δ)-Al2O3
CeO2
NiO
7.913
5.410

7.5
10.0
1.31
H2/800 °C710.3118.0(γ + δ)-Al2O3
CeO2
Ni
7.907


6.5
6.5
10Ni/Al2O3-SGO2/500 °C960.3313.7(γ + δ)-Al2O37.922
H2/800 °C910.3816.9Al2O3
Ni
7.907

13.5
20Ce0.8Ni0.2O1.8/Al2O3-SGO2/500 °C930.3113.5(γ + δ)-Al2O3
CeO2
7.908
5.404

25.0
0.36
H2/800 °C790.3115.6(γ + δ)-Al2O3
CeO2
7.900
5.422

10.5
20Ce0.5Ni0.5O1.5/Al2O3-SGO2/500 °C950.3012.8(γ + δ)-Al2O3
CeO2
7.908
5.400

5.5
1.19
H2/800 °C780.2914.8(γ + δ)-Al2O3
CeO2
7.913
5.400

20Ce0.2Ni0.8O1.2/Al2O3– SGO2/500 °C890.3214.2(γ + δ)-Al2O3 CeO2
NiO
7.914


7.16
H2/800 °C820.3316.1(γ + δ)-Al2O3
Ni
7.907

* SBET—specific surface area, Vp—total pore volume, Dp—mean pore size, CSR—coherent scattering region, I570/I465—band intensity ratio at 570 and 465 cm−1 in Raman spectra.
Table 3. Characteristics of the Ce1−xNixO2−x/Al2O3 catalysts after reaction *.
SampleSBET, m2/gVp, cm3/gDp, nmPhase CompositionsCell Parameter, ÅCSR,
nm
Content of
C, wt.%
10Ni/Al2O3-CI880.3716.6(γ + δ)-Al2O3
Ni
7.919

9.0
–0.3
5Ce0.2Ni0.8O1.2/Al2O3-CI940.4017.0(γ + δ)-Al2O3 7.919–0.7
10Ce0.2Ni0.8O1.2/Al2O3-CI920.3415.0(γ + δ)-Al2O37.919–0.4
20Ce0.2Ni0.8O1.2/Al2O3-CI810.3215.8(γ + δ)-Al2O3
CeAlO3
Ni
7.913


6.5
–0.5
10Ni/Al2O3-SG860.3416.0(γ + δ)-Al2O3
Ni
7.919

6.0
–0.5
20Ce0.8Ni0.2O1.8/Al2O3-SG740.3217.3(γ + δ)-Al2O3 CeO2 7.908
5.413

50.0
–0.6
20Ce0.5Ni0.5O1.5/Al2O3-SG730.3217.7(γ + δ)-Al2O3
CeO2
7.908

–0.3
20Ce0.2Ni0.8O1.2/Al2O3-SG830.3516.8(γ + δ)-Al2O3
Ni
7.913

6.5
–0.4
* SBET—specific surface area, Vp—total pore volume, Dp—mean pore size, CSR—coherent scattering region.
Disclaimer/Publisher’s Note: The statements, opinions and data contained in all publications are solely those of the individual author(s) and contributor(s) and not of MDPI and/or the editor(s). MDPI and/or the editor(s) disclaim responsibility for any injury to people or property resulting from any ideas, methods, instructions or products referred to in the content.